1. Introduction
Stiffened panels composed of plating and stiffeners are widely used in hull structures because of their light weight, high stiffness and high material utilization rate. However, in offshore practice, the collapse of stiffened panels is fairly common, making it of great significance to establish an accurate and effective method for evaluating the ultimate strength of stiffened panels.
Numerous studies have been completed to establish empirical formulas for predicting the ultimate strength of stiffened panels. Paik [
1,
2] derived an empirical formula for the ultimate strength of stiffened panels under uniaxial compression based on compression test data of stiffened panels of different sizes, and the empirical formula contains two parameters: the plate slenderness and column slenderness. Khedmati [
3] proposed a formula for the prediction of the ultimate strength of aluminum stiffened panels under the combination of biaxial compression and lateral pressure. T-stiffeners and a flat bar were considered and lateral pressure was characterized by water head. Zhang [
4] conducted numerical simulation and experimental verification of the ultimate strength of stiffened panels under uniaxial compression and proposed a more concise formula. Faulkner [
5] analyzed the post-buckling capacity of a plate and the supporting effect of the stiffeners and proposed a formula for the average stress of the overall cross-section of stiffened panels. To consider the influence of the stiffener type, Xu [
6] added several terms to the relevant parameters of Paik’s formula, proposed an empirical formula shape with 10 coefficients, and carried out data fitting and experimental verification.
The numerical simulation method is widely used in the study of the ultimate strength of stiffened panels. In the process of numerical simulation, factors such as structural forms, model range, and initial imperfections are fully considered, which provides a valuable reference. However, as a thin-walled composite structure, the stiffened panel will collapse in various modes due to the difference in stiffness between the plating and the stiffener, which makes it necessary to consider failure modes when studying the ultimate behaviour of stiffened panels.
After investigating the effects of factors such as the shape and size of an initial imperfection, the magnitude and direction of the residual stress, and the cross-sectional area ratio between the plating and stiffener on the axial load capacity and failure mode of stiffened panels, Grondin [
7] found that the relative size of the torsional stiffness of the stiffener and the bending stiffness of the plate are the key factors that determine the occurrence of stiffener tripping and local plate buckling. Through investigations, model tests and numerical simulations, Zhang [
4] proved that the failure mode of stiffened panels under axial compression manifested as coupled bending and torsion failure, which are mainly determined by beam–column behaviours. Ozgur [
8] compared the ultimate strength of stiffened panels obtained using ABAQUS and PULS, and found that the greatest deviation usually occurs in areas where the failure modes are inconsistent. The ISSC [
9] Ultimate Strength Committee initiated a benchmark study on the ultimate state analysis of stiffened plate structures subjected to uniaxial compression loads. The finite element results of 17 groups, which were compared with each other and with the experimental results. It was found that the failure mode of stiffened panel was not precisely predicted, which may be due to the inaccurate modeling of residual stress. The Committee recommends that more research on failure modes needs to be carried out to define and predict structural failure.
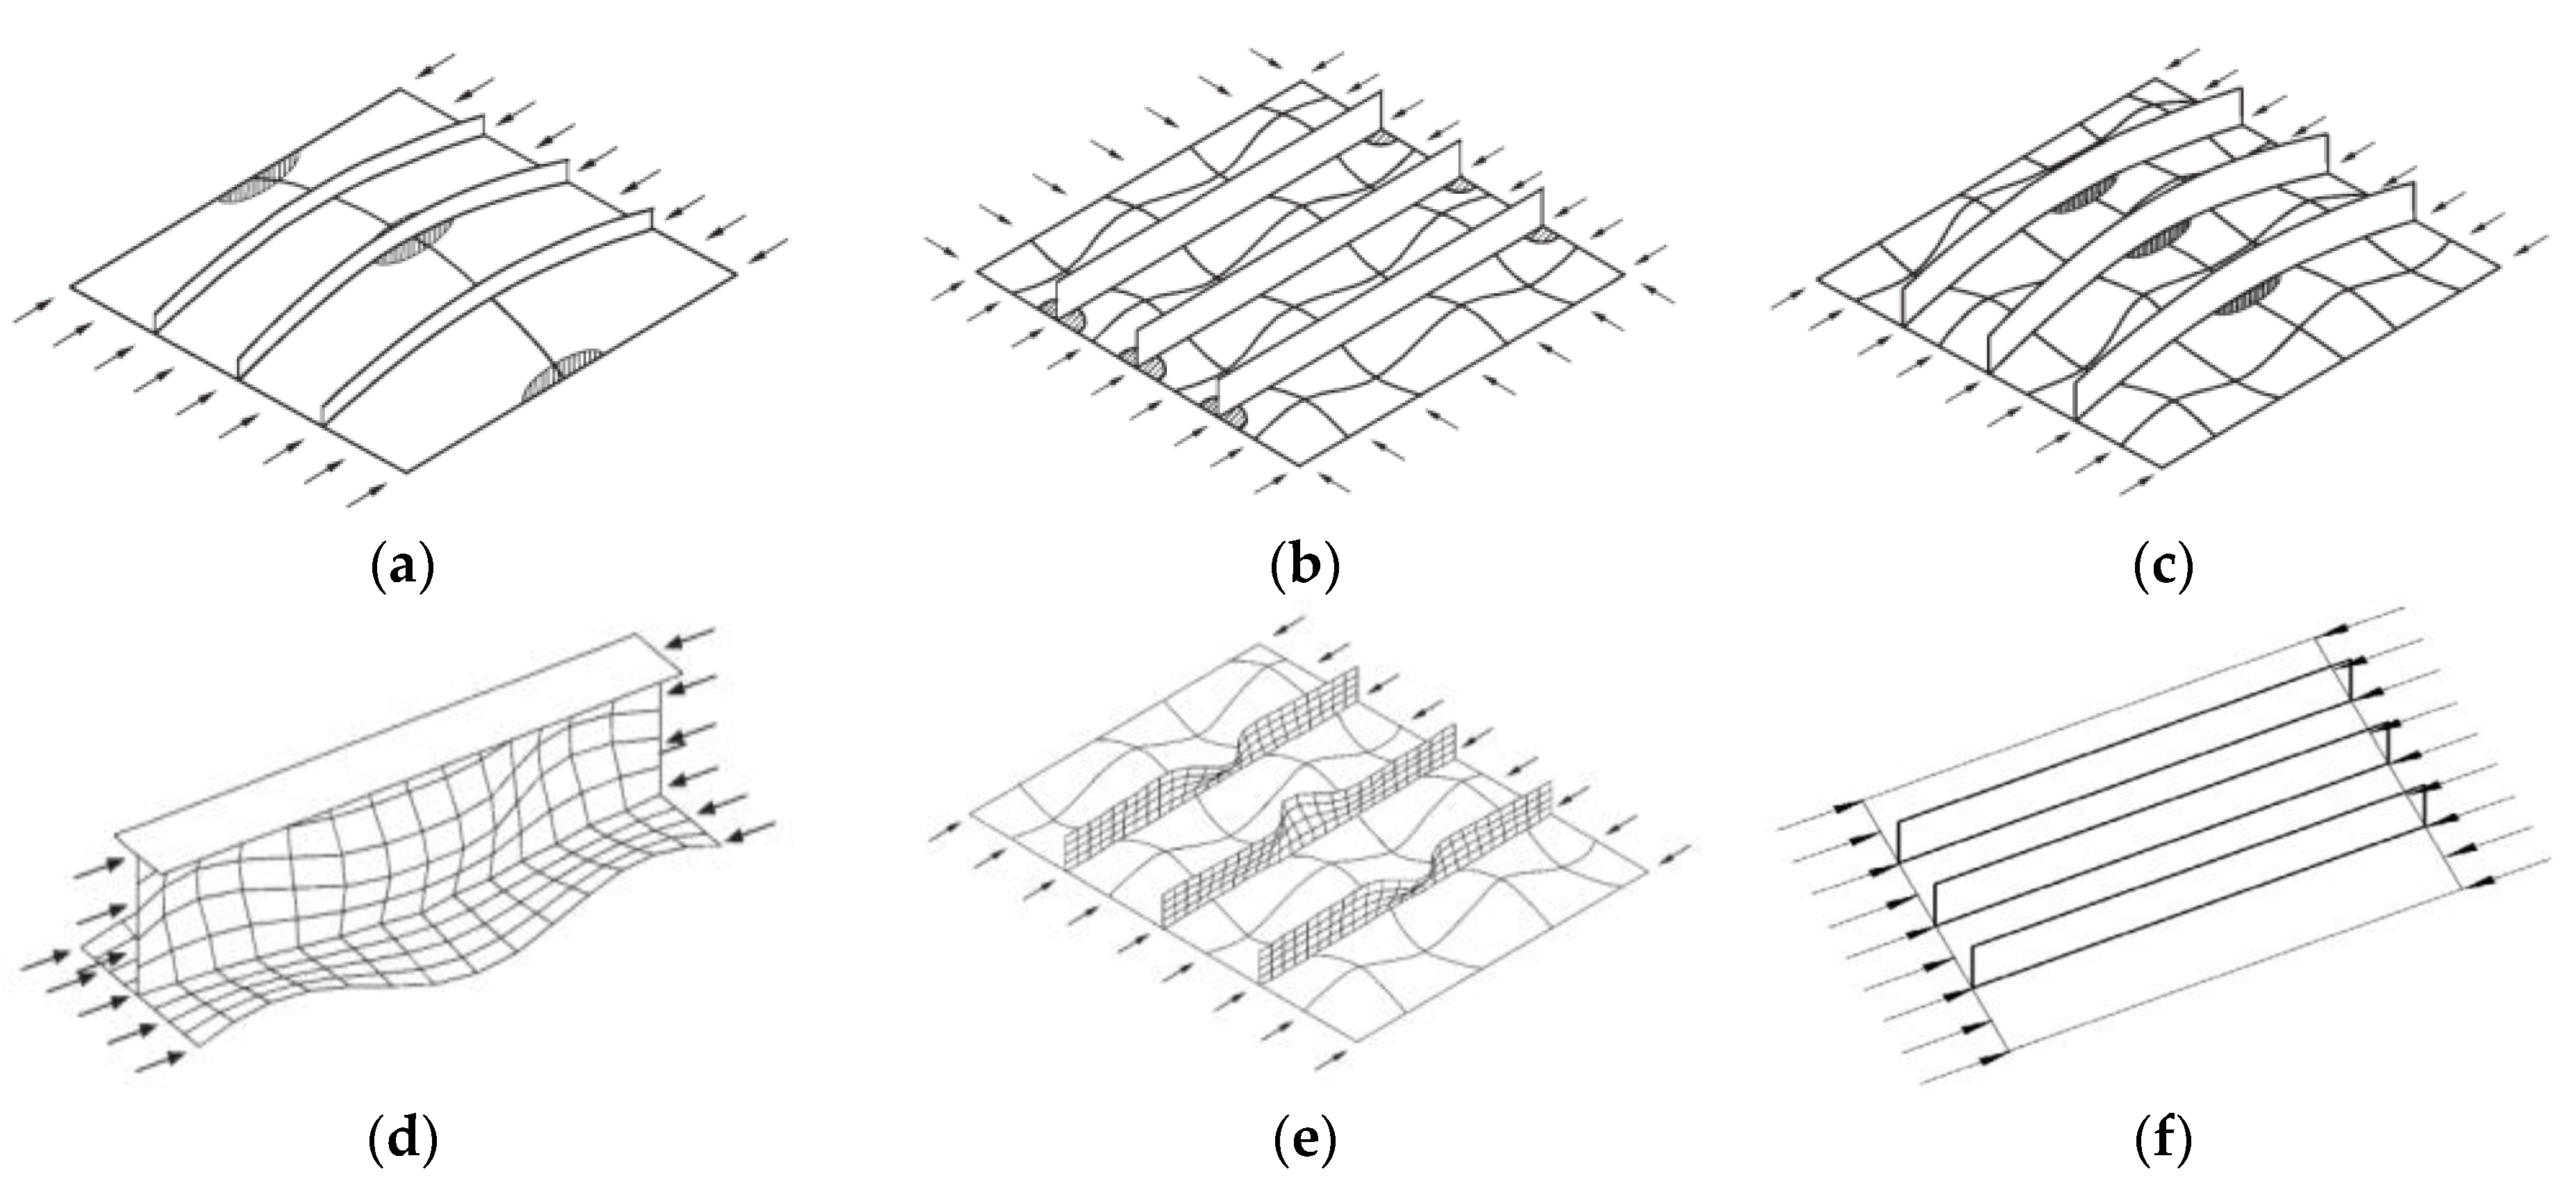
According to the research of Paik [
10], the failure modes of stiffened panels subject to axial compression can be divided into six types, as shown in
Figure 1: overall buckling (mode I), local plate buckling (mode II), beam–column buckling (mode III), stiffener web buckling (mode IV), stiffener tripping (mode V) and overall yielding (mode VI). Among them, local plate buckling (mode II), beam–column buckling (mode III), stiffener web buckling (mode IV), and stiffener tripping (mode V) are more common in offshore practice.
Mode II: The relatively weak plating severely deforms, and the stress concentrates at the corners of the plating between stiffeners.
Mode III: The principle of beam–column buckling is similar to that of the bending buckling of bars. The plating and stiffener are considered an entity due to their similar stiffness, and the collapse occurs mid-span. Without a violent deformation process, beam–column buckling is regarded as a relatively safe failure mode. A slight change in the size of the stiffened panel will not lead to a drastic change in the ultimate strength.
Mode IV: Stiffener panels are prone to collapse in this mode when the web of the stiffener has a large height-to-thickness ratio. As the main stiffened component, the stiffener bears the maximum load of the structure. However, the lack of stiffness often results in buckling on the web, and consequently lead to a sharp increase in the collapse probability of stiffened panel.
Mode V: Due to the small torsional stiffness, the stiffener twists around the intersection line of the stiffeners and the plating under axial compressive. Unlike beam–column buckling, the stiffened panel collapses sharply in a dangerous mode without the support of the stiffener. A slight reduction in the size of the stiffened panel may lead to a sharp decrease in the ultimate strength.
In summary, a great deal of work has been conducted on the formula for ultimate strength and the identification of failure modes of stiffened panels, which can provide us with valuable references. Nevertheless, a single line shape formula for stiffened panels containing only two parameters, and , fails to disclose the effect of failure modes, and there are still deficiencies in the study of the key parameters, evolution and boundaries of different failure modes.
From the above-mentioned situation, a study based on the failure modes is conducted. A new method of failure mode identification based on the variation trend of the ultimate strength and stress distribution in the ultimate limit state is proposed. Based on this method, the boundary between different failure modes is determined and a four-parameter ultimate strength formula applicable to different failure modes is proposed.
2. Modelling for FE Analysis
The finite element solver ANSYS was used for the analysis of ultimate limit state capacity of stiffened panel. The modeling of the stiffened panel, the application of the initial deformation and the post-processing work were all realized by ANSYS parametric design language (APDL).
In this paper, the advanced buckling analysis method recommended by the International Association of Classification Societies (IACS), which is based on nonlinear analysis techniques, was used to study the ultimate strength of stiffened panels. Nonlinear buckling analysis is a static analysis method based on factors such as elastic–plastic material properties, large deformation and initial imperfections. The model of an ideal elastic–plastic material was adopted and the effect of strain-hardening was ignored. To track the post-buckling process of the structure, the Riks method was used to solve the complex load and displacement paths in the post-buckling stage of the structure by introducing a load factor to link the load and displacement.
2.1. Geometric and Material Properties
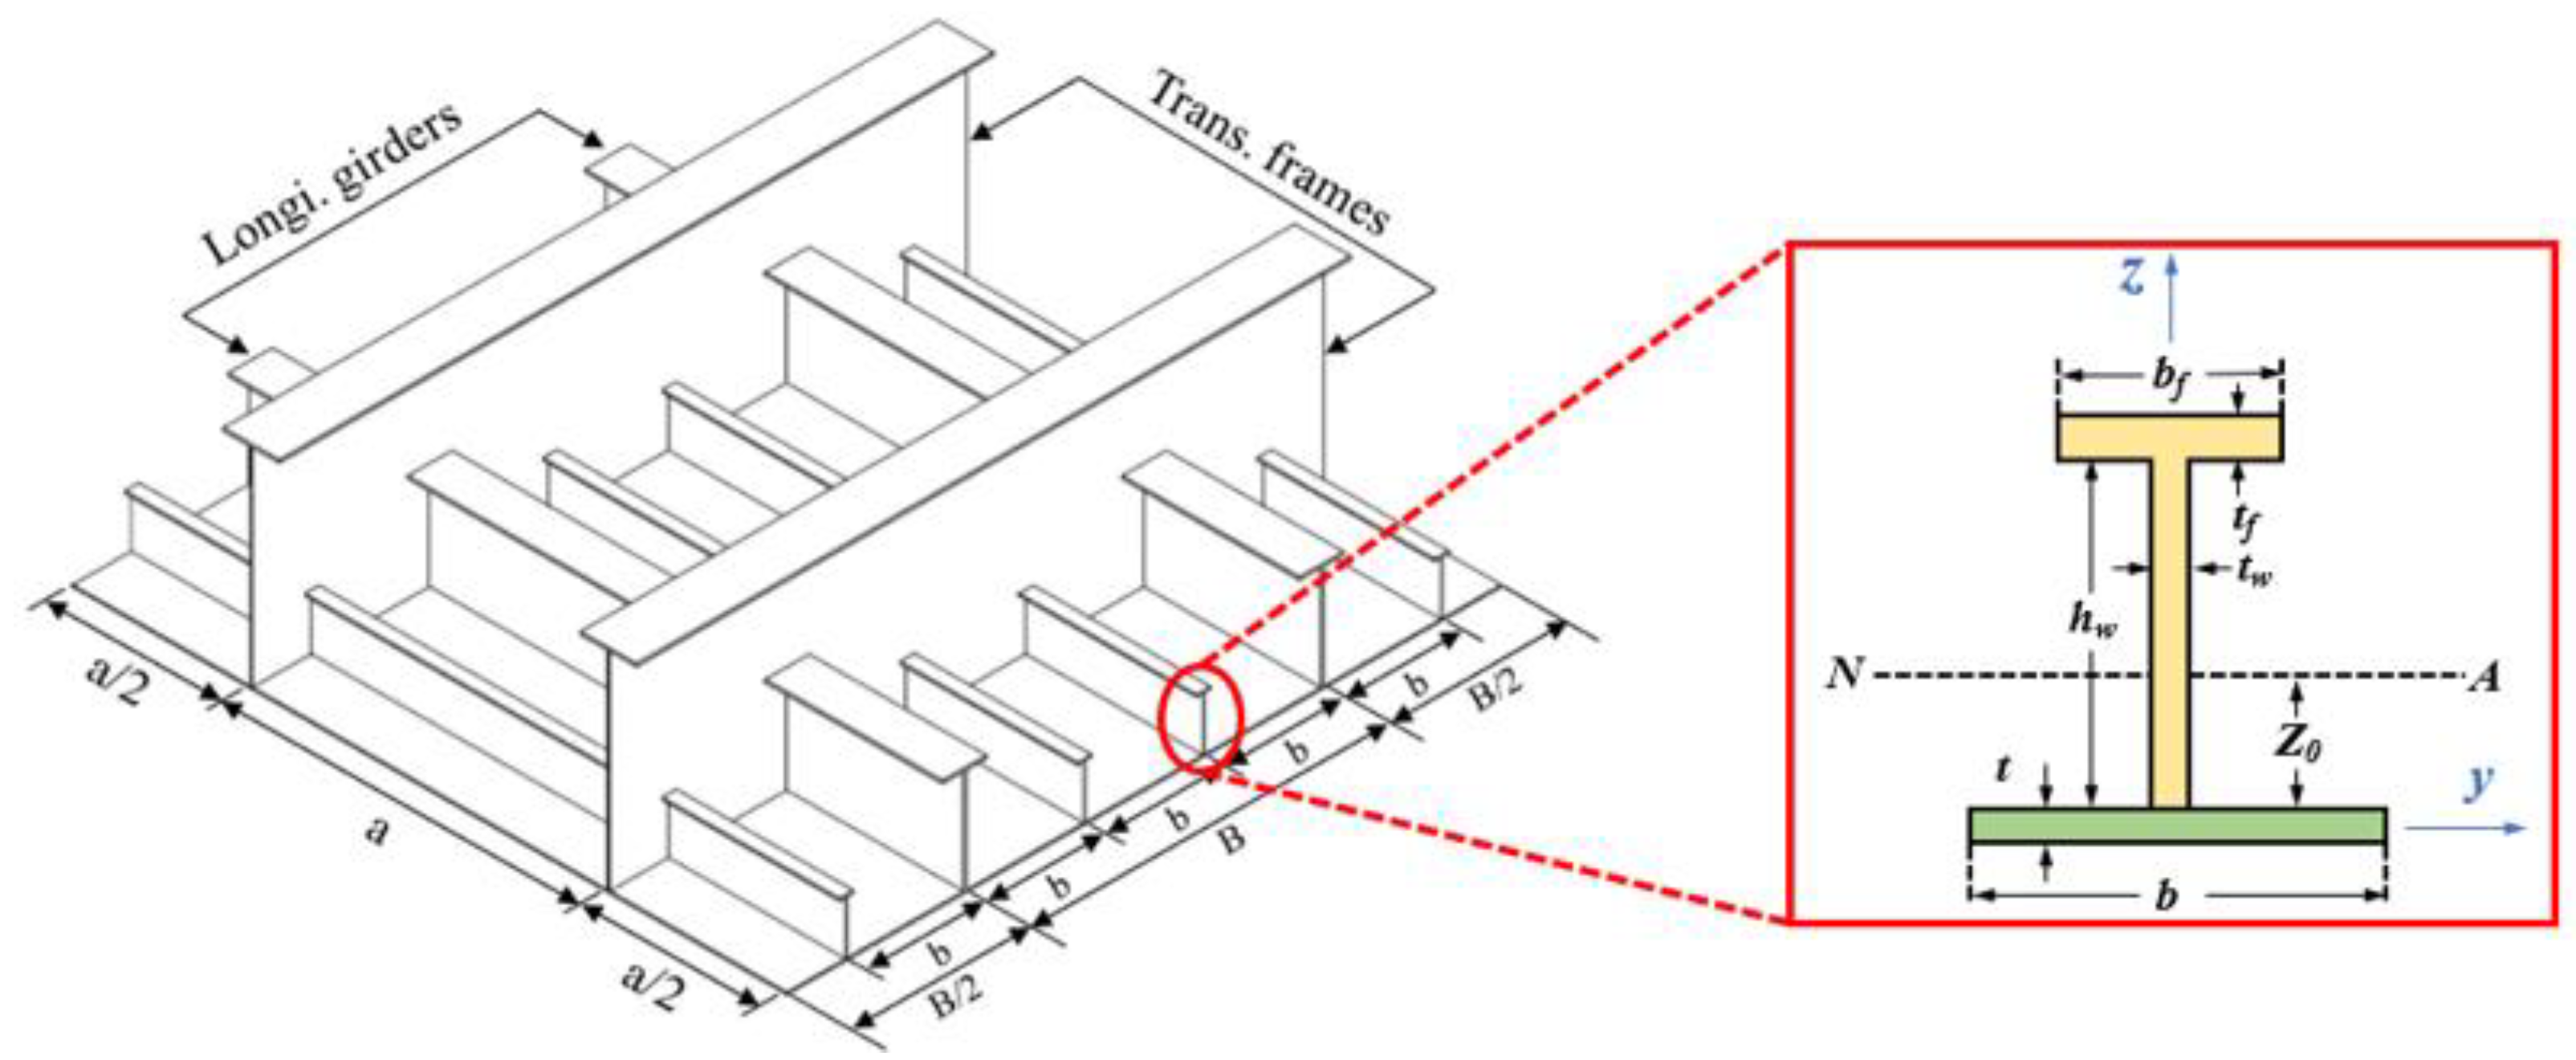
The ultimate strength of stiffened panels is related to the material parameters, geometric dimensions, initial defects, and load conditions. With reference to the benchmark model Panel A in ISSC2012 [
11], the ultimate strength of stiffened panels under uniaxial longitudinal compression was studied. The structure and size of the stiffened panel are shown in
Figure 2. The stiffened panel was made of hull steel, and the material was assumed to be uniform, continuous, isotropic and ideal elastoplastic, satisfying the Von Mises yield criterion. The relevant parameters are shown in
Table 1. The Shell181 element was used to establish the stiffened panel model, which has four nodes; each node contains six degrees of freedom. This element can be applied to linear, large rotation or large strain analysis. Allowing for both geometric and material nonlinearities, Shell181 is well-suited to simulating thin and medium-thickness shells. In the element domain, both full and reduced integration schemes are supported. For stiffened panels, the ideal choice is to use a reduced integration for the plating and a full integration for the stiffeners.
2.2. Initial Imperfections
An initial imperfection contains initial deformation and residual stress, which often leads to a reduction in the ultimate strength regarding the analysis of problems involving structural instabilities. Therefore, it is necessary for the finite element model to reasonably include initial imperfections.
The residual stress distribution of each part of a stiffened panel differs, and the stress amplitude is greatly affected by temperature. At the same time, a hull structure subjected to a cyclic wave force undergoes residual stress redistribution and relaxation. Therefore, in the numerical calculation of stiffened panels, the residual stress is usually ignored.
Initial deformation can be directly measured by scanning equipment. When the measurement is difficult or the data reliability is poor, a modal analysis method can be adopted to obtain the lowest buckling mode and the initial deformation. This paper refers to the ISSC to impose the buckling initial deformation on the stiffened panels. The initial deformation expressions for local plate buckling
, beam–column buckling
, and stiffener tripping
are as follows:
where
(moderate deformation), buckling periodic waves
(the smallest integer that satisfies
),
,
, and the plate width between the longitudinal girders
.
The final initial deformations are obtained by superimposing these three initial deformations and created by an APDL program according to the coordinates calculated by the above equation.
2.3. Boundary Conditions
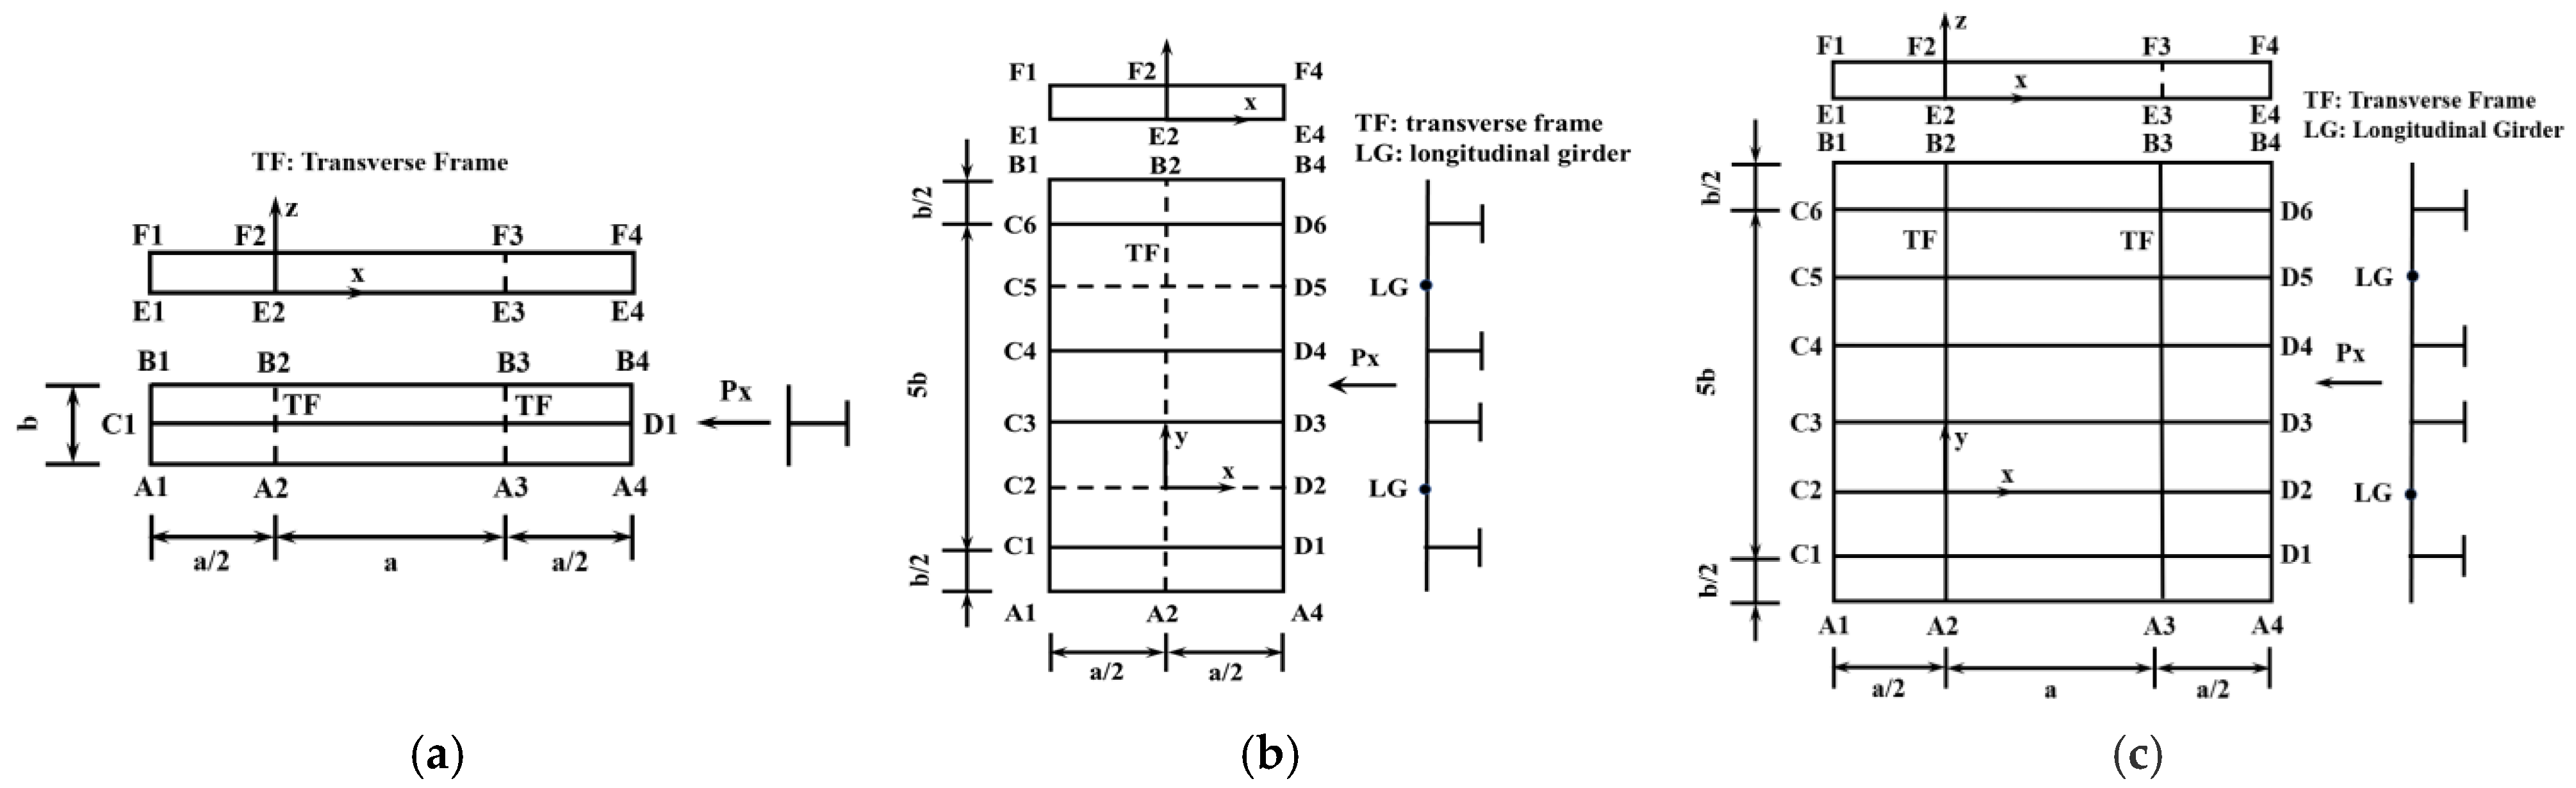
The boundary conditions were set is based on Xu [
12]. Taking a stiffened panel with a thickness of 16 mm and stiffeners of size 3 as an example,
Figure 3 and
Figure 4 show the size and stress distribution in the ultimate state of the single-stiffener model, symmetrical model (half model in the longitudinal direction) and periodic model (Panel A). The ultimate strength of these three models is shown in
Table 2.
The accuracy of the ultimate strength of the single-stiffener model is low, while the results of the symmetrical model and the periodic model are essentially the same. The boundary conditions of the two models are shown in
Table 3 and
Table 4. 0, and indicate constraint. To observe the failure modes comprehensively, periodic boundary conditions are selected.
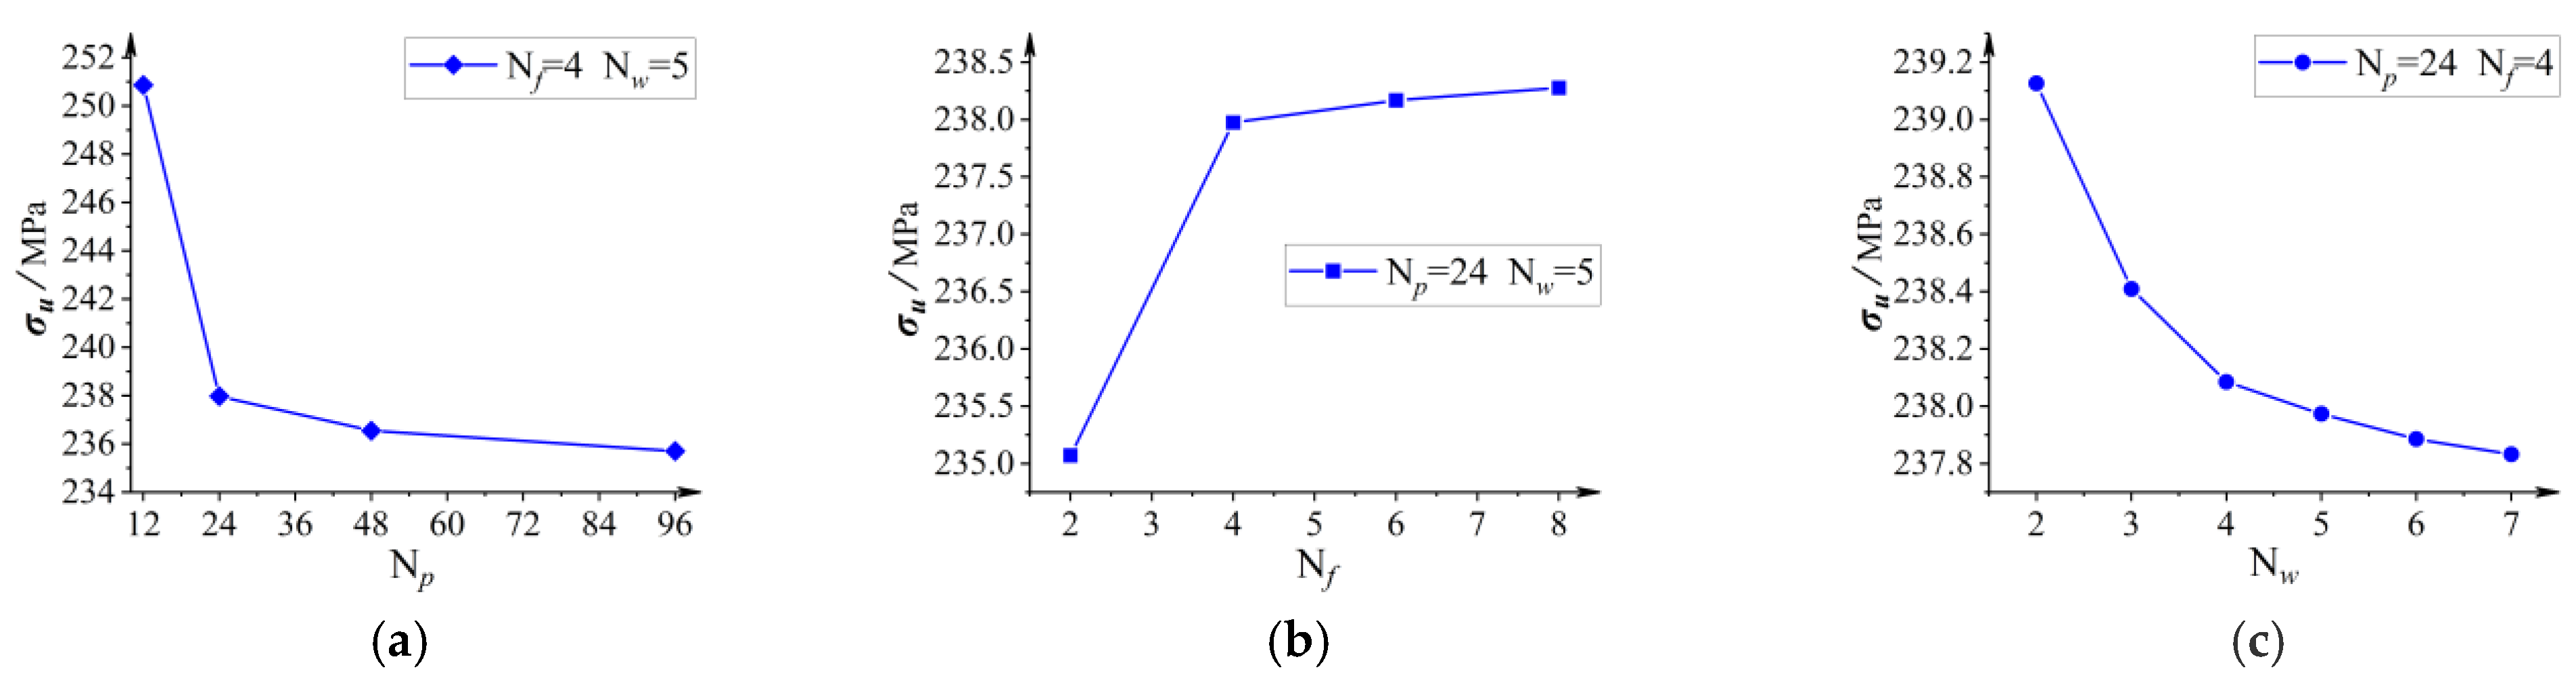
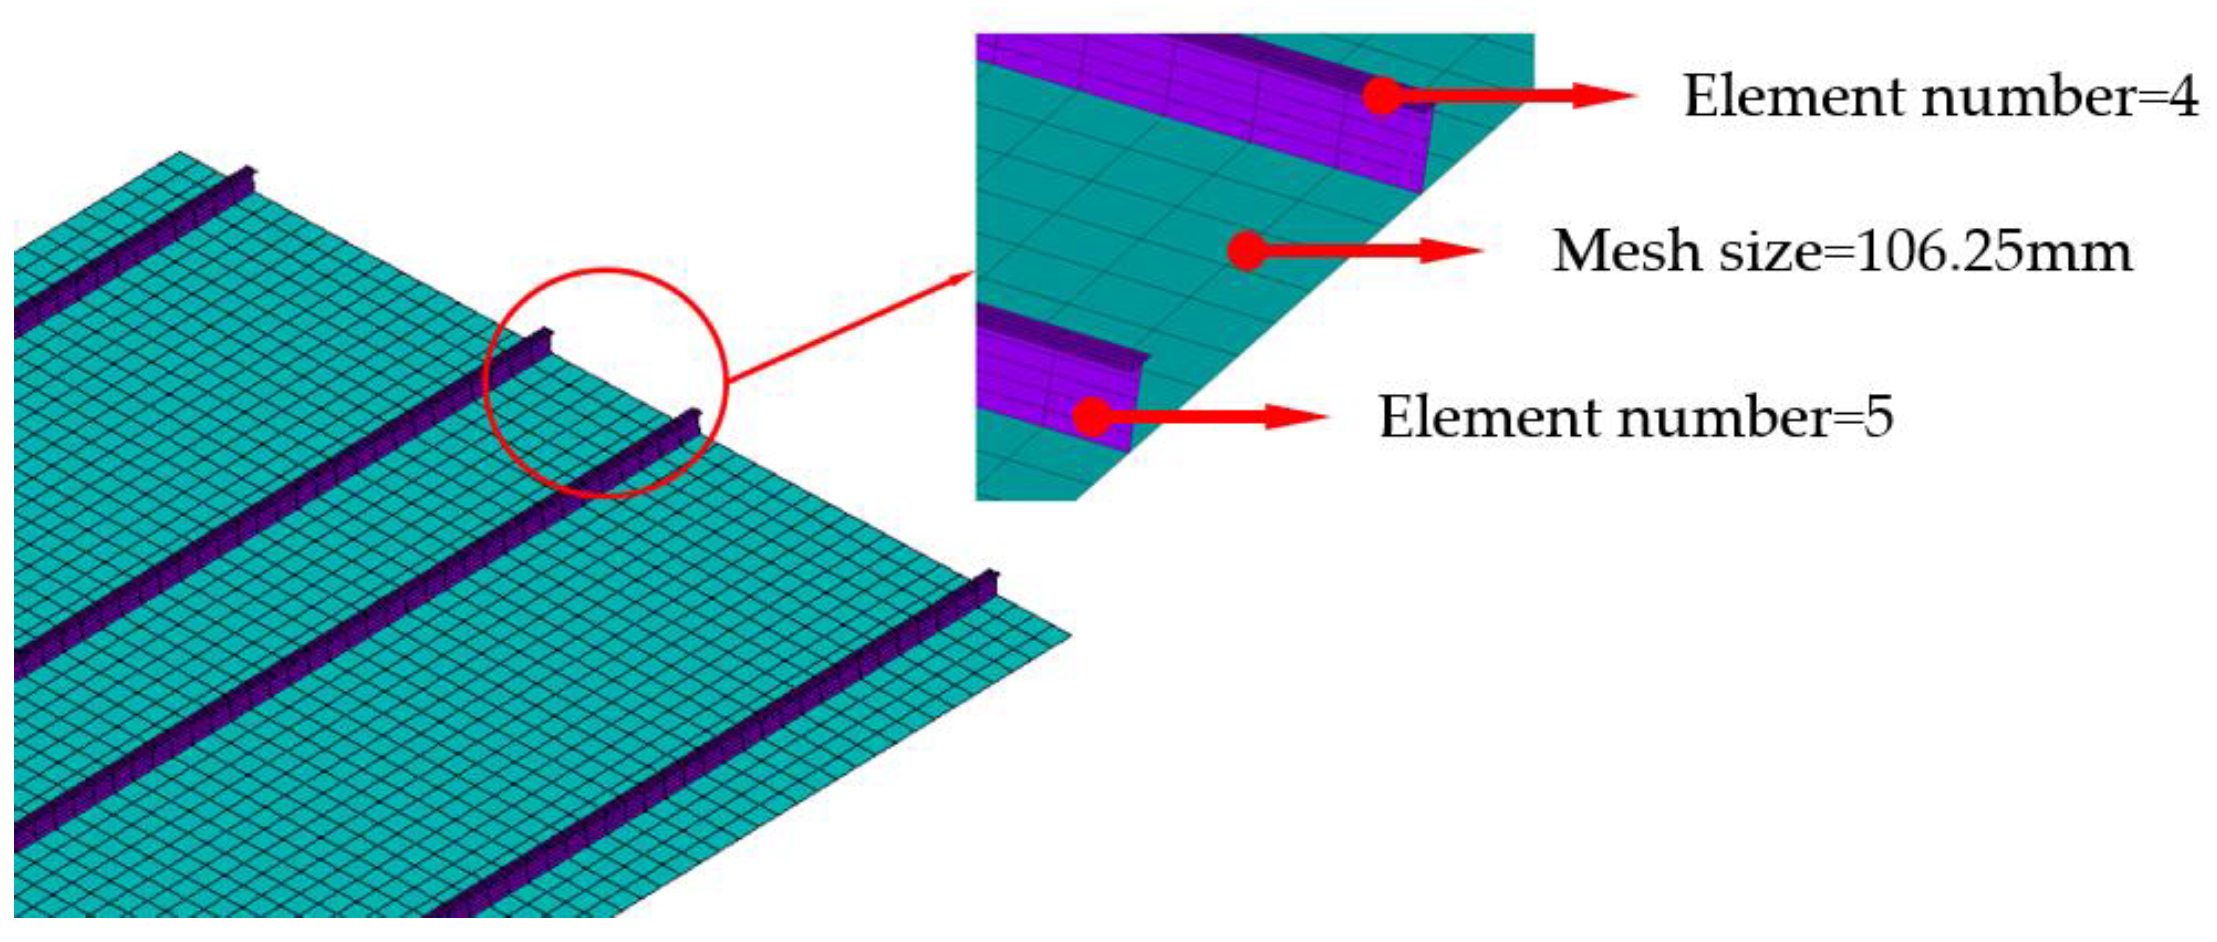
2.4. Mesh Size
The mesh size determines the total number of elements. To find a balance between computational expense and accuracy, a stiffened panel with a plate thickness of 16 mm and stiffeners of size 3 was used for convergence verification of the mesh size. The number of elements with plating, flange and web was set to Np, Nf, Nw respectively.
Take the number of elements with plating as an example. Four mesh sizes of 213.50 mm (N
p = 12), 106.25 mm (N
p = 24), 53.125 mm (N
p = 48) and 26.563 mm (N
p = 96) were selected for tentative calculation. As
Figure 5a shows, when the mesh size is less than 106.25 mm (N
p = 24), the reduction in the mesh brings little benefit in terms of accuracy. The difference in ultimate strength between 106.25 mm (N
p = 24) and 53.125 mm (N
p = 48) mesh sizes is only 0.6%. The mesh size of 106.25 mm (N
p = 24) can be considered to meet the convergence requirements, so the 106.25 mm (N
p = 24) mesh size was set for calculation. Similarly, the numbers of elements of the stiffener flange and web were set as 4 and 5, respectively, as shown in
Figure 6.
2.5. Model Verification
In this paper, several stiffened panels with different plating thicknesses and stiffener sizes were selected for the ultimate strength calculation, and the calculation results are compared with the results in the related literature in
Table 5. Under the same conditions, such as the same size stiffener and same initial imperfections, the error in the results is within ±3%, which means that the results are within a reasonable range and the model is sufficiently accurate.
4. Study on Stiffener Failure
4.1. Theoretical Formula
The principle of web buckling is similar to the buckling of thin plates. Solving the neutral equilibrium differential equation of a thin plate leads to the ideal elastic buckling critical stress formula:
where the value of coefficient
is related to
and
[
17].
and
are negatively correlated, and
can be selected as a mechanical parameter for evaluating web buckling.
Stiffener tripping refers to stiffener torsional buckling around the centre of forced rotation. According to the principle of constant potential energy, the ideal elastic buckling critical stress of stiffener tripping can be obtained, which can be written in a similar way to beam–column buckling, as follows:
where
and
is the converted radius of gyration.
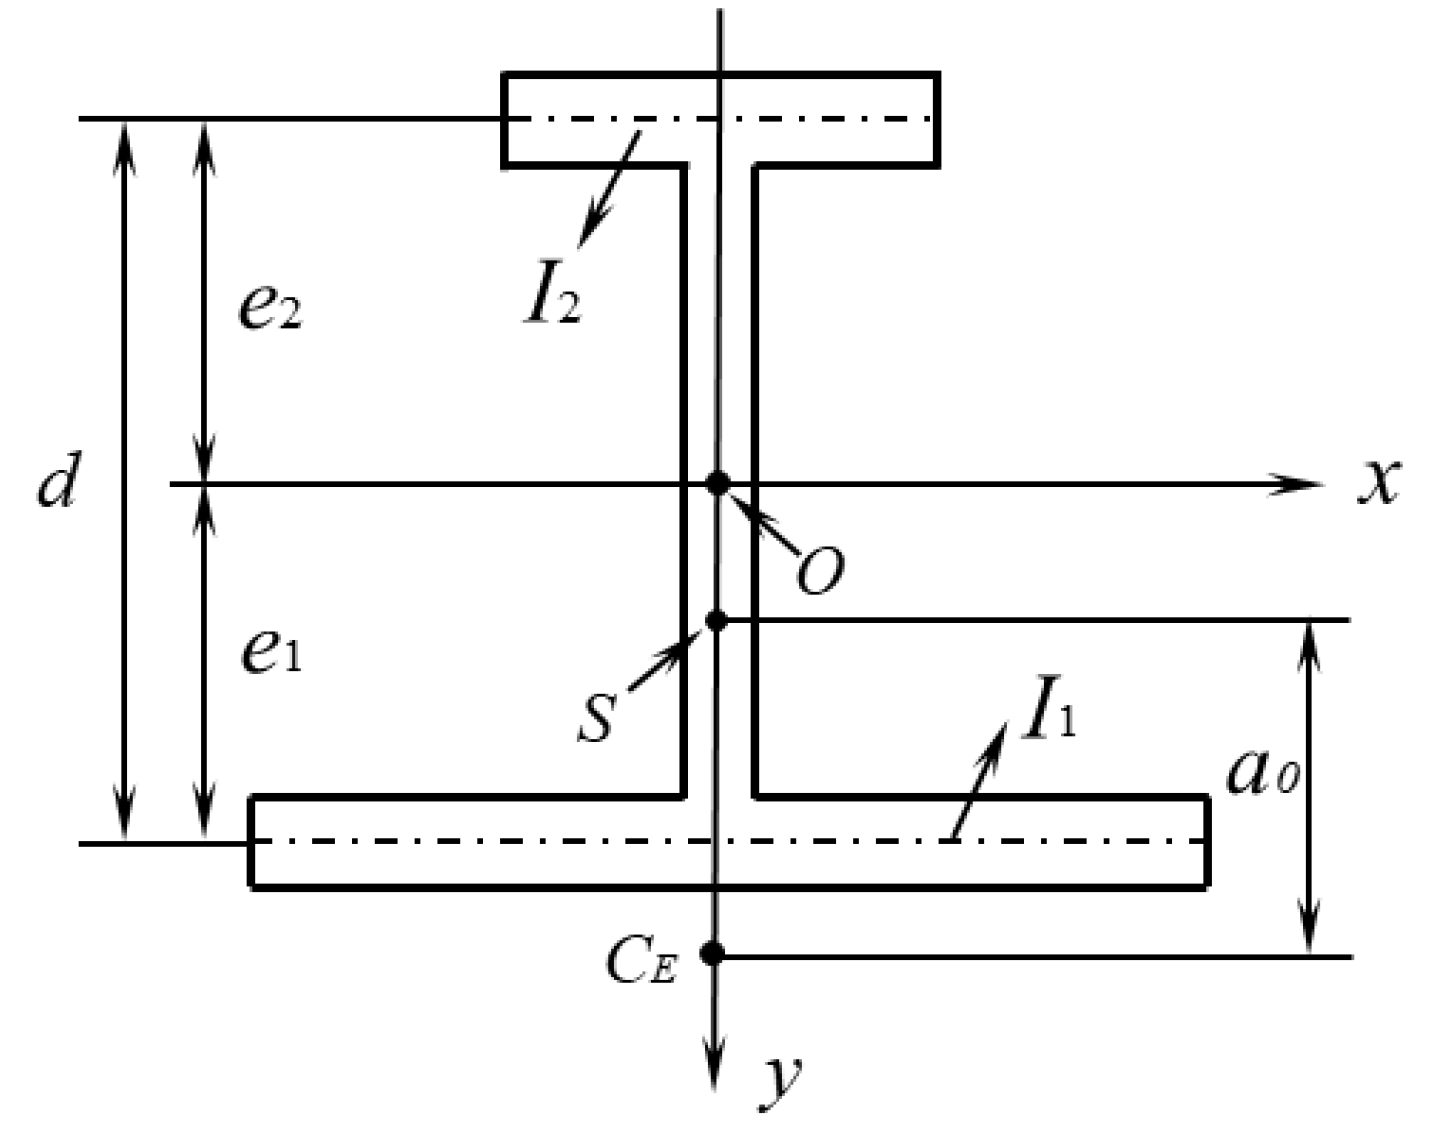
A stiffened panel can be regarded as I-beams with different flanges, as shown in
Figure 12. With centroid
O as the origin,
and
are the moments of inertia of the two flanges to the
y-axis. The shear centre
S is located on the
y-axis,
, and the sector moment of inertia is
. For a stiffened panel, due to the large difference in the sizes of the plate and the flange of the stiffener, the forced rotation centre
is approximately at the intersection of the plate and the centre line of the web; that is,
.
The formula [
17] for the converted radius of gyration
is as follows:
where
is the polar moment of inertia of the section to
.
and
are the principal moments of inertia of the section to the centroid
O.
is the cross-sectional area of the stiffener.
G is the shear modulus.
is the torsional moment of inertia of the cross-section.
[
18] is the torsional spring stiffness.
Therefore, and are negatively correlated, and can be selected as the mechanical parameter for evaluating stiffener tripping. is related not only to the stiffener size but also to the plate size.
Notably, since the stiffener web is connected to the plating and stiffener flange, web buckling has a strong coupling effect with local plate buckling and stiffener tripping, respectively. According to the calculations in the IACS standard [
16], the web buckling stress is almost always greater than the local plate buckling stress or the stiffener tripping stress in the normal size range. Therefore, stiffener web buckling can be considered to play a secondary role in a stiffened panel with T-section stiffeners. To facilitate the distinction, web buckling is classified into these two failure modes according to the effect of local plate buckling and stiffener tripping, and web buckling is not considered separately. Zhang [
8] also adopted a similar approach when classifying the failure modes of stiffened panels.
4.2. Identification of Stiffener Tripping
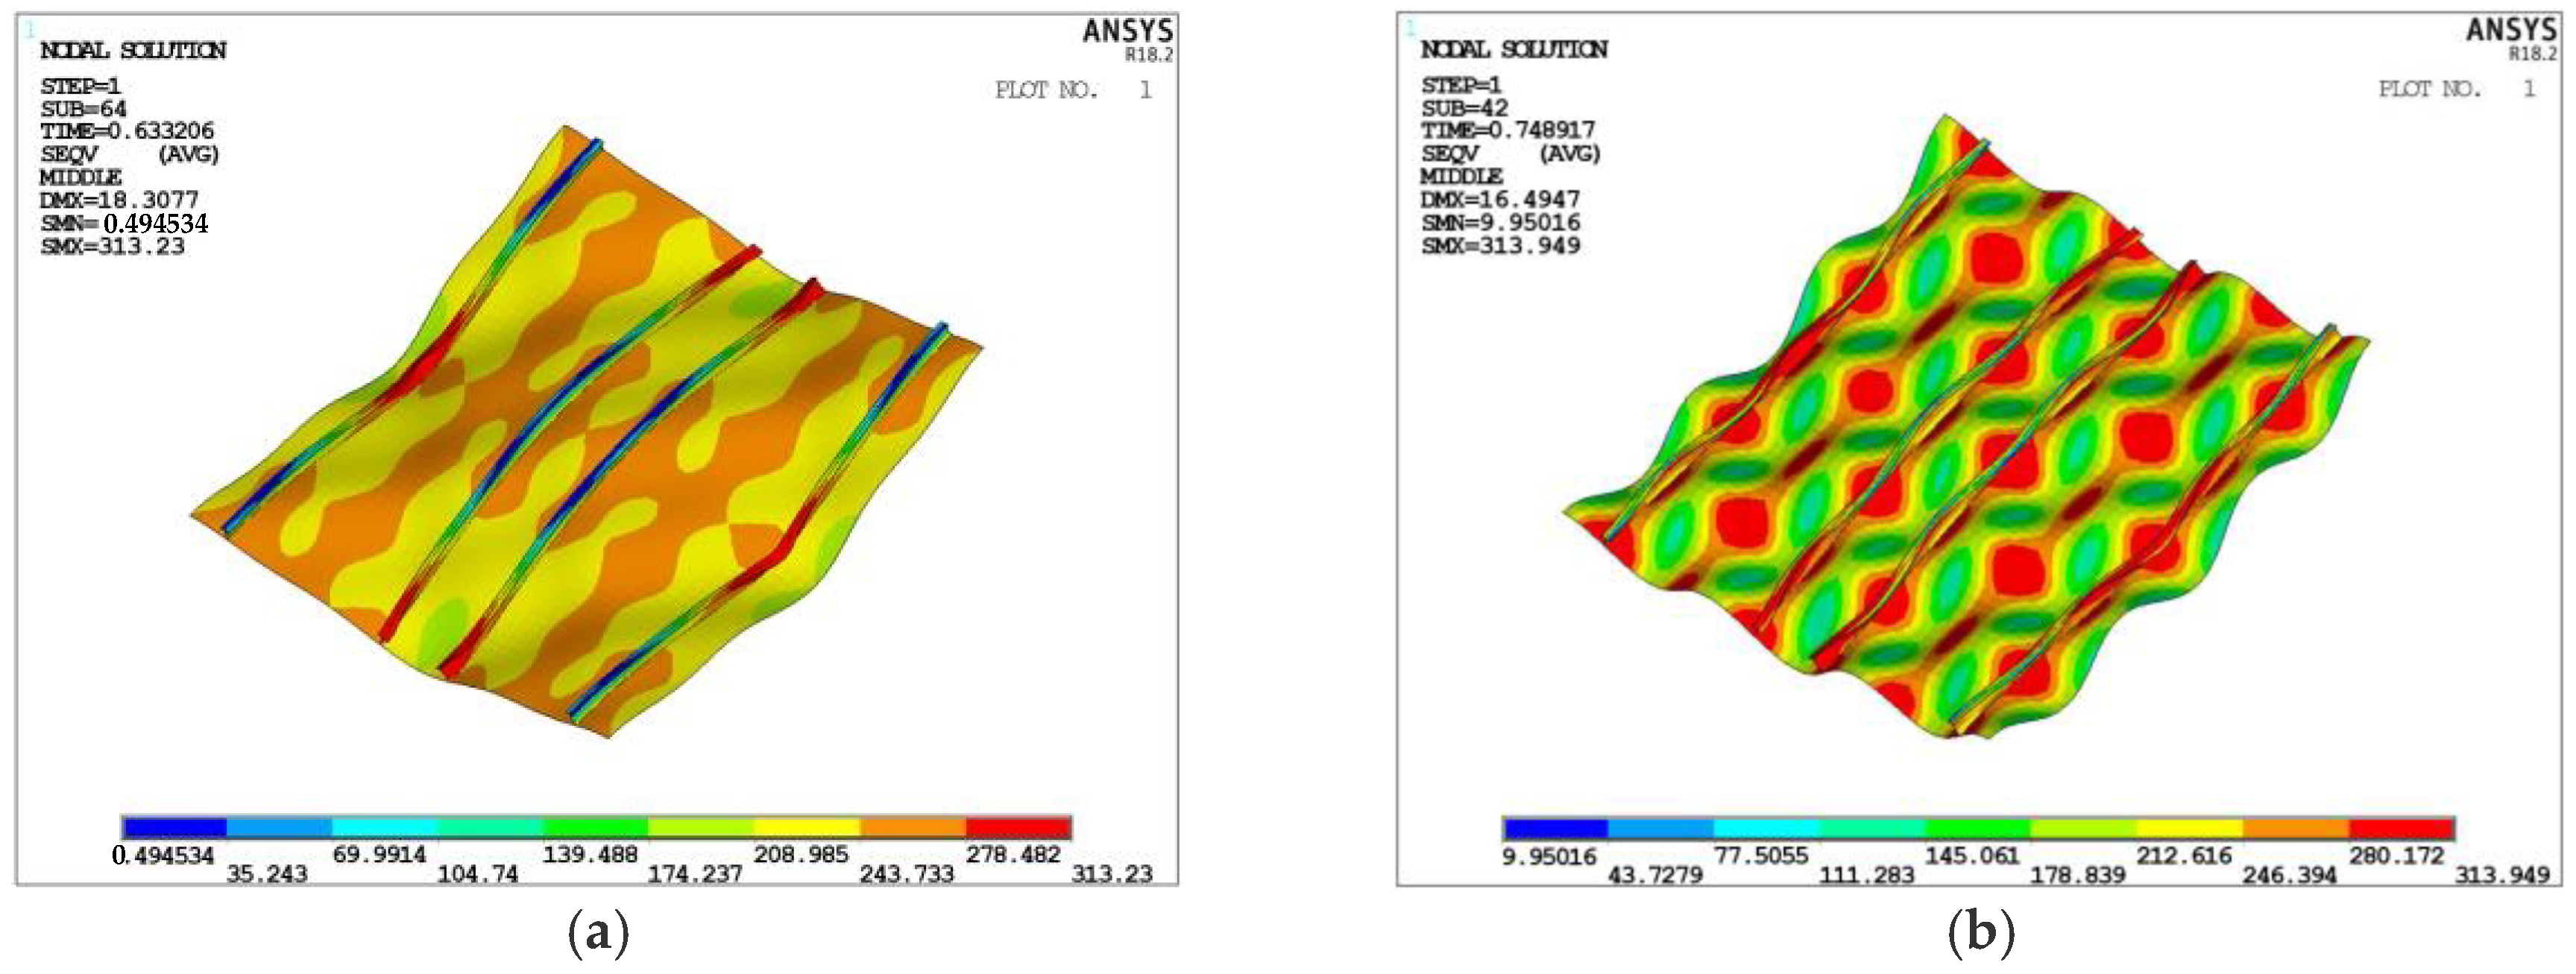
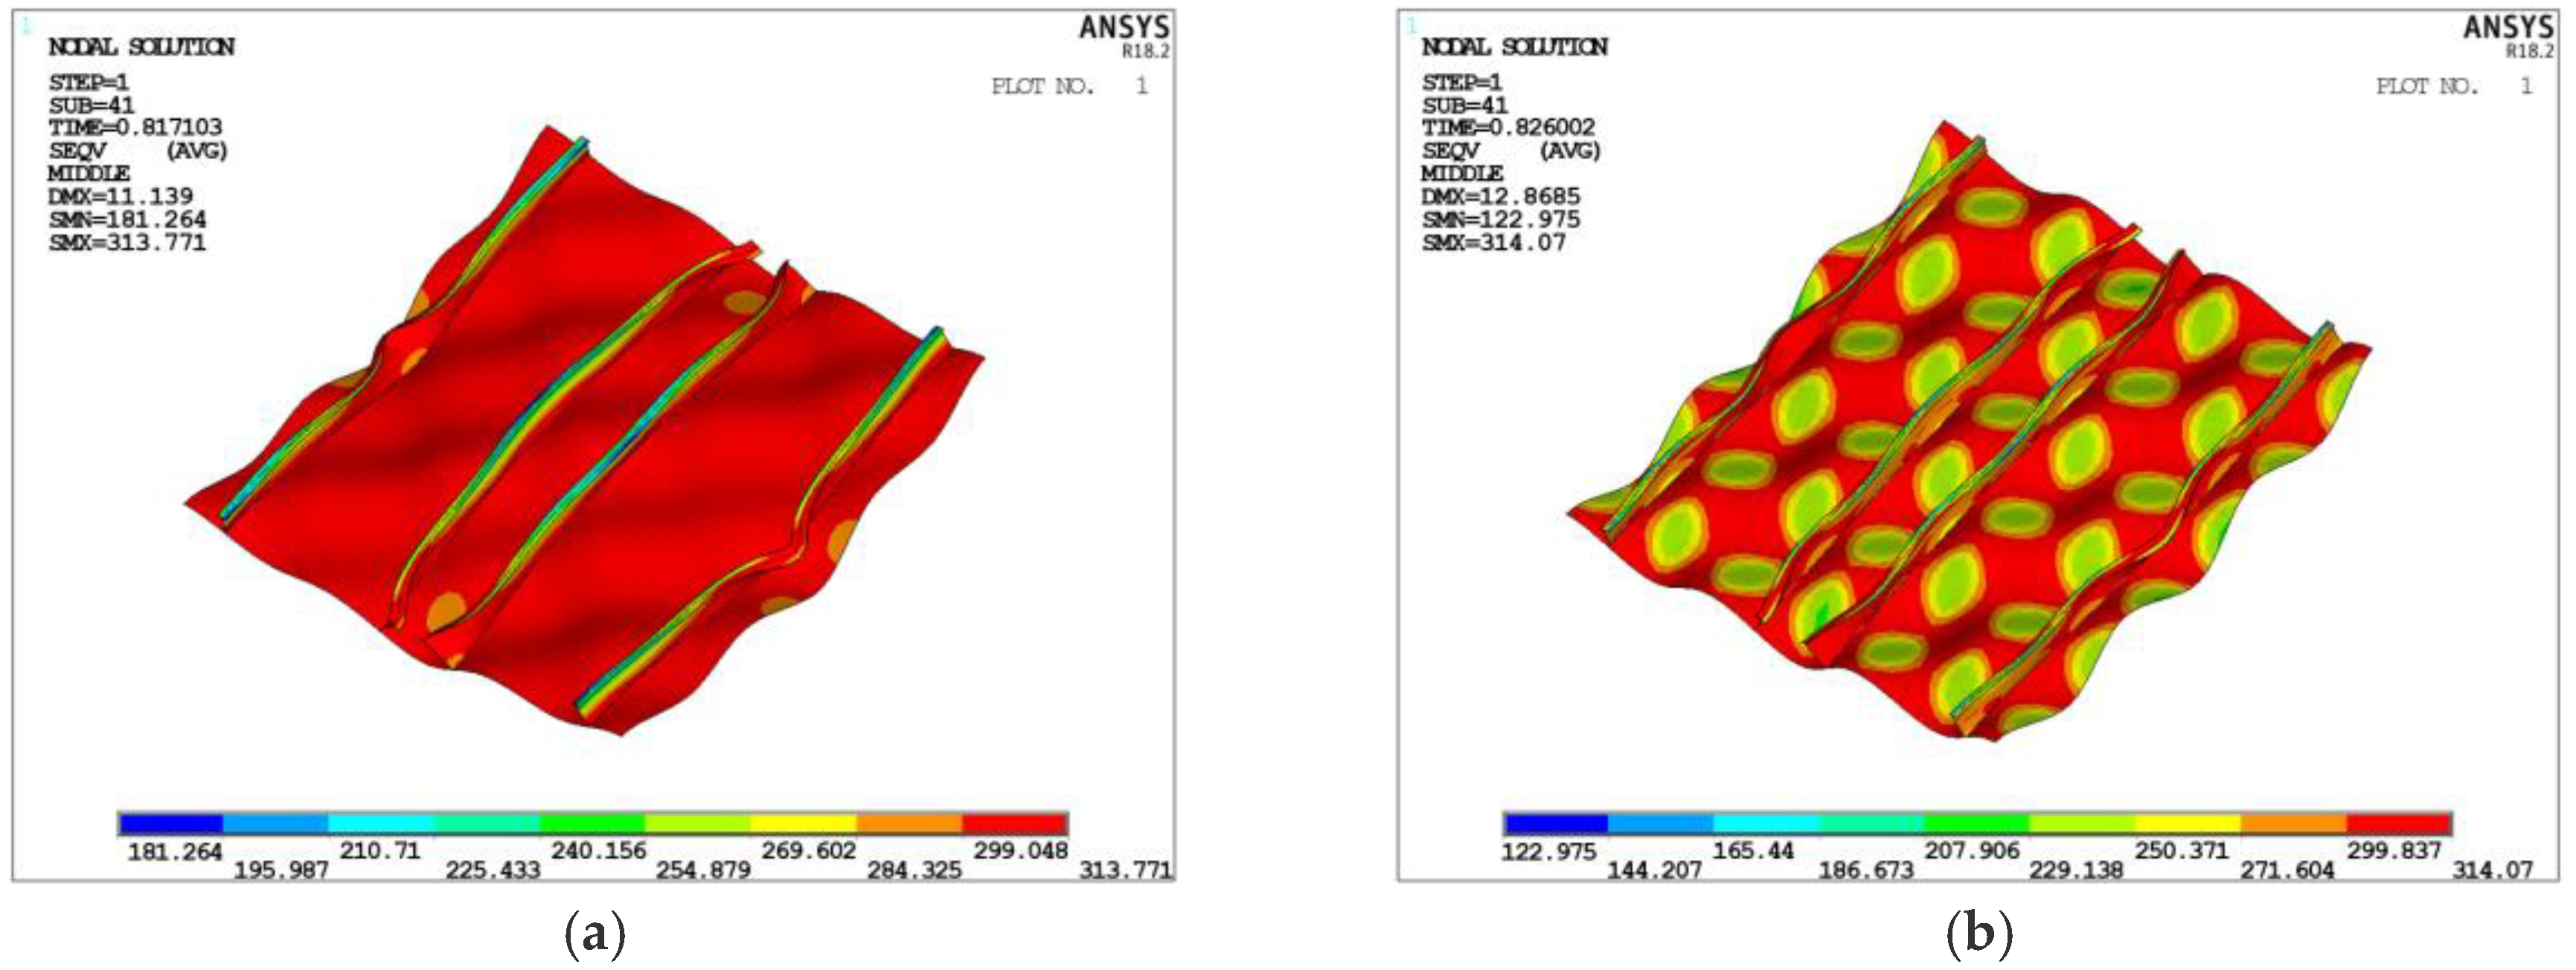
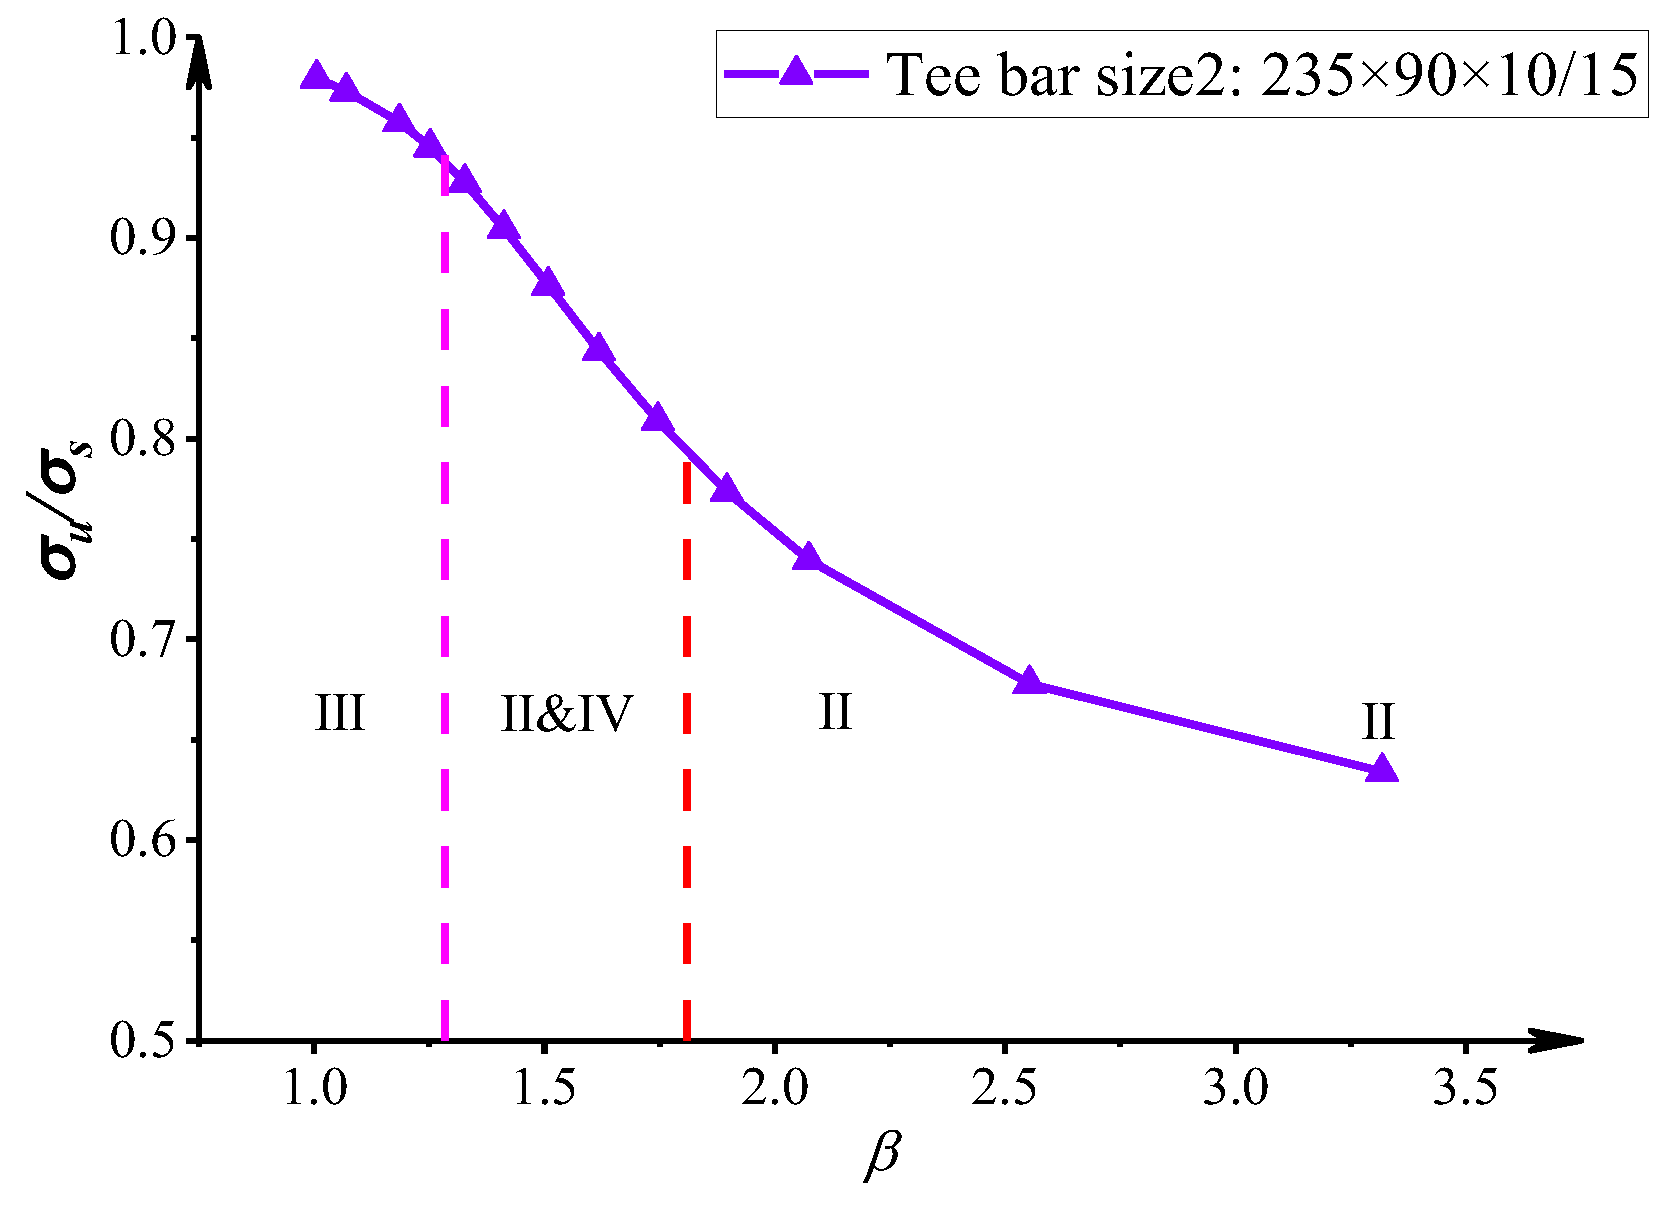
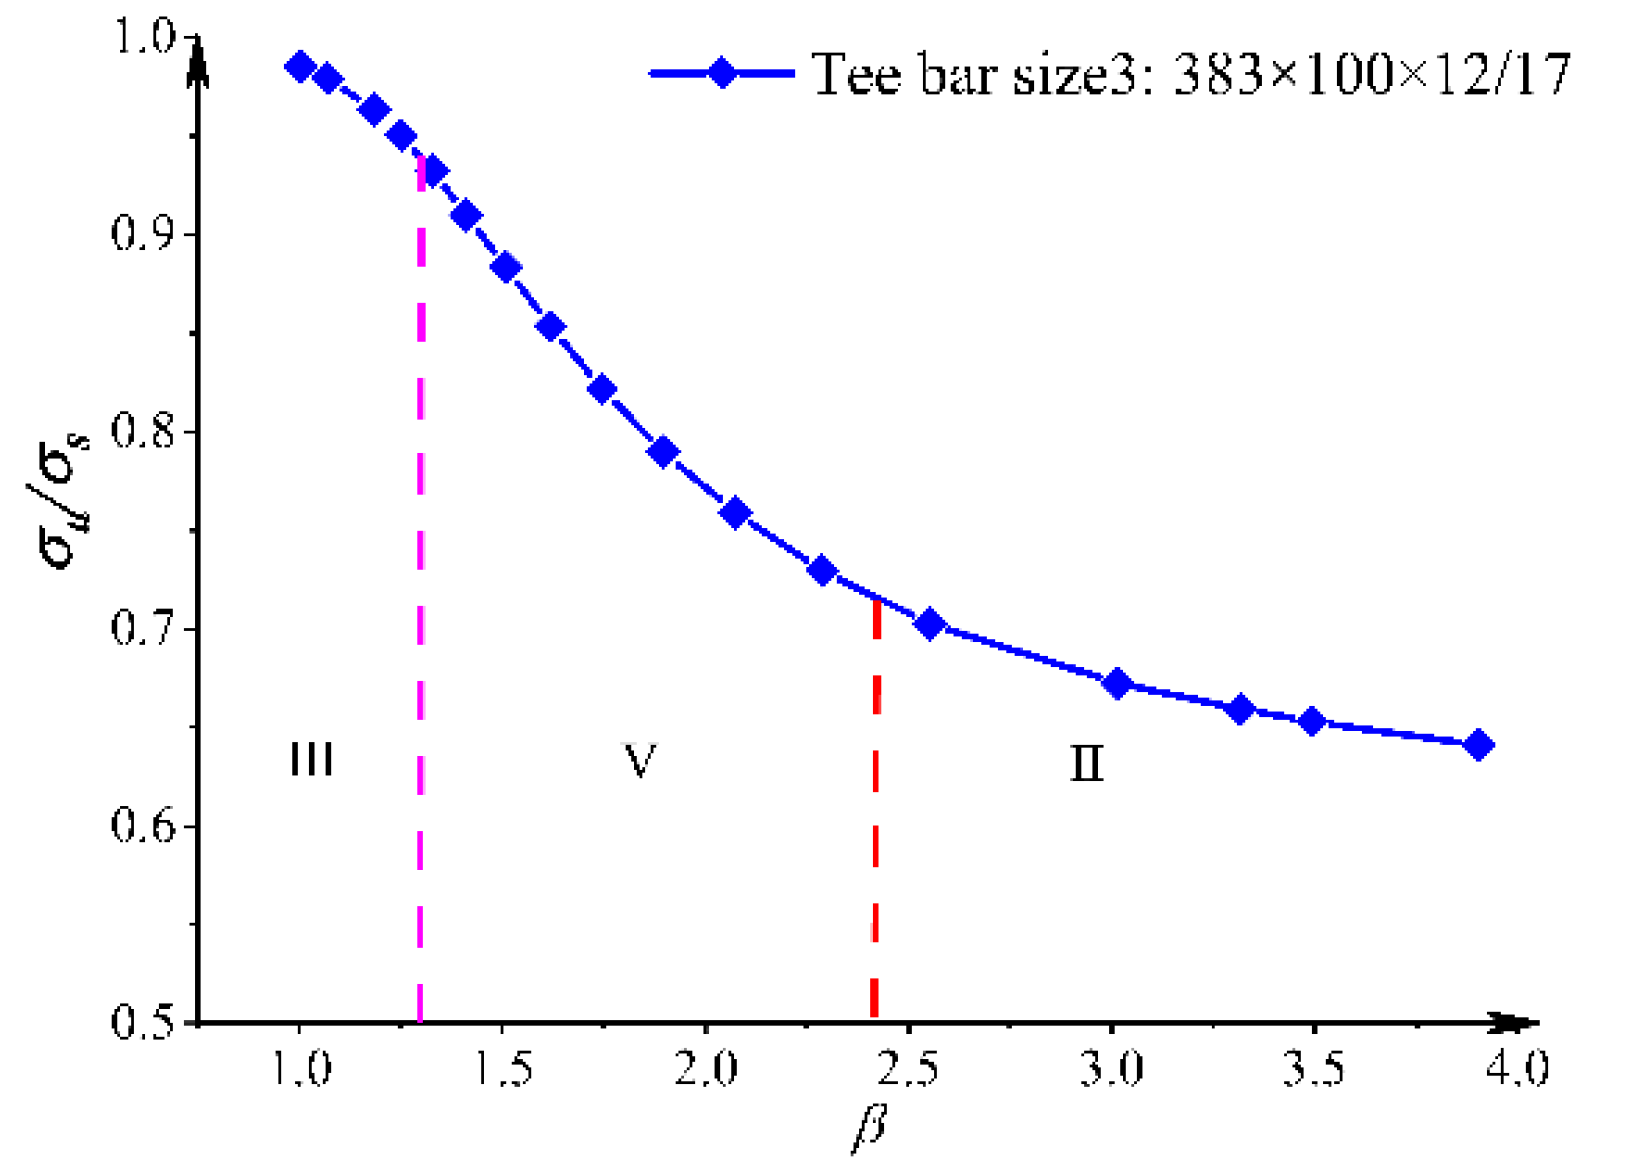
Figure 13 shows the relationship between the ultimate strength and
for a stiffener of size 3 and the dashed line indicates the critical value of
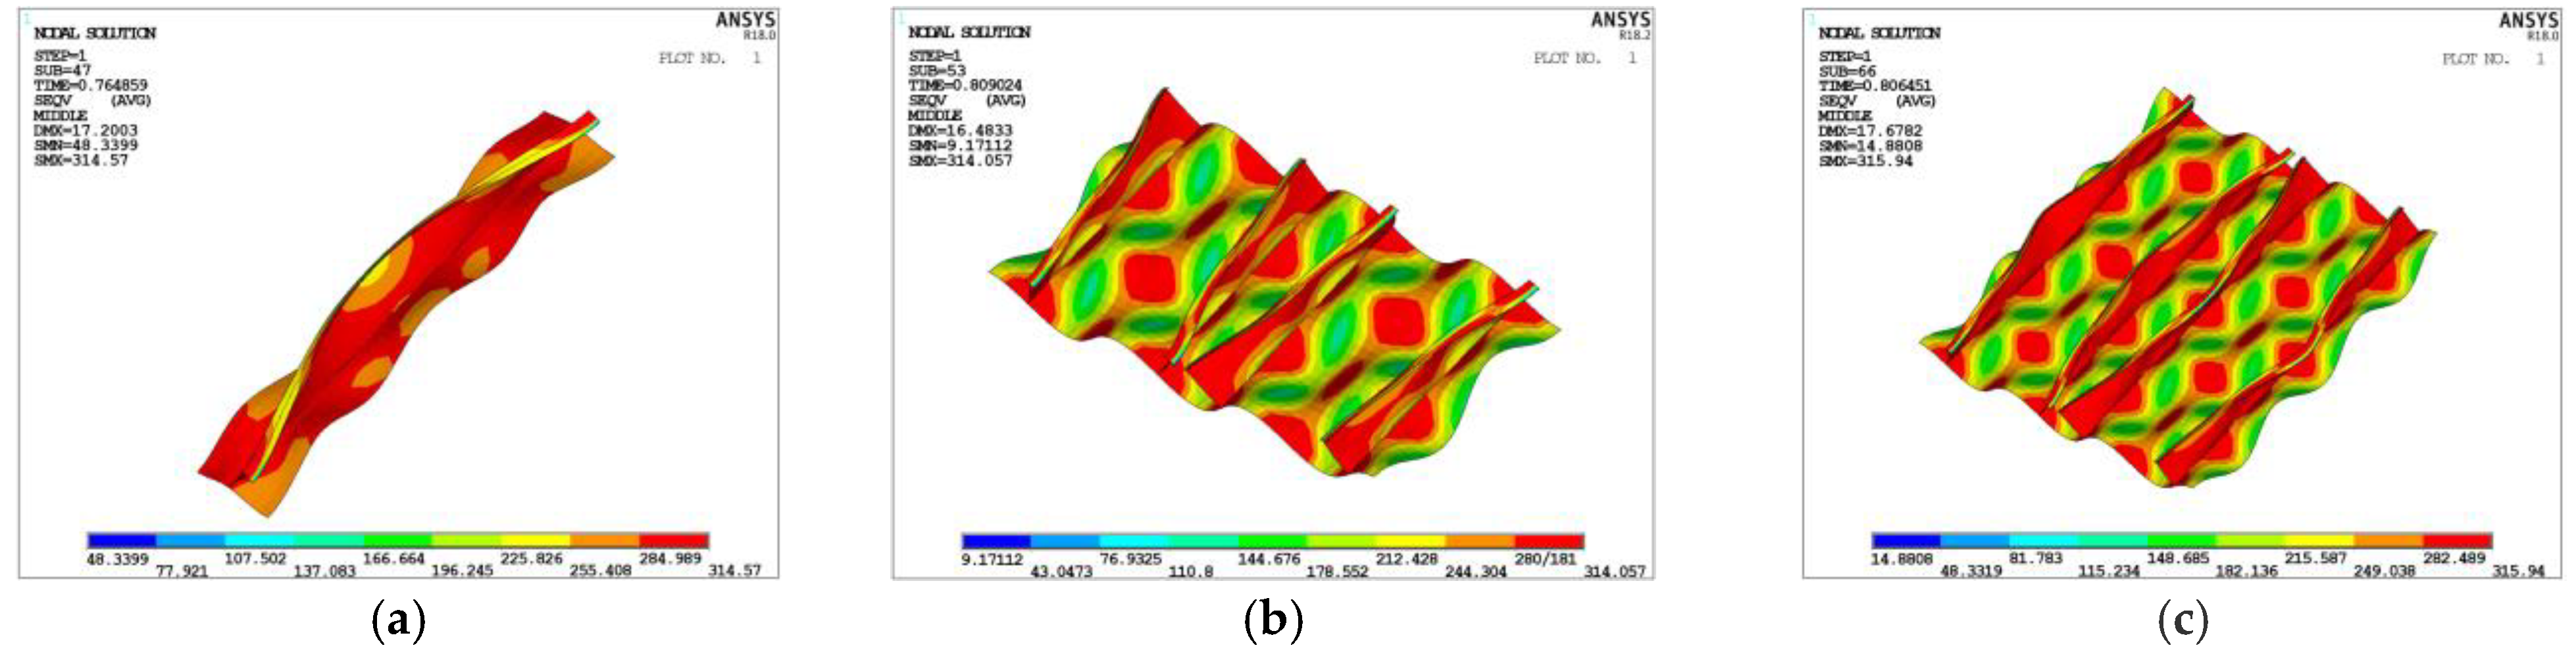
for different failure modes. When the plate thickness is large, the beam–column overall failure mode is the main form; when the plate thickness is reduced to a certain extent, the beam–column effect is weakened and the tripping effect of the stiffeners is strengthened; when the plate thickness is very thin, local plate buckling plays a major role.
As shown in
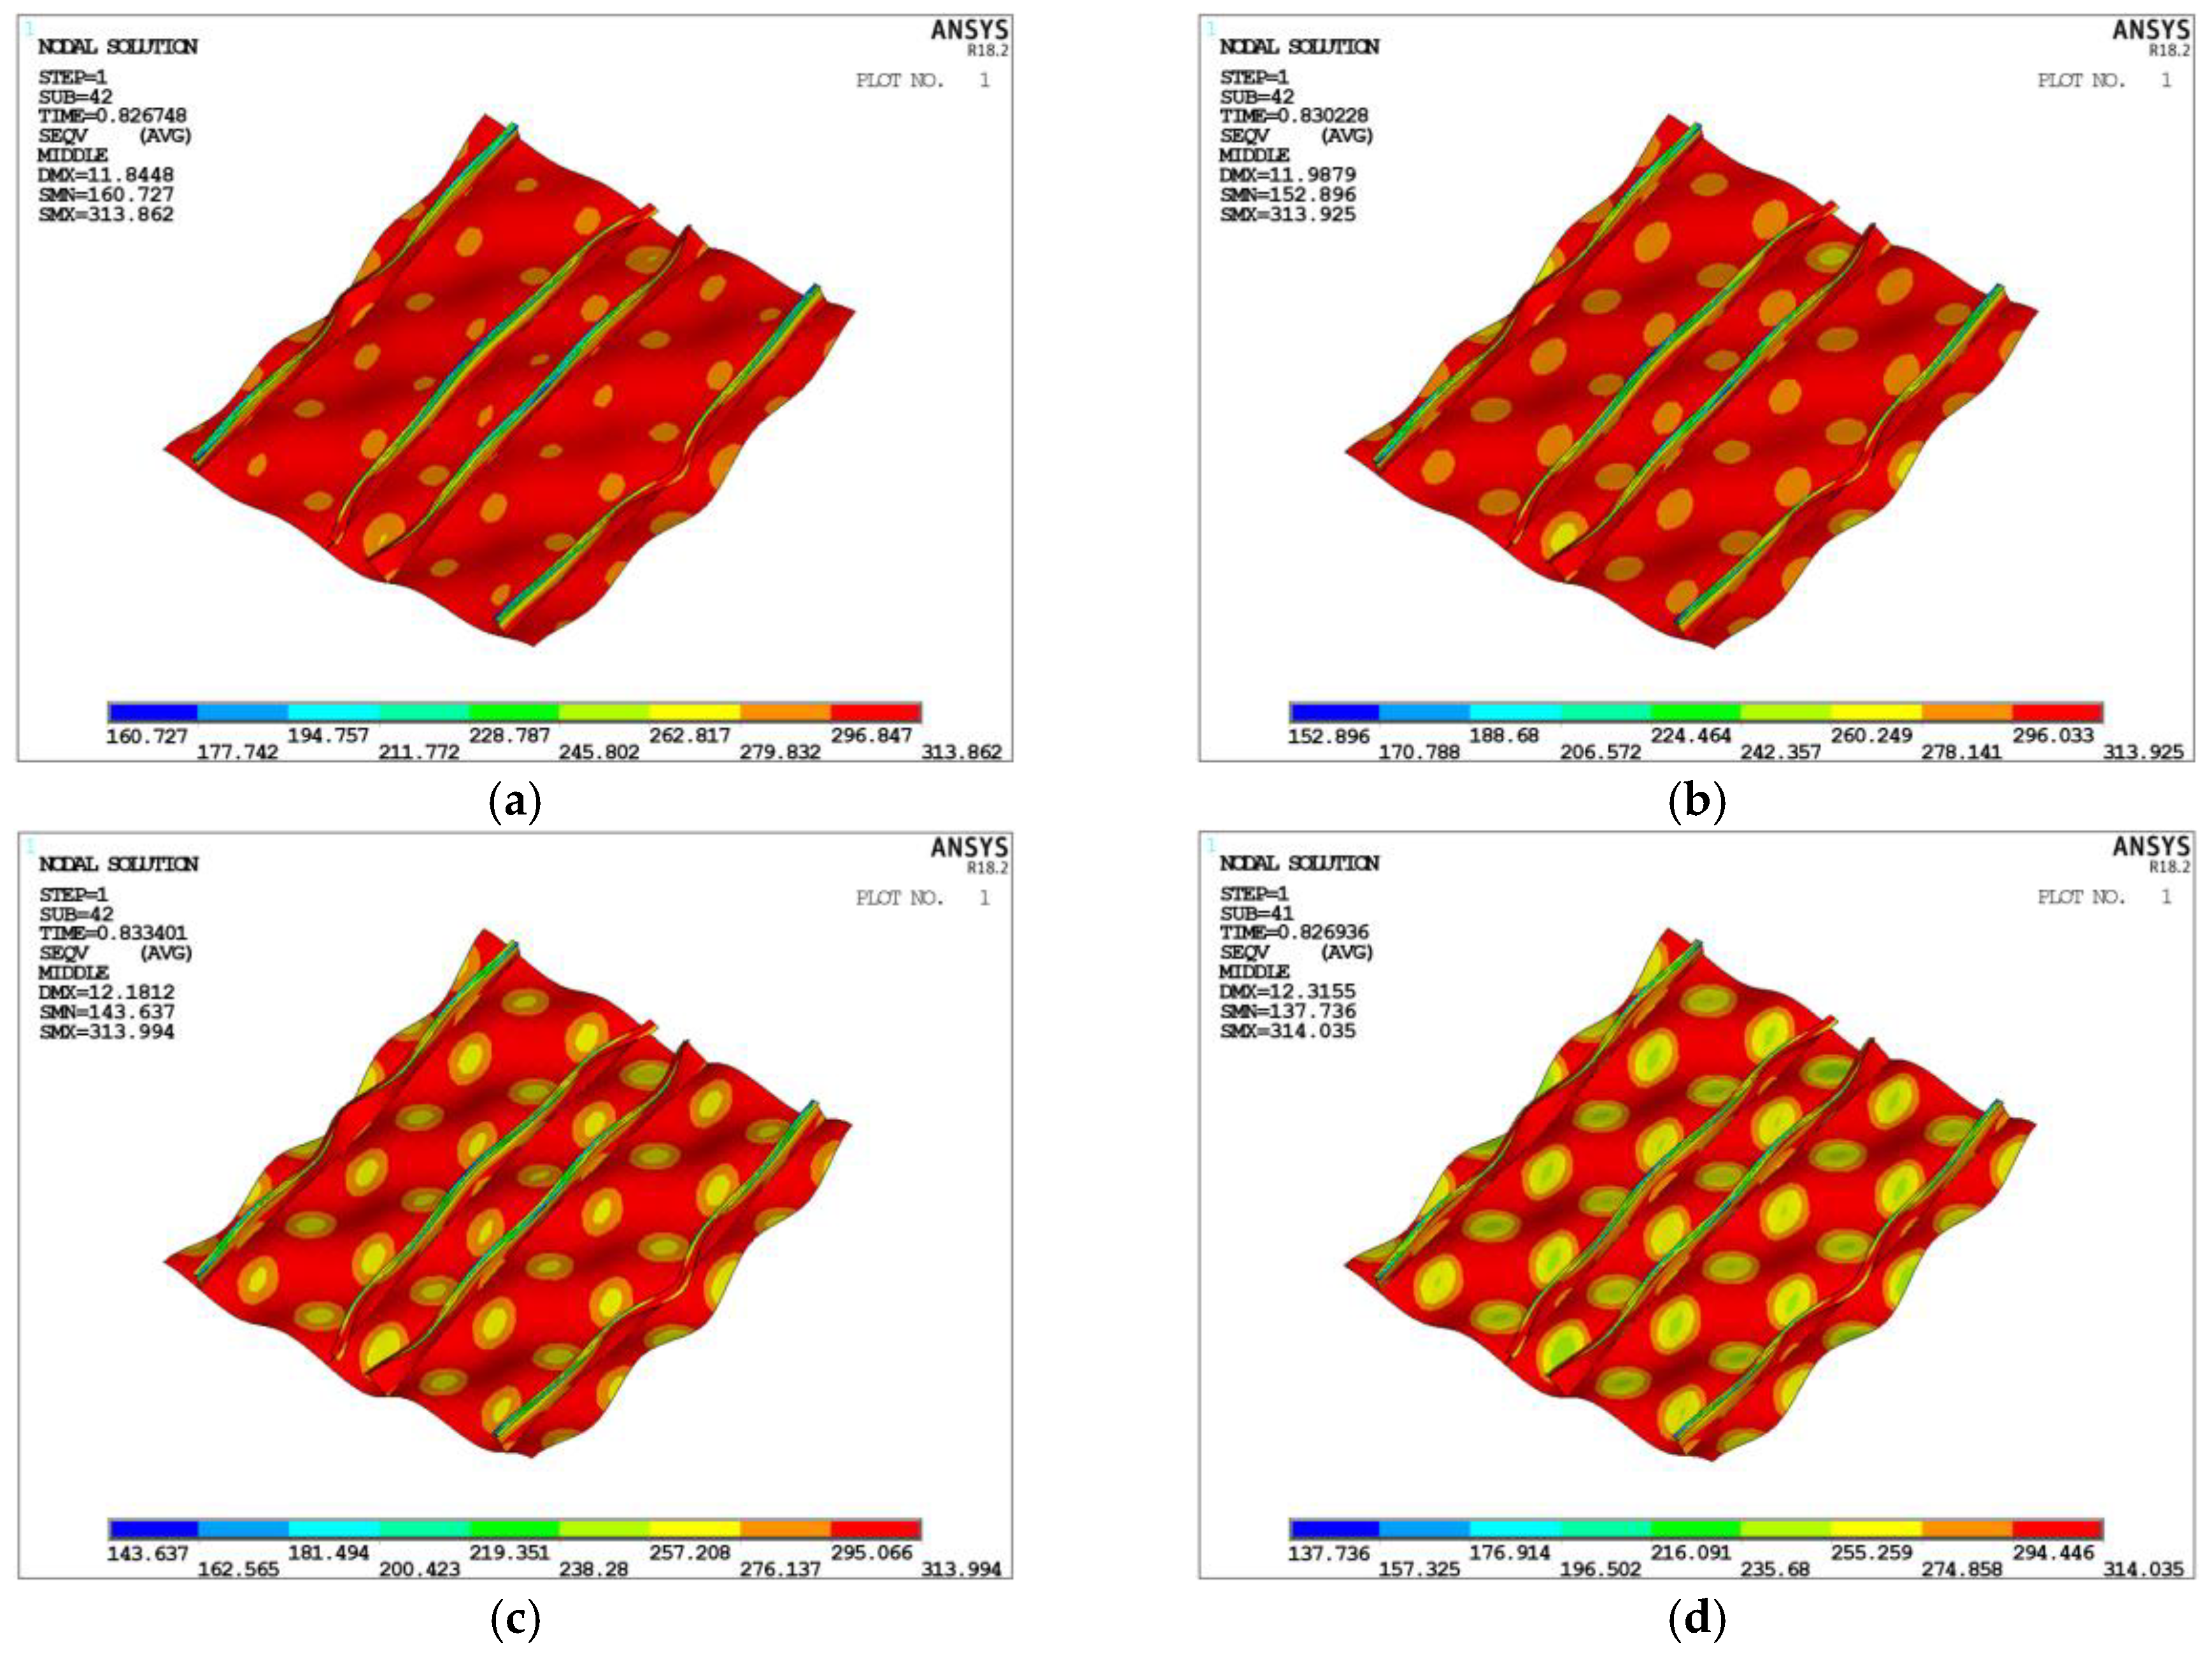
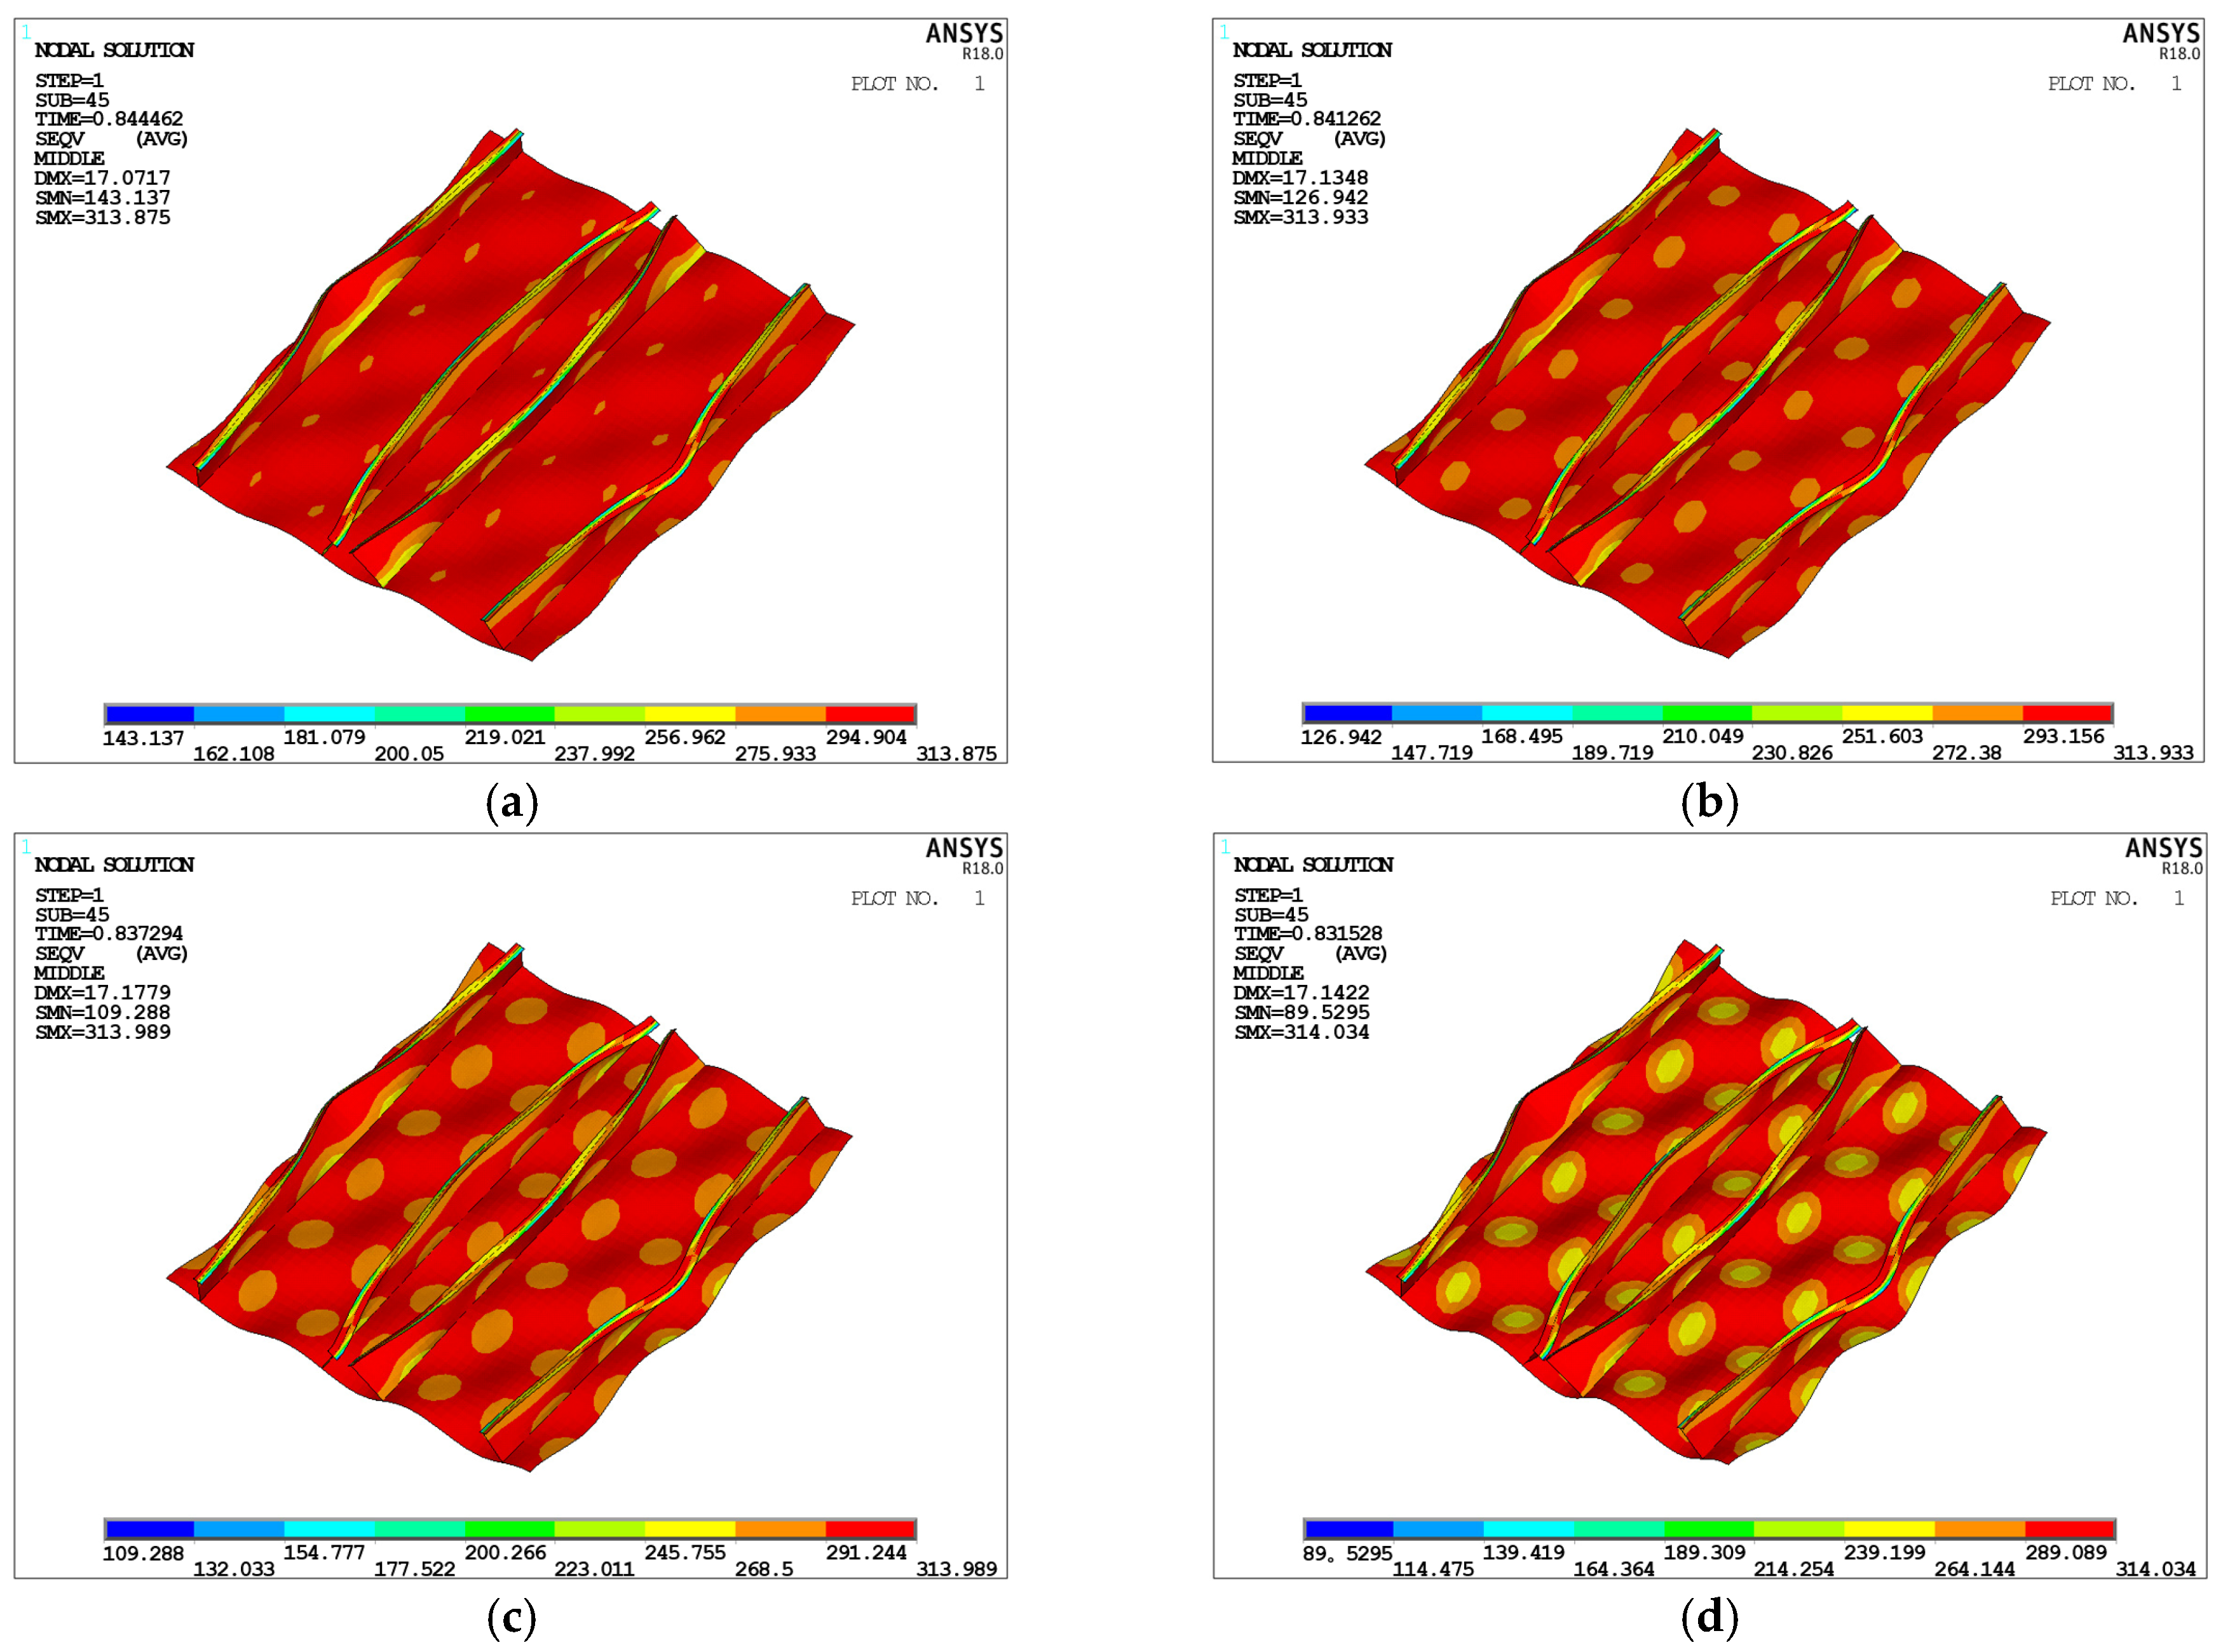
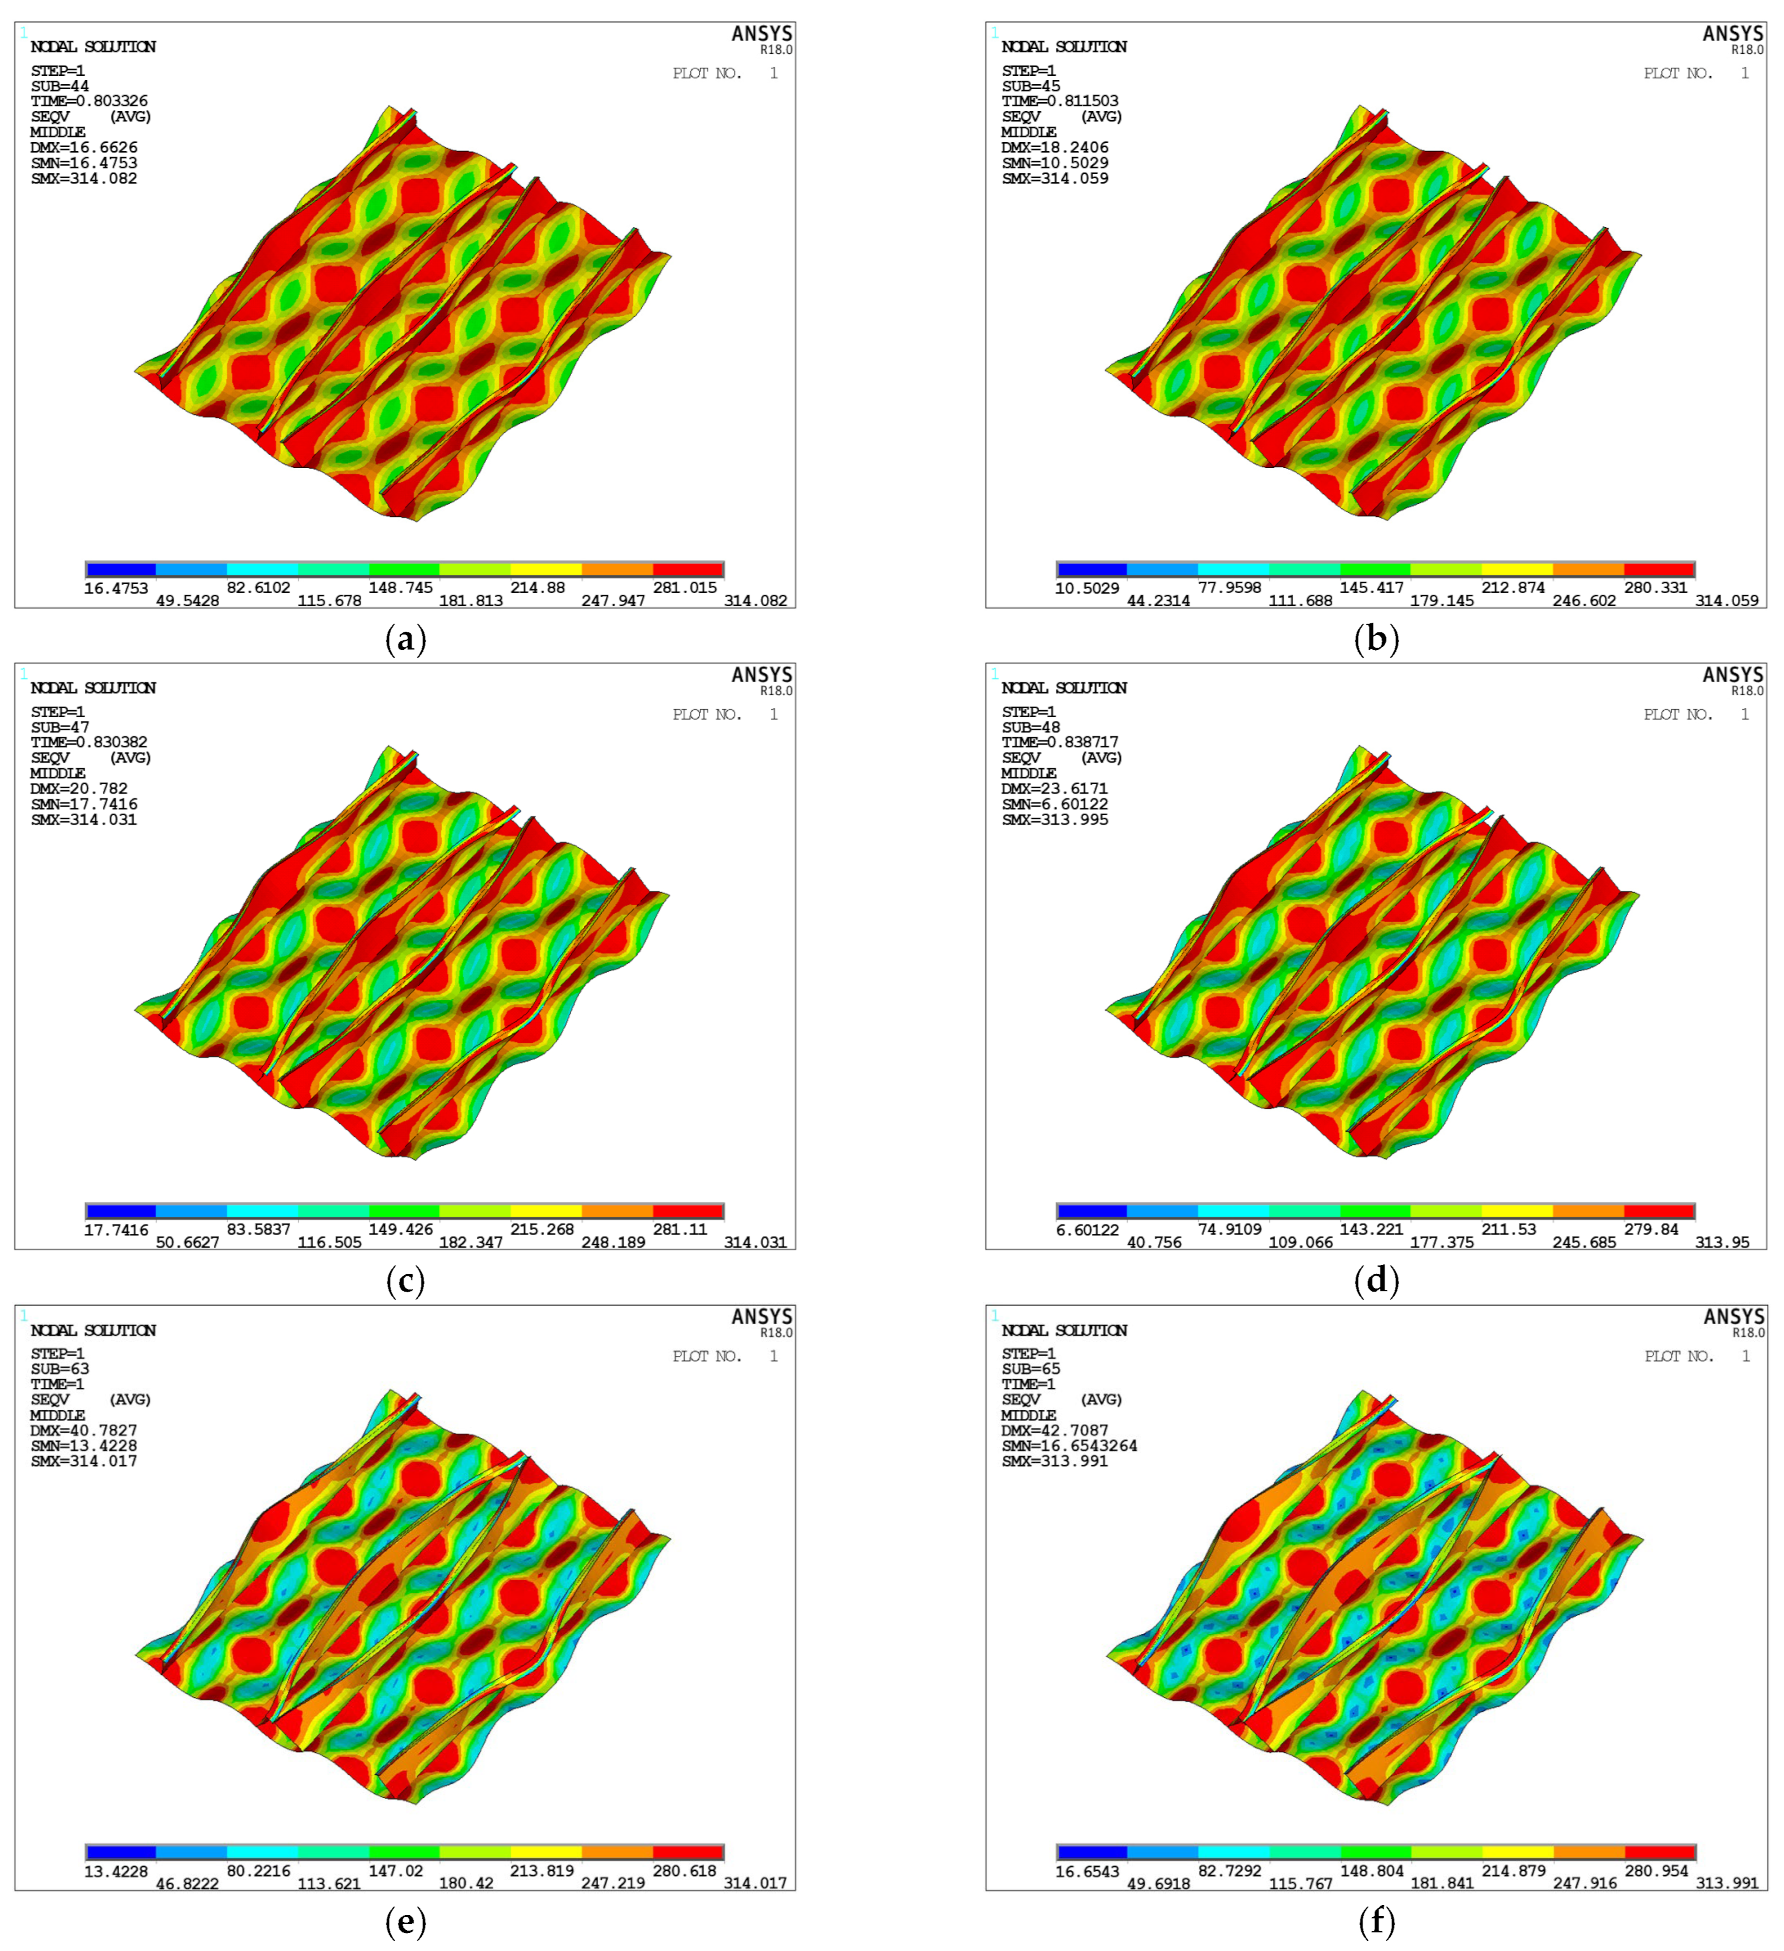
Figure 14, as the plating thickness decreases, the stress level of the stiffeners increases while that of the plating decreases, which means that the characteristics of the beam–column buckling are weakened and stiffener tripping gradually plays a major role. As shown in
Figure 15, when the thickness of the plating is 17.5 mm, the stiffener has a high stress and obvious transverse displacement, which is very consistent with the characteristics of stiffener tripping. With the reduction in plating thickness, the stress of the stiffener gradually decreases, and the high-stress region becomes periodic and concentrates at the corners of plating between stiffeners, which means that the failure mode changes from stiffener tripping to local plate buckling.
Combined with the trend of ultimate strength, mm can be regarded as the boundary between beam-column buckling and stiffener tripping, and mm as the boundary between stiffener tripping and local plate buckling.
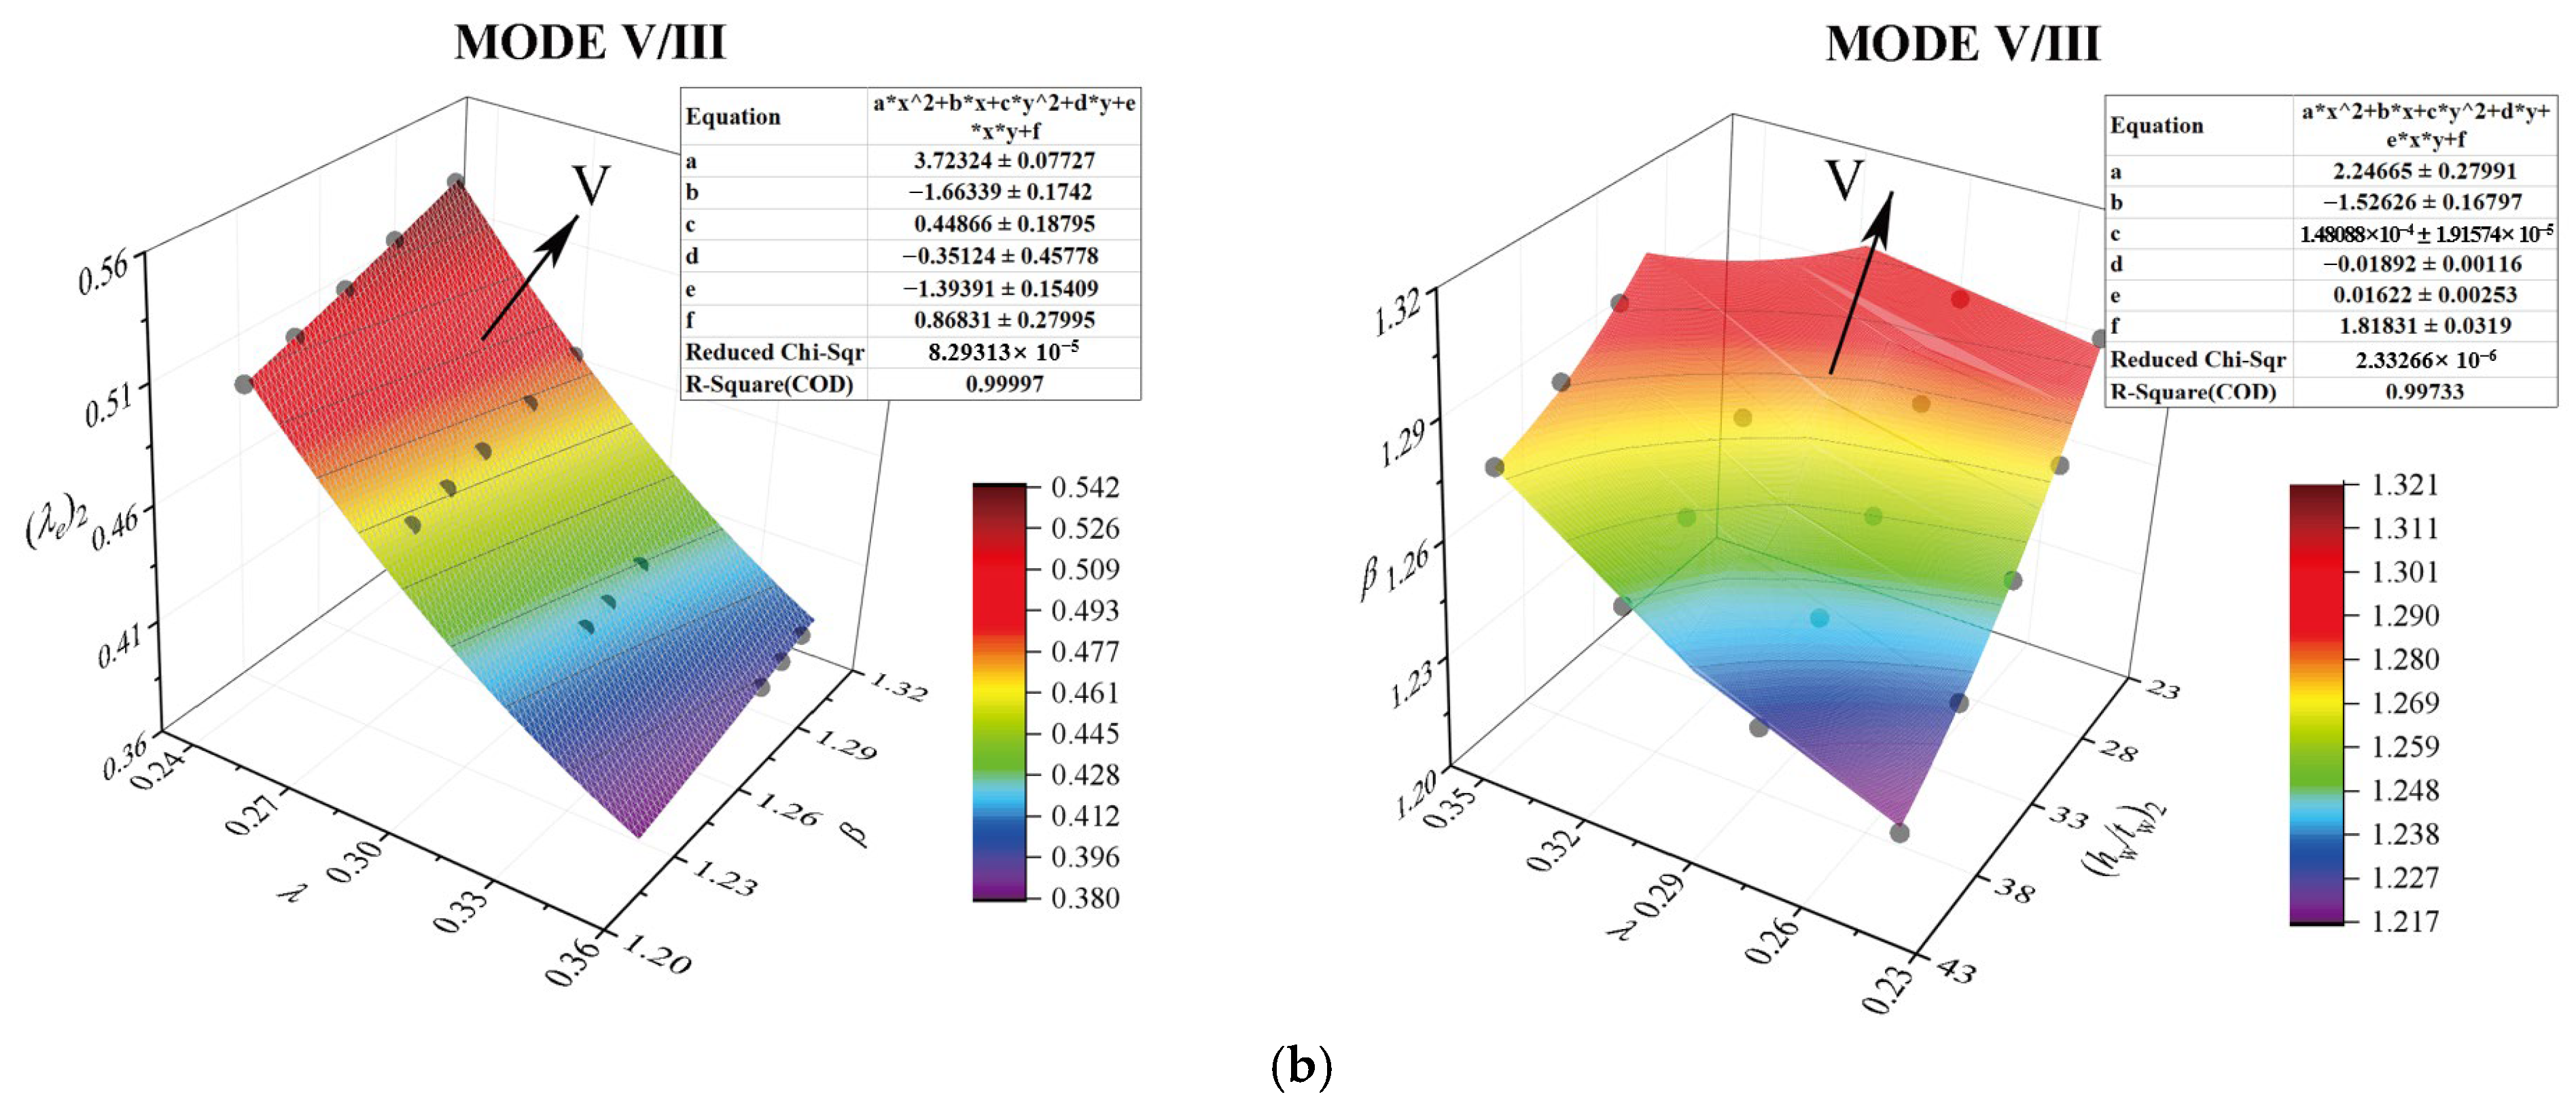
4.3. Boundaries of Local Plate Buckling, Stiffener Tripping and Beam–Column Buckling
To carry out a statistical study on the boundary of the failure modes of local plate buckling, stiffener tripping, and beam–column buckling, a series of stiffener sizes (
Table 7) that meet the CSR requirements was set. The
and
values of each dataset are essentially equal.
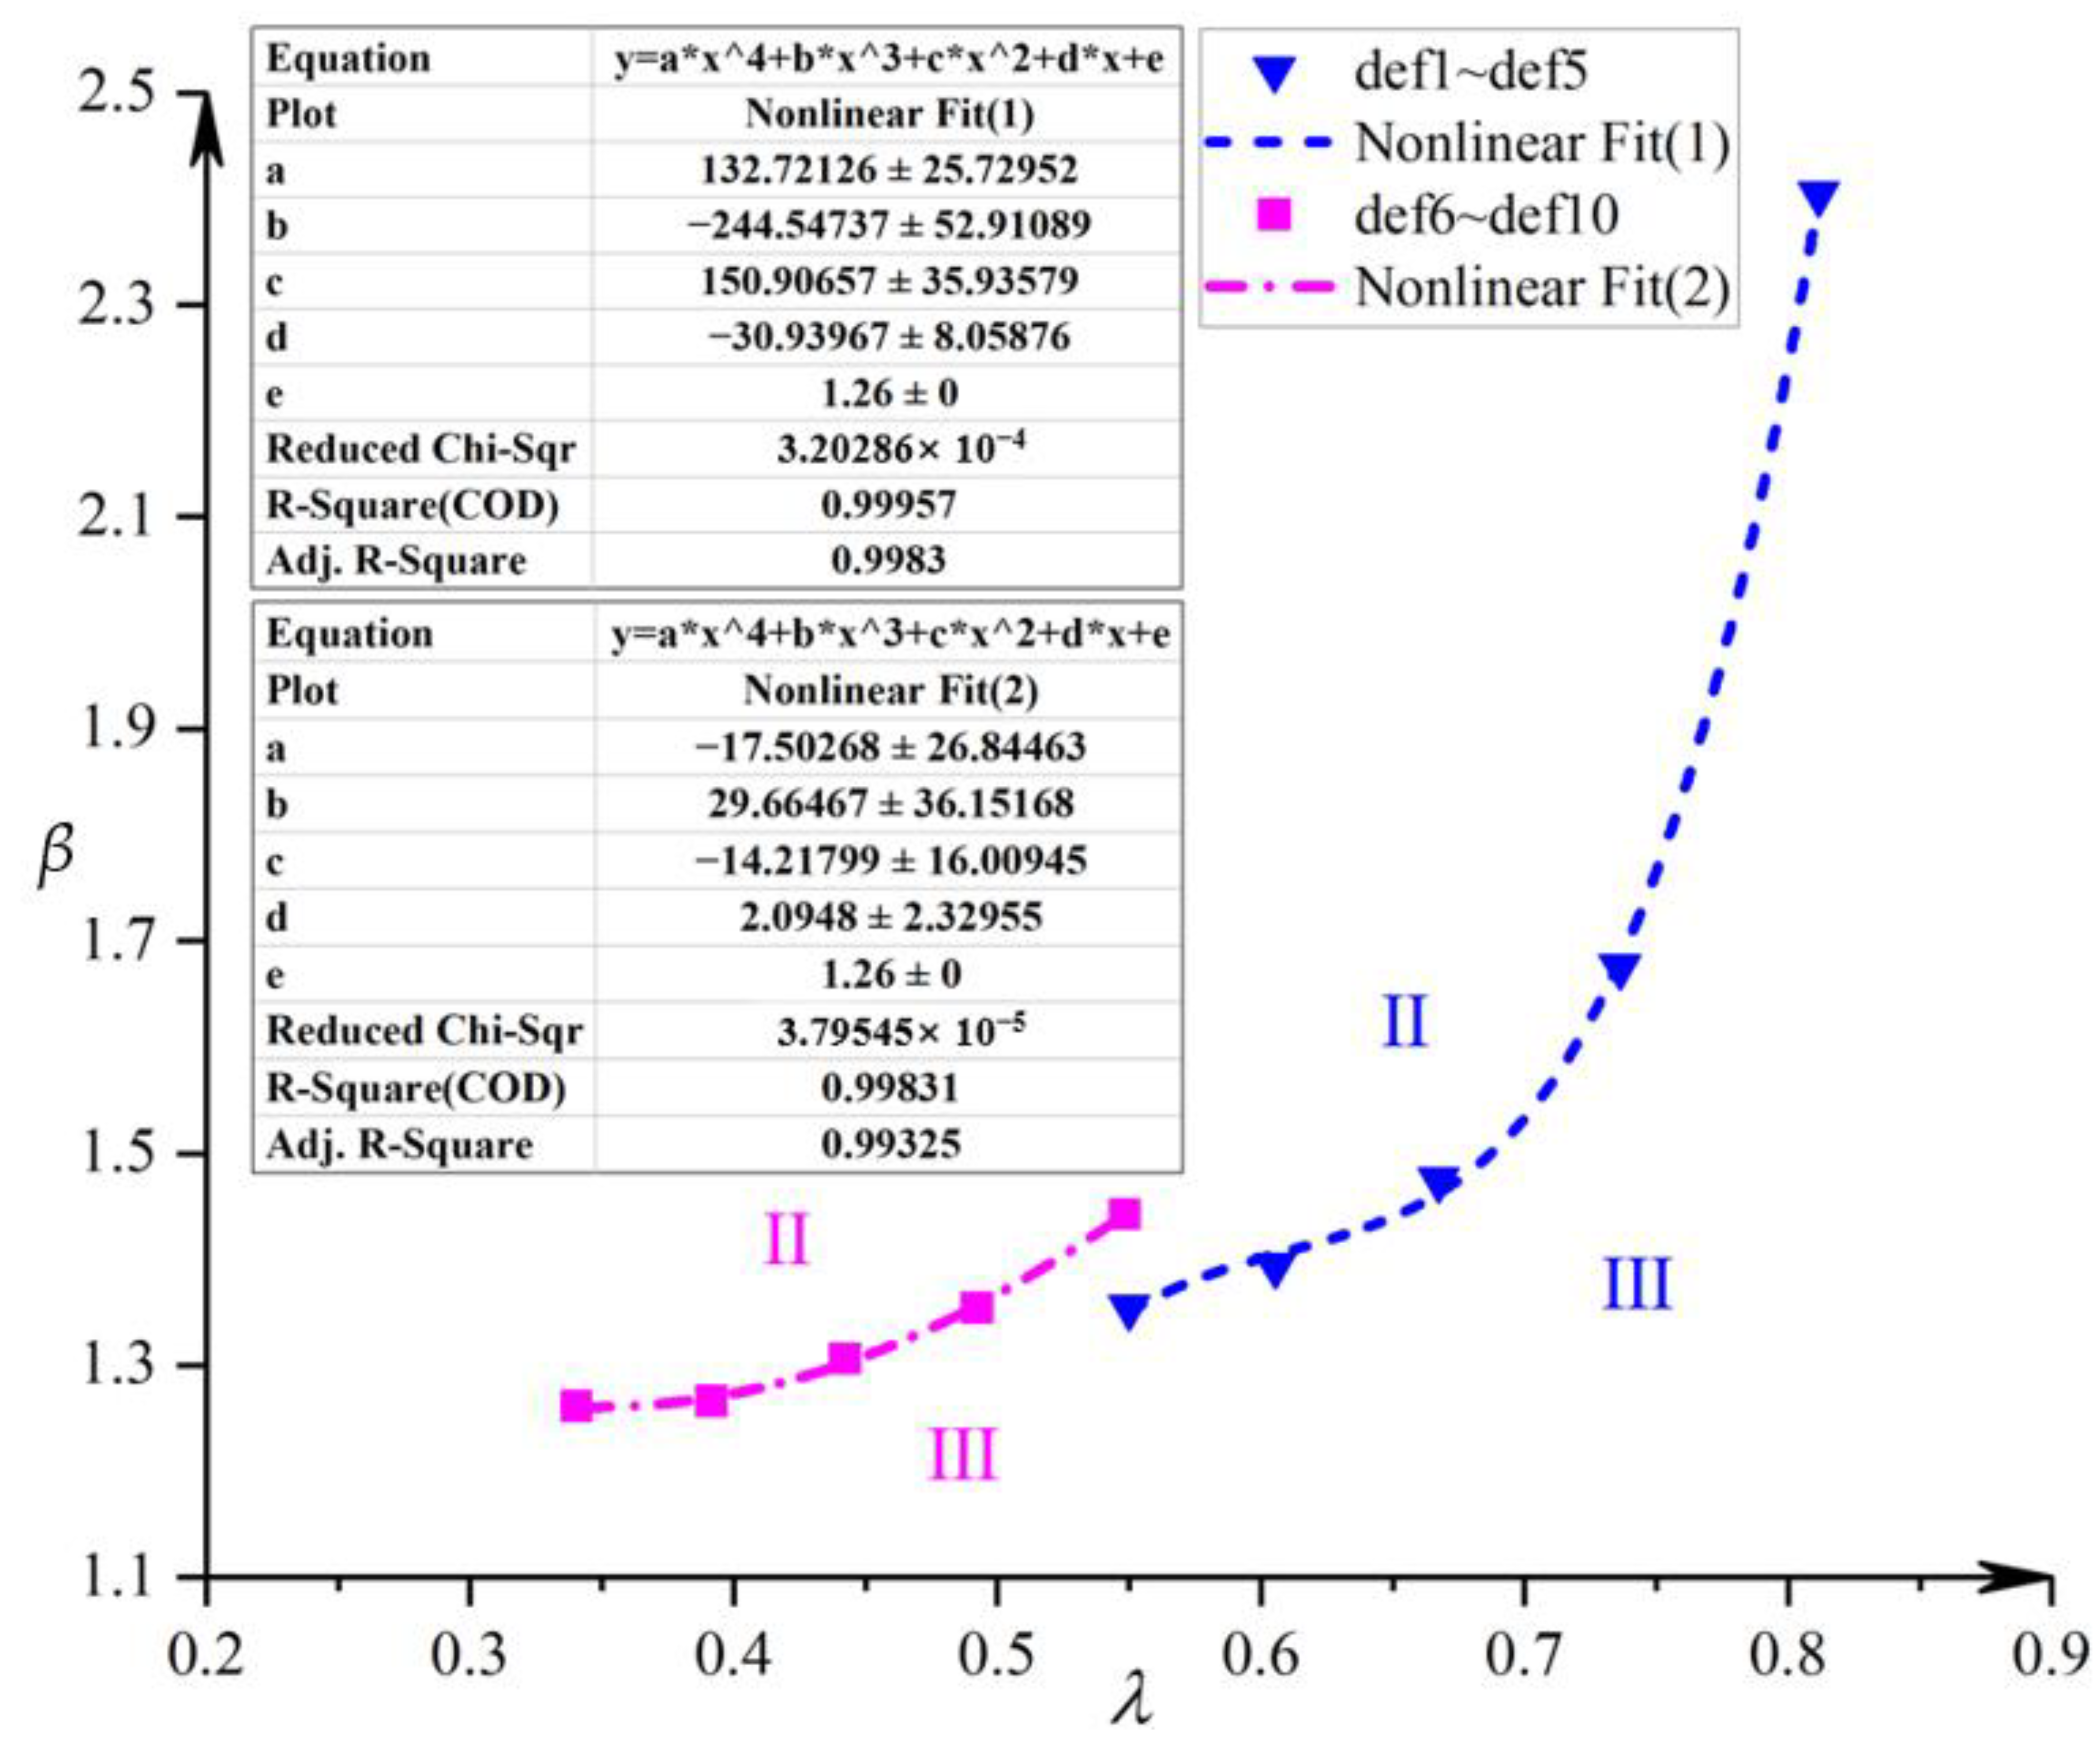
The ultimate strengths of stiffened panels with different combinations of plating and stiffener sizes were calculated. Three factors, the trend of the ultimate strength, the stress and deformation in the ultimate limit state, were combined to determine the failure mode and find the boundary of different failure modes. The critical points of the failure mode were determined with a certain accuracy (
mm), and nonlinear fitting was used to obtain the boundaries of the failure modes, as shown in
Figure 16.
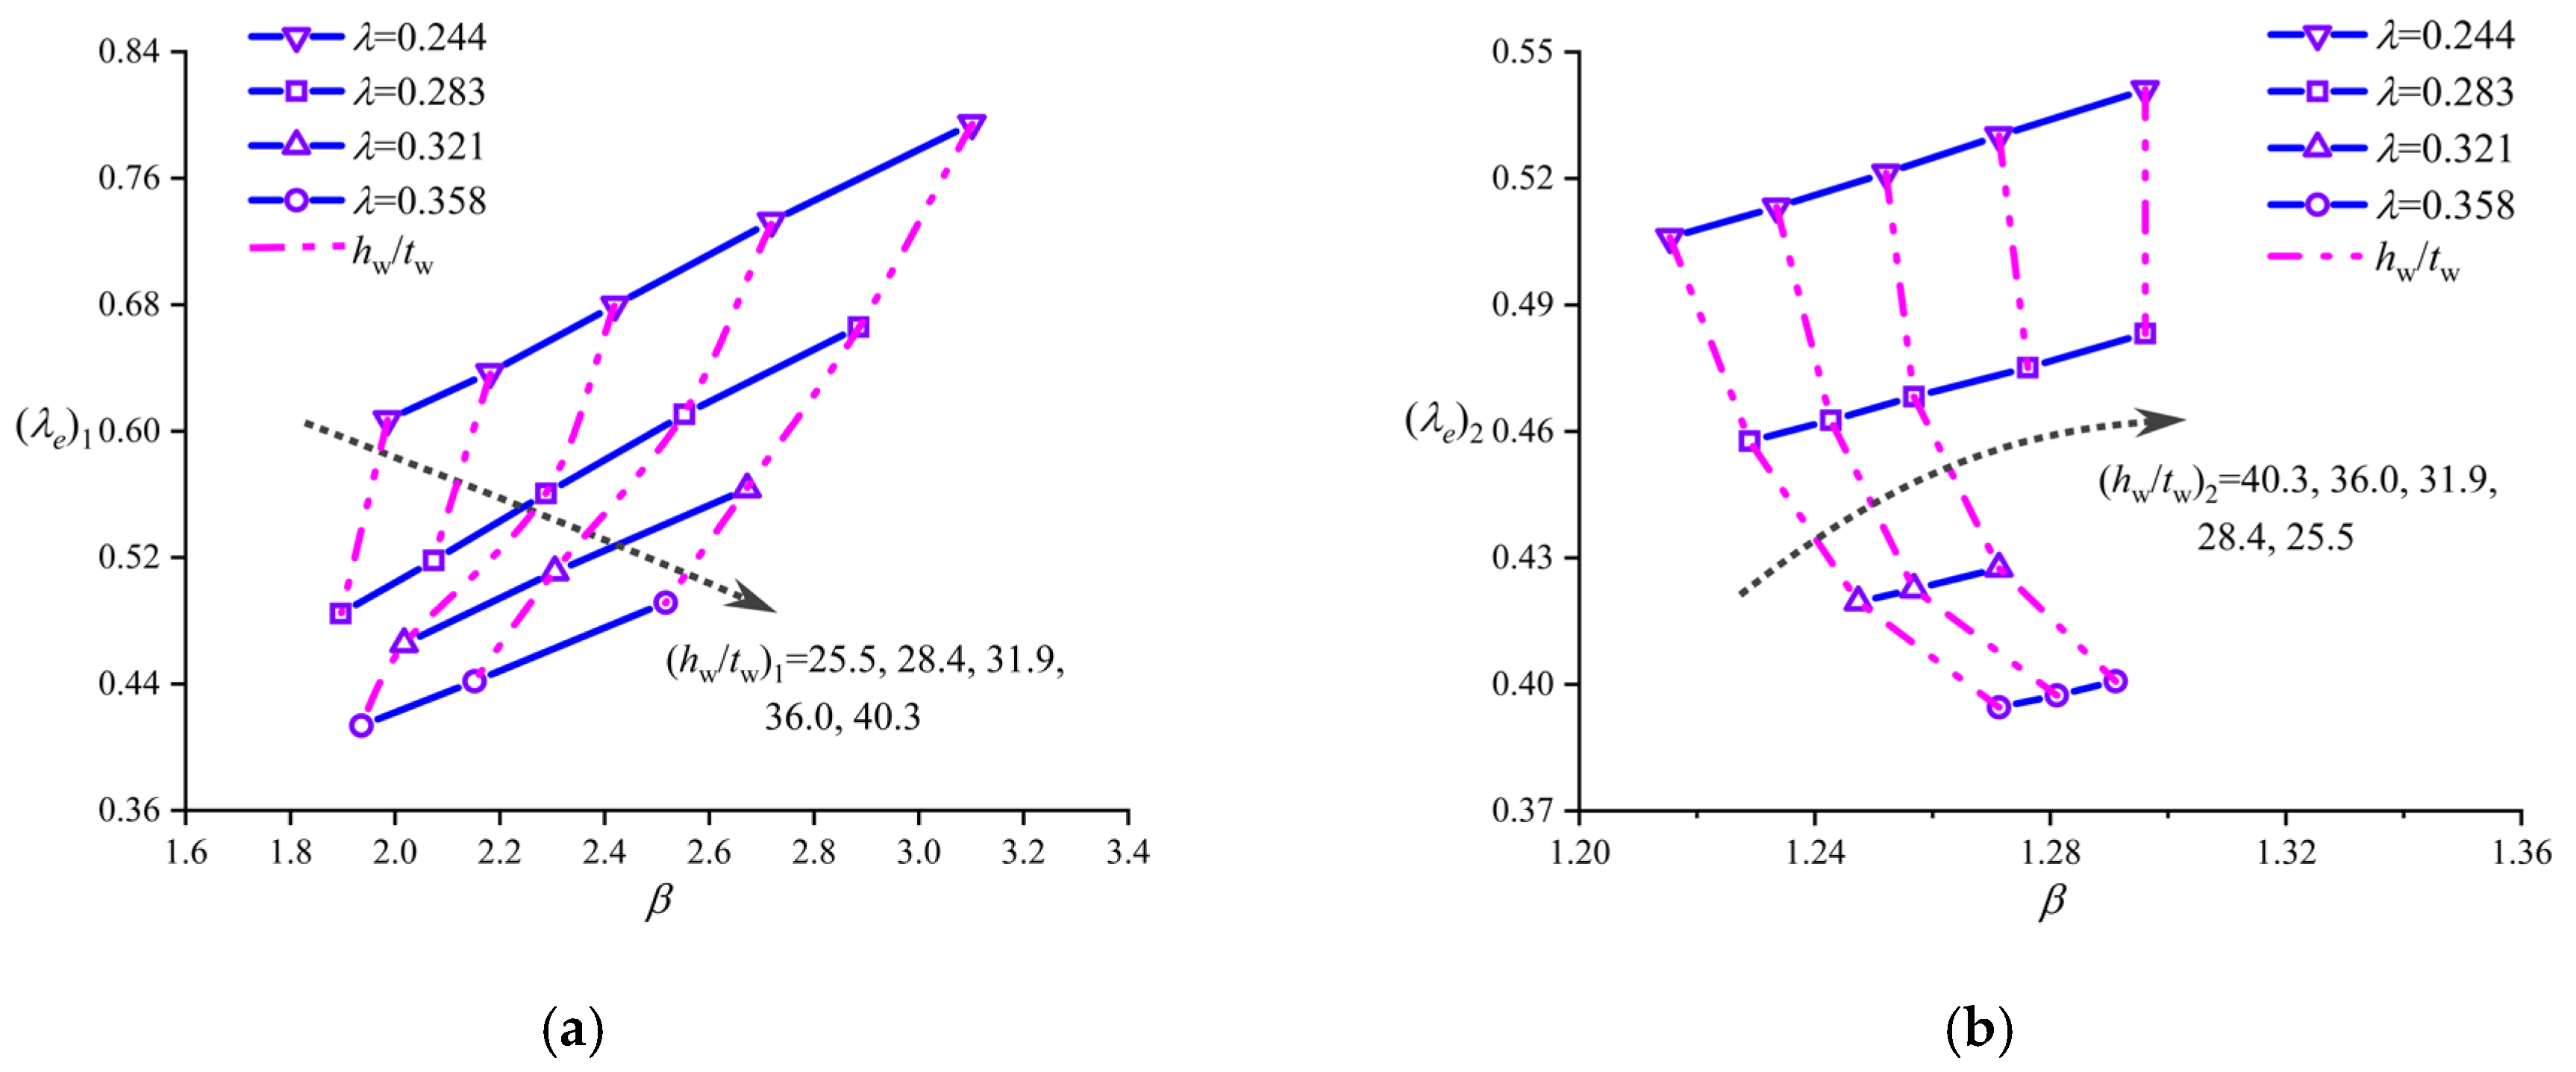
In this study, both and were used to evaluate stiffener tripping. It is believed that stiffener tripping only occurs when both and are greater than the critical value, and local plate buckling or beam–column buckling only occurs when both and are less than the critical value. From and , the coordinates of the critical point (, ) () can be determined. If &&, stiffener tripping occurs; if &&, local plate buckling or beam–column buckling occurs.
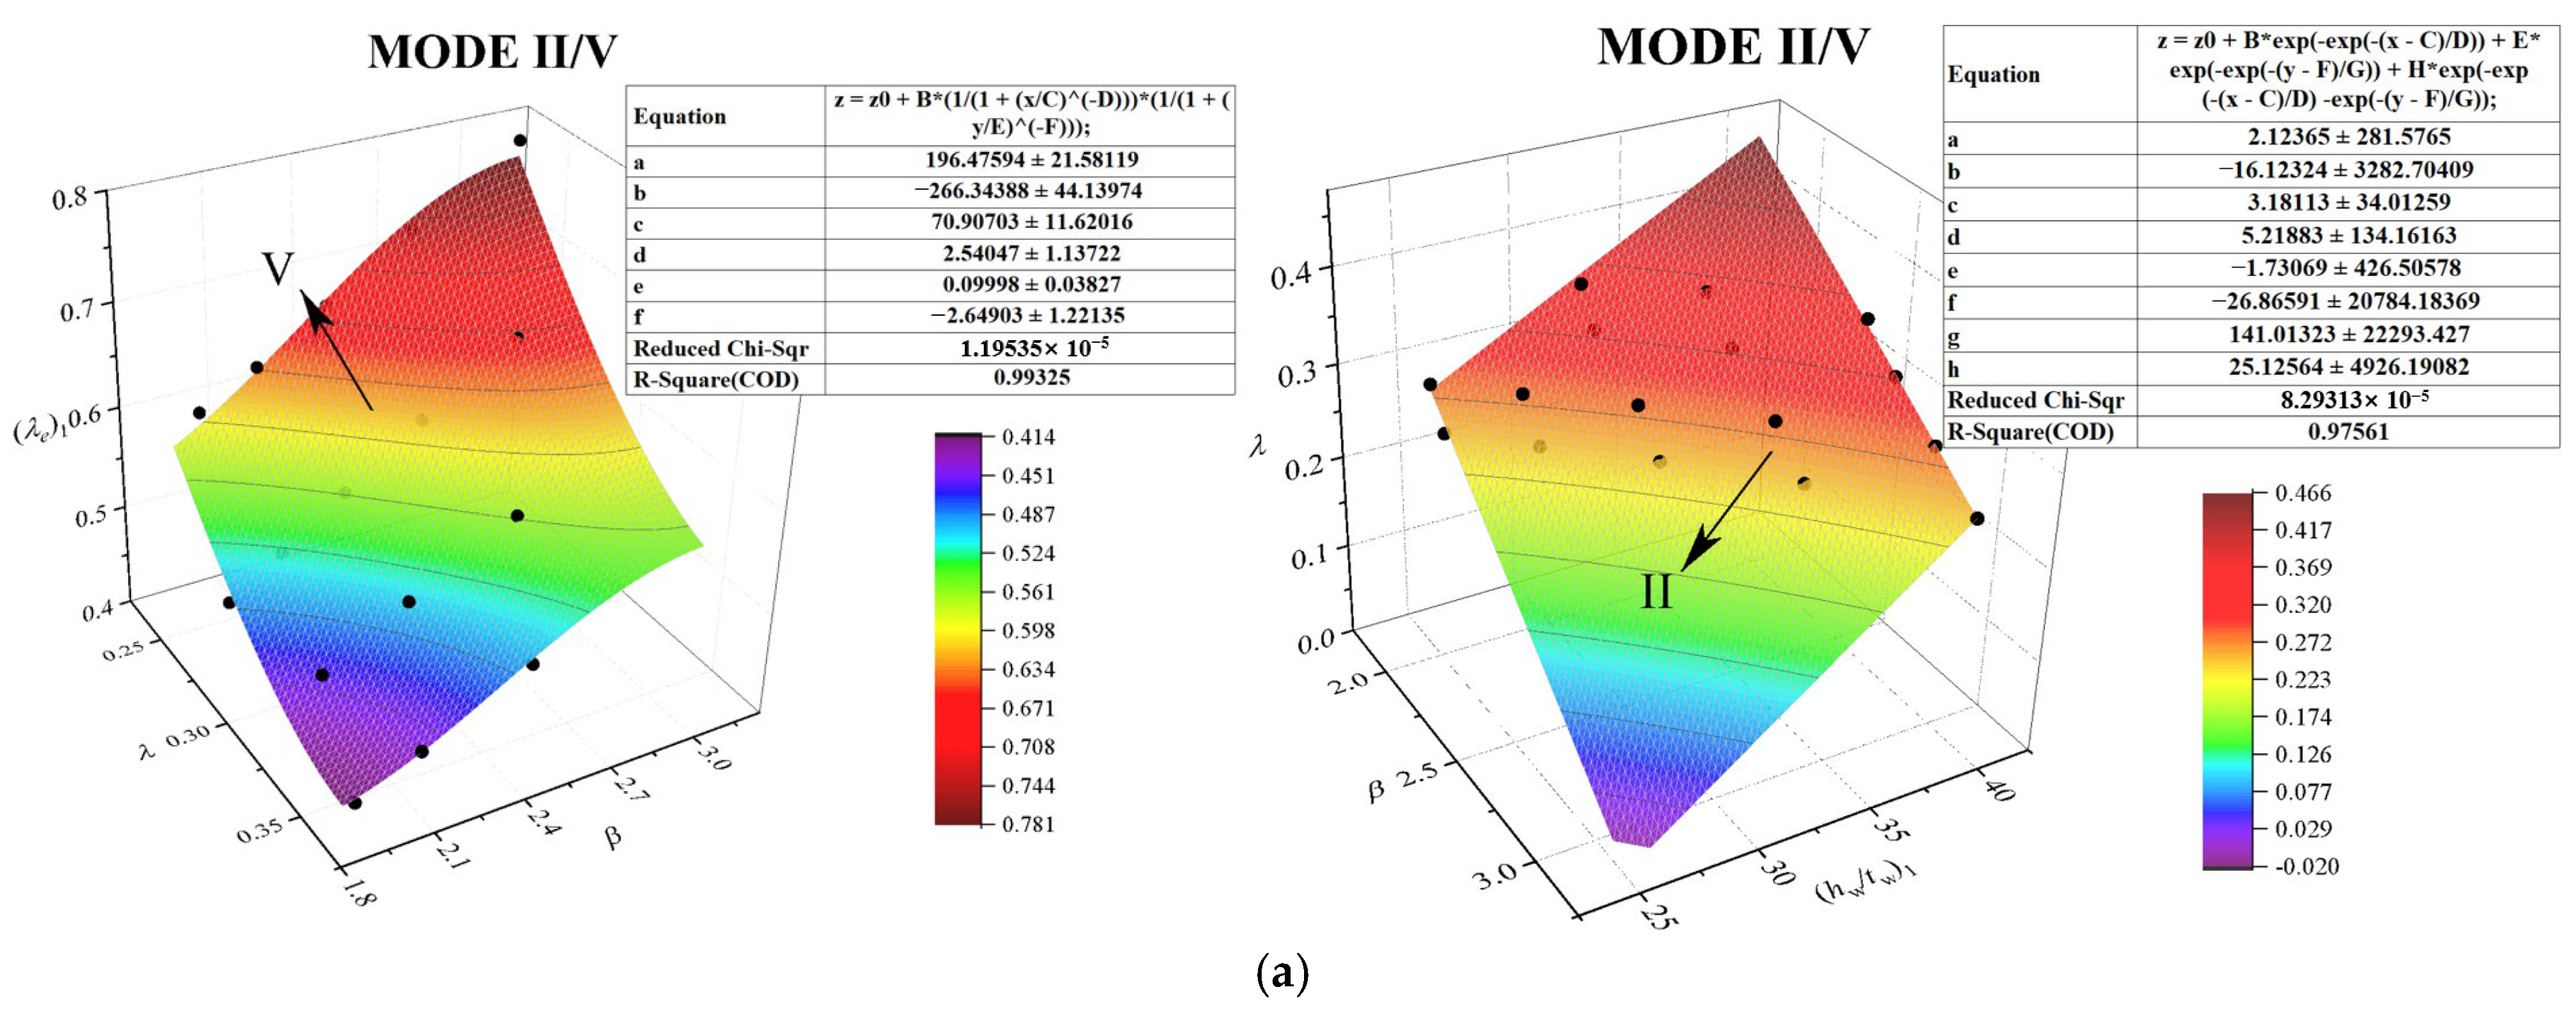
As shown in
Figure 17, when
is constant,
and
increase with increasing
, which is consistent with the relative relationship between local plate buckling and stiffener tripping. When
is constant,
decreases with increasing
, and
does not change much, which is consistent with the relative relationship between stiffener tripping and beam–column buckling. Increasing
or decreasing
is an effective measure to avoid stiffener tripping.
According to the critical points of the failure modes, the parameters were reasonably selected as dependent variables, and the functional relationships shown in Equations (6)–(8) were obtained through nonlinear fitting.
(6). Critical relationship between Mode II and Mode V:
(7). Critical relationship between Mode V and Mode III:
(8). Critical relationship between Mode II and Mode III:
Applicable range: , , , and .
First, , , and are calculated from the size of the stiffened panel, and then, and are used as benchmarks to obtain the critical values of and using the functional relationship. The identification method is as follows:
When &&: If &&, III is the main failure mode; if &&, II is the main failure mode; and if &&, V is the main failure mode.
When &&, V can be ignored: If &&, II is the main failure mode; if &&, III is the main failure mode.
In addition to the above cases, the result can be regarded as a mixed-mode result; that is, there are multiple failure modes, and the effects of these modes on the ultimate strength are similar. At this time, the coupling effect between modes is strong. Additionally, the margin coefficient can be set to modify the critical values, thereby dividing a certain range near the boundaries into a mixed mode.
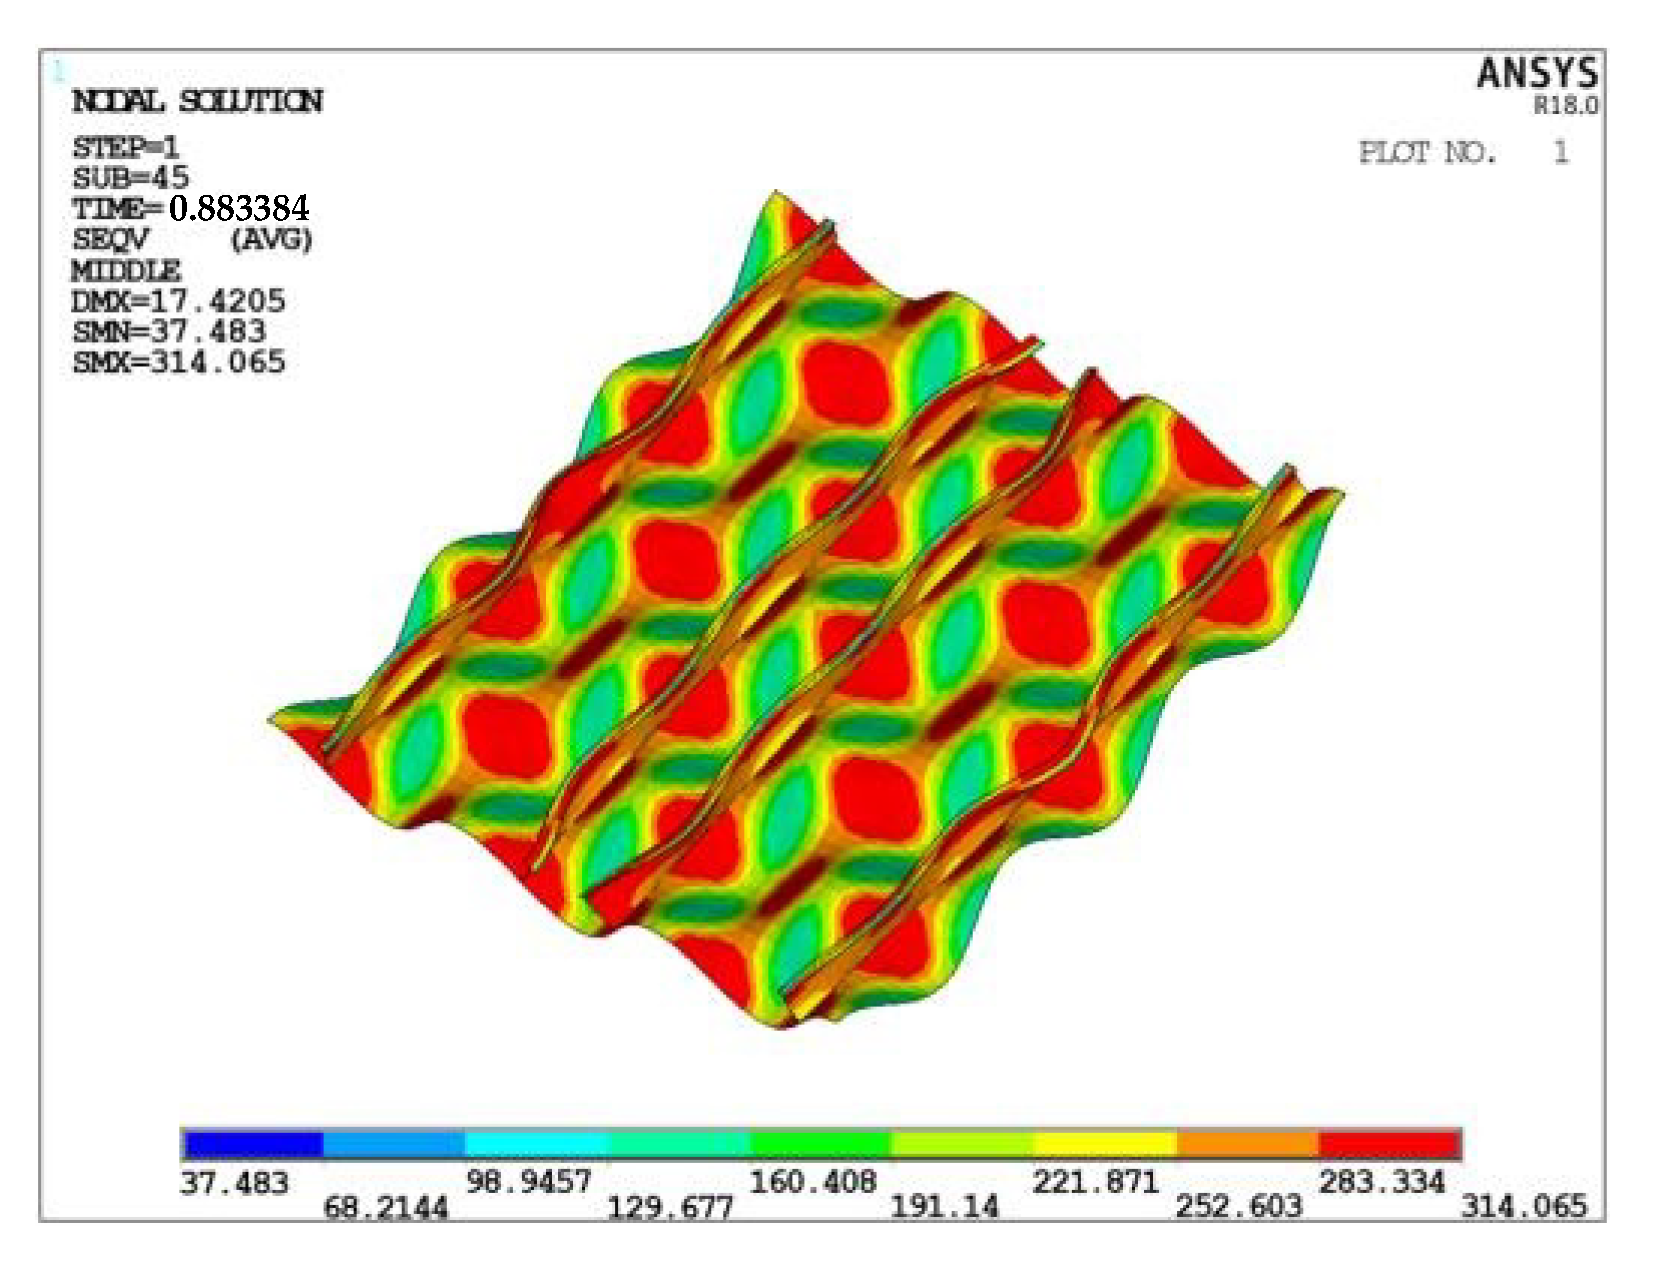
Take the stiffened panel with mm and stiffener of size 2 as an example; the values of and are 83.68 and 157.90, respectively, which satisfy . At the same time, the values of and are 0.86 and 0.54, which satisfy . Stiffener tripping does not occur in the ultimate limit state and can be ignored. In this case, since the size of the stiffened panel can also meet the requirement that and , the failure mode of can be identified as the local plate buckling (mode II).
The distribution of stress and deformation shown in
Figure 18 implies that the failure mode of the stiffened panel is local plate buckling, as predicted, which means that the formula proposed in this paper can realize the prediction of the failure mode.
5. Ultimate Strength Evaluation Formula of Stiffened Panels Based on Different Failure Modes
Based on the elastic theory formulas of beam–column buckling, local plate buckling, stiffener web buckling and stiffener tripping and the introduction of a primary term considering plastic range modification, an ultimate strength evaluation in the form of a stiffened panel based on four mechanical parameters is proposed as follows:
where
is the ultimate strength of the stiffened panel and
,
,
, and
are undetermined coefficients.
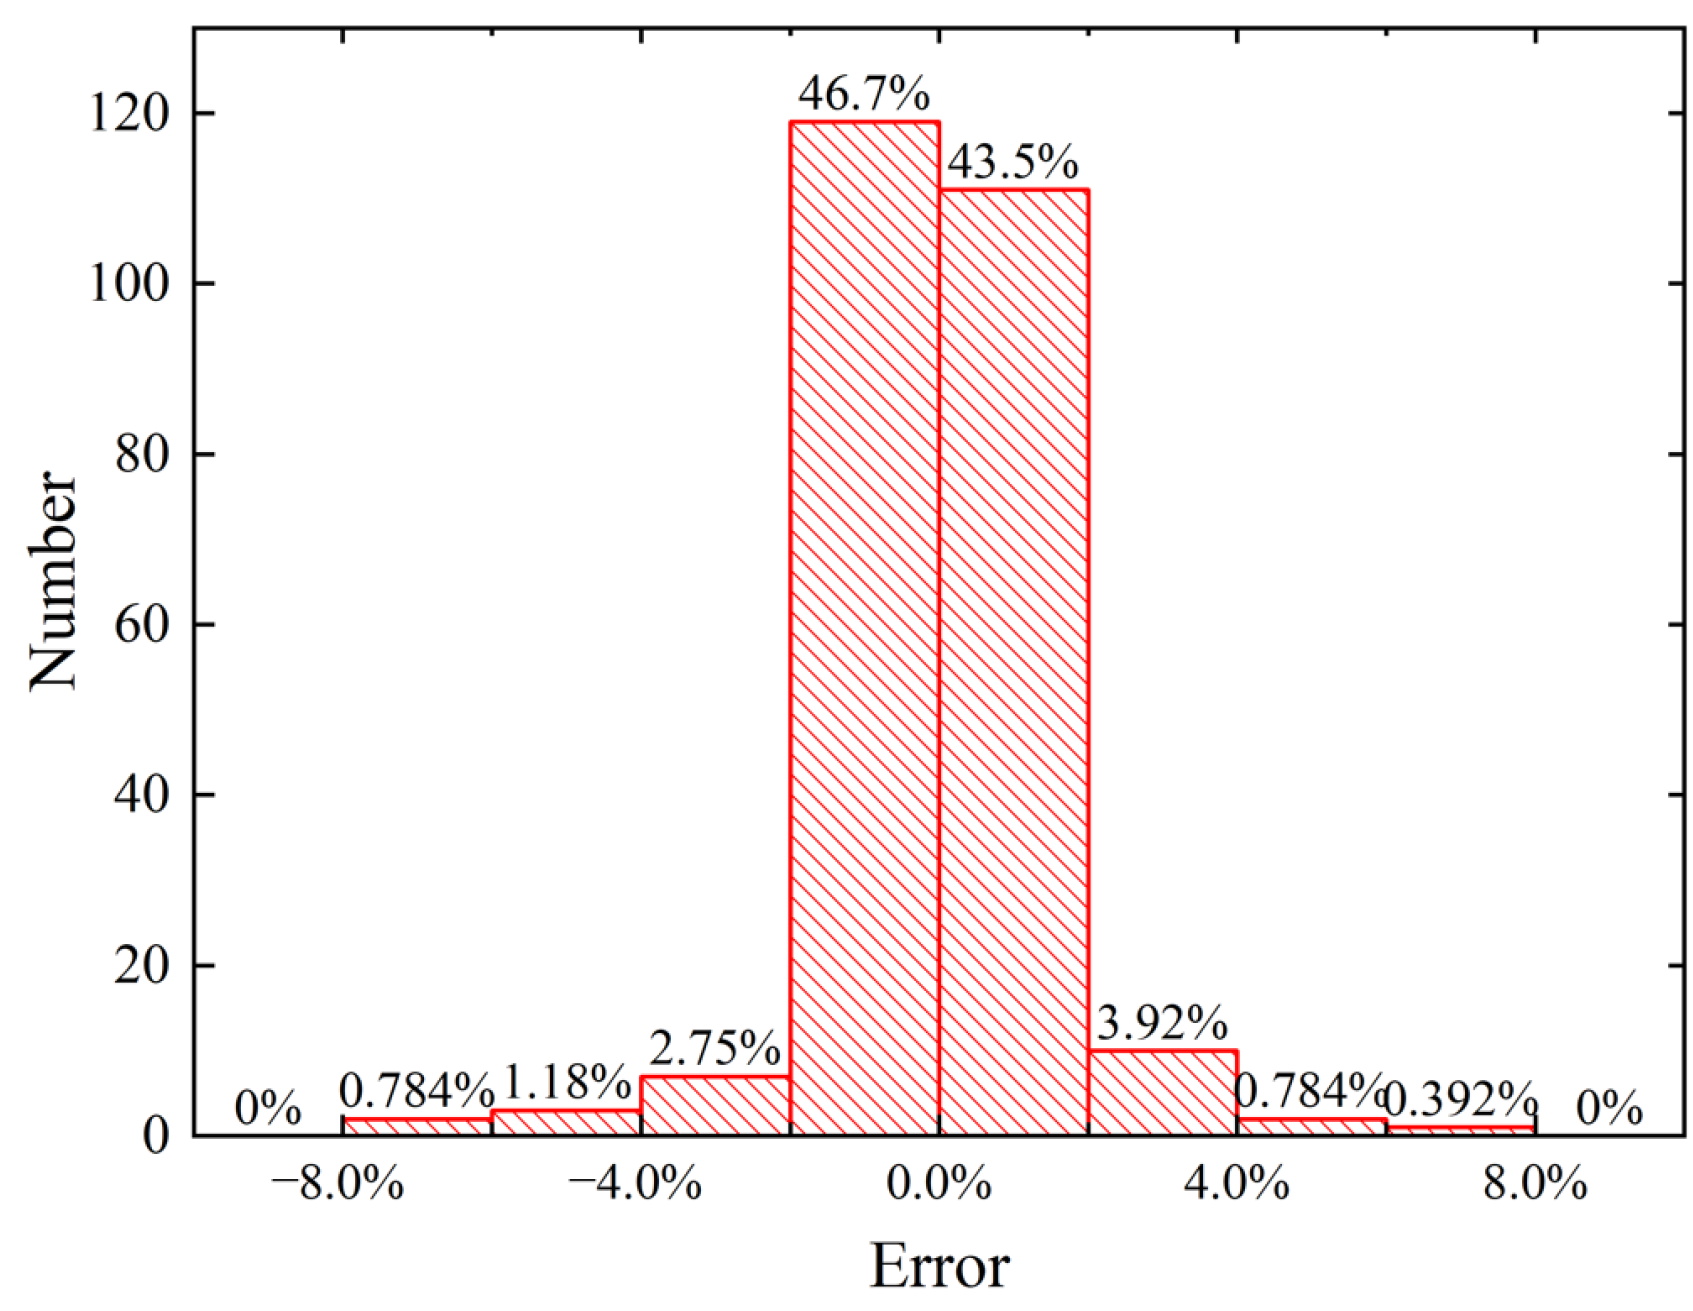
Using MATLAB to perform multivariate function fitting on the ultimate strength of 255 stiffened panels with different failure modes, the calculation formula is as follows:
Applicable range: , , , and .
The coefficient (
) of determination of Equation (10) is 0.94708, and the adjusted
is 0.94198. Statistics on the error ((formula value—finite element value)/finite element value) were obtained, as shown in
Figure 19. The error of more than 90% of the data is within
, a few results are outside
, the fitting effect is good, and the accuracy of Equation (10) is high.
As shown in
Table 8, Equation (10) is compared with the evaluation effect determined by Paik [
1] and Zhang [
4]. Since the parameters in Paik and Zhang’s formulas only contain
and
, they cannot accurately reflect the effect of stiffener failure. For example, when
or
mm, the ultimate strength is slightly reduced after the stiffener is changed from size 3 to size 4. This is because the effect of increasing
(causing a decrease in the ultimate strength) exceeds the effect of decreasing
(causing an increase in the ultimate strength).
6. Conclusions
In this study, through nonlinear finite element analysis, an identification method based on four mechanical parameters is established for common failure modes of stiffened panels, and an ultimate strength evaluation formula suitable for different failure modes is proposed. The conclusions are as follows:
(1) Assuming no stiffener tripping, decreasing and increasing are beneficial to preventing local plate buckling and changing the mode to beam–column buckling. The nonlinear critical curves show that the general form, such as , struggles to effectively evaluate the failure modes of stiffened panels.
(2) The evolution laws and the relationships of the three failure modes, local plate buckling, stiffener tripping and beam–column buckling, are studied. Increasing and decreasing are beneficial to preventing stiffener tripping. At the same time, the critical function formulas of the three failure modes are fitted for the evaluation of the failure modes.
(3) Based on a large amount of calculation data, a refined formulation of stiffened panels with four parameters is proposed. and are added to the formula to reflect the influence of stiffener tripping. The results can provide a reference for the subsequent study of the failure modes of stiffened plates. A comparison with Paik and Zhang shows that the formulation in this paper has a reasonable form and good precision.
However, it may be too ideal to determine the failure mode by considering the variation trend of the ultimate strength and stress distribution in the ultimate limit state. In subsequent work, more accurate methods for determining failure modes need to be developed, which could improve the accuracy of critical function formulas and ultimate strength.


