Article

Reliability Analysis of the Deep-Sea Horizontal Clamp Connector Based on Multi-Source Information from an Engineering Background

College of Mechanical and Electrical Engineering, Harbin Engineering University, No. 145 Nantong Street, Nangang District, Harbin 150001, China
*
Author to whom correspondence should be addressed.
J. Mar. Sci. Eng. 2023, 11(5), 986; https://doi.org/10.3390/jmse11050986
Submission received: 8 April 2023 / Revised: 26 April 2023 / Accepted: 4 May 2023 / Published: 6 May 2023
(This article belongs to the Special Issue Safety and Reliability of Offshore Energy Facilities)

Abstract

:
As a key piece of equipment in underwater production system, a reliability study of deep-sea connectors has important theoretical significance and engineering value for increasing fault-free operation time, improving engineering safety, and reducing maintenance costs. However, the diverse failure modes of connectors and the lack of high-quality and credible reliability data can lead to biased analysis outcomes. To tackle this problem, this study aims to establish a reliability model for deep-sea horizontal clamp connectors. Based on the actual engineering background, a fault tree model for deep-sea horizontal clamp connectors is developed, and the distribution types of bottom events are analyzed concerning the failure mechanism. To enhance the model’s credibility, a multi-source information approach is employed, combining prior product information, expert experience, and design information to quantitatively solve the reliability probability of the connector. The expert experience is quantified using the fuzzy quantitative analysis method, while the design information is estimated by developing a corrosion prediction model combined with grey theory. Thus, the reliability assessment of deep-sea horizontal clamp connectors is completed. Factory Acceptance Test (FAT) is performed on the improved connectors, and the closed-loop work of reliability analysis is completed.

1. Introduction

At present, offshore oil and gas exploration continues to be more challenging than onshore exploration due to various technical difficulties, such as an unclear understanding of underground oil reserves, installation complications of underwater production equipment, and difficulties in sealing the transportation process of oil and gas [1,2]. As a vital instrument in deep-sea oil exploration, deep-sea connectors are frequently utilized along with jumpers to establish pipeline connections between equipment, connecting various underwater production system devices, and transmitting oil, gas, and other energy sources such as deep-sea hydrate and sediment mixtures [3,4]. These technical challenges create significant obstacles to underwater oil and gas exploration which, if not addressed effectively, can lead to substantial economic losses and irreparable environmental damage, as seen in incidents such as the massive oil spill in the Gulf of Mexico in 2010 [5], the oil spill accident in the Bohai Sea about 38 nautical miles away from the coast of China in 2011 [6], and the oil spill incident in California in 2021 [7]. The concept of “reliability engineering” was introduced to reduce the failure rate of engineering accidents, and risk assessment of production equipment in marine oil and gas development can effectively decrease accidents in marine production [8,9].
During the installation stage of deep-sea connectors, the failure rate is relatively high due to underwater operations. During the service stage, the connectors are often exposed to high-temperature and high-pressure environments, which can also affect the performance of the sealing structure. Banaszek, Andrzej [10] has confirmed that thermal stress can cause failure of hydraulic systems and pipeline rupture, while corrosion can accelerate the strength degradation of pipelines [11]. To improve the reliability of subsea connectors, scholars have conducted a large amount of research and improvement: Kim, Sunghee [12] used Markov methods to study the reliability of subsea spray preventers and analyzed the sensitivity of connectors and control systems to them. Yun Feihong [13] established a mathematical model of contact stress for connector sealing structure based on Hertz contact theory and verified the relationship between sealing ring structure parameters and pre-load. Zhang, Kang [14] addressed the problem of a lack of risk factor data for claw connectors and analyzed the risk of installation failure events of claw connectors using the risk matrix method. Ifelebuegu, Augustine O [15] improved the operational risk of a subsea gas compression system by combining Layer of Protection Analysis (LOPA) with Bayesian methods. Zeng Wei [16] developed a VX gasket structure optimization method that considers random workloads to improve the sealing performance of connectors. Wang Yingying [17] proposed a reliability analysis method based on dynamic Bayesian networks combined with Monte Carlo methods to reduce the failure probability of the drive ring of deep-sea connectors. Duan Menglan [18] pointed out the shortcomings of the connector hub design method of the American Society of Mechanical Engineers (ASME) and developed a stress analysis method to improve the reliability of connectors. Wang Yingying [19] analyzed the expansion process of initial cracks to critical crack size in connectors and established a dynamic Bayesian network to determine the structural influence of multiple variable factors on failure probability.
The introduction of novel research and analysis methods has greatly facilitated the improvement of connector reliability. However, many of these studies only employ basic reliability methods to enhance the complex system of connectors, resulting in biases in the evaluation results due to a lack of consideration for the product reliability characteristic model and practical application [14,20]. The main obstacle to the reliability study of deep-sea horizontal clamp connectors is the lack of high-quality reference information, and reliability information needs to be collected from multiple sources to ensure unbiased and credible evaluation results. A single source is insufficient to guarantee the unbiasedness and credibility of the assessment without prior information, and multi-source, extensive, and mixed reliability information is necessary [21,22,23]. The sources of information include (but are not limited to) information on similar products, design information provided by designers, expert experience, and reliability tests conducted during the verification period. Objective prior product information is the most reliable in terms of information reliability, while subjective expert experience and design information need to be processed using reliability methods to qualitatively analyze the uncertainty of the information, but they can compensate for the lack of reliability information. Therefore, adopting a multi-source and mixed approach to the reliability analysis of connectors is beneficial for ensuring the credibility and impartiality of the reliability analysis results [24]. Currently, there are several works on modeling system reliability using limited failure statistical data. An, Jianqi [25] proposed a multi-source information fusion method based on reliability theory and the Kalman filter, which provided an effective solution for the control and monitoring of complex metallurgical processes. Peng, Chong [26] proposed a multi-source information fusion reliability model based on Bayesian inference for situations with small sample sizes, which removed the constraint of limited life failure data. Xu, Yingchun [27] used the Bayesian fusion method (BMM) to fuse multi-source life information from satellite systems and subsystems with a multi-level structure, fully integrating multiple sources of information to enhance the reliability model with more knowledge. Zhao, Qian [28] proposed a Bayesian method for estimating the remaining life of Weibull distribution components by fusing collected information, which determines the prior distribution using different types of information and obtains the posterior distribution by fusing the collected information. Salomon, Julian [29] provided an effective method for quantifying the reliability of complex systems when considering uncertainty spectra by combining structural reliability and system reliability. Xiang Jia [30] proposed a method of transmitting multi-source data first and then merging and integrating the data, which overcomes the limitation of setting combination weights in data integration and can be used for reliability analysis of complex systems.
Scholars have conducted extensive research on reliability modeling based on limited fault statistical data and multiple sources of data, breaking through the limitations of system reliability modeling using limited fault statistical data. This paper refers to the foundation of previous research and aims to increase the credibility of reliability modeling by supplementing the model’s information sources through the direction of increasing the acquisition paths of reliability data sources. In response to this, this article aims to analyze the reliability of deep-sea horizontal clamps connectors as the research objective. Starting from the practical engineering and physical background, a reliability model is established to evaluate the reliability of deep-sea horizontal clamps connectors. The following steps were taken:
(1)
An analysis of the subsystem composition and working principle of the connector was conducted, and a connector fault tree was established.
(2)
The distribution of failure bottom events was determined based on failure mechanisms, and information was collected from multiple sources to establish an accurate reliability model.
(3)
FAT was conducted on the connector.

2. Reliability Analysis Method for Deep-Sea Horizontal Clamp Connectors

The reliability analysis process for deep-sea horizontal clamp connectors is shown in Figure 1.

2.1. System Definition of Deep-Sea Horizontal Clamp Connector

Different types of deep-sea connectors can be used for different ocean working conditions [31]. The deep-sea horizontal clamp connector studied in this paper has the advantages of low cost, small overall height, and convenient placement of protective covers. From the function of the deep-sea horizontal clamp connector, it can be divided into three parts: the frame, the drag system, and the connector body. At the same time, the connector body can be divided into three subsystems: the body structure, the sealing system, and the locking system; the frame and the body structure constitute the guiding system. In the process of connecting pipelines, each system cooperates with each other to complete the guiding, dragging, locking, and sealing functions of the connector. The specific structure is shown in Figure 2.
After conducting a functional analysis of each subsystem, the operational process of the deep-sea horizontal clamp connector can be dissected into four distinct stages, as shown in Figure 3.
(1)
The connector is lowered onto the inclined plate using the guiding column of the frame structure and the horn mouth of the body structure. The connector is leveled using the inclined surfaces of the guiding plate and the guiding plates on either side of the body structure.
(2)
The drag tool is lowered, and the positioning block of the drag tool cylinder is placed between the two outer end plates to create a point of action. The cylinder head is then guided into the specified installation point using the pull head of the frame structure. The hydraulic flying head of the operating system initiates the drag tool and pulls the connector towards the terminal flange. During the dragging process, the horizontal precision guide of the frame and the horizontal guiding column collaborate to provide vertical guidance for the connector. Due to the asymmetrical structure of the crossover pipe and the connector, a bias load may be generated during the dragging process. Therefore, there is a stringent requirement for the synchronization of the hydraulic system of the drag tool. The frame undergoes a tremendous load during the dragging process of the connector, so reinforcement ribs are welded onto the guiding inclined plate and the dragging support plate.
(3)
The drag tool is retrieved, and the ROV torque wrench is installed at the ROV base and activated. The locking bolts are tightened to rotate the ear shaft, which then moves under the constraint of the inclined guiding slot of the outer end plate, thereby driving the clamp to close.
(4)
When the clamp is closed, the inner inclined surface of the clamp paw squeezes the moving end flange and the terminal flange. The sealing ring forms a sealing surface under the compression of the two flanges. Finally, the hydraulic flying head is employed to press the sealing layer for sealing test.

2.2. Construction of Fault Tree Model for Deep-Sea Horizontal Clamshell Connector

To develop a reliability model for the deep-sea horizontal clamp connector, it is essential to utilize reliability analysis methods to assess the impact of failure events, components, and subsystems on the overall system, as well as their logical interdependencies. In this regard, fault trees have been extensively employed as a conventional systems engineering research tool. Fault trees enable a detailed deductive analysis of an event to identify potential causes and estimate the probability of failure [32]. A fault tree model was established based on a brainstorming session for risk assessment of the deep-sea horizontal clamp connector, which involved multiple experts, engineers, and designers. The model is presented in Figure 4, with symbols representing the names of the events as shown in Table 1.
Combining the logical relationship of failure events in the deep-sea horizontal clamp connector fault tree described earlier, the probability of the top event not occurring is equal to the probability that none of the failure modes occur in all the minimal cut sets. Based on this condition, obtain:
P s = i = 1 k P s i ,
where P s i is the reliability of the i-th minimal cut set under study, and k is the total number of minimal cut sets.
Simplify the fault tree analysis according to Boolean algebra method, and perform a logical calculation for connector failure events:
T = M 1 + M 2 + M 3 + M 4 = = X 1 + + X 8 + X 9 + + X 25 + X 26 + + X 40 + X 41 + + X 51 + X 52 .

2.3. Probability Distribution Analysis of Connector Failure Modes

To ensure the reliability model of the deep-sea horizontal clamp connector is credible and unbiased, it is crucial to establish the model based on actual engineering requirements and systematically collect reliability information. The working stage of the connector can be divided into two stages: the connection stage and the service stage. If the same probability distribution model is used for the failure modes of both stages, the results may be biased. Therefore, the probability distribution model can be established by combining the failure mode mechanism of the failure bottom event.
Deep-sea horizontal clamp connectors consist of mechanical structures and hydraulic systems. For the hydraulic system and most mechanical components, there is no wear-out failure caused by repeated work. The failure mode of these components only occurs during the connector’s connection stage. Therefore, the exponential probability model can approximately describe the failure distribution of these components, such as the stress-related failures of the frame mechanism, clamp structure, and sealing structure during the connection process. However, for structural damage caused by corrosion and wear-out over time, a Weibull probability model that considers the degradation characteristics should be used to describe it.
The reliability function representing the failure of the bottom event that follows an exponential distribution can be expressed as [33]:
P t = e λ t ,
where λ is the failure rate and t is the time.
The failure of the bottom event that follows a Weibull distribution can be represented by the reliability function [33]:
R t = t f τ d τ = e t γ η β ,
where η is the scale parameter that affects the size of the time axis, β is the shape parameter that affects the failure rate, and γ is the location parameter that affects the earliest occurrence of failure.
The reliability function of a mixed distribution can be represented by:
R m t = j = 1 n e t γ j η j β j + i = 1 n e λ i t .

2.4. Probability Distribution Analysis of Connector Failure Modes

Collecting multiple sources of mixed information can minimize poor reliability information and ensure the credibility and unbiasedness of the reliability analysis results. According to the characteristics of the reliability model of horizontal clamp connectors, the following reliability quantitative analysis process is established, as shown in Figure 5. According to the analysis, the failure bottom event probability distribution of the connector can be divided into exponential distribution, Weibull distribution, and a mixed distribution that combines the two. Prior product information can be searched and directly applied based on the reliability information database, and expert experience needs to be transformed into probability density functions through fuzzy quantitative analysis. Design information is the analytical data left by the designer during the design process. It provides critical information about how the equipment is designed, manufactured, and operated, and can be converted into reliability information through certain research methods, such as Bayesian method, grey theory, maximum value theory, and cumulative damage model, etc.

2.4.1. Reliability of Bottom Event under Prior Product Information

All hydraulic components of the drag system are standard parts that have undergone standard factory testing, such as the X16, X17, X18, X19, X20, and X21 check valves, so the failure probability can be obtained by querying the reliability database [34].

2.4.2. Reliability of Bottom Event under Expert Experience

Due to the limited availability of samples of the same type of connector, a risk assessment of different connector types can only serve as a reference and not be used for precise quantitative analysis using existing data. Expert scoring is an effective approach to resolve such issues [35].
Since the level of expertise of invited experts may vary, this paper needs to weight the scores provided by them to reduce subjectivity. The weight of an expert can be comprehensively evaluated based on their job title, education, age, and years of experience in the industry. The lower the score given by an expert, the smaller their impact on the overall result. The factors for determining expert weights are shown in Table 2 [36].
Convert the expert’s resume into a score and add it up, so that the sum of all experts’ resumes is set to 1, and the weight of the i-th expert can be normalized to:
R i = i = 1 , j = 1 n W i V i j / k = 1 m i = 1 , j = 1 n W i V i j k .
In this paper, 7 connector experts were invited to assess the risk of horizontal clamp connector failure events, and their information is shown in the Table 3.
Combined with Equation (6), the weights of the 7 experts can be obtained:
[R1 R2 R3 R4 R5 R6 R7] = [0.113 0.171 0.193 0.125 0.102 0.159 0.136],
where Ri is the weight value of the ith expert.
For the fuzzification of event probabilities, only the degree of expression is needed, not the specifics, while the definition of the degree needs to be established. Fuzzy quantitative analysis methods represent the degree of membership of elements in a set with any value in the range of 0 to 1. When extended to the occurrence probability of basic events in engineering, it can be described using “very low (VL)”, “low (L)”, “relatively low (FL)”, “medium (M)”, “relatively high (FH)”, “high (H)”, and “very high (VH)”, using fuzzy numbers to express this language, and making their membership functions linearly related [37,38], as shown in Figure 6. This paper chooses trapezoidal distribution to describe “very small”, “relatively small”, “relatively large”, and “very large”, and triangular distribution to describe “small”, “medium”, and “large”. The corresponding membership function graphs for these distributions are shown in Figure 7.
The expression for this membership function is:
f V L ( x ) = 1   ( 0 < x 0.1 ) ( 0.2 x ) / 0.1   ( 0.1 < x 0.2 ) 0   others f L ( x ) = ( x 0.1 ) / 0.1   ( 0.1 < x 0.2 ) ( 0.3 x / 0.1 )   ( 0.2 < x 0.3 ) 0   others f F L ( x ) = ( x 0.2 ) / 0.1   ( 0.2 < x 0.3 ) 1   ( 0.3 < x 0.4 ) ( 0.5 x ) / 0.1   ( 0.4 < x 0.5 ) 0   others f M ( x ) = ( x 0.4 ) / 0.1   ( 0.4 < x 0.5 ) ( 0.6 x ) / 0.1   ( 0.5 < x 0.6 ) 0   others f F H ( x ) = ( x 0.5 ) / 0.1   ( 0.5 < x 0.6 ) 1   ( 0.6 < x 0.7 ) ( 0.8 x ) / 0.1   ( 0.7 < x 0.8 ) 0   others f H ( x ) = ( x 0.7 ) / 0.1   ( 0.7 < x 0.8 ) ( 0.9 x ) / 0.1   ( 0.8 < x 0.9 ) 0   others f V H ( x ) = ( x 0.8 ) / 0.1   ( 0.8 < x 0.9 ) 1 ( 0.9 < x 1 ) 0 others .
The λ-cuts of the membership functions represented by the expert fuzzy language are as follows:
V L λ = [ v 1 , v 2 ] L λ = [ l 1 , l 2 ] F L λ = f 1 , f 2 M λ = [ m 1 , m 2 ] F H λ = [ h 1 , h 2 ] H λ = [ g 1 , g 2 ] V H λ = [ b 1 , b 2 ] ,
where l1, l2, ……, b1, b2 represent the upper and lower limits of the λ-cut sets.
Let λ = (v − 0.2)/0.1, then v = 0.2 − 0.1λ. Using the same method, the following formulas can be obtained:
l 1 = 0.1 λ + 0.1 l 2 = 0.3 0.1 λ f 1 = 0.1 λ + 0.2 f 2 = 0.5 0.1 λ m 1 = 0.1 λ + 0.4 m 2 = 0.6 0.1 λ h 1 = 0.1 λ + 0.5 h 2 = 0.7 0.1 λ g 1 = 0.1 λ + 0.7 g 2 = 0.8 0.1 λ b = 0.1 λ + 0.8 .
Integrating the λ-cuts of the expert opinions on the fuzzy language of a basic event yields the evaluation opinion and, thus, the average fuzzy number W can be calculated as follows:
W = | W 1 l 1 + + W 7 l 2 | = a λ + b , c d λ ,
order W a = | ( x 1 , x 2 ) | = | ( a λ 1 + b ) , ( c d λ 2 ) | , then λ 1 = x 1 b a , λ 2 = c x 2 d .
Convert the above equation into a functional relationship using the membership function:
f W ( x ) = x B A   ( B x A + B )     1       ( A + B x D ) D x C ( D x C + D )     0             others ,
and using the left–right fuzzy ranking method, fuzzy numbers can be transformed into probability values. The fuzzy maximum set and fuzzy minimum set are defined as follows:
f max ( x ) = x 0 < x < 1   0 others f min ( x ) = 1 x   0 < x < 1   0 others .
The left and right fuzzy numbers at the intersection of the fuzzy maximum set and fuzzy minimum set with the expert membership function are:
F P S L ( W ) = sup x [ f W ( x ) f min ( x ) ] F P S R ( W ) = sup x [ f W ( x ) f max ( x ) ] ,
thus, the fuzzy possibility value FPS(W) is obtained as follows:
F P S ( W ) = F P S R ( W ) + 1 F P S L ( W ) 2 .
The fuzzy value is converted into fuzzy failure probability. The conversion equation of fuzzy possible value FPS and fuzzy failure rate FFR (failure probability) is:
F F R = 1 10 k ( F P S 0 ) 0   ( F P S = 0 ) ,
where k is the failure possibility coefficient when the maximum membership degree value is equal to 1. The expression for the failure possibility coefficient is:
k = [ 1 F P S F P S ] 1 3 ln ( 1 E r M ) ,
where ErM is the possible failure rate, obtained from reference values of top event statistical data or expert-provided empirical values. ErM values for M1, M2, M3, and M4 can be estimated based on the OREDA 2015 reliability database of connector failure samples [39]. The ErM values are 0.03 for M1, 0.03 for M2, 0.02 for M3, and 0.13 for M4.
The evaluation of each failure event by experts is shown in Table 4.

2.4.3. Reliability of Bottom Events under Design Information

The reliability of the bottom events X43, X46, and X50 in the fault tree is time-variant reliability. The yield strength of the flange manufacturing material is 515 MPa, and according to the design information, its working process is subject to maximum stress values far below the yield strength. Although fatigue can occur during the process below the material yield strength, the difference between the two is too large. Therefore, the corrosion, which is the focus of attention, will win in the competition of failure mechanisms with fatigue and wear, and occur earlier than other mechanisms. Therefore, corrosion should be analyzed as the cause of pipeline rupture.
Expert experience is not applicable in predicting the development of failure events. Instead, the Weibull distribution can be utilized to describe the basic model of the corrosion of the connector sealing system, as it is a distribution form that describes cumulative wear failure. Reliability information of the sealing structure of the connector can be obtained by combining design information and predicting failure modes from the perspective of design reliability, and then fitting various parameters of the Weibull distribution.
(a)
Corrosion Prediction Analysis
Figure 8 shows the stress state of the sealing structure in service. Sacrificial anodes are used to prevent external corrosion at the cross-joint pipe end. The corrosion rate of the material 12Cr2Mo1 in the fully immersed area is approximately 0.21 mm/a. This means that the flange corrosion rate is roughly 0.019 mm/a (95% corrosion protection rate) under cathodic protection [40]. To prevent internal corrosion by cathodic protection, corrosion inhibitors are added to prevent the corrosive medium from contacting the inner wall and reacting with the corrosive medium. The corrosion rate for the internal corrosion depth d can be estimated using the empirical “de Waard & Williams” equation, which incorporates the effect of operating pressure and environmental temperature on the corrosion rate [41]:
log v t = 5.8 1710 T t + 0.67 log 10 n c o 2 Δ p o p e r t ,
where T(t) represents the Kelvin temperature, and 0 °C is 273.15 Kelvin; n c o 2 is the molar fraction of CO2 in the gas phase, 0.02; Δpoper is the operating pressure, 345 bar. Substituting the environmental conditions into Equation (18) yields the internal corrosion rate, v(t), of 1.25 mm/a.
To make the corrosion results closer to the actual working conditions during the service life of the connector, the corrosion degree is expected to be adjusted by considering the influence of the corrosive agent and the uncertainty of the model as factor [42]:
d c o r r t = X ac X c o r r 0 t a t v t d t ,
where Xac is the corrosion rate coefficient of cathodic protection, which is 0.6; a(t) is the distribution of corrosion inhibitor, which follows a beta (a, 50%) distribution; Xcorr is the uncertainty of the empirical corrosion rate model, which follows an N (0.2, 20%) distribution.
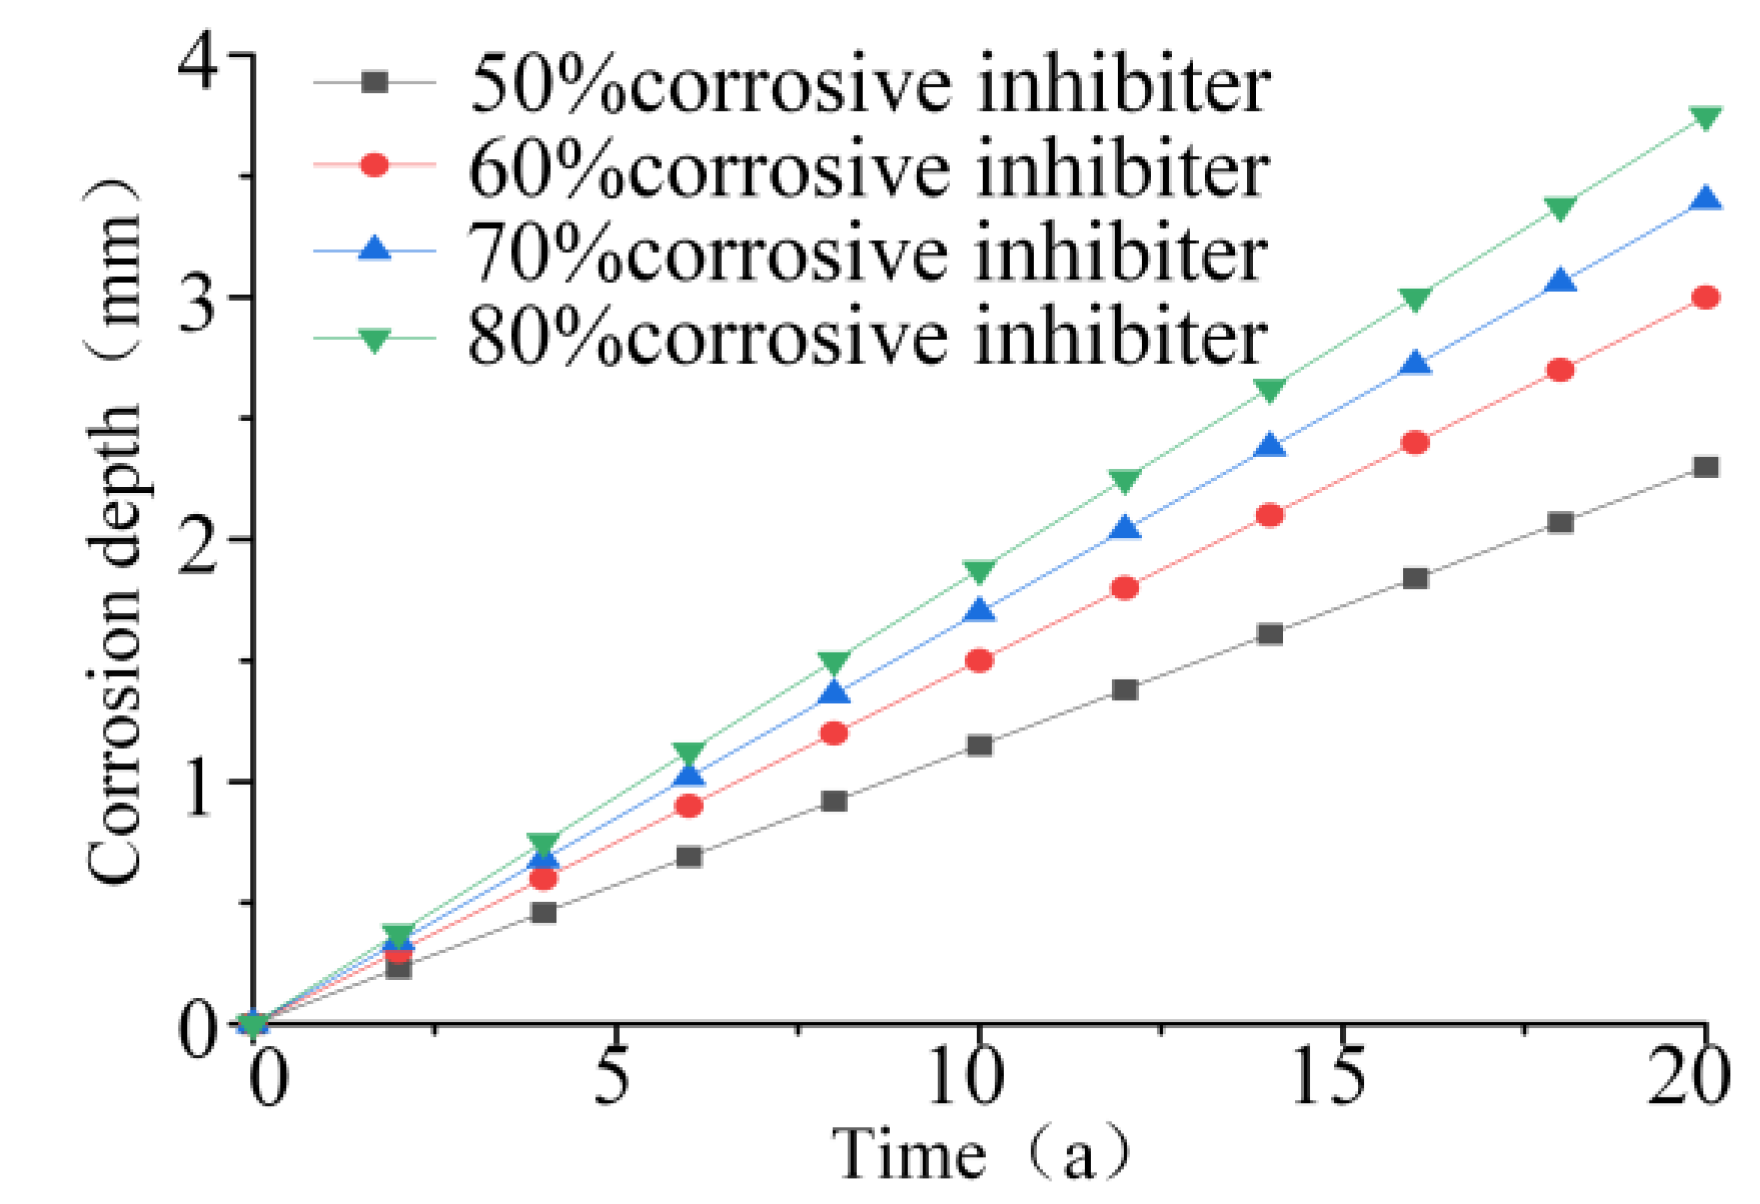
Combining Equations (18) and (19), the relationship between the utilization rate of the corrosion inhibitor and the expected corrosion and service life can be obtained, as shown in Figure 9. In this paper, the maximum entropy theory is used to adopt a 50% utilization rate of the corrosion inhibitor.
Scholars have conducted extensive research and tests to prove that there is no correlation between corrosion depth d and corrosion length l [43,44,45]. In actual working conditions, flange corrosion is mostly characterized by “6 o’clock” flat corrosion. According to Sakakibara’s research conclusions, when the longitudinal defect length l is relatively large compared to the width defect w, the influence of the width defect on the strength of the pipeline can be ignored [46]. However, for a known defect depth, there are many factors that affect the defect length, and there is no good mathematical model to calculate it. Generally, statistical measurements are used to obtain data. Therefore, this paper refers to an empirical equation for defect length growth rate of 3 mm/a in marine engineering [40].
The width w growth rate in the defect area is calculated based on the empirical equation for length growth rate, with a length-to-width ratio of 0.2, i.e., the width d is 0.6 mm/a. Then, the non-conservative Equation (20) proposed by Hopkins is used to correct the length and width growth rates, as they previously pointed out that the precise calculation of the cross-sectional area of the corrosion zone was overly conservative [47]:
A R E A = 2 3 L d ,
the 2/3 coefficient proportion is allocated to the defect length and width, which results in the parameter model of the defect area within a given time:
d T = d 0 + 0.18 v d l T = l 0 + 1.8 v l w T = w 0 + 0.6 v w .
This paper mainly focuses on the corrosion degradation problem of the terminal flange. According to the relationship between the ultimate pressure equation and the wall thickness given by ASME-B31G, the general standard for evaluating the strength of the pipeline is the minimum wall thickness of the pipeline after corrosion. Therefore, the minimum wall thickness of the flange can be used as the inner and outer diameter of the pipeline for analysis, which results in more realistic results [48]:
P = σ ¯ 2 d D 1 d σ 1 d σ M ,
where P is the carrying pressure in MPa, σ is the average stress, d is the inner diameter in mm; σ ¯ is the average stress in MPa, D is the outer diameter in mm, and M is the expansion coefficient. The expansion coefficient M can be expressed as:
M = 1 + 0.6275 1 D d 2 + 0.003375 l D d 4 l D d 50 0.32 l D d 2 + 3.3   Others   .
By combining Equations (22) and (23), the maximum corrosion depth can be obtained:
d max = P D d M 2 σ ¯ d 2 M P 2 σ ¯ d M .
(b)
Finite Element Analysis
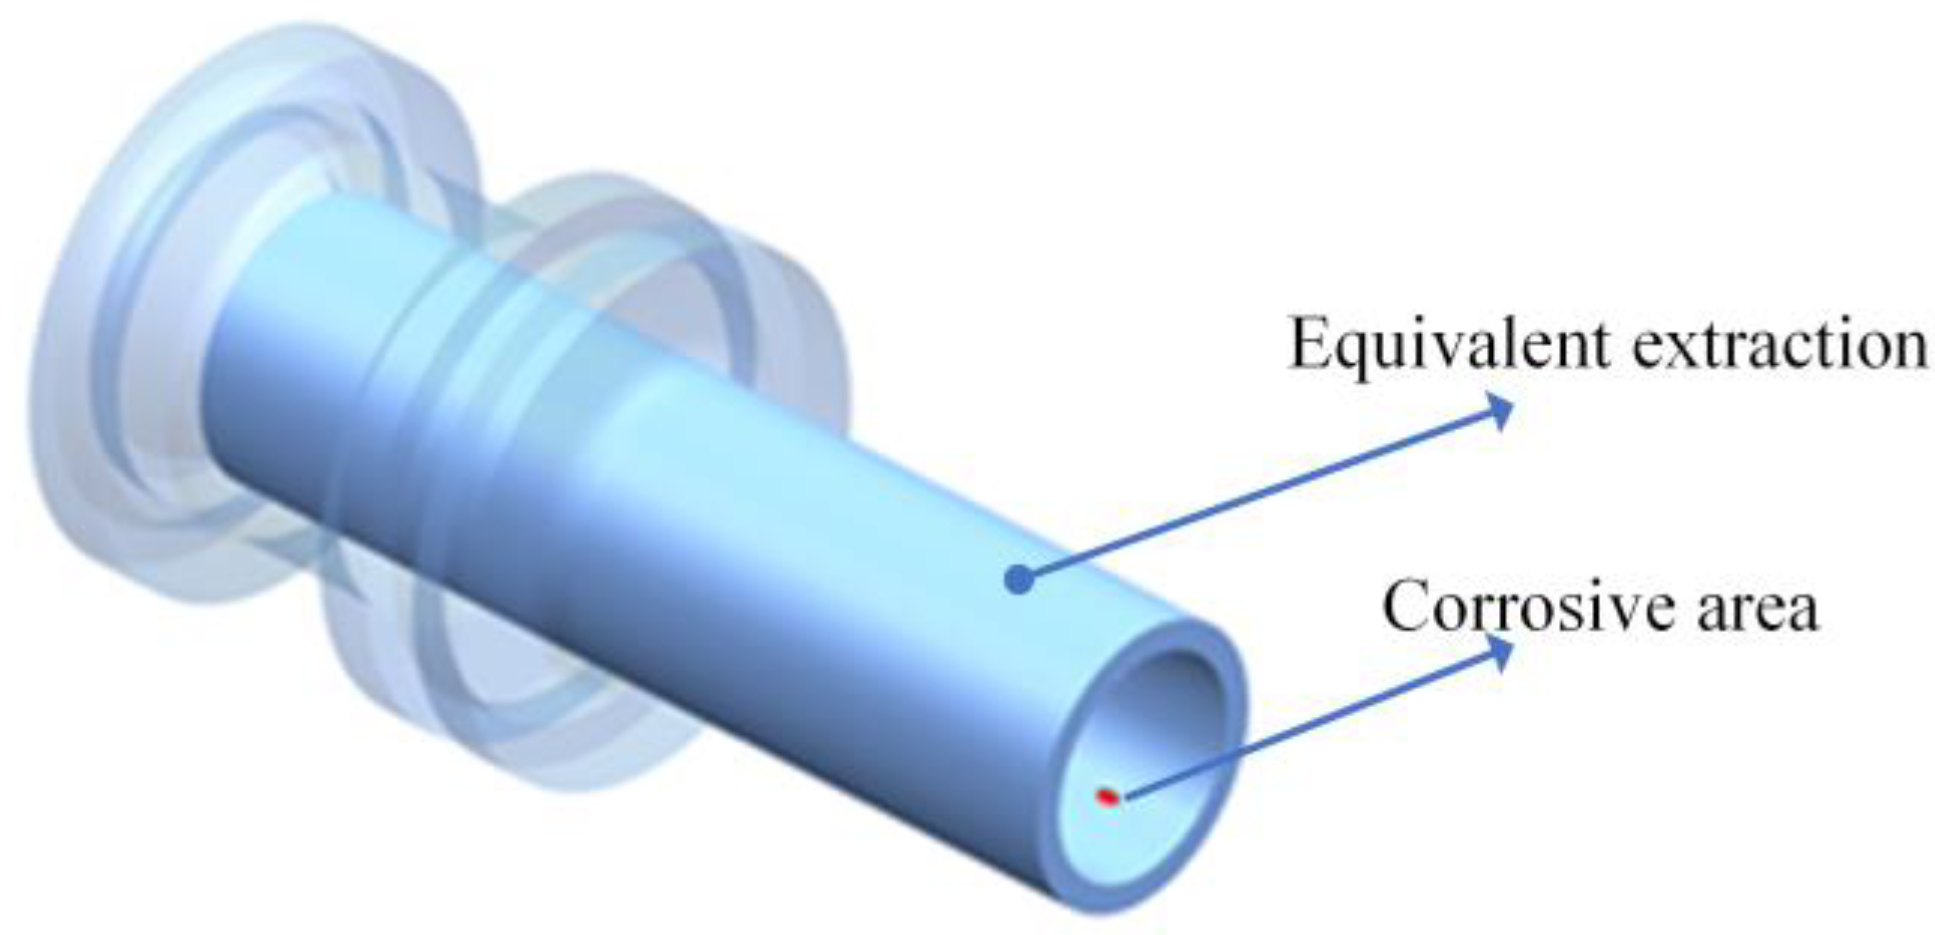
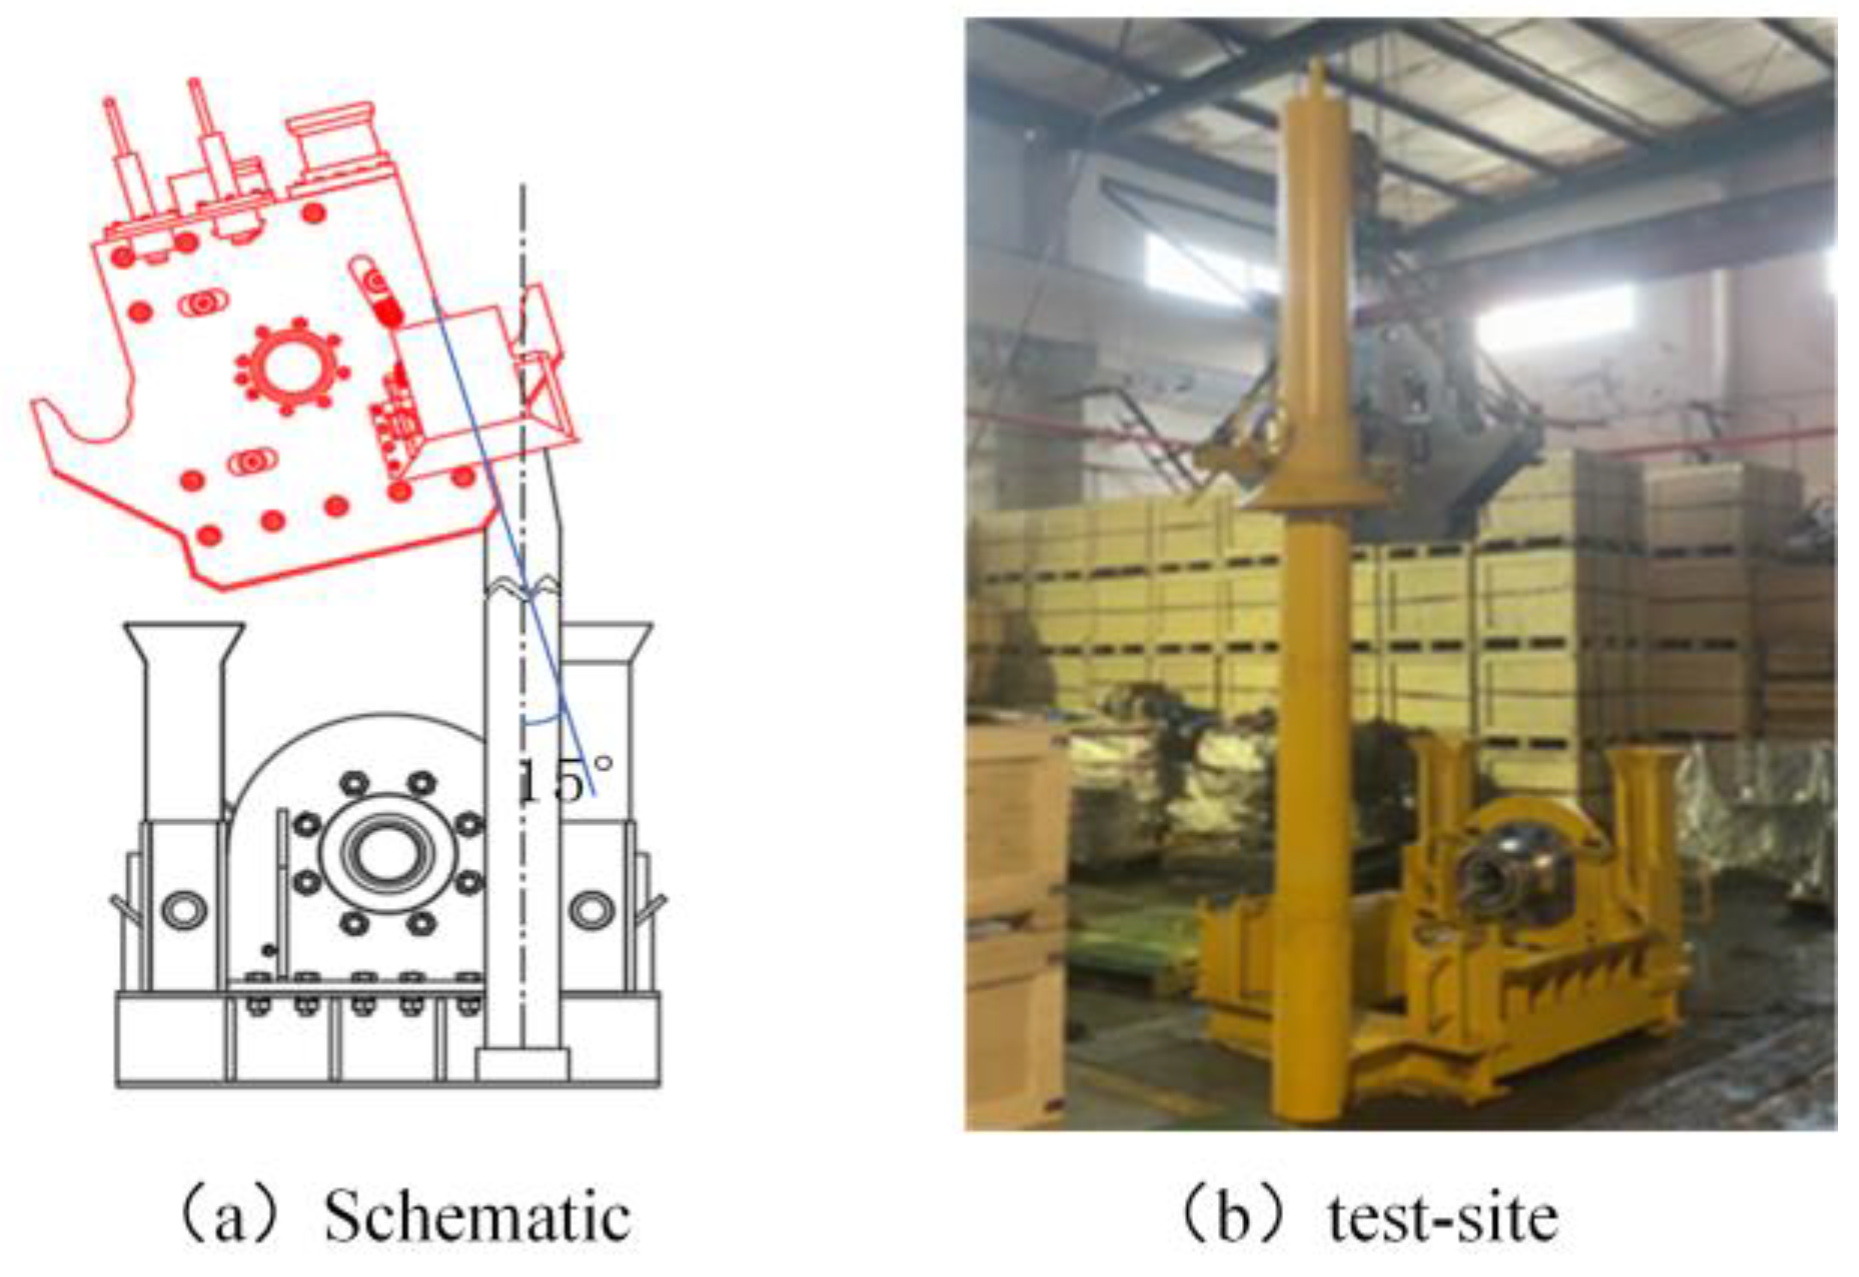
As shown in Figure 10, the terminal flange is parametrically modeled and simplified into a solid part, and the equivalent length is 428 mm, the inner radius is 66.85 mm, and the outer radius is 84.15 mm, combined with the design information. As the corrosion on the flange is mostly in the form of long plateau corrosion, the internal corrosion point is equivalent to a semi-elliptical defect after parameterization, which is approximately equivalent to long plateau corrosion. The corrosion defect is located at the boundary where the wall thickness is the thinnest, as this is where the pipeline is weakest due to the welding of the cross-connection pipe, and also where corrosion is most likely to occur.
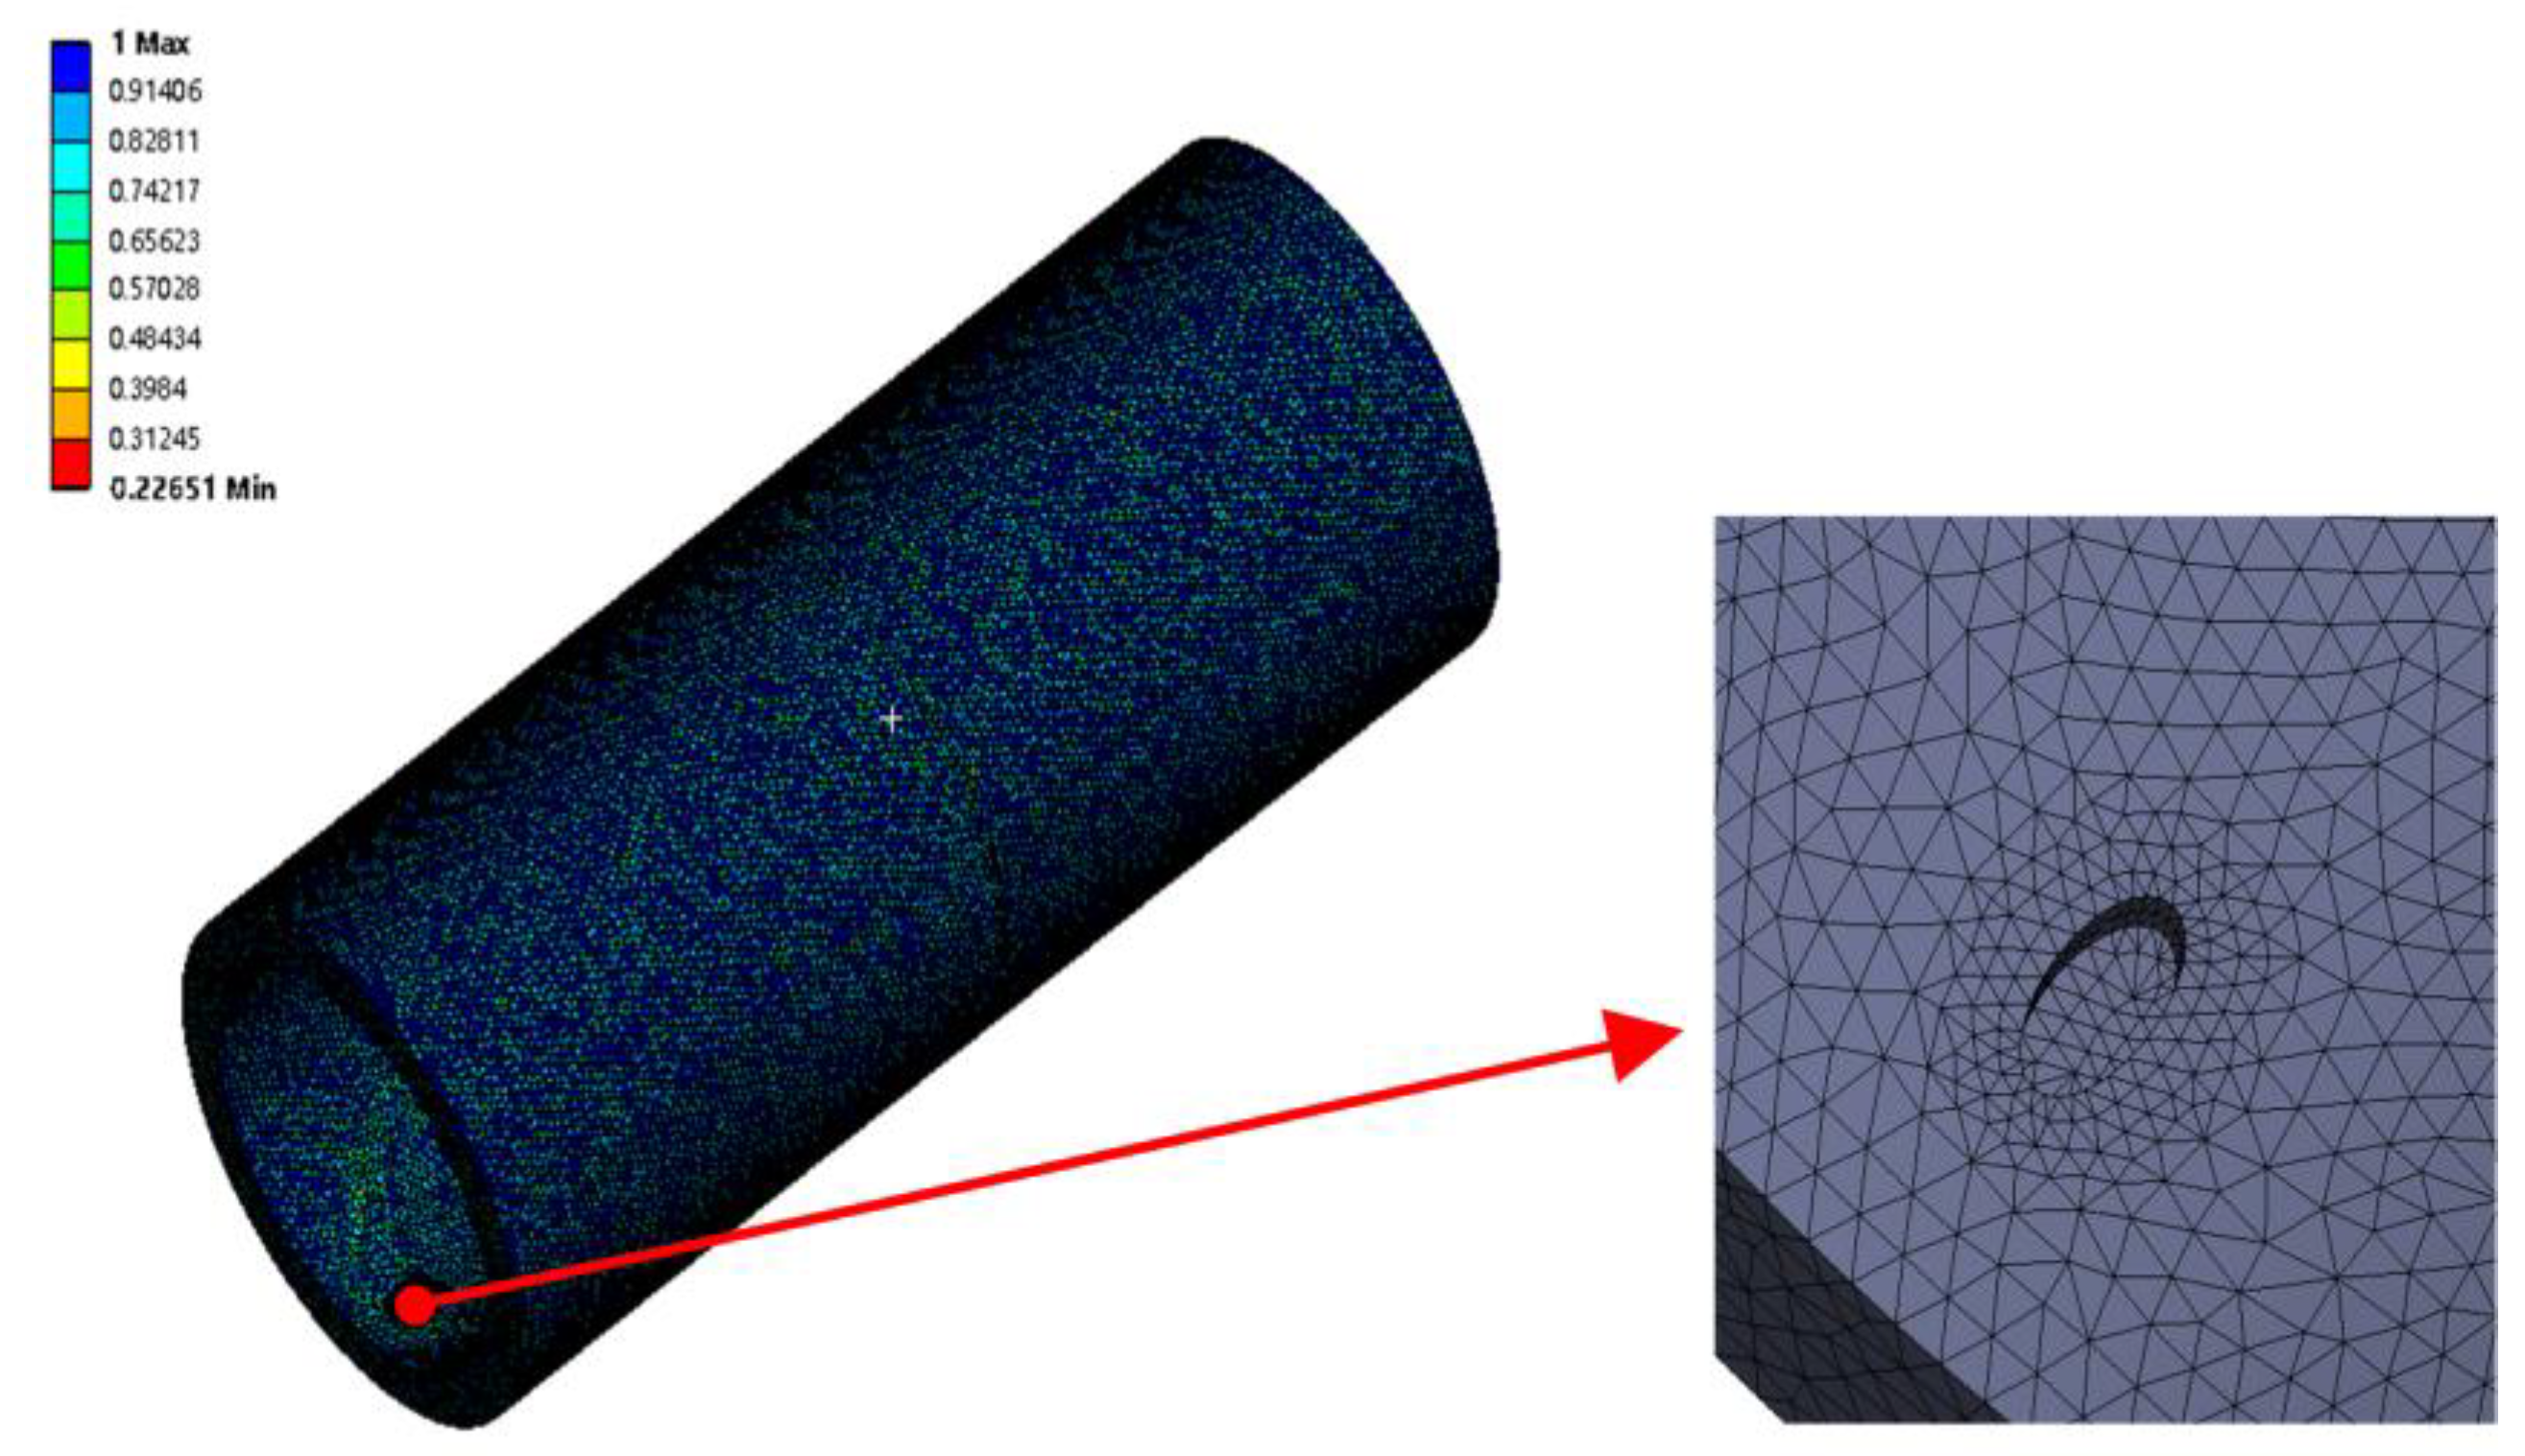
Finite element analysis of the seal structure with corrosion defects is performed using Ansys Workbench software. The Geometry module in the static structural module is selected to partition the model into meshes. The material properties of the equivalent model are as follows: the flange is made of 12Cr2Mo1, with an elastic modulus of 2.1 × 10⁵ MPa, a Poisson’s ratio of 0.3, and a yield strength of 515 MPa. The meshing method is Hex Dominant, the mesh size is 3 mm, and the number of meshes after partitioning is 245,824. The mesh in the defect area is refined by 1 mm, as shown in 
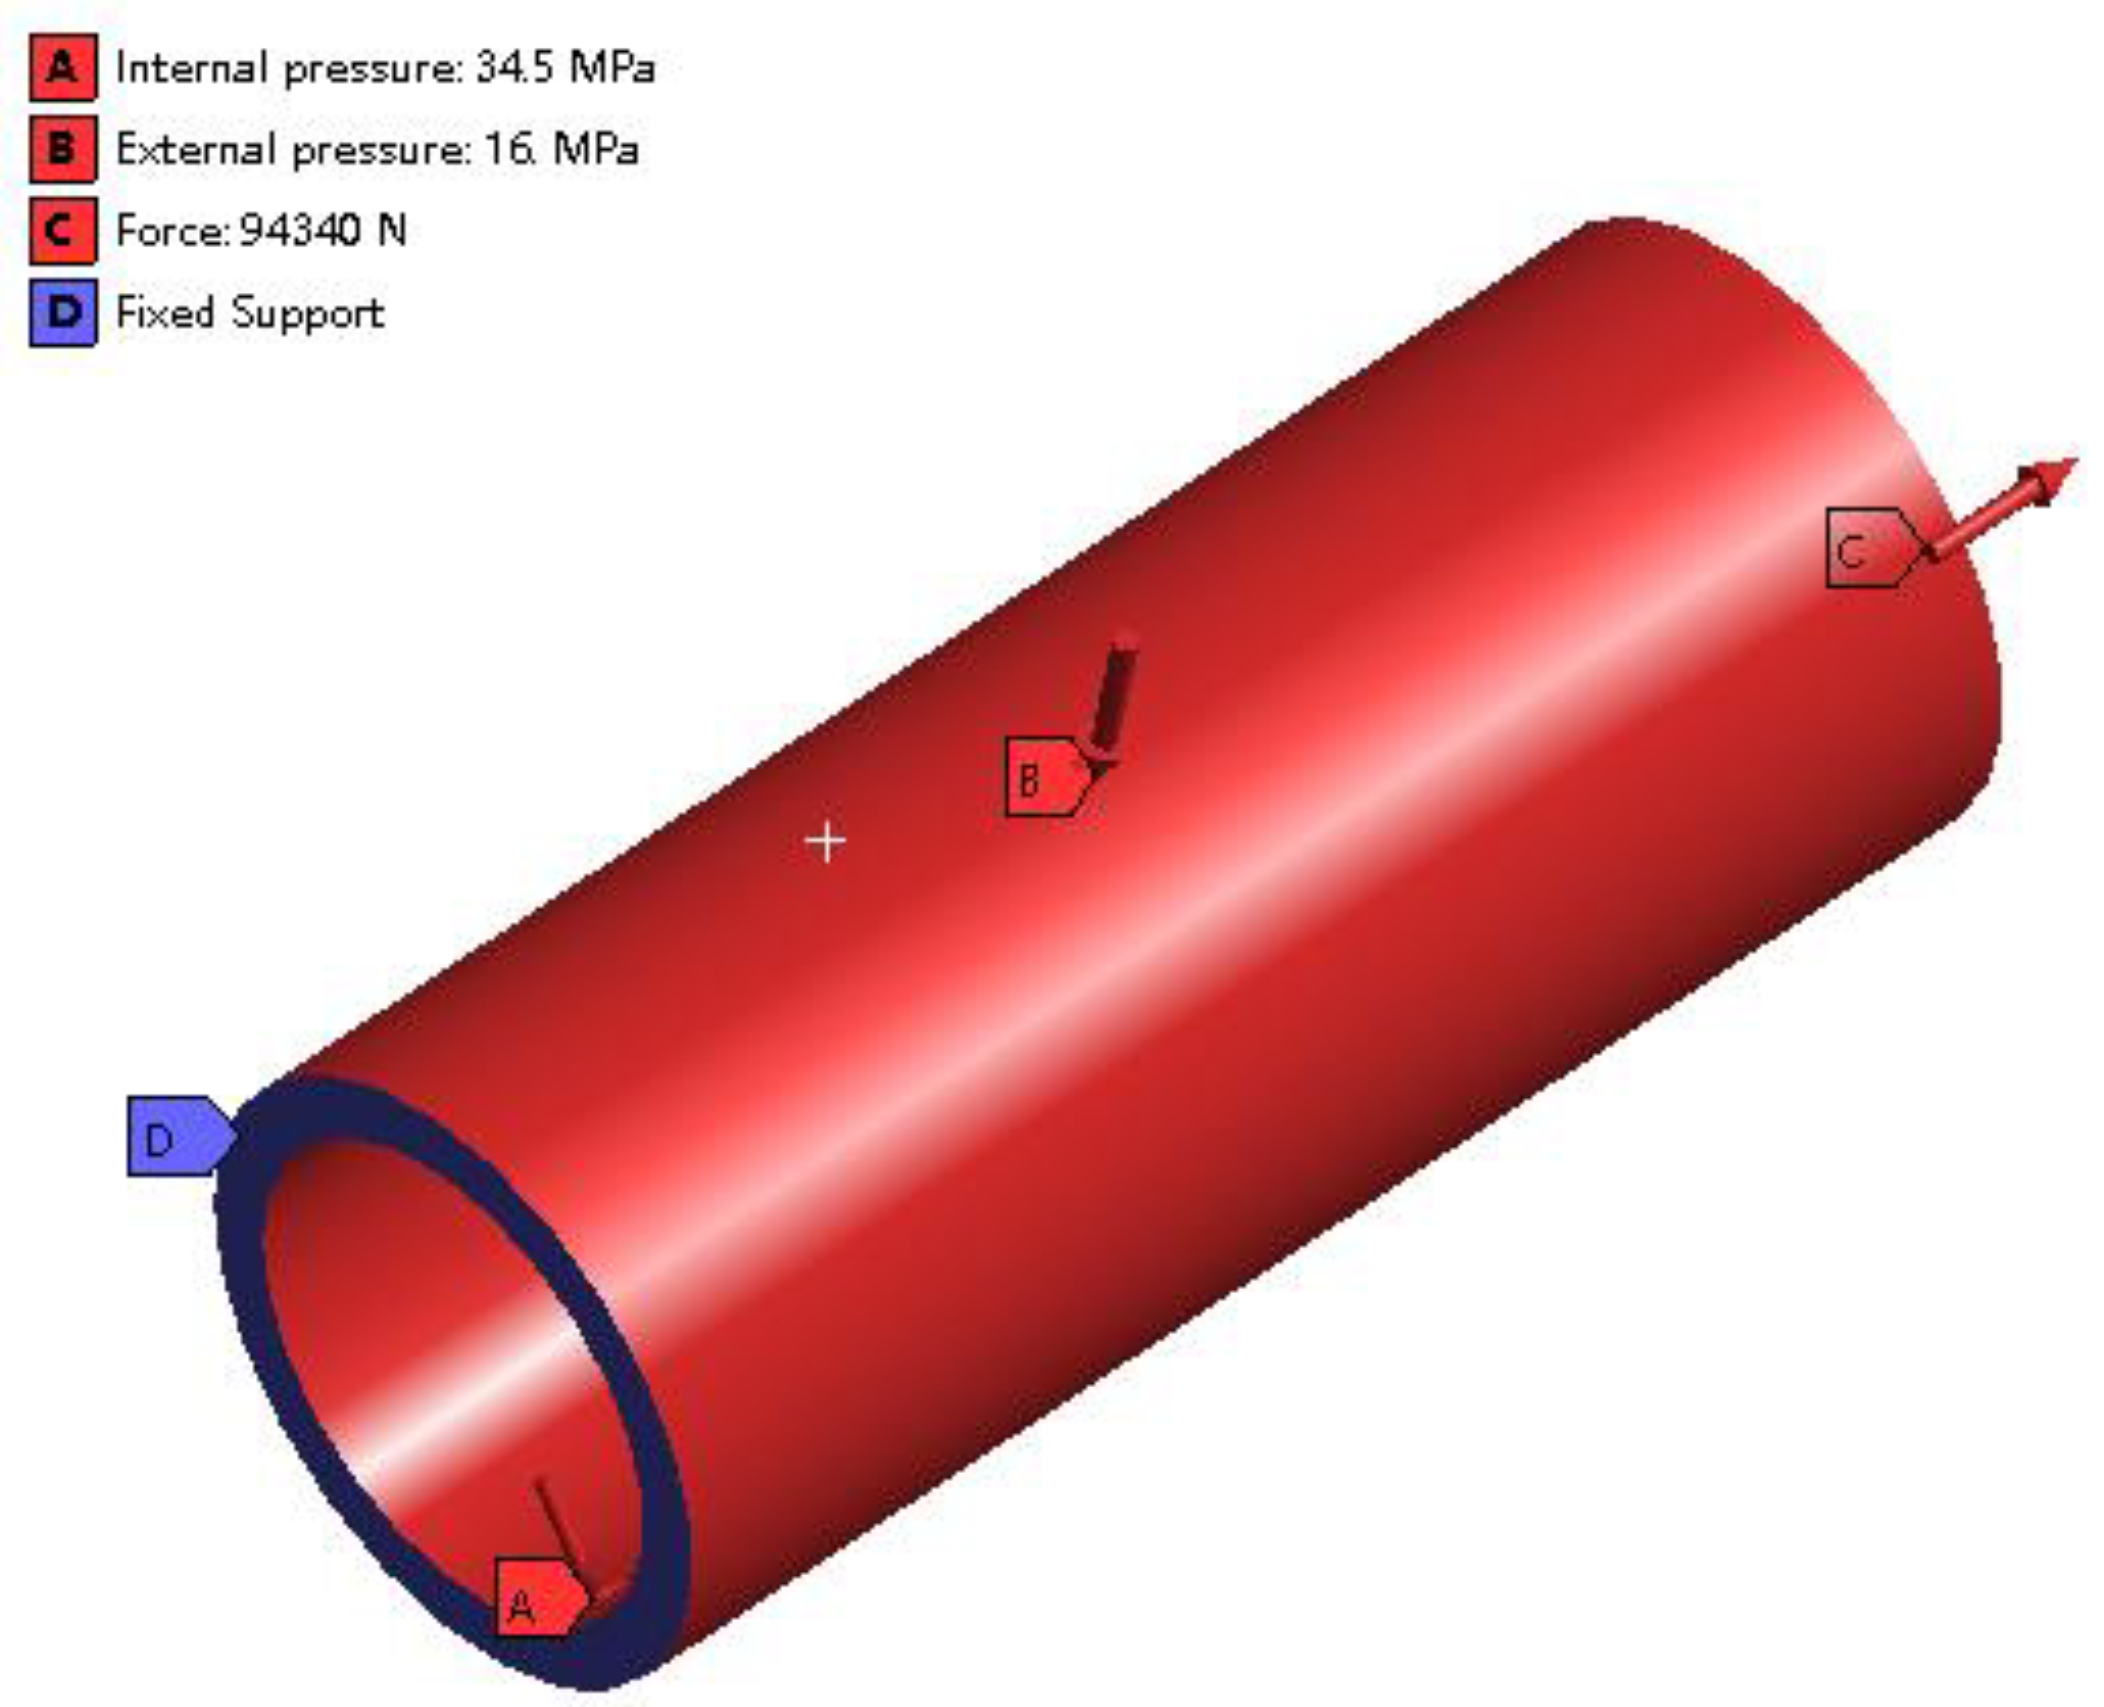
Figure 11. According to the connector design operating conditions, an internal pressure of 34.5 MPa is applied to the inner surface of the flange, an external pressure of 16 MPa is applied to the outer surface, and a cross-joint pipe acting load of 94,340 N is applied to the left end surface of the equivalent body, and a constraint is applied to the right end surface, as shown in Figure 12.
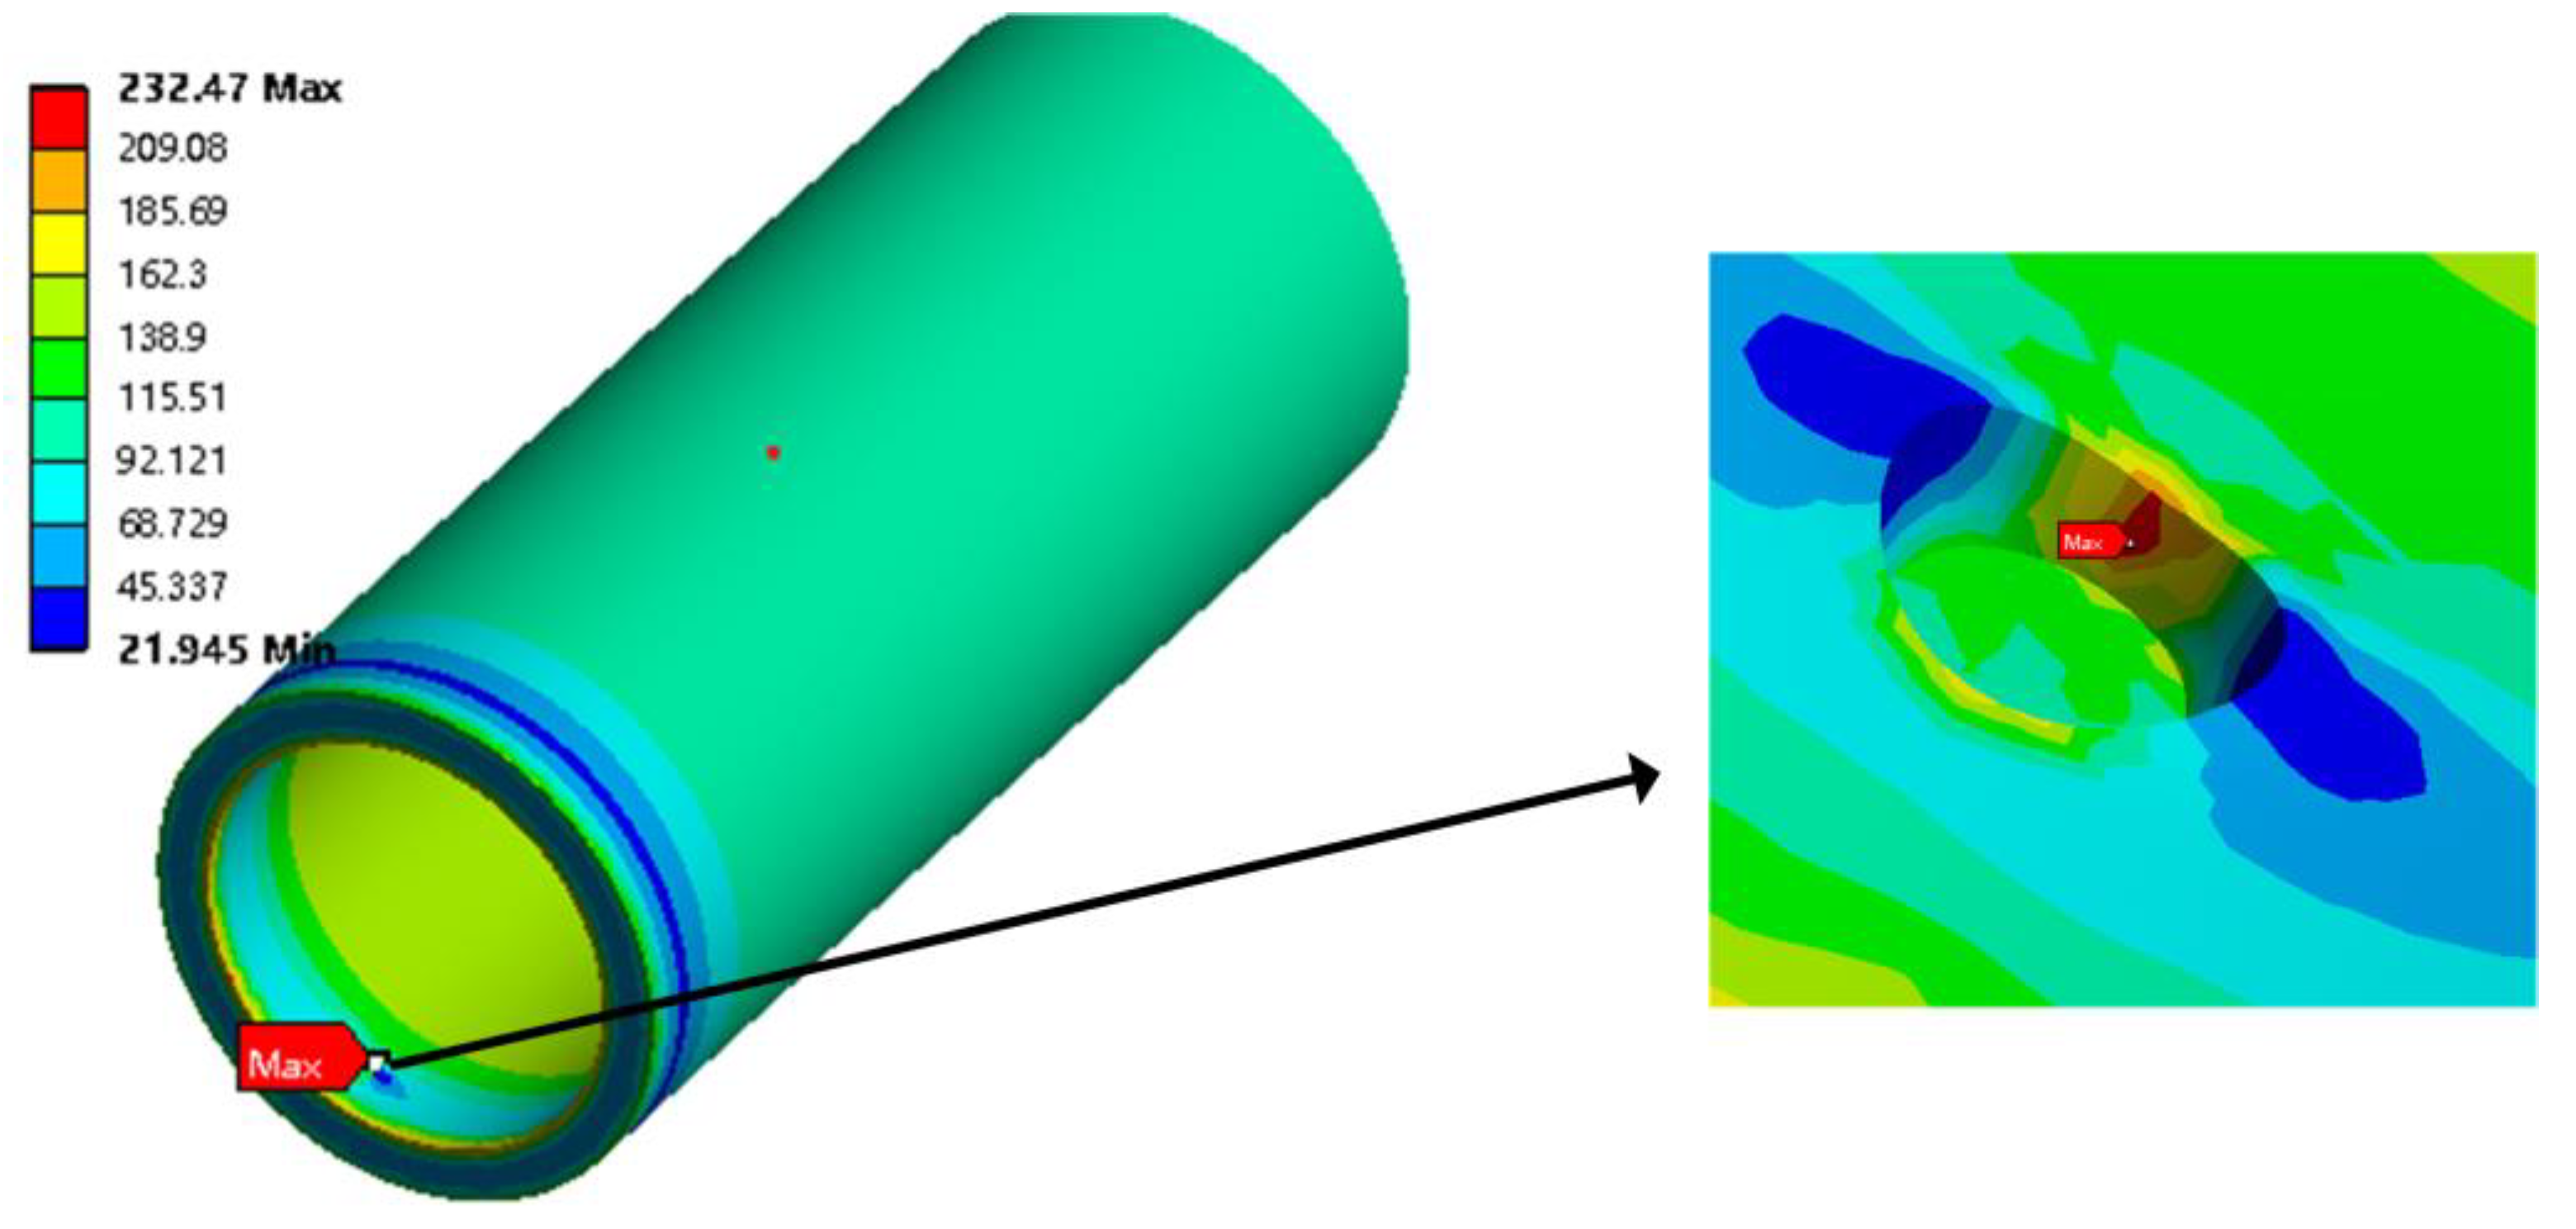
According to the third strength theory, under the combined effect of the uniform reduction of the outer wall thickness of the flange and the defects caused by internal point corrosion, the sealing failure of the flange defect area occurs when the equivalent stress under internal and external pressure exceeds the yield strength of the material itself, so the maximum equivalent stress in the defect area should be analyzed.
Equivalent stress and the maximum stress on the inner wall surface of the defect in the upper flange were selected as the solution results. As shown in Figure 13, the maximum equivalent stress of the equivalent body is 232.47 MPa; when the defect depth is 0.5 mm, the length is 4 mm, and the width is 2 mm, the maximum equivalent stress of the defect area is 141.8 MPa.
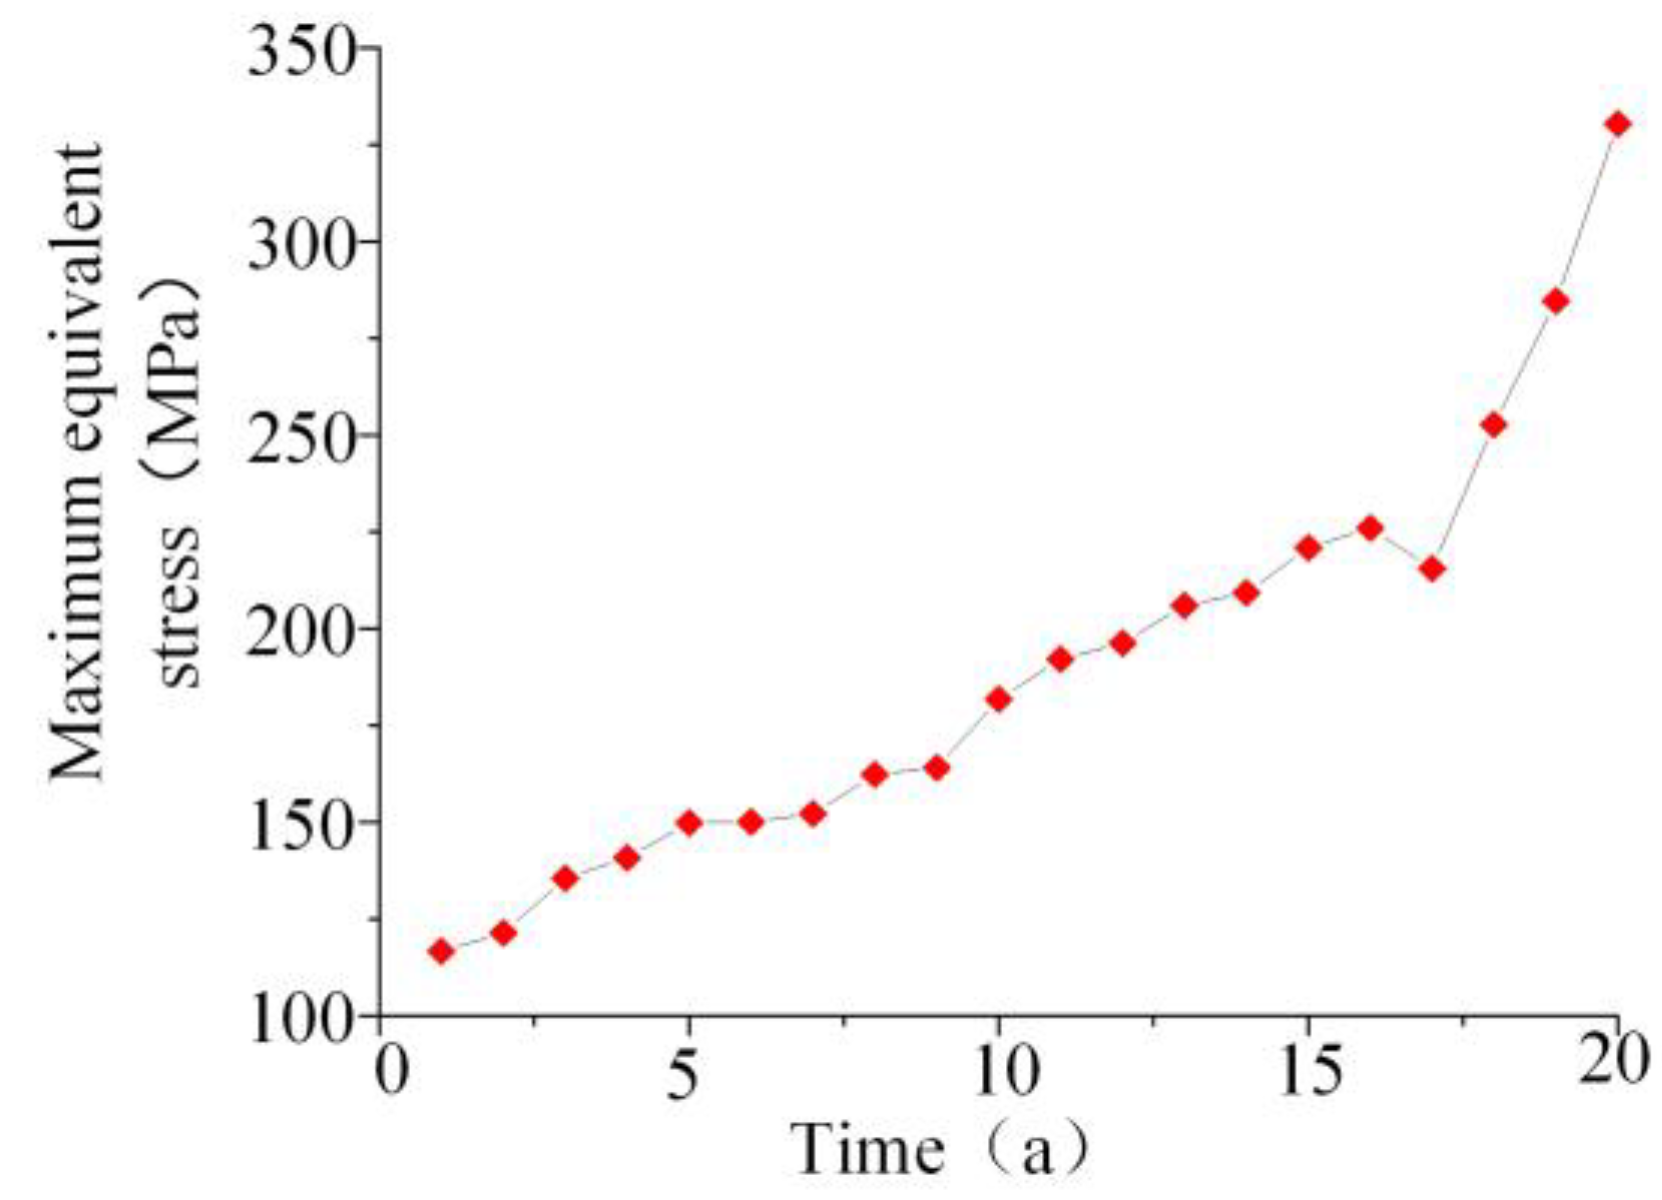
Load the Six Sigma analysis module in Ansys Workbench, select the Design of Experiments type of custom+Sampling option, predict the strength change over 20 years, and choose a sample size of 20 to obtain the equivalent stress of the corroded defect area as shown in Figure 14:
Grey system theory is a method based on the analysis and prediction of a small amount of sample data, which can handle uncertain and incomplete information. Grey system theory is mainly used to analyze and predict systems that are difficult to model and analyze through traditional methods [49]. The data from Figure 14 show that the stress results are generally increasing, and the rate of increase in the last three years is significantly greater. The maximum stress is 116.7 MPa without defects, and the maximum stress in the defect area is 330.4 MPa after 20 years.
(c)
Weibull Parameter Fitting
The unknown parameters η, β, and γ of the Weibull distribution are estimated by fitting using the stress transformation of the connection flange combined with the grey prediction model GM (1,1) and transforming Equation (4):
t = γ + η e ln 1 β ln 1 R ( t ) .
Establish the GM (1,1) model, with the whitening differential equation:
d x ( 1 ) d t + a x ( 1 ) = b ,
where a is the development coefficient and b is the grey action amount. Solving the whitening differential equation and discretizing it gives the time response function of the GM (1,1) model:
x ( 1 ) k = b a + x 0 k b a e a k 1 ( k = 2 , 3 , 4 , , n ) ,
and insert the equivalent stress values of different years from Figure 13 into the Equation (28):
X ( 0 ) = x ( 0 ) 1 , x ( 0 ) 2 , , x ( 0 ) 20 .
Generate the first-order accumulated data of the original data x(0) to obtain Equation (29):
X ( 1 ) = x ( 1 ) 1 , x ( 1 ) 2 , , x ( 1 ) 20 ,
where x 1 k = i = 1 k x 0 , k = 1 , 2 , 3 , , n . Generate the mean of X(1) near numbers for Equation (30)
z 1 k = 0.5 x 1 k + x 1 k 1 .
After obtaining the sequence, use the least squares method to estimate the parameter variables of GM (1,1):
a = a , b T = B T B 1 B T Y ,
where Y = x 0 2 x 0 1 x 0 3 x 0 2 x 0 20 x 0 19 ; B = z 1 2 z 1 3 z 1 20 1 1 1 .
By substituting η, β, and 
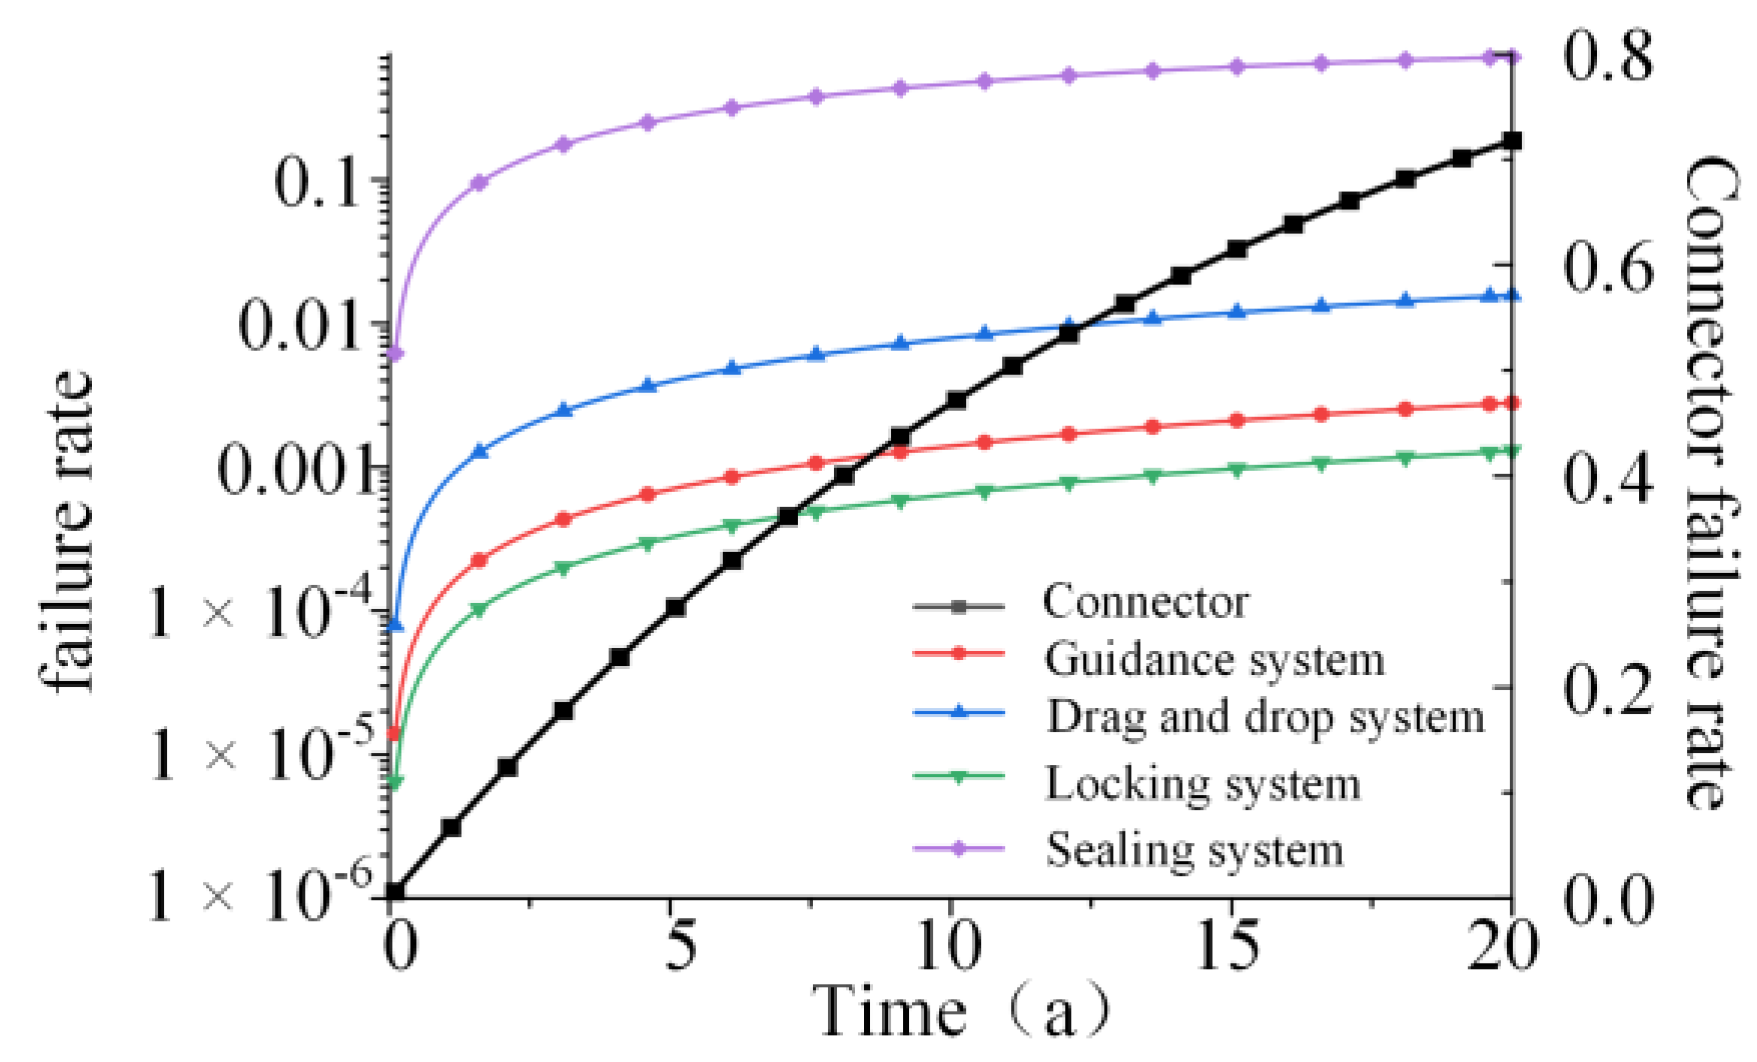
γ into Equation (25), the corrosion reliability function of the flange can be obtained. Combining with the reliability database OREDA [39], which provides a welding failure rate of 3 × 10⁻⁶, the mixed distribution of flange failure due to rupture can be obtained.

3. The Reliability Analysis Results of Horizontal Clamp Connectors

The failure rates of the deep-sea horizontal clamp connector’s fault tree bottom events were obtained by integrating prior product information, expert experience, and design information and using relevant methods to process the raw data, as shown in Table 5.
According to Equation (2), the failure probabilities of the top event and intermediate event can be obtained, as shown in Table 6.

4. Reliability Analysis of Deep-Sea Horizontal Clamp Connectors

Through the above analysis and calculation, the initial failure probabilities of all bottom events in the fault tree of the deep-sea horizontal clamp connector are obtained. By using the logical relationship between the fault trees, the failure probabilities of the initial top events and intermediate events are then obtained. As shown in Figure 15 and Figure 16, the left coordinate axis corresponds to the bottom events, and the right coordinate axis corresponds to the top events and intermediate events. X49 has the highest failure probability among the bottom events, and the other bottom events of the sealing system are relatively high as well. According to Table 6, the initial total failure rate of the connector is 0.007, and the failure rate of the sealing system in the second-top event is higher than that of the guidance system, drag system, and locking system.
Due to the different failure probabilities of each bottom event, the impact on the second-top and top events is also different. Therefore, importance analysis should be carried out on the fault tree to identify weak links in the system and improve them. The importance analysis of the horizontal clamp connector includes probability importance analysis and critical importance analysis. Probability importance I i P reflects the impact of changes in the probability of bottom events on top events in the fault tree and can be expressed as [50]:
I i P = P T / P i ,
The critical importance I i c r or key importance refers to the rate of change in the probability of the top event caused by a change in the probability of a basic event. It reflects the degree of impact of improving the reliability of an event on the system and can be expressed as [51]:
I i c r = lim Δ P i 0 Δ P T P T / Δ P i P i = P i P T I i P ,
By using Equation (33) and combining it with the Weibull reliability function of the sealing system components, the importance of each failure event during the connector’s connection and service can be obtained. From Figure 17, it can be seen that the importance is concentrated at the bottom event of the sealing system. During the service process, the importance of the terminal flange failure event increased from 10.5% to 44.5%, the importance of the end flange failure event increased from 0.4% to 2.2%, and the importance of the sealing ring deformation event increased from 0.9% to 3.8%, while the importance of other events decreased.
The importance of basic events for each system can be obtained based on the basic event and top event probabilities of each system. From Figure 18, it can be seen that the importance of the piston rod extension length change is highest in the guiding system, the importance of the horizontal guiding column deformation is highest in the drag system, the importance of the flange mating surface deformation of the clamp pawl is highest in the locking system, and the importance of the sealing ring’s inability to adapt to temperature and load during connection status is highest in the sealing system, while it changes to the terminal flange failure event during service.
To analyze the failure rate of each system and the overall failure rate of the connector during service, the equations for exponential distribution without failure time and Weibull distribution without failure time can be used, i.e.,:
M T T F e = 1 λ i ,
M T T F w = γ + η Γ 1 β + 1 ,
Combining Equations (34) and (35), the failure probability of the connector is shown in Figure 19, where the failure probability of the connector corresponds to the right axis and the others correspond to the left axis. It can be seen that after 20 years of service, the overall failure rate of the connector has exceeded 60%, and the sealing system has a high contribution to its failure rate. In order to ensure the stable operation of the connector, regular maintenance such as replacing sealing rings and adding corrosion inhibitors should be carried out during service to reduce the failure rate of certain bottom events. The overall failure rate of the dragging system, locking system, and guiding system is not high, but the maintenance cost is high, so the failure events during installation should be given more attention.

5. Reliability Test

Improvements were made to the connector based on the high failure rate of the bottom event in the reliability analysis: (1) the O-ring model was changed from 160 × 3.1 to 150 × 3.5; (2) the minimum wall thickness of the connecting flange and terminal flange pipeline was increased from 17 mm to 20 mm; (3) the seal contact surface was inspected with a laser probe to ensure that any scratches were no deeper than 0.05 mm; (4) the diameter of the horizontal guide column was increased. The reliability test was conducted on the connectors that had already been processed and manufactured. The test targeted the top event in the fault tree. The reliability test included the following procedures: down guide test, connector drag test, connector locking test, and connector sealing test. The test plan followed experimental standards such as API 17R and API 6A. The significance of reliability testing in this paper is to identify design shortcomings of the connector through the test results and make secondary improvements, and to calibrate the analysis results of the reliability model through the test results.

5.1. Down Guide Test of the Connector Body

The schematic and on-site images of the connector body down guide test are shown in Figure 20. The specific operating steps are as follows:
(1) The connector body is hoisted, and the compatibility between the connector’s vertical guide and the guide column is confirmed. This step is repeated three times. (2) When the connector body is lifted above the frame, it is slowly lowered after being rotated to a maximum of 8 degrees in the horizontal direction. Confirm that the connector body can enter the frame’s horizontal guide slot. This step is repeated three times. The test data are shown in the Table 7.

5.2. Drag Tool Lowering Guide Test

After successful lowering of the connector body, the drag tool lowering guide test was conducted.
The specific steps of this test are as follows: Lift the drag tool so that the pull head of the drag tool enters the guide of the rack, and the positioning cylinder enters the groove of the end plate of the connector body. External devices may be used appropriately during the process, and this step is repeated three times. As shown in Figure 21, the installation process was smooth without any collisions, and the test results are shown in Table 8.

5.3. Connector Drag Test

To address the synchronization problem of the drag tool, a control group with no load was set up. The distance between the connector body marker and the rack marker was 350 mm. As shown in the Figure 22 and Table 9, the steps of the connector drag test are as follows: (1) Start the drag tool and shut off the oil source twice, record the drag distance of the double cylinders at this time. (2) Tighten the connector with a torque wrench. (3) After tightening is complete, use a gauge block to measure the distance between the upper and lower flanges and record it; repeat steps 1–3 three times.

5.4. Connector Installation and Removal Test

The steps of the connector installation and removal test are as follows: (1) Tighten the connector with a torque wrench, and the locking verification standard is that the gap between the upper and lower flanges is 0.5 mm. Record the torque required for tightening, and the test fixture is shown in Figure 23. (2) Unlock the connector and record the torque required for unlocking, without damage. (3) Repeat steps (1)~(2) 40 times.
The test results show that a torque of 2100 N·m is sufficient to lock the connector. However, from the perspective of reliability, the torque was applied up to 2200 N·m for the completion of the test and there was no wear or damage to the locking structure, indicating that the locking structure meets the reliability requirements.

5.5. Connector Sealing Test

Connector sealing tests include a hydrostatic test and a temperature–pressure cycling test. A hydrostatic test includes an internal chamber hydrostatic test and an external chamber hydrostatic test. The purpose of the internal chamber hydrostatic test is to test the internal pressure sealing, while the purpose of the external chamber hydrostatic test is to test the external pressure sealing. According to the hydrostatic test requirements in API 17D, the upper limit of hydrostatic test pressure should be 1.5 times the rated working pressure; when using pressure gauges, pressure recorders, and pressure recording platforms and other pressure display instruments, the pressure drop rate during each hour of the test should not exceed 3% or 300 psi of the test pressure, whichever is smaller.
  • Inner chamber hydrostatic test
The rated working pressure of the connector is 34.5 MPa, and the internal chamber hydrostatic pressure should be 51.75 MPa. The operation steps of this test are as follows: (1) Connect the connector hole blocked by the lower flange to the pressure pump. (2) When the pressure gauge reading reaches the rated working pressure of 34.5 MPa, stop the pressure pumping, maintain the pressure for 5 min after the pressure stabilizes, check whether the connector leaks, and record the pressure gauge data. (3) When the pressure gauge reading reaches the rated working pressure of 51.75 MPa, stop the pressure pumping, maintain the pressure for 15 min after the pressure stabilizes, check whether the connector leaks, and record the pressure gauge data. (4) Gradually reduce the pressure and disassemble the test device.
The schematic diagram of the internal pressure test and the test fixture are shown in Figure 24. The rated working pressure of the connector is 34.5 MPa, and the internal pressure should be 51.75 MPa. The test operation steps are as follows: (1) Connect the pressure pump to the connection hole blocked by the lower flange. (2) When the pressure gauge value reaches the rated working pressure of 34.5 MPa, stop the pressure, maintain pressure for 5 min after the pressure is stabilized, check whether there is leakage in the connector, and record the pressure gauge data. (3) When the pressure gauge value reaches the rated working pressure of 51.75 MPa, stop the pressure, maintain pressure for 15 min after the pressure is stabilized, check whether there is leakage in the connector, and record the pressure gauge data. (4) Gradually reduce the pressure and disassemble the test fixture.
The test results are shown in Table 10: when pressurized to the rated pressure, the pressure remained unchanged during the 5-min holding period; when pressurized to 1.5 times the rated pressure, the pressure dropped from 52.8 to 52.5 MPa during the 15 min holding period, with a pressure drop rate of 2.22% per hour. The pressure drop meets the acceptance criteria, proving that the internal sealing capability of the connector meets the engineering requirements.
2.
External chamber hydrostatic test
The schematic diagram of the external chamber pressure test is shown in Figure 25. Since the rated working depth of the connector is 1600 m and the water pressure at that depth is 16 MPa, the external chamber pressure value is set at 24 MPa, and the pressure drop should not exceed 0.72 MPa per hour. The operation steps of this test are as follows:
(1) Use an adapter to connect the connection hole at the upper flange to the pressure pump. (2) When the pressure gauge reading reaches the rated working pressure of 16 MPa, stop the pressure test, hold the pressure for 5 min after the pressure stabilizes, and check for any leakage at the connector. Record the pressure gauge reading. (3) When the pressure gauge reading reaches the rated working pressure of 24 MPa, stop the pressure test, hold the pressure for 15 min after the pressure stabilizes, and check for any leakage at the connector. Record the pressure gauge reading. (4) Gradually reduce the pressure and dismantle the test equipment.
Table 11 shows the test results: when pressurized to the rated pressure of 16 MPa, the pressure remains at 16.2 MPa until the end of the 5 min holding time without any change in pressure; when pressurized to 1.5 times the rated pressure, the pressure drops from 24.5 MPa to 24.4 MPa during the 15 min holding time, with a pressure drop rate of 1.63% per hour. The pressure drop meets the acceptance criteria for the test, demonstrating that the external chamber sealing capability of the connector meets the engineering requirements.

6. Conclusions

This article has improved the reliability model from the perspective of information acquisition. Currently, there are some studies on using inferior data for reliability modeling. In future research, if information acquisition can be regarded as strengthening the credibility of inferior data and integrating the already developed multi-source information reliability model, it will greatly improve the credibility of the model. For the acquisition of multi-source information, Effects and Criticality Analysis, Bayesian networks, and the use of Modelica language and reliability experiments can all improve the ability of reliability models to obtain multi-source information. The probability of connector bottom event failure obtained in this article can be integrated into higher-level information systems, such as the reliability study of underwater production systems, but the correlation between information and other system information needs to be considered when using it.
Based on the practical engineering background, this article has improved the reliability model by using a multi-source approach to obtain reliability information. It solves the problem of the lack of high-quality reliability information for deep-sea horizontal clamp connectors from the perspective of credibility. The innovation and achievements obtained are as follows:
(1)
According to the failure mechanism of the fault tree bottom event, this article divided its probability distribution model into exponential distribution, Weibull distribution, and mixed distribution. Combined with subjective and objective multi-source information such as prior product information, expert experience, and design information, the deep-sea horizontal clamp connector was quantitatively analyzed for reliability. Compared with other works on the reliability analysis of deep-sea connector, the research method used in this article fully considered the credibility of information and the limitations of expert experience and combined the reliability database of standard parts and design information to modify the reliability model. The results obtained include constant failure rate and time-varying failure rate of failure events, which are more in line with engineering facts.
(2)
Based on the fault tree model and the reliability characteristic model, the reliability analysis of the connector was carried out. The analysis results showed that the sealing system, drag system, guiding system, locking system, and overall failure rate of the connector are 3.3 × 10⁻³, 8 × 10⁻⁶, 4.5 × 10⁻⁵, 1.8 × 10⁻⁵, and 3.6 × 10⁻³, respectively. Under the influence of time-varying factors, the cumulative failure rate of the connector in 20 years will exceed 60%, so a monitoring system should be established for regular maintenance.
(3)
Based on the reliability analysis results, part of the structure of the connector is further improved, and the improved connector is subjected to a FAT. The FAT results show that the connector can meet the requirements of deep-sea applications. The design-reliability analysis-optimization closed-loop process proves the practicality of this reliability analysis, and a certain amount of prior information can be obtained through the test results to re-correct the analysis results of the reliability model.

Author Contributions

Conceptualization, F.Y.; methodology, F.Y.; validation, W.L.; formal analysis, L.W.; investigation, S.Y.; resources, S.Y.; data curation, W.L.; writing—original draft preparation, G.W.; writing—review and editing, W.L.; funding acquisition, L.W. All authors have read and agreed to the published version of the manuscript.

Funding

This research was funded by the Heilongjiang Provincial Natural Science Foundation of China, grant number LH2021E046; National Natural Science Foundation of China, grant number 52001089; China Postdoctoral Science Foundation, grant number 2020M670889.

Institutional Review Board Statement

Not applicable.

Informed Consent Statement

Not applicable.

Data Availability Statement

Not applicable.

Conflicts of Interest

The authors declare no conflict of interest.

References

  1. Yousuf, A.; Khan, M.R.; Islam, M.A.; Ab Wahid, Z.; Pirozzi, D. Technical difficulties and solutions of direct transesterification process of microbial oil for biodiesel synthesis. Biotechnol. Lett. 2017, 39, 13–23. [Google Scholar] [CrossRef]
  2. Yun, F.H.; Wang, G.; Yan, Z.P.; Jia, P.; Xu, X.J.; Wang, L.Q.; Sun, H.T.; Liu, W.F. Analysis of Sealing and Leakage Performance of the Subsea Collet Connector with Lens-Type Sealing Structure. J. Mar. Sci. Eng. 2020, 8, 444. [Google Scholar] [CrossRef]
  3. Li, Z.G.; Wang, Y.C.; Chen, Z.; Liu, J.; Li, Y.T.; Wang, L.Q. The Study of Underwater Connector Temperature Test Equipment. In Proceedings of the International Conference on Material Engineering and Mechanical Engineering (MEME), Hangzhou, China, 23–25 October 2015; pp. 20–31. [Google Scholar]
  4. Peng, F.; Duan, M.L.; Wang, J.L.; Zhu, Y.S.; Wang, X.D. Optimisation method for mathematical model of deepwater collet connector locking mechanism. Ships Offshore Struct. 2016, 11, 575–590. [Google Scholar] [CrossRef]
  5. Kato, N.; Choyekh, M.; Dewantara, R.; Senga, H.; Chiba, H.; Kobayashi, E.; Yoshie, M.; Tanaka, T.; Short, T. An autonomous underwater robot for tracking and monitoring of subsea plumes after oil spills and gas leaks from seafloor. J. Loss Prev. Process Ind. 2017, 50, 386–396. [Google Scholar] [CrossRef]
  6. Yu, F.J.; Xue, S.Y.; Zhao, Y.; Chen, G. Risk assessment of oil spills in the Chinese Bohai Sea for prevention and readiness. Mar. Pollut. Bull. 2018, 135, 915–922. [Google Scholar] [CrossRef] [PubMed]
  7. Rossi, R.J.; DiGiulio, D.C.; Shonkoff, S.B.C. An examination of onshore produced water spills in the state of California: Incident frequency, spatial distribution, and shortcomings in available data. Environ. Sci. Pollut. Res. 2023, 30, 18631–18642. [Google Scholar] [CrossRef]
  8. Gotoh, H.; Khayyer, A. On the state-of-the-art of particle methods for coastal and ocean engineering. Coast Eng. J. 2018, 60, 79–103. [Google Scholar] [CrossRef]
  9. Vanem, E.; Fazeres-Ferradosa, T.; Rosa-Santos, P.; Taveira-Pinto, F. Statistical description and modeling of extreme ocean wave conditions. Proc. Inst. Civil. Eng.-Marit. Eng. 2019, 172, 124–132. [Google Scholar]
  10. Banaszek, A.; Petrovic, R.; Zylinski, B. Finite element method analysis of pipe material temperature changes influence on line expansion loops in hydraulic installations on modern tankers. Therm. Sci. 2011, 15, 81–90. [Google Scholar] [CrossRef]
  11. Banaszek, A.; Losiewicz, Z.; Jurczak, W. Corrosion influence on safety of hydraulic pipelines installed on decks of contemporary product and chemical tankers. Pol. Marit. Res. 2018, 25, 71–77. [Google Scholar] [CrossRef]
  12. Kim, S.; Chung, S.; Yang, Y. Availability analysis of subsea blowout preventer using Markov model considering demand rate. Int. J. Nav. Archit. Ocean Eng. 2014, 6, 775–787. [Google Scholar] [CrossRef]
  13. Yun, F.H.; Wang, L.Q.; Yao, S.M.; Liu, J.; Liu, T.; Wang, R.H. Analytical and experimental study on sealing contact characteristics of subsea collet connectors. Adv. Mech. Eng. 2017, 9, 14. [Google Scholar] [CrossRef]
  14. Zhang, K.; Duan, M.; Luo, X.; Hou, G. A fuzzy risk matrix method and its application to the installation operation of subsea collet connector. J. Loss Prev. Process Ind. 2017, 45, 147–159. [Google Scholar] [CrossRef]
  15. Ifelebuegu, A.O.; Awotu-Ukiri, E.O.; Theophilus, S.C.; Arewa, A.O.; Bassey, E. The application of Bayesian—Layer of Protection Analysis method for risk assessment of critical subsea gas compression systems. Process Saf. Environ. Protect. 2018, 113, 305–318. [Google Scholar] [CrossRef]
  16. Zeng, W.; Ren, T.; Yu, L.J.; Huang, J.J. Design Optimization of a VX Gasket Structure for a Subsea Connector Based on the Kriging Surrogate Model-NSGA-II Algorithm Considering the Load Randomness. Algorithms 2019, 12, 42. [Google Scholar] [CrossRef]
  17. Wang, Y.Y.; Luo, W.T.; Liu, S.J.; Feng, H.Z.; Li, J.C.; Wang, J.J. A model for reliability assessment of sealing performance of the C-shaped metal sealing ring at the outlet of the subsea tubing hanger. Ocean Eng. 2022, 243, 13. [Google Scholar] [CrossRef]
  18. Duan, M.L.; Zhang, K.; Soares, C.G.; Paik, J.K. Theoretical investigation on hub structure design of subsea connectors. Thin-Walled Struct. 2021, 159, 15. [Google Scholar] [CrossRef]
  19. Wang, Y.Y.; Chen, Z.H.; Yan, Q.; Hu, Y.D.; Wang, C.; Luo, W.T.; Cai, B.P. A dynamic failure analysis methodology for fault diagnosis of fatigue cracks of subsea wellhead connectors with material aging. Process Saf. Environ. Protect. 2022, 159, 35–52. [Google Scholar] [CrossRef]
  20. Pang, N.; Jia, P.; Liu, P.; Yin, F.; Wang, X.J.A.S. A Fuzzy Markov Model for Risk and Reliability Prediction of Engineering Systems: A Case Study of a Subsea Wellhead Connector. Appl. Sci. 2020, 10, 6902. [Google Scholar] [CrossRef]
  21. Nor, A.K.M.; Pedapati, S.R.; Muhammad, M. Reliability engineering applications in electronic, software, nuclear and aerospace industries: A 20 year review (2000–2020). Ain Shams Eng. J. 2021, 12, 3009–3019. [Google Scholar] [CrossRef]
  22. Rausand, M.; Barros, A.; Hoyland, A. System Reliability Theory: Models, Statistical Methods, and Applications; John Wiley & Sons: Hoboken, NJ, USA, 2020. [Google Scholar]
  23. Verma, A.K.; Ajit, S.; Karanki, D.R.J.S. Reliability and Safety Engineering; Springer: London, UK, 2016. [Google Scholar]
  24. Leahy, K.; Gallagher, C.; O’Donovan, P.; O’Sullivan, D.T.J. Issues with Data Quality for Wind Turbine Condition Monitoring and Reliability Analyses. Energies 2019, 12, 201. [Google Scholar] [CrossRef]
  25. An, J.Q.; Wu, M.; He, Y. A temperature field detection system for blast furnace based on multi-source information fusion. Intell. Autom. Soft Comput. 2013, 19, 625–634. [Google Scholar] [CrossRef]
  26. Peng, C.; Cai, Y.Z.; Liu, G.P.; Liao, T.W. Developing a Reliability Model of CNC System under Limited Sample Data Based on Multisource Information Fusion. Math. Probl. Eng. 2020, 2020, 10. [Google Scholar] [CrossRef]
  27. Xu, Y.C.; Yao, W.; Zheng, X.H.; Chen, X.Q. Satellite System Design Optimization Based on Bayesian Melding of Multi-Level Multi-Source Lifetime Information. IEEE Access 2019, 7, 103505–103516. [Google Scholar] [CrossRef]
  28. Zhao, Q.; Jia, X.; Guo, B.; Cheng, Z.J. Real-time Bayes Estimation of Residual Life Based on Multisource Information Fusion. In Proceedings of the Prognostics and System Health Management Conference (PHM-Chongqing), Chongqing, China, 26–28 October 2018; pp. 215–222. [Google Scholar]
  29. Salomon, J.; Winnewisser, N.; Wei, P.F.; Broggi, M.; Beer, M. Efficient reliability analysis of complex systems in consideration of imprecision. Reliab. Eng. Syst. Saf. 2021, 216, 14. [Google Scholar] [CrossRef]
  30. Jia, X.; Cheng, Z.J.; Guo, B. Reliability analysis for system by transmitting, pooling and integrating multi-source data. Reliab. Eng. Syst. Saf. 2022, 224, 16. [Google Scholar] [CrossRef]
  31. Wei, Z.L.; Wang, L.Q.; Guan, Y.; Yao, S.M.; Li, S.K. Static metal sealing mechanism of a subsea pipeline mechanical connector. Adv. Mech. Eng. 2016, 8, 16. [Google Scholar] [CrossRef]
  32. Merle, G.; Roussel, J.M.; Lesage, J.J. Algebraic determination of the structure function of Dynamic Fault Trees. Reliab. Eng. Syst. Saf. 2011, 96, 267–277. [Google Scholar] [CrossRef]
  33. Grodzenskii, S.Y.; Domrachev, V.G. A universal distribution for component failure times. Meas. Tech. 2002, 45, 710–713. [Google Scholar] [CrossRef]
  34. John, B. Treatment System Hydraulics; American Society of Civil Engineers: Reston, VA, USA, 2008. [Google Scholar]
  35. Yu, W.B.; Zhang, T.Q.; Lu, Y.; Han, F.L.; Zhou, Y.F.; Hu, D. Engineering risk analysis in cold regions: State of the art and perspectives. Cold Reg. Sci. Tech. 2020, 171, 18. [Google Scholar] [CrossRef]
  36. Bansal, S.; Gutierrez, G.J.; Keiser, J.R. Using Experts’ Noisy Quantile Judgments to Quantify Risks: Theory and Application to Agribusiness. Oper. Res. 2017, 65, 1115–1130. [Google Scholar] [CrossRef]
  37. Derbel, I.; Hachani, N.; Ounelli, H.; Ieee Computer, S.O.C. Membership Functions Generation Based on Density Function. In Proceedings of the International Conference on Computational-Intelligence and Security, Suzhou, China, 13–17 December 2008; pp. 96–101. [Google Scholar]
  38. Smith, E.D.; Siefert, W.T.; Drain, D. Risk Matrix Input Data Biases. Syst. Eng. 2009, 12, 344–360. [Google Scholar] [CrossRef]
  39. OREAD 2015; OREAD Participants: Bærum, Norway, 2015; p. 643.
  40. Googan, C. Marine Corrosion and Cathodic Protection; CRC Press: Boca Raton, FL, USA, 2022. [Google Scholar]
  41. Mohd, M.H.; Lee, B.J.; Cui, Y.; Paik, J.K. Residual strength of corroded subsea pipelines subject to combined internal pressure and bending moment. Ships Offshore Struct. 2015, 10, 554–564. [Google Scholar] [CrossRef]
  42. Féron, D. Marine Corrosion of Stainless Steels; CRC Press: Boca Raton, FL, USA, 2021. [Google Scholar]
  43. Zhang, X.H.; Chen, B.Q.; Soares, C.G. Effect of non-symmetrical corrosion imperfection on the collapse pressure of subsea pipelines. Mar. Struct. 2020, 73, 16. [Google Scholar] [CrossRef]
  44. Mansfeld, F.B. Corrosion Mechanisms; CRC Press: Boca Raton, FL, USA, 2020. [Google Scholar]
  45. Bijan, K. Recommended Practice for Corrosion Management of Pipelines in Oil & Gas Production and Transportation; Taylor and Francis: Boca Raton, FL, USA; CRC Press: Boca Raton, FL, USA, 2017. [Google Scholar]
  46. Sakakibara, N.; Kyriakides, S.; Corona, E. Collapse of partially corroded or worn pipe under external pressure. Int. J. Mech. Sci. 2008, 50, 1586–1597. [Google Scholar] [CrossRef]
  47. Hopkins, P.J.U.P.C. Assessing the significance of corrosion in onshore oil and gas pipelines. In Underground Pipeline Corrosion; Woodhead Publishing: Sawston, UK, 2014; pp. 62–84. [Google Scholar]
  48. Mousavi, S.S.; Moghaddam, A.S. Failure pressure estimation error for corroded pipeline using various revisions of ASME B31G. Eng. Fail. Anal. 2020, 109, 8. [Google Scholar] [CrossRef]
  49. Yang, W.G.; Lin, L.H.; Gao, H.K. Simulation evaluation of small samples based on grey estimation and improved bootstrap. Grey Syst. 2022, 12, 376–388. [Google Scholar] [CrossRef]
  50. Zheng, J.J.; Okamura, H.; Dohi, T. Component Importance Analysis of Virtualized System. In Proceedings of the IEEE 9th International Conference on Ubiquitous Intelligence and Computing (UIC)/IEEE 9th International Conference on Autonomic and Trusted Computing (ATC), Fukuoka, Japan, 4–7 September 2012; pp. 462–469. [Google Scholar]
  51. Hromada, M.; Lukas, L.; IEEE. The status and importance of robustness in the process of critical infrastructure resilience evaluation. In Proceedings of the 13th IEEE International Conference on Technologies for Homeland Security (HST), Waltham, MA, USA, 12–14 November 2013; pp. 589–594. [Google Scholar]
Figure 1. The process of reliability analysis for deep-sea horizontal clamp connectors.
Jmse 11 00986 g001
Figure 2. Structural Form of the Deep-sea Horizontal Clamp Connector.
Jmse 11 00986 g002
Figure 3. Working Process of the Deep-sea horizontal Clamp Connector.
Jmse 11 00986 g003
Figure 4. Fault Tree Analysis of the Deep-sea Horizontal Clamp Connector.
Jmse 11 00986 g004
Figure 5. Quantitative Analysis Process of Connector Reliability.
Jmse 11 00986 g005
Figure 6. Risk Matrix.
Jmse 11 00986 g006
Figure 7. Corresponding Membership Function.
Jmse 11 00986 g007
Figure 8. Stress Analysis of Sealing Structure.
Jmse 11 00986 g008
Figure 9. Effect of Corrosion Inhibitors on Corrosion Protection.
Jmse 11 00986 g009
Figure 10. Parameterized Simplified Model of Flange.
Jmse 11 00986 g010
Figure 11. Mesh quality.
Jmse 11 00986 g011
Figure 12. Loads and Boundary Conditions of Connecting Flange.
Jmse 11 00986 g012
Figure 13. Finite Element Results.
Jmse 11 00986 g013
Figure 14. Equivalent Stress of Corrosion Defect Area.
Jmse 11 00986 g014
Figure 15. Bottom Event Failure Rate.
Jmse 11 00986 g015
Figure 16. Intermediate Event Failure Rate.
Jmse 11 00986 g016
Figure 17. Bottom Event Importance.
Jmse 11 00986 g017
Figure 18. System Importance.
Jmse 11 00986 g018
Figure 19. Failure Rate Variation Over Time.
Jmse 11 00986 g019
Figure 20. Schematic and on-site of the down Guide Test.
Jmse 11 00986 g020
Figure 21. Connector Drag Tool Lowering Test Site.
Jmse 11 00986 g021
Figure 22. Schematic and on-site Images of the Drag Test.
Jmse 11 00986 g022
Figure 23. On-site Fixture for Locking Test.
Jmse 11 00986 g023
Figure 24. The Principle of the Internal Pressure Test and the on-site Fixture.
Jmse 11 00986 g024
Figure 25. Principle and on-site Equipment for External Chamber Pressure Test.
Jmse 11 00986 g025
Table 1. Fault Tree Events.
CodeEventCodeEventCodeEvent
TConnector failureM29Flange connection failureX25Horizontal guide column bolt failure
M1Guide system failureM30Seal ring failureX26Insufficient torque wrench torque
M2Drag system failureM31Terminal flange failureX27ROV base deformation
M3Locking system failureM32Anti-loosening structure failureX28ROV base connection bolt failure
M4Sealing system failureM33Flange connection structure failureX29Locking bolt deformation
M5Body guide failureX1Guide column base deformationX30Locking bolt thread slipping
M6Drag tool guide failureX2Guide column body deformationX31Groove screw deformation
M7Guide column failureX3Guide horn mouth deformationX32Groove deformation
M8Guide diagonal plate failureX4Guide diagonal plate deformationX33Ear axis thread slipping
M9Drag tool guide failureX5Piston rod extension length changeX34Ear axis deformation
M10Frame guide failureX6Hydraulic cylinder flange deformationX35Clamp petal deformation
M11Frame drag fixed end failureX7Cylinder body guide deformationX36Connection shaft deformation
M12Drag tool failureX8Hydraulic cylinder head fixed end deformationX37Pin shaft deformation
M13Body structure failureX9Flange connection bolt deformationX38Flange mating surface deformation
M14Hydraulic cylinder structure failureX10Frame drag fixed end deformationX39Connection bolt failure
M15Hydraulic system failureX11Cylinder barrel positioning block screw failureX40Slope inclination angle is too small
M16Cylinder barrel positioning block failureX12Cylinder barrel positioning block deformationX41Seal surface damage
M17Hydraulic cylinder head failureX13Hydraulic cylinder head welding failureX42Terminal flange deformation
M18Control circuit failureX14Hydraulic cylinder head pull head deformationX43Terminal flange pipeline rupture
M19Horizontal guide column failureX15Piston rod deformationX44Seal surface damage
M20Torque transmission failureX16Hydraulic system leakageX45Terminal flange deformation
M21Torque conversion failureX17Stop valve failureX46Terminal flange pipeline rupture
M22Clamp structure failureX18Speed control valve failureX47Seal ring seal surface scratches
M23ROV base failureX19Relief valve failureX48O-ring deformation
M24Locking bolt failureX20Reversing valve failureX49Unable to adapt to temperature and load changes
M25Sliding groove failureX21Flow distribution valve failureX50Seal ring deformation
M26Ear axis failureX22Hydraulic flying head malfunctionX51Anti-loosening block reversal
M27Clamp petal failureX23Outer end plate deformation
M28Clamp claw failureX24Horizontal guide column deformation
Table 2. Expert Weight.
DeterminantDeterminants
Evaluation TermWeight WiRankWeight Vij
Title4Professor/Associate Professor (Senior Engineer)/Engineer/Technician4/3/2/1
Engaged in this industry for over (years)3≥20/10~19/5~9/<54/3/2/1
Education2Doctoral/Master’s/Undergraduate/Junior College/Vocational and Technical School5/4/3/2/1
Age1Over 50 years old/40–49 years old/30–39 years old/Under 30 years old4/3/2/1
Table 3. Expert Information.
Expert Serial NumberProfessional TitleEducationAgeEngaged in This Industry for over (Years)
Expert 1TechnicianMaster’s386
Expert 2Associate ProfessorDoctoral5220
Expert 3ProfessorDoctoral5926
Expert 4EngineerJunior College5731
Expert 5TechnicianUndergraduate4214
Expert 6Senior EngineerMaster’s5517
Expert 7Senior EngineerUndergraduate4715
Table 4. Expert scoring.
CodeExpert Fuzzy LanguagesCodeExpert Fuzzy Languages
12345671234567
X1VLLVLVLLVLVLX28VLLVLVLVLVLVL
X2VLVLVLLVLVLVLX29LLVLLLLL
X3VLVLVLLVLVLVLX30LLLLLLL
X4VLLVLVLLVLVLX31VLVLVLVLLVLVL
X5LVLLLVLFLLX32VLVLVLVLVLLL
X6LVLLLLLVLX33VLVLVLVLLVLVL
X7VLLVLVLVLVLVLX34LLVLLLLVL
X8LVLVLLFLLVLX35LVLVLVLVLLL
X9VLVLVLVLLVLLX36VLVLLVLLVLVL
X10VLVLLLLVLLX37VLVLVLVLVLVLVL
X11VLVLVLVLVLVLVLX38LLLLLFLVL
X12LVLVLLVLLVLX39VLVLVLVLVLVLVL
X13LVLFLVLVLLVLX40LVLVLVLVLLL
X14VLVLLVLVLVLLX41VLLVLVLVLVLVL
X15VLVLVLVLVLVLVLX42LVLLVLVLLVL
X22VLLVLLVLVLVLX44VLLVLVLVLVLVL
X23VLVLVLVLVLVLVLX45VLLVLLVLLVL
X24VLLFLFLLFLLX47VLLVLVLVLVLVL
X25VLLLVLLFLLX48LLLVLLLVL
X26VLVLVLLVLVLVLX49VLVLVLVLVLLVL
X27LLVLVLVLVLVLX51VLVLVLVLVLVLVL
Table 5. Bottom Event Failure Probability.
RiskProbabilityRiskProbabilityRiskProbabilityRiskProbabilityRiskProbability
X11.38 × 10−6X112.78 × 10−8X211 × 10−7X318.95 × 10−8X412.94 × 10−4
X26.07 × 10−7X121.99 × 10−6X221.68 × 10−7X323.17 × 10−7X427.56 × 10−4
X36.07 × 10−7X135.54 × 10−6X232.78 × 10−8X338.95 × 10−8X43 e t 73.8 20 1.97 + e 3 × 10 5 t
X41.38 × 10−6X141.66 × 10−6X241.83 × 10−5X341.02 × 10−6X442.94 × 10−4
X56.48 × 10−6X152.78 × 10−8X256.73 × 10−6X354.51 × 10−7X454.01 × 10−4
X63.49 × 10−6X165.06 × 10−6X261.15 × 10−7X363.16 × 10−7X46 e t 81.2 20 1.99 + e 3 × 10 5 t
X72.78 × 10−8X179 × 10−6X273.03 × 10−7X378.95 × 10−8X472.94 × 10−4
X83.95 × 10−8X185.7 × 10−6X281.70 × 10−7X381.90 × 10−6X486.96 × 10−4
X91.21 × 10−6X196.8 × 10−6X299.87 × 10−7X398.95 × 10−8X493.5 × 10−3
X102.78 × 10−6X204.2 × 10−6X301.29 × 10−7X404.51 × 10−7X50 e t 83.2 20 2 .
X514.83 × 10−5
Table 6. Probability of failure for top and intermediate events (t = 0).
RiskProbabilityRiskProbabilityRiskProbabilityRiskProbabilityRiskProbability
T7.17 × 10−3M71.98 × 10−6M149.24 × 10−6M212.94 × 10−6M282.07 × 10−6
M11.40 × 10−5M81.21 × 10−6M154.09 × 10−5M222.93 × 10−6M291.81 × 10−4
M27.92 × 10−5M92.78 × 10−6M162.01 × 10−6M234.73 × 10−7M307.25 × 10−4
M36.46 × 10−6M106.73 × 10−8M175.56 × 10−6M241.26 × 10−6M314.55 × 10−3
M46.8 × 10−3M113.99 × 10−6M182.68 × 10−5M257.06 × 10−7M322.64 × 10−8
M53.97 × 10−6M125.01 × 10−5M192.50 × 10−5M261.10 × 10−6M331.51 × 10−3
M61.00 × 10−5M132.50 × 10−5M205.88 × 10−7M277.67 × 10−7M344.31 × 10−4
Table 7. Connector Docking Test.
Test Data1st Time (s)2nd Time (s)3rd Time (s)Average Time (s)Remarks
Lower Along Guide Column34383937Successful
Enter Horizontal Guide Slot56786566.3Successful
Table 8. Connector Drag Tool Lowering Test Data.
Test Data1st Time (s)2nd Time (s)3rd Time (s)Average Time (s)Remarks
Lower Drag Tool871067589.3Successful
Table 9. Drag Test Data.
No.Test PointCylinder 1 (mm)Cylinder 2 (mm)Difference (mm)Gap between Upper and Lower Flanges (mm)Control Cylinder 1 (mm)Control Cylinder 2 (mm)Difference (mm)
1point 182.982.70.20.5141.3132.48.9
point 2267.2266.80.4279.4269.310.1
End350.0349.60.4350.0336.513.5
2point 1107.5107.40.10.5101.492.88.6
point 2233.2233.10.1304.7292.012.7
End350.0349.80.2350.0335.814.2
3point 155.455.400.576.570.75.8
point 2203.5203.30.2143.9135.68.3
End350.0349.70.3350.0337.312.7
Table 10. Internal Hydrostatic Pressure Test Data.
No.Pressure Percentage (%)Theoretical Pressure (MPa)Test Pressure (MPa)Holding Time (min)Final Pressure (MPa)Pressure Drop per Hour (%)
110034.534.9534.90
215051.7552.81552.52.22
Table 11. Data From the External Chamber Hydrostatic Pressure Test.
No.Pressure Percentage (%)Theoretical Pressure (MPa)Test Pressure (MPa)Holding Time (min)Final Pressure (MPa)Pressure Drop per Hour (%)
11001616.2516.20
21502424.51524.41.63
Disclaimer/Publisher’s Note: The statements, opinions and data contained in all publications are solely those of the individual author(s) and contributor(s) and not of MDPI and/or the editor(s). MDPI and/or the editor(s) disclaim responsibility for any injury to people or property resulting from any ideas, methods, instructions or products referred to in the content.

