
Influence of Beach Erosion during Wave Action in Designed Artificial Sandy Beach Using XBeach Model: Profiles and Shoreline
Abstract
:1. Introduction
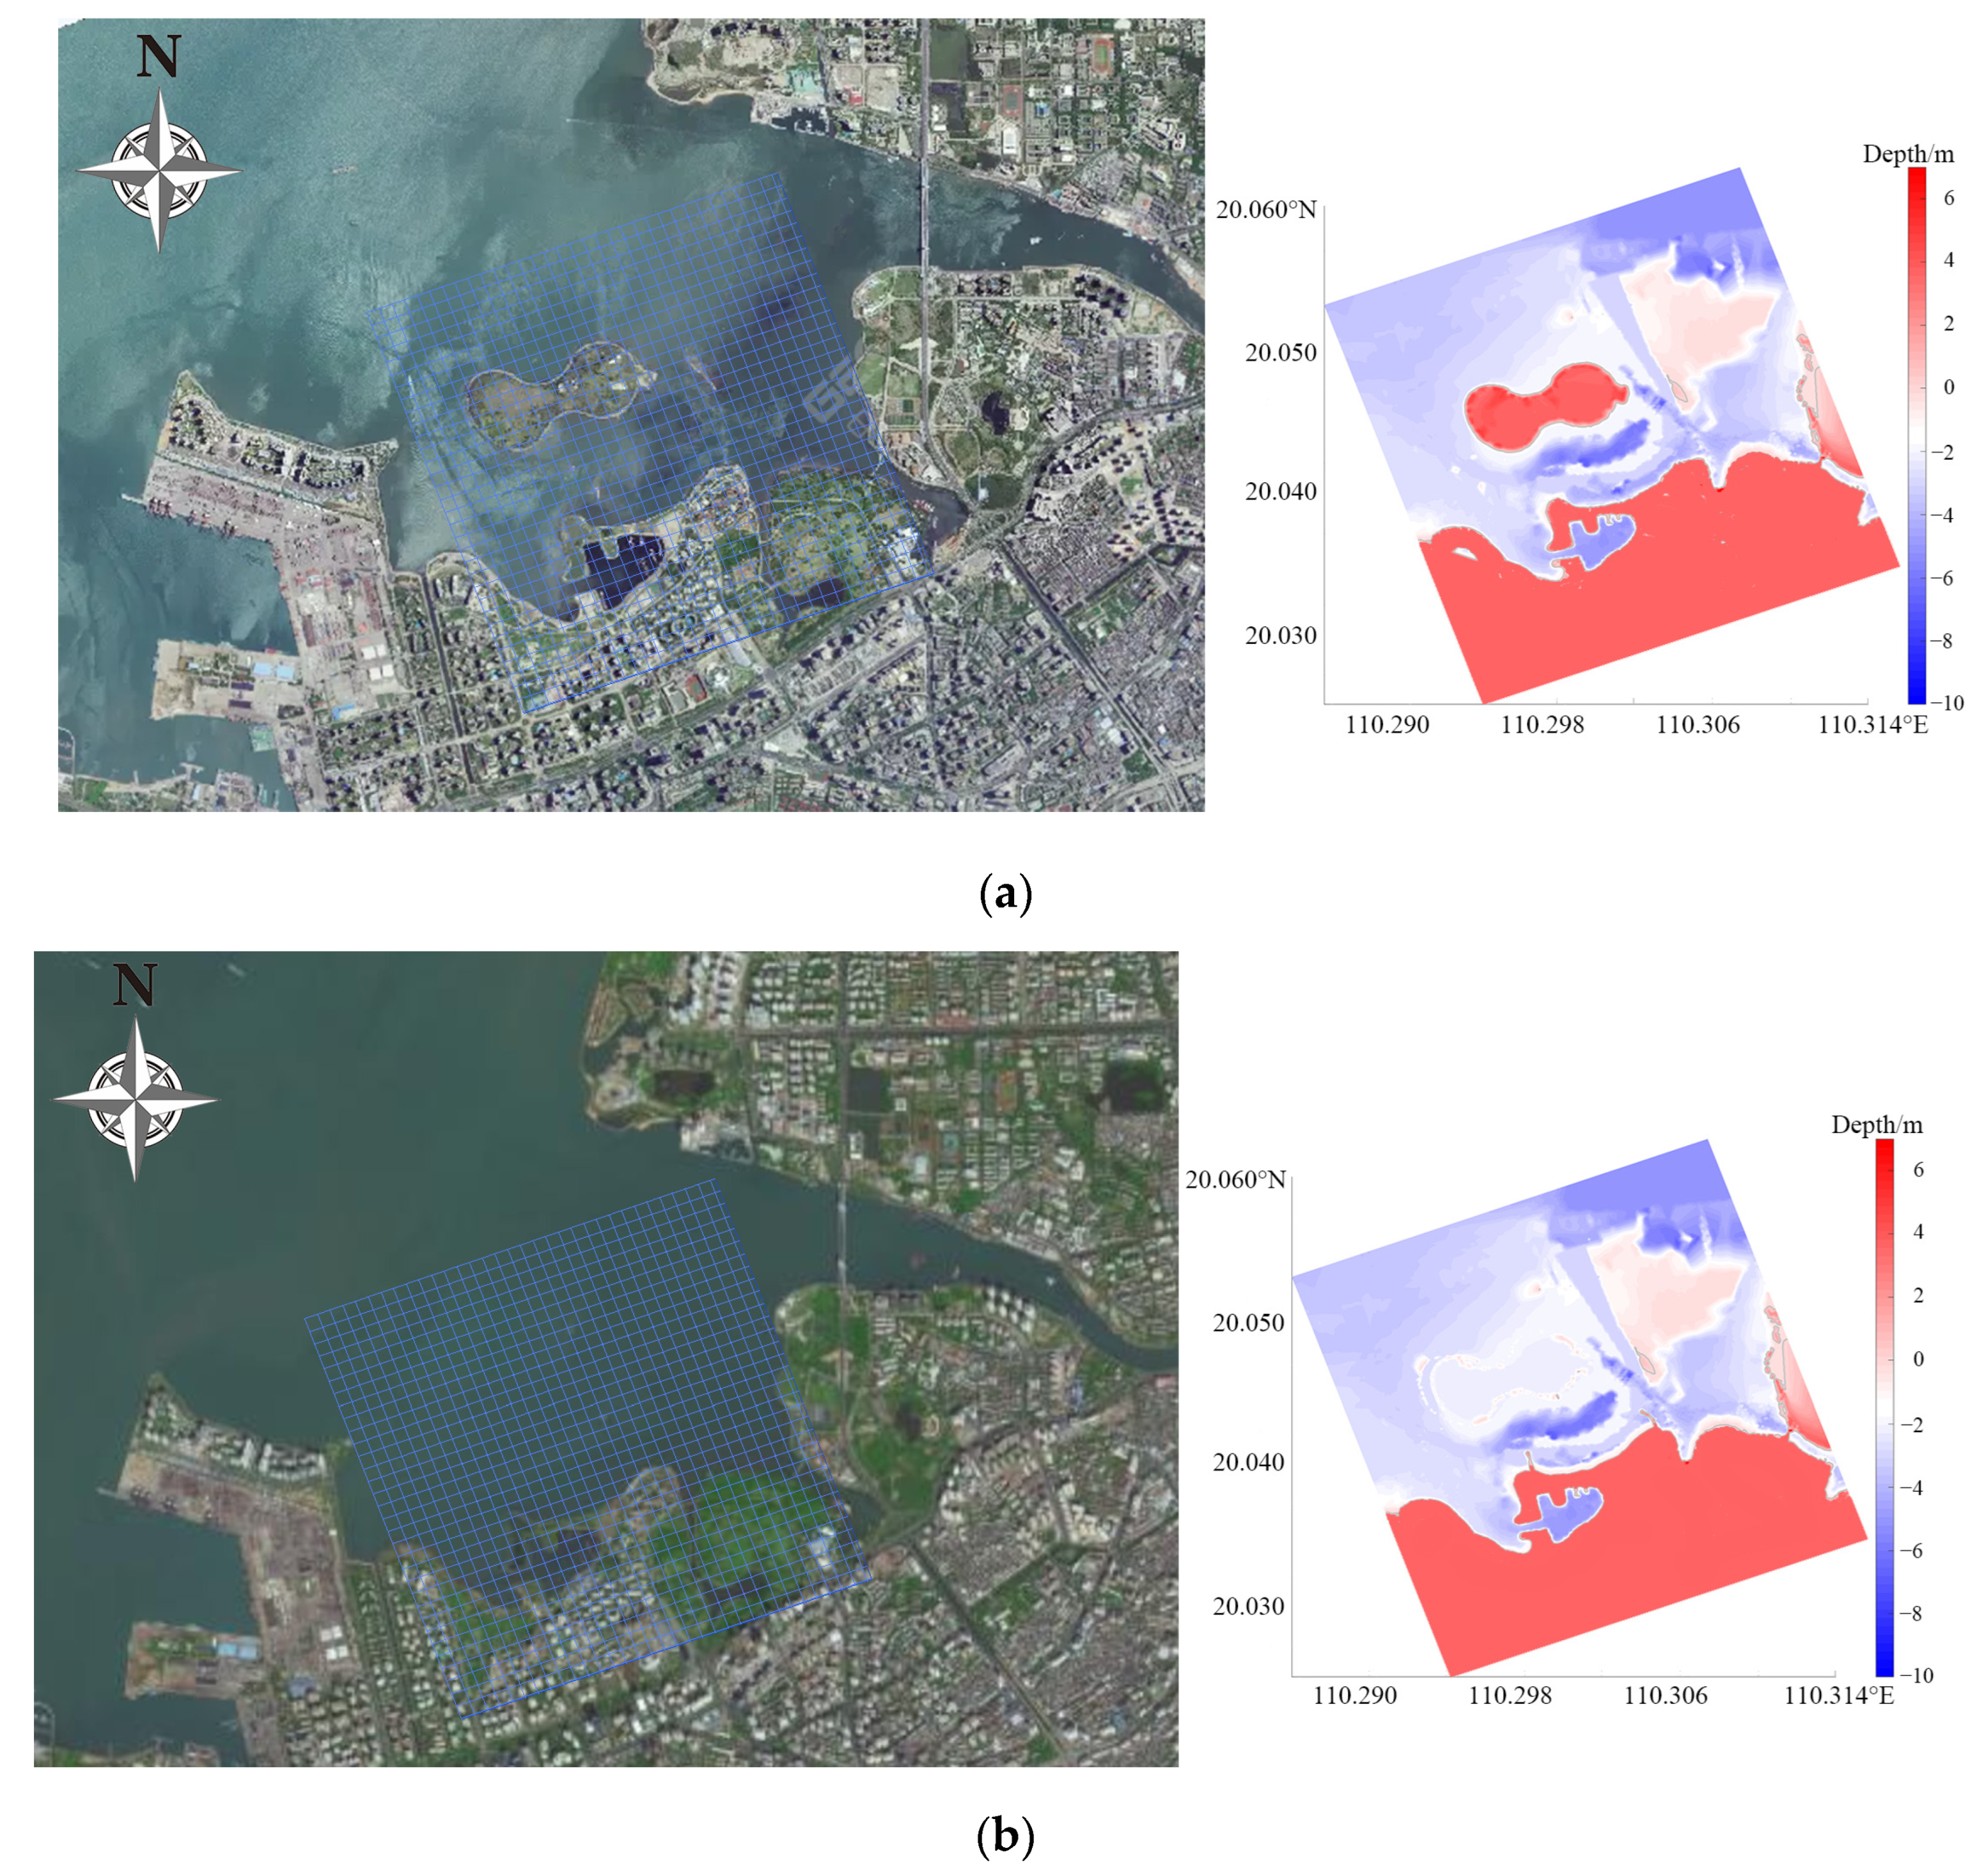
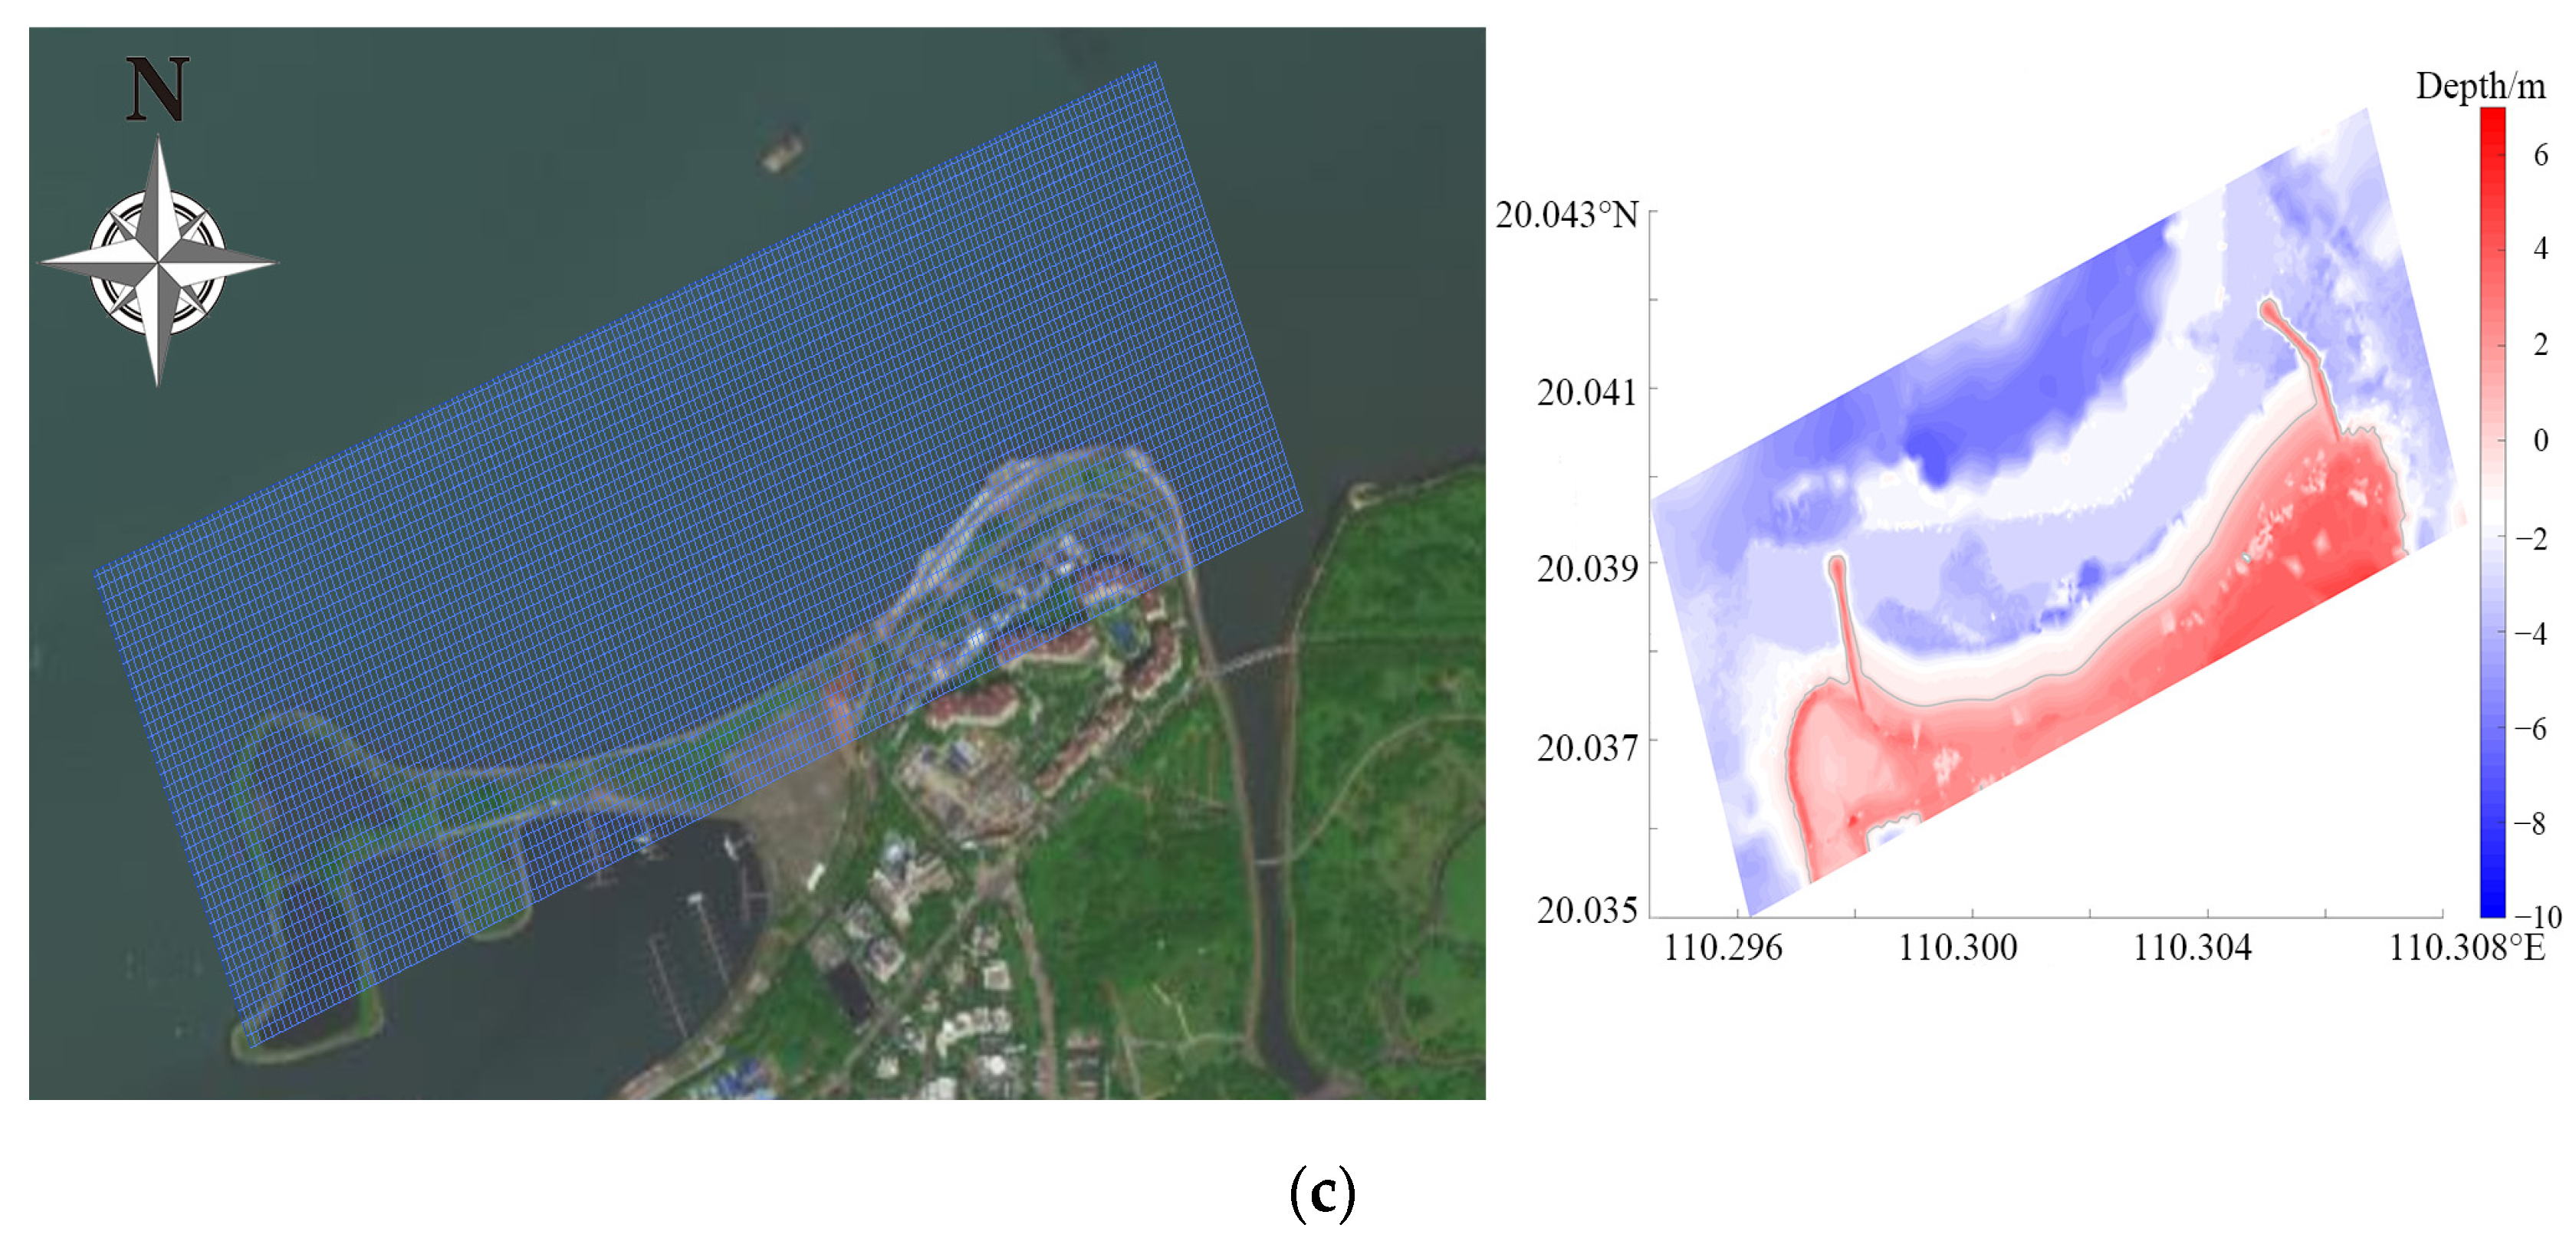
2. Study Site
3. Methods
3.1. Model Setup
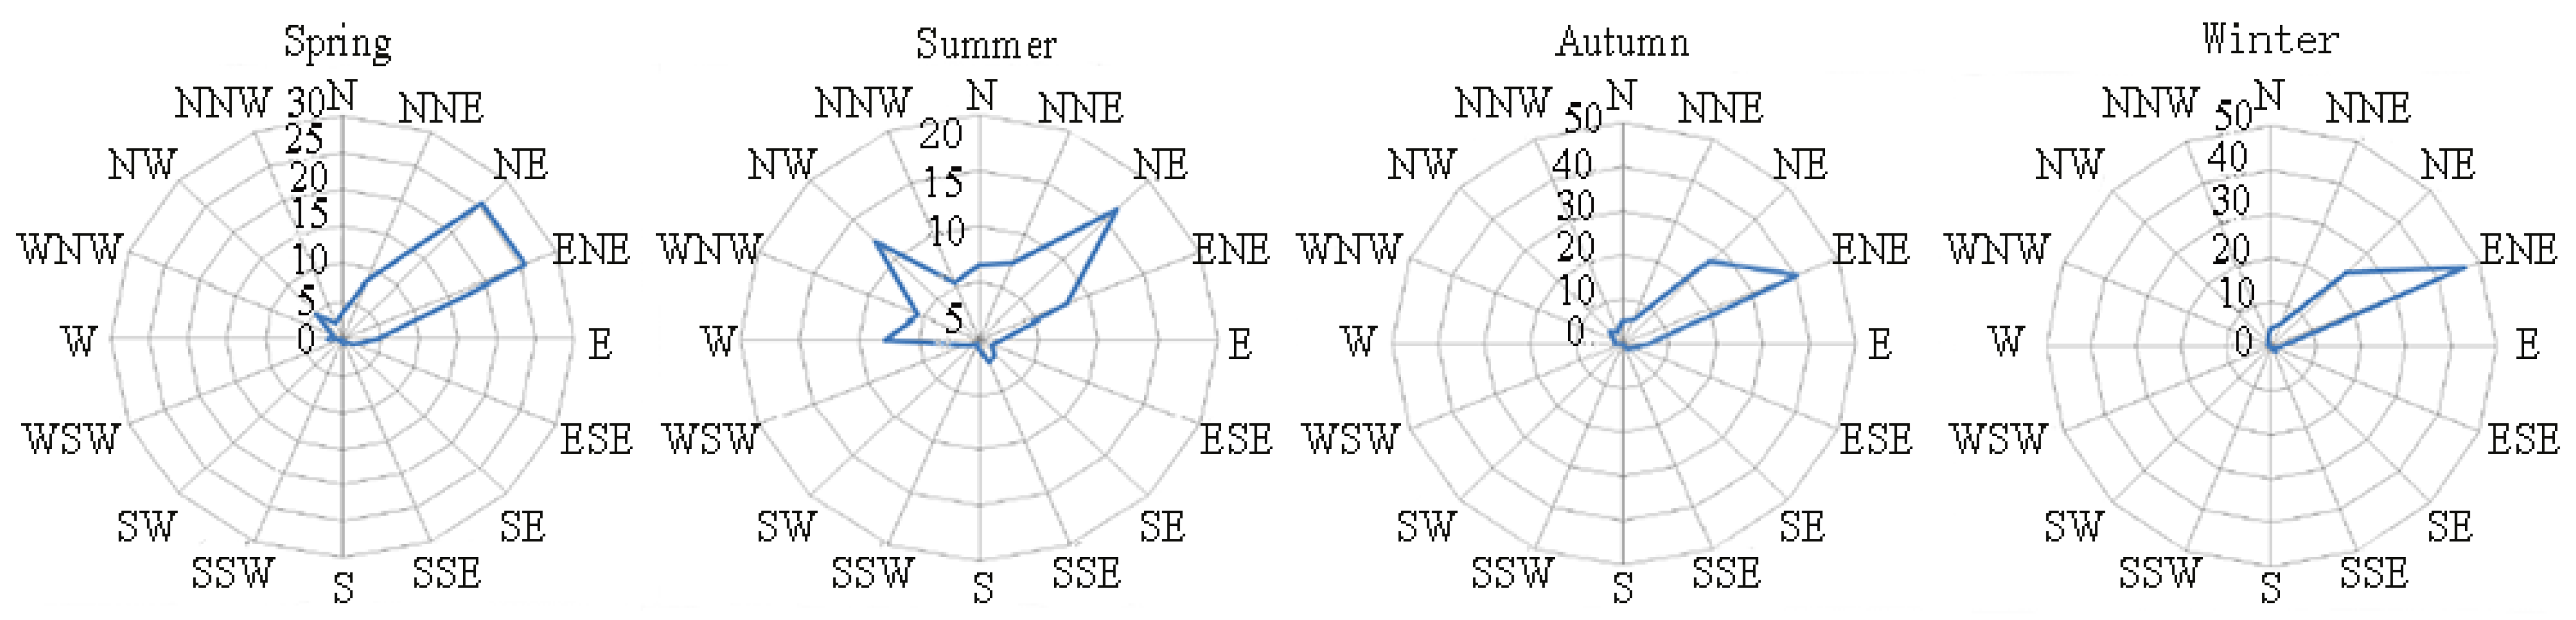
3.2. Wave Scenarios
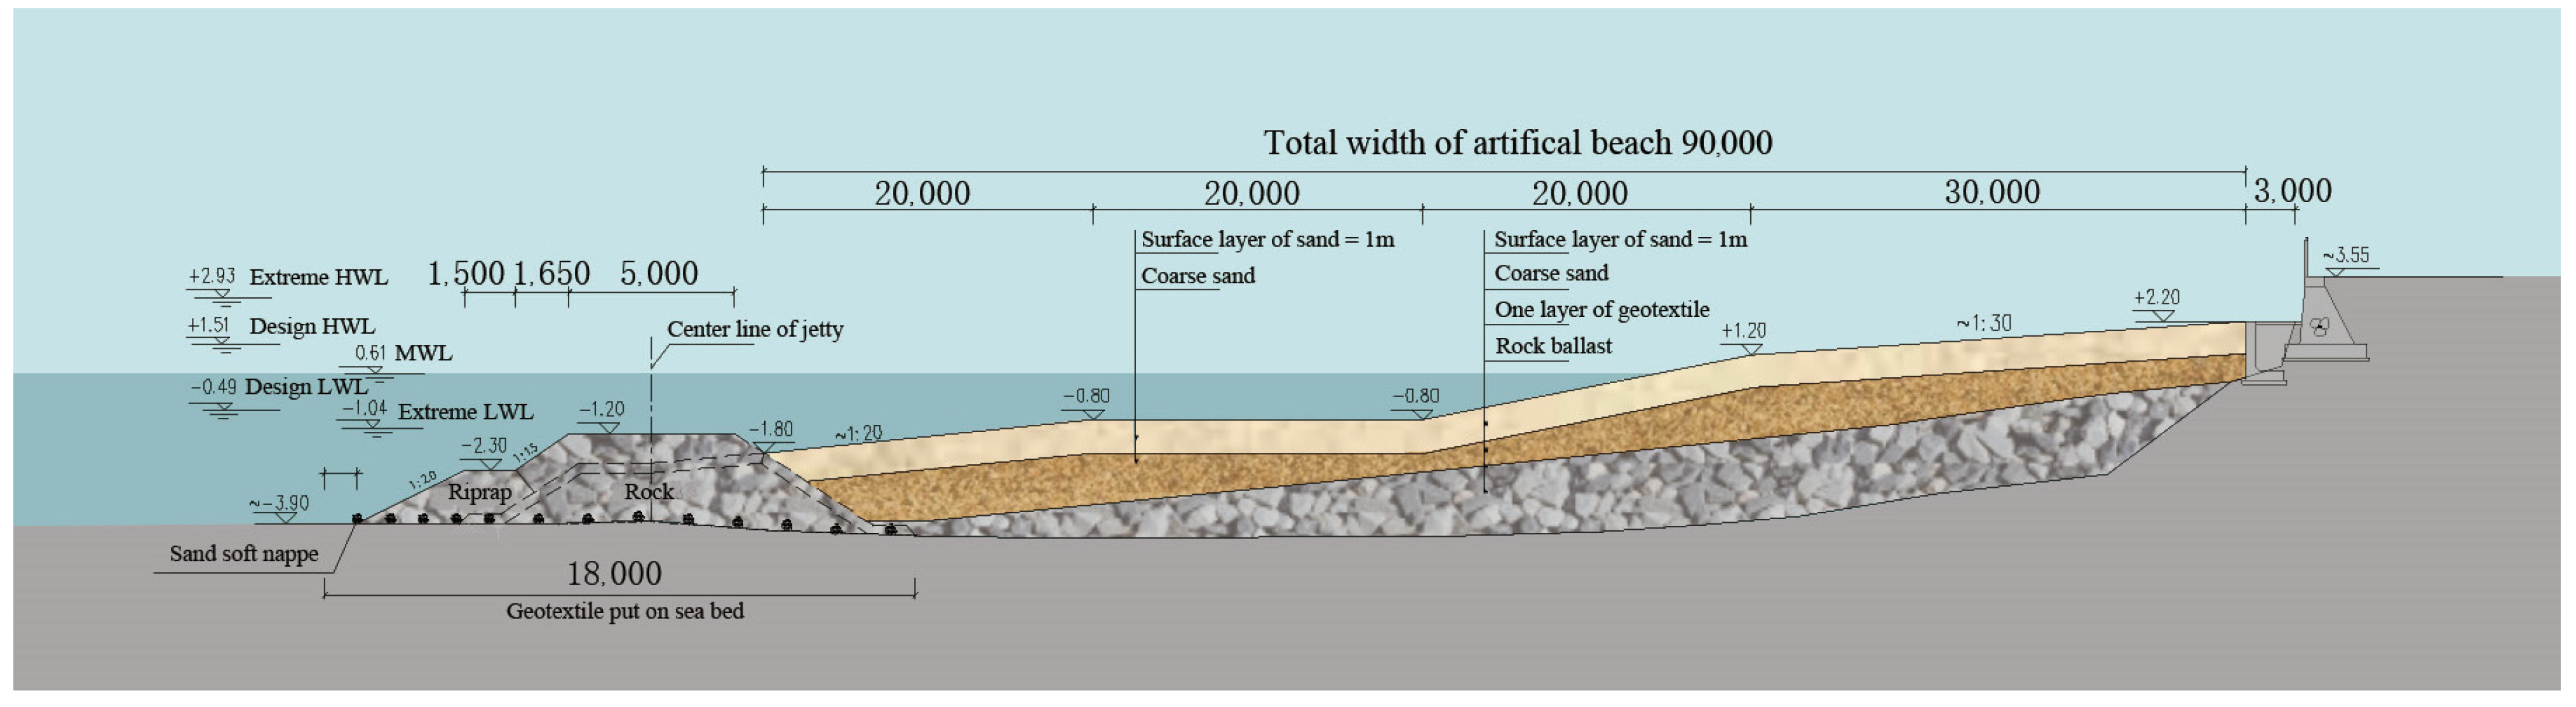
4. Feasibility Analysis of Engineering Construction
5. Results
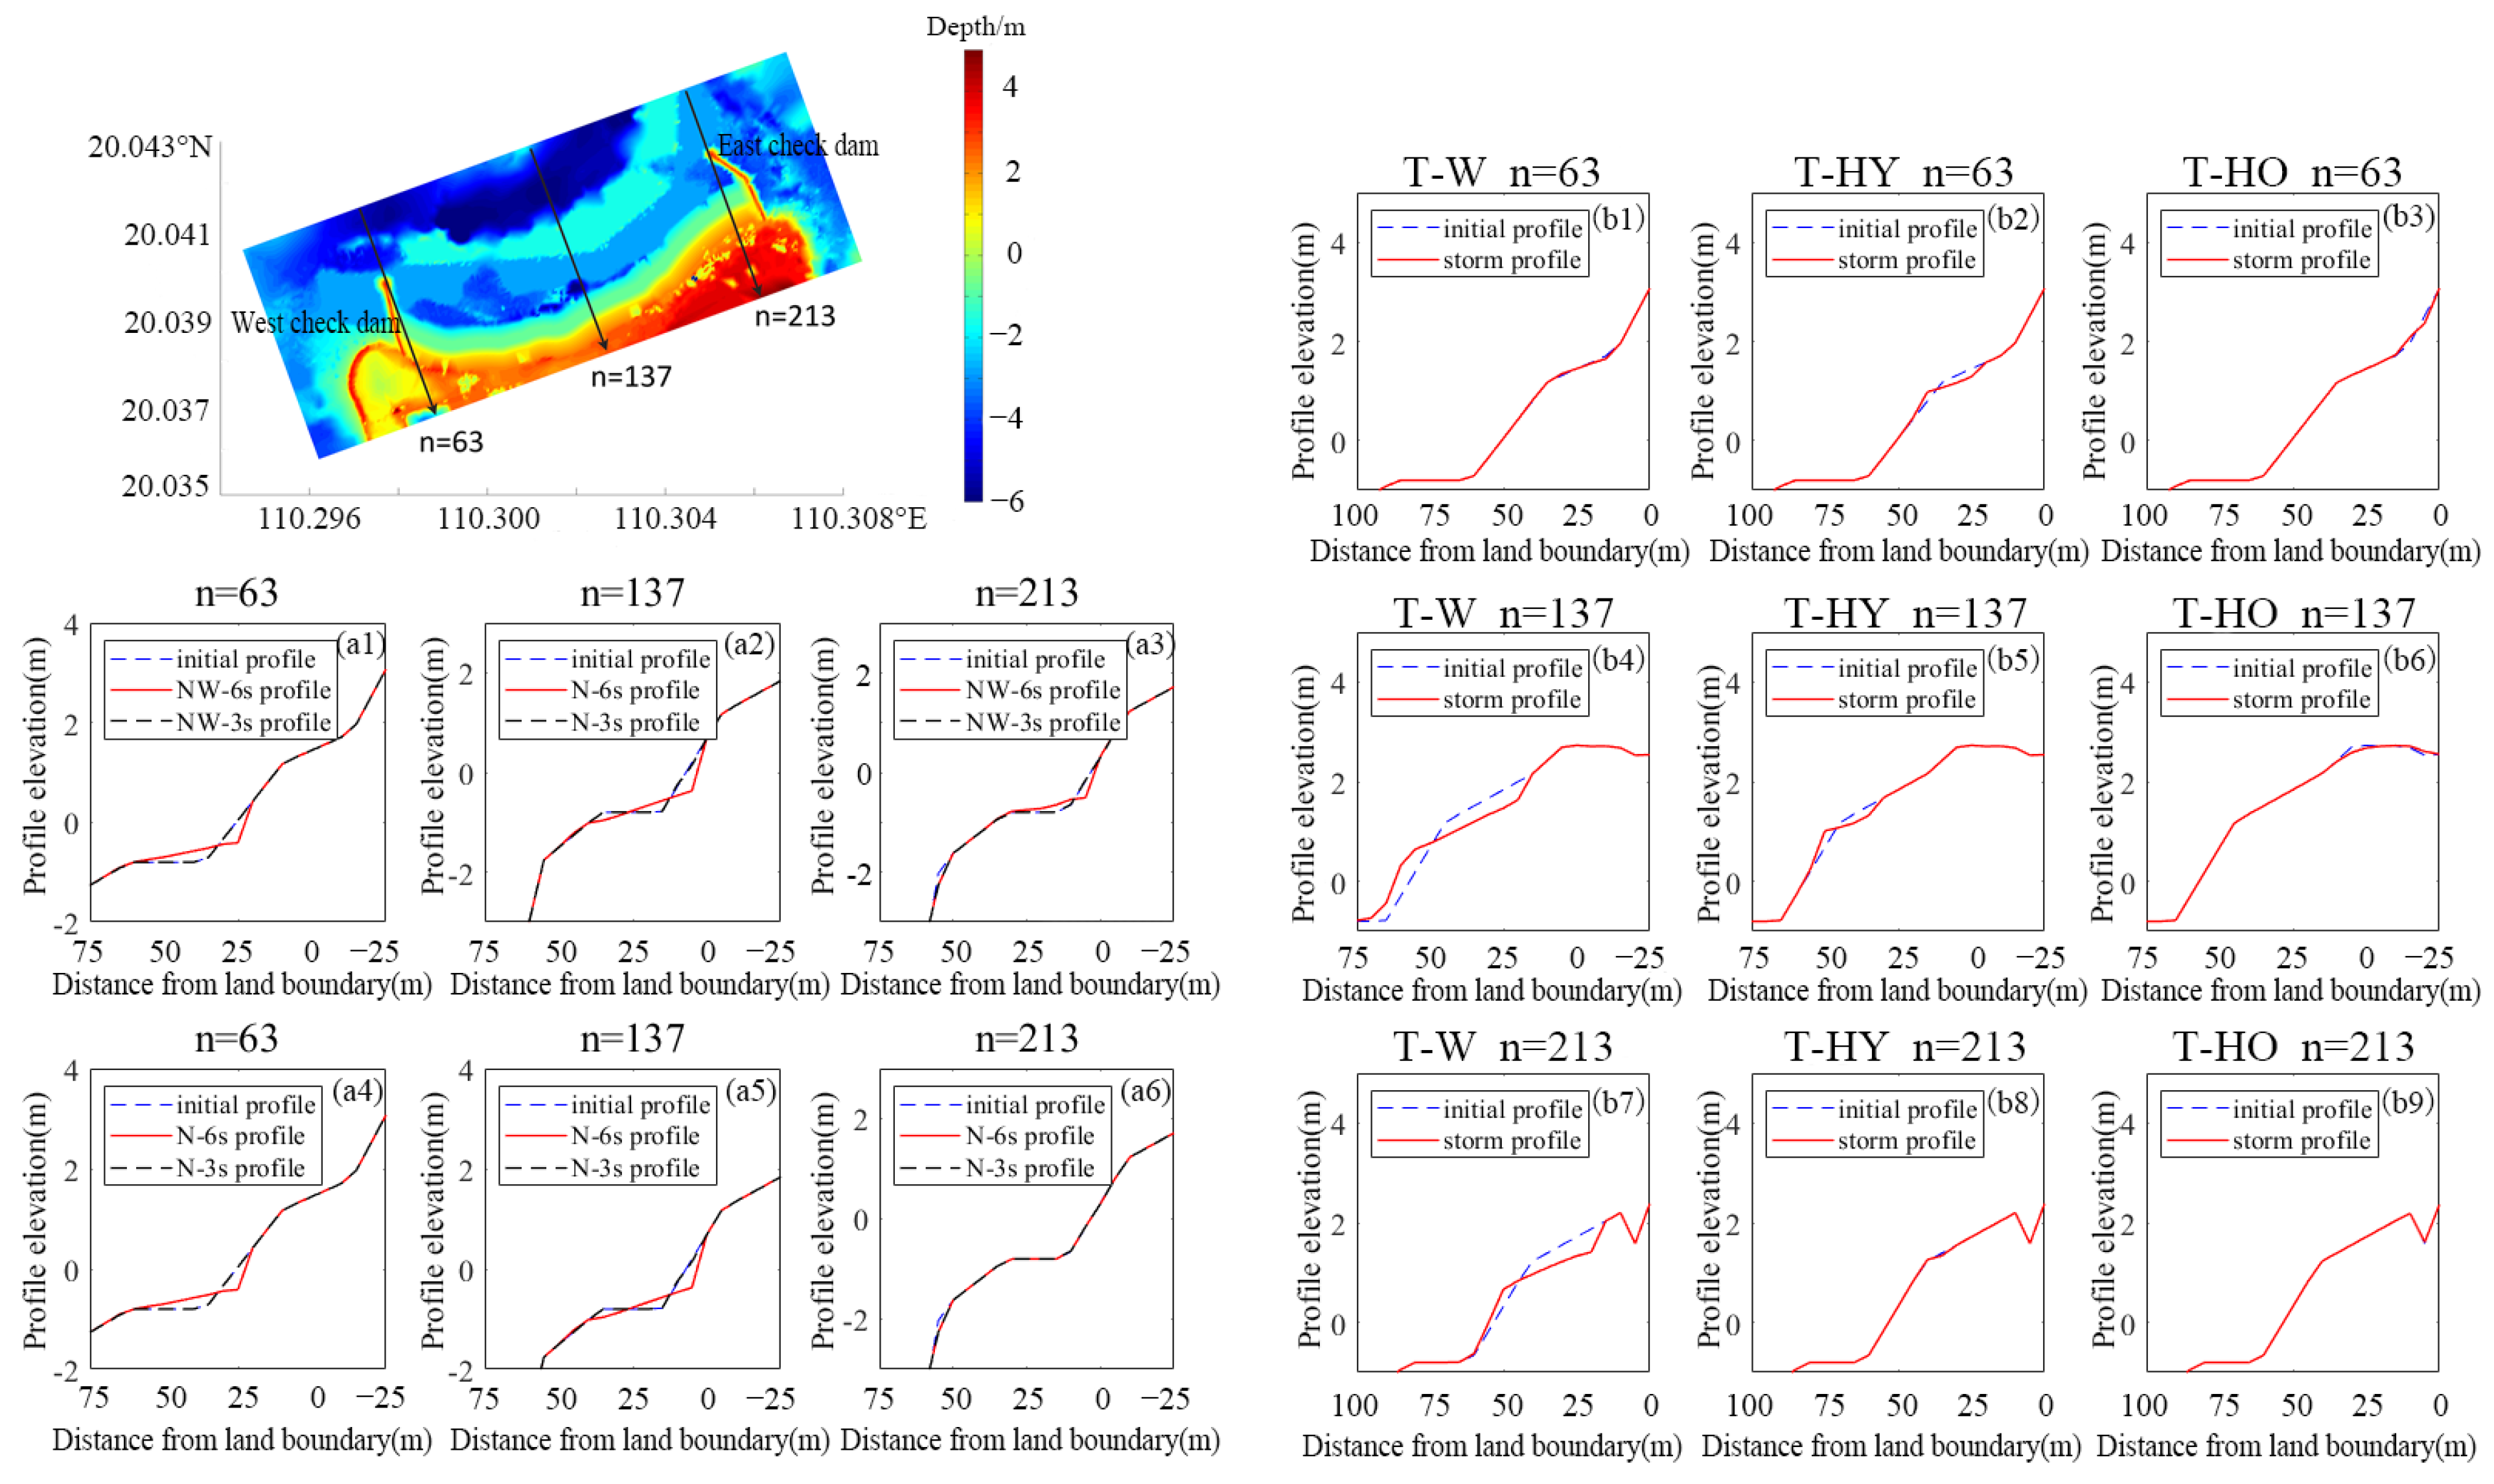
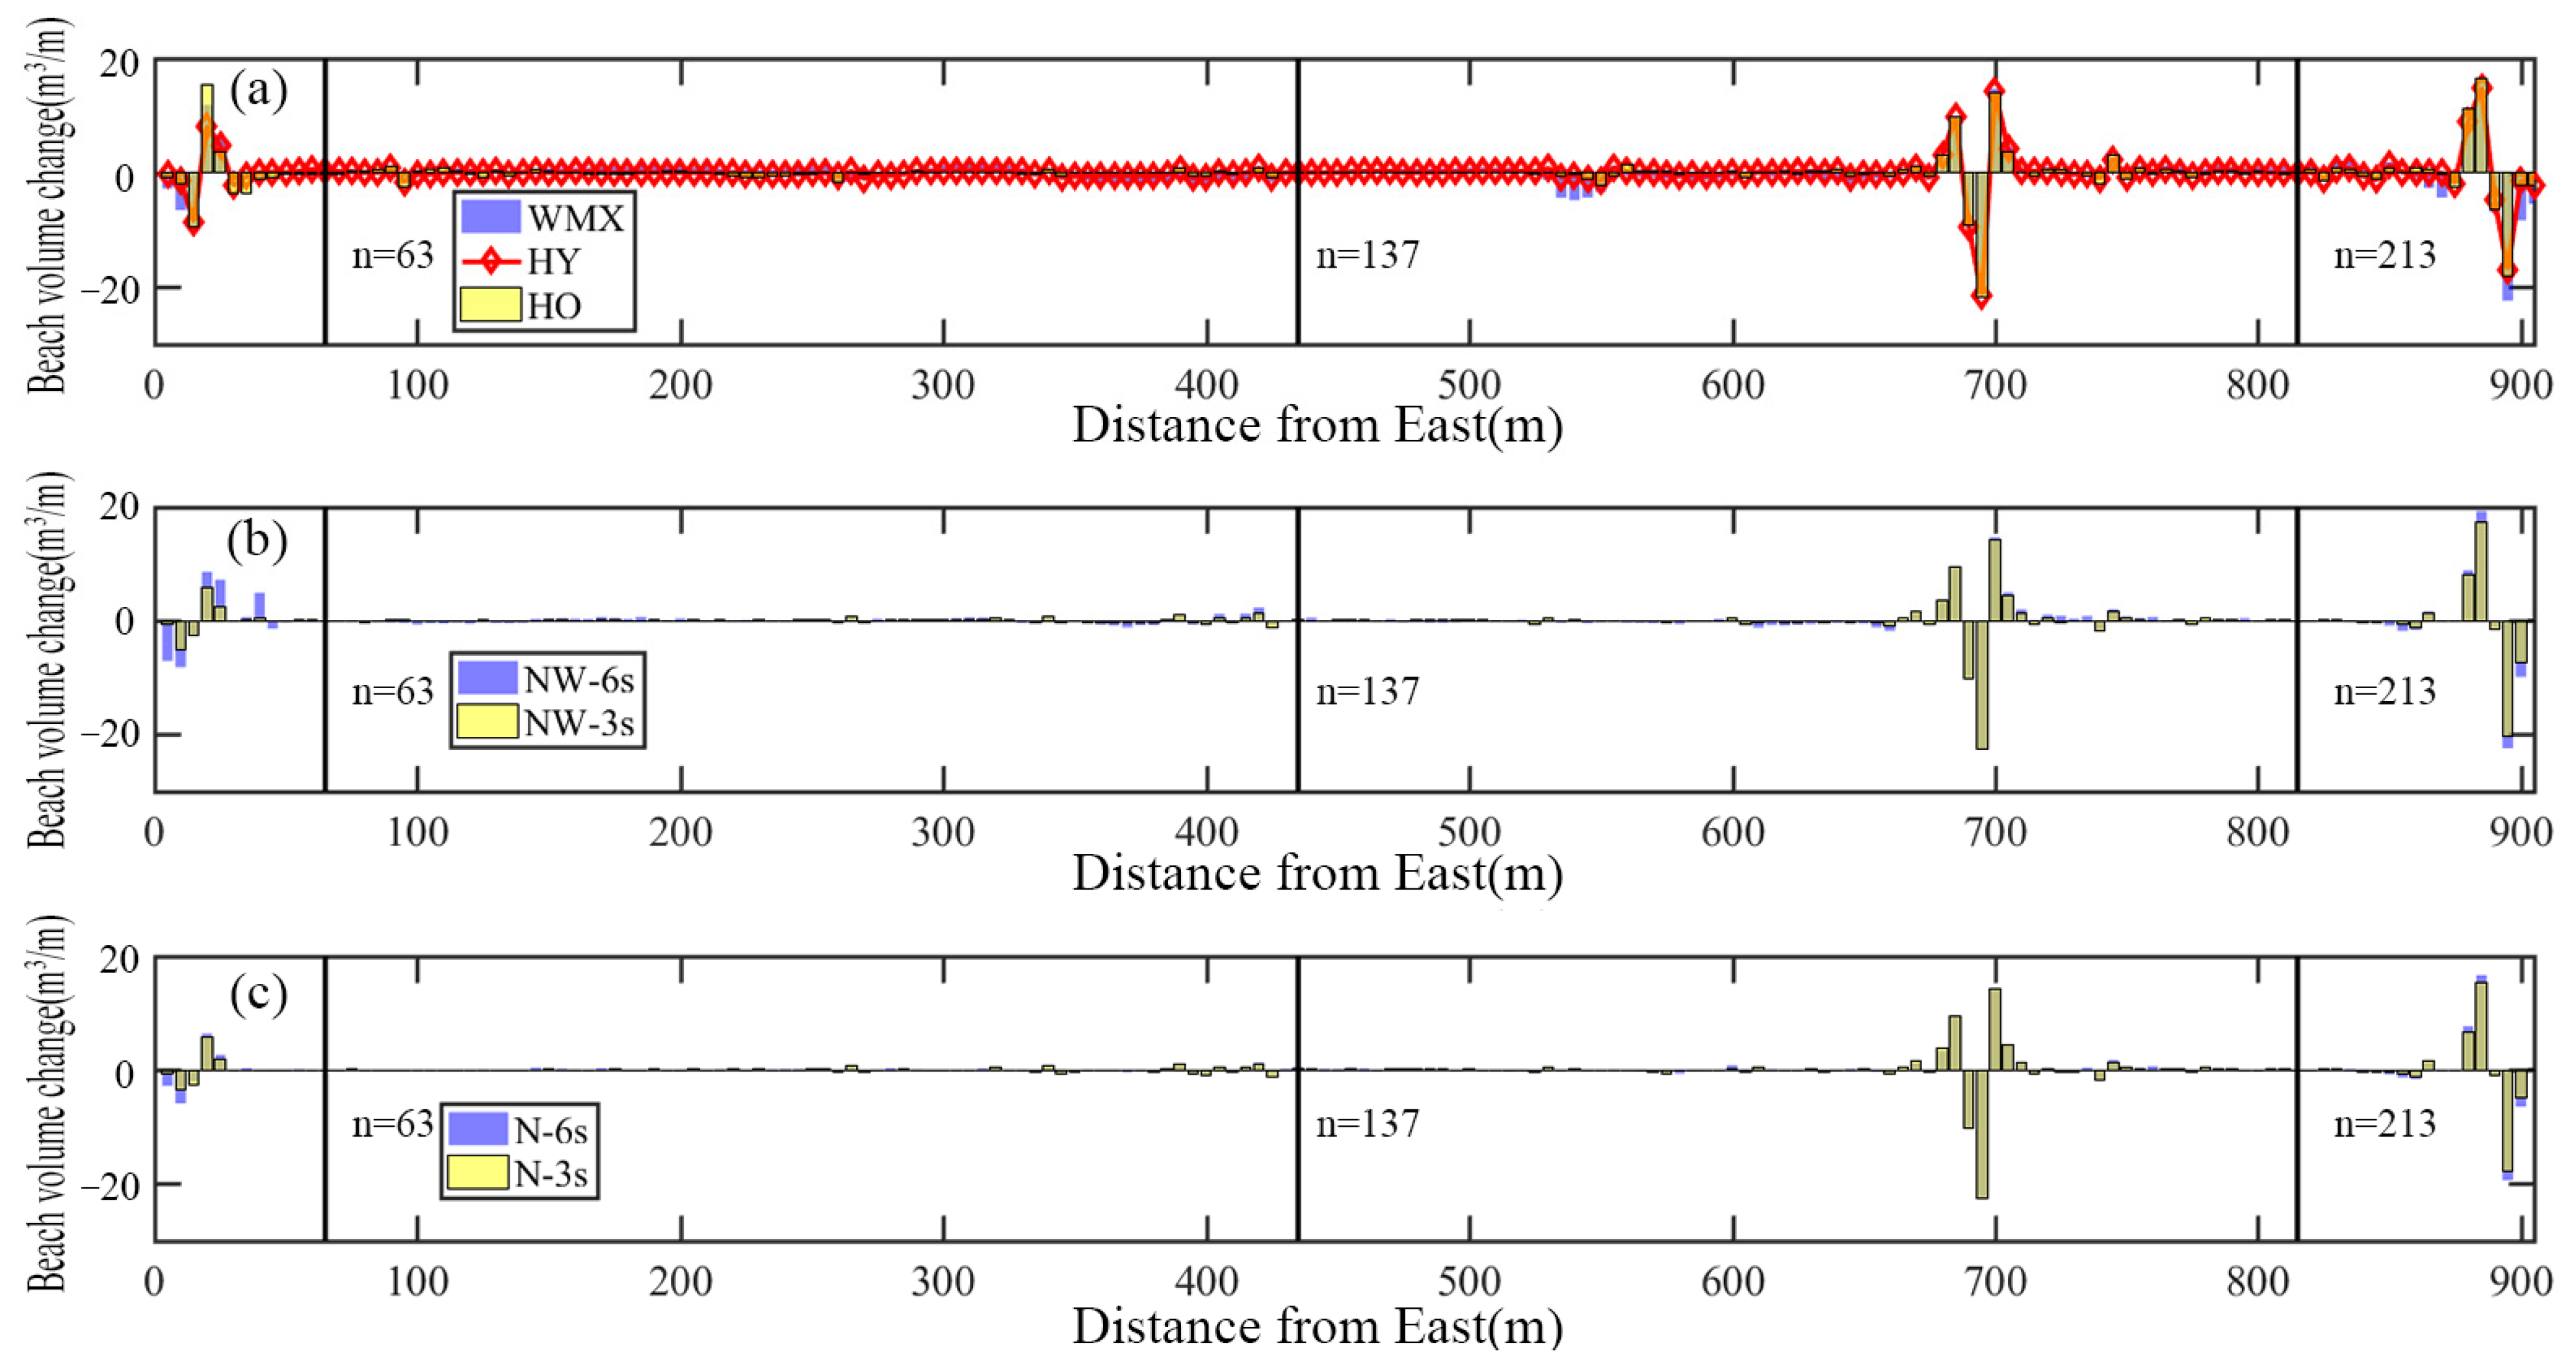
5.1. Profiles’ Widths and Sediment Volume Change
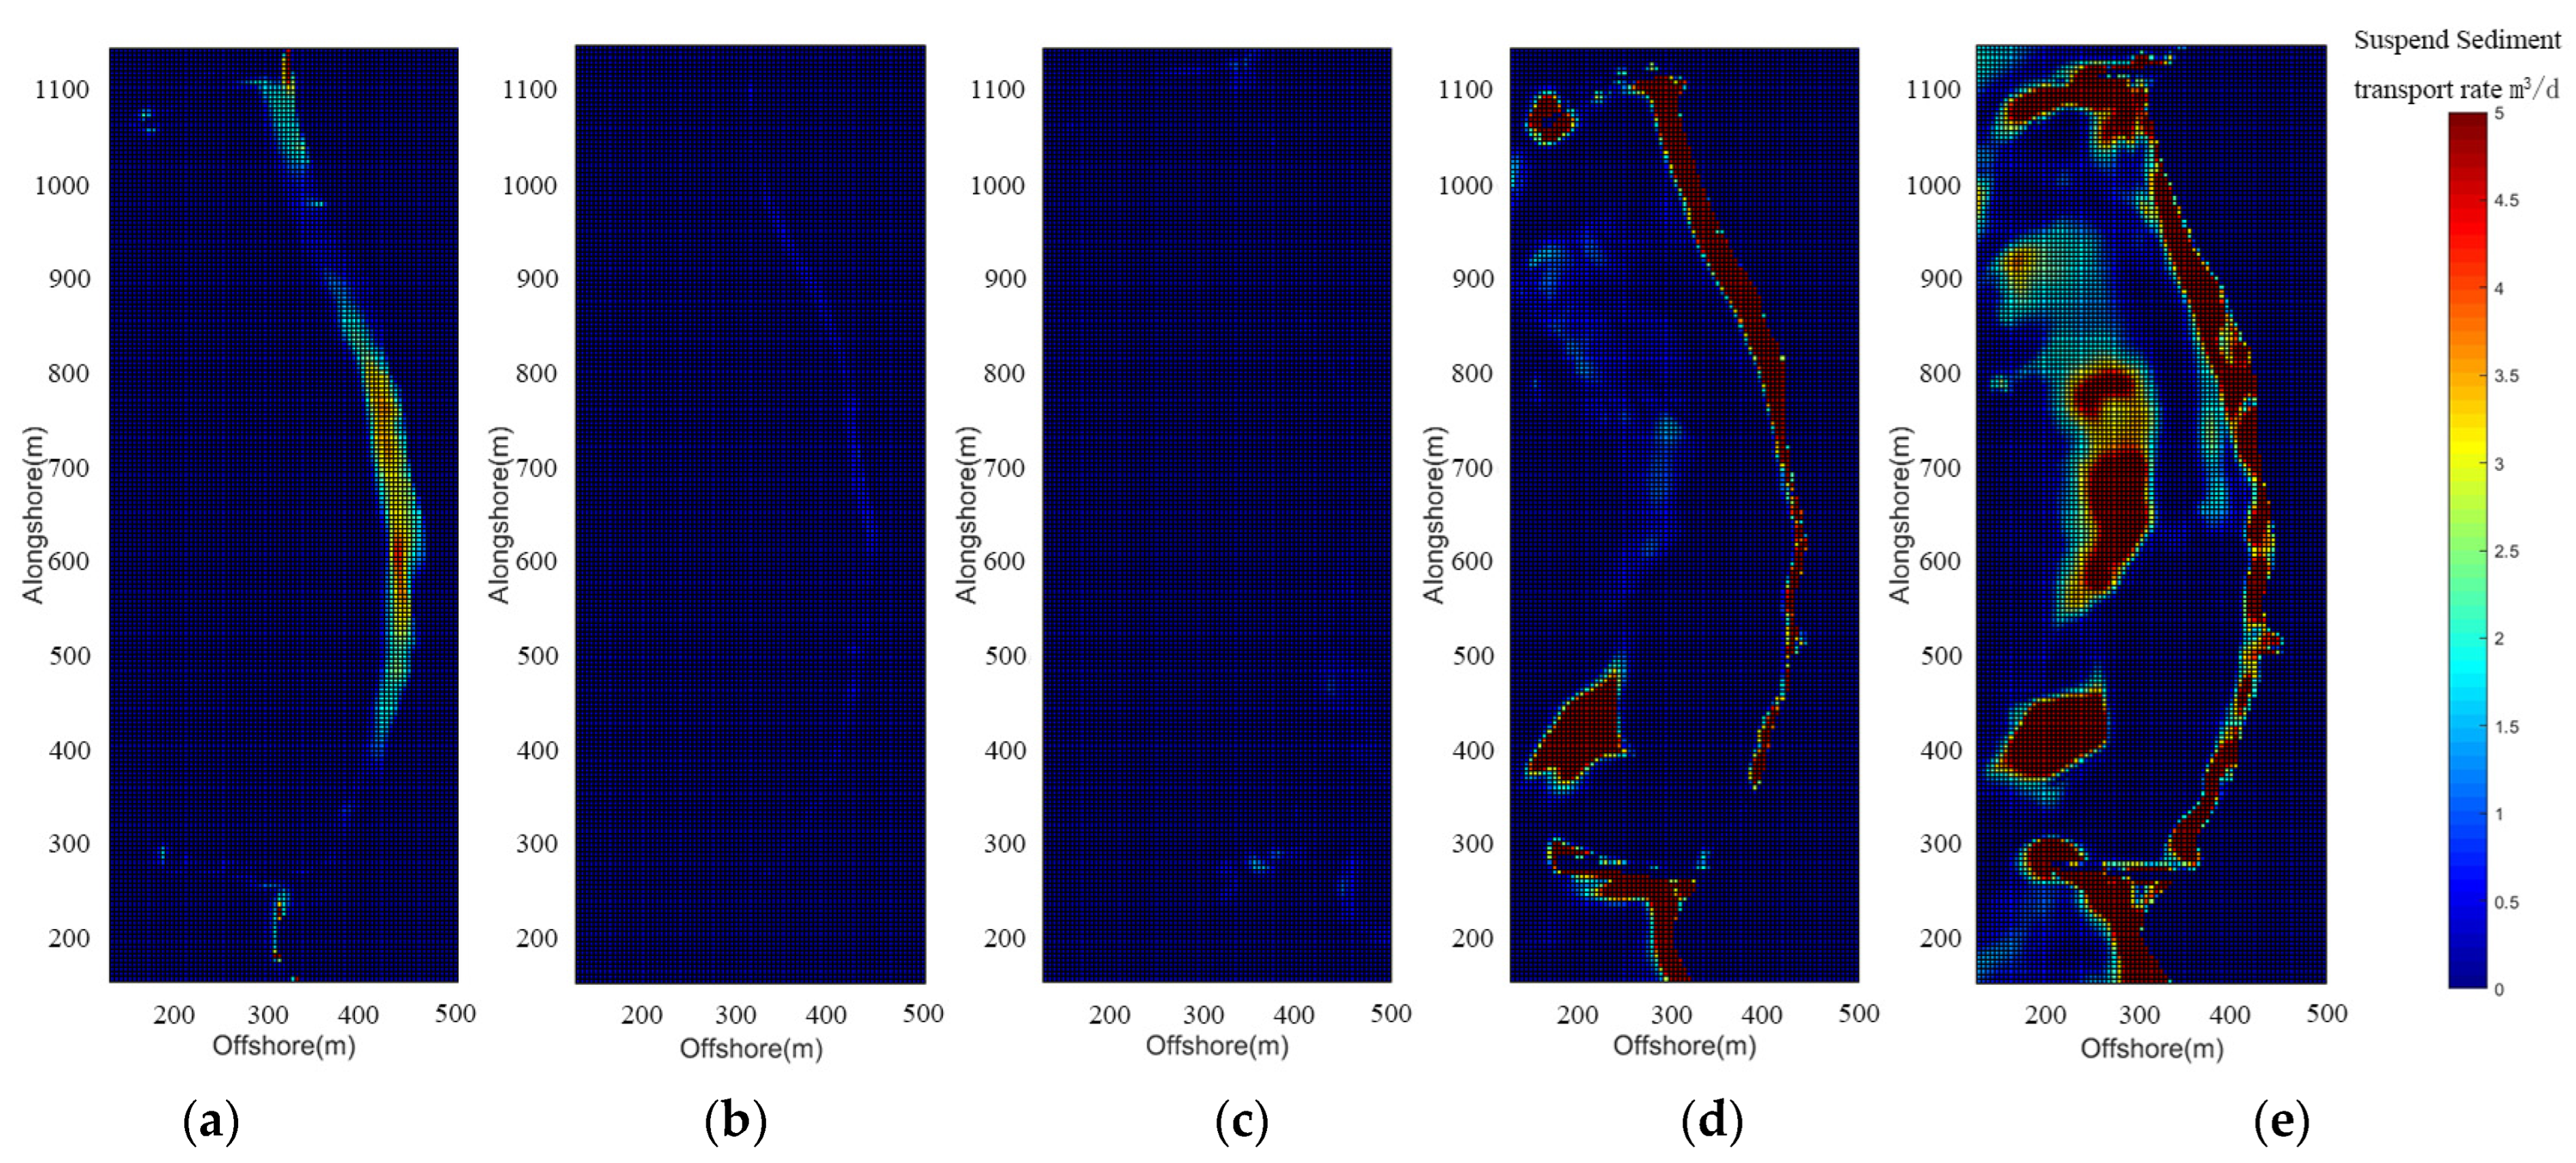
5.2. Sediment Transport Alongshore and Offshore
5.3. Shoreline Prediction
6. Discussion
6.1. Engineered Projects (“Grey Method”)
6.2. Biological Methods (“Green Method”)
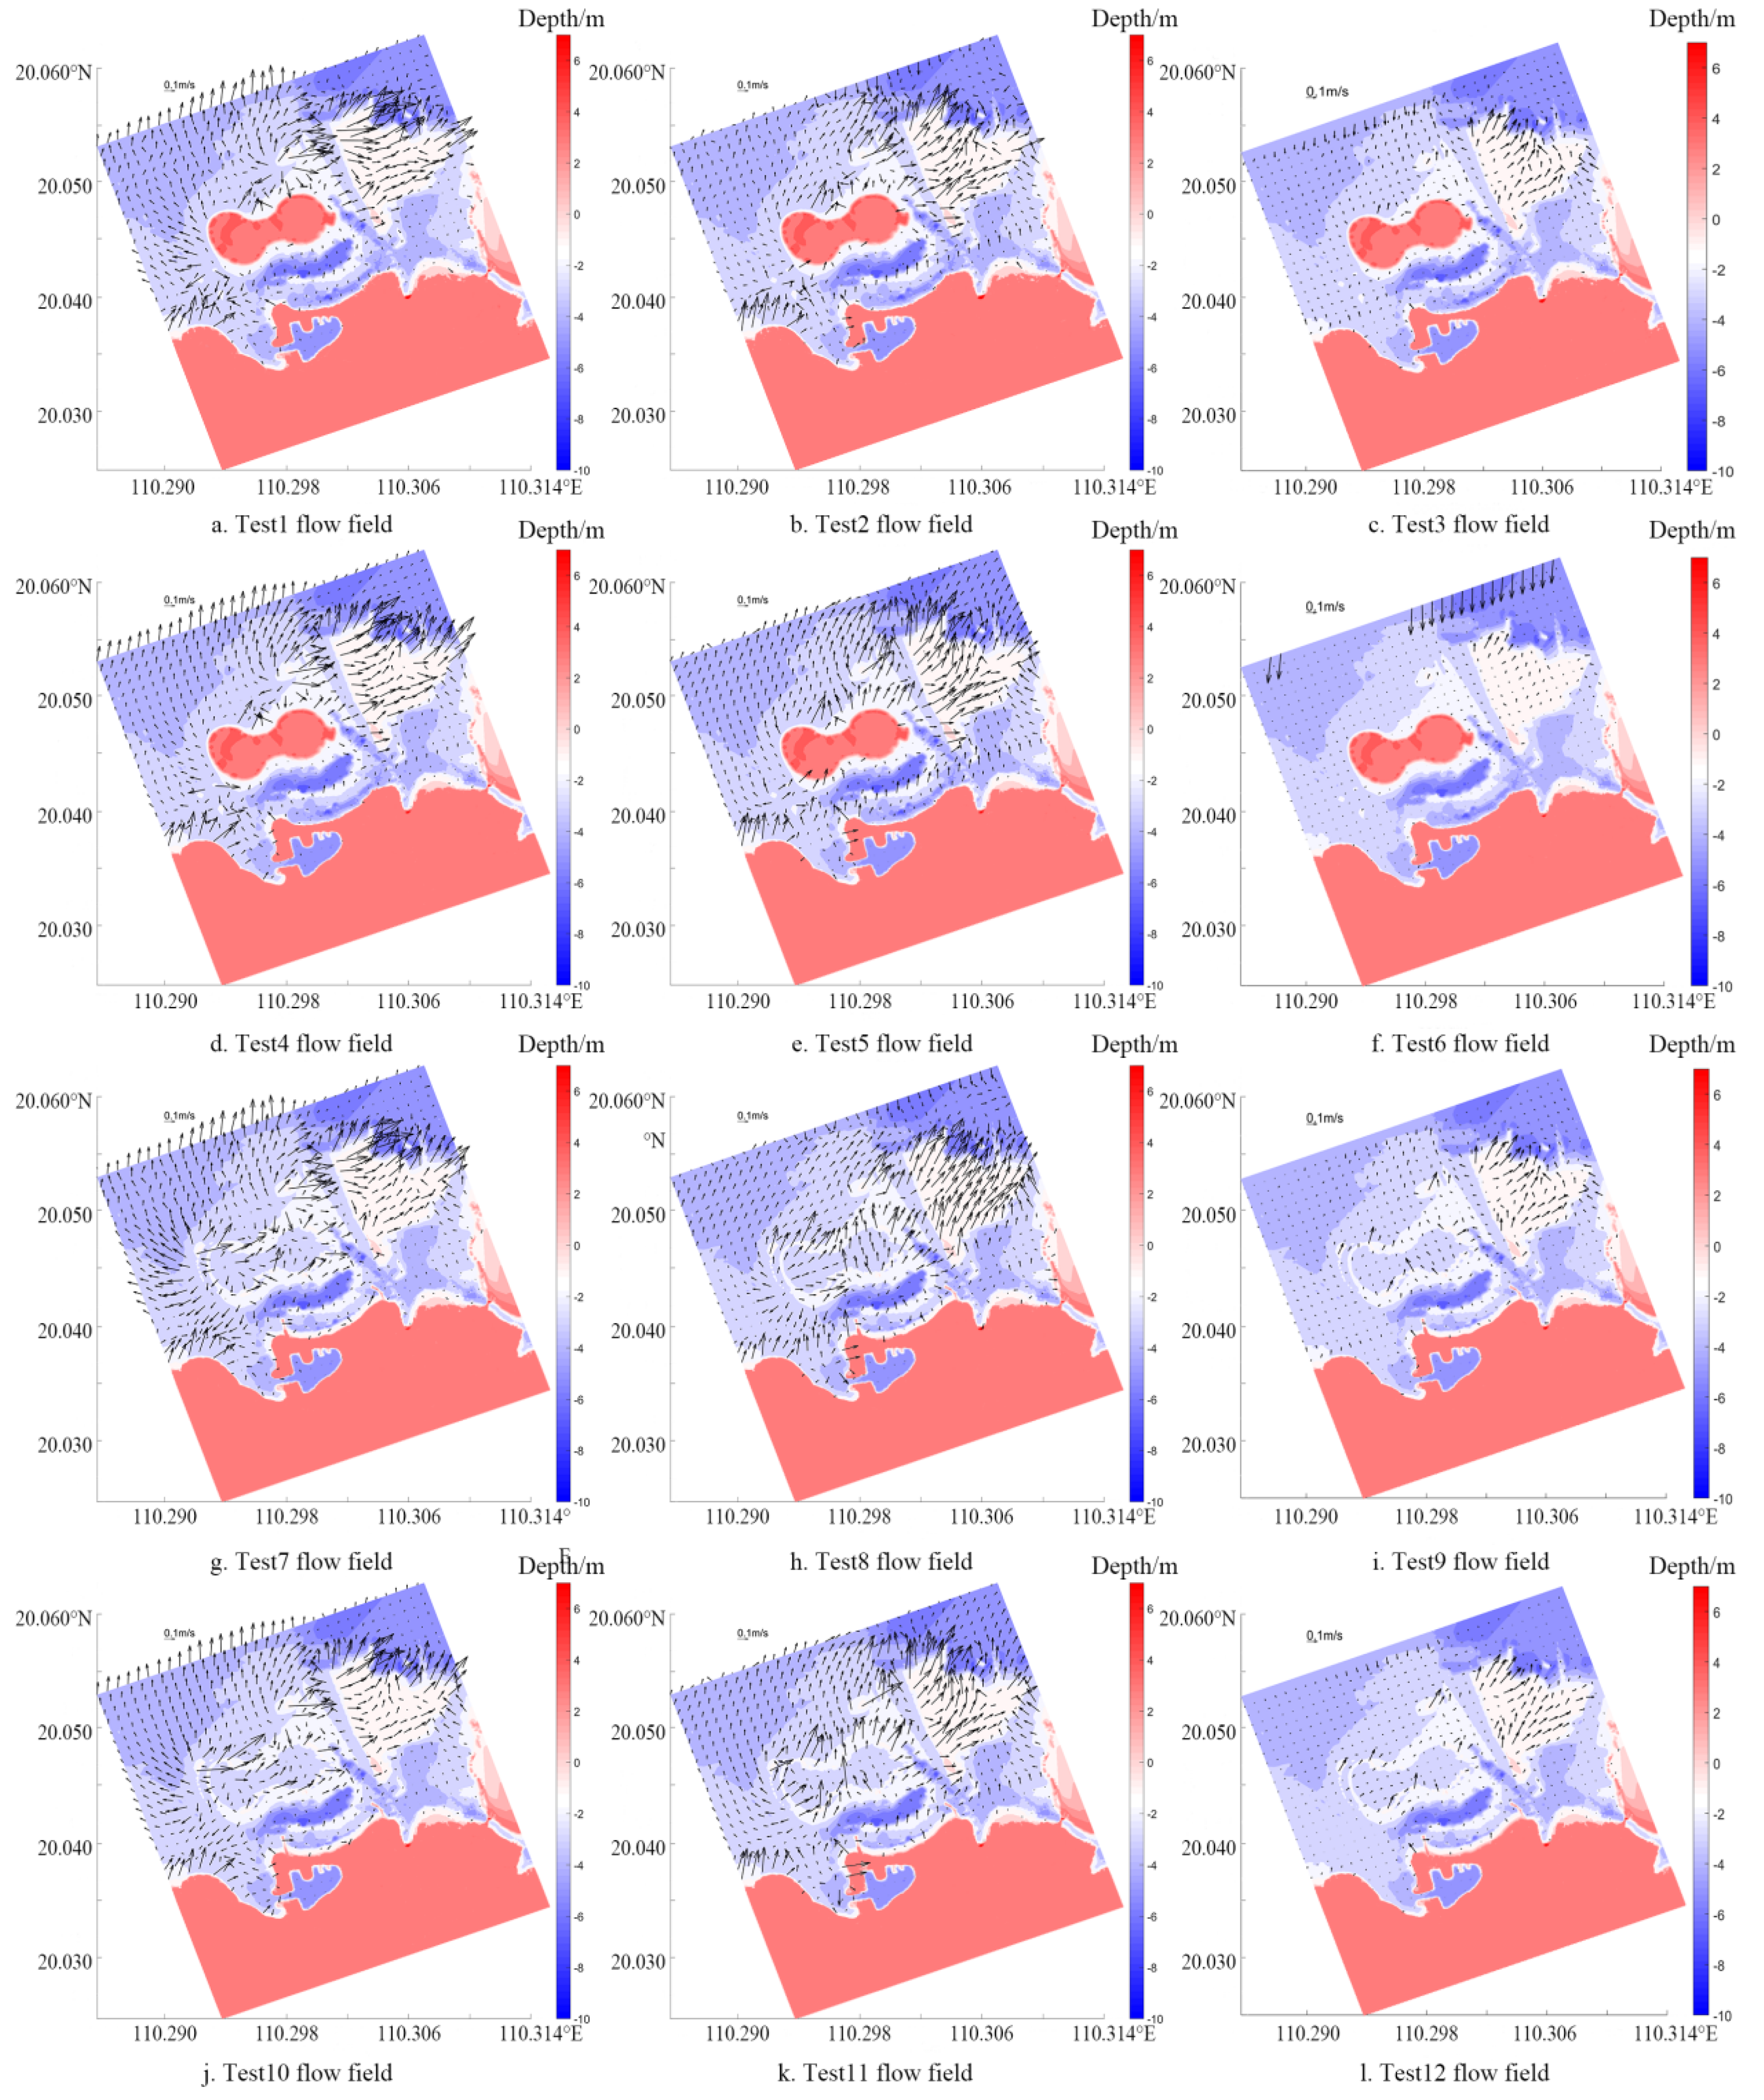
6.3. Offshore Infrastructure Induced Wave-Flow Field Change
7. Conclusions
- (1)
- Normal waves induced greater erosion on the artificial beach than storm wave events.
- (2)
- Waves with long wave period cause more erosion and accretion because they maintain long distance sediment transport without breaking.
- (3)
- Sediment transport at the study site follows two main routes: offshore, and westward. It is argued that beach profiles will be eroded more in eastern portion of the beach than the western and central portion of the beach. The designed beach will maintain shoreline balance and remain in dynamic equilibrium during normal wave events.
- (4)
- Offshore sandbars and ridges can protect the beach since wave energy can be largely reduced however they can enhance risks beach mudding and blackening in Haikou Bay.
Author Contributions
Funding
Institutional Review Board Statement
Informed Consent Statement
Data Availability Statement
Acknowledgments
Conflicts of Interest
References
- Feng, X.; Feng, H.; Li, H.; Zhang, F.; Feng, W.; Zhang, W.; Yuan, J. Tidal responses to future sea level trends on the Yellow Sea shelf. J. Geophys. Res. Ocean. 2019, 124, 7285–7306. [Google Scholar] [CrossRef]
- Feng, H.; Feng, X.; Feng, W.; Zhang, W. Sensitivity of tides and tidal components to sea-level-rise in the Radial Sand Ridges. Reg. Stud. Mar. Sci. 2021, 47, 101918. [Google Scholar] [CrossRef]
- Zhou, Y.; Feng, X.; Guan, W.; Feng, W. Characteristics of beach erosion in headland bays due to wave actiont: Taking the Narrabeen beach in Australia as an example. Chin. Sci. Bull. 2019, 64, 223–233. (In Chinese) [Google Scholar] [CrossRef]
- Jiang, C.; Cao, H.; Feng, W.; Feng, X. Quasi-static balance profile Test of rigid vegetation coast under regular wave action. Port Waterw. Eng. 2019, 7–14, 30. [Google Scholar]
- Zheng, J.; Zhang, C.; Demirbilek, Z.; Lin, L. Numerical study of sandbar migration under wave-undertow interaction. J. Waterw. Port Coast. Ocean Eng. 2013, 140, 146–159. [Google Scholar] [CrossRef]
- Zhang, C.; Zhang, Q.; Zheng, J.; Demirbilek, Z. Parameterization of nearshore wave front slope. Coast. Eng. 2017, 127, 80–87. [Google Scholar] [CrossRef]
- Feng, X.; Zhou, Y.; Lu, Y.; Feng, W. Characteristics of Beach Erosion in Headland Bays due to Storm-Waves. In Proceedings of the 29th International Ocean and Polar Engineering Conference, Honolulu, HI, USA, 16–21 June 2019; pp. 3821–3829. [Google Scholar]
- Splinter, K.D.; Kearney, E.T.; Turner, I.L. Drivers of alongshore variable dune erosion during a storm event: Observations and modelling. Coast. Eng. 2018, 131, 31–41. [Google Scholar] [CrossRef]
- Zollini, S.; Dominici, D.; Alicandro, M.; Cuevas-González, M.; Angelats, E.; Ribas, F.; Simarro, G. New Methodology for Shoreline Extraction Using Optical and Radar (SAR) Satellite Imagery. J. Mar. Sci. Eng. 2023, 11, 627. [Google Scholar] [CrossRef]
- Vallarino Castillo, R.; Negro Valdecantos, V.; Moreno Blasco, L. Shoreline Change Analysis Using Historical Multispectral Landsat Images of the Pacific Coast of Panama. J. Mar. Sci. Eng. 2022, 10, 1801. [Google Scholar] [CrossRef]
- O’Grady, J.G.; Hemer, M.A.; McInnes, K.L.; Trenham, C.E.; Stephenson, A.G. Projected incremental changes to extreme wind-driven wave heights for the twenty-first century. Sci. Rep. 2021, 11, 8826. [Google Scholar] [CrossRef]
- Church, J.; Wilson, S.; Woodworth, P.; Aarup, T. Understanding sea level rise and variability. Eos 2007, 88, 43. [Google Scholar] [CrossRef]
- Li, Y.; Zhang, C.; Cai, Y.; Xie, M.; Qi, H.; Wang, Y. Wave Dissipation and Sediment Transport Patterns during Shoreface Nourishment towards Equilibrium. J. Mar. Sci. Eng. 2021, 9, 535. [Google Scholar] [CrossRef]
- Meade, R.H.; Moody, J.A. Causes for the decline of suspended-sediment discharge in the Mississippi River system, 1940–2007. Hydrol. Process. Int. J. 2010, 24, 35–49. [Google Scholar] [CrossRef]
- Zhang, D.; Xie, W.; Shen, J.; Guo, L.; Chen, Y.; He, Q. Sediment dynamics in the mudbank of the Yangtze Estuary under regime shift of source and sink. Int. J. Sediment Res. 2022, 37, 97–109. [Google Scholar] [CrossRef]
- Cristaudo, D.; Gross, B.M.; Puleo, J.A. Momentum Balance Analysis of Spherical Objects and Long-Term Field Observations of Unexploded Ordnance (UXO) in the Swash Zone. J. Mar. Sci. Eng. 2023, 11, 79. [Google Scholar] [CrossRef]
- Kuang, C.; Ma, Y.; Han, X.; Pan, S.; Zhu, L. Experimental Observation on Beach Evolution Process with Presence of Artificial Submerged Sand Bar and Reef. J. Mar. Sci. Eng. 2020, 8, 1019. [Google Scholar] [CrossRef]
- Yang, Z.; Yang, Z.; Deng, Z.; Chen, Y.; Yang, B.; Hou, Y.; Deng, Z.; Tong, M. Multi-Timescale Analysis of the Evolution of Sandy Coastline: A Case Study in South China. J. Mar. Sci. Eng. 2022, 10, 1609. [Google Scholar] [CrossRef]
- Duo, E.; Sanuy, M.; Jiménez, J.A.; Ciavola, P. How good are symmetric triangular synthetic storms to represent real events for coastal hazard modelling. Coast. Eng. 2020, 159, 103728. [Google Scholar] [CrossRef]
- van Ormondt, M.; Nelson, T.R.; Hapke, C.J.; Roelvink, D. Morphodynamic modelling of the wilderness breach, Fire Island, New York. Part I: Model set-up and validation. Coast. Eng. 2020, 157, 103621. [Google Scholar] [CrossRef]
- Bennett, W.G.; Karunarathna, H.; Reeve, D.E.; Mori, N. Computational modelling of morphodynamic response of a macro-tidal beach to future climate variabilities. Mar. Geol. 2019, 415, 105960. [Google Scholar] [CrossRef]
- Didier, D.; Baudry, J.; Bernatchez, P.; Dumont, D.; Sadegh, M.; Bismuth, E.; Bandet, M.; Dugas, S.; Sévigny, C. Multihazard simulation for coastal flood mapping: Bathtub versus numerical modelling in an open estuary, Eastern Canada. J. Flood Risk Manag. 2019, 12 (Suppl. S1), e12505. [Google Scholar] [CrossRef]
- Galappatti, G.; Vreugdenhil, C.B. A depth-integrated model for suspended sediment transport. J. Hydraul. Res. 1985, 23, 359–377. [Google Scholar] [CrossRef]
- Roelvink, D.; Reniers, A.; Van Dongeren, A.; van Thiel De Vries, J.; McCall, R.; Lescinski, J. Modelling storm impacts on beaches, dunes and barrier islands. Coast. Eng. 2009, 56, 1133–1152. [Google Scholar] [CrossRef]
- Lu, Y.; Li, S.; Zuo, L.; Liu, H.; Roelvink, J. Advances in sediment transport under combined action of waves and currents. Int. J. Sediment Res. 2015, 30, 351–360. [Google Scholar] [CrossRef]
- Raabe, A.L.; Klein, A.H.; González, M.; Medina, R. MEPBAY and SMC: Software tools to support different operational levels of headland-bay beach in coastal engineering projects. Coast. Eng. 2010, 57, 213–226. [Google Scholar] [CrossRef]
- Zhang, R.; Chen, L.; Liu, S.; Zhang, H.; Gong, W.; Lin, G. Shoreline evolution in an embayed beach adjacent to tidal inlet: The impact of anthropogenic activities. Geomorphology 2019, 346, 106856. [Google Scholar] [CrossRef]


| Site | MHWL/m | MLWL/m | HWL/m | MinT/m | MeanT/m | MaxT/m | DHWL/m | DLWL/m |
|---|---|---|---|---|---|---|---|---|
| Xiu Ying station | 1.17 | −0.04 | 2.93 | −0.86 | 1.21 | 3.79 | 1.51 | −0.49 |
| Type | Mean Value | p = 1% | p = 2% | p = 3.3% | p = 5% | p = 10% | p = 20% |
|---|---|---|---|---|---|---|---|
| Annual maximum high tide level | 2.13 | 3.08 | 2.93 | 2.81 | 2.72 | 2.55 | 2.38 |
| Annual minimum low tide level | −0.84 | −1.07 | −1.04 | −1.01 | −0.99 | −0.94 | −0.90 |
| Parameter | Description | Value | Reference Value |
|---|---|---|---|
| CFL | Maximum Courant–Friedrichs–Lewy number | 0.7 | 0.1~0.9 |
| morfac | Morphological acceleration factor | 5 | 0~1000 |
| bedfriccoef | Bed friction coefficient/s/m1/3 | 0.02 | 3.5 × 10⁻²~0.9 |
| wetslp | Critical avalanching slope under water | 0.3 | 0.1~1 |
| dryslp | Critical avalanching slope above water | 1.00 | 0.1~2 |
| D50 | D50 grain diameter first class of sediment | 0.4 | - |
| por | Porosity | 0.4 | 0.3~0.5 |
| reposeangle | Angle of internal friction/° | 30 | 0~45 |
| Storm Number | Name | Starting Time (y/m/d) | Ending Time (y/m/d) | Fastest Wind Velocity (m/s) | Lowest Central Pressure (hPa) | Landing Location |
|---|---|---|---|---|---|---|
| 201415 | T-HO | 2014.09.11 | 2014.09.18 | 40 | 960 | WenChang |
| 201409 | T-W | 2014.07.11 | 2014.07.21 | 60 | 910 | WenChang |
| 201330 | T-HY | 2013.11.03 | 2013.11.12 | 42 | 955 | Vietnam |
| Model test Number | Hs (m) | Tp(s) | Model test Number | Hs (m) | Tp (s) | Dir (°) |
| Nom-1 | 1.4 | 6.0 | Nom-2 | 1.4 | 3.0 | NW |
| Nom-3 | 1.4 | 6.0 | Nom-4 | 1.4 | 3.0 | N |
| Model Test Number | Topography | Hs (m) | Tp (s) | Model Test Number | Hs (m) | Tp (s) | Dir (°) | Explanation |
|---|---|---|---|---|---|---|---|---|
| 1 | With island | 1.4 | 6.0 | 4 | 1.4 | 3.0 | NW | wave-tide coupling model |
| 2 | With island | 1.4 | 6.0 | 5 | 1.4 | 3.0 | N | |
| 3 | With island | 1.4 | 6.0 | 6 | 1.4 | 3.0 | NE | |
| 7 | Without island | 1.4 | 6.0 | 10 | 1.4 | 3.0 | NW | |
| 8 | Without island | 1.4 | 6.0 | 11 | 1.4 | 3.0 | N | |
| 9 | Without island | 1.4 | 6.0 | 12 | 1.4 | 3.0 | NE |
Disclaimer/Publisher’s Note: The statements, opinions and data contained in all publications are solely those of the individual author(s) and contributor(s) and not of MDPI and/or the editor(s). MDPI and/or the editor(s) disclaim responsibility for any injury to people or property resulting from any ideas, methods, instructions or products referred to in the content. |
© 2023 by the authors. Licensee MDPI, Basel, Switzerland. This article is an open access article distributed under the terms and conditions of the Creative Commons Attribution (CC BY) license (https://creativecommons.org/licenses/by/4.0/).
Share and Cite
Zhou, Y.; Feng, X.; Liu, M.; Wang, W. Influence of Beach Erosion during Wave Action in Designed Artificial Sandy Beach Using XBeach Model: Profiles and Shoreline. J. Mar. Sci. Eng. 2023, 11, 984. https://doi.org/10.3390/jmse11050984
Zhou Y, Feng X, Liu M, Wang W. Influence of Beach Erosion during Wave Action in Designed Artificial Sandy Beach Using XBeach Model: Profiles and Shoreline. Journal of Marine Science and Engineering. 2023; 11(5):984. https://doi.org/10.3390/jmse11050984
Chicago/Turabian StyleZhou, Yingtao, Xi Feng, Maoyuan Liu, and Weiqun Wang. 2023. "Influence of Beach Erosion during Wave Action in Designed Artificial Sandy Beach Using XBeach Model: Profiles and Shoreline" Journal of Marine Science and Engineering 11, no. 5: 984. https://doi.org/10.3390/jmse11050984