1. Introduction
In response to the ever-increasing need for electrical energy, several research projects have been conducted to identify strategies for the generation of a sizeable amount of power. Consequently, there has been a shift in attention towards the improvement of more environmentally friendly energy sources such as different forms of renewable energy. Wind turbines have received notice as a potential alternative among various other options as the economic prospects for their application are very good [
1]. The usage of onshore wind has been prevalent for several decades, but offshore wind farms have been developing at a large pace [
2]. Several studies have been made about possible locations for offshore wind farms and about the criteria to rank their economic potential [
3]. Different kinds of support structures have been used [
4], in particular the spar [
5], semisubmersible [
6], tension leg platform [
7], and barge type [
8]. Several of the present studies are being made for turbines of 10 MW, using as the reference model the one specified in [
9].
Some researchers investigated the stress distribution on offshore wind turbines and support structures. For example, Reyno et al. [
10] did research on the stress concentration in the door opening under design loading conditions. According to the results, the average value of the stress concentration is 1.45, while the amount of reduction achieved by reinforcement was 78%. Umut et al. [
11] studied the effects that gravity, rotor forces, and wind loads/vortex loads have on the behaviour of square cross-sections of wind turbine towers with varying wall thicknesses. It was determined that square cross-sections might be a workable alternative to the more commonly used circular cross-sections.
Within the offshore wind turbines, there are two different categories of supporting structures which are fixed bottom and floating structures, both of which are subject to fatigue. For instance, Yeter et al. [
12] investigated a fixed offshore wind turbine support structure subjected to combined wave and wind-induced loading. It was concluded that the brace component experienced the most severe fatigue damage, and the estimated fatigue life was above 1000 years. Yeter et al. [
13] designed a jacket offshore wind turbine support structure installed in water depths of 40, 60, and 80 m. The final dimensions were verified by free vibration, structural strength, and stability assessments.
Regarding floating turbines, there are also studies investigating the different types of platforms. Teixeira et al. [
14] performed a fatigue analysis for the tower of offshore wind turbines. Kim et al. [
15] investigated a support structure of a floating wind turbine to evaluate the effect of wind speed on the stress transfer function. To this end, an artificial neural network (ANN) was used to minimize the number of simulations while increasing the accuracy of the findings. To increase the accuracy of the ANN model, a superposition model was developed. In another study on floating turbines, Bachynski and Moan [
16] performed a study on the design and dynamic analysis of a single-column 5 MW tension leg platform wind turbine (TLPWT). It was concluded that for some TLPWTs, second-order sum-frequency wave forces are important for fatigue and extreme response calculations. Ringing forces of third order were shown to be essential for TLPWTs with large diameters (14–18 m), particularly when the turbine was idle or parked.
Oguz et al. [
17] performed a numerical and experimental study on a SeaStar-type TLP floating offshore 5 MW wind turbine in regular and irregular waves with wind conditions. It was concluded that the surge, pitch, and heave motion of the experimental and the numerical results have a good agreement, but the roll, sway, and yaw motions were insignificant. A coupled analysis for a floating 5 MW wind turbine, which is fixed by mooring to the bed, was conducted by Sclavounos et al. [
18]. The authors indicated that TLPs, due to their low root mean square response have the potential to offer benefits accelerations and negligible heave and pitch motions.
Nematbakhsh et al. [
19] compared the typical potential flow calculations of wave-induced loads with CFD calculations demonstrating how detailed analysis can be performed. Jamalkia et al. [
20], on the other hand, showed how the analysis of the dynamics response of the structure could be used for detecting damage.
While most of these studies were made with turbines of the order of 5 MW, more recent studies address platforms with 10 MW turbines [
21,
22,
23].
The design of the tension leg platform which is the main subject of this paper has been used as a reference for the design of a wind farm in the north of Spain [
24]. For this area, the environmental conditions have been assessed using specific models to determine the conditions of wind [
25], waves [
26], and currents [
27].
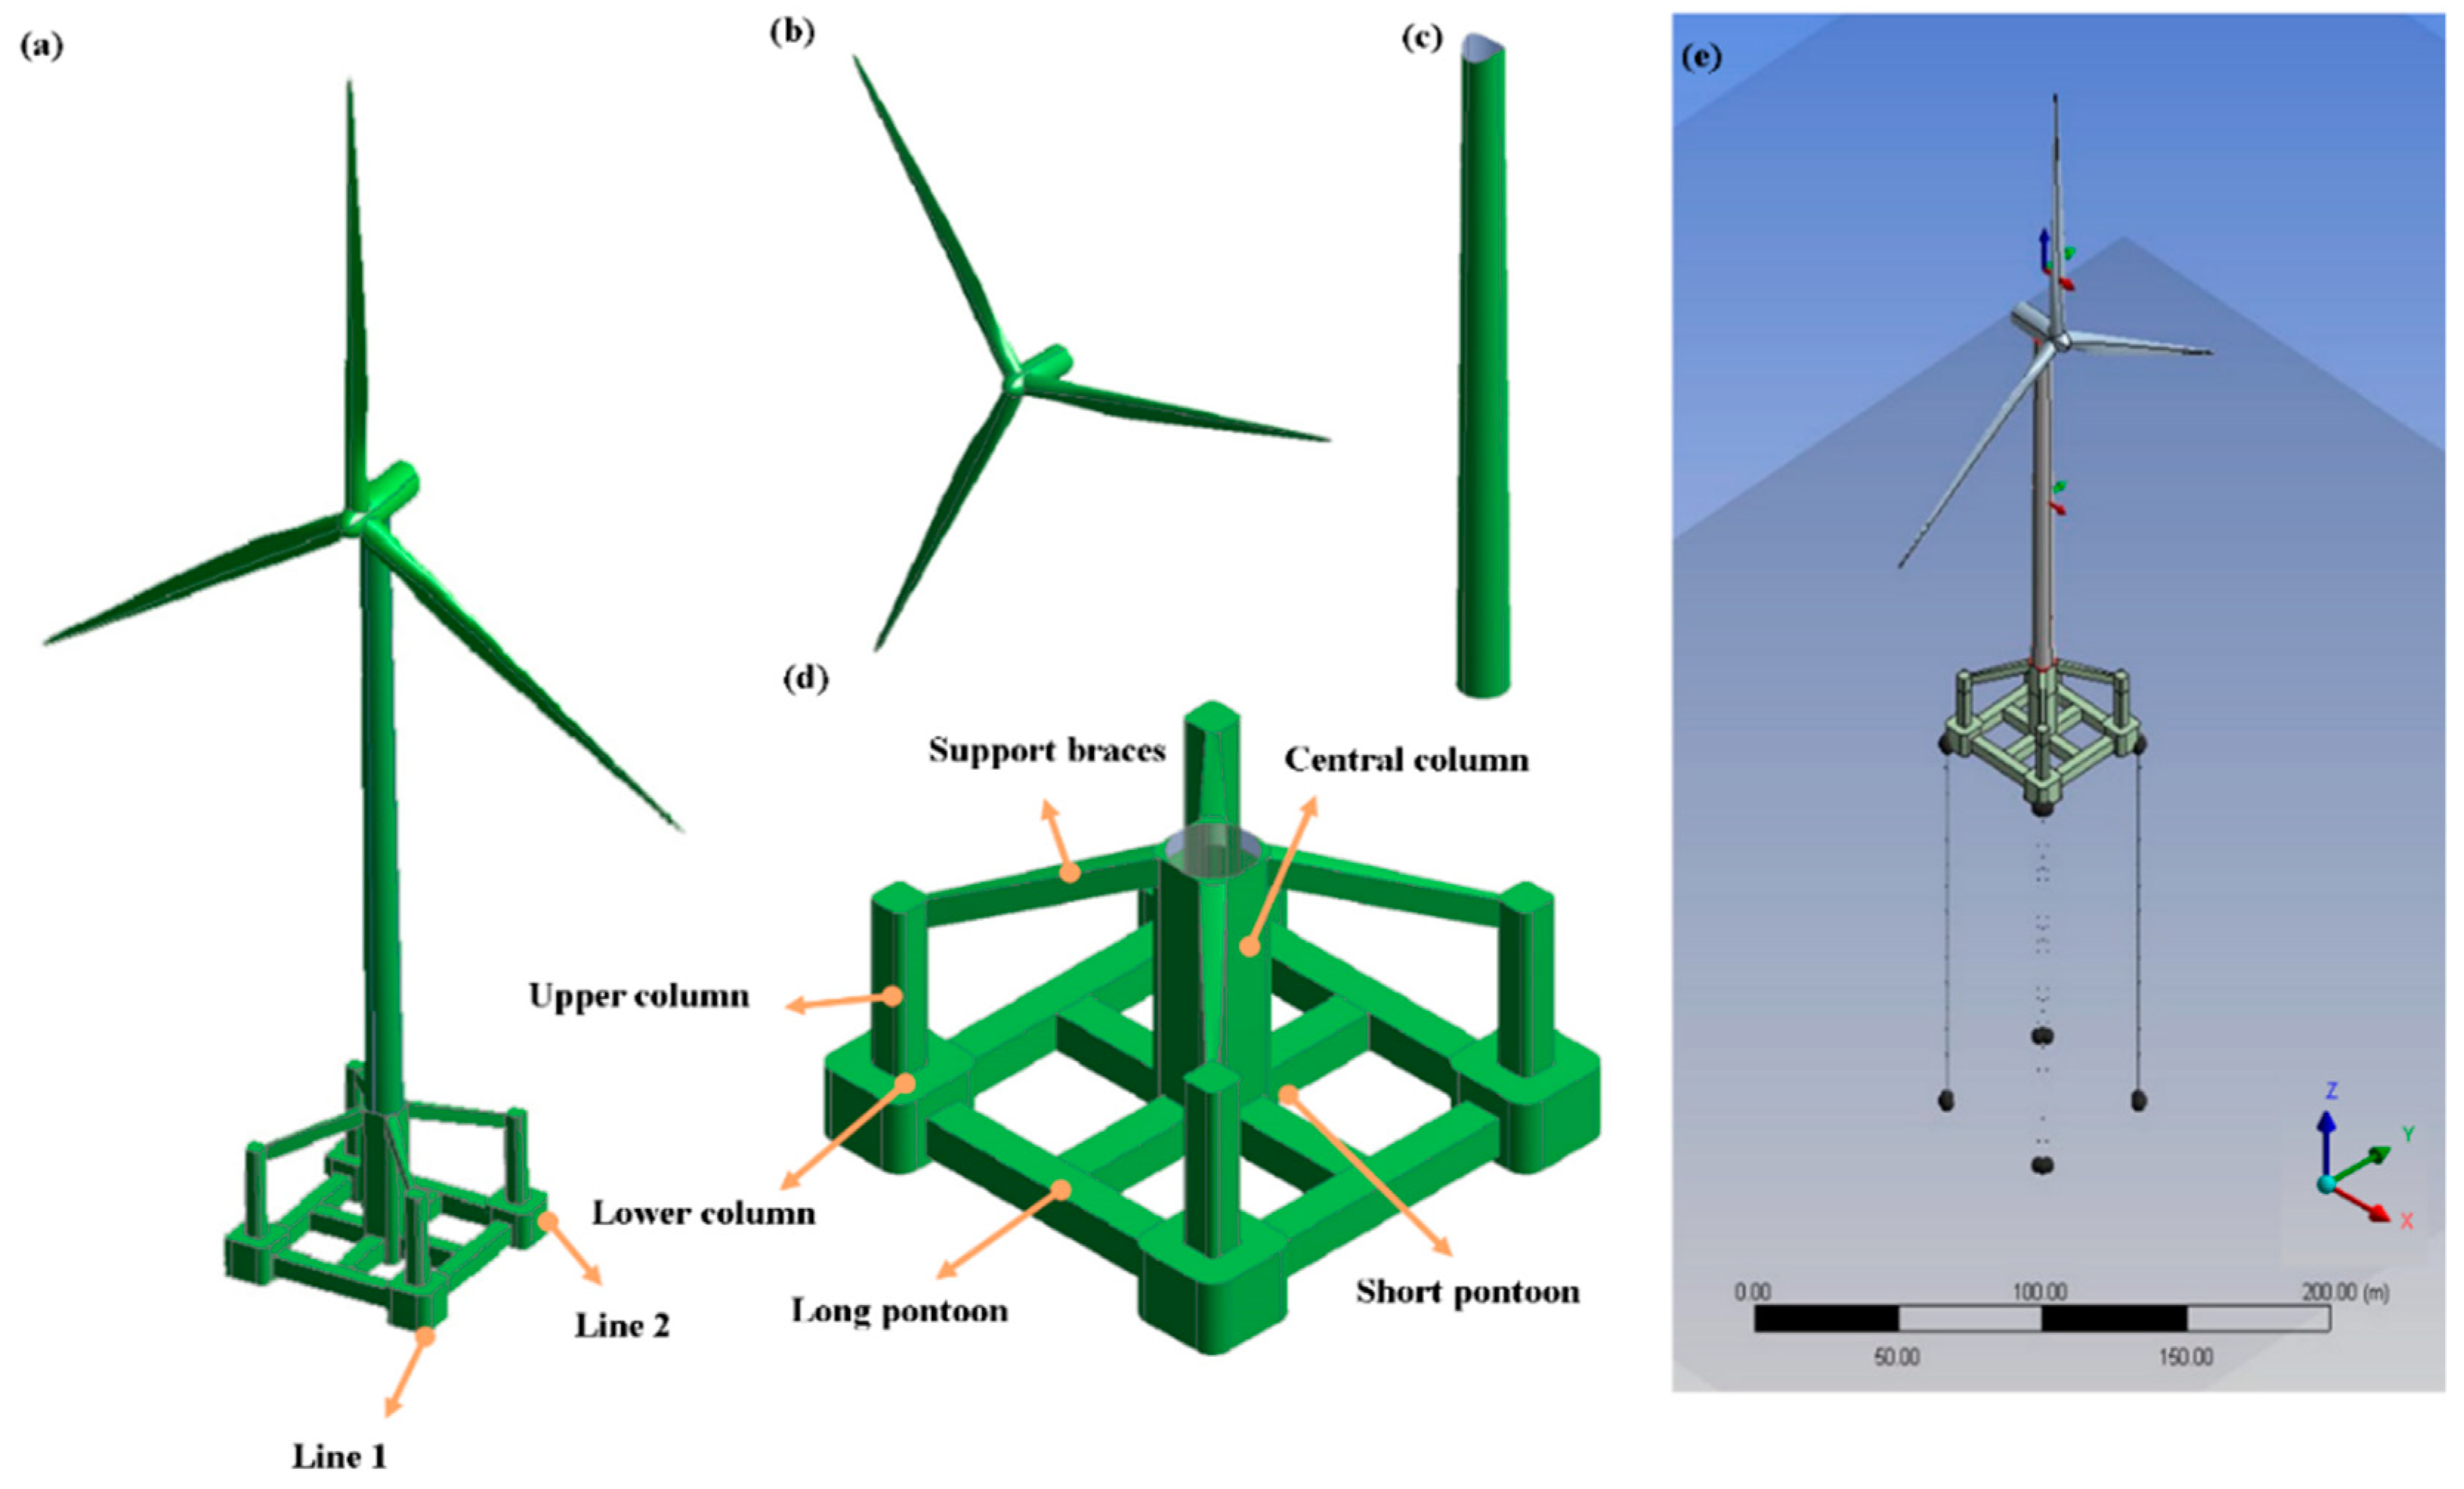
Uzunoglu and Guedes Soares [
7,
28] explained the design process of the TLP platform and conducted a numerical investigation of the CENTEC-TLP with the 10 MW DTU wind turbine. The results showed minimal wave and wind responses in transport and operational conditions. The frequency domain design solution was conducted with in-house code, and NREL’s FAST provided the time-domain solution verification. Tank testing was carried out within the ARCWIND project [
29]. In the numerical design study, three environmental conditions consisting of rated, above-rated, and 50-year extreme, was published. The study concluded that the designed model had restrained responses in free-floating conditions, and installed conditions, and the structure of the TLP did not experience any problems regarding mooring breaking, slack, or excessive surge motions. Given the satisfactory dynamic response performance, the preliminary structural design of the CENTEC-TLP has been conducted and this study contributes to the understanding of stress distribution on this 4-column TLP hull.
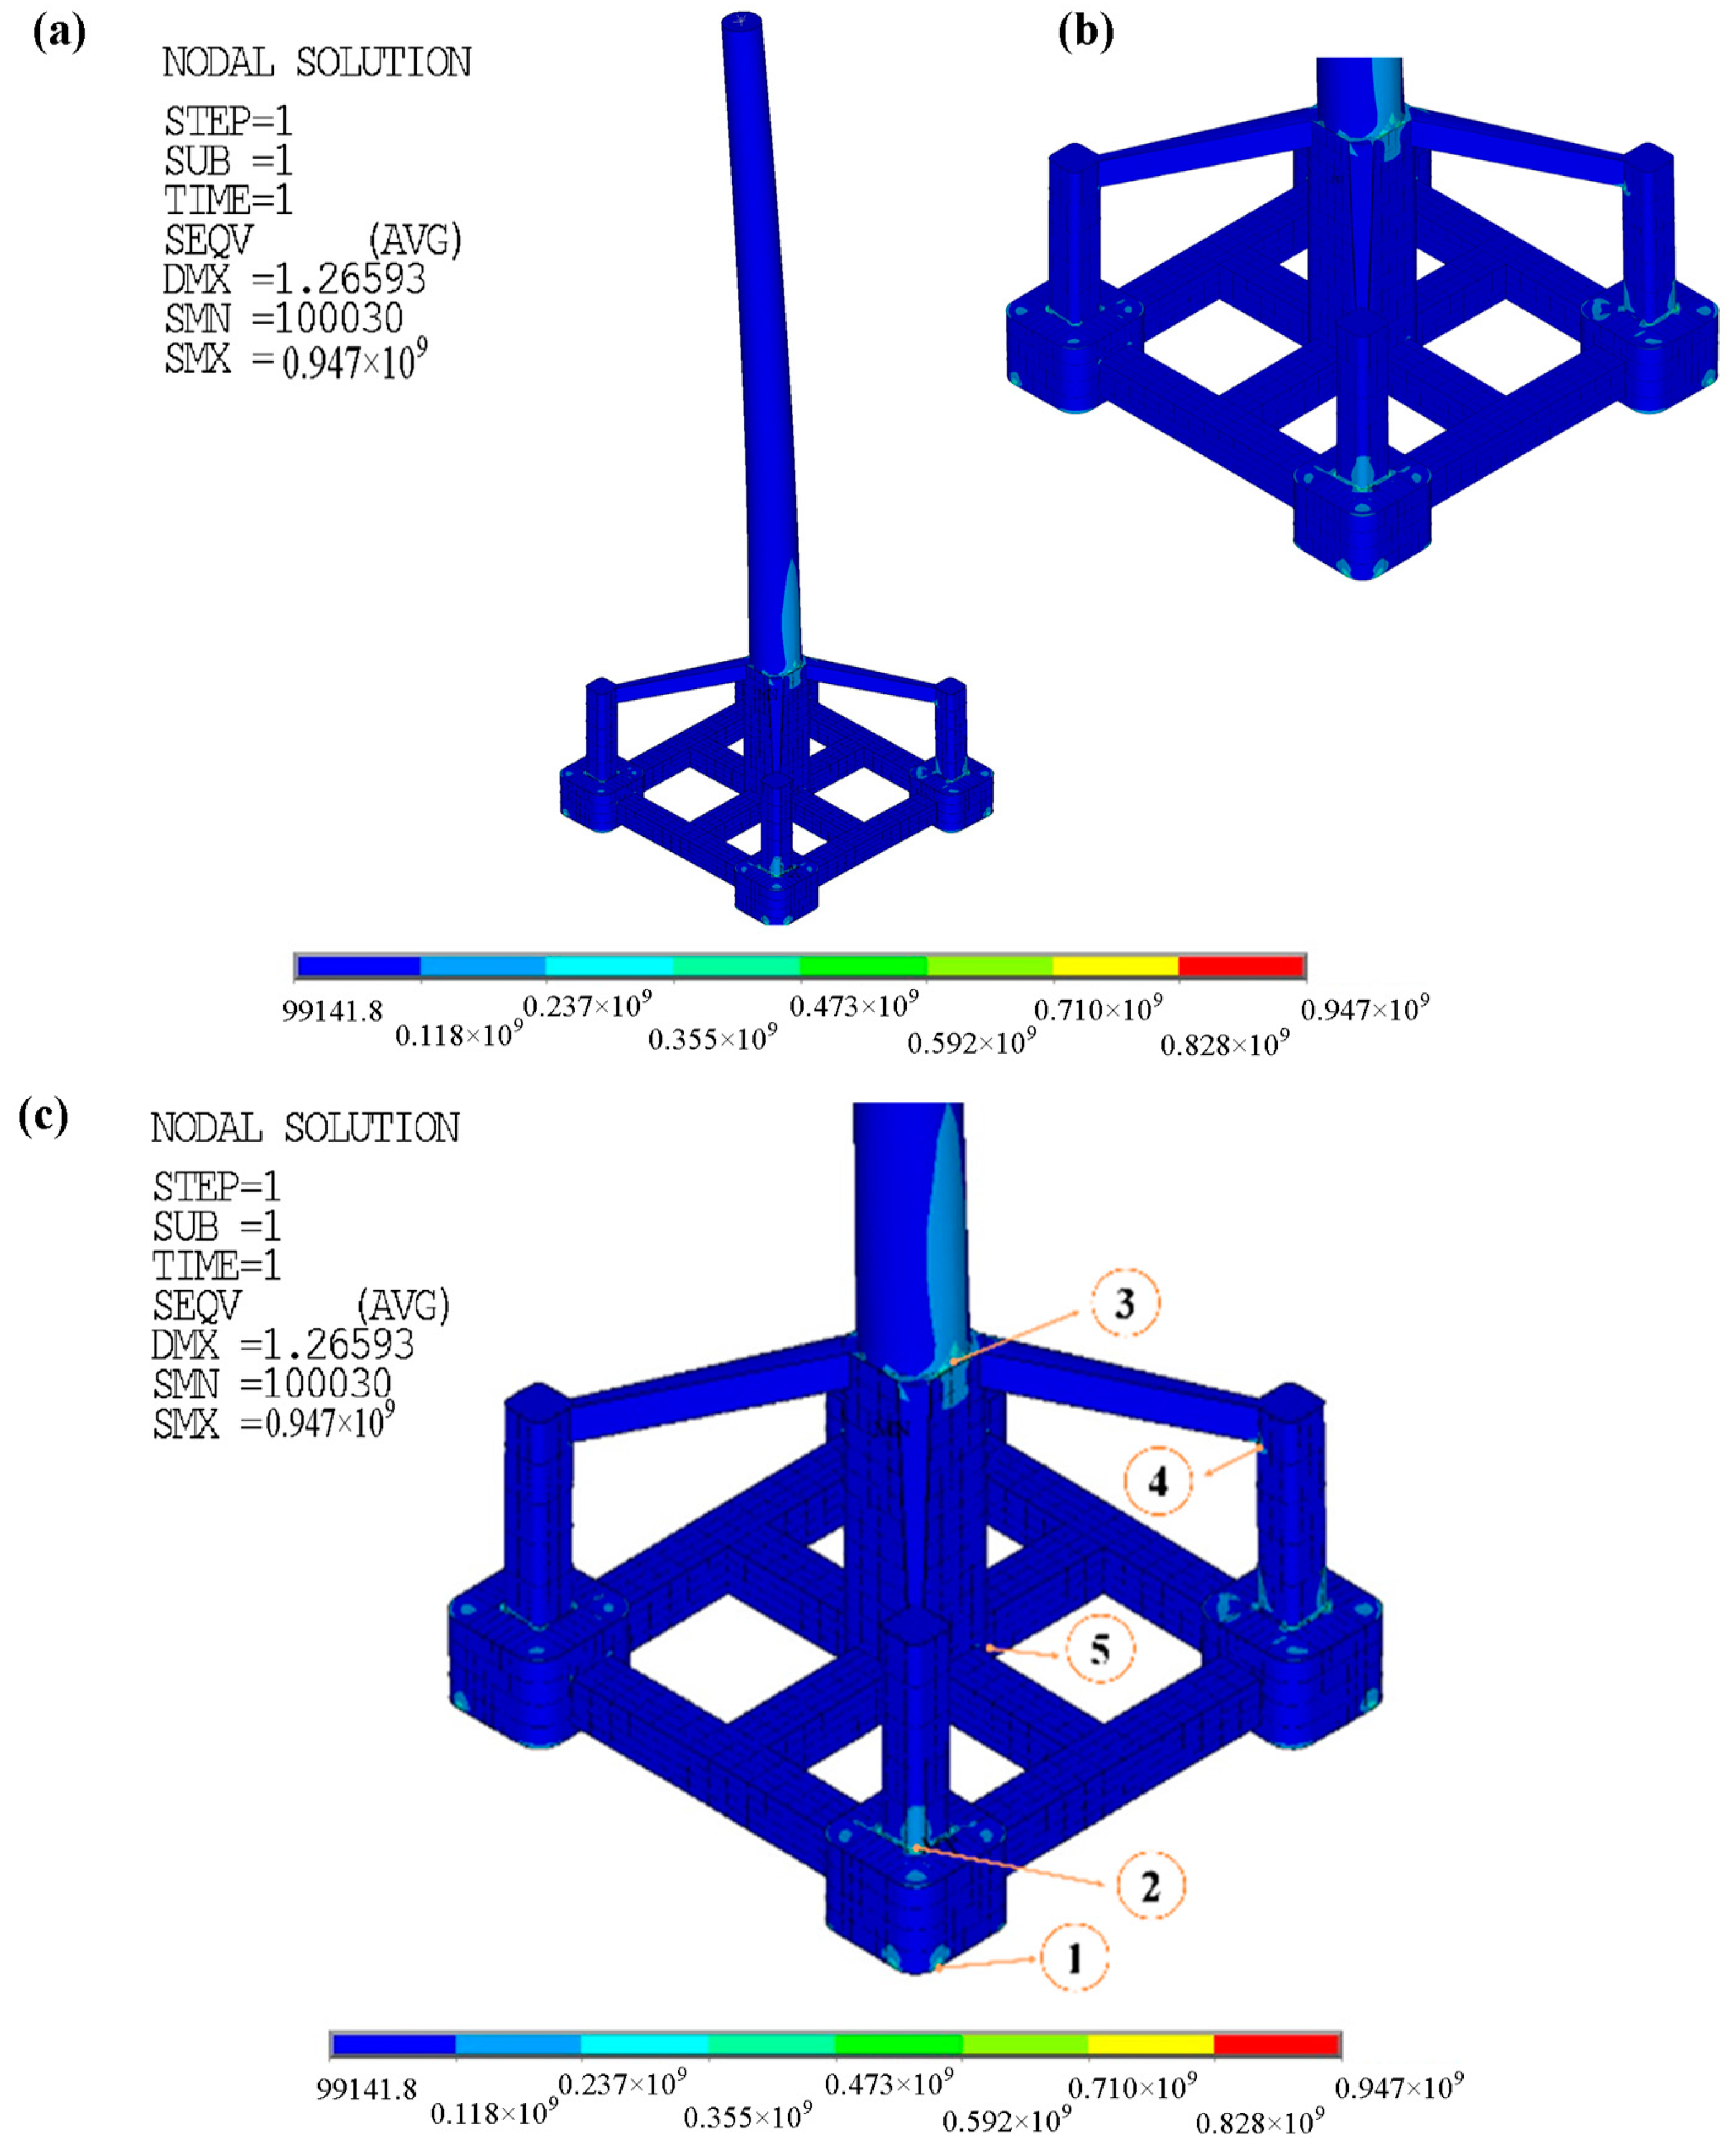
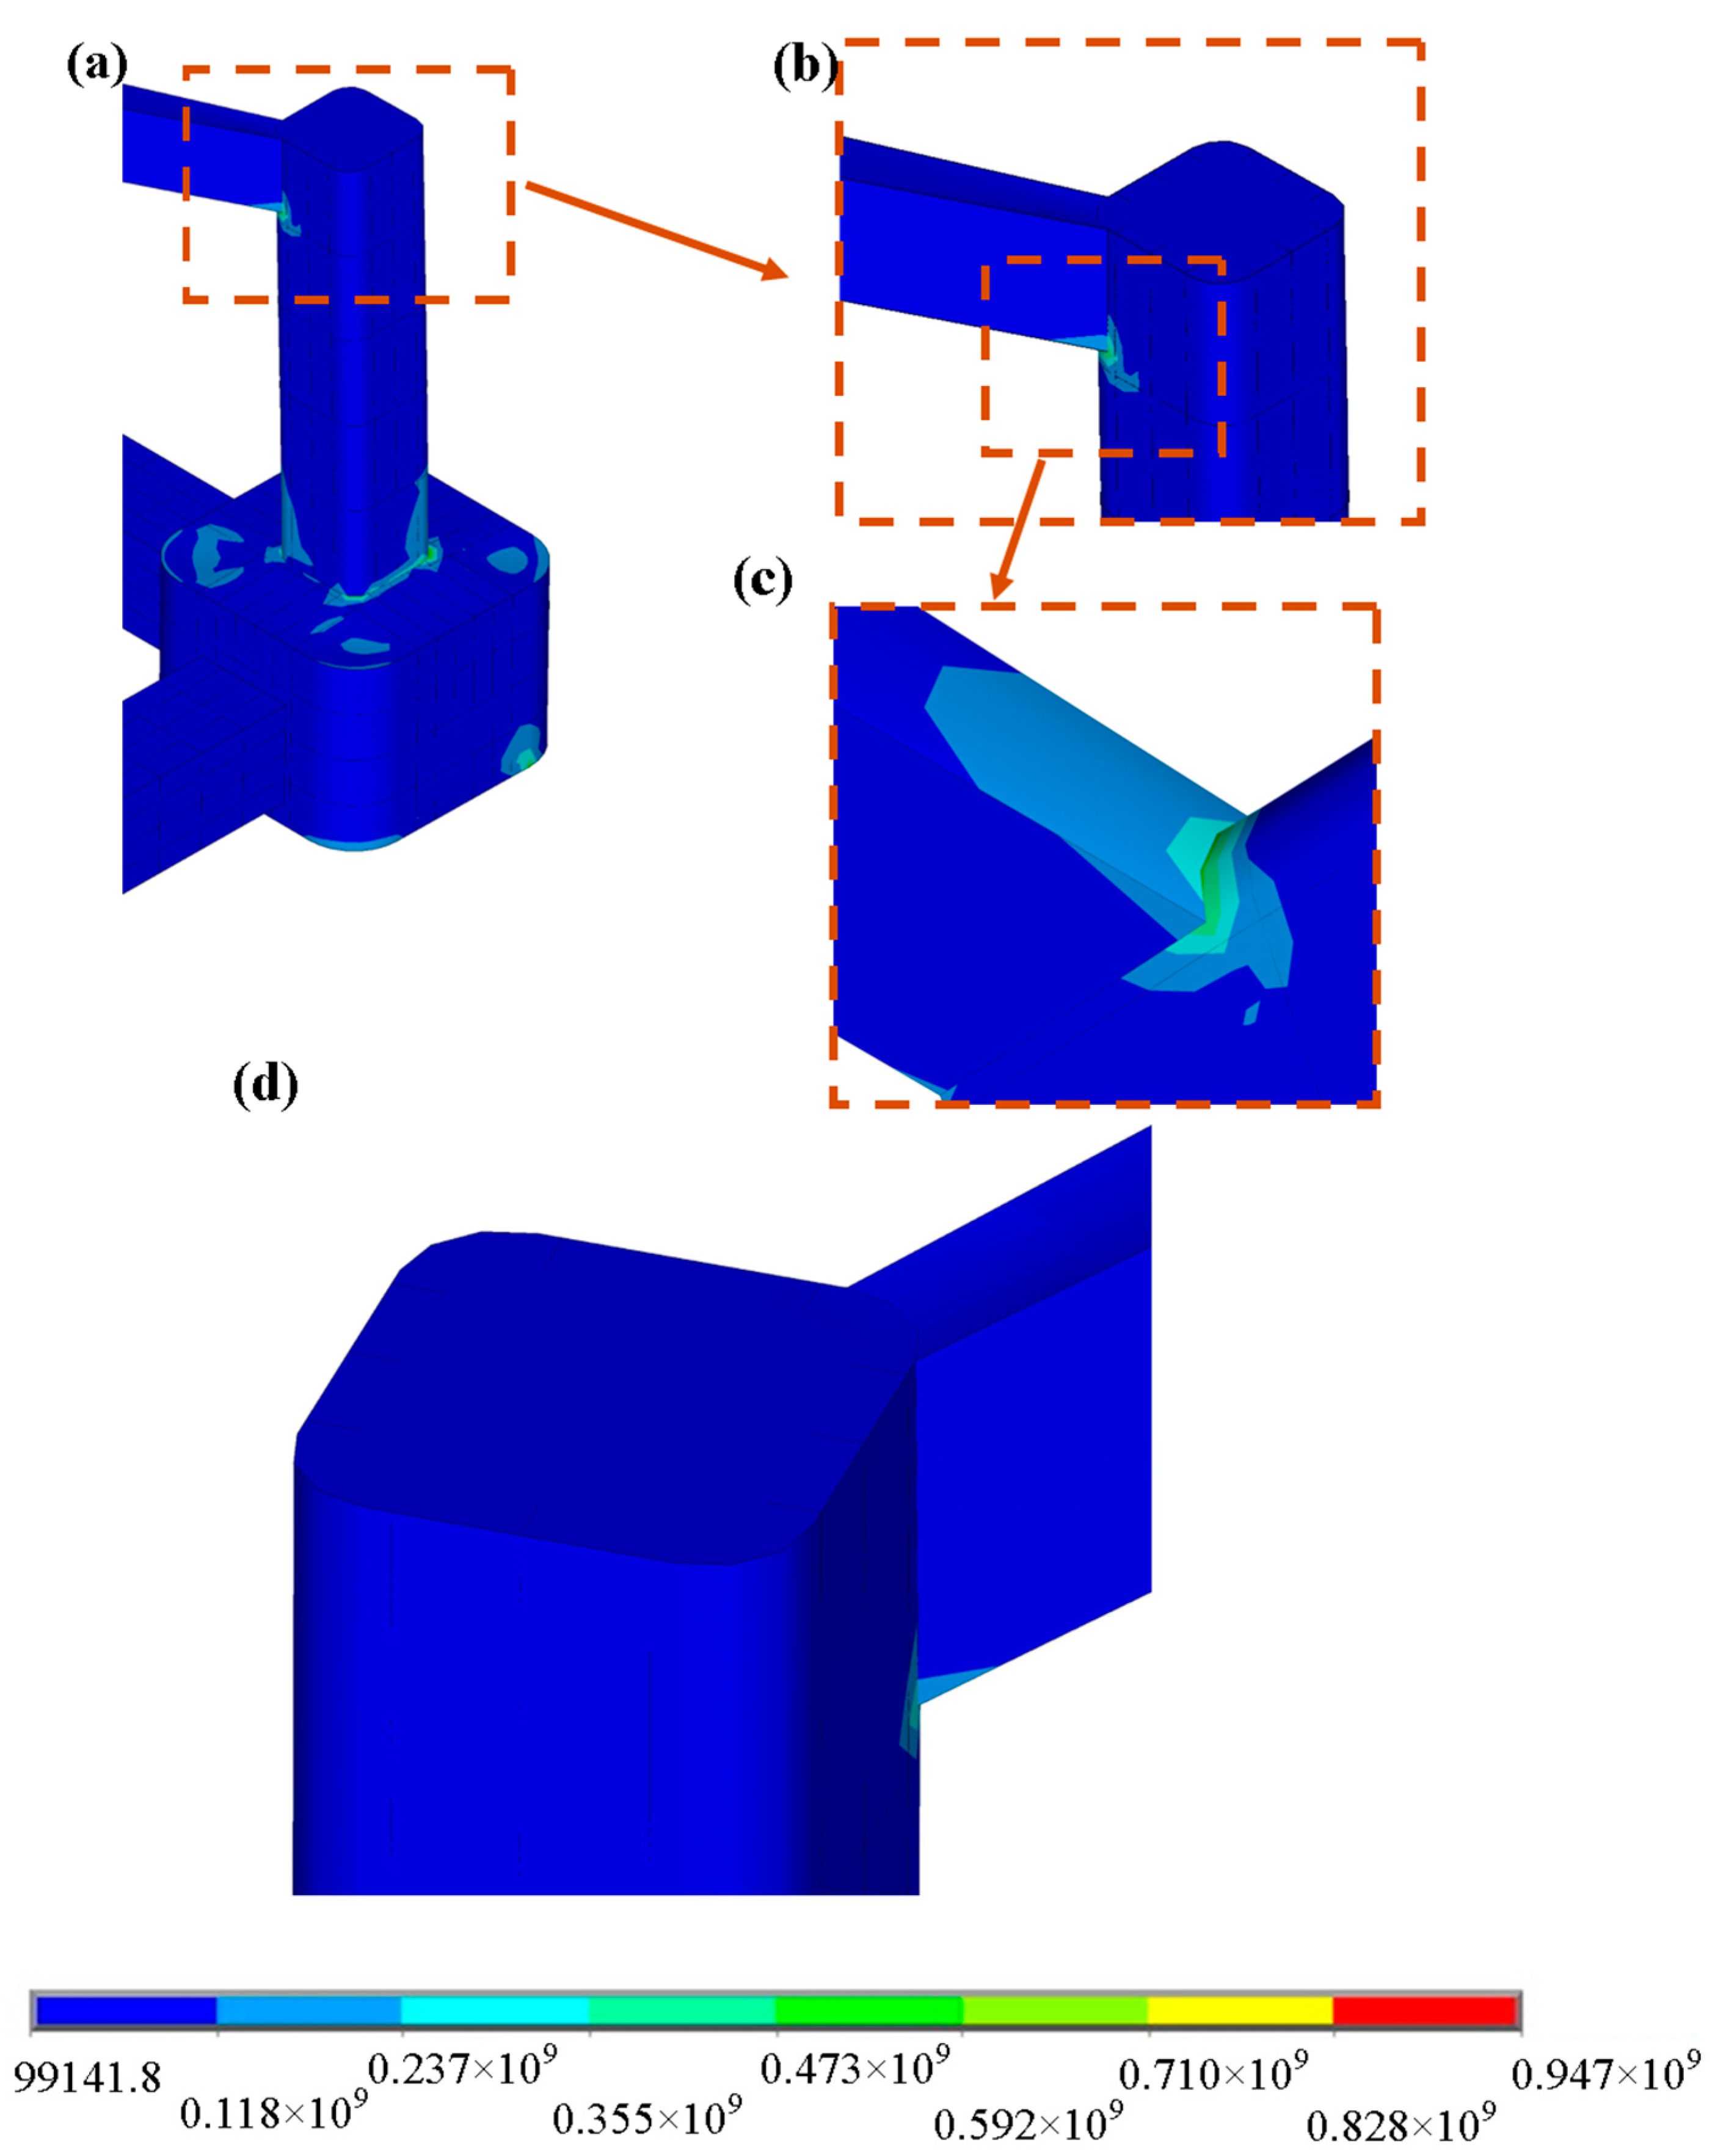
This work aims to assess the preliminary structural design of the CENTEC-TLP 4-column design against the class society guidelines and to identify the locations exposed to higher stresses. Therefore, the platform is structurally analysed in still water conditions using ANSYS
® APDL, with wind thrust applied at a constant rated wind speed. Then, hydrodynamic analysis is performed under wave and wind loads. In addition, a comparison with the results of the earlier work of Uzunoglu and Guedes Soares [
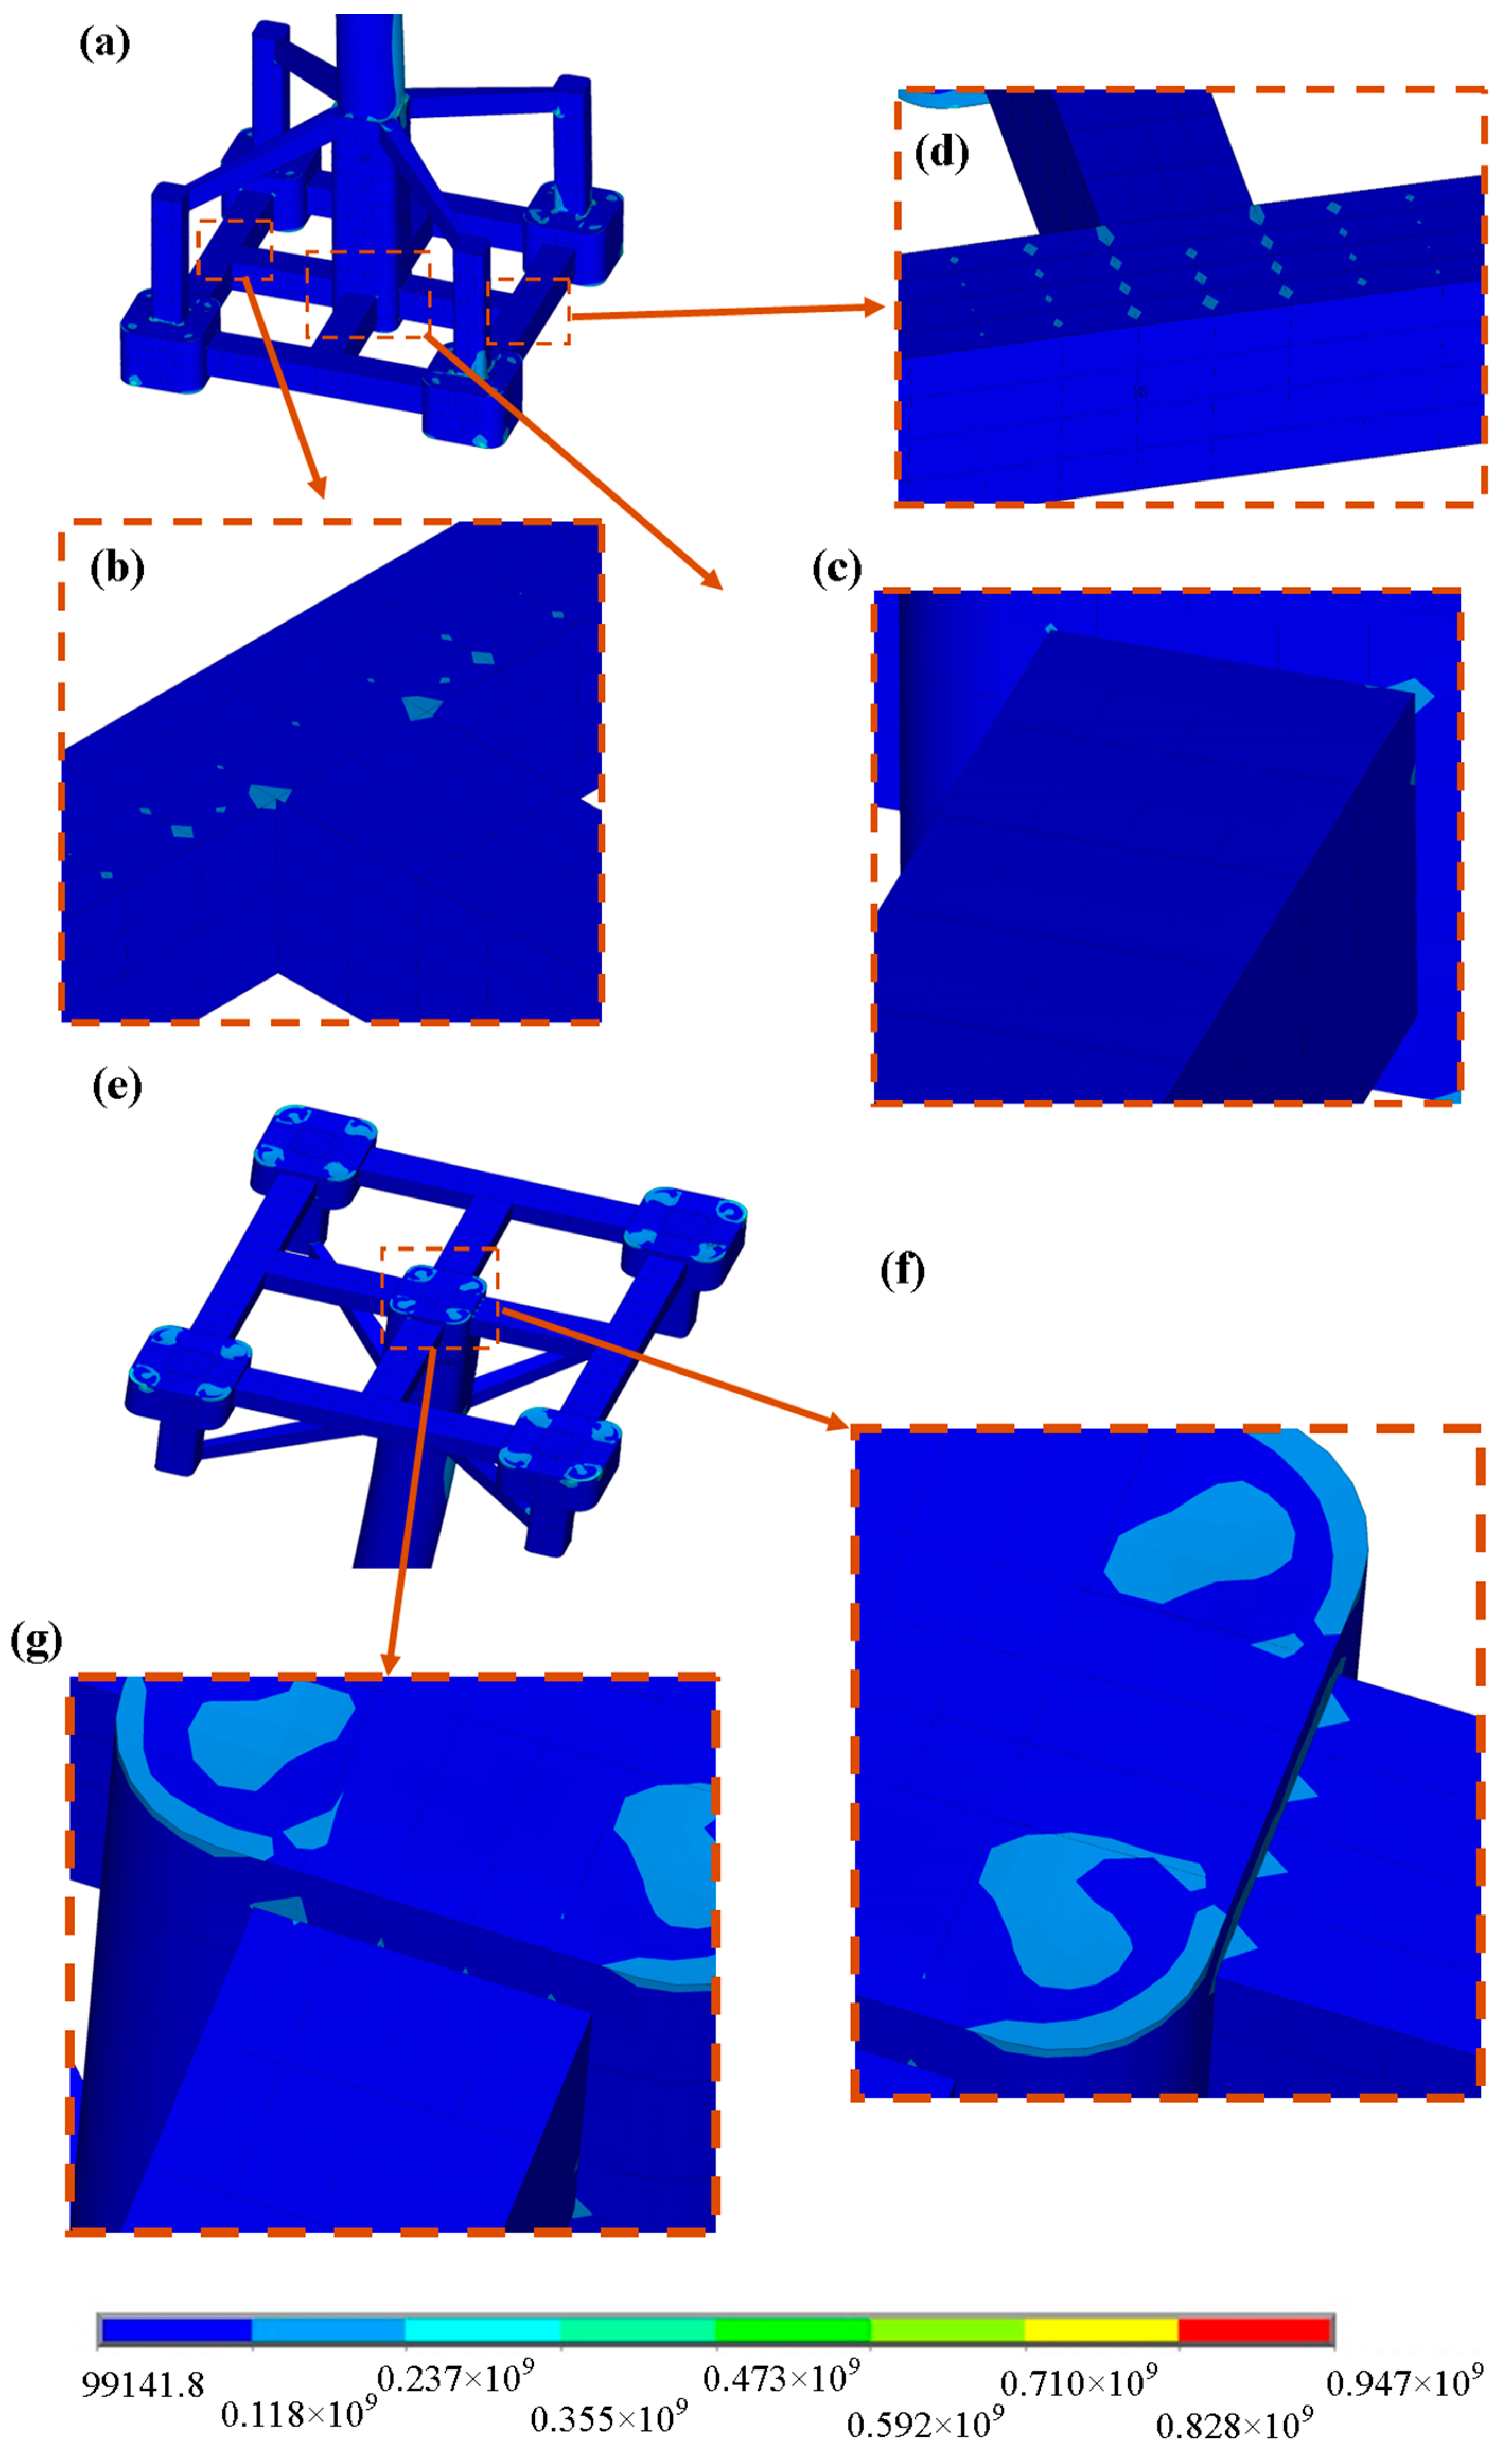
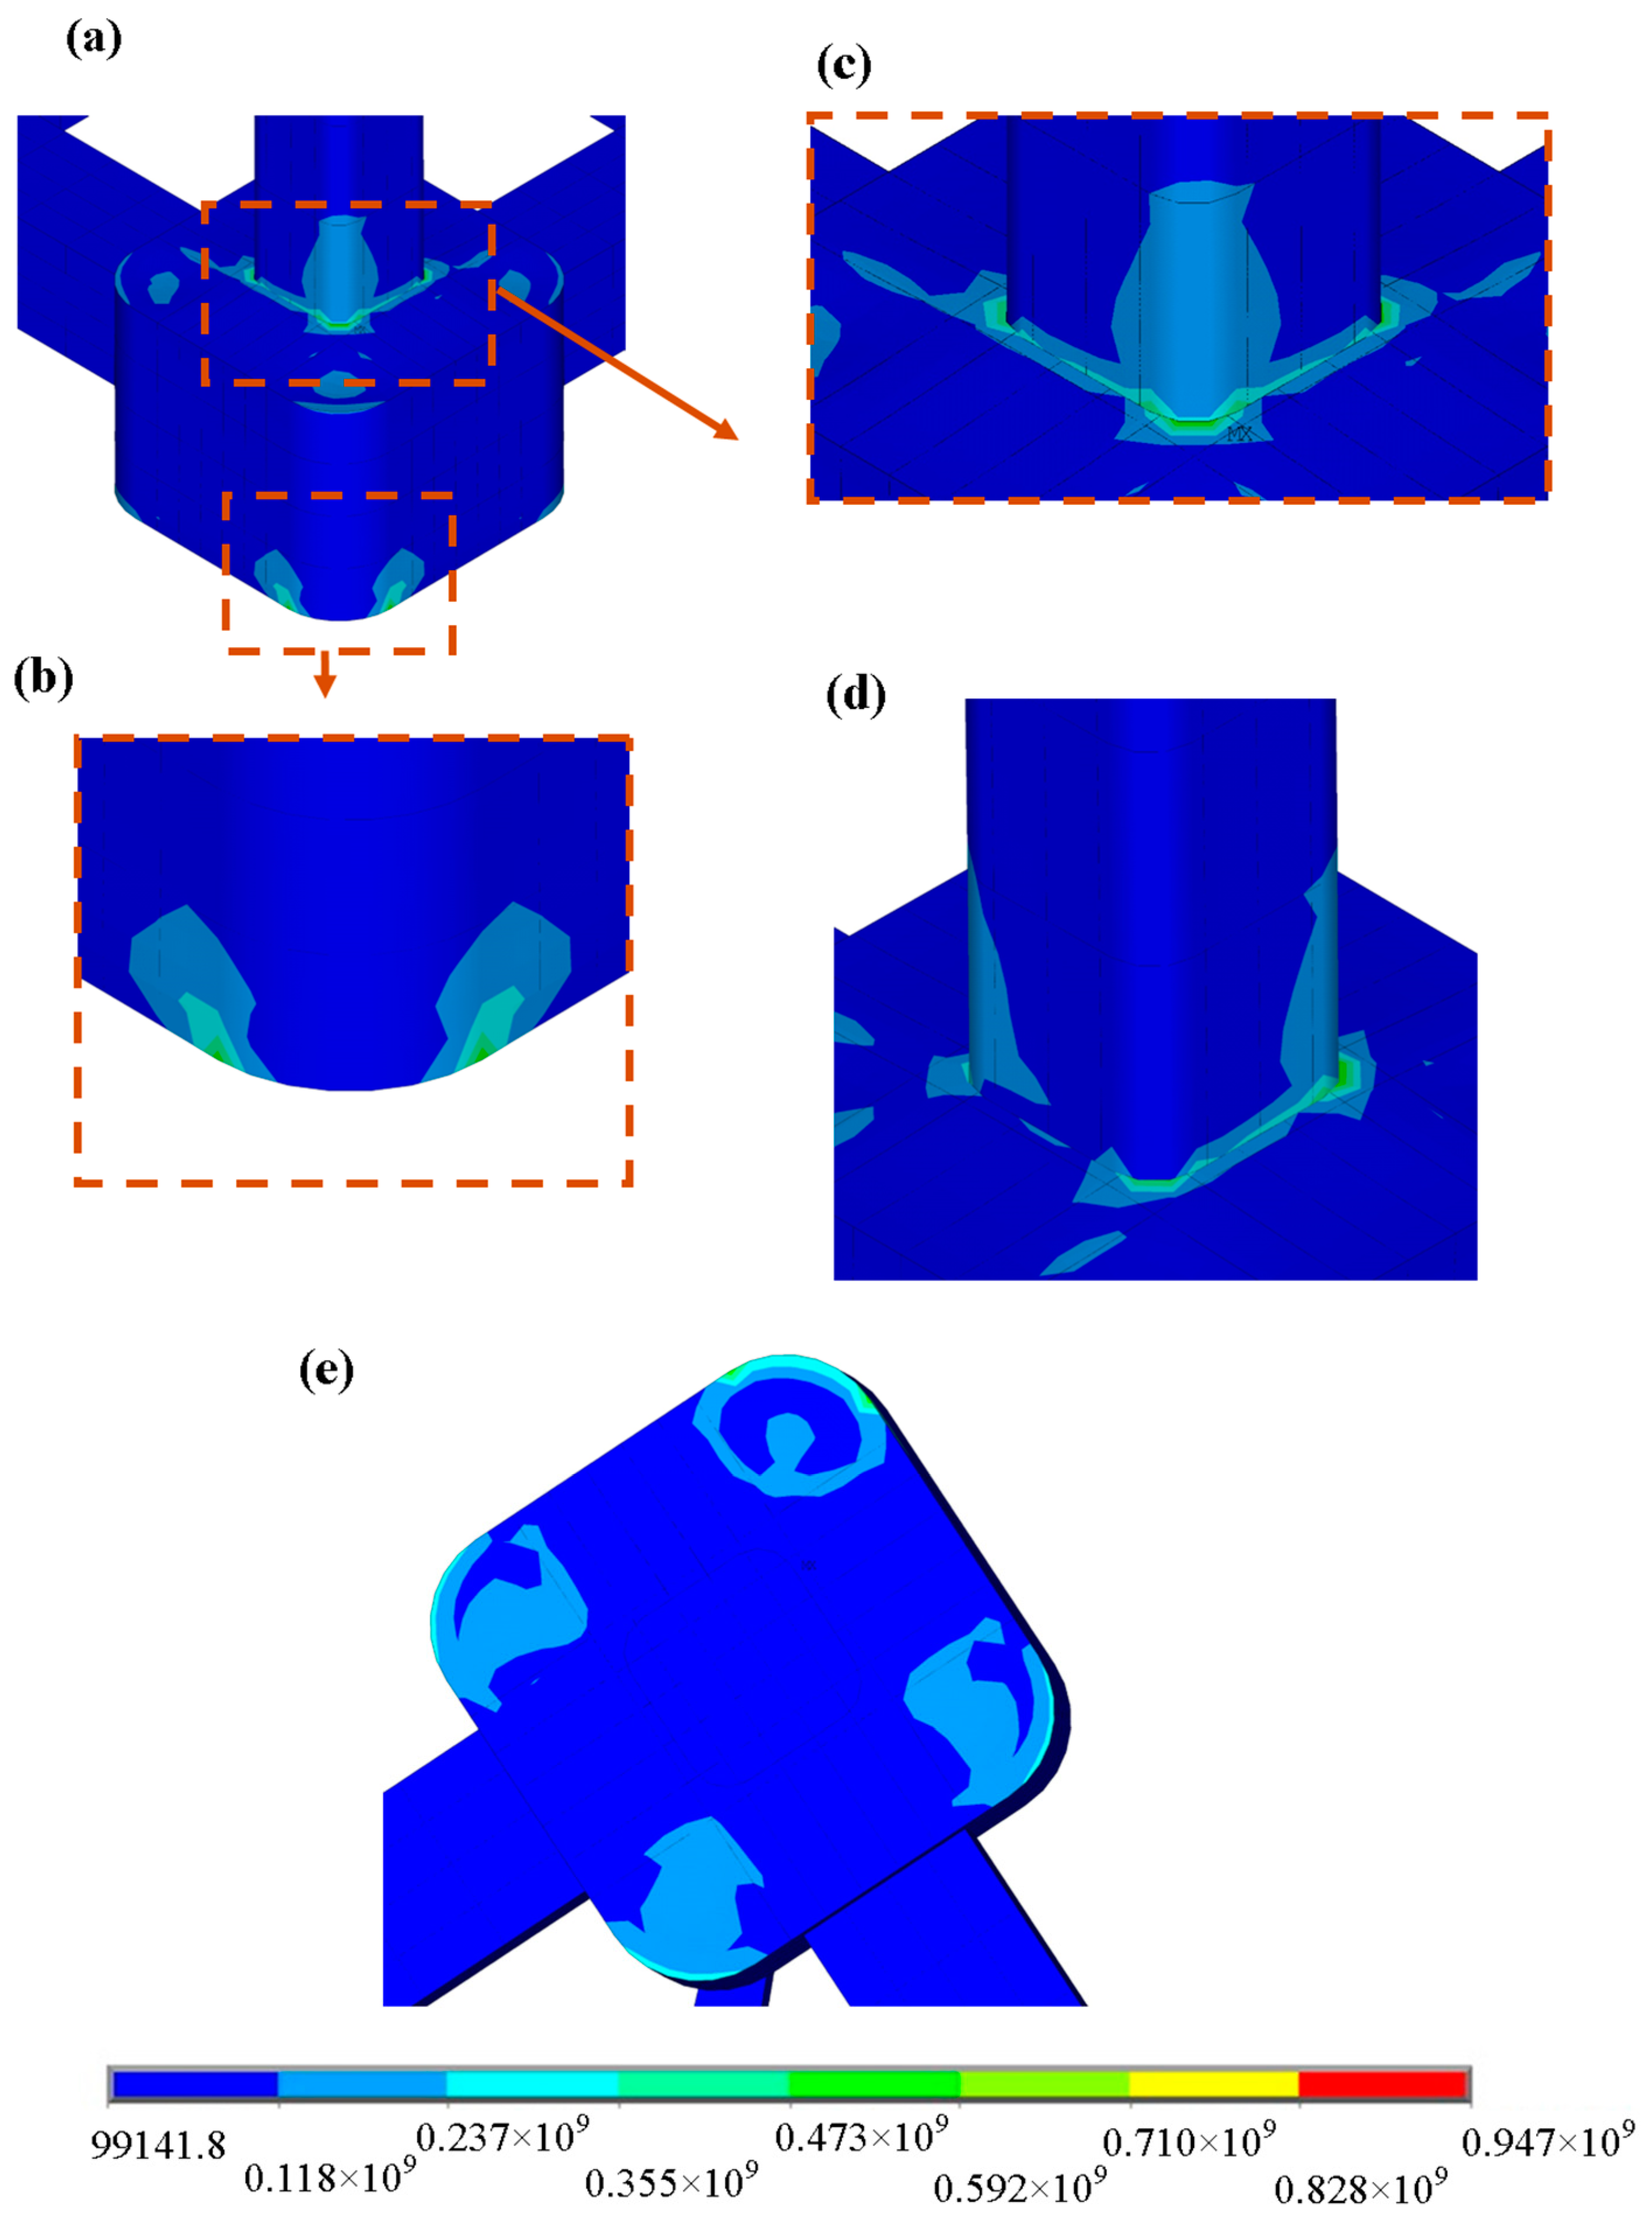
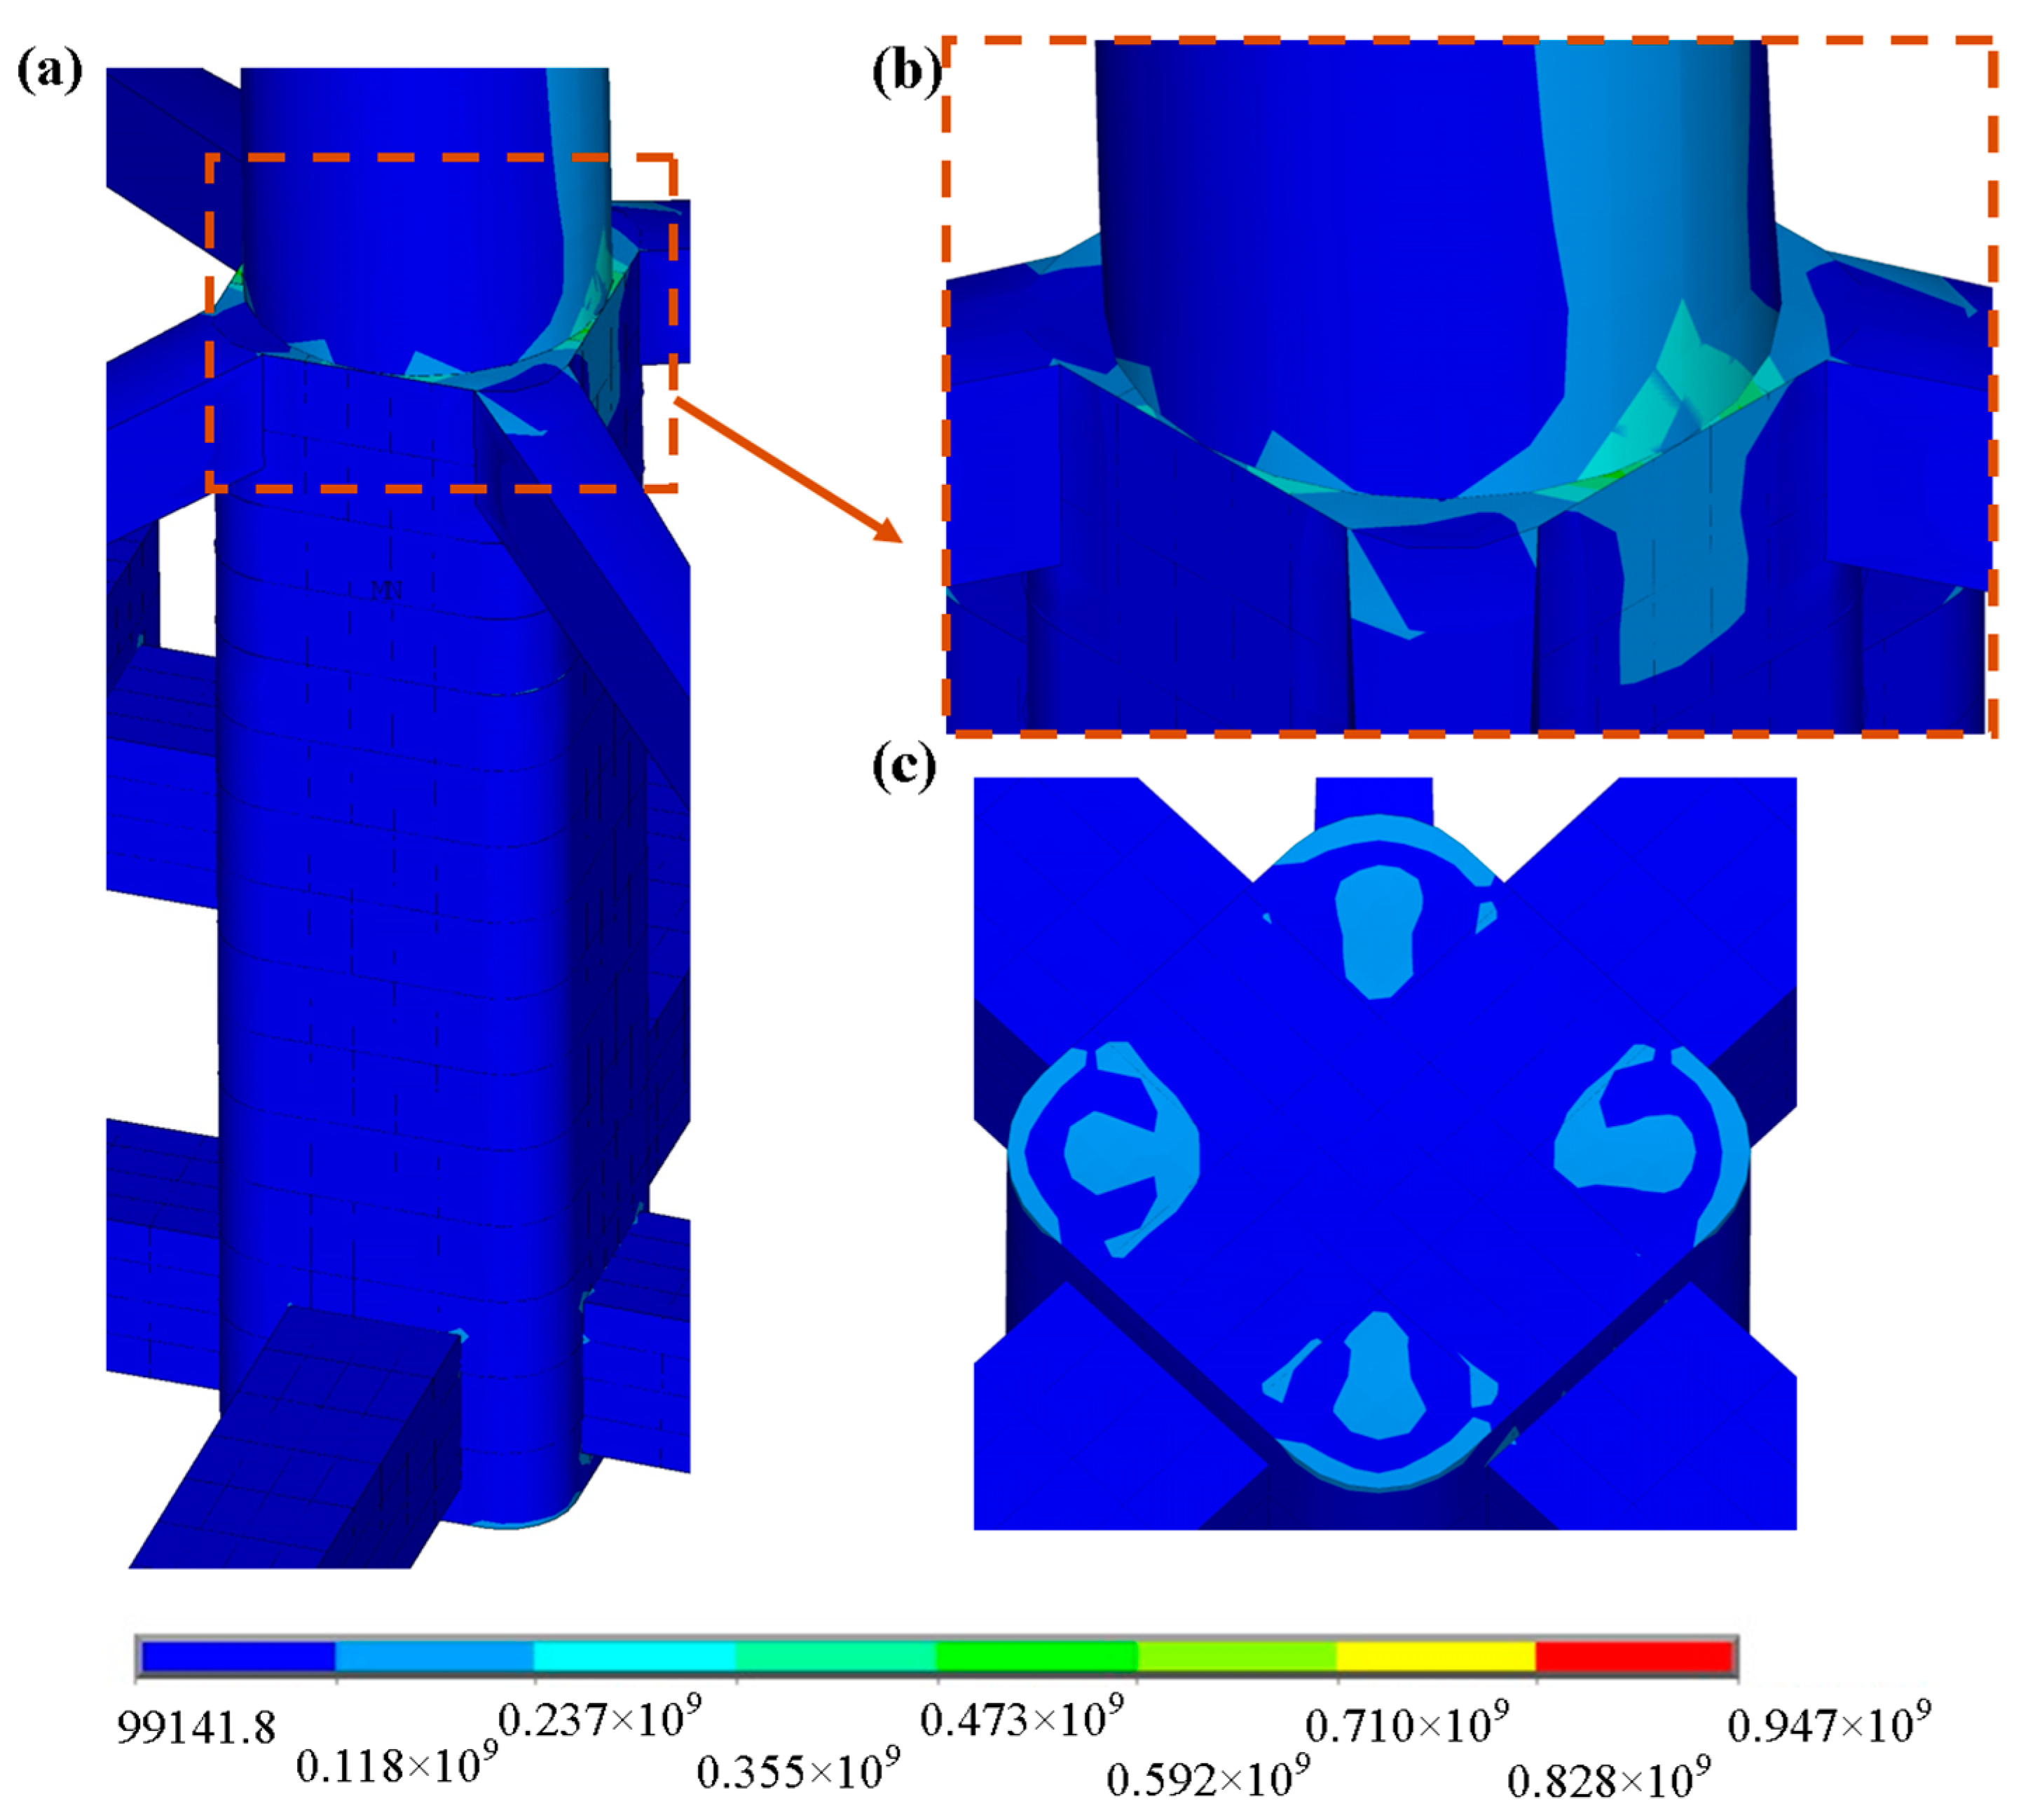
7] is carried out. Finally, the stress distribution is evaluated on the sections of the platform to identify the critical sections that require further reinforcements.
3. Development of the FEM Model
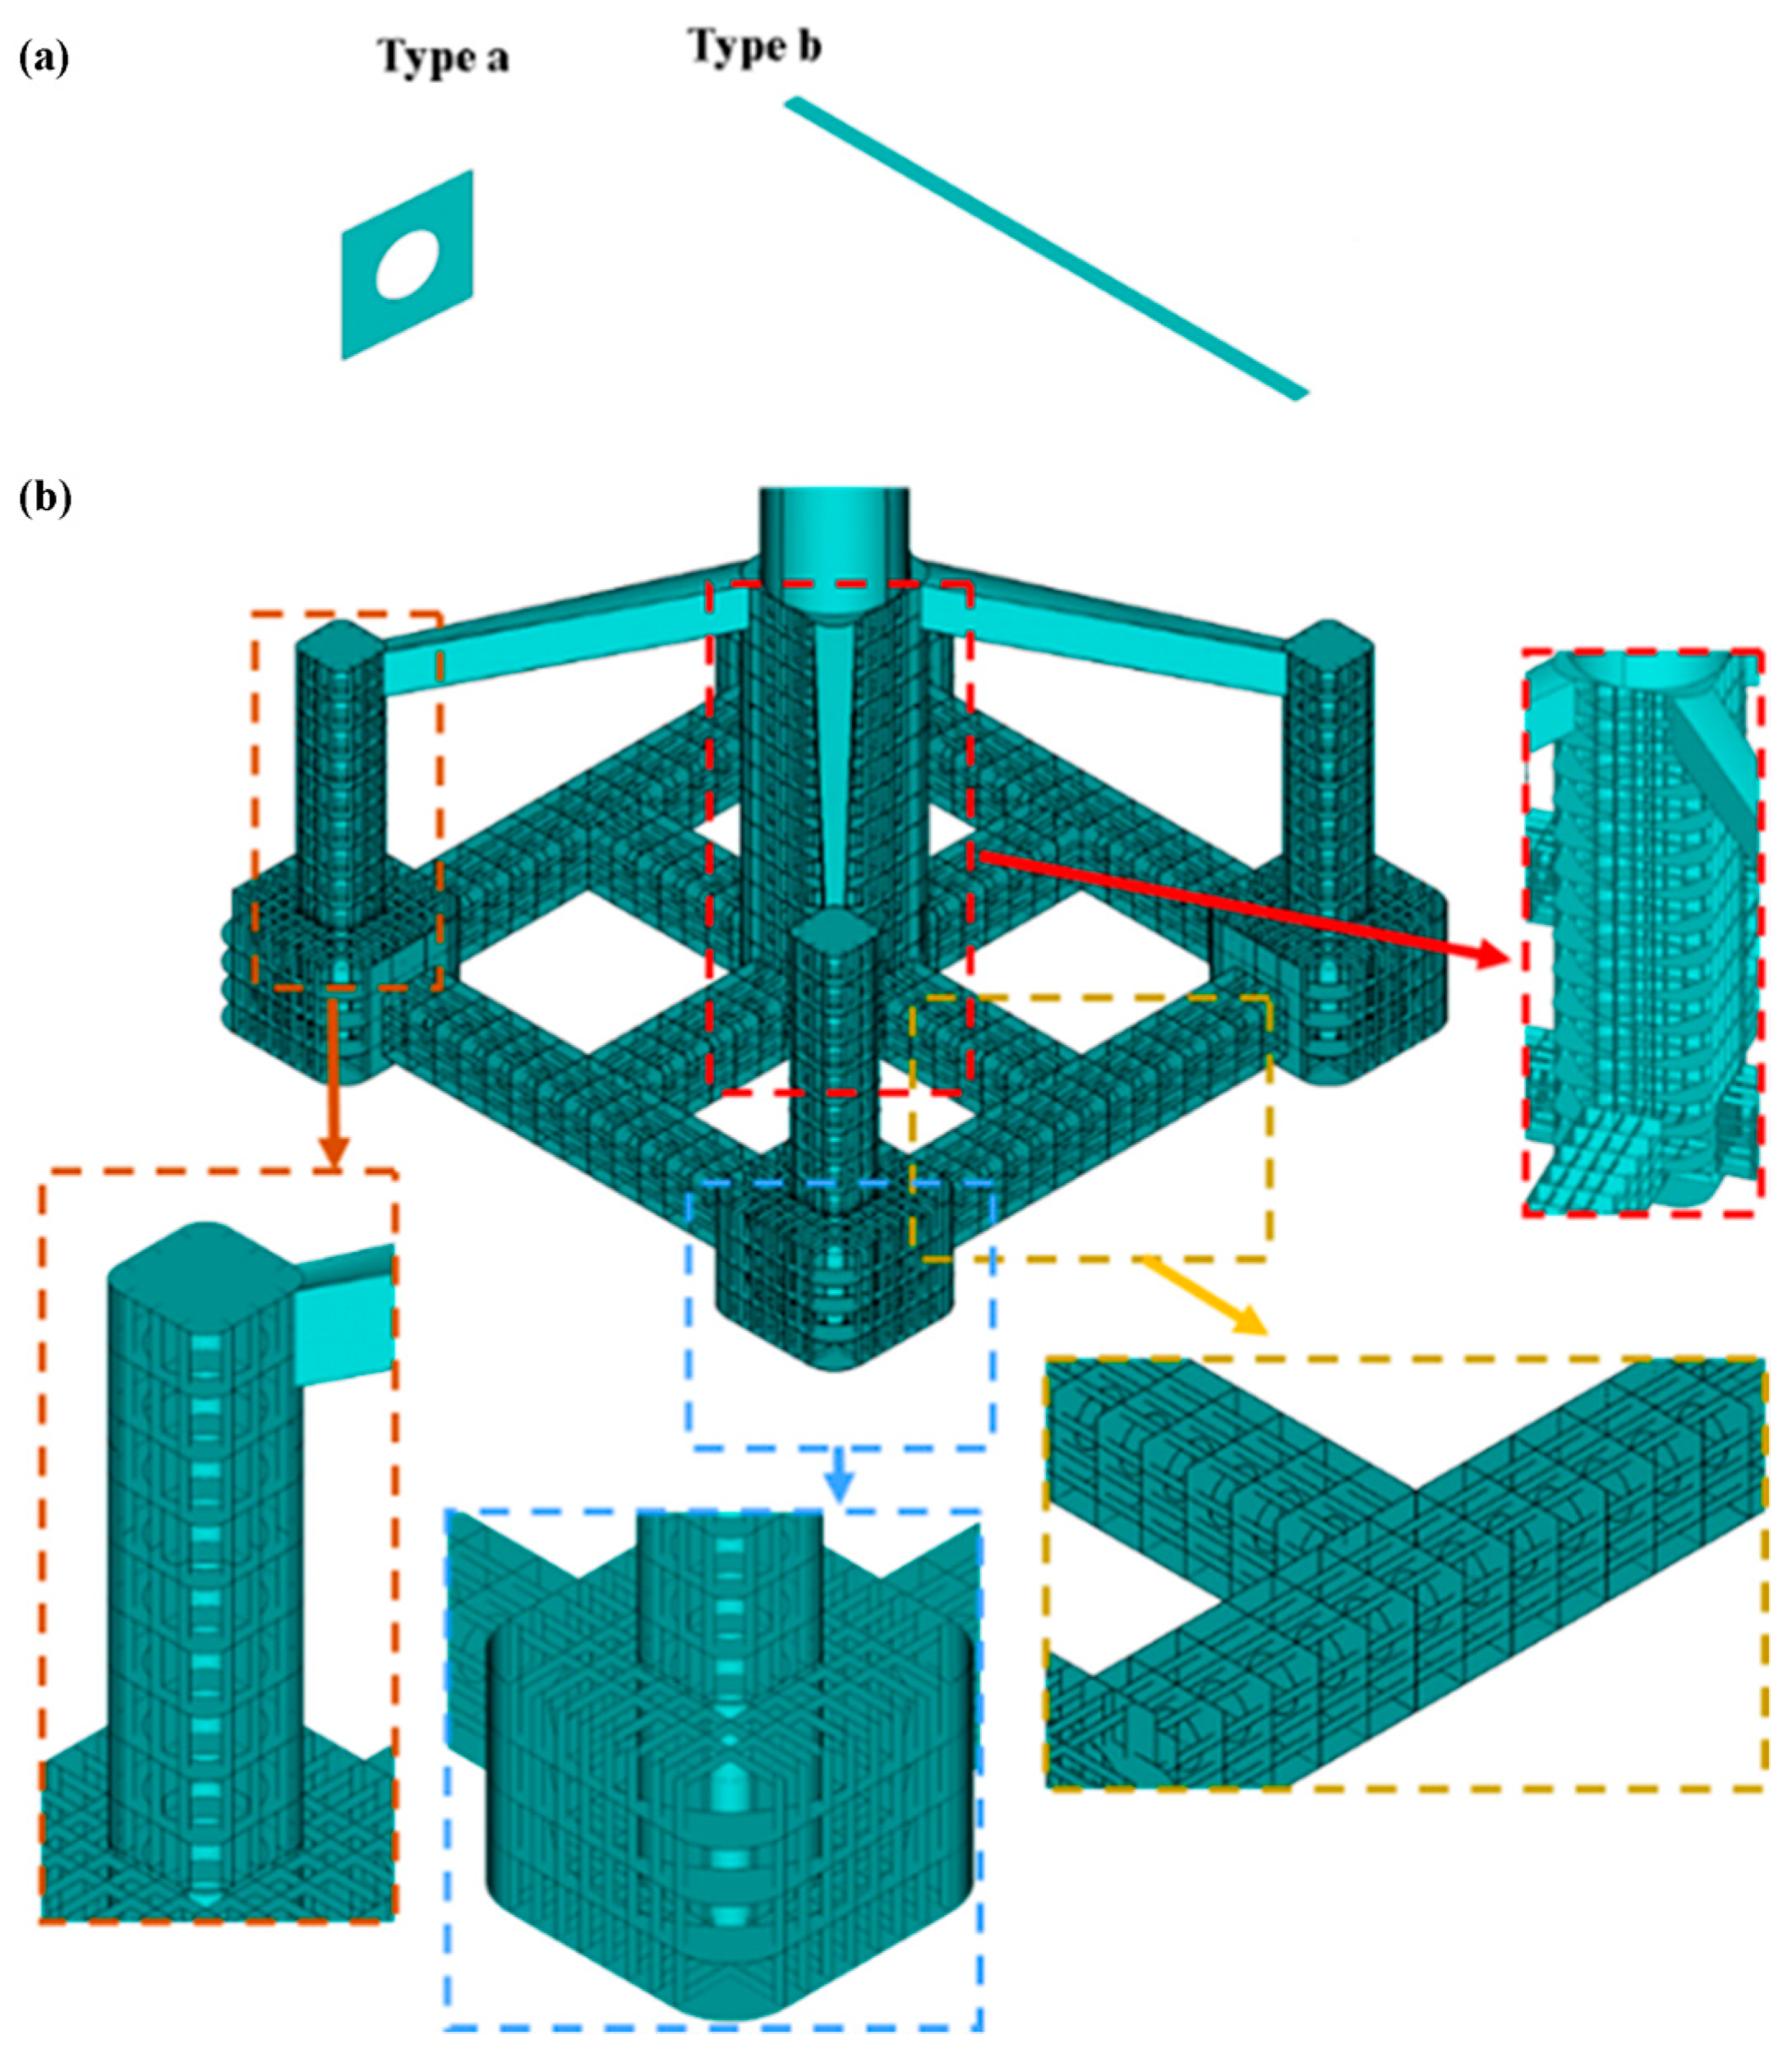
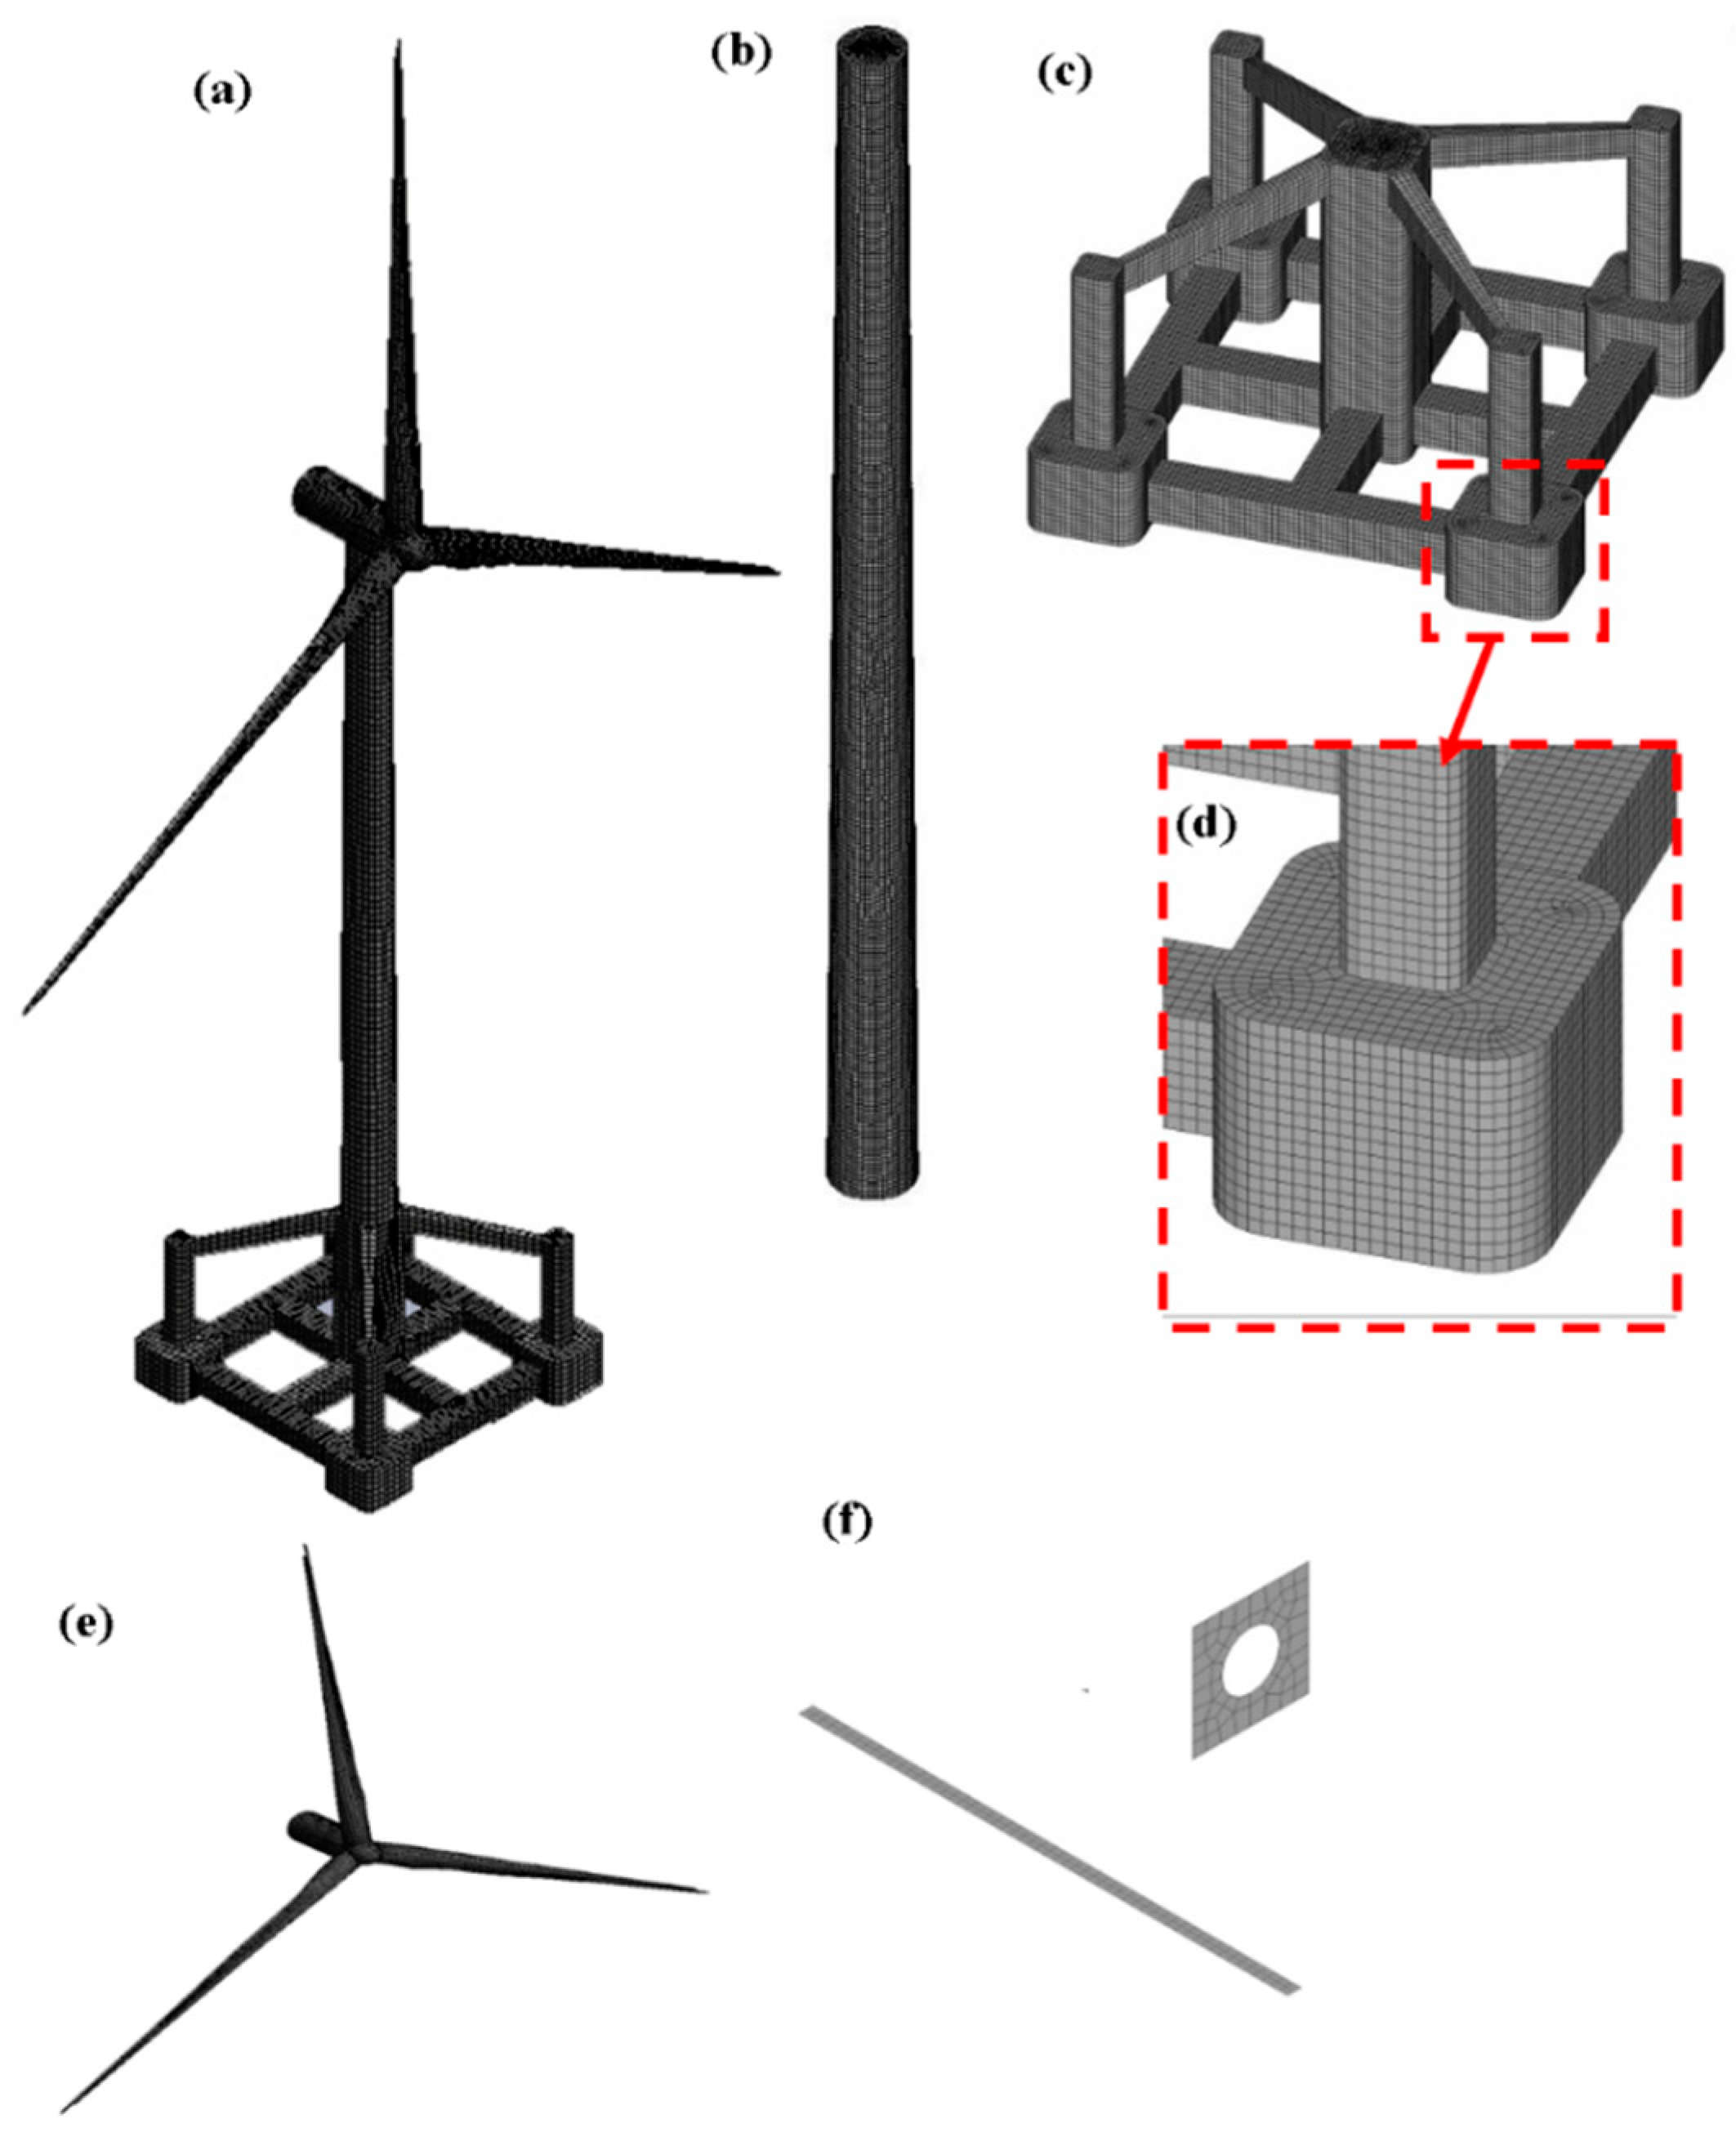
To model the TLP, Shell 281 element with eight nodes in the ANSYS is used (
Figure 3). The ANSYS contact capability is utilized to model the interaction of the stiffeners and TLP. In contact between two elements, the node-to-line method is established as the target and the contact. The hull of the TLP was defined as the target surface, and the edges of the stiffeners were introduced as the contact surface. The mesh size is 0.5 m (Yeter et al. [
14]) for the TLP and 1.0 m for the tower, and the turbine is 0.3 m.
The mesh size is larger in the tower as the focus is on the stress distribution on the TLP. The meshed TLP with 10 MW wind turbine and stiffeners are presented in
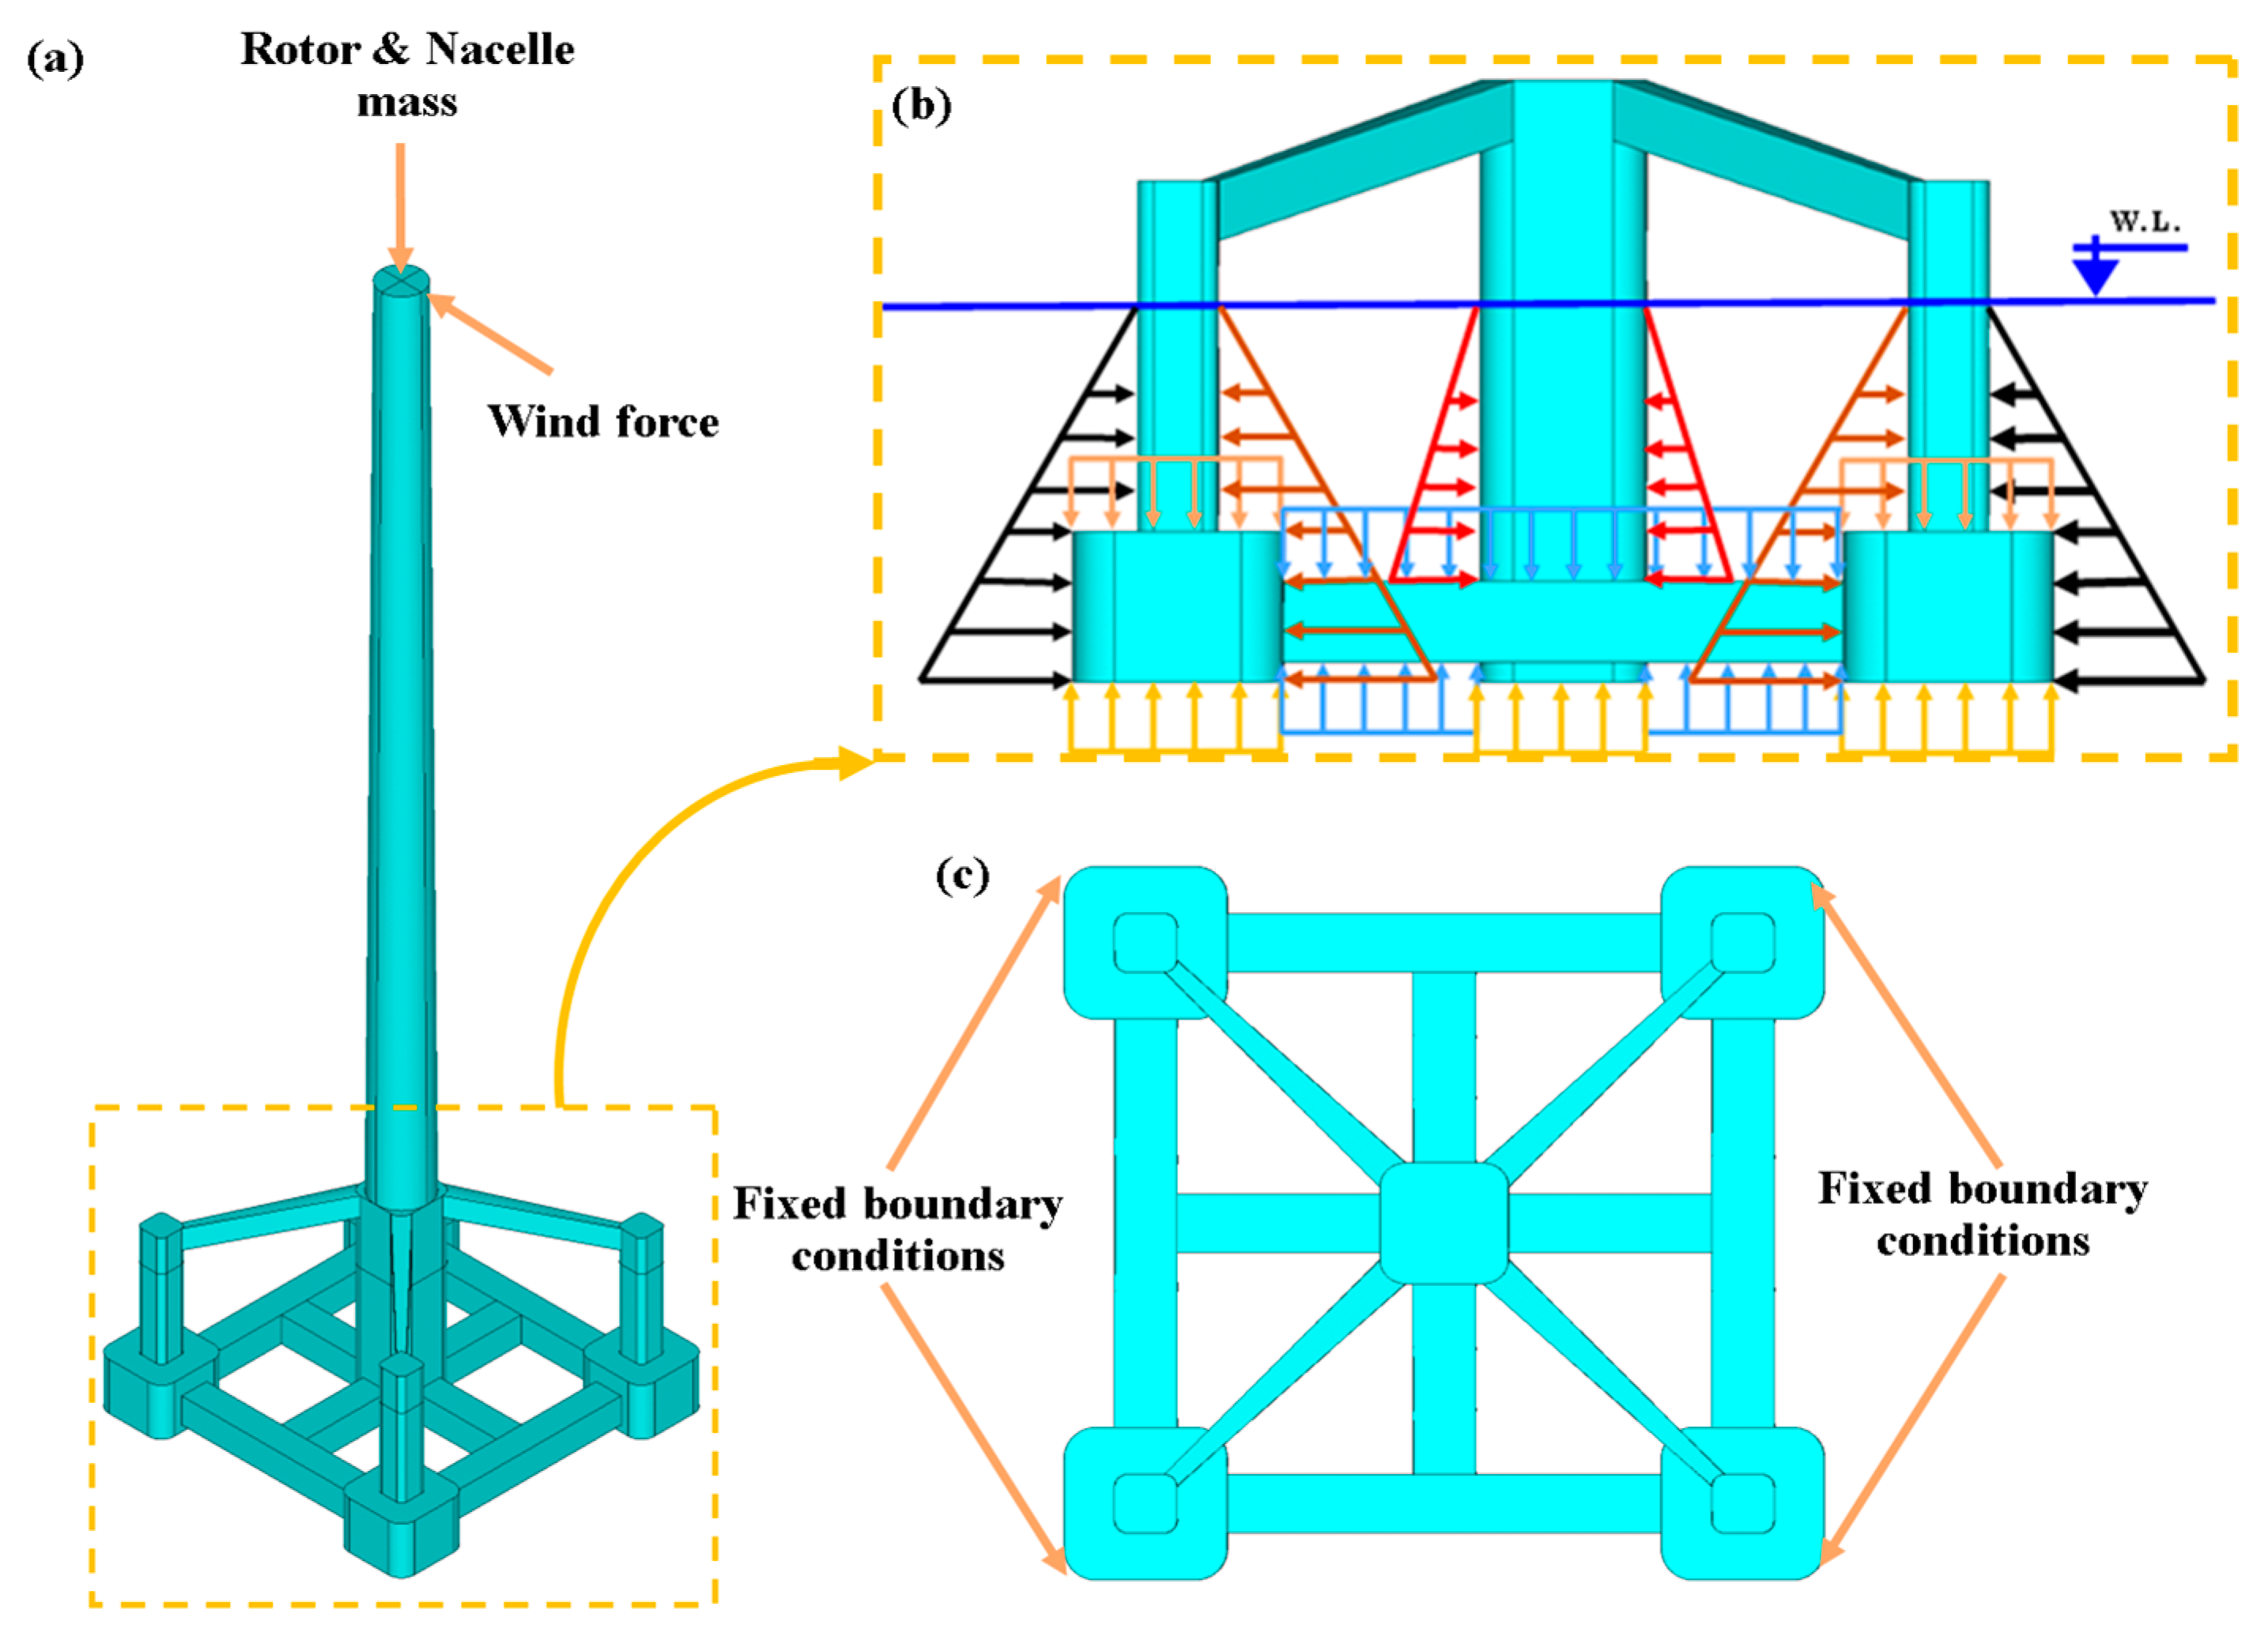
Figure 3. To analyze the stress distribution, the rotor, and the nacelle weight are defined as a point mass, and the wind pressure is defined as a force on the top of the tower (
Figure 4a). The wind force and the moment of the nacelle and the rotor are 1500 kN and 40 MN·m, respectively. The TLP is under hydrostatic pressure as the still water, as shown in
Figure 4b. The TLP’s draft after installation is 20 m. Fixed boundary conditions are used in each corner of the model in the locations of tendons (
Figure 4c).
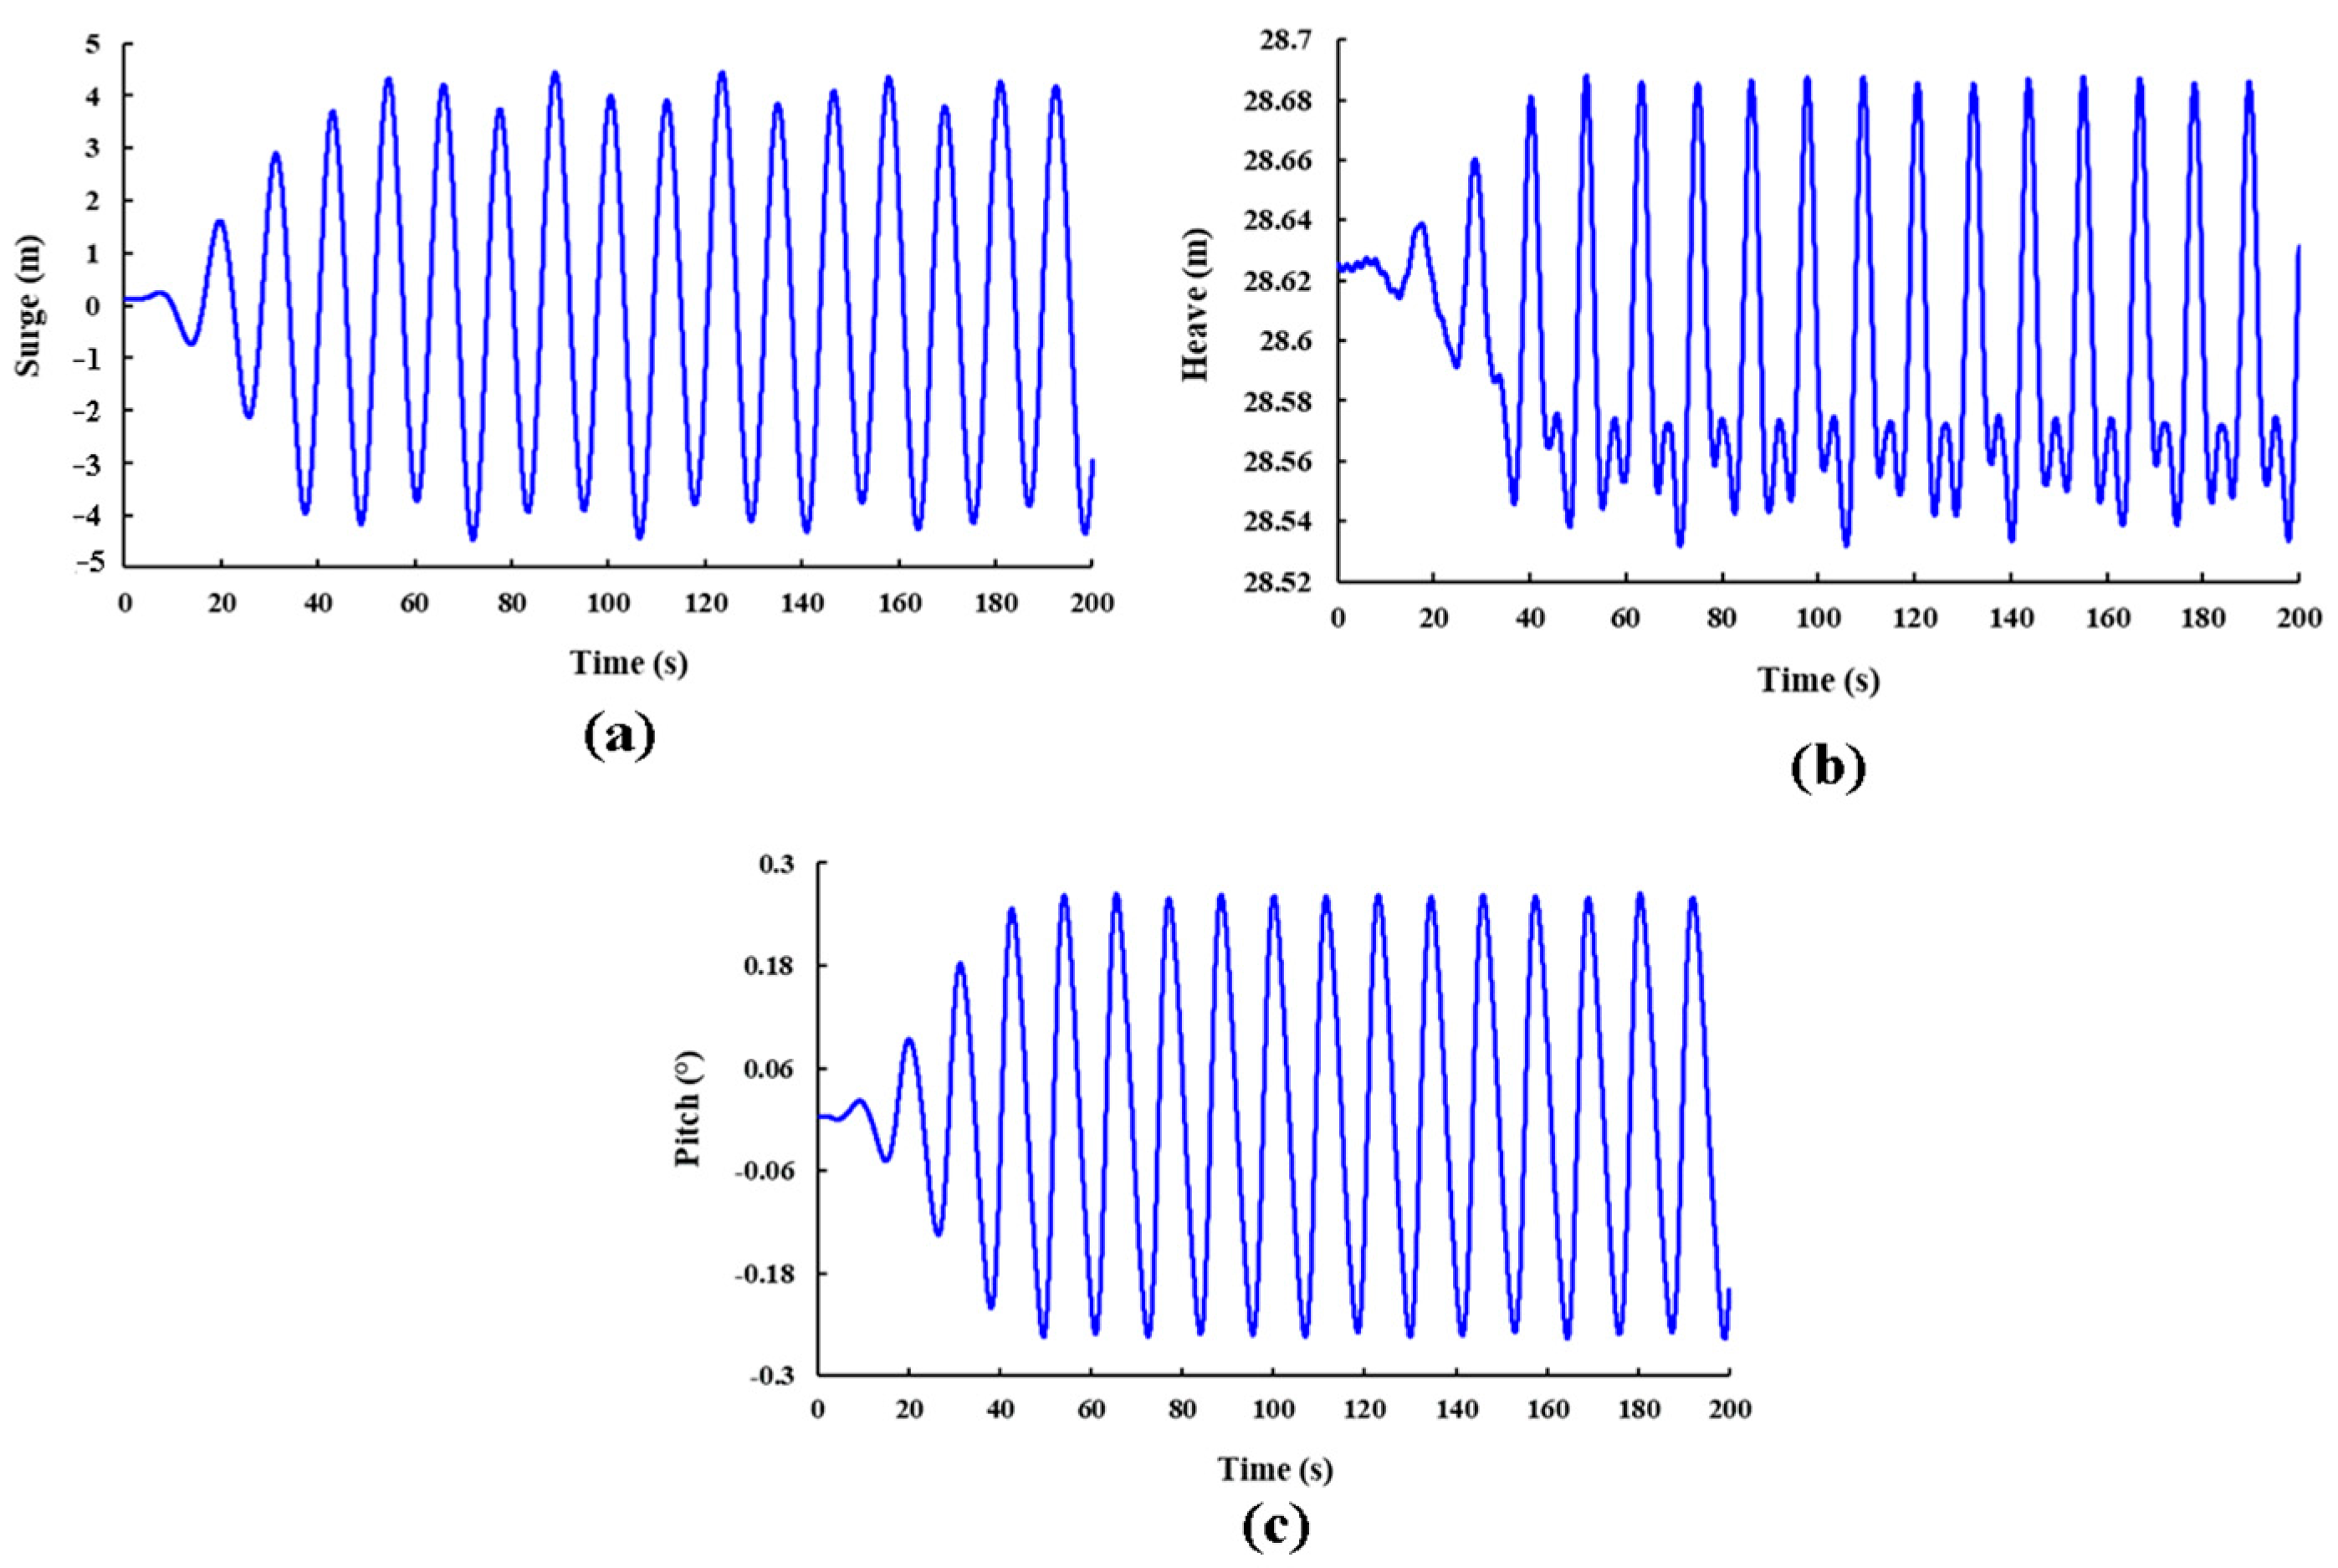
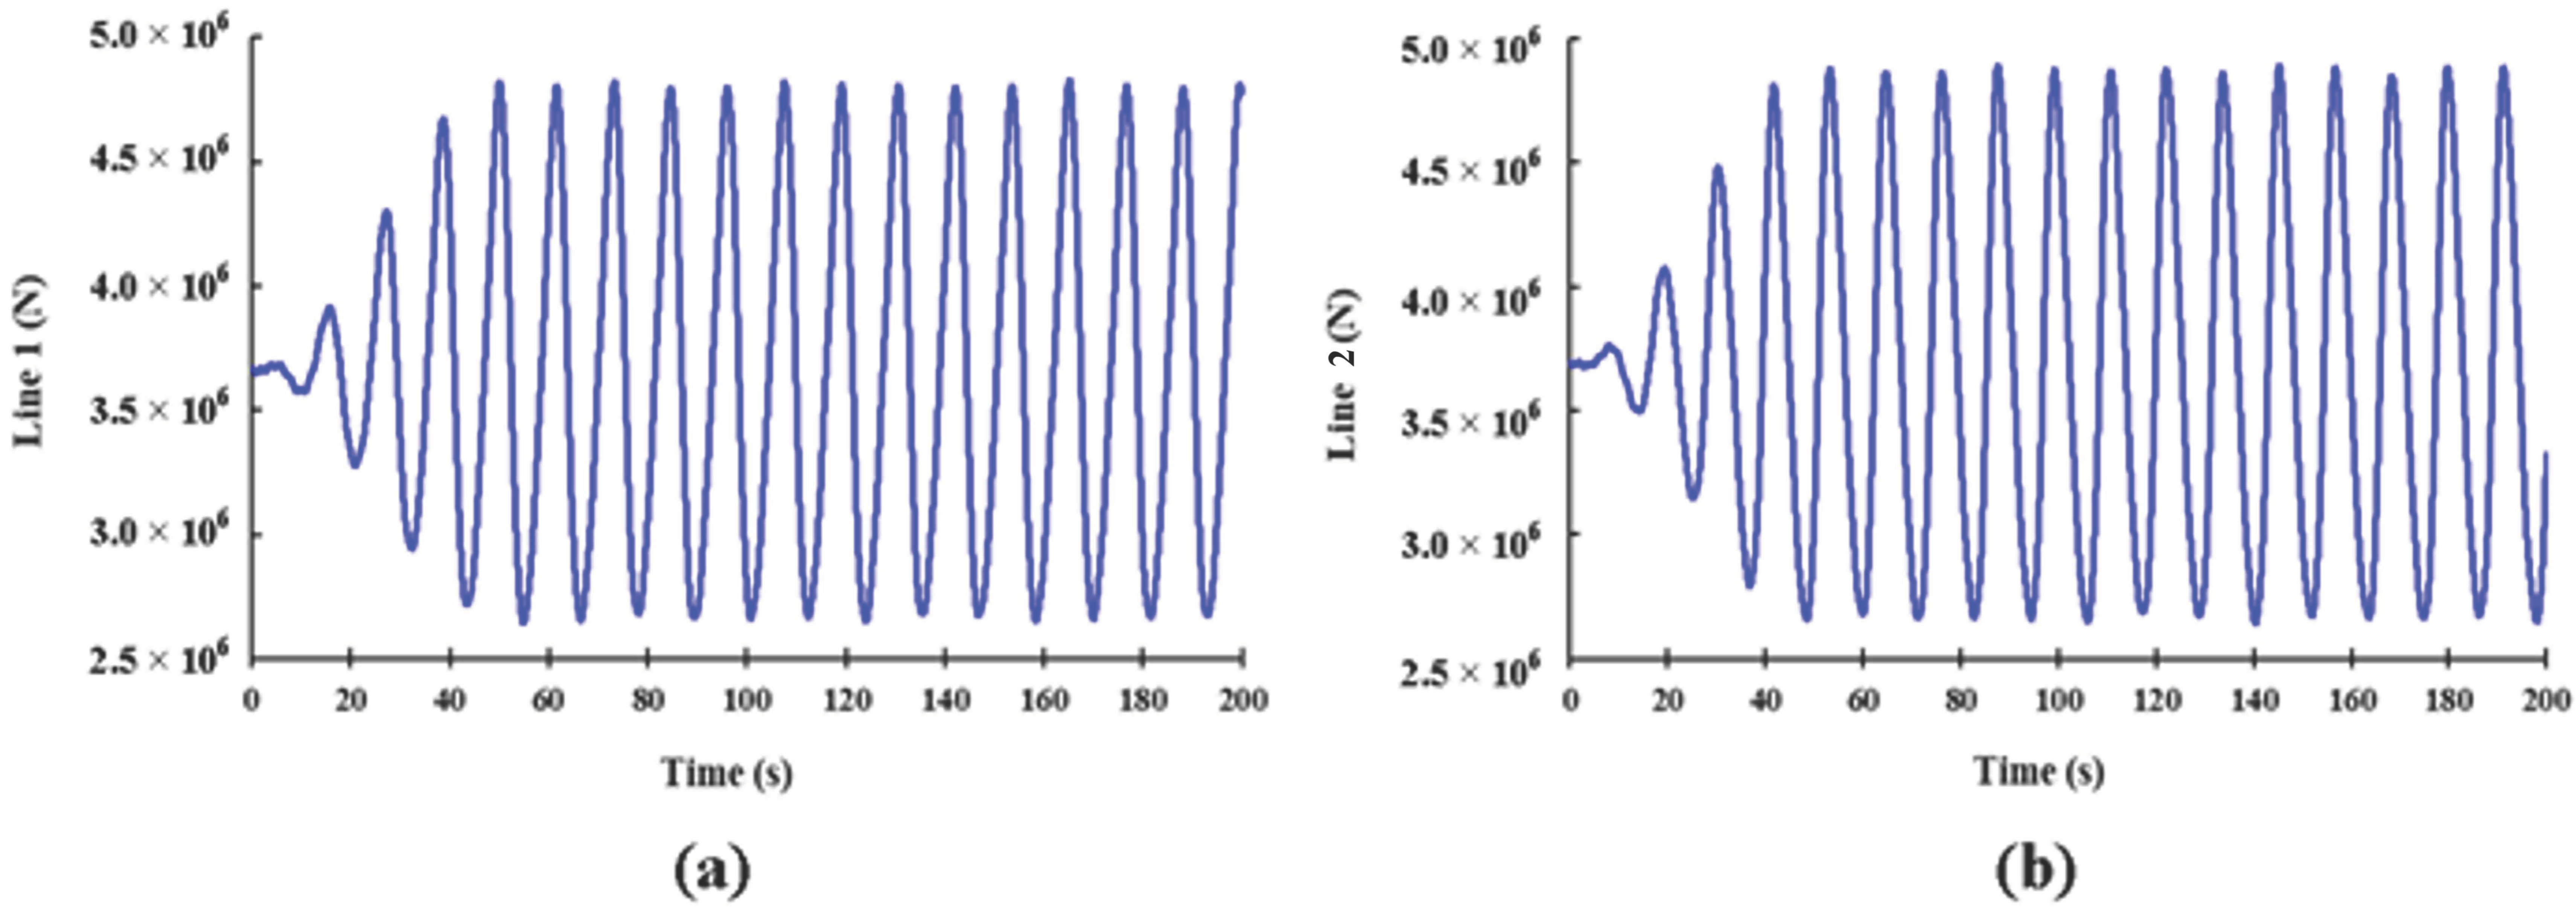
To analyse the CENTEC-TLP under hydrostatic and hydrodynamic loads, after generating the model in APDL, the geometry of the model is transferred to AQWA. The simulations in the time domain are conducted on the full scale. The simulations performed in regular waves as well as the wind loads are shown in
Table 6 for the above-rated conditions. The wind force and wind speed at the above-rated conditions are 800 kN and 22.4 m/s, respectively. The total simulation time is selected to be the 60 s after the transient be-haviour of the platform. The selected time step is 0.05 s. This study assumes that the TLP has mooring lines instead of steel tethers.
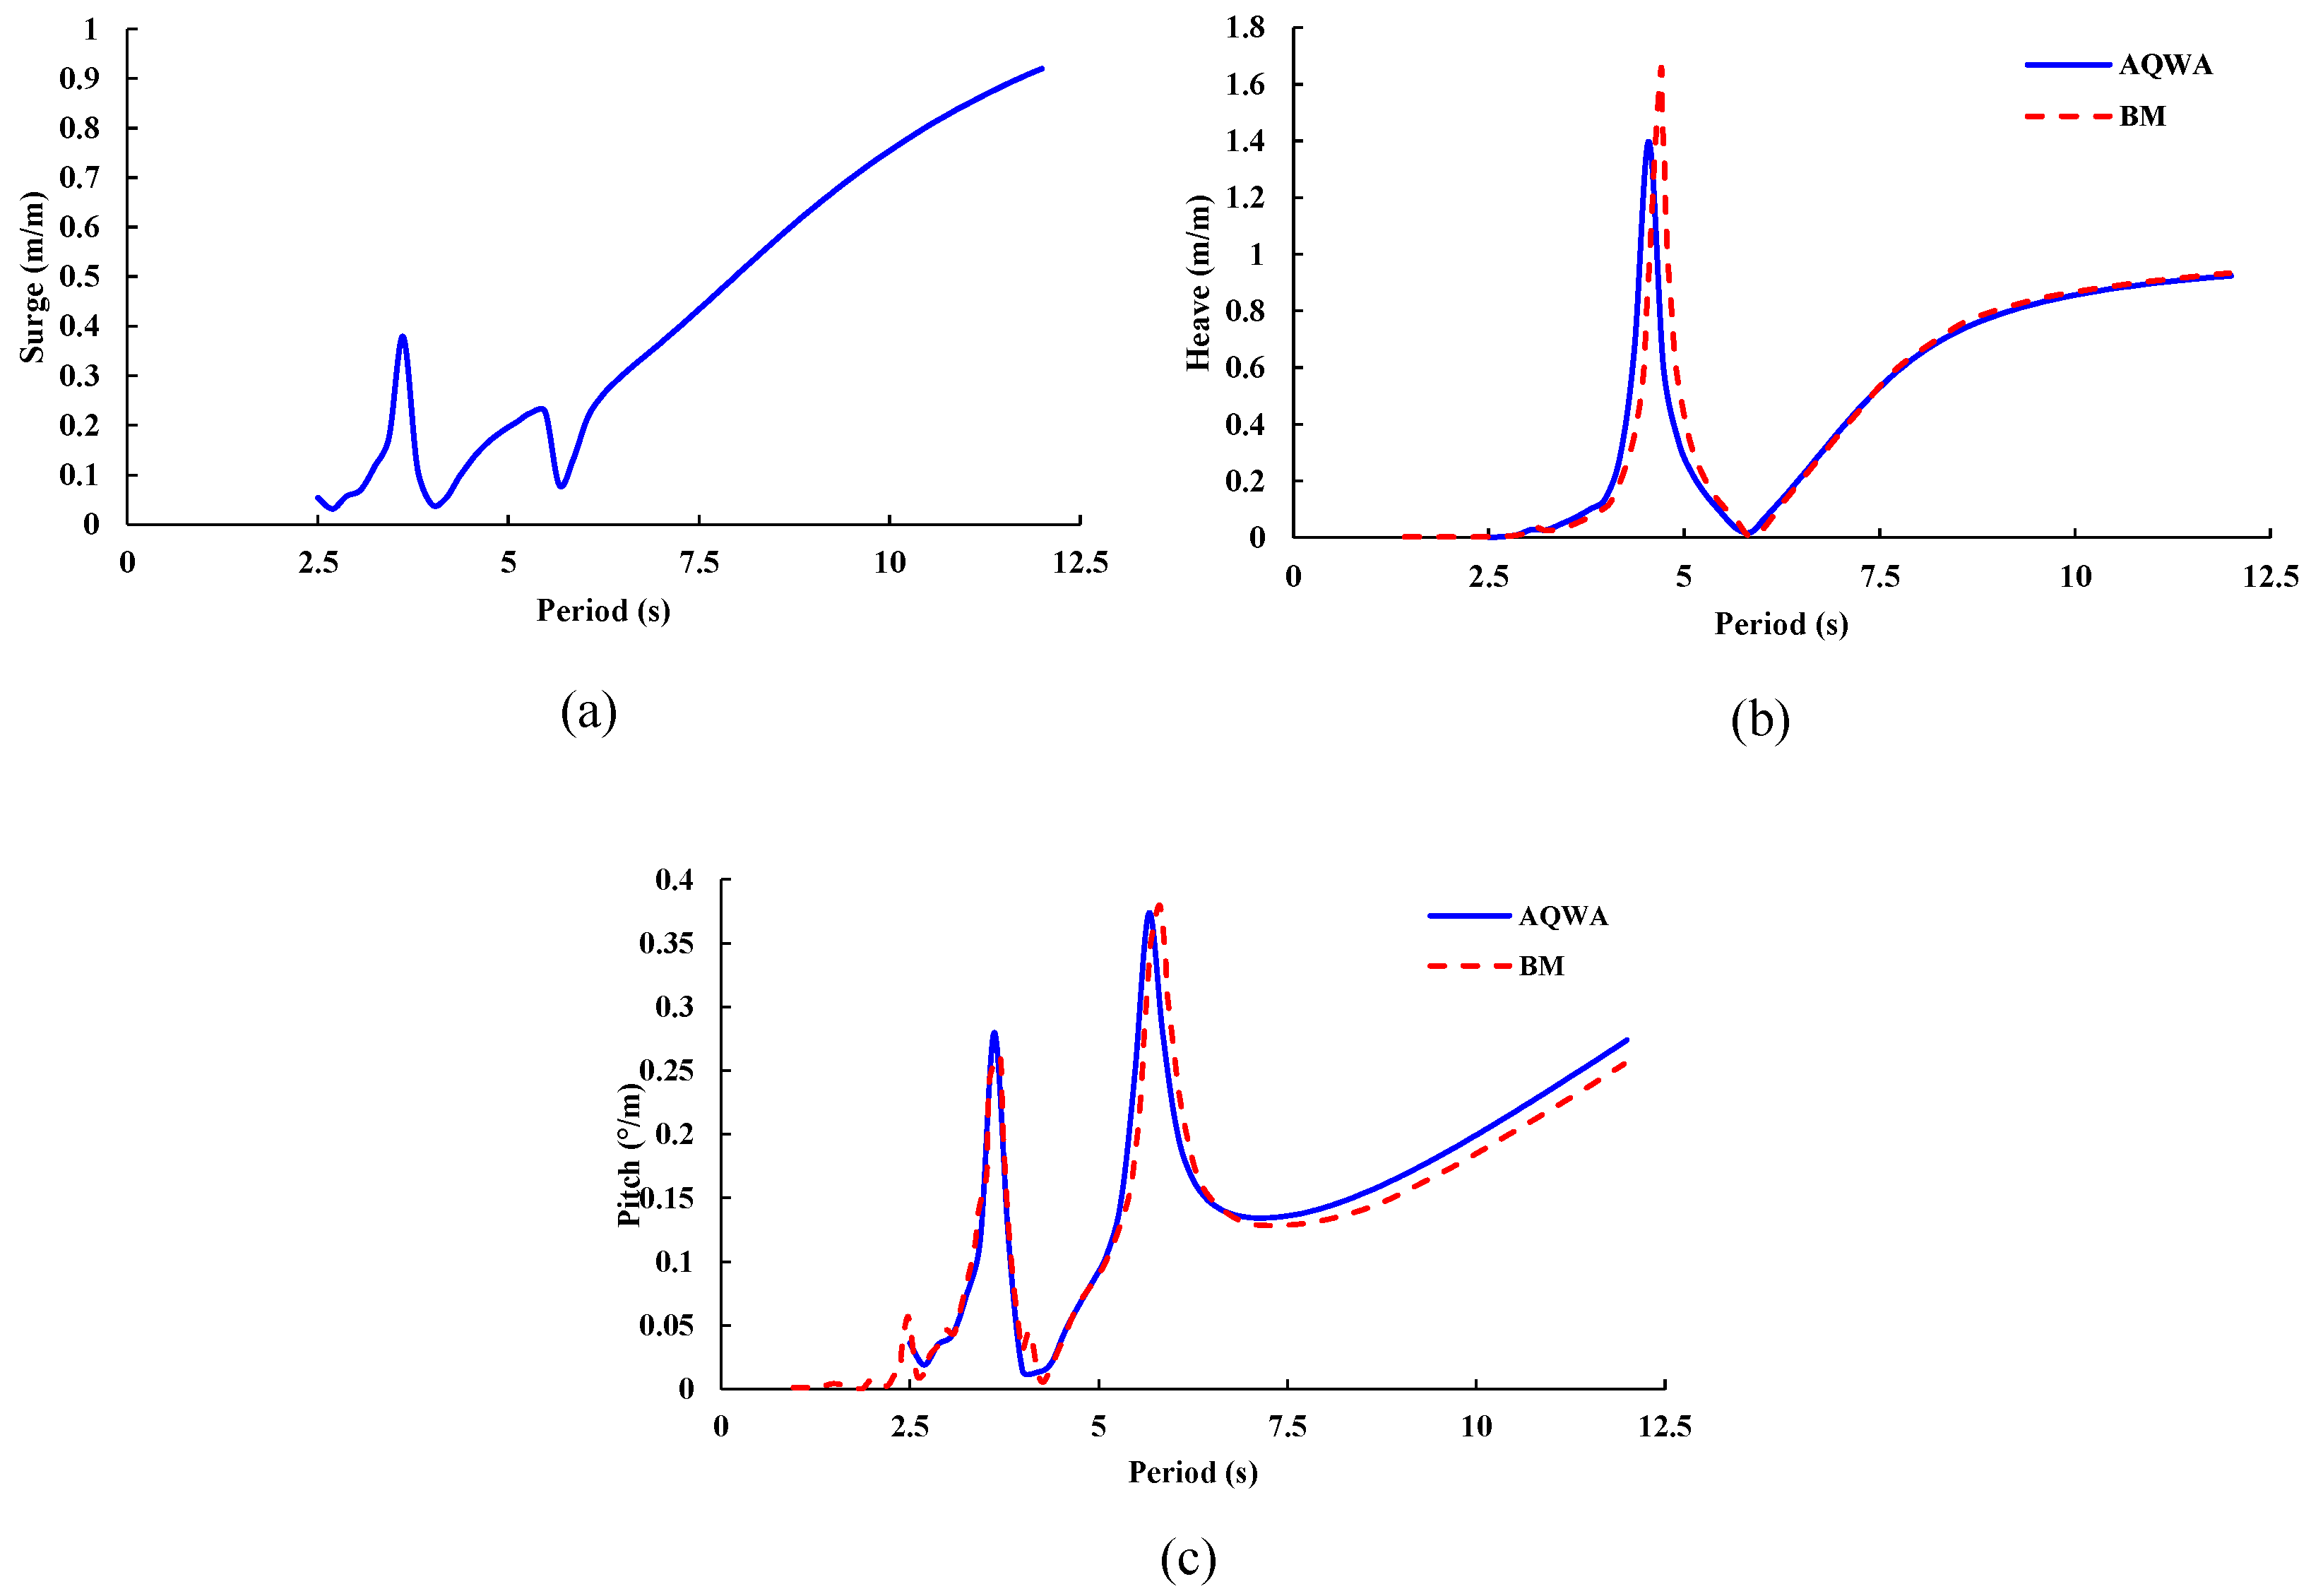
The benchmark values are validated by experimental models presented in [
29]. Hence, to show the accuracy of the modeling, meshing, and method used, the results of the ANSYS AQWA are validated with the benchmark model.


