1. Introduction
With the deterioration of the ecological environment, the historical status of fossil energy sources is gradually declining and renewable energy sources are gradually showing their superiority [
1]. In the aftermath of the energy crisis, pumped storage technology has alleviated the need for energy shortage to some extent. With 130 years of development since its inception, pumped storage technology has become the most successful energy storage technology especially for hydro and marine power within modern power storage systems due to its mature technology and huge scale [
2,
3]. Pumped storage power stations are an important part of the power grid as they play a major role in peak and valley regulation, frequency and phase regulation, and so on. The reversible pump turbine, as the core component of pumped storage technology, is often transformed under different operating load conditions according to the different needs of the power station [
4,
5]. The pump as a turbine in practice often causes high amplitude pressure pulsations due to the complexity of its internal circulation [
6]. Therefore, pump turbine pressure pulsation at different loads is of great concern, and the noise and vibration caused by pressure pulsation greatly affect the stable operation of pump turbine units to a certain extent. Deng et al. [
7] used Doppler velocimetry to test the velocity distribution in the induced flow tube of a mixed-flow pump turbine. The velocity pulsation was directly related to the pressure pulsation, and the velocity pulsation was also influenced by the cavitation coefficient. Ouyang et al. [
8] investigated the effect of blade tilt on the hydraulic excitation and structural response of a reversible pump turbine, whereby they compared the soft theory of five blade tilt angles in pump mode and turbine mode, respectively. The head, efficiency, internal flow pressure pulsation, and flow path stresses were compared. Zhu et al. [
9] investigated the flow analysis and pressure pulsation fluctuations in a pump turbine under nonworking design conditions. The results showed that the matching relationship between the guide vane opening and flow rate affected the operational stability. Zeng et al. [
10] studied the operational stability of a pump turbine under different operating conditions. Numerical simulations were carried out for the runner and bladeless zones of a model pump turbine, and the laws of pressure pulsation and entropy yield affected were analyzed.
In the actual operation of a pump turbine, when the water head is certain, there is a close relationship between the load to which the pump turbine is subjected and the opening of the guide vane, which varies mainly under the combined influence of the movable guide vane and the fixed guide vane angle [
11]. When a pump turbine is operated at a specific combination of guide vane openings, it is subjected to a fixed load, and the operating flow rate is positioned within a specific range. When the operating flow rate is outside this range, the pressure pulsation of the pump turbine may increase, which results in a reduction in the unit performance [
12]. The fluctuation in the pressure pulsation in pump turbines is therefore different under different load conditions. Using the guide vane opening to control the turbine load conditions, many scholars have conducted and discussed a large number of studies on the problem of pump turbine pressure pulsation caused by dynamic and static interference at different loads. Le et al. [
13] studied the analysis of the pressure pulsation and internal flow characteristics of a pump turbine under very small angle opening pump conditions. Wang et al. [
14] found that the unstable state of the pump turbine under no-load operation directly affected the grid connection of the unit and could seriously damage and affect the unit components. During the whole no-load process, the axial horizontal thrust in the runner varies slowly with time and fluctuates slightly. Liu et al. [
15] simulated the extreme case of two turbines dumping load simultaneously in a prototype pumped storage system based on a one-dimensional–three-dimensional coupled simulation to assess the pressure fluctuation under this extreme case. Su et al. [
16] conducted a numerical study on the dynamic flow characteristics of the pump turbine during a runaway. A numerical simulation study was carried out to investigate the dynamic flow characteristics of a pump turbine during a runaway, with a focus on the speed, flow, torque, and corresponding pressure fluctuation variations.
In areas of unstable pump turbine loading, the internal flow becomes extremely complex, and when the pump turbine is operated at low load conditions, it is often prone to unit vibration and vortex banding [
17]. Pressure pulsation also then increases, and to improve the operating stability and safety of the unit under different load conditions, we delve into the laws of pulsation fluctuations and the causes; many scholars have investigated the effect of the unit speed, flow rate, pulsation amplitude, vibration frequency, and other aspects, which has helped to reveal the pulsation fluctuation mechanism. Hu et al. [
18] studied the amplitude conversion frequency and rotor–stator interacting pump turbine with splitting vanes, with a focus on the pressure pulsation characteristics of the bladeless zone of the pump turbine runner with a splitting vane design. Dai et al. [
19] established a turbine test and detection system to improve the noise of the internal flow of the pump turbine and conducted an experimental study to explore the flow noise at different flow rates. The lowest blade frequency radiation noise was found at the optimum operating conditions. Shang et al. [
20] studied the flow characteristics and pressure pulsation characteristics of this turbine at three speeds to improve the operating efficiency under turbine conditions and the automatic frequency regulation capability under pump conditions to obtain better efficiency and stability for pumping in turbine-pumped storage power plants.
In this paper, to reveal the pressure fluctuation mechanism of the pump turbine, two operating conditions were chosen with a 440 m head and loads of 65.7% and 93.3%. The corresponding guide vane openings were 7.5° and 19°. The pressure pulsation fluctuations at different monitoring points were combined with the experimental results and compared with the CFD numerical simulation results to analyze the pressure pulsation fluctuation principle about the load [
21,
22,
23]. The highlight of this paper is the combination of the experimental and CFD numerical simulation results, which provides an in-depth elucidation of the pressure pulsation fluctuation mechanism under strong and weak loads and provides some ideas for optimizing the pulsation amplitude of the pump turbine to improve the stability and safety of the unit operation [
24,
25,
26,
27,
28].
2. Pump Turbine Model
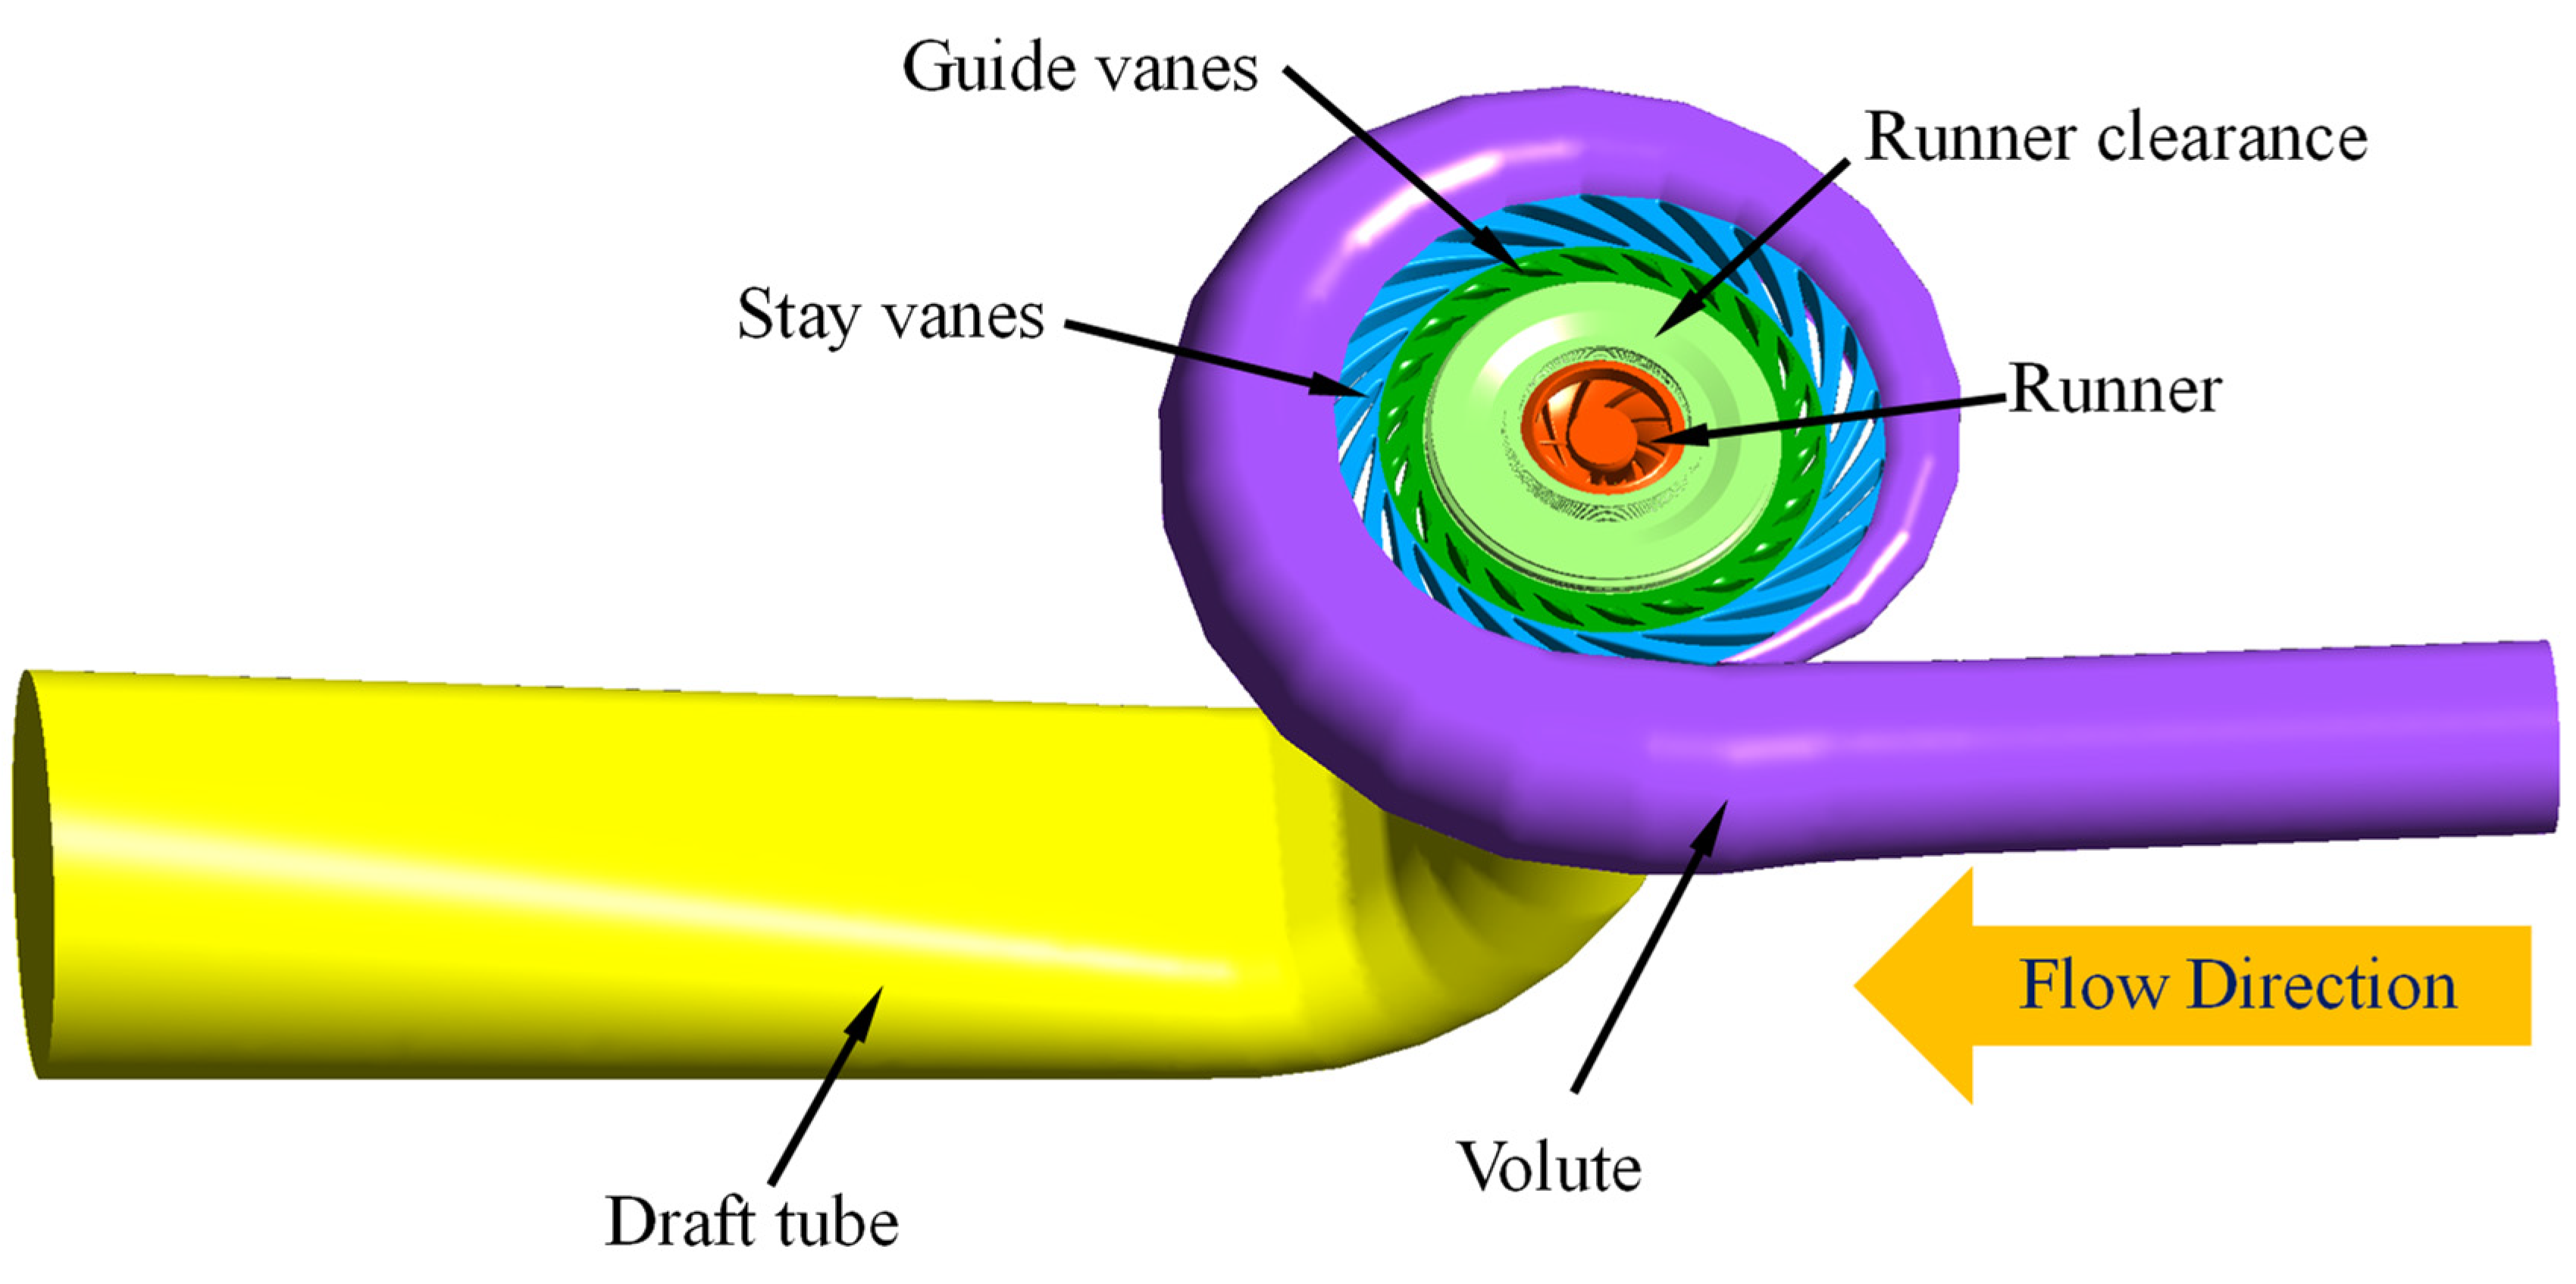
This paper focuses on the strong pressure fluctuation mechanism of a pump turbine under partial load. The target model was the pump turbine shown in
Figure 1. The components included the volute, guide vanes, stay vanes, runner, runner clearance, and draft tube. The main parameters can be found in
Table 1. The number of runner blades was 9; the number of guide vanes and stay vanes blades was 22; the diameter of the runner was 554 mm; the maximum and minimum heads were 52.9 m and 58.0 m, respectively; the rated rotational speed was 1100 rpm; and the specific speed was 34.6.
where
nq is 34.6,
nd is the rated rotational speed,
Qd is the rated flow rate, and
Hd is the design head.
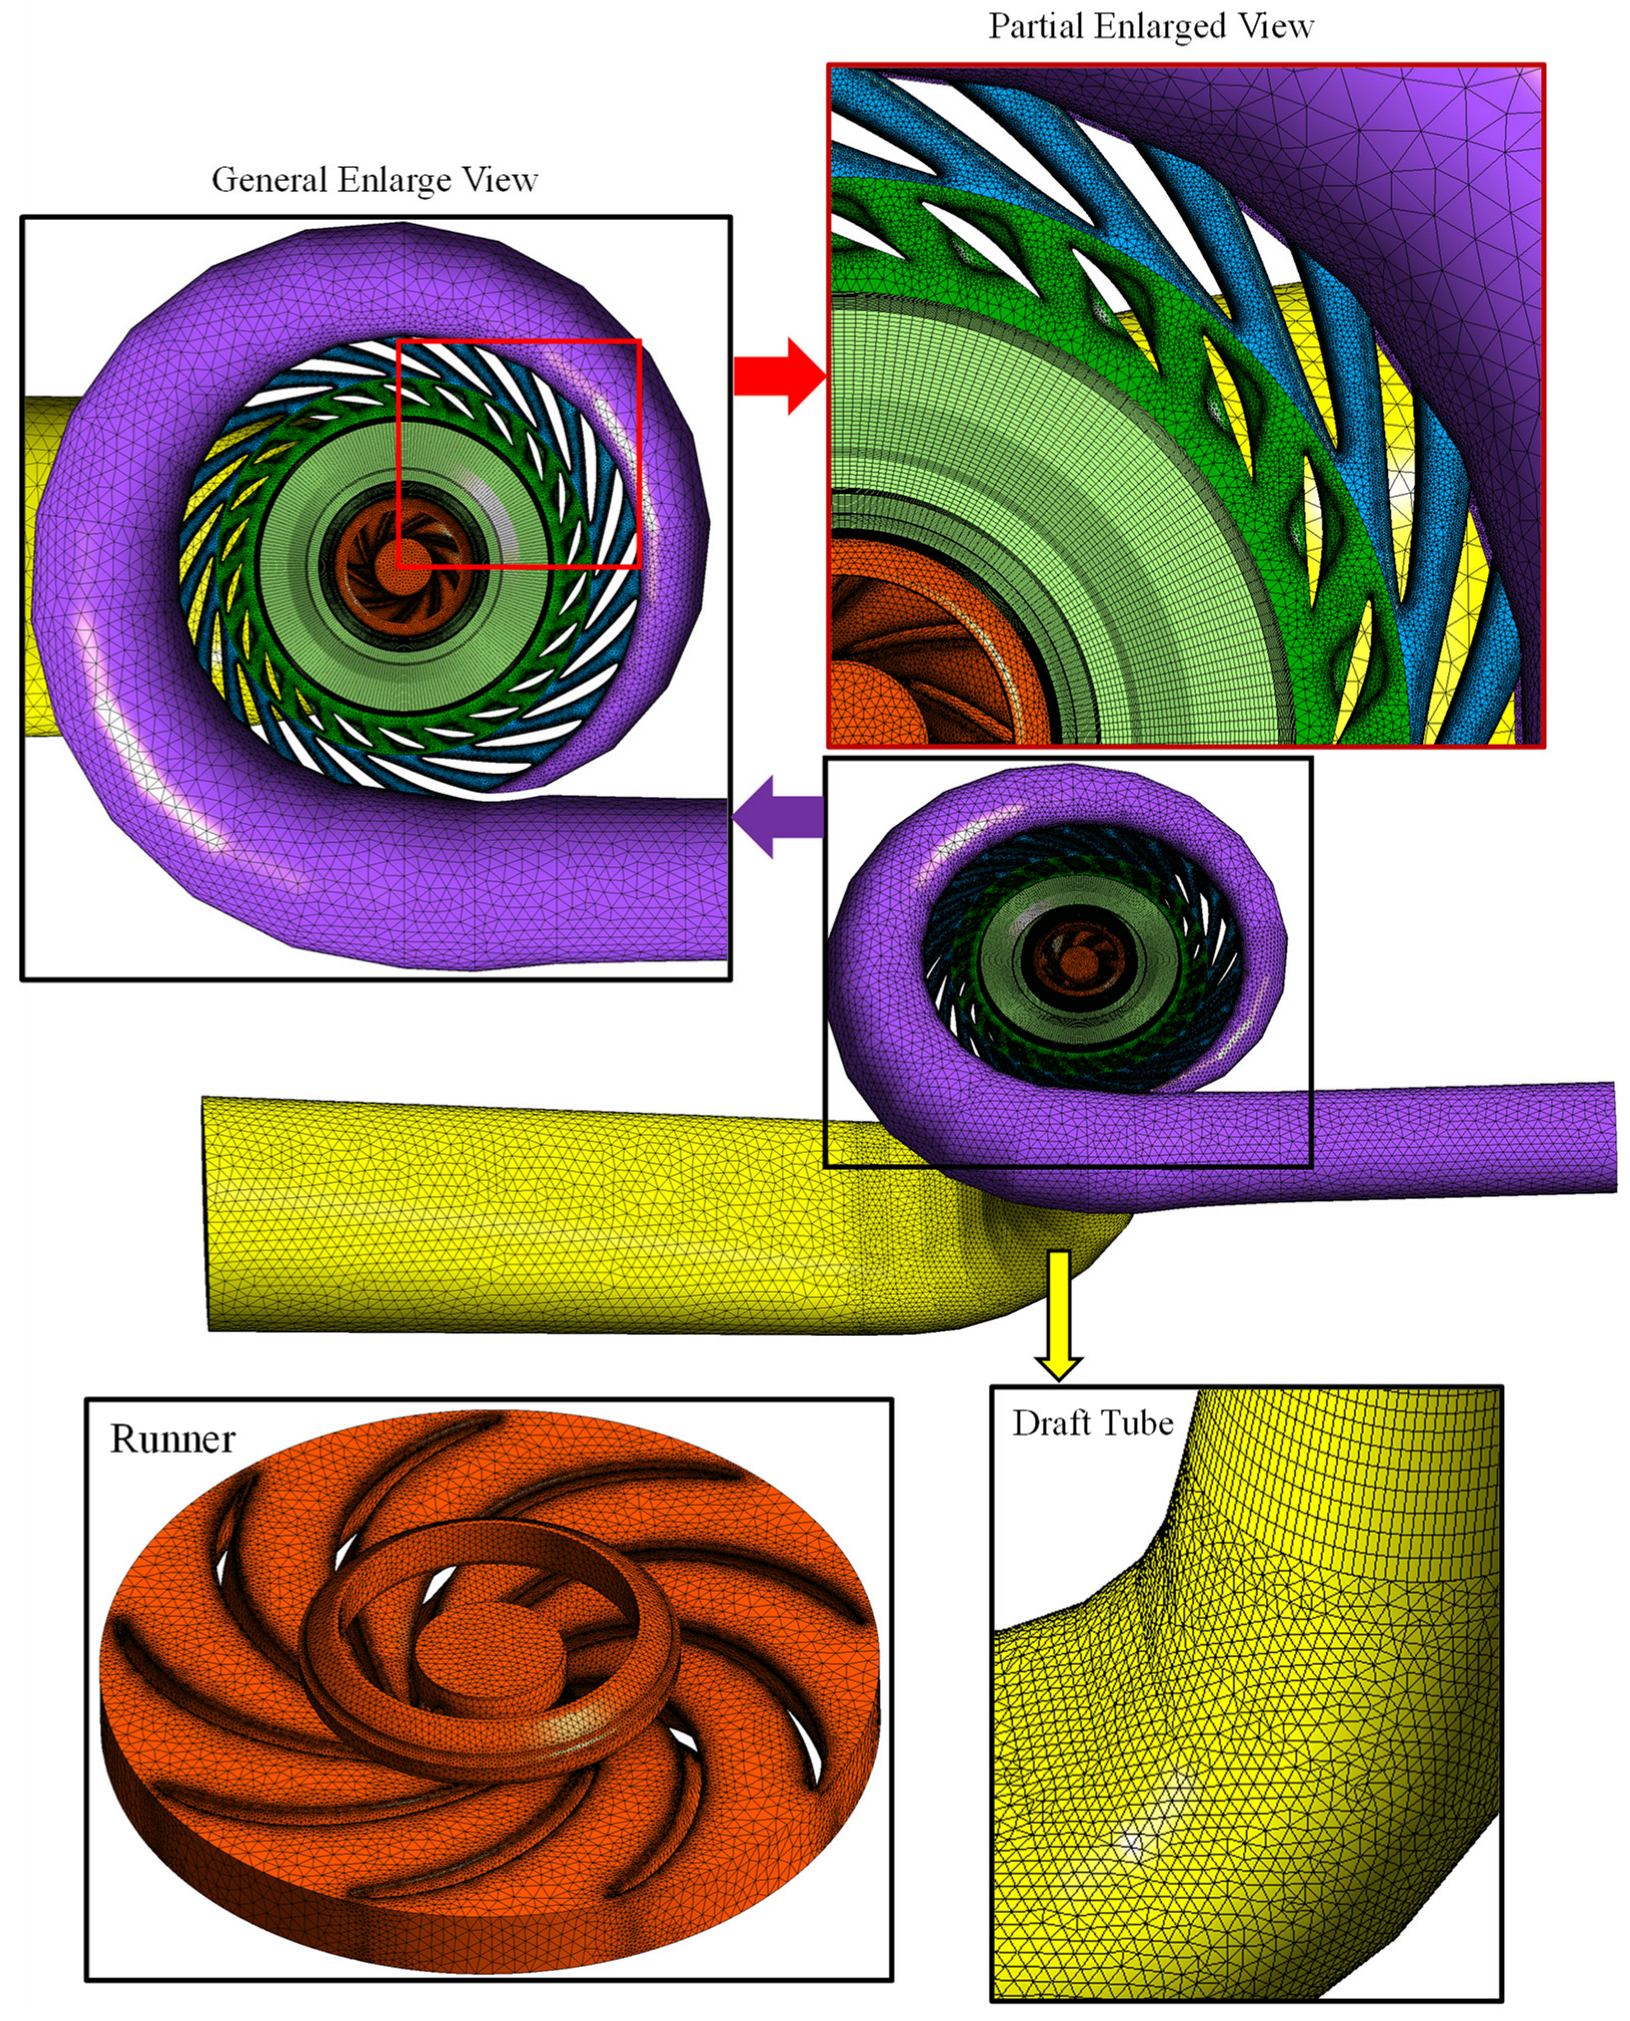
The commercial software ICEM CFD was used to grid the model, as shown in
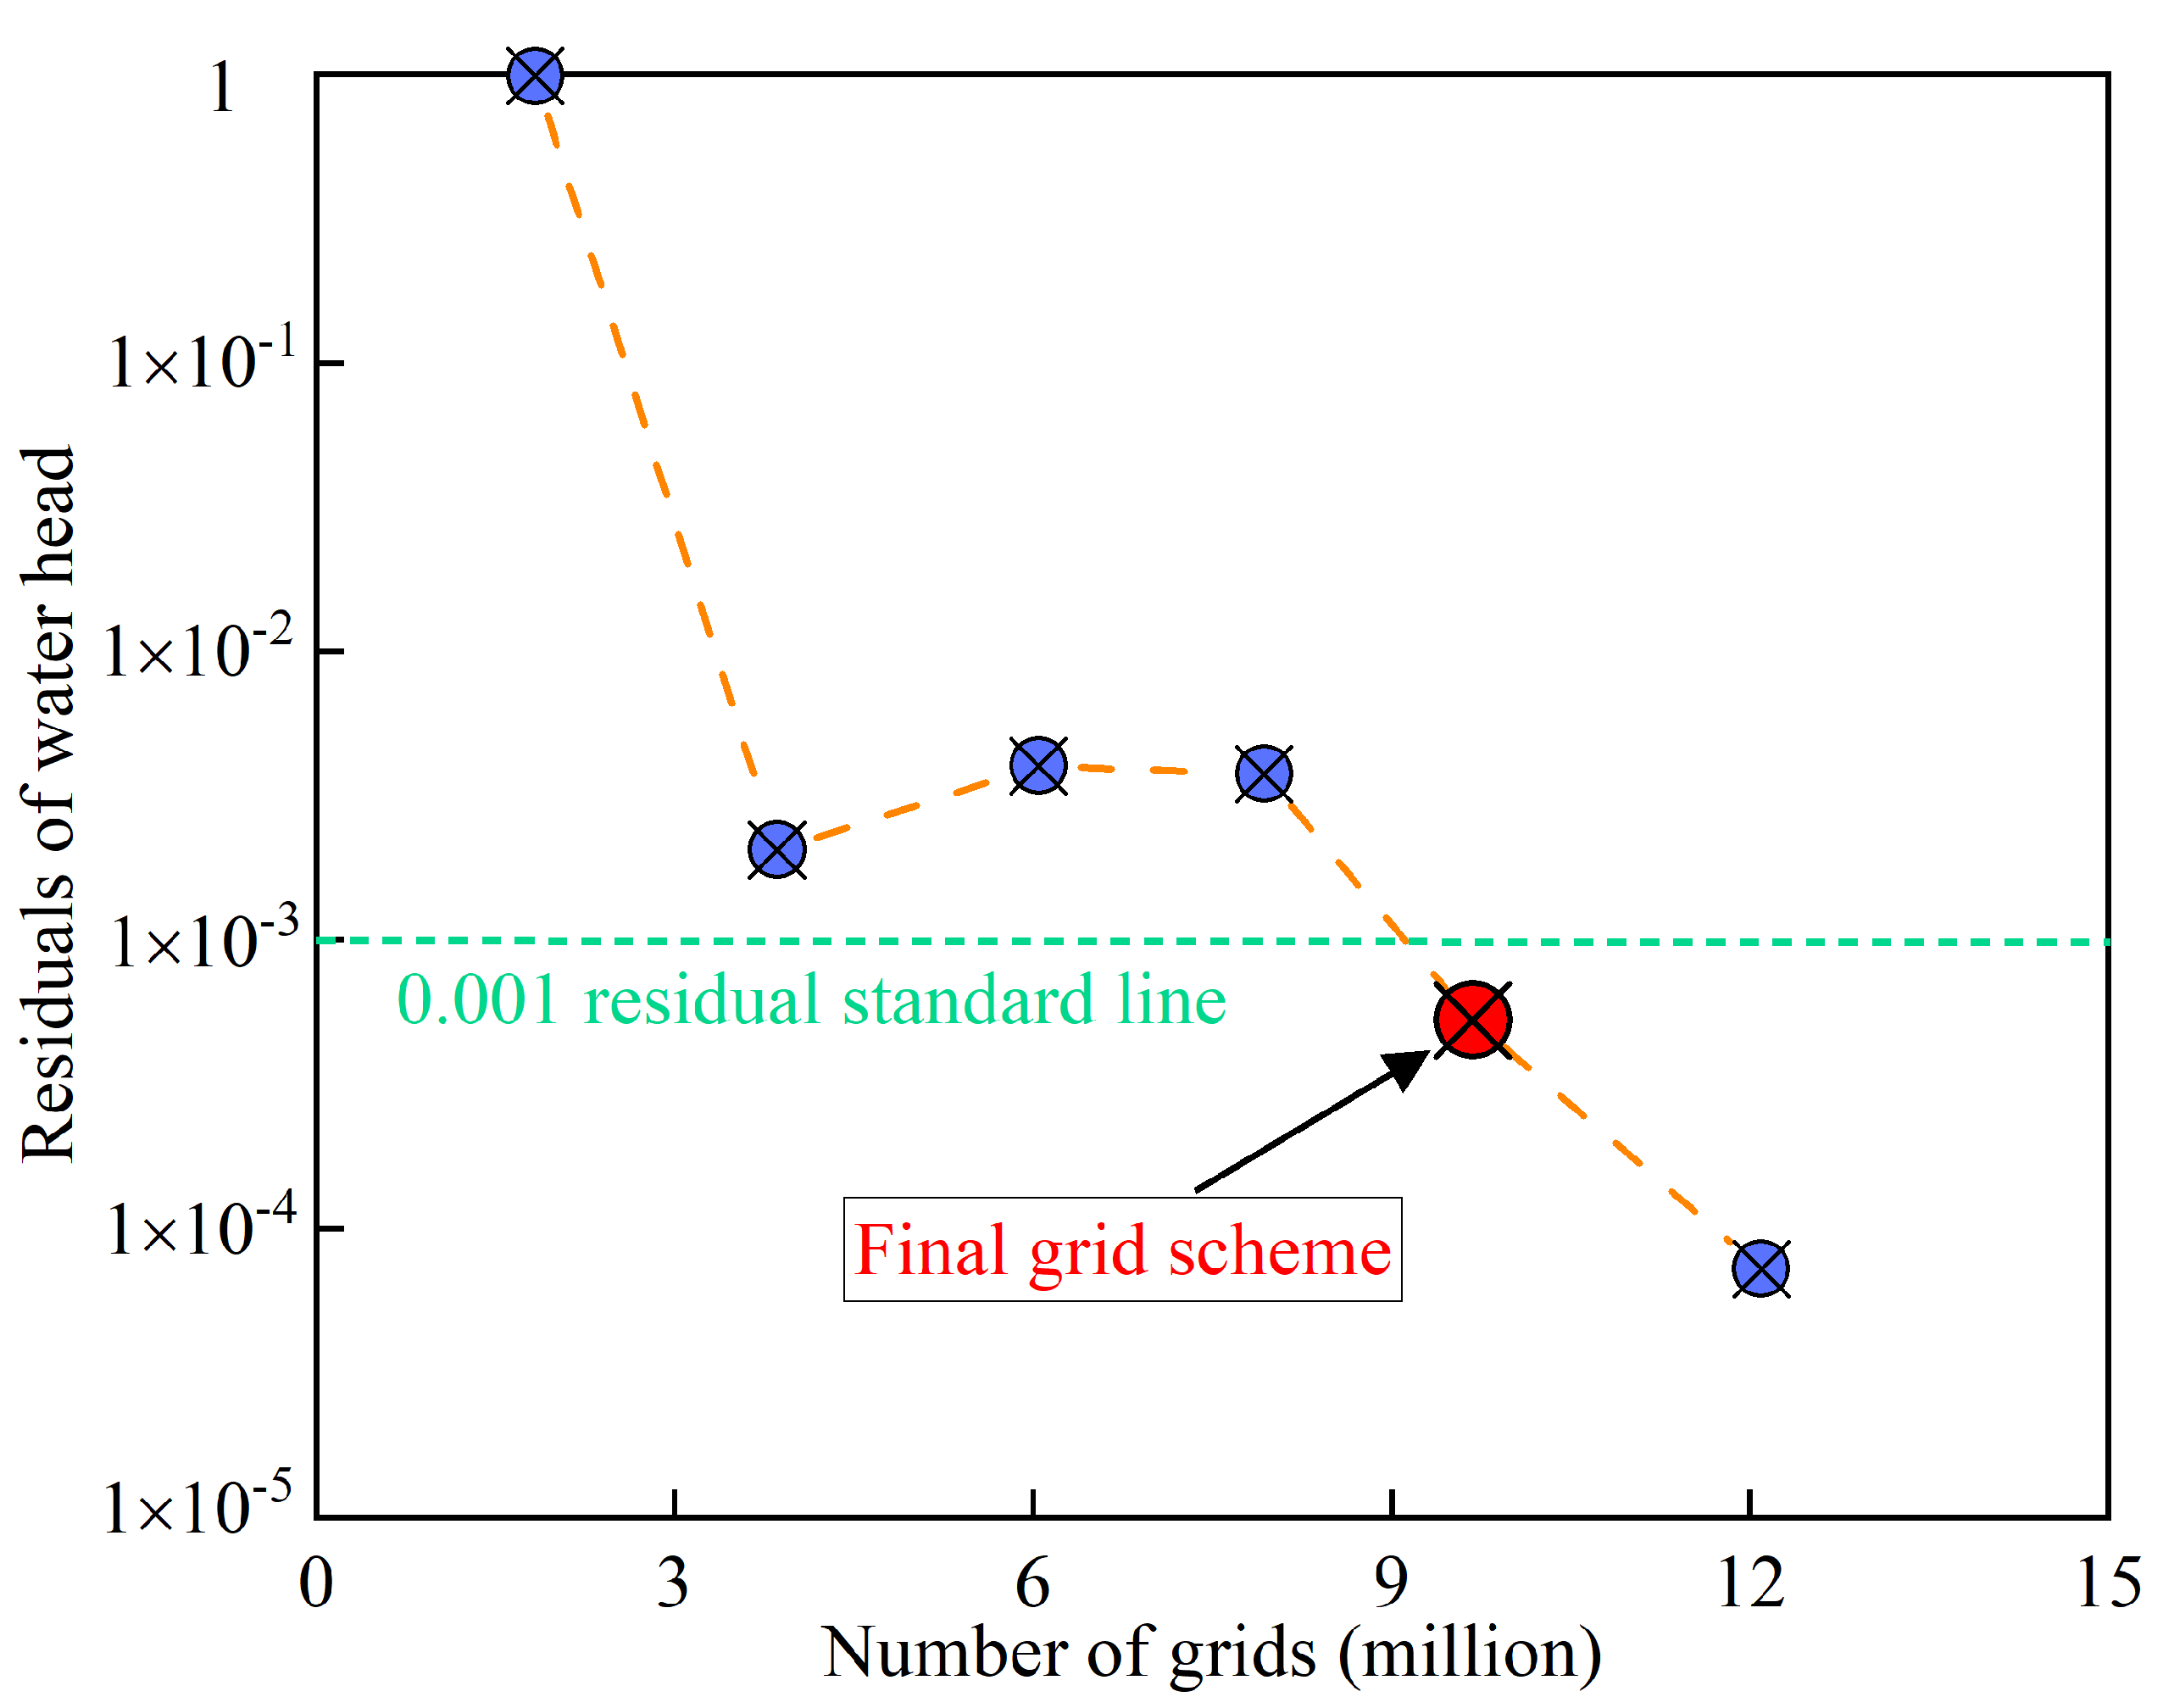
Figure 2. Hexahedral elements were used to grid the straight section of the draft tube and the runner basin, and tetrahedral elements were used to grid the rest of the components. To save calculation time and ensure the accuracy of the calculations, independent grid checks were required. The residual of the predicted head at the optimal efficiency point of the pump turbine was selected as the reference value, and a residual value of less than 0.001 was accepted.
Figure 3 was obtained. It can be seen from the figure that when the total number of grids was 9,668,956, see
Table 2, the target residual met the requirements, so this grid number was selected as the final calculation grid.
3. Model Test Method and Apparatus
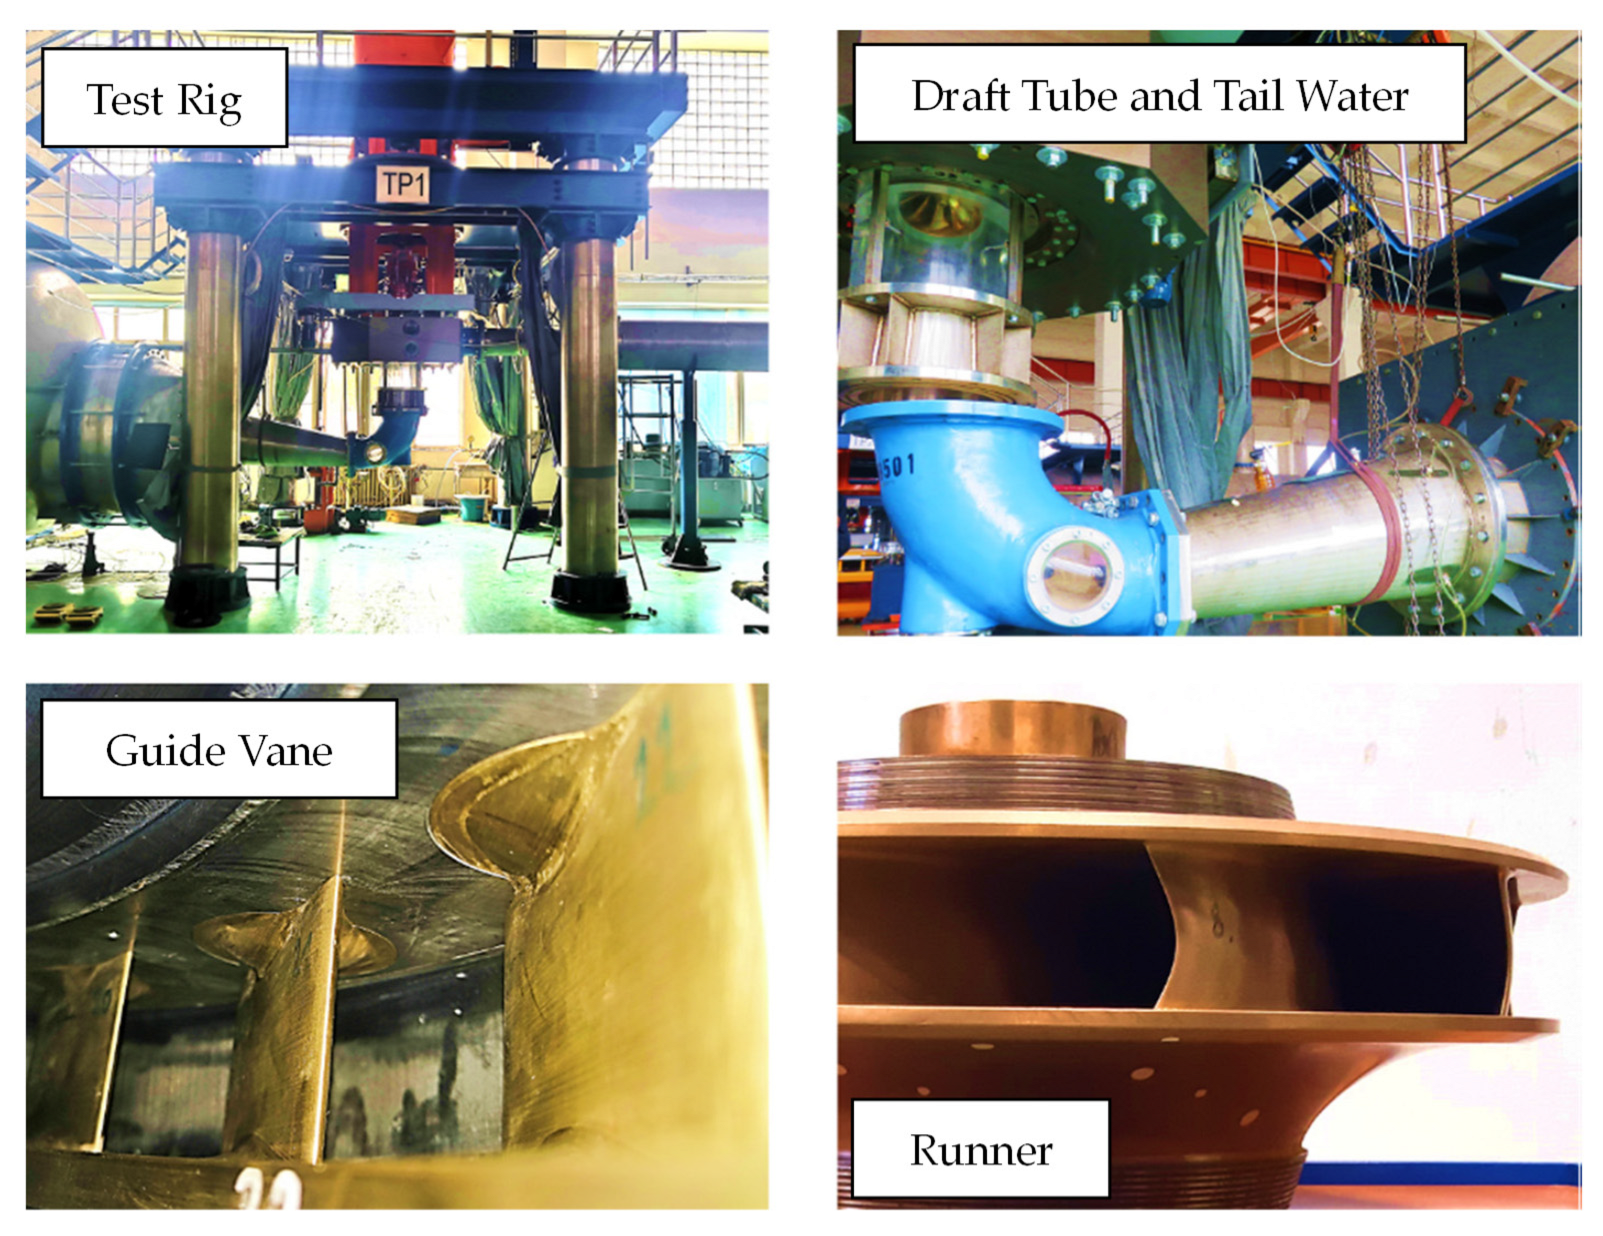
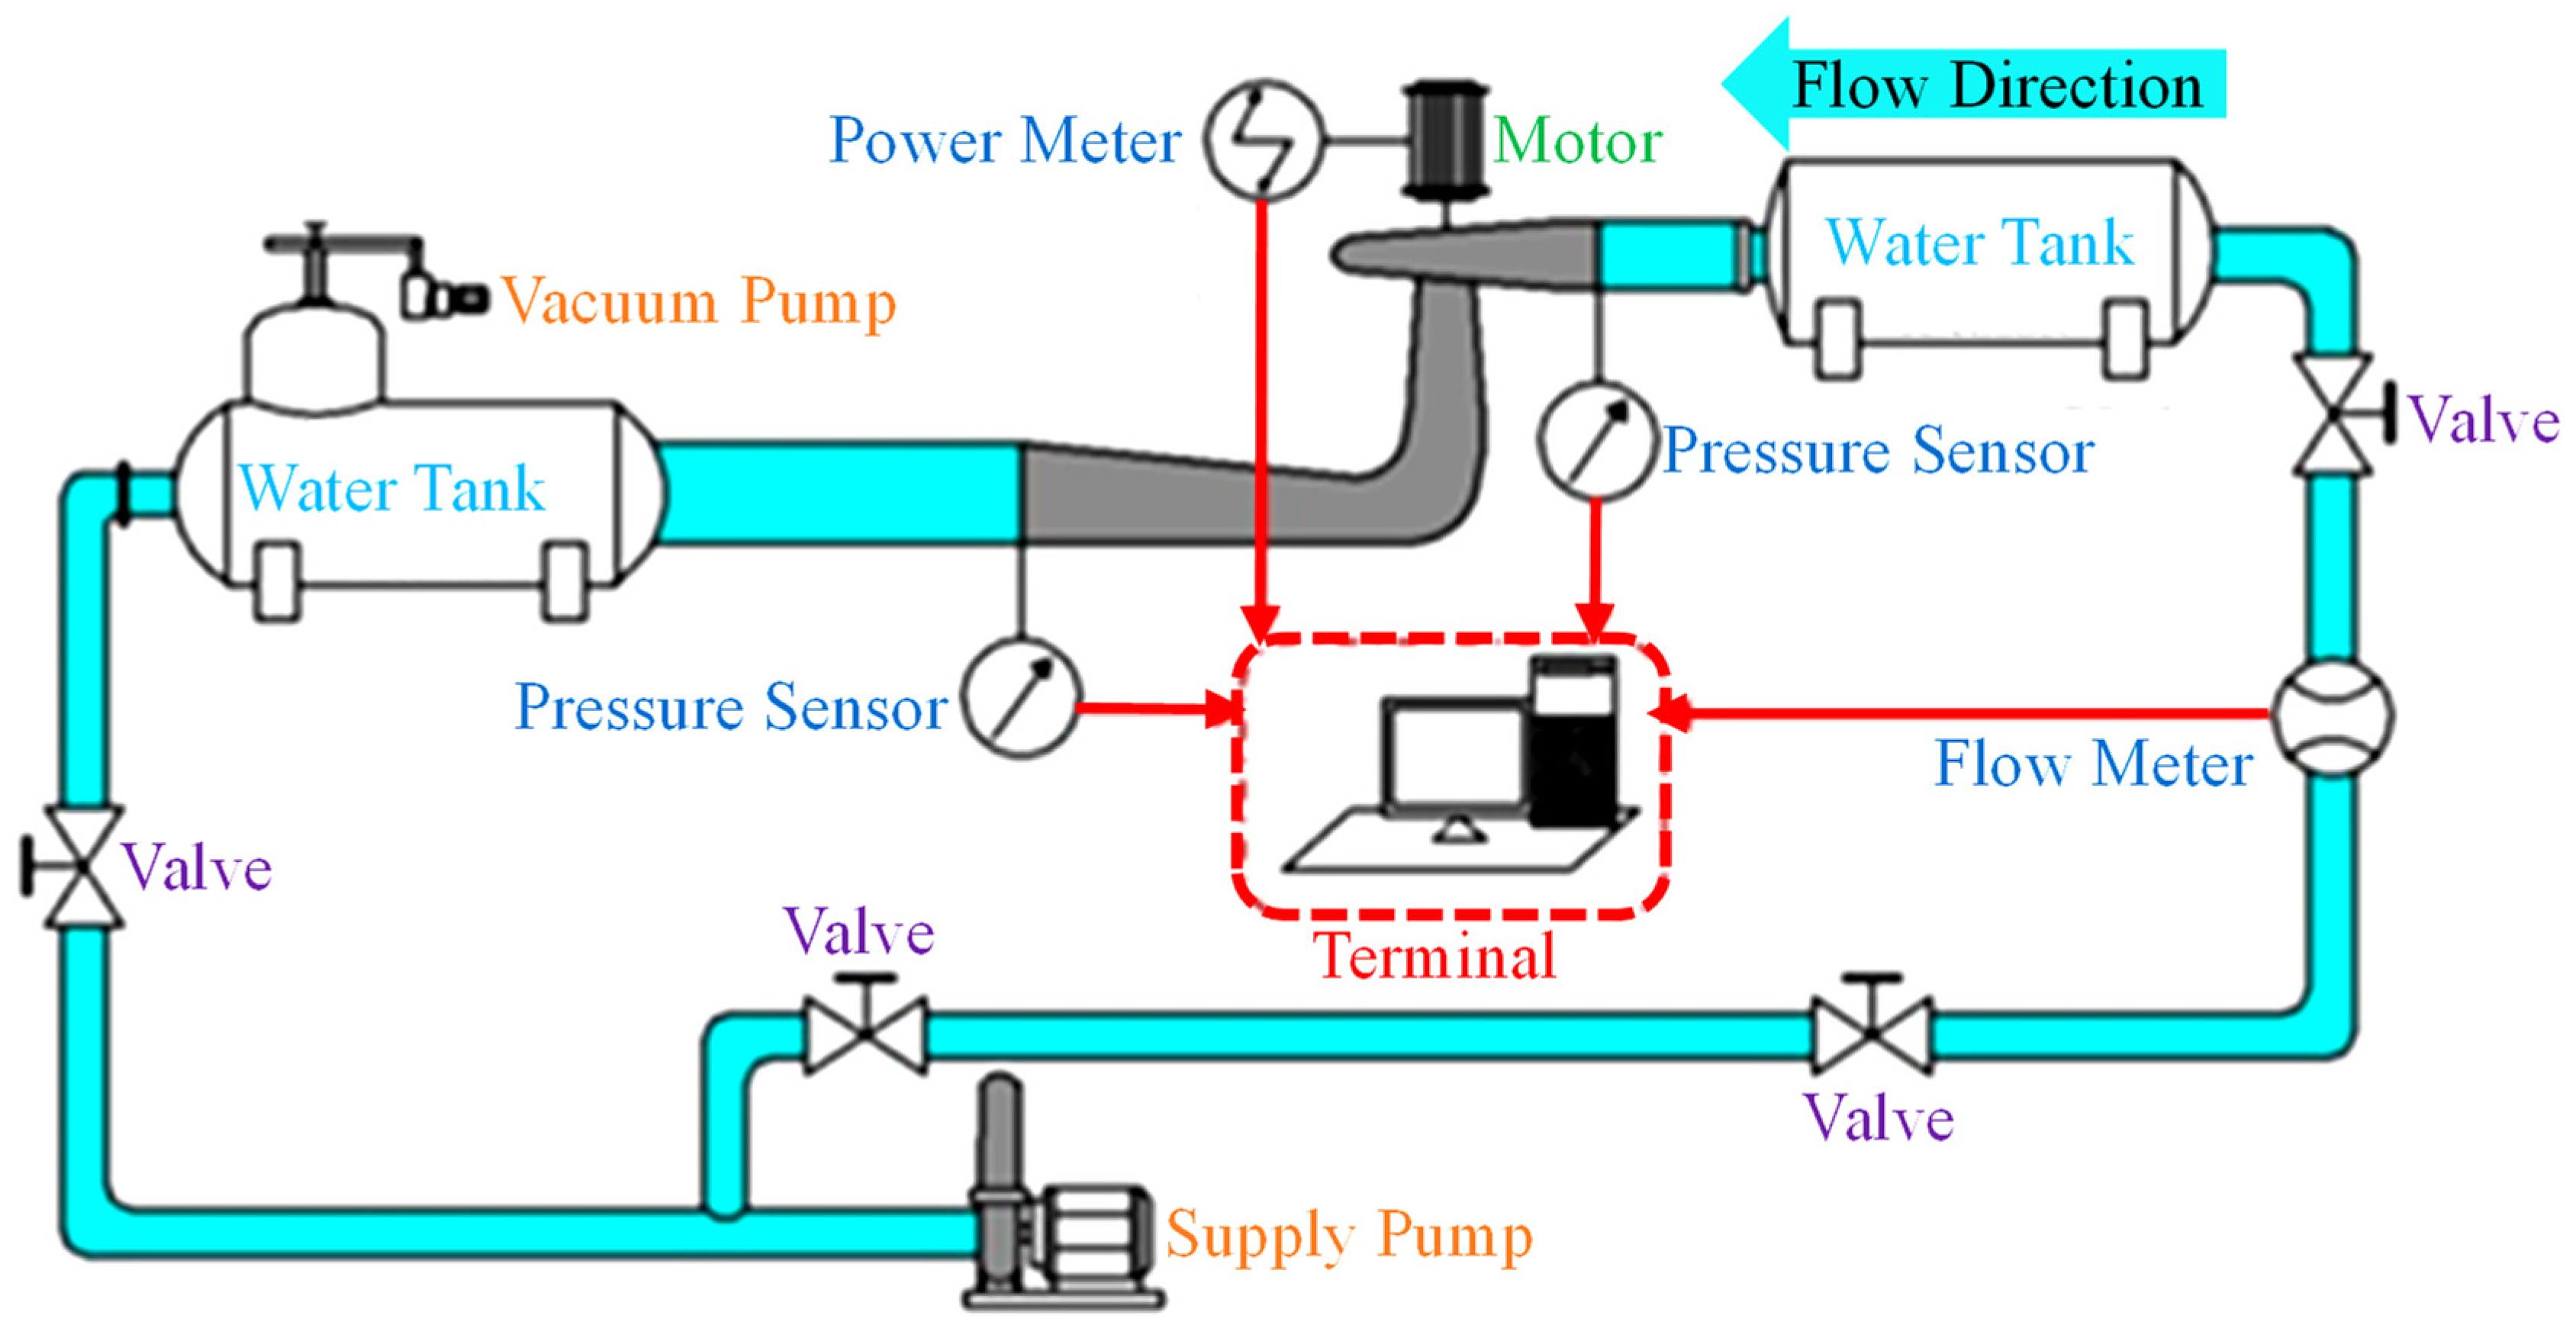
The model test is the focus of this paper; the real machine was made to be identical to the model size and was installed on the test stand, and the specific components of the field experiment can be seen in
Figure 4. The test stand installation arrangement can be seen in
Figure 5, and the upstream and downstream set for the reservoir and cavitation tank, which play the role of water storage, combined with the vacuum pump placed above the cavitation tank, can jointly regulate the cavitation. A supply pump was placed below to maintain the circulation of the fluid in the experimental lines. Several measuring instruments were placed at the connections of the different components, including electromagnetic flow meters, rotary encoders, differential pressure transducers, load transducers, absolute pressure transducers, and angular displacement transducers. These instruments were used to measure the experimental flow rate
Q, rotational speed
n, head
H, torque
M, draft tube pressure
Pdt, and the angle of the movable guide vane
α. The specific type of instrumentation used and the permissible error of the instrumentation can be seen in
Table 3.
This experiment explored the constant velocity and the operation of the pump turbine under different operating conditions by adjusting the relevant valves and the opening of the movable guide vanes. The power
P and efficiency
η of the pump turbine could be calculated by recording the physical quantities monitored above, and the head was measured by using a differential pressure sensor to measure the static pressure
Psi,
Pso and differential pressure
Psd; the head
H was calculated as follows:
where
ρ is the density and
g is the acceleration of gravity.
The measurement of power
P requires the use of load sensors and rotary encoders to measure the torque
M and the speed
n. The formula for calculating power
P is as follows:
where the unit of
n is r/min.
The pump turbine efficiency
η is calculated as follows:
Angular displacement sensors were used to measure the opening of the movable guide vane α. The measurement data were collected in a uniform manner and converted and processed by means of a computerized data acquisition system.
4. Experimental Results
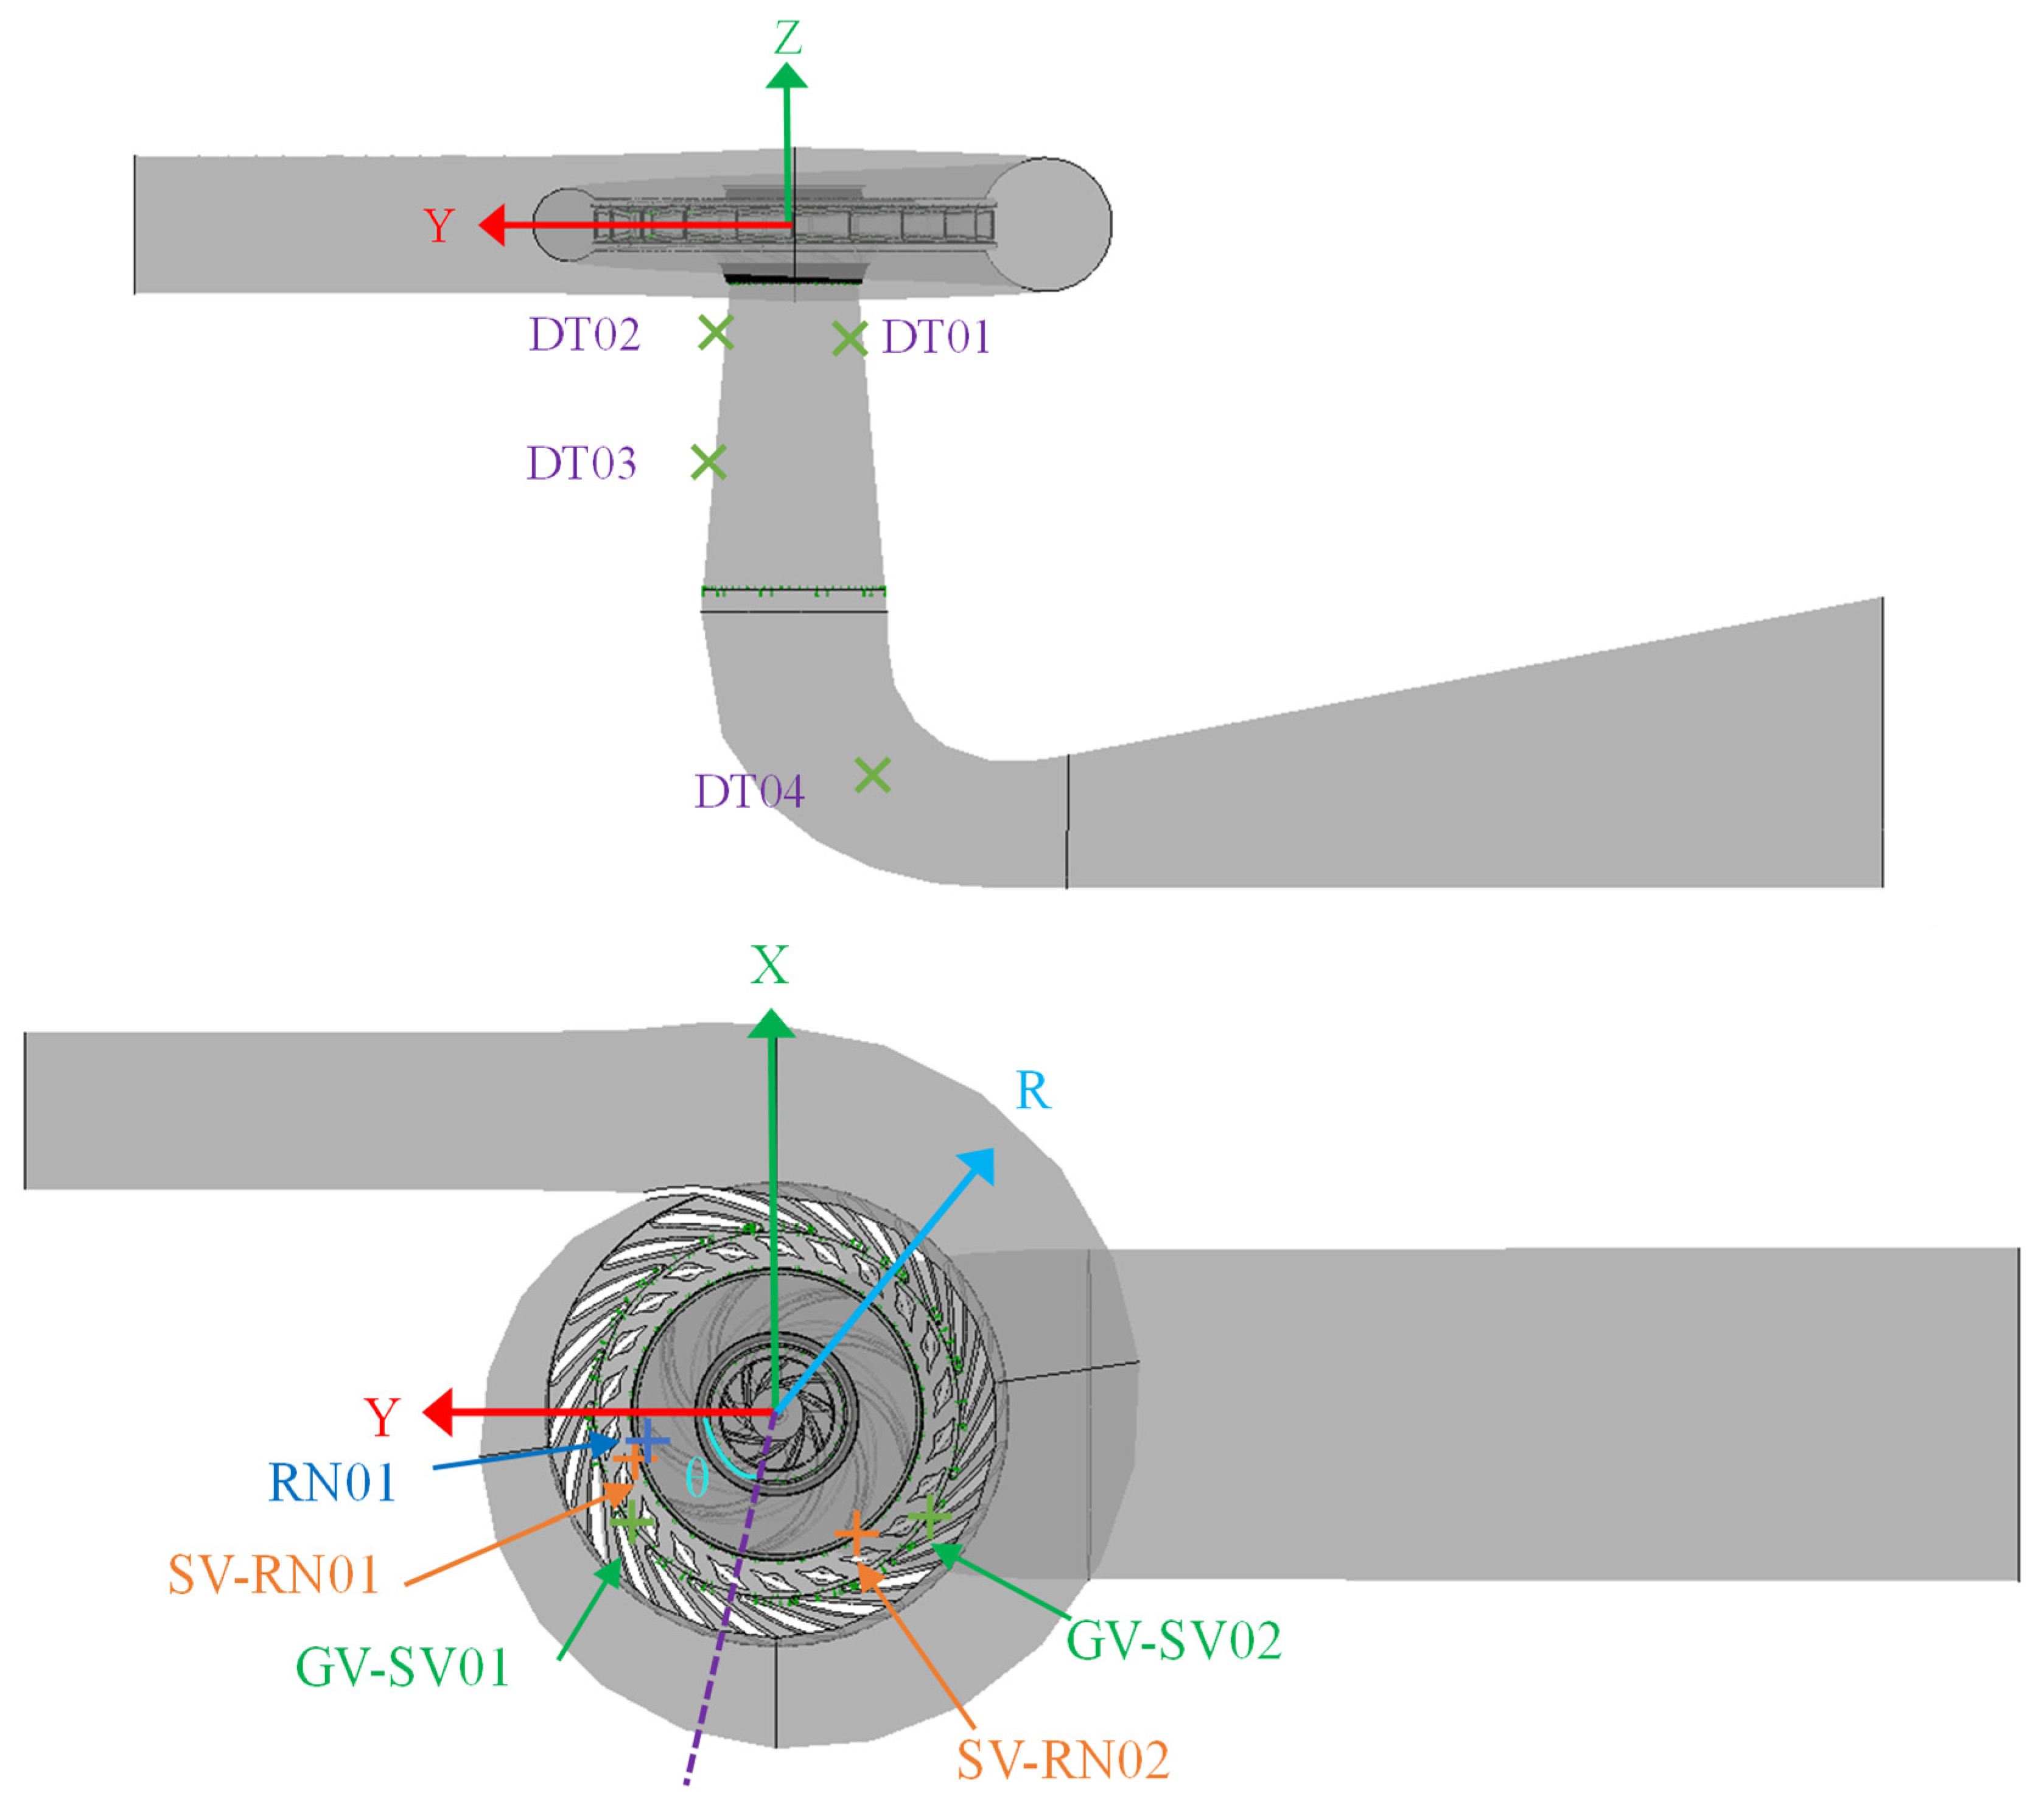
The results of the test bench demonstrated the pressure pulsation fluctuations at six typical monitoring points, see
Table 4 and
Figure 6, DT01, DTT03, DT04, SV-RN01, RN01, and GV-SV01, with a rated head of 440 m and under strong (93.3% load) and weak (65.7% load) loads. The prototype and model flows were converted, and the
QED of the prototype flow was calculated as follows:
where
QM is the value of the model machine flow,
DM is the model machine runner diameter, and
EM is the value of the model machine operating efficiency.
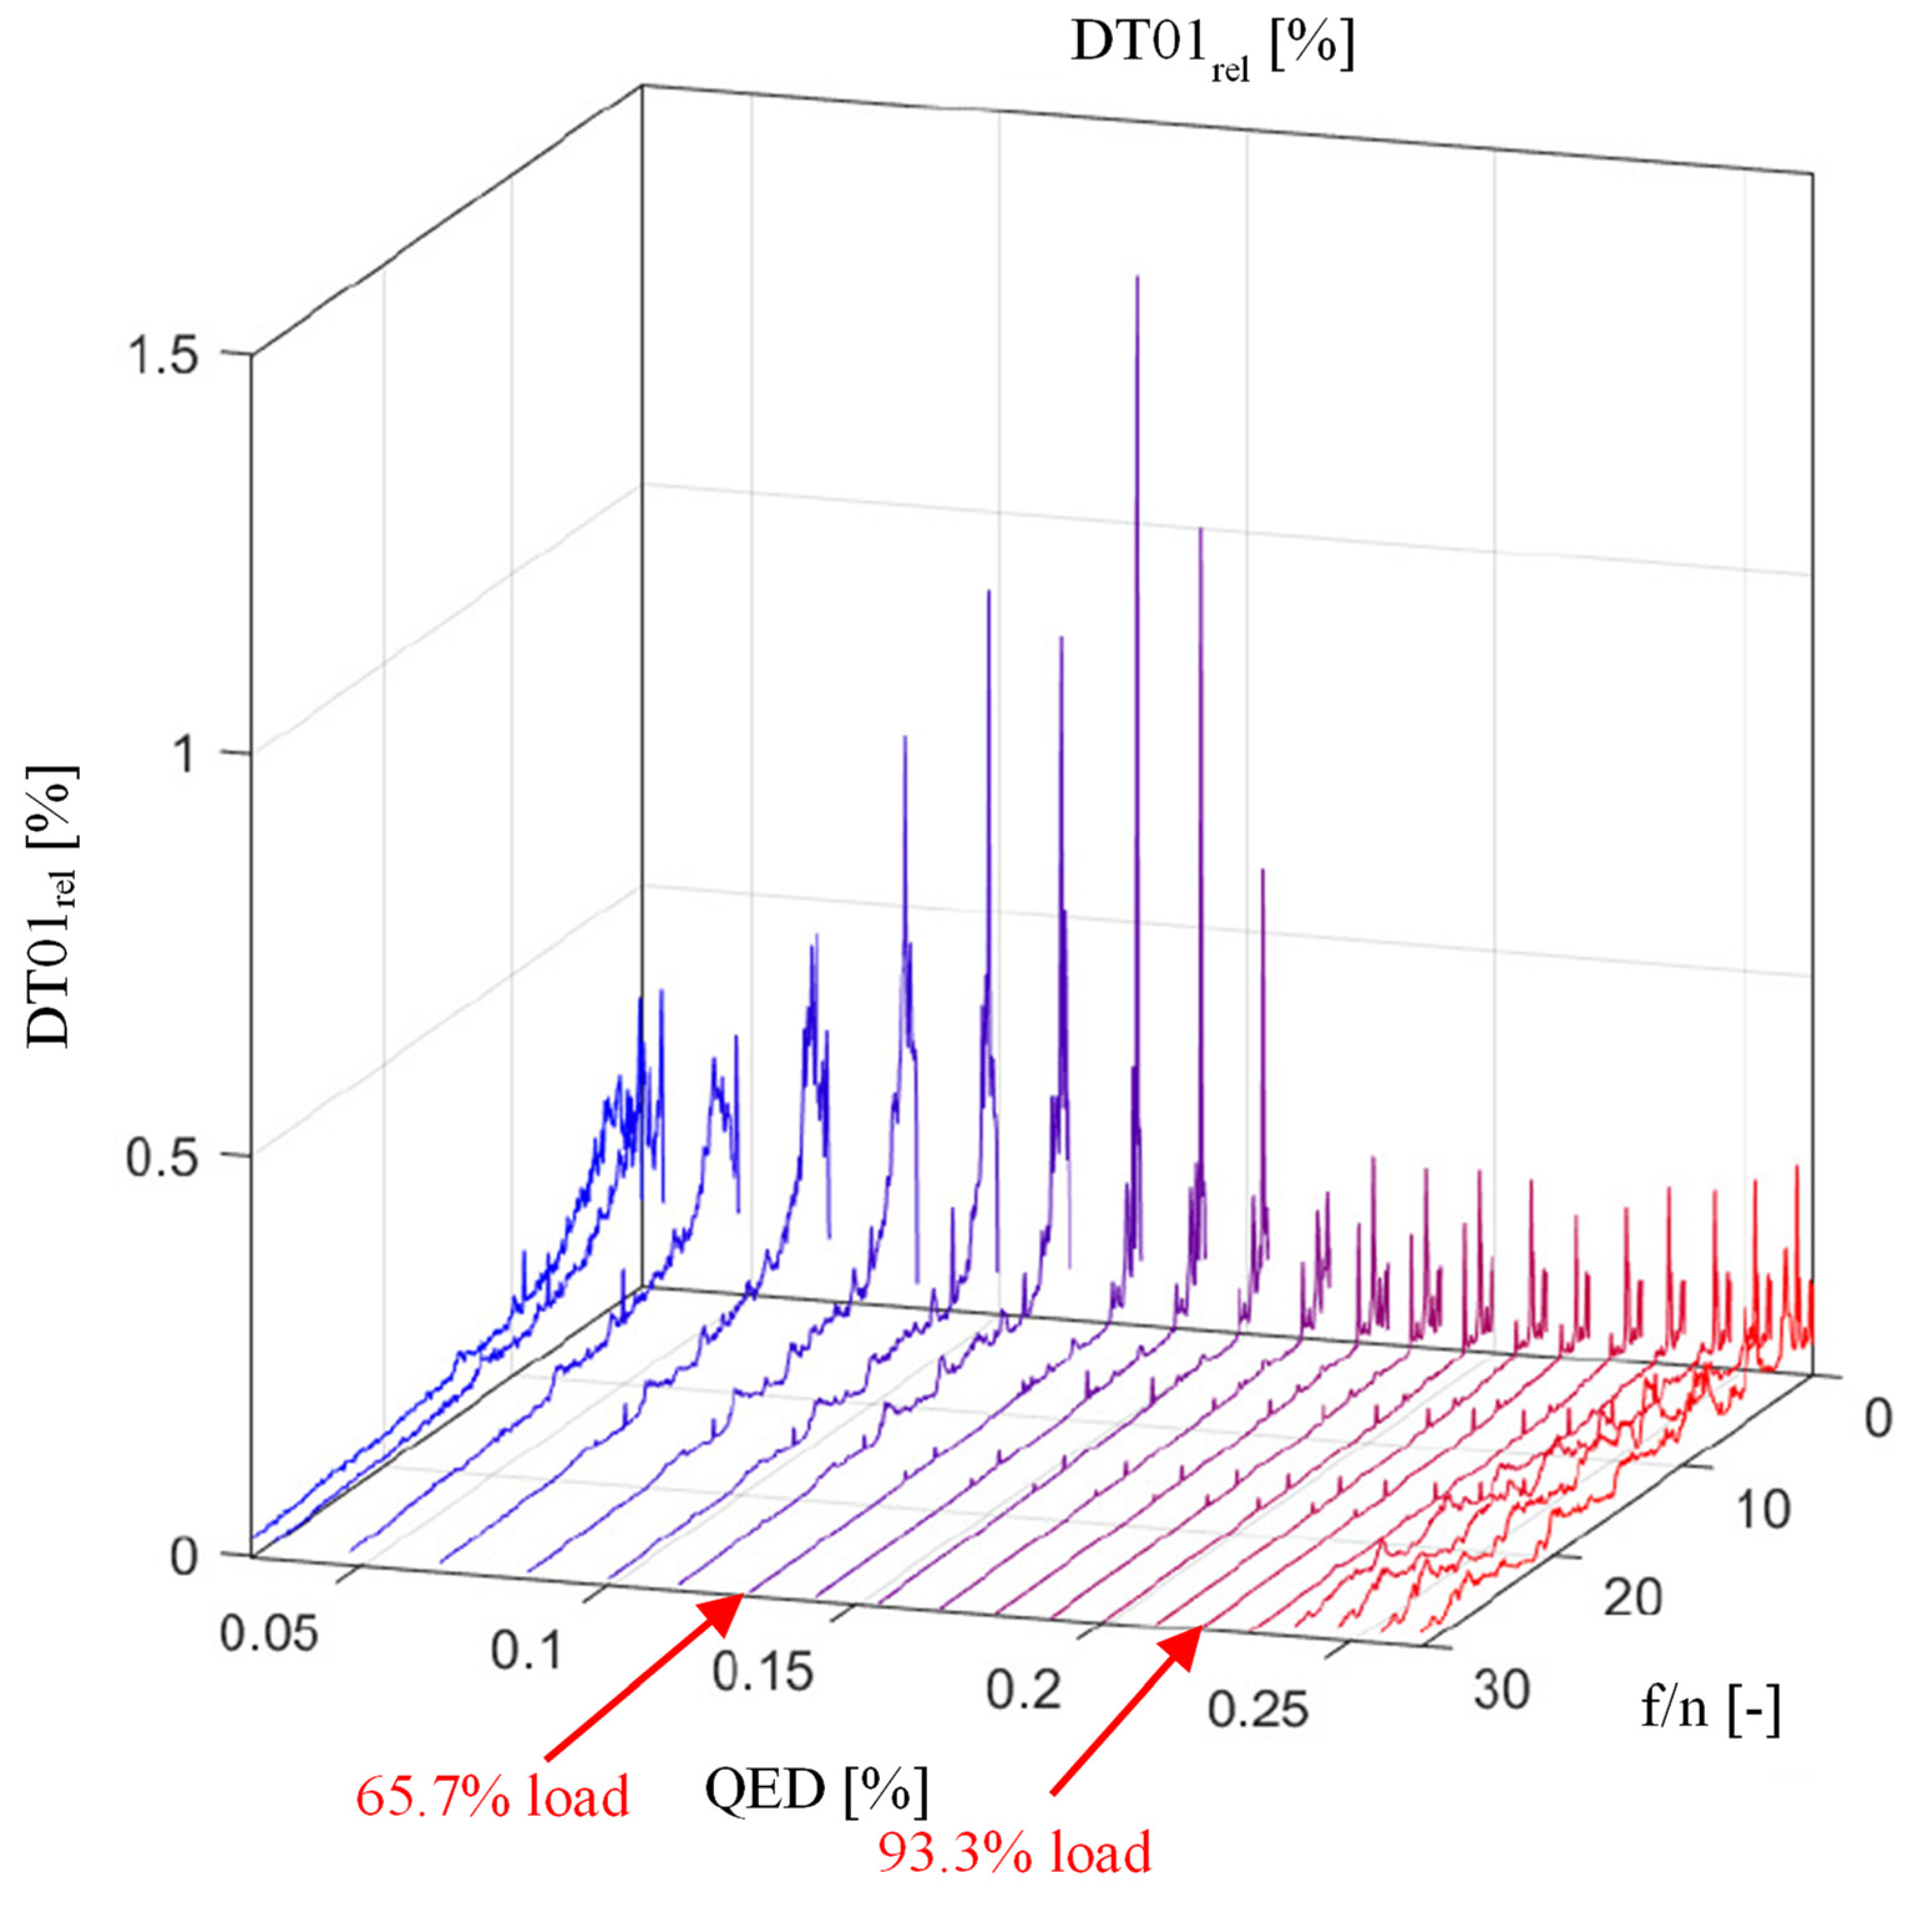
The monitoring point DT01 was placed in the draft tube near the runner outlet interface, and pressure pulsation detection data were obtained, see
Figure 7. It is obvious from the graph that at the location of the monitoring point DT01, the pressure pulsation under the low load (65.7% load) was much higher than that under the strong load (93.3% load) conditions. The low load pressure pulsation was approximately 1.35% and the strong load pressure pulsation amplitude was approximately 0.3%, which was approximately 4.5 times higher than the strong load.
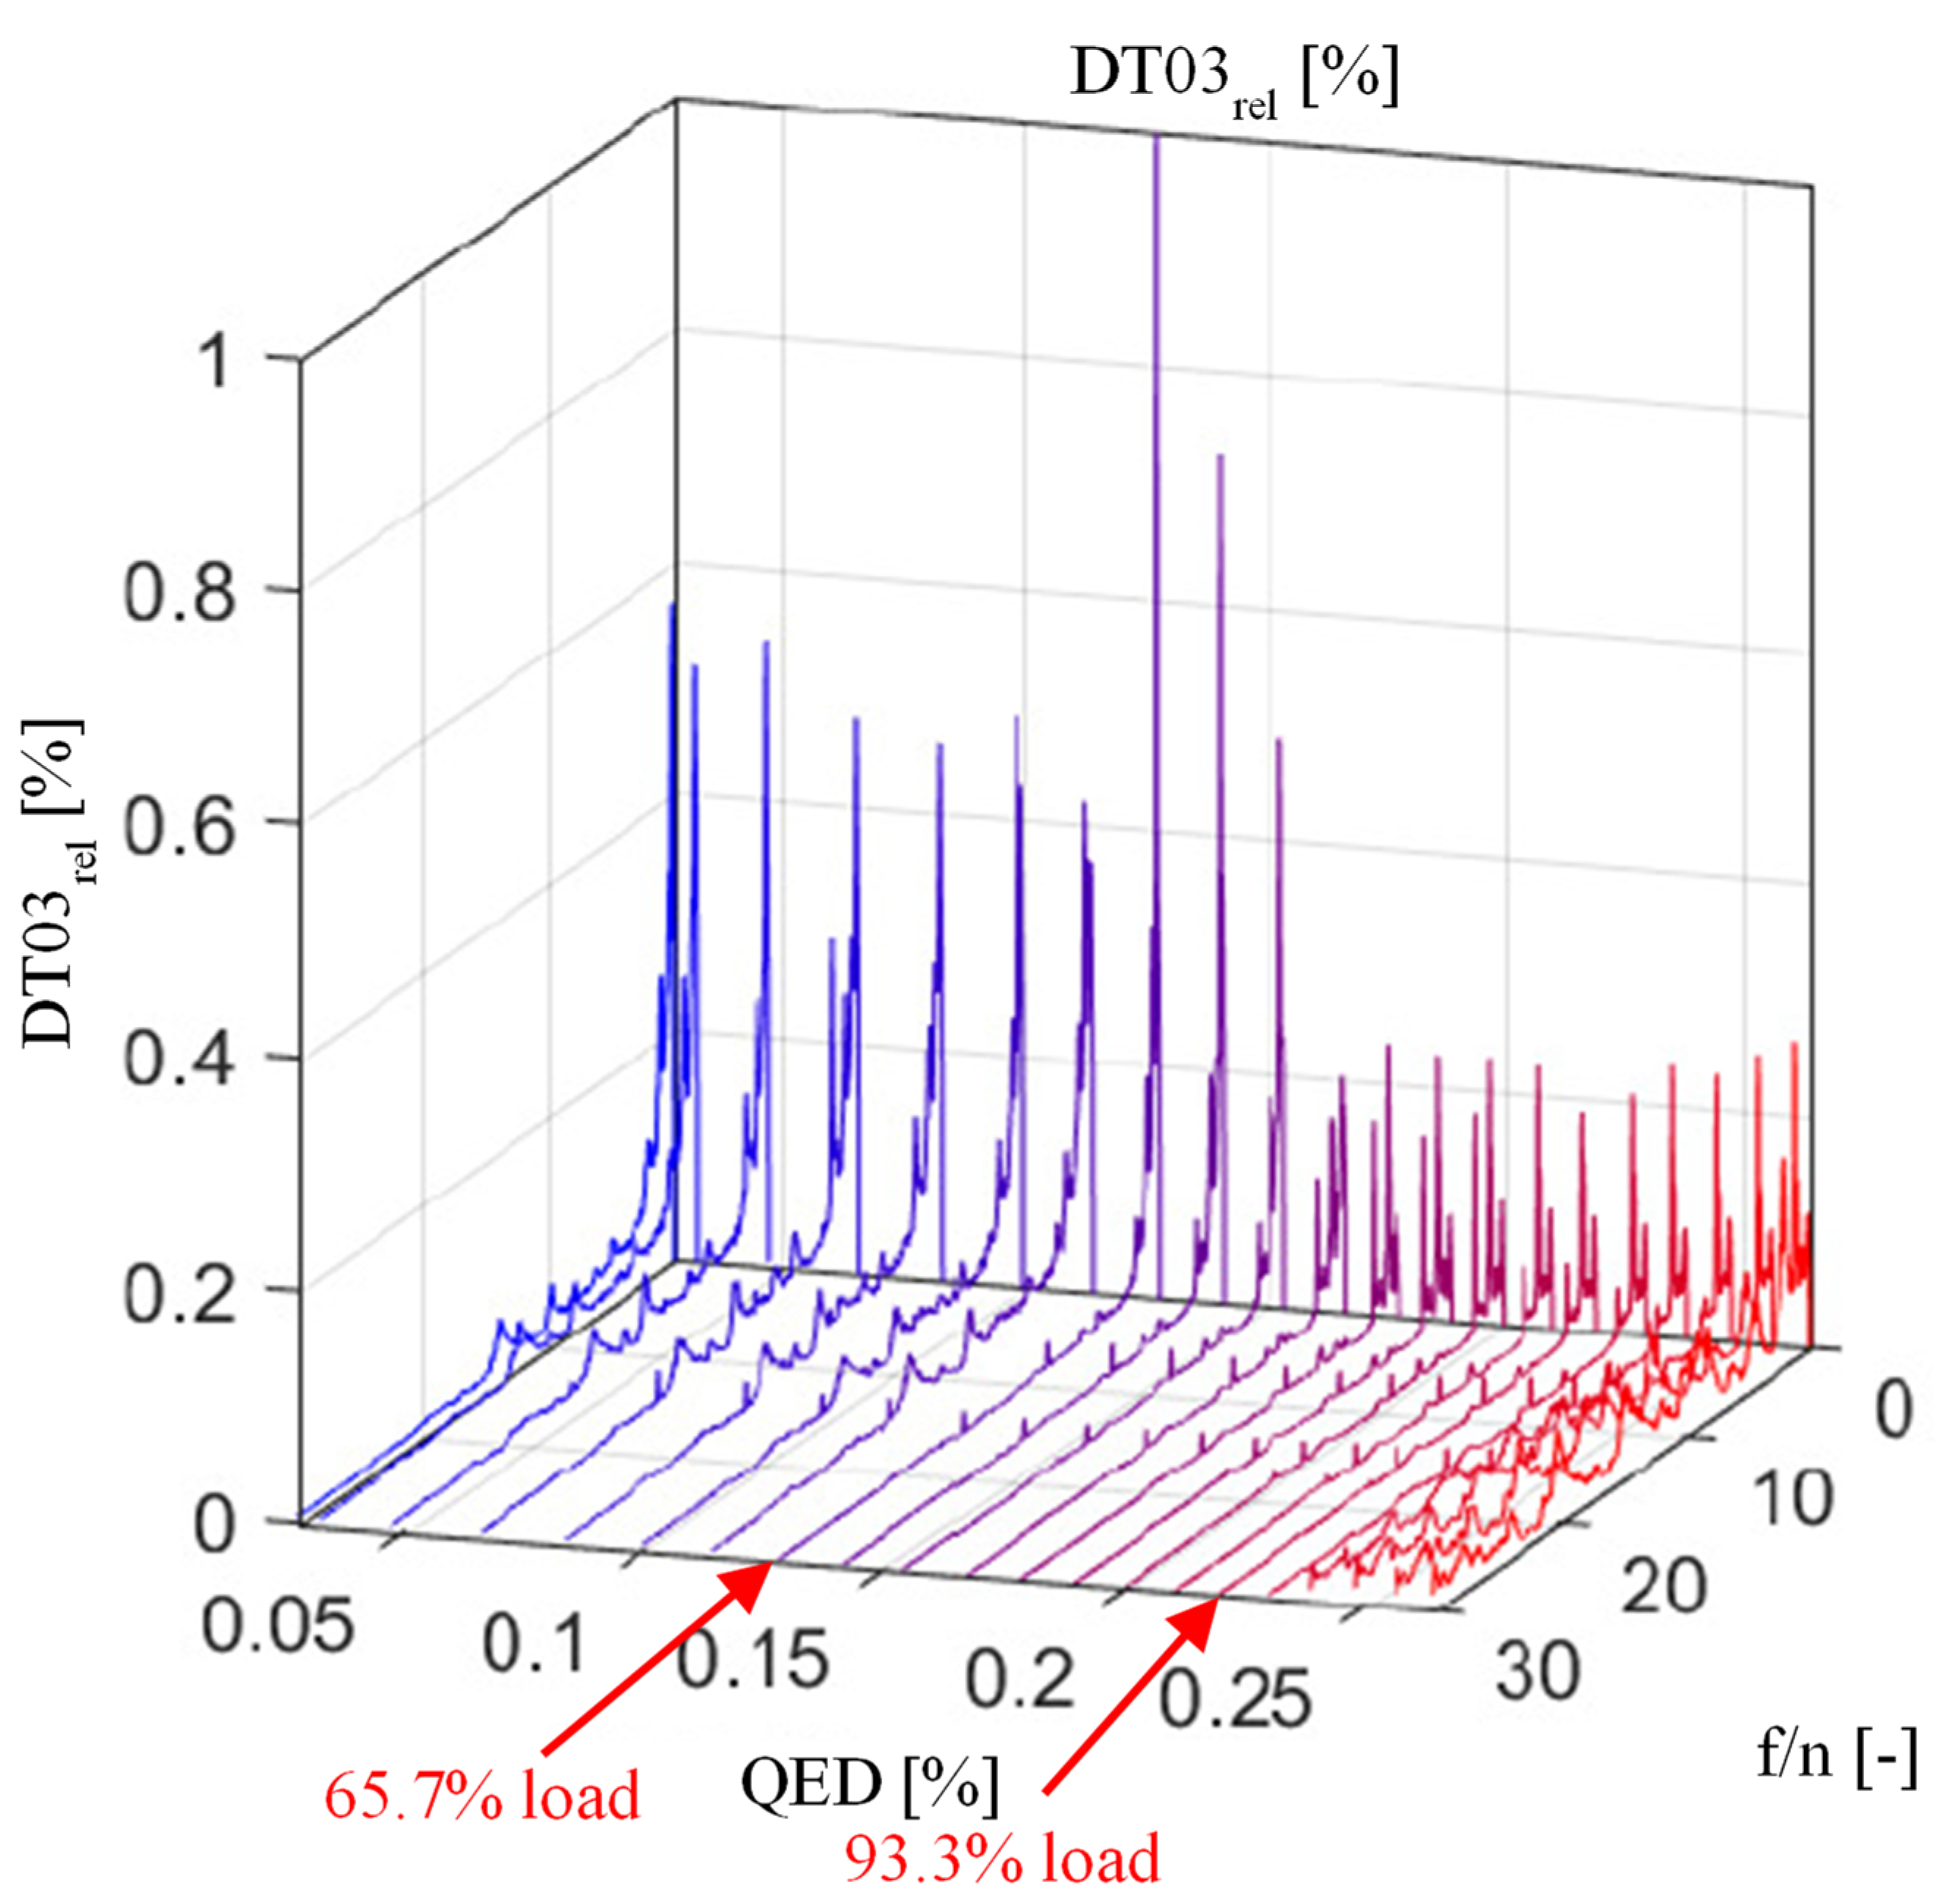
The monitoring point DT03 was set up near the outlet of the straight section of the draft tube, and the fluctuation in the pressure pulsation was monitored, as shown in
Figure 8, from which it can be seen that the pressure pulsation value under the weak load (65.7% load) reached 1% and the pressure pulsation value under the strong load (93.3% load) was only 0.3%. It can be clearly seen that the fluctuation in the pressure pulsation under this monitoring point was influenced by the strength of the load.
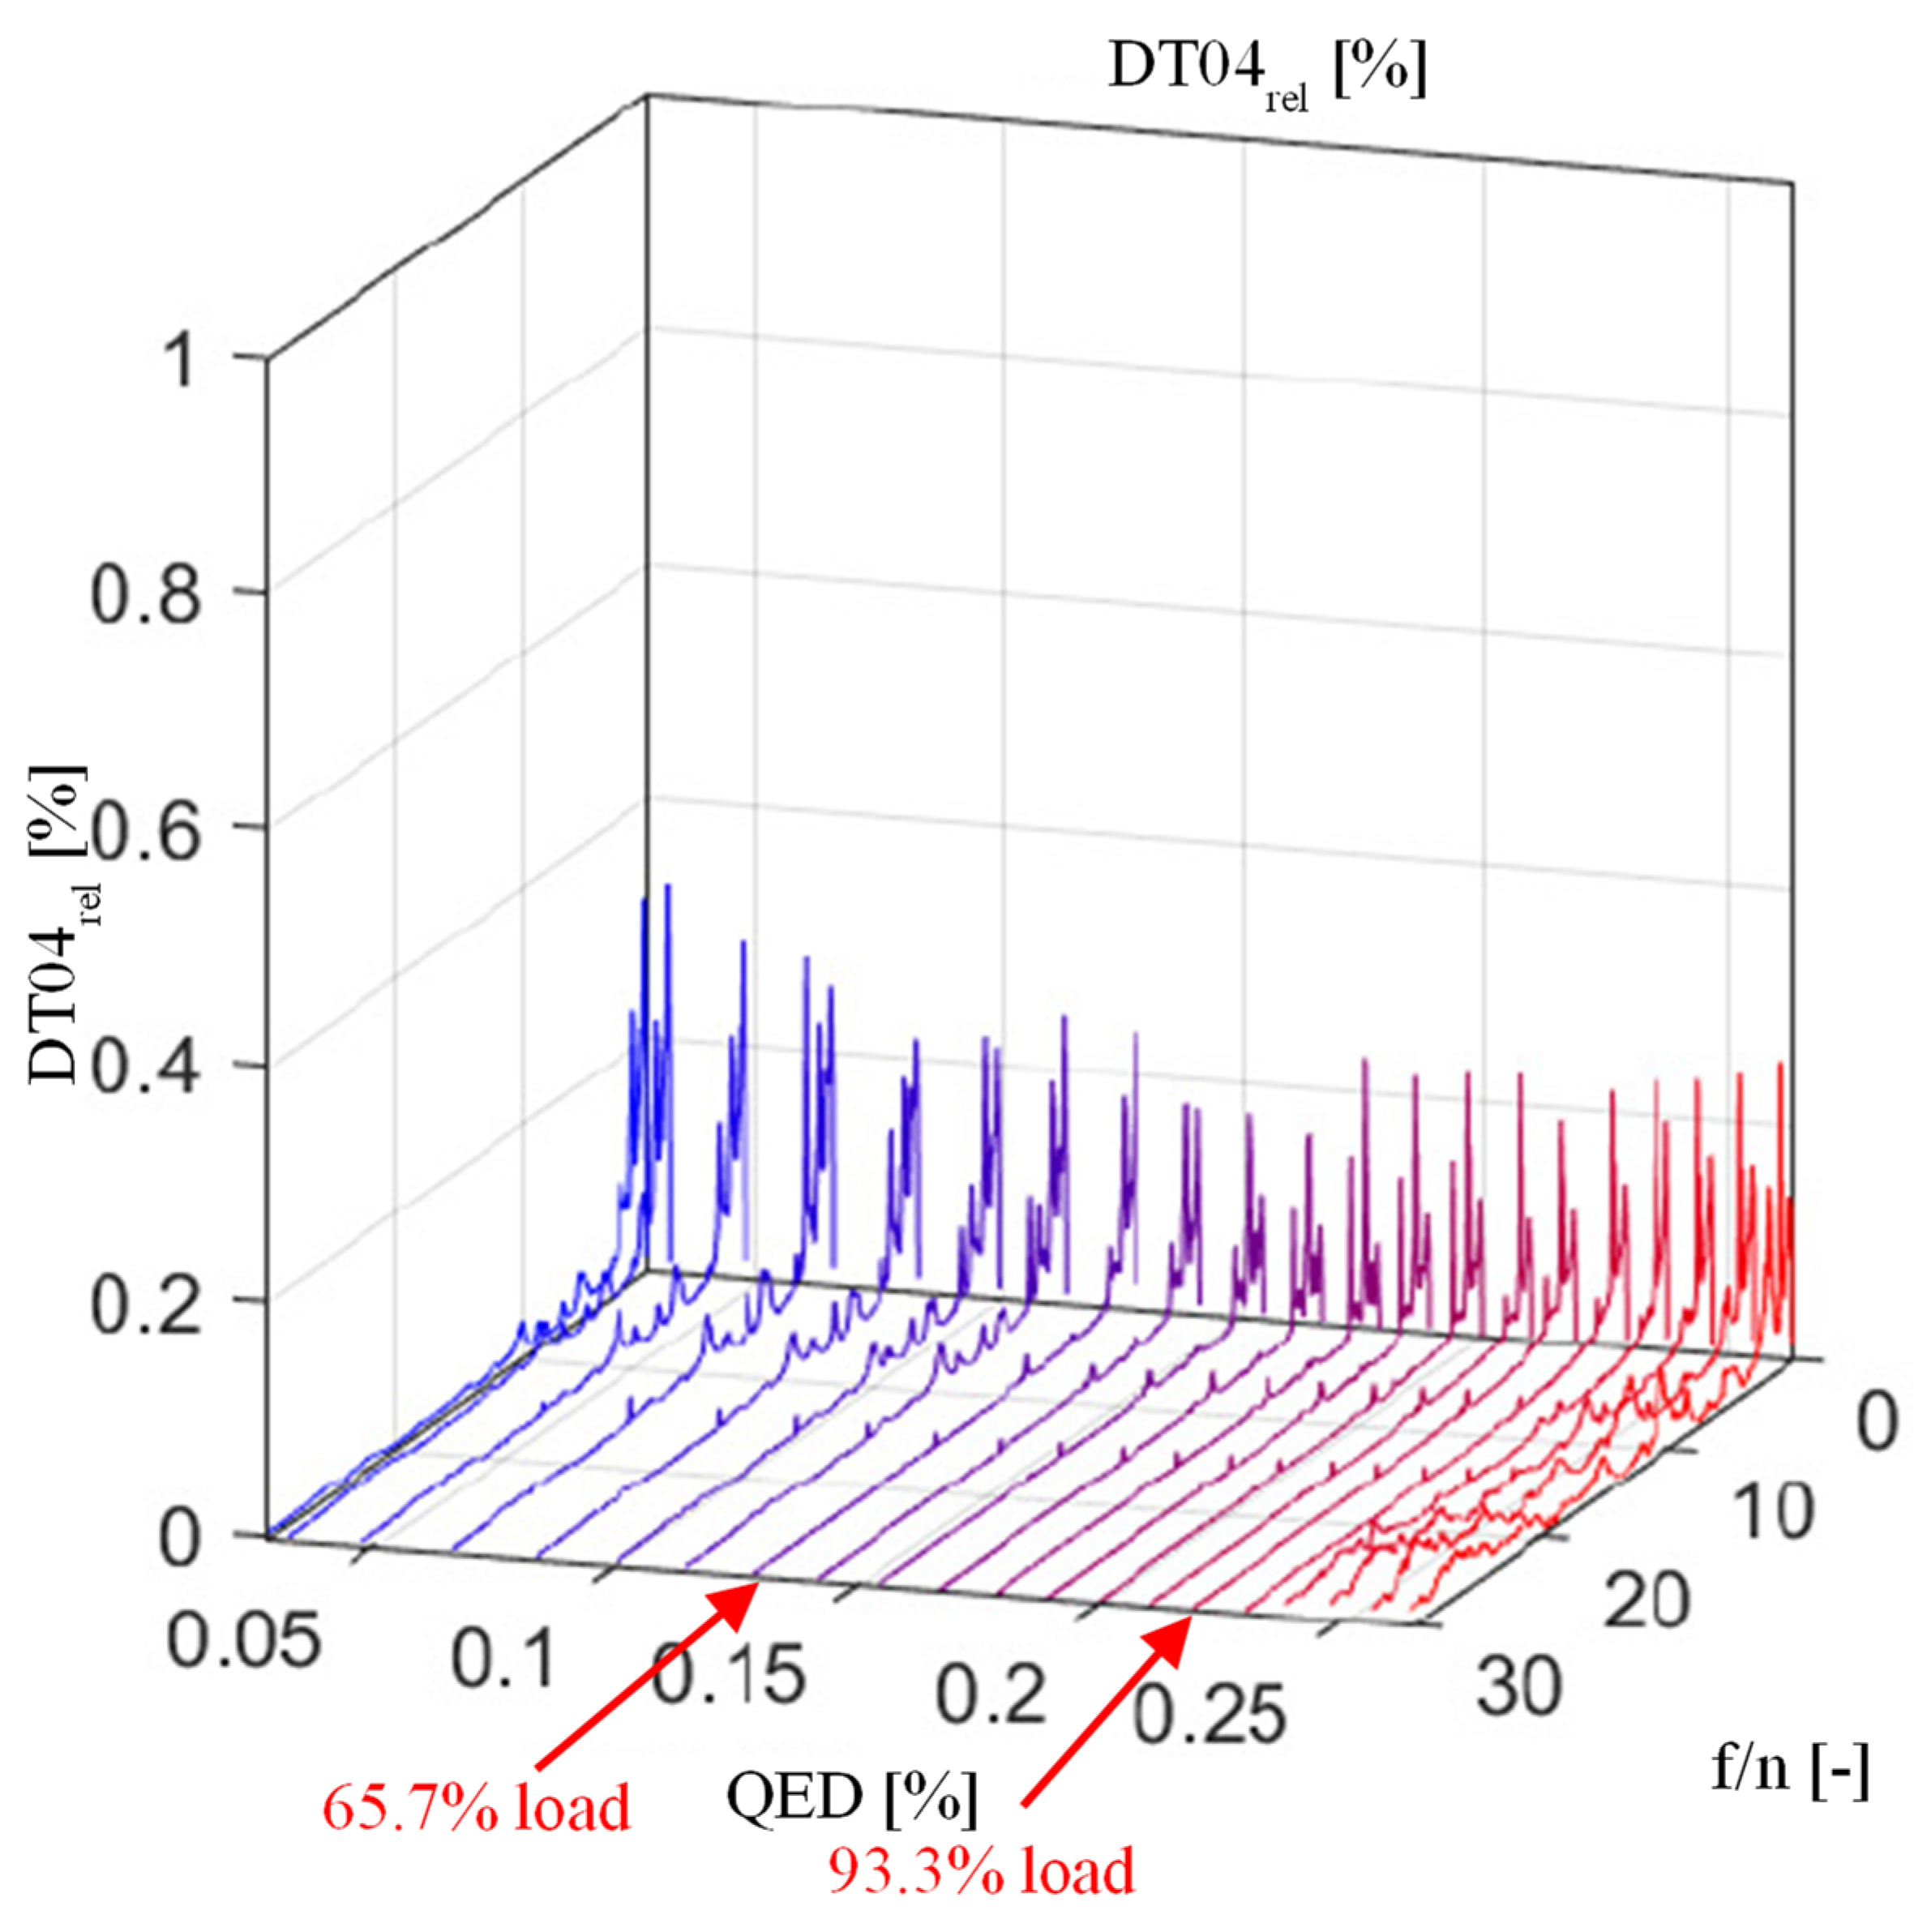
The pressure pulsation fluctuations in the draft-tube elbow section set of monitor point DT04 are shown in
Figure 9, and from the figure, it can be seen that the pressure pulsation value under the weak load conditions and strong load conditions pressured the pulsation amplitude basic star by 0.25% and 0.3%, respectively, so it seems that the pressure pulsation was not obviously affected by the strong and weak loads. The overall pressure pulsation value decreased with an increasing load and then increased.
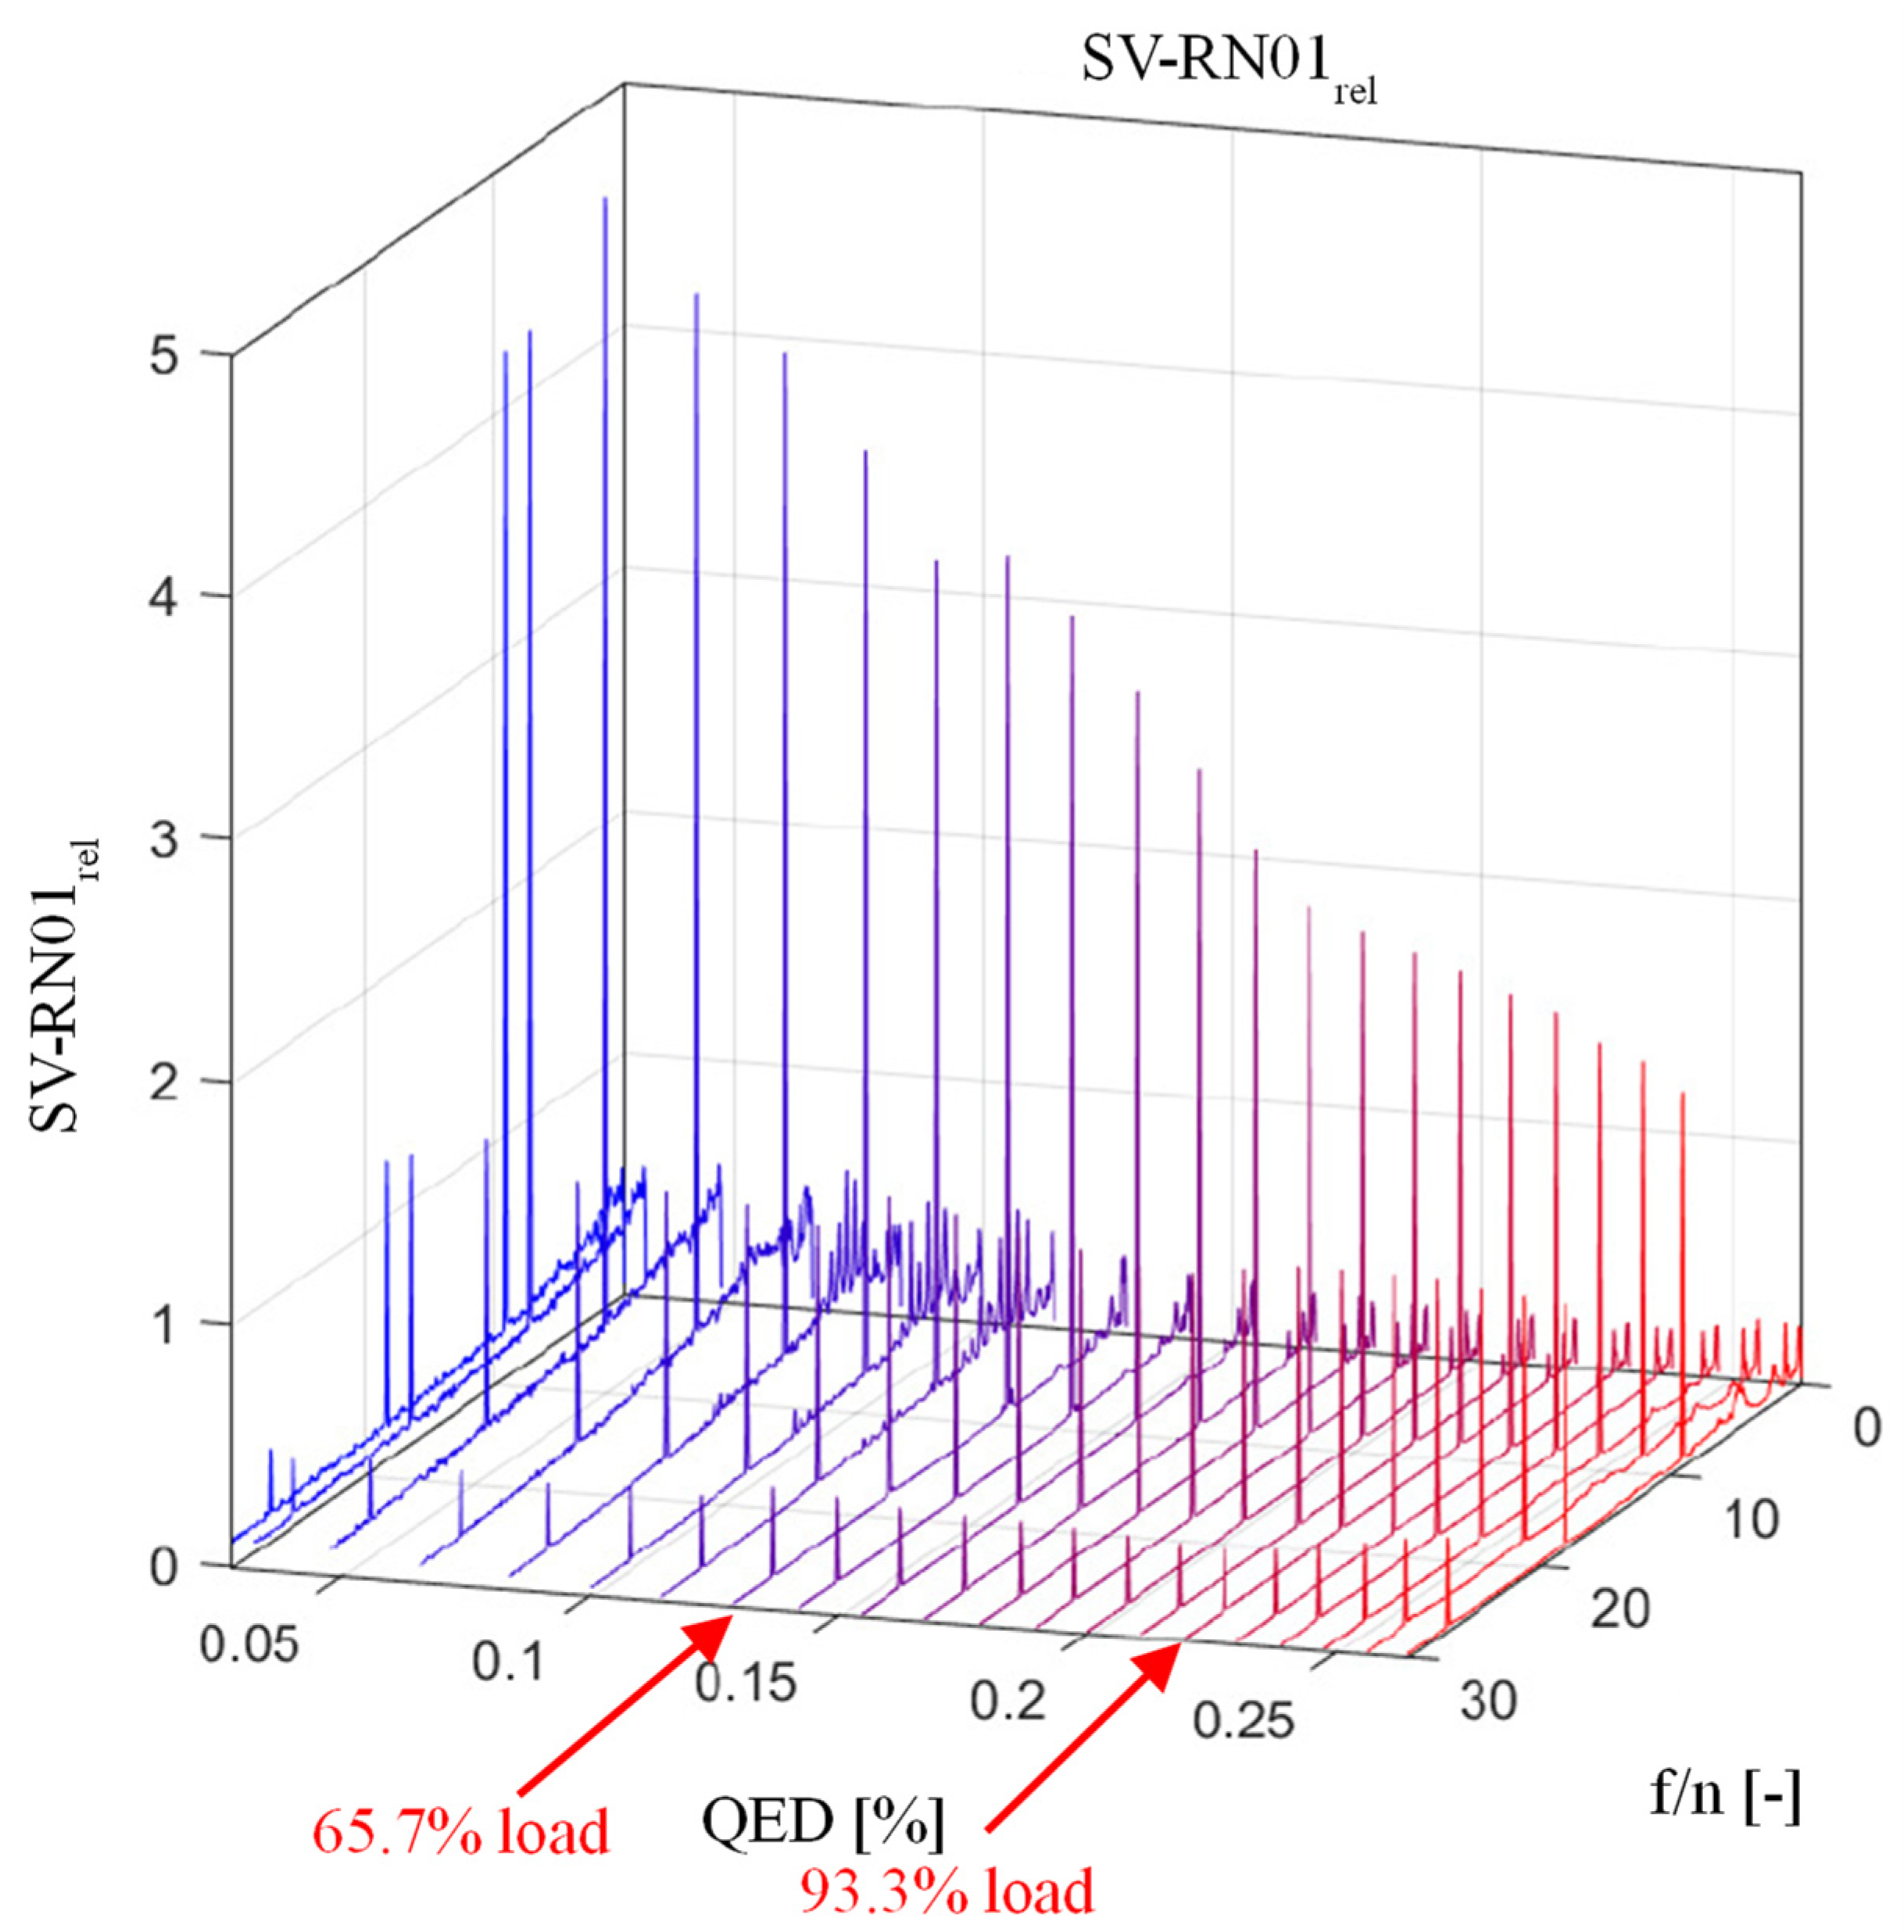
The pressure pulsation fluctuations at monitoring point SV-RN01 in the bladeless zone between the guide vane and the runner are shown in
Figure 10. As can be seen from the graph, the maximum pressure pulsation value was approximately 4% under the weak load condition, and the strongest pressure pulsation value was approximately 2.7% under the strong load condition. The pressure pulsation fluctuations in the bladeless zone between the runner and the guide vane were even stronger compared to the previous pressure pulsation values at the draft-tube monitoring point. From the graph, we can still see that the pressure pulsation fluctuations decreased as the pump turbine load increased. It is assumed that the pressure pulsation in the bladeless zone between the runner and the guide vane had a certain pattern in relation to the pump turbine load conditions.
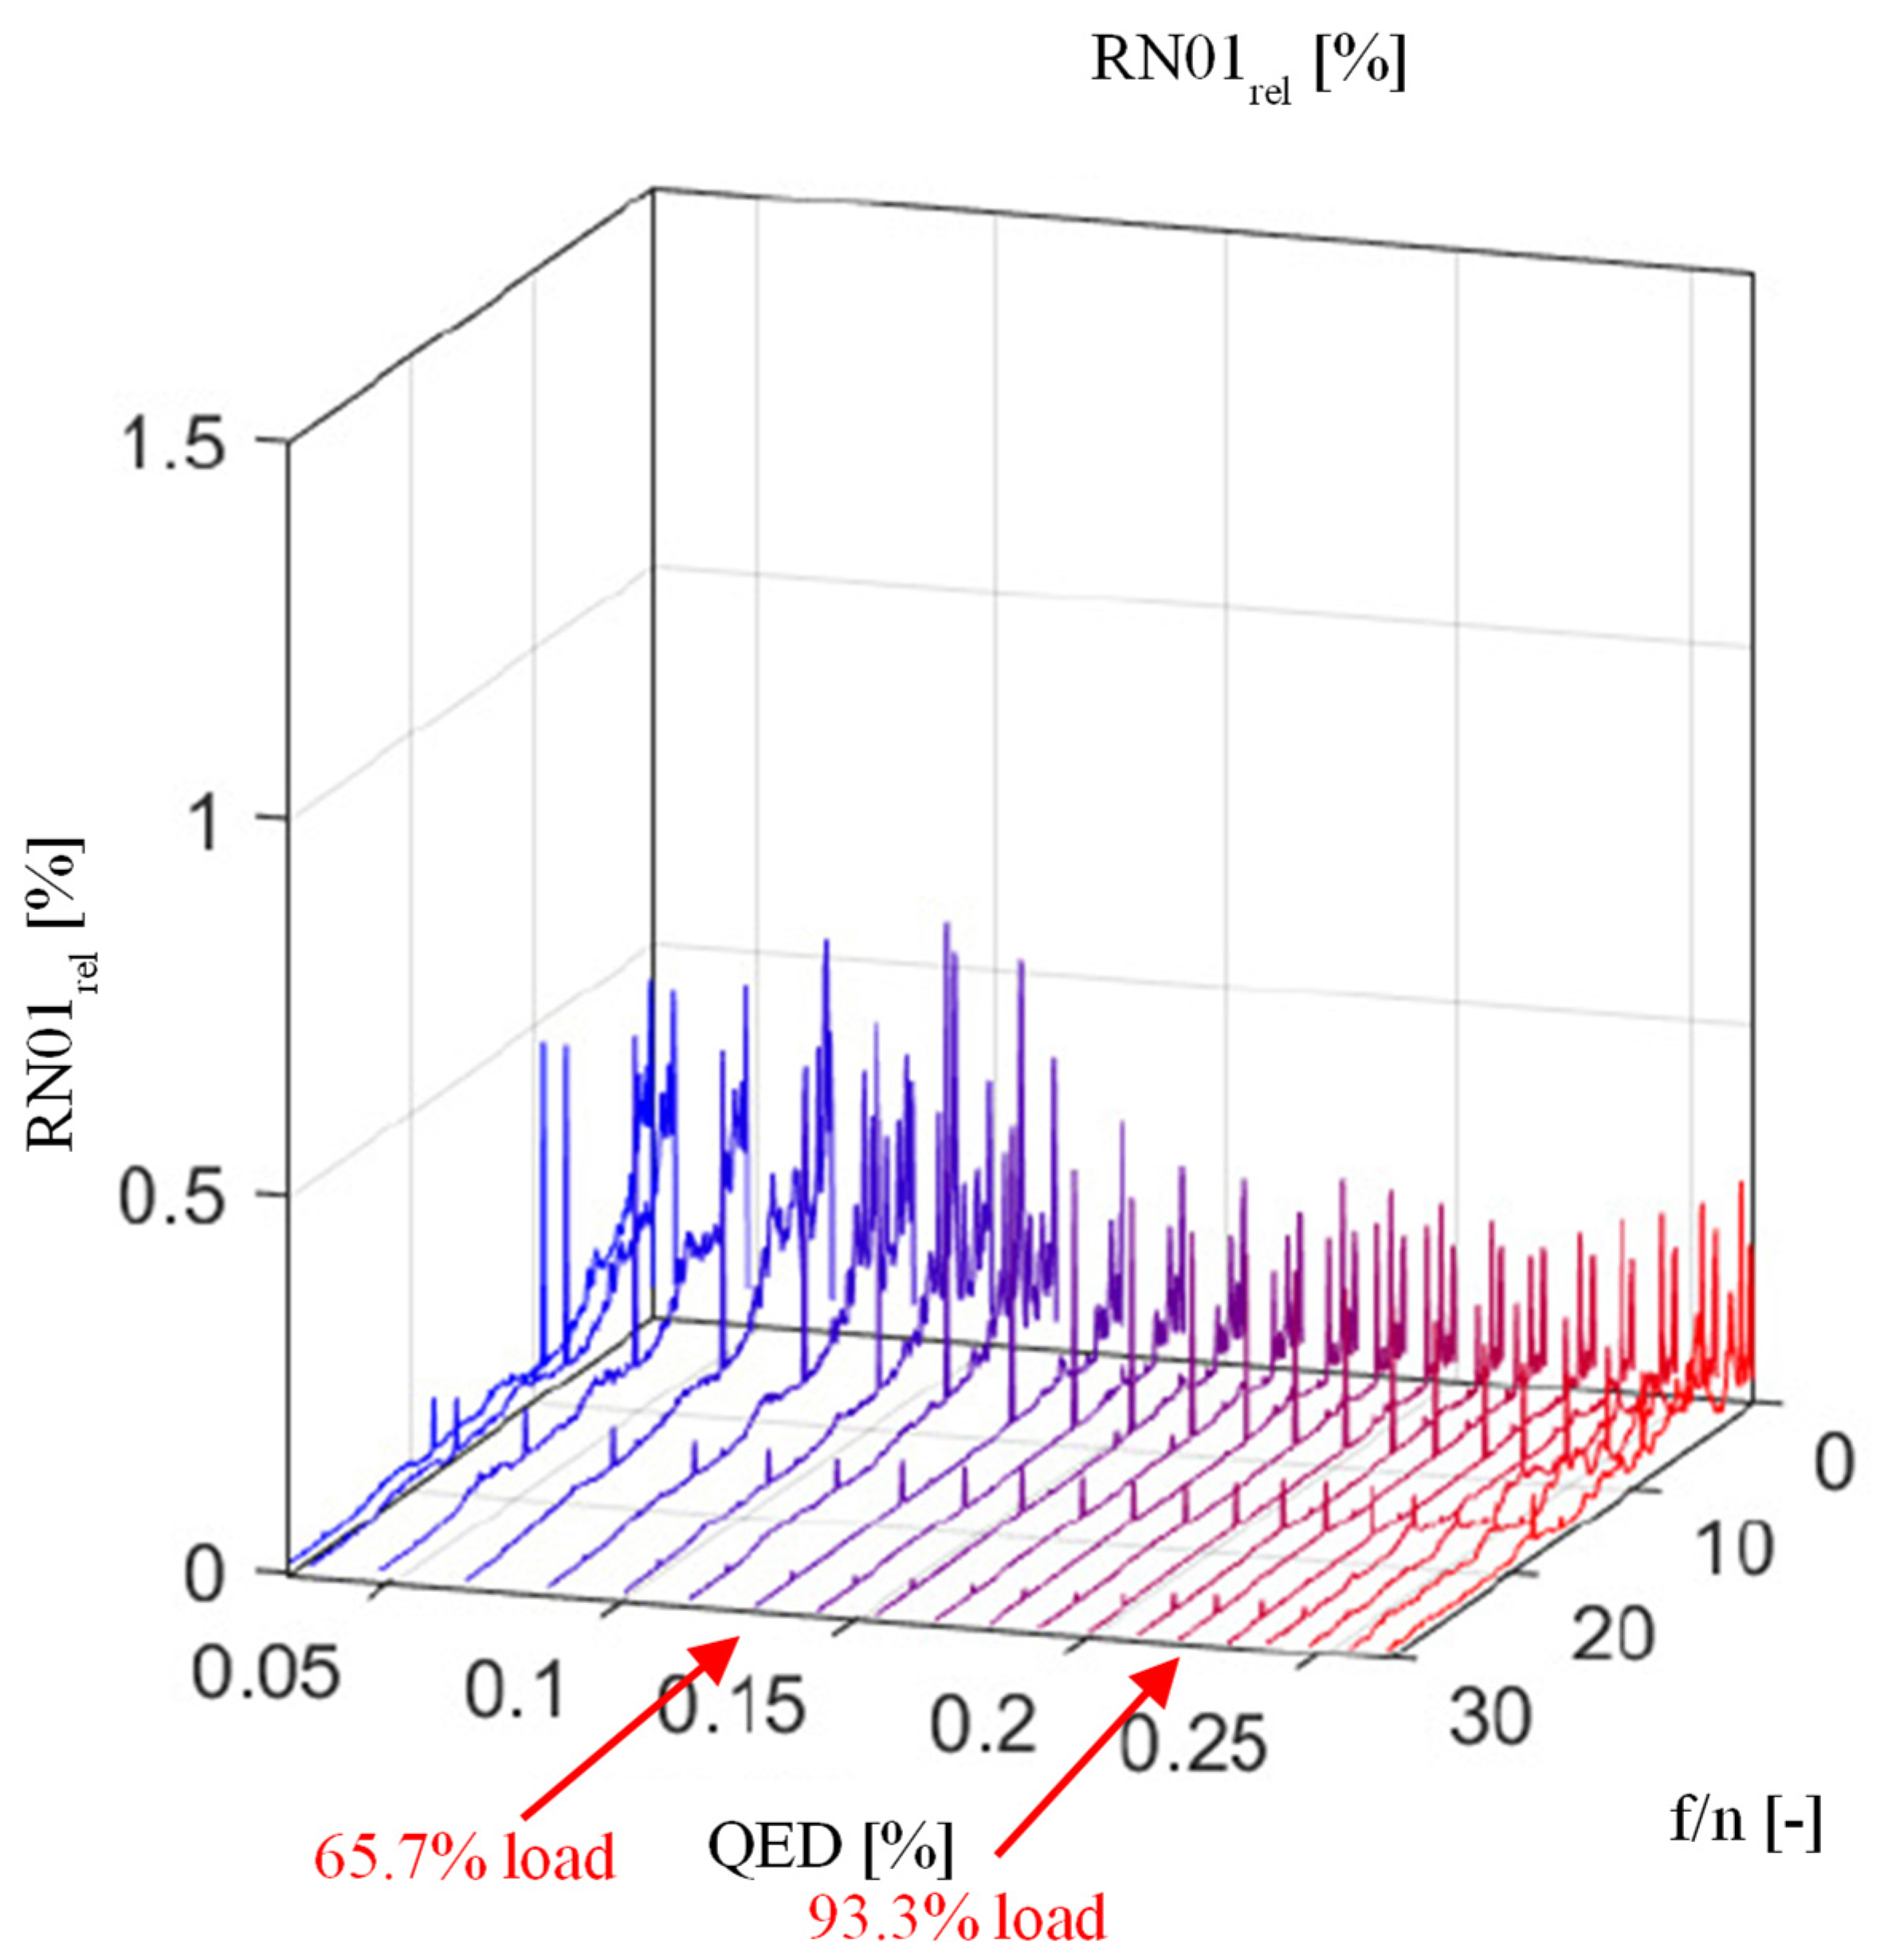
The pressure pulsation fluctuations are shown in
Figure 11, where the monitoring point RN01 was set at the crown gap on the runner. We judge that the pressure pulsation in the crown gap on the runner was relatively weak.
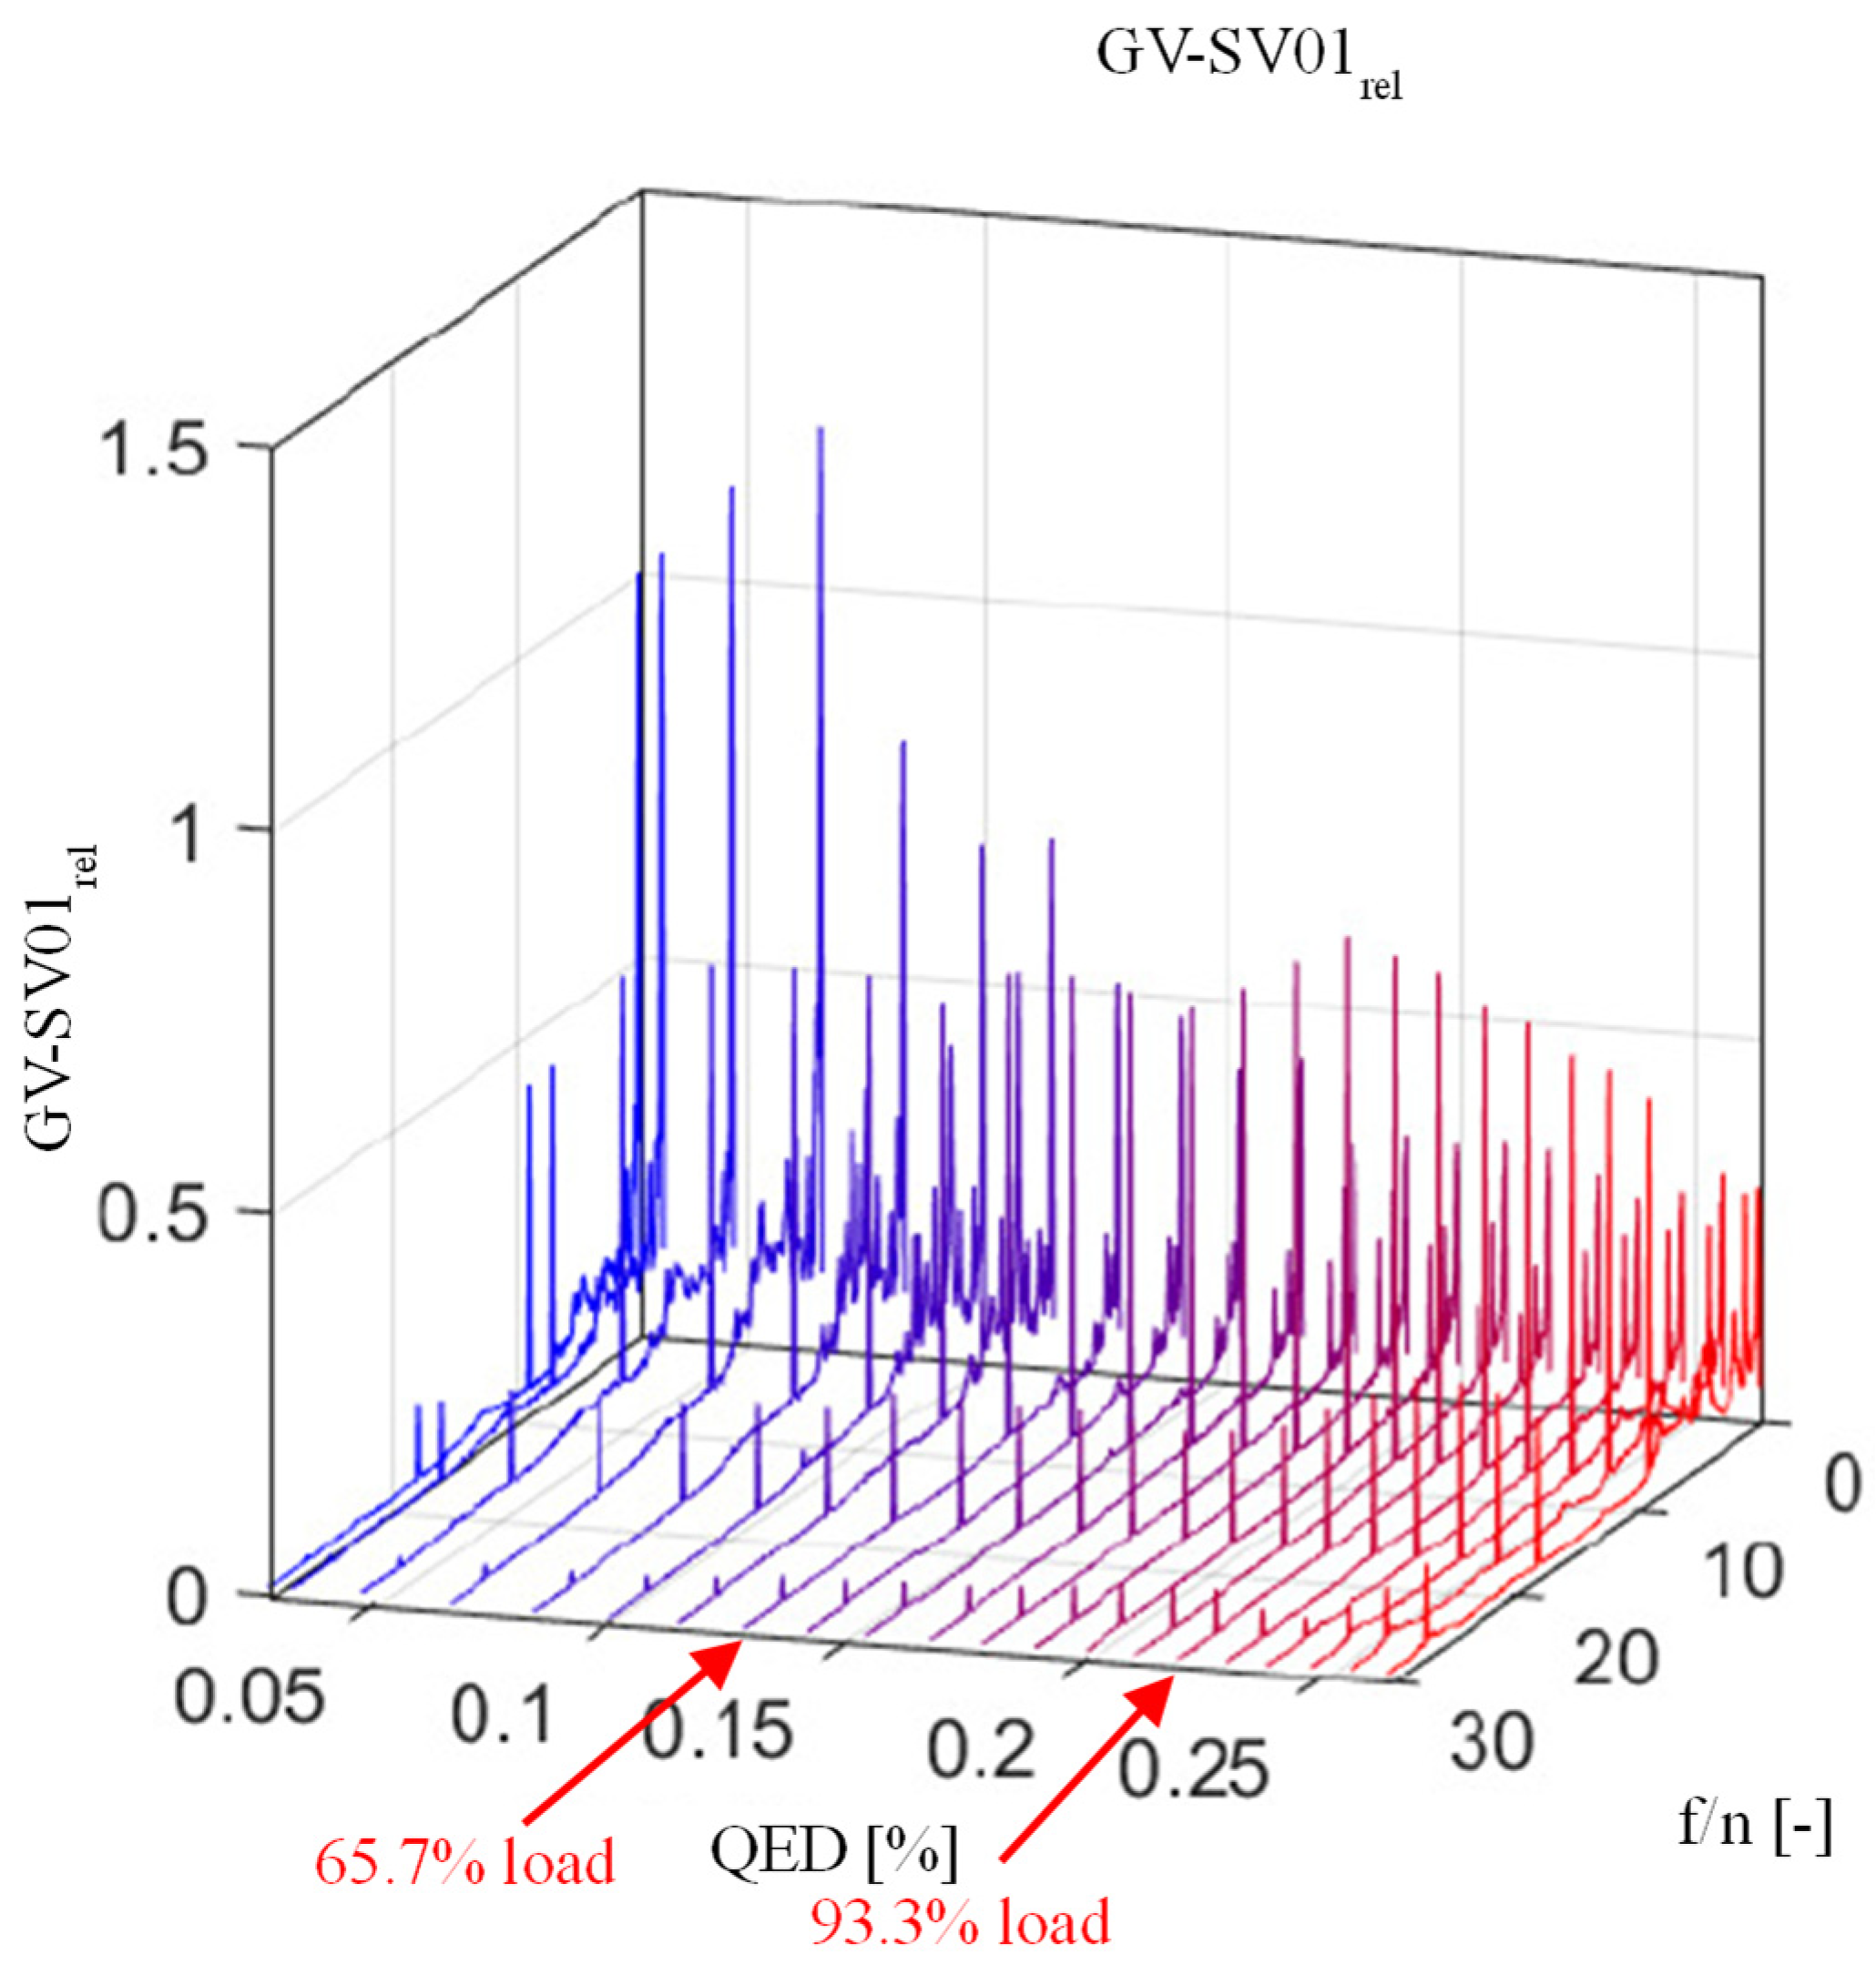
The monitoring point GV-SV01 was set in the bladeless zone between the guide vane and the stay vane, and the pressure pulsation is shown in
Figure 12. It can be seen from the graph that the maximum value of pulsation was about 0.5% under weak load conditions and about 0.48% under strong load conditions; additionally, it was found that the amplitude of the pressure pulsation under both load conditions was basically the same at the GV-SV01 monitoring point value, and there was no significant change.
5. Numerical Simulation Setup
With the development of fluid mechanics and the maturity of numerical simulation techniques, computational fluid dynamics (CFD)-based research methods have come into widespread use. It plays a huge role in the analysis of the flow field and performance of hydraulic machinery.
The differential form of the conservation of fluid flow, the N-S equation, is:
For turbulent flows, the Reynolds averaged Navier–Stokes (RANS) method was used to treat turbulent motion as a composite of the time-averaged and instantaneous pulsating flows. Any instantaneous variable
can be decomposed into a time-averaged value
and a pulsating value
:
where
t is the time and Δ
t is the time scale. Neglecting the effect of density pulsations, but considering the variation in the mean density, the turbulence control equations were averaged over time and the tensor representations of the continuous, and the momentum equations are as follows:
We used the commercial software ANSYS CFX for the numerical simulation, which followed the numerical simulation setup. The fluid medium was set to water at 25 °C and the reference pressure was 1 Atm. The turbulence model was set to the SST
k-ω model, considering its advantages of having better stability and faster convergence, and the fact that it can simulate most engineering fluid motion states. The transport equations for the turbulent kinetic energy
k and specific dissipation rate
ω were
where
ρ is the fluid density,
Pt is the turbulence generation term,
μ is the dynamic viscosity,
μt is the eddy viscosity coefficient,
σ is the model constant,
Cω is the coefficient of the turbulent dissipation term,
F1 is the blending equation, and
k-ω is the scale of the turbulence. In the term
ρk3/2/
lk-ω, the expression for the turbulence scale
lk-ω is given by
The turbine inlet was set as a flow inlet boundary condition with a mass flow rate value of 88,333.3 kg/s. The draft tube outlet was set as a static pressure outlet boundary condition with an average static pressure value of 107,914 Pa, and all the walls were set as a no-slip boundary. A multireference frame (MRF) model was used, with the runner and the runner gap set as the rotating reference system, the rotating component speed set to 375 r/min, and the rest of the components set as the stationary reference system. The General Grid Interface (GGI) model was chosen for the data transfer between the different components.
The minimum number of iterations for the stable calculation was set at 300 and the maximum number of iterations was set at 1000, and the convergence criterion was that the root mean square residuals of the equations of motion and continuity were less than 0.00001. In total, 10 cycles of unstable calculations were carried out, with 720 steps per cycle and 10 iterations per step, to ensure convergence. The pump turbine efficiency η, flow rate Q, power P, and head H were monitored at the monitoring points between the runner and the guide vane, in the bladeless zone between the guide and stay vane, and in the draft tube.
6. Numerical Results
The CFD simulation results were analyzed to investigate the pressure conditions on the pump turbine with a rated head of 440 m under 65.7%, and 93.3% load intensities and with flow field streamlines.
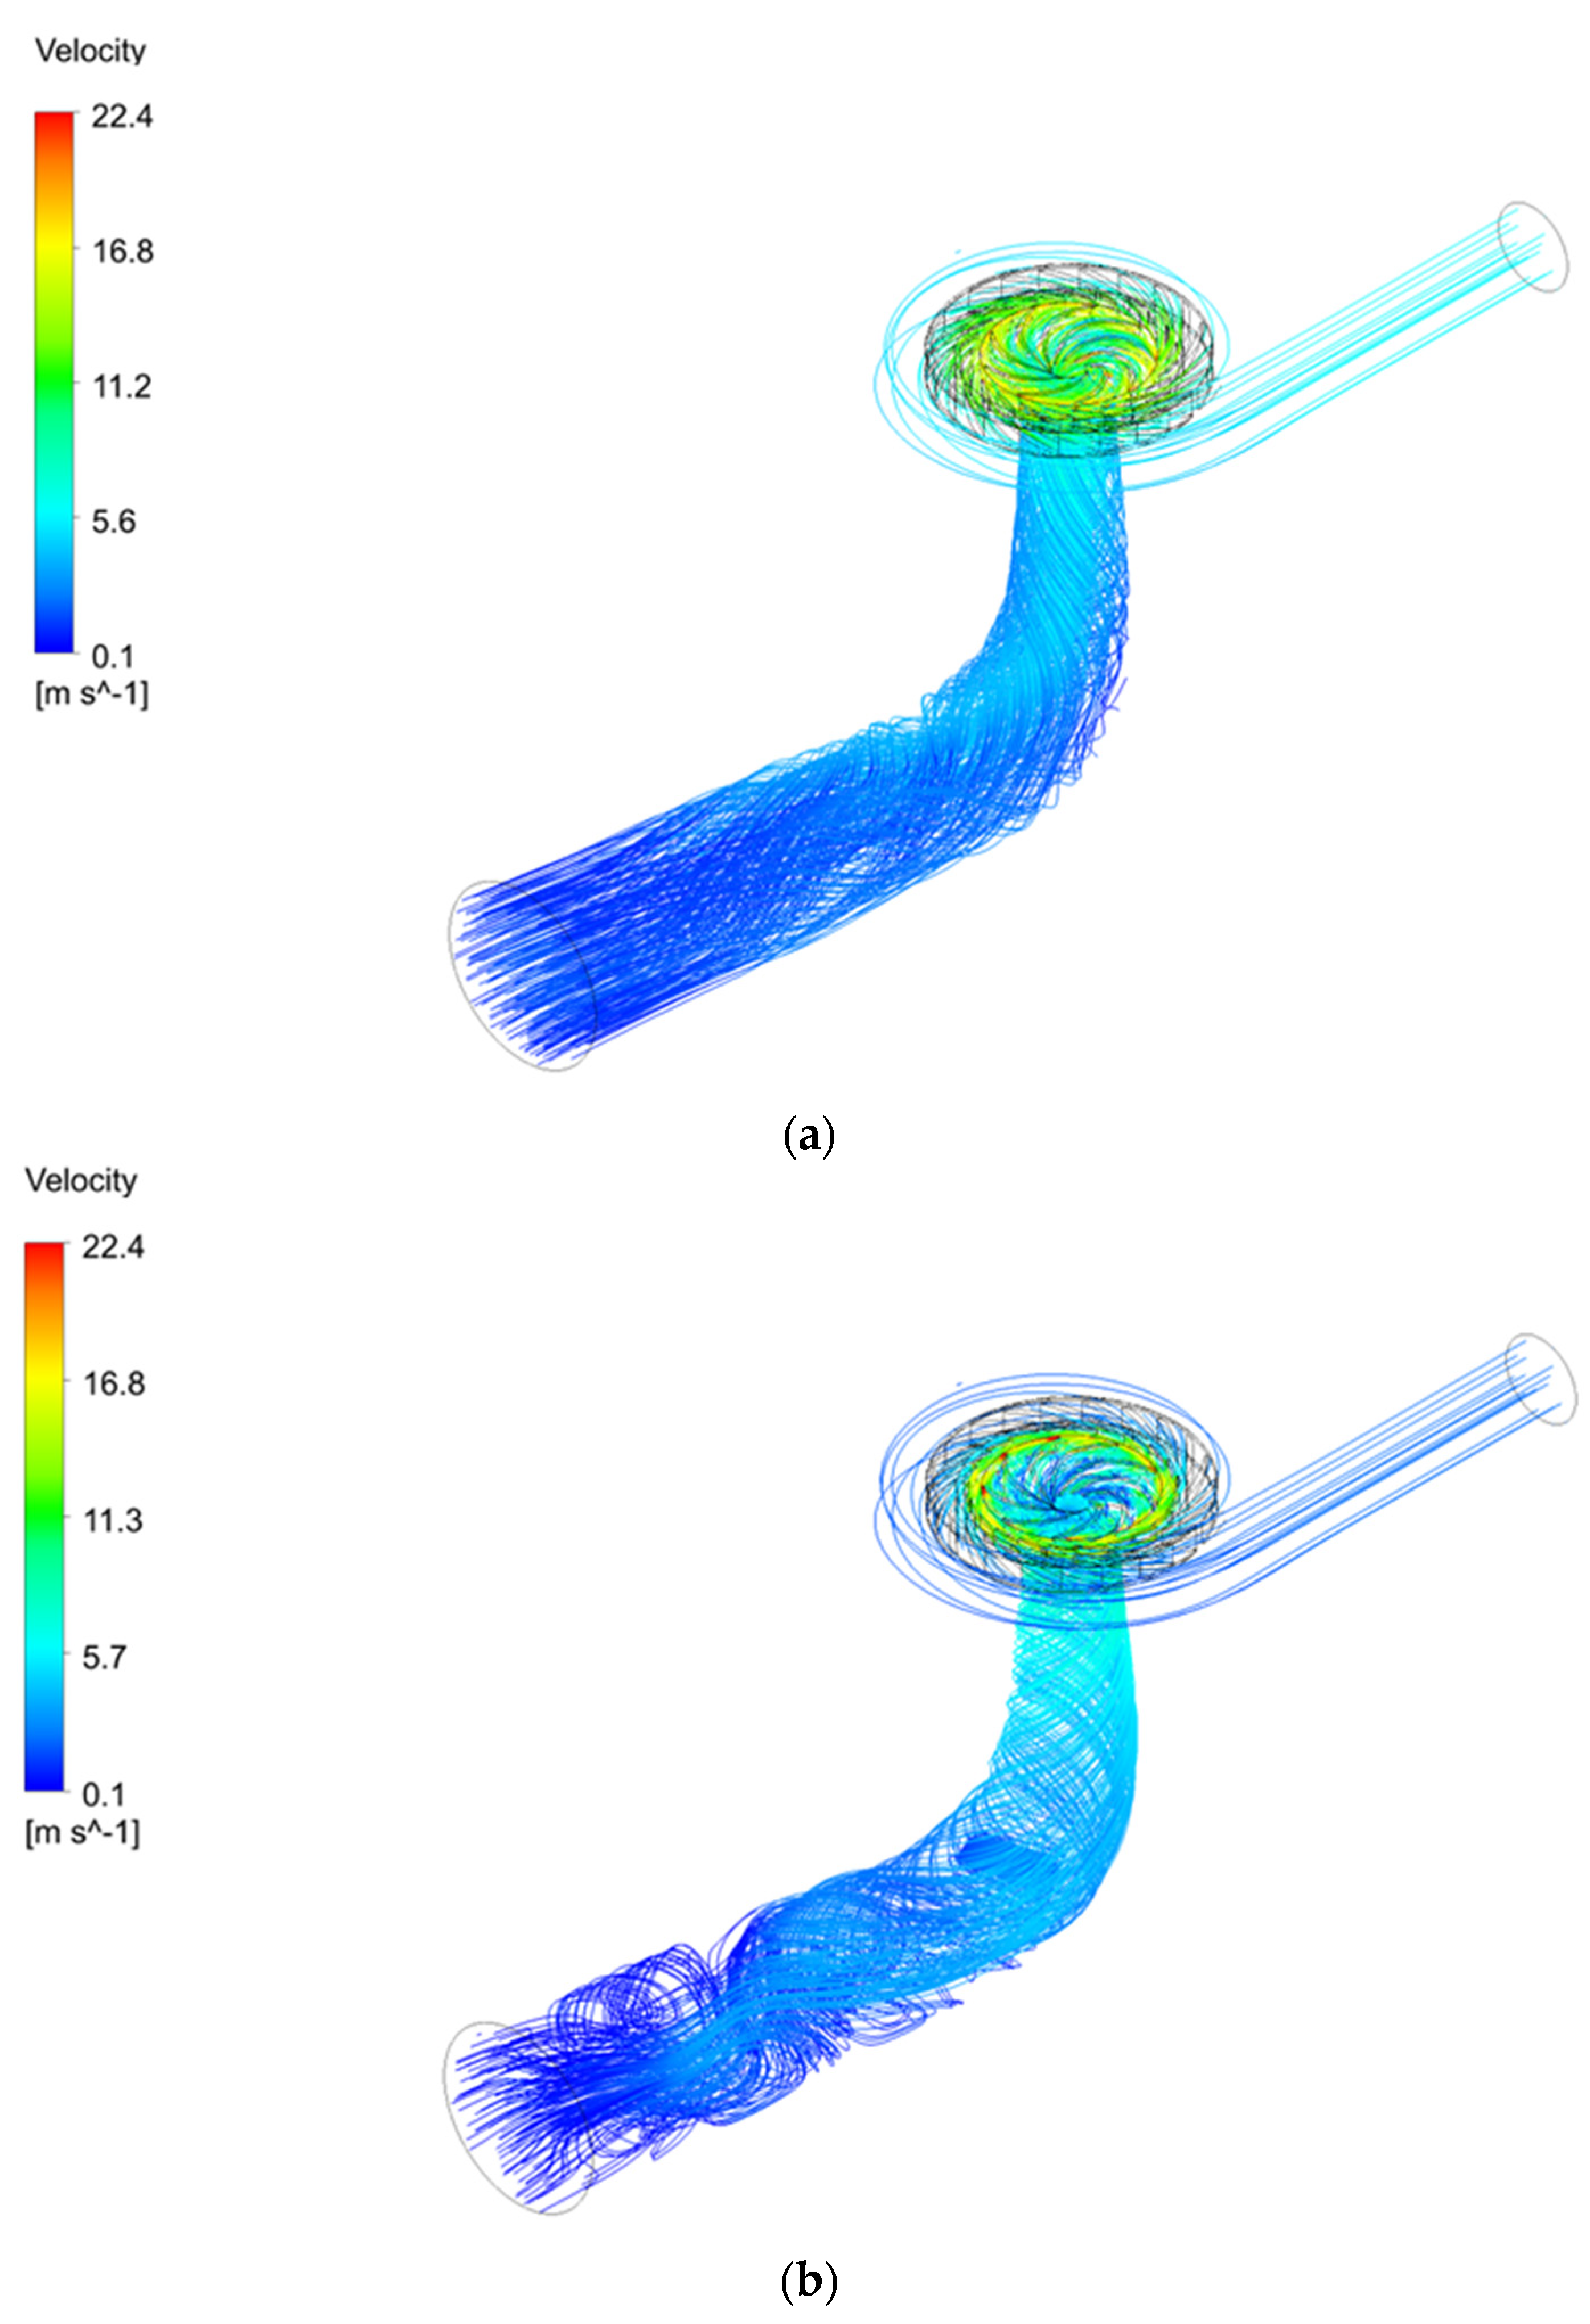
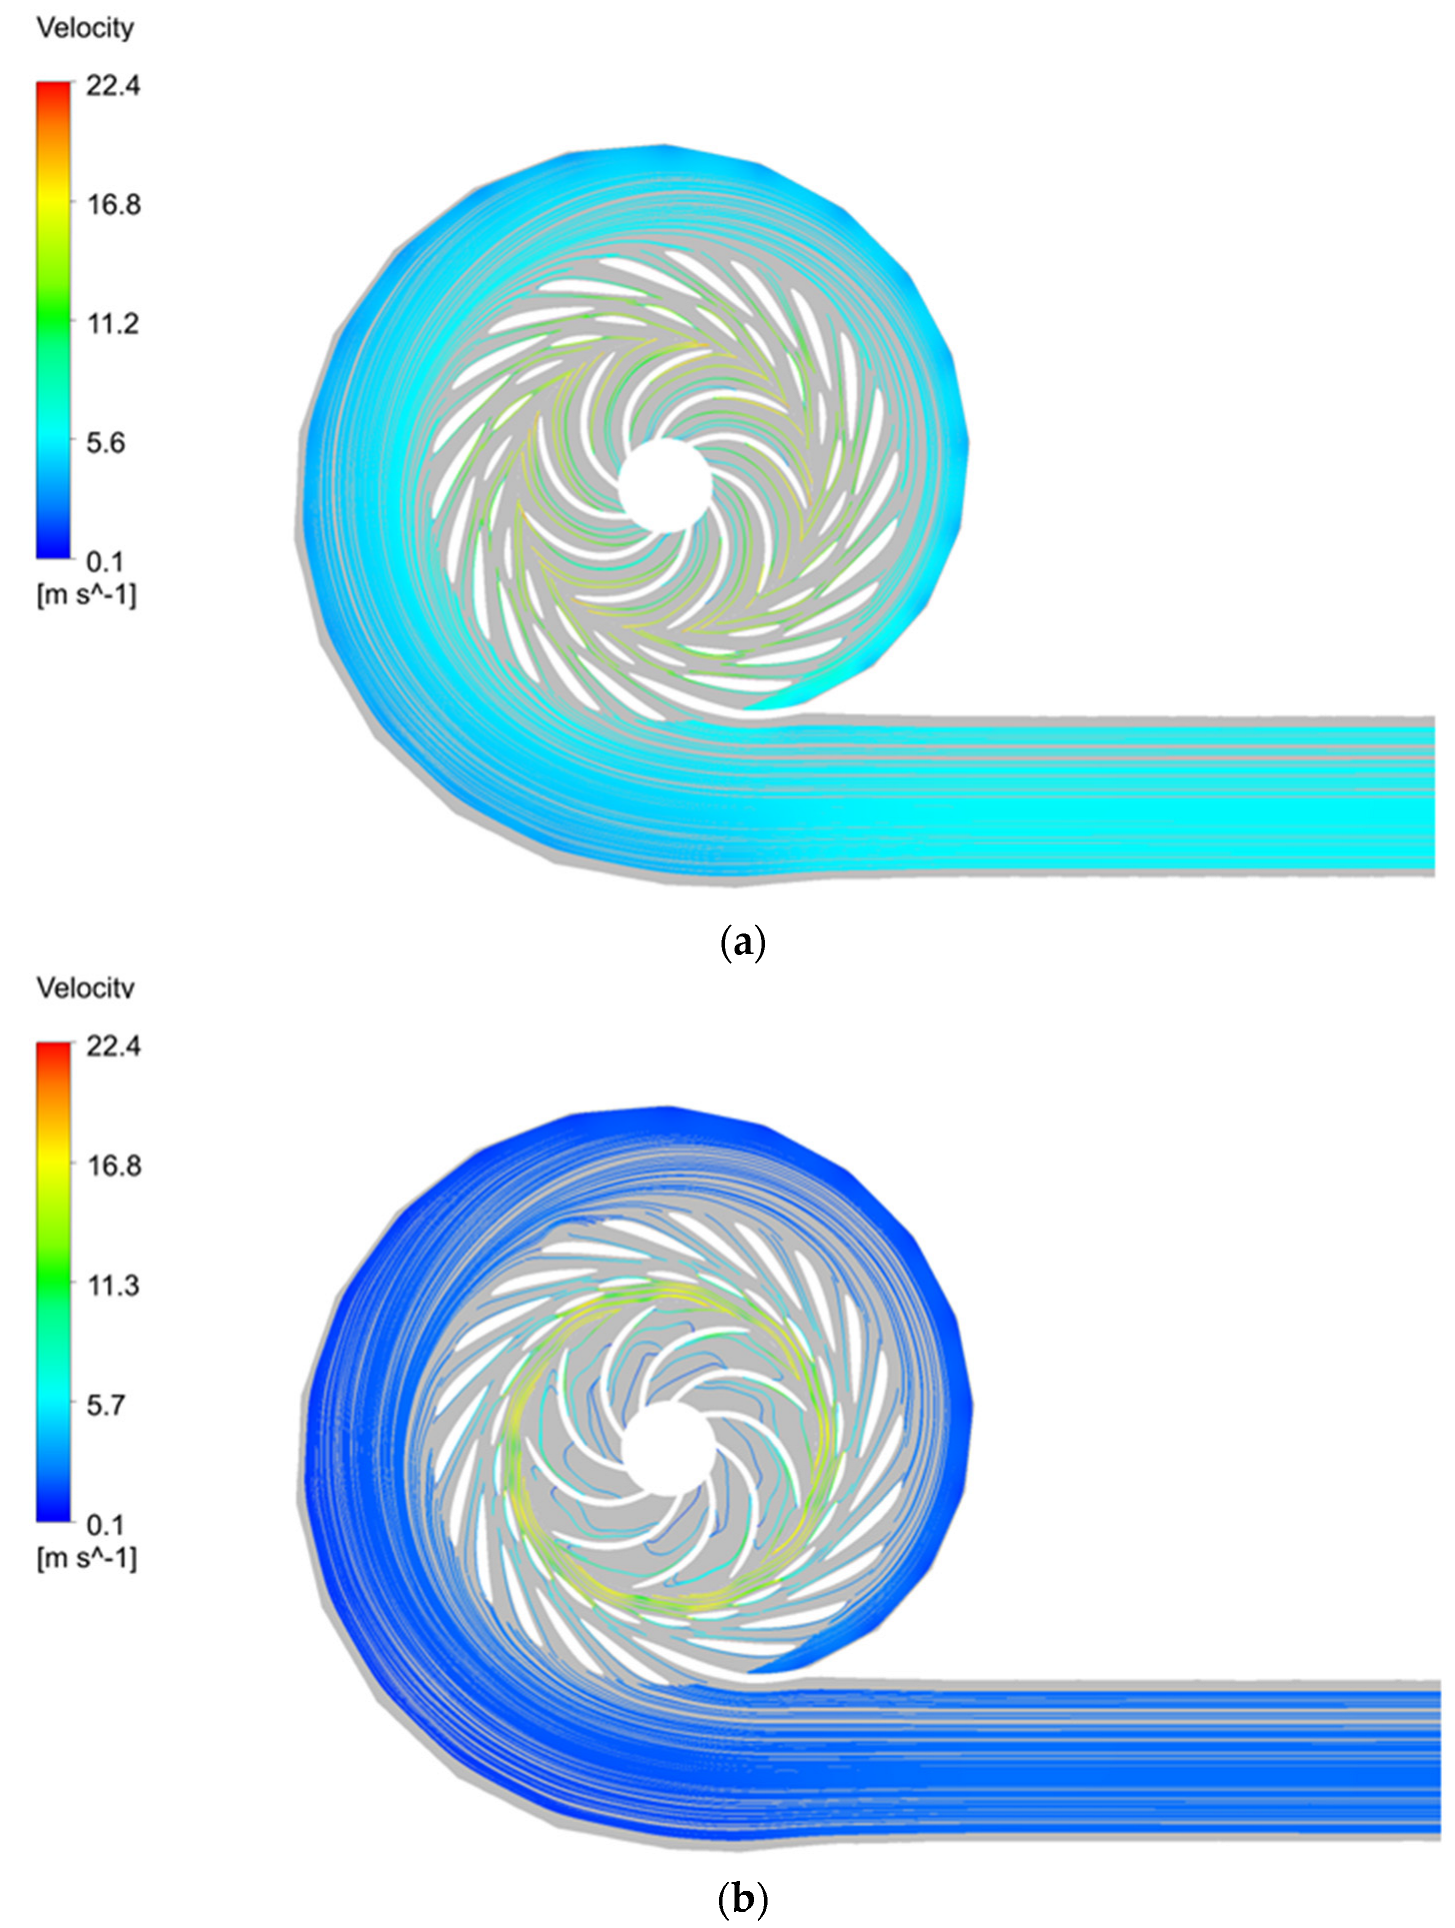
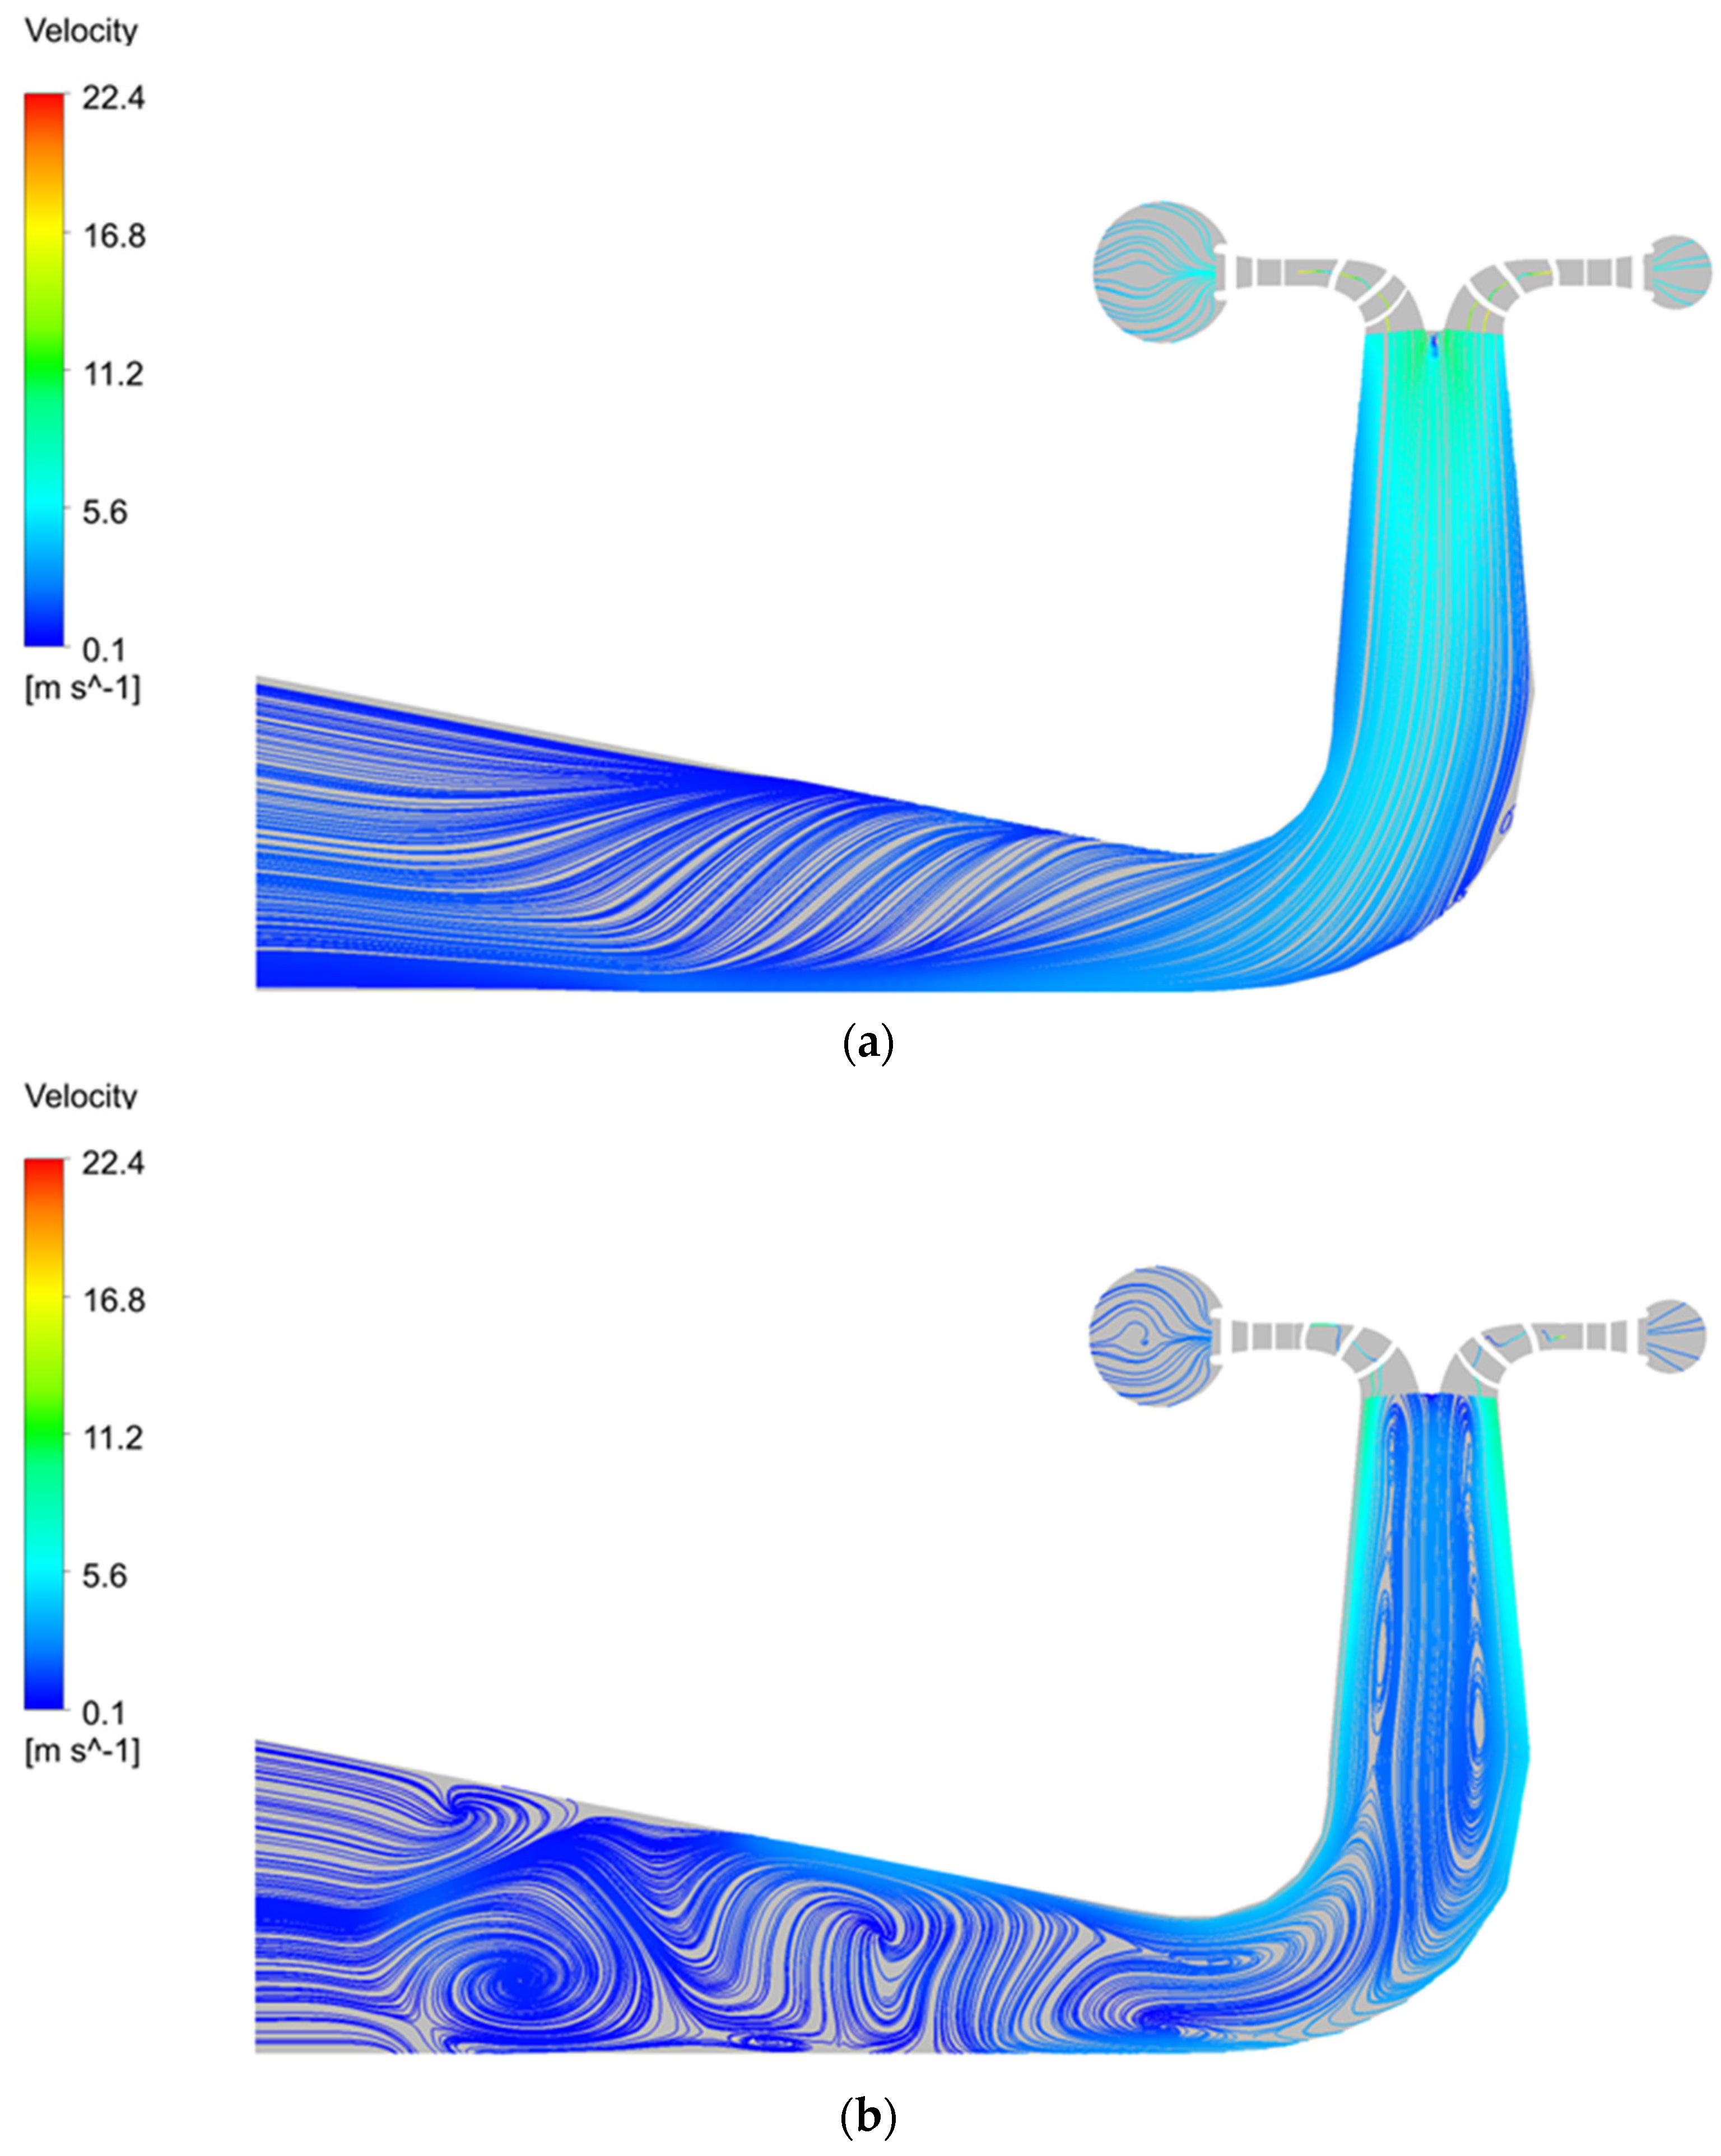
The three-dimensional flow line of the pump turbine is shown in
Figure 13, where the water flow under the 93.3% strong load flowed uniformly from the pump turbine inlet and accelerated into the runner to generate rotational velocity and a distorted change in the uniform flow line, where it then flowed out of the draft tube. The overall three-dimensional velocity flow line was uniformly distributed, with a uniform rotational distribution in the draft tube. However, under the 65.7% weak load, the inlet section of the worm gear was uniformly distributed and the draft tube section showed a haphazard and irregular distribution with the presence of vortices. This corresponded to a strong pressure pulsation under weak load and a weak pressure pulsation under strong load conditions. Under the weak load condition, the overall flow rate of the pump turbine was smaller compared to the strong load conditions.
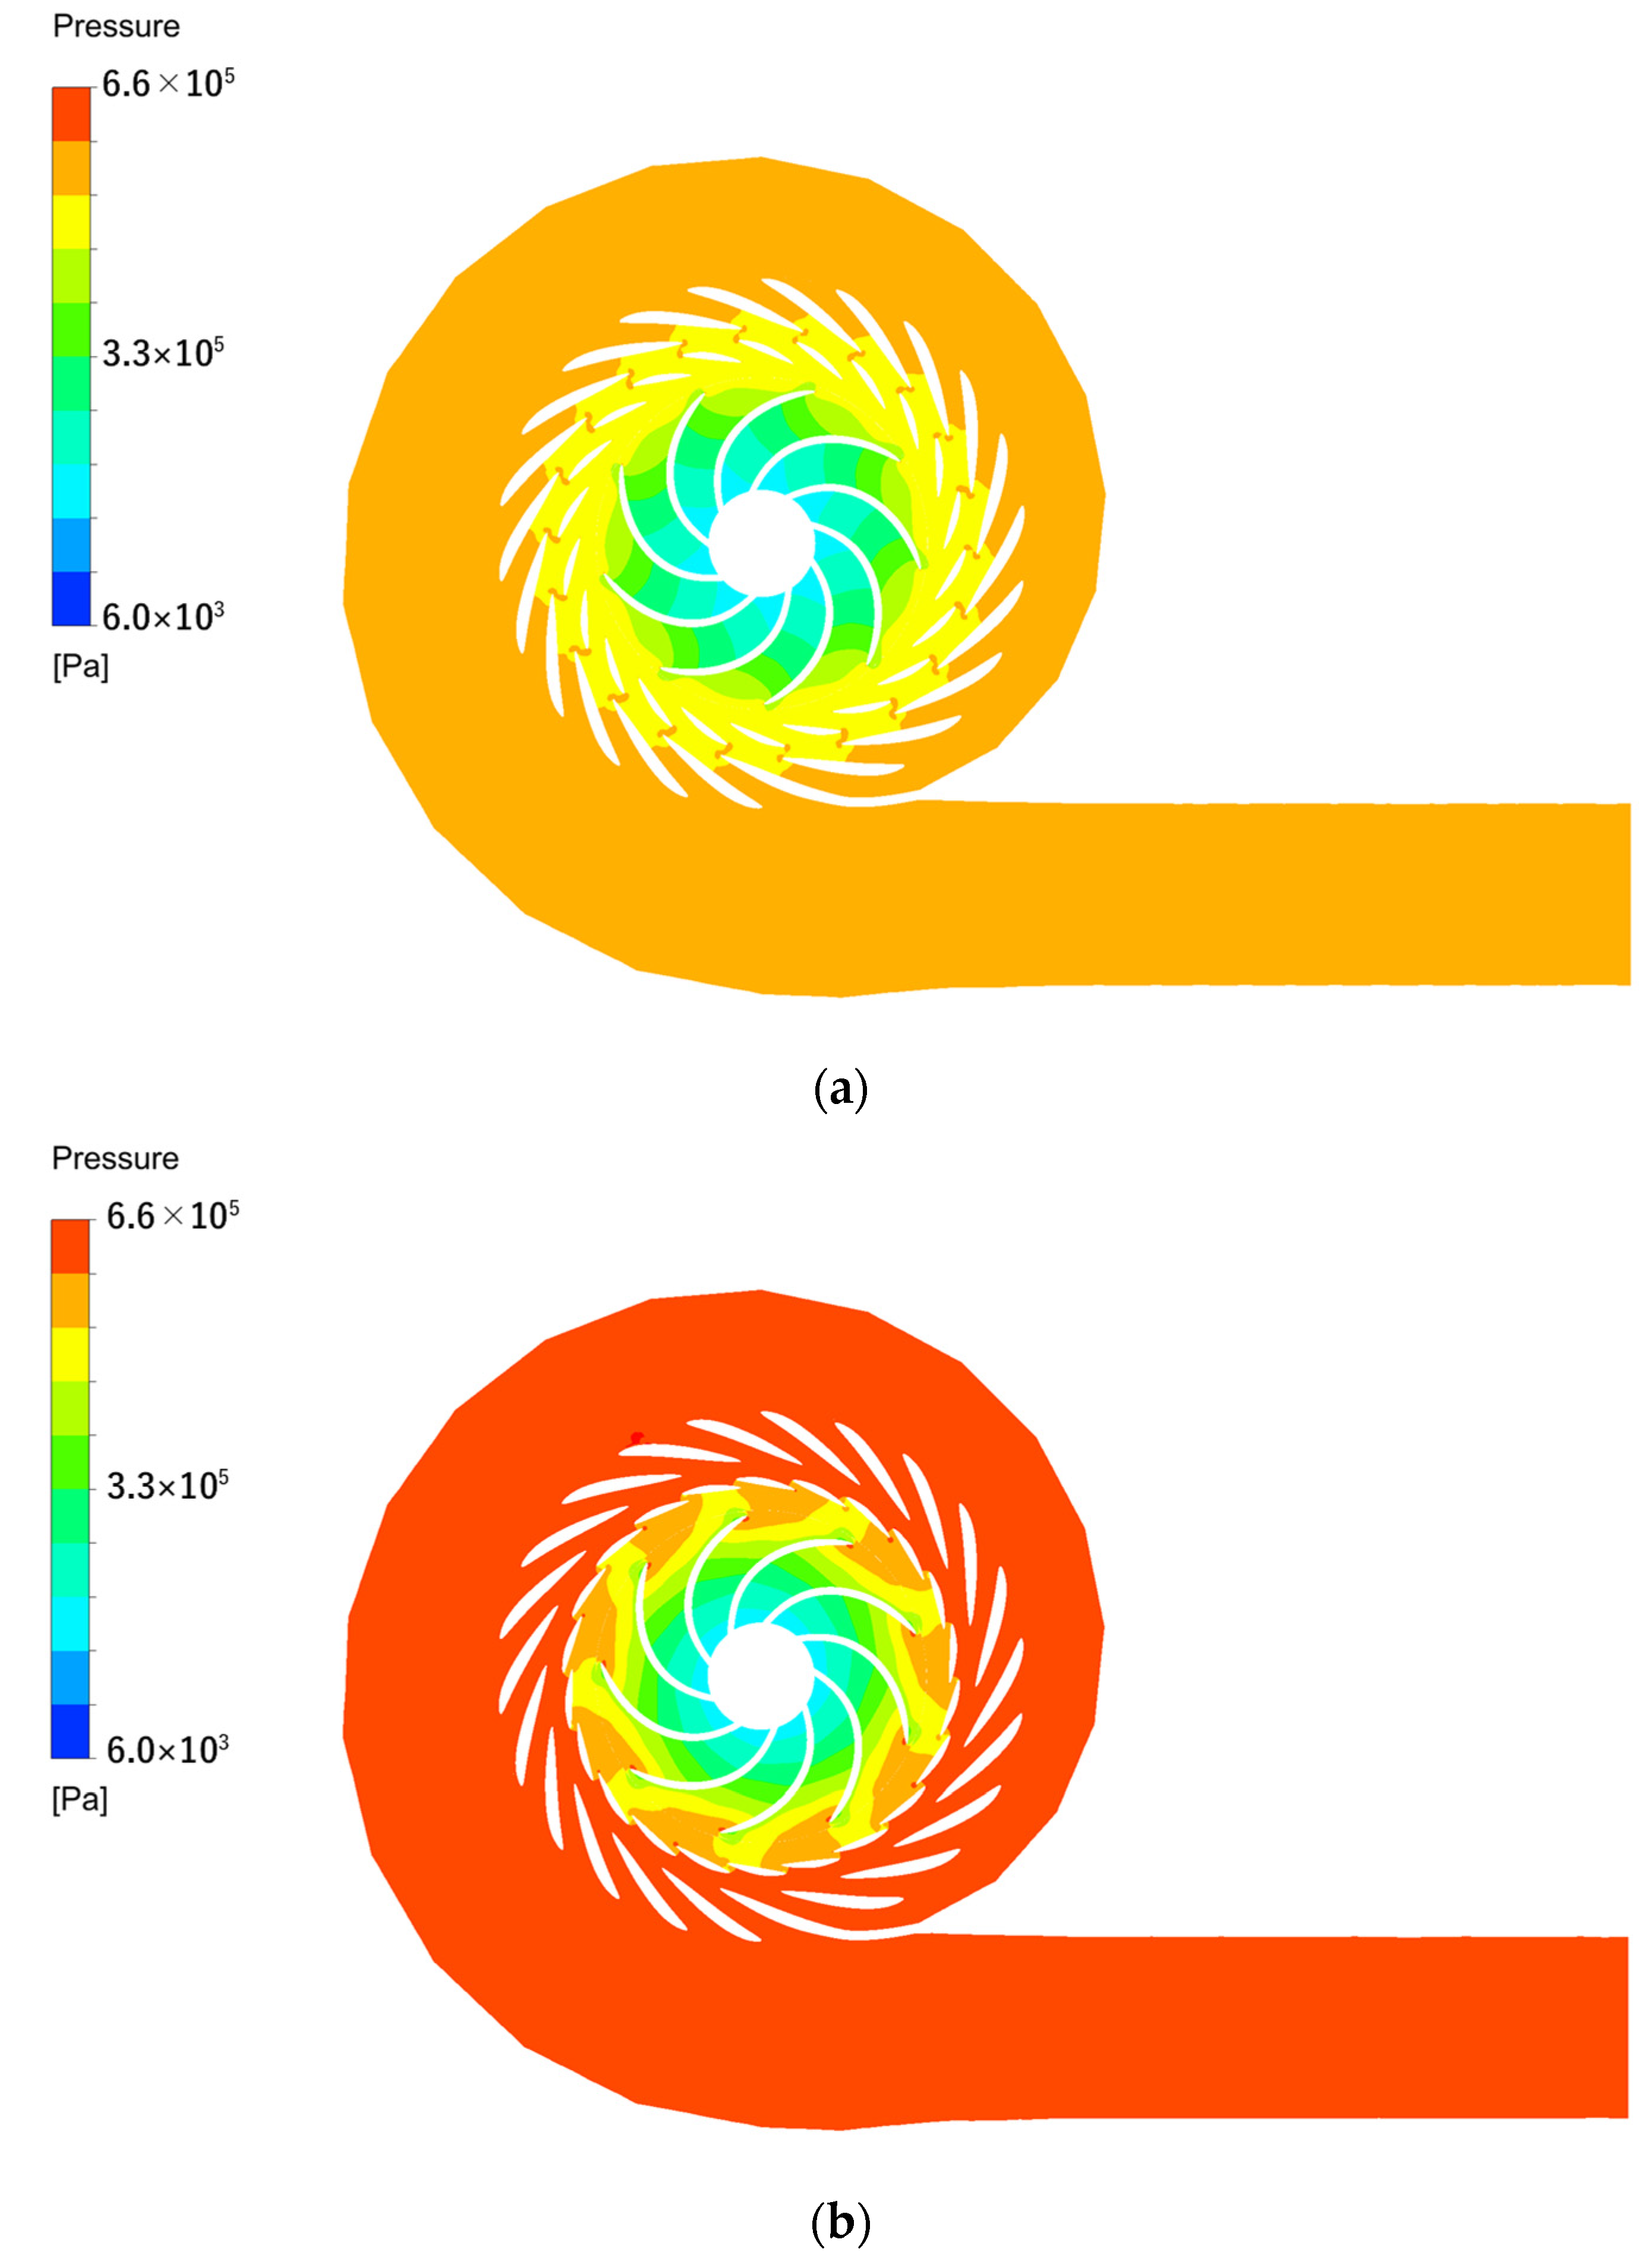
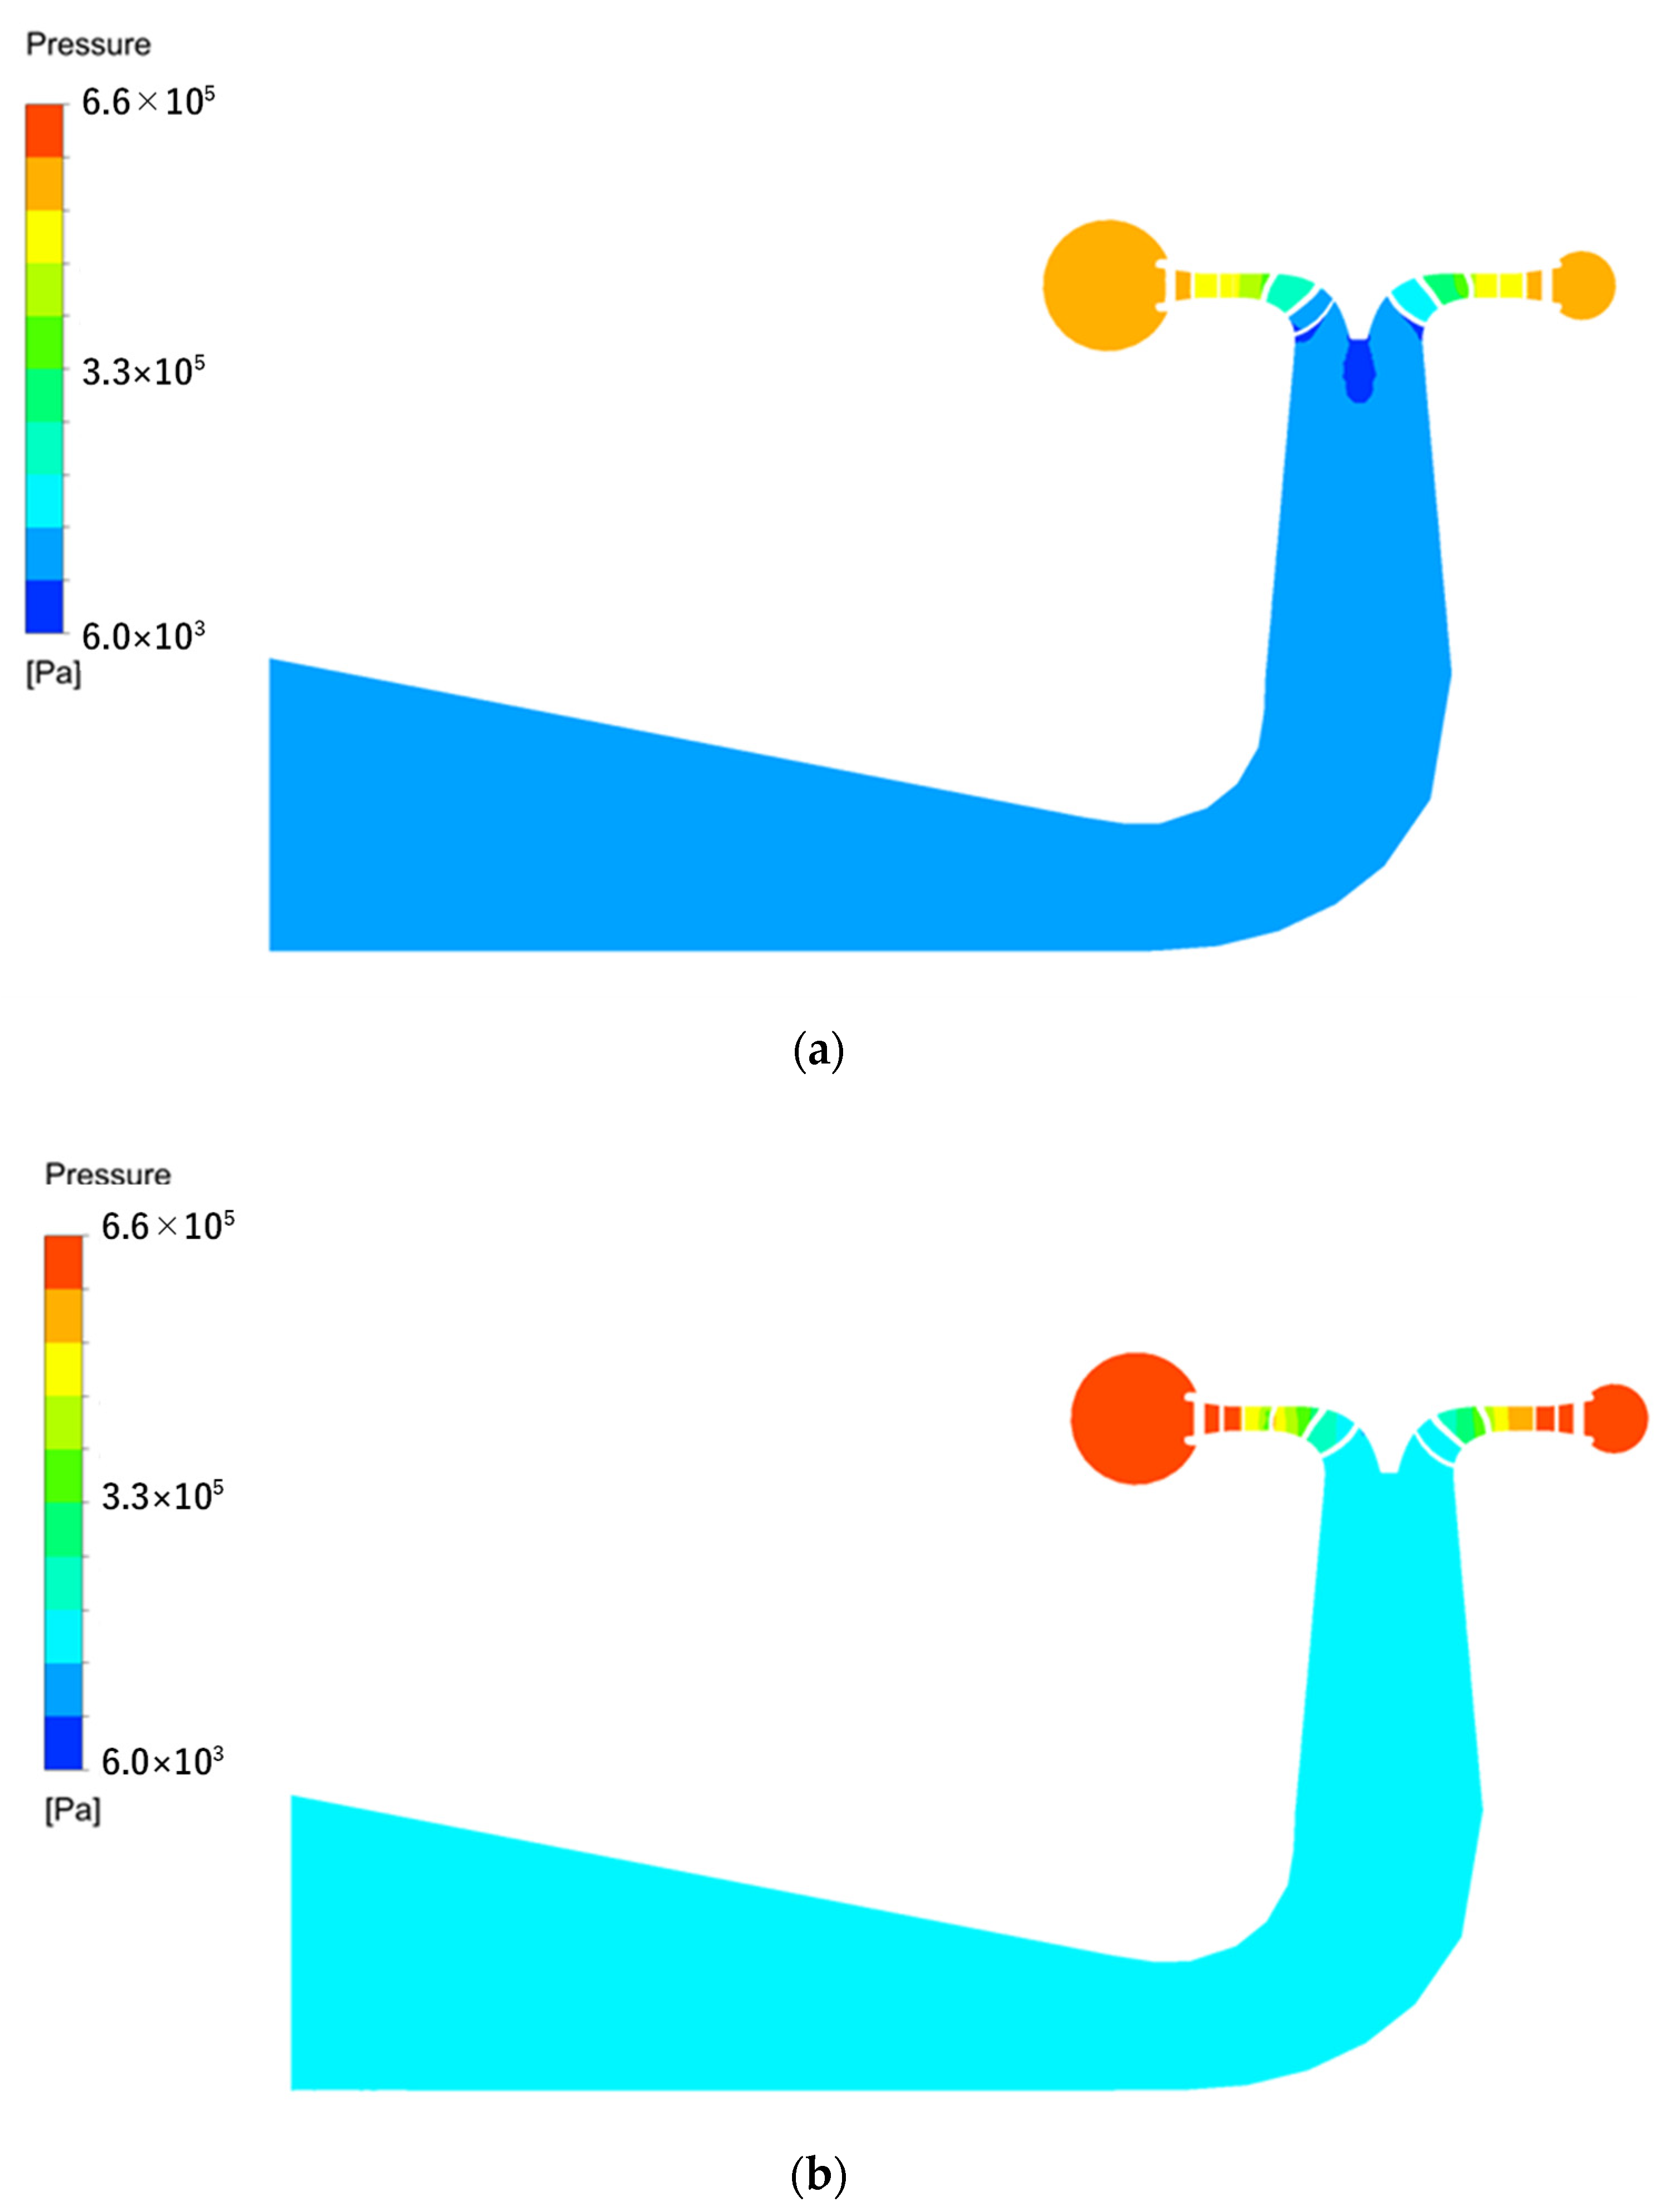
The cross-sectional pressure cloud diagram of the pump turbine is shown in
Figure 14, from which it can be seen that under strong loads, the pump turbine was subjected to less pressure in the runner component, followed by the guide vane section and finally the volute, whereby it gradually built up outwards, with the volute having the highest pressure values. Under weak load conditions, the lowest pressure values were found in the runner, with a clear stratification in the pressure values in the guide vane section, which gradually increased outwards, with the pressure reaching its maximum in the volute section. The pressure values in the guide vane and volute parts were clearly enhanced compared to the strong load conditions.
7. Conclusions
The following conclusions are made from our study of the pressure pulsation fluctuation mechanism of the pump turbine unit for hydro and marine power storage and power generation.
In this paper, the combination of experimental and CFD numerical simulations revealed the pressure pulsation fluctuations at different detection points under 65.7% and 93.3% load conditions; from the comparison of the experimental and CFD simulation results, it was found that the CFD simulation results were more accurate and basically consistent with the experimental results. It was found that under weak load conditions, the pressure pulsation amplitude of the pump turbine unit was relatively high; for example, at the DT03 monitoring point, the pressure pulsation amplitude under weak load conditions was about three times that under the strong load, and the flow line was more complex and accompanied by a vortex, which is related to the variation in the pressure pulsation. In the strong load condition, the pump turbine pressure pulsation was relatively low, and the flowline was more uniform and stable. The pressure pulsation also varied at different monitoring points, with the pressure pulsation occurring between the runner and the guide vane and between the guide vane and the stay vane in the bladeless area being relatively stronger, which we suspect may have been due to the hydrodynamic excitation caused by static and dynamic interference. Secondly, there were also some parts of the draft tube where the pressure pulsation was stronger, as the runner blades gave a circular directional velocity to the water flow, which resulted in a large number of vortices in the draft tube that thus caused pressure pulsations. In summary, our results revealed the pressure pulsation fluctuation mechanism of the pump turbine, which can be used in engineering to reduce the pressure pulsation of the pump turbine, improve the safety and stability of the pump turbine operation, and provide certain guidance ideas.
Translated with
www.DeepL.com (accessed on 10 January 2023)/Translator (free version).


