Article

Experimental and Numerical Analysis of Structural Capacity of Perforated Stiffened Plates

1
Naval Architecture and Marine Engineering Department, Faculty of Engineering, Port Said University, Port Fouad 42526, Egypt
2
Centre for Marine Technology and Ocean Engineering (CENTEC), Instituto Superior Técnico, Universidade de Lisboa, 1049-001 Lisbon, Portugal
*
Author to whom correspondence should be addressed.
J. Mar. Sci. Eng. 2023, 11(4), 842; https://doi.org/10.3390/jmse11040842
Submission received: 11 March 2023 / Revised: 5 April 2023 / Accepted: 13 April 2023 / Published: 16 April 2023

Abstract

:
This study presents experimental and numerical analyses of compressive collapse tests of initially corroded steel-stiffened plates with multiple circular openings, which may be used as tank wash plates. The ultimate load-carrying capacity and the relevant collapse modes are identified. The load-axial/lateral displacement relationships and local strain for each opening degree are analysed with developed regression equations for the ultimate capacity of stiffened plates as a function of different degrees of openings and the resting volume and residual cross-sectional area. A series of finite element analyses are performed. The experimental and numerical results are compared and show the complexity of predicting the ultimate capacity and the collapse mode as the degree of openings increases. The experimental results are compared for aged steel plates, and high-tensile stiffened plates considering the same degrees of openings, showing good agreement.

1. Introduction

The main structural components of ship hull structures are plates, usually stiffened with various stiffeners. Openings or cut-outs are generally for functional purposes, including washing plates and bulkheads; therefore, it is essential to understand the behaviour of such structural components with and without openings to comply with the structural capacity requirements.
For intact plates, several empirical formulations and simplified methods have been developed for evaluating the ultimate strength, such as the work done by Faulkner [1] for the effective width approach and the effect of residual stress. Guedes Soares [2] investigated the contribution of the uncertainties in plate bucking and developed a design equation for specific types of ship plating [3]. Masaoka and Mansour [4] concluded that the aspect ratio has a minor effect, and the plate’s slenderness significantly affects the plate’s ultimate strength.
According to the acting load, different effects on the plates with openings may arise. For compressive loading, Paik [5] studied the ultimate strength of rectangular steel plates numerically with one circular opening. It was demonstrated that the opening significantly affects the ultimate strength, and the plate aspect ratio is not an essential parameter for the ultimate strength of perforated plates. Paik [6] studied the shear strength of supported steel plates with a central circular opening. The effect of opening size and plate geometry was considered. It was stated that the plate aspect ratio affects the shear capacity more than the plate thickness.
Wang et al. [7] conducted comprehensive finite element analyses for steel plates with circular and long circular openings. The results showed that the opening size significantly affects the ultimate strength, and the reduction in the ultimate strength is scattered more than the reduction of the buckling strength due to the complexity of the collapse mode of the plate.
Kumar et al. [8] developed a regression formulation for calculating the ultimate strength of stiffened panels with a central circular opening considering the axial compressive and lateral load. Moen and Schafer [9] developed several expressions for the elastic buckling stress of stiffened and unstiffened plates with single and multiple openings, considering bending and compressive loading.
Saad-Eldeen et al. [10,11] investigated the compressive capacity of steel plates with elongated circular openings and locked cracks. For plates with a central opening with and without locked cracks, it was concluded that by increasing the opening size and the crack length, the resilience decreases linearly, and both dissipated energy and the toughness decrease nonlinearly. Due to increasing the crack length, the plate acts as a column subjected to a compressive axial load flowed by twisting. Considering the effect of multiple damage scenarios, such as the initial imperfection, presence of cracks, level of corrosion degradation and openings, Saad-Eldeen et al. [12] analysed a series of failure modes. They concluded that the locked crack has a lower impact on reducing the ultimate capacity than the initial imperfection, conditional on the fact that the collapse mode is governed by the crack size rather than the imperfection amplitude. Additionally, the reduction in the structural capacity due to the combined effect of such scenarios is not the same as the superposition of each separately.
For high-tensile steel structures, Saad-Eldeen et al. [13] performed several strength tests for stiffened panels with an opening of different geometries. Based on the experimental analyses, locating the opening near the attached stiffeners dramatically decreases the ultimate compressive capacity, and as the buckling stresses increase, the capacity decreases. The collapse shape mode is the same as the initial imperfection for panels with a circular opening and of any shape for panels with an elongated opening. Furthermore, considering both strength and weight saving, the elongated opening is a better design option than the circular one.
Saad-Eldeen et al. [14] compared the structural behaviour of different structural configurations and construction materials. They concluded that as the opening size increases, the resultant plastic strain for structural elements made of mild steel increases at a high rate rather than high tensile steel.
Wash plates are used in marine structures in many forms and may be subjected to different loads and damage scenarios. Saad-Eldeen et al. [15] performed buckling tests for aged steel plates with multiple circular openings, varying the number and degree of opening intensity. It was concluded that the remaining volume of the wash plates better represents the compressive capacity than the residual cross-sectional area. Additionally, the capacity discharge is more sensitive to the lower number of openings than the higher ones with the same degree of openings.
Xu et al. [16] analysed the buckling strength of a submarine with multiple openings subjected to hydrostatic pressure. It was concluded that multiple openings decrease the ultimate strength significantly, but using ring reinforcement enhances the ultimate strength.
Cui and Wang [17] performed both experimental and numerical simulations for stiffened panels with one central opening accounting for different distributions of corrosion pitting damage and subjected to compressive loading. It was observed that the dominant imperfection shape directly affects the ultimate strength of column failure by tripping. It was recommended that the opening is located far from the flange from a strength point of view.
Saad-Eldeen et al. [18] experimentally analysed the compressive strength of high-tensile steel-stiffened plates with multiple openings and developed a failure assessment diagram. Additionally, a regression expression has been developed for predicting the ultimate axial capacity for stiffened plates with symmetrically oriented multiple openings as a function of the resting volume.
Zhao et al. [19] conducted experimental and numerical analysis for steel plates of different plating thicknesses, opening positions and opening shapes. It was stated that the location for which the ultimate strength is the lowest is near the centre of the plate. For different opening shapes, it was concluded that the effect of a rectangular opening shape on the strength is lower than the circular one in the same area. Additionally, the initial imperfection remarkably affects the shear capacity for thinner plates than thicker ones.
Xu et al. [20] investigated the ultimate strength of perforated stiffened panels subjected to compressive loading. The experimental analysis showed the initial twisting of the plating affecting the ultimate strength in the opening case rather than the intact one.
Liu et al. [21] studied the behaviour of H-shaped aluminium alloy members with openings for other construction materials. It was concluded that the ratio between member length and slenderness ratio is a governing parameter in collapse criteria. For short specimens, the opening dimensions affect the bearing load capacity rather than the long member. Additionally, different opening ratios are stated with their contribution to reducing the bearing capacity.
The perforated structural components may be analysed considering different loading conditions, such as the work done in [22]. It was stated that resultant deflection increases as the degree of perforation increases, and the central openings significantly affect the central deformation of the plate. Bellezi et al. [23] investigated the sloshing effect inside a box-shaped tank with a swash bulkhead. Different opening ratios as filling levels were considered. It was concluded that the submerged opening ratio affects the sloshing, despite the structural configuration and arrangement of the openings.
The present study continues the work performed in [15,18]. Initially, corroded steel-stiffened plates with circular openings subjected to compressive loads are experimentally and numerically analysed, accounting for plate openings with an intact stiffener. We identified the best arrangement and configurations of the openings from the structural capacity point of a few. Additionally, the effects of material properties, residual plate slenderness, resting volume and residual cross-sectional area are highlighted, and the more representative parameter of the structural capacity is indicated. The newly tested specimens are compared with the existing results of the same configurations and regression equations developed with an established confidence level for unstiffened/stiffened steel plates with openings of different steel grades that can be directly used to design swash steel structures under uniaxial compressive loading.

2. Experimental Compressive Test

The ultimate compressive capacity of multi-circular opening perforated stiffened plates of ordinary shipbuilding steel is evaluated experimentally considering uniaxial compressive load. The effect of lateral pressure, which may result from the acting fluid inside the tank ballast boundaries, is not considered and may be analysed in future analyses.

2.1. Specimen Geometries

The geometrical configurations of the tested stiffened plates are given in Table 1, with a length and breadth of 300 mm and 150 mm, respectively, average plating and stiffener thickness of 4 mm, and stiffener height of 20 mm. The tested specimens’ structural configuration, part of a scaled model box girder, maintains first-order similarity with fundamental structures [24]. The multiple openings in the plate with an intact stiffener are introduced considering the degrees of openings concept DoO defined by:
D o O = 1 A P i = 1 n A o p e n 100 %
where AP is the total surface area of the plating, n is the number of openings, and Aopen is the surface area of the ith opening. Three DoOs are analysed—16.8%, 28.3%, and 42.9%—of the total surface area of the plate, which are the same as the ones analysed in [15,18], to have a good relationship in the comparison. Each DoO is introduced by a different number of circular openings with an opening radius r, keeping the stiffener intact, as seen in Table 1 and Figure 1.
The initial imperfection of each stiffened plate is examined before the collapse test, showing that all specimens have symmetric initial imperfection shapes, as presented in Figure 1, with different initial imperfection amplitudes, w o , which may result from welding. The descriptive characteristics of the initial imperfection, including the amplitude and direction for each specimen, are given in Table 1.

2.2. Mechanical Properties

The analysed specimens were part of an initially corroded box girder tested to four points’ bending moments in [25], made of regular shipbuilding steel with yield stress 235 MPa, tensile strength 400 MPa, total uniform elongation of about 22%, and Young modulus of 206 MPa. A series of coupons of different corroded plate thicknesses of the same box girder was tested in [26] under uniaxial tensile loading. The degree of degradation D o D for the current specimens is identified as:
D o D = V 0 V c V 0
where V0 is the intact volume of specimens and Vc is the volume of the corroded specimens, resulting in a DoD of 11.11% for the newly tested specimens. According to [26], the mechanical properties of the analysed corroded samples are given in Table 2.

2.3. Test Set-Up

The testing rig comprises a universal testing machine with a loading capacity of 250 kN. As presented in Figure 2, additional instruments such as mechanical displacement and strain gauges are attached to the specimens to measure the lateral displacement and local strain during loading. The displacement gauge is located at the centre of the specimen to measure the lateral displacement. Supporting clamps are constructed at both short edges (the lower and upper) of the stiffened plates, as shown in Figure 2, which impose boundary conditions such that the lateral displacement and rotation are prevented within a 20 mm depth of the clamp. The two long edges are free. The compressive tests have been performed in one loading cycle with a load rate control of 0.5 kN/s.

3. Experimental Results

The results presented are for 11 stiffened plate specimens, categorised as the intact condition (no openings) SP-NS1-4, and three degrees of openings 16.8% (three specimens), 28.3% (five specimens) and 42.9% (2 specimens) as described in Table 1.

3.1. Intact Specimen

The experimental output represented by the shortening and lateral displacement corresponds to the applied compressive load, shown in Figure 3, with an ultimate compressive capacity of 156.86 kN and developed shortening displacement of 1.36 mm. As seen from Figure 3b, as the load increases, the specimen tends to deform upward (in the direction of the stiffener), with a positive lateral displacement of 2.23 mm at the point of the ultimate load. It is clear from Figure 3a that from the beginning of loading up to 35.5 kN, the local strain is almost constant, and after that, the plate-registered positive strain increases as the load increases.
This initial response is due to the almost flat plating (zero initial imperfection; Table 1), which takes time to accommodate the initial upward deformation. After that, the specimen undergoes large upward symmetric deformation, as presented in Figure 4a, supported by a significant positive strain in Figure 3c. The final deformation shape is symmetric of the plate-induced failure, without fracture of the stiffener, as occurred for the same structural configuration of the high-tensile stiffened plate tested in [18]; see Figure 4b,c.

3.2. Perforated Specimens

The results here deal with initially corroded stiffened plates of the same plating and stiffener geometry, with multi-circular openings forming three sets of DoO.

3.2.1. Set 1, DoO = 16.8%

In this set, the results of three specimens, SP-NS2-3, SP-NS3-4, and SP-NS4-2, are presented, where the three specimens are of the same DoO, represented by a different number of circular openings—24, 8, and 4—respectively, as can be seen in Figure 1. The descriptive results of the structural response for each specimen as a relationship between the applied force, shortening, lateral displacement and local strain are presented in Figure 5 and the collapse modes are shown in Figure 6.
Figure 5a shows that the ultimate compressive capacity decreases significantly for a specimen with eight openings (SP-NS3-4) by 63.54% concerning the intact specimen. Additionally, the developed shortening displacement for such a specimen is the lowest of 0.96 mm compared to other specimens, including the intact one. The weak behaviour of SP-NS3-4 may be explained by the higher downward initial imperfection of 8 mm, followed by lateral displacement in the same direction of 2.12 mm at ultimate load, and increases as the applied load increases (Figure 5b). This response is confirmed by symmetric downward post-collapse mode, as presented in Figure 6c, with local tripping of the stiffener at the central region, which reduces the stiffened plate capacity. The failure mode for specimen SP-NS3-4 may be represented as stiffener-induced failure accompanied by stiffener tripping.
For the other two specimens, SP-NS2-3 and SP-NS4-2, the ultimate capacity is less than the intact one by 41.73% and 45.00%, respectively. The better capacity of these two specimens than SP-NS3-4 is due to the lower imperfection amplitude of 2 mm downward and zero, respectively, in addition to the developed asymmetric upward post-collapse shapes, as seen in Figure 6a,c. It can be seen that despite the 2 mm downward initial imperfection of specimen SP-NS2-3, which may facilitate the occurrence of buckling, the strain gauge located at the mid-span shows positive strain and increases as the load increases, as seen in Figure 5c.
Additionally, the displacement gauge confirms the exact behaviour of changing the buckling mode from an initial downward 2 mm amplitude to the final upward 0.36 mm amplitude at the ultimate load, as seen in Figure 5b. This change provides more resistance to the applied load, resulting in less capacity discharge than the other specimens, SP-NS3-4 and SP-NS4-2. Therefore, for this set of openings, where the number of openings is eight and for the higher downward initial imperfection, in addition to the final symmetric collapse with the stiffener tripping, the worst capacity is observed for DoO = 16.8%, and the best capacity is registered for specimen SP-NS4-2 of 24 openings.

3.2.2. Set 2, DoO = 28.3%

This set comprises five specimens: two have the same openings (n = 24: SP-NS5-2 and SP-NS5-3) but with different downward initial imperfection amplitudes (2 and 7 mm, respectively). Three specimens with varying numbers of openings were n = 8 (SP-NS6-2), n = 4 (SP-NS7-2) and n = 6 (SP-NS8-1).
For the first two specimens with n = 24, SP-NS5-2 and SP-NS5-3, the ultimate capacity is lower than the intact one by 47.61% and 58.62%, respectively. As seen in Figure 7a, the slope of both specimens is the same in the linear sector, but the ultimate capacity is different. The reason for such a lower capacity of SP-NS5-3 is the higher downward initial imperfection of 7 mm, followed by the downward post-collapse mode demonstrated by a negative lateral displacement of 1.73 mm at the ultimate load, as presented in Figure 7b, followed by the local tripping of the stiffener near the central part, as shown in Figure 8c. For the other specimen, SP-NS5-2, the strength capacity is higher than SP-NS5-3 due to the lesser downward initial imperfection of 2 mm and the asymmetric upward post-collapse deformed shape confirmed by positive lateral displacement, as can be seen in Figure 7b and Figure 8a. Therefore, for the same DoO of 28.3% and several openings, n = 24, the capacity controlling parameter is the initial imperfection amplitude and the corresponding collapse mode.
It may be concluded that if the post-collapse mode follows the initial imperfection shape, the strength capacity will be the lowest. Additionally, the probability of occurrence for stiffener tripping is higher if the amplitude of the initial downward imperfection is severe. This observation agreed with the work done in [18] for high-tensile stiffened plates with multiple circular openings. Considering DoO = 28.30%, characterised by a different number of openings as well as opening distributions, the results of three specimens—n = 8 (SP-NS6-2), n = 4 (SP-NS7-2) and n = 6 (SP-NS8-1)—are shown in Figure 7. The lower capacity of 59.19 kN is registered for the specimen SP-NS7-2 of four openings. The main reason for such capacity is the downward initial imperfection amplitude of 2 mm and the post-collapse deformed shape (Figure 9b). It is visible that there are two locations of plastic hinges located in the middle of the residual breadth of the frontier openings, forming an asymmetric deformation shape with shifted peak far from the centre, followed by lower central lateral displacement. On the other hand, the higher capacity is related to SP-NS6-2 of 8 openings and zero initial imperfection, for which the collapse mode is asymmetric with almost the same vertical displacement and local strain at the mid-span as the intact one (Figure 7c and Figure 9a).
For DoO = 28.30% and the same initial imperfection direction and amplitude 2 mm (SP-NS5-2, SP-NS7-2), the lower capacity may relate to the smaller cross-sectional area (lower number of openings, bigger radius), which facilitates the occurrence of plastic hinges.
The last specimen in this set, SP-NS8-1, is different from the opening’s distribution point of view, where two openings of the six are located precisely at the mid-length of the specimen, as illustrated in Figure 1. In contrast, the openings are distributed away from the mid-length for the rest of the specimens. It is apparent from the load-shortening curve in Figure 7 that the slope of SP-NS8-1 is less than all specimens with and without openings, indicating less stiffness in the pre-buckling and buckling zones. Comparing the global response of SP-NS8-1 (n = 6) with specimen SP-NS6-2 (n = 4) of the same initial imperfection, it may be noted that SP-NS8-1 registered capacity of 63.69 kN, which is less than the 76.87 kN of SP-NS6-2.
However, SP-NS8-1 also developed a higher central lateral displacement of 3.01 mm and considerable local strain at ultimate load compared to other specimens, as evident from Figure 7b. The 9.40% difference between the two capacities concerning the intact one may arise from the smaller cross-sectional area due to the lower residual breadth of SP-NS8-1 at the central region. Additionally, the opening at the mid-length facilitates symmetric post-collapse deformation at the centre of the specimen (Figure 9c). Therefore, from a design point of view, it may be stated that it is better to locate the opening away from the central portion because its presence in such a location has a negative impact on the ultimate capacity of stiffened plates.

3.2.3. Set 3, DoO = 42.90%

The last set for DoO is 42.90%, composed of two specimens, one with several openings n = 24 (SP-NS9-3) and 8 mm initial imperfection, whereas the specimen (SP-NS10-3) with several openings (n = 8) and zero initial imperfection.
For the first specimen, SP-NS9-3 (n = 24), the reduction of the ultimate capacity concerning the intact one is 64.41%, with a higher developed vertical displacement of 1.75 mm than the intact one, as may be seen in Figure 10a. On the contrary, the registered lateral displacement corresponds to the ultimate capacity of 1.84 mm, lower than the intact one (Figure 10b). The reason for this lesser central lateral displacement is the change of the 8 mm downward initial imperfection direction to the upward collapse mode of asymmetric shape, which results in shifting the peak of the lateral displacement away from the central portion, as presented in Figure 11a, as well as twisting of the residual plating strip between the openings near the attached stiffener.
Specimen SP-NS10-3, the reduction concerning the intact one is 63.85%, followed by an asymmetrical upward deformed shape (Figure 11b). It may be noted that the decrease in the structural capacity for both specimens is somewhat close, regardless of the different number of openings. The reason for that is the higher initial imperfection of specimen SP-NS9-3, which affects the global response, considering the registered upward deformation for both specimens, represented by positive lateral displacement and local strain.

4. Numerical Modelling and Results

The experimentally tested specimens are analysed numerically using the nonlinear finite element commercial code ANSYS [27]. The finite element analysis utilises the full Newton–Raphson equilibrium iteration scheme with considerable strain. The automatic time stepping is activated to determine the appropriate load steps. The perforated stiffened plates are modelled using shell element 181 with four nodes and six degrees of freedom suitable for thin structures. The material stress–strain curve is implemented based on the mechanical properties defined in Table 2. The boundary conditions are modelled like the experiment with uniaxial compressive load at the short edge. The plate’s initial imperfections are implemented without additional stresses and modelled by changing the nodes’ location in the lateral direction with imperfection amplitude for each specimen, as shown in Table 1. The appropriate element size for the current analyses is 5 mm based on the performed studies in [28] for wash plates, with free meshing and quadrilateral elements to adopt the opening shape, which results in the number of finite elements being 1838 (n = 4) and 2053 (n = 24) for DoO = 16.80%. A comparison between the experimental results and the numerical ones, such as the load shortening curve and the deformed shape at the ultimate load step, is presented in
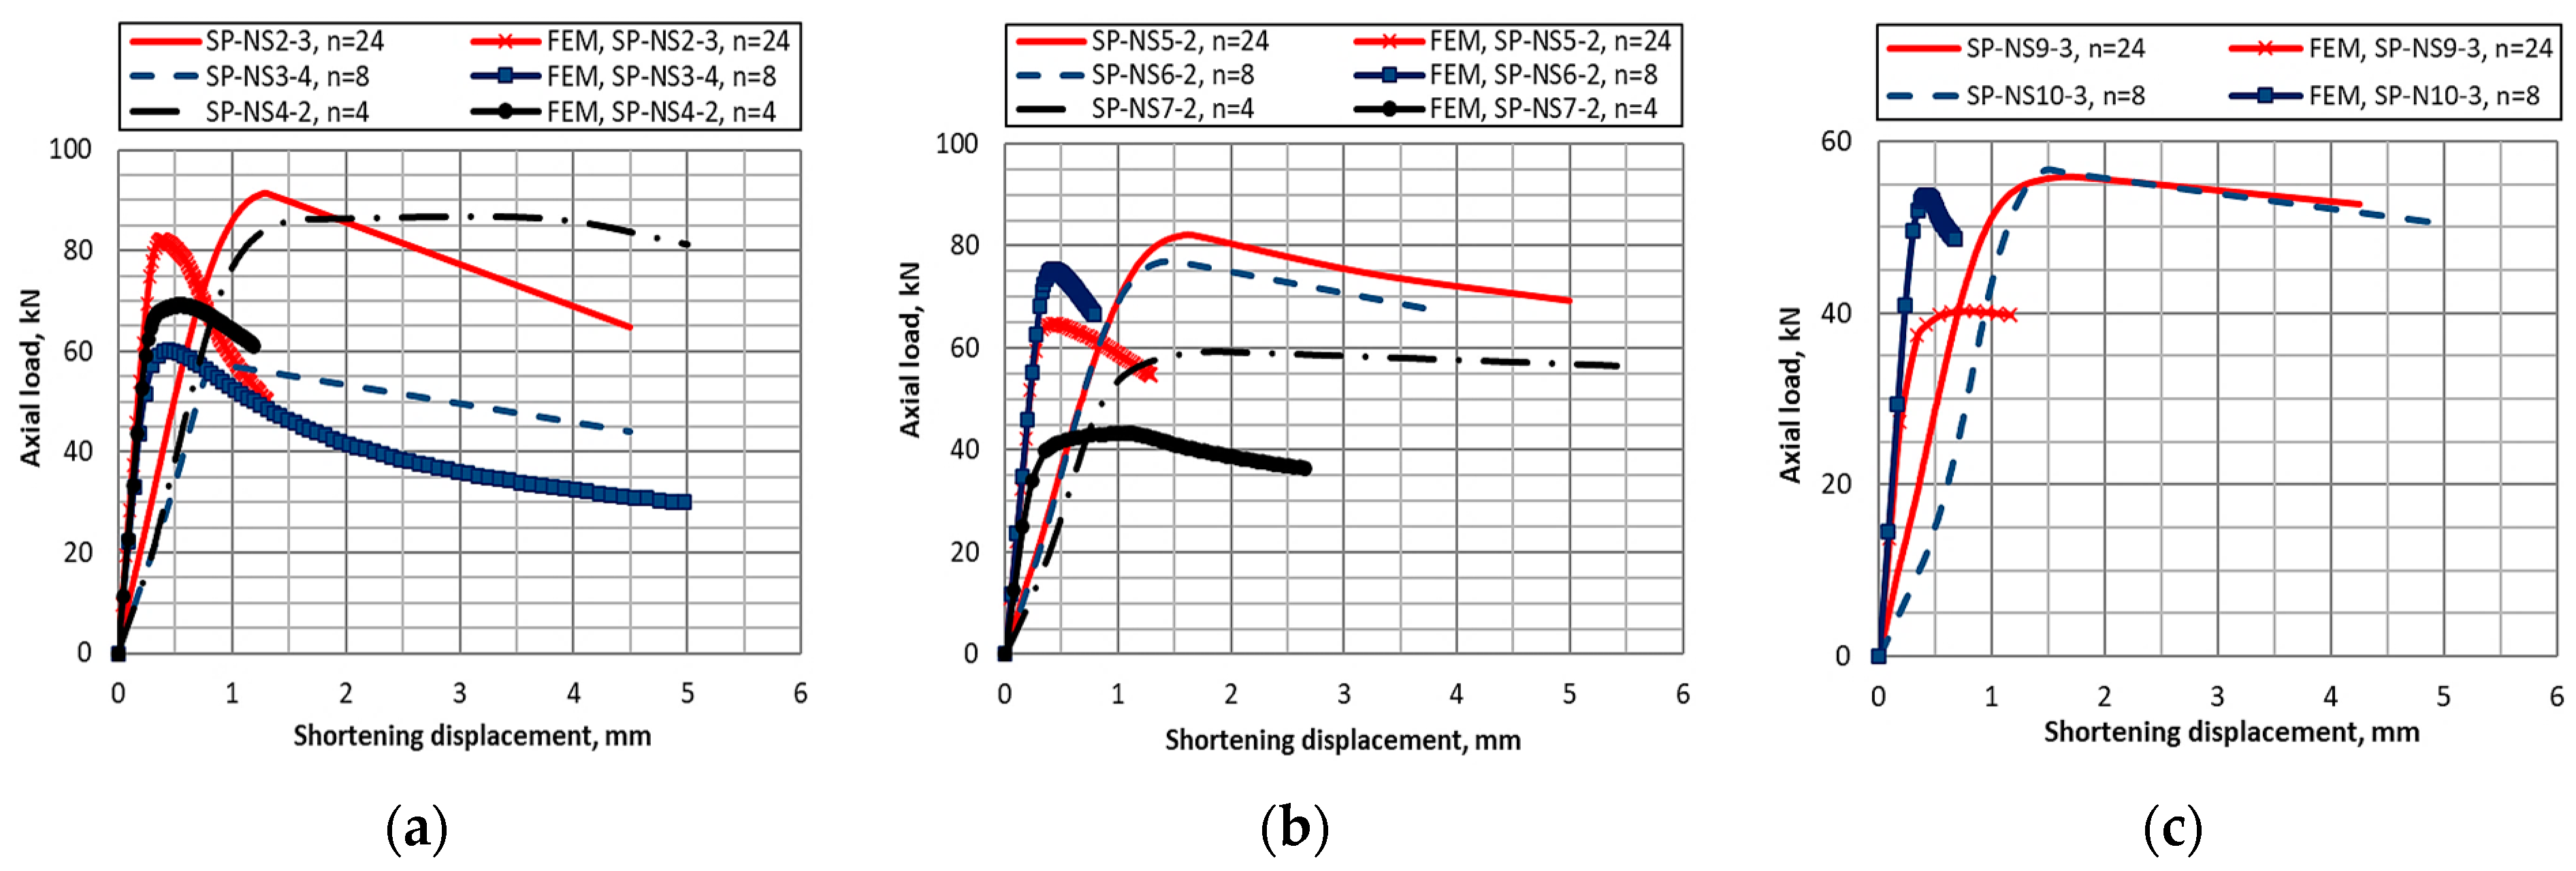
 Figure 12.
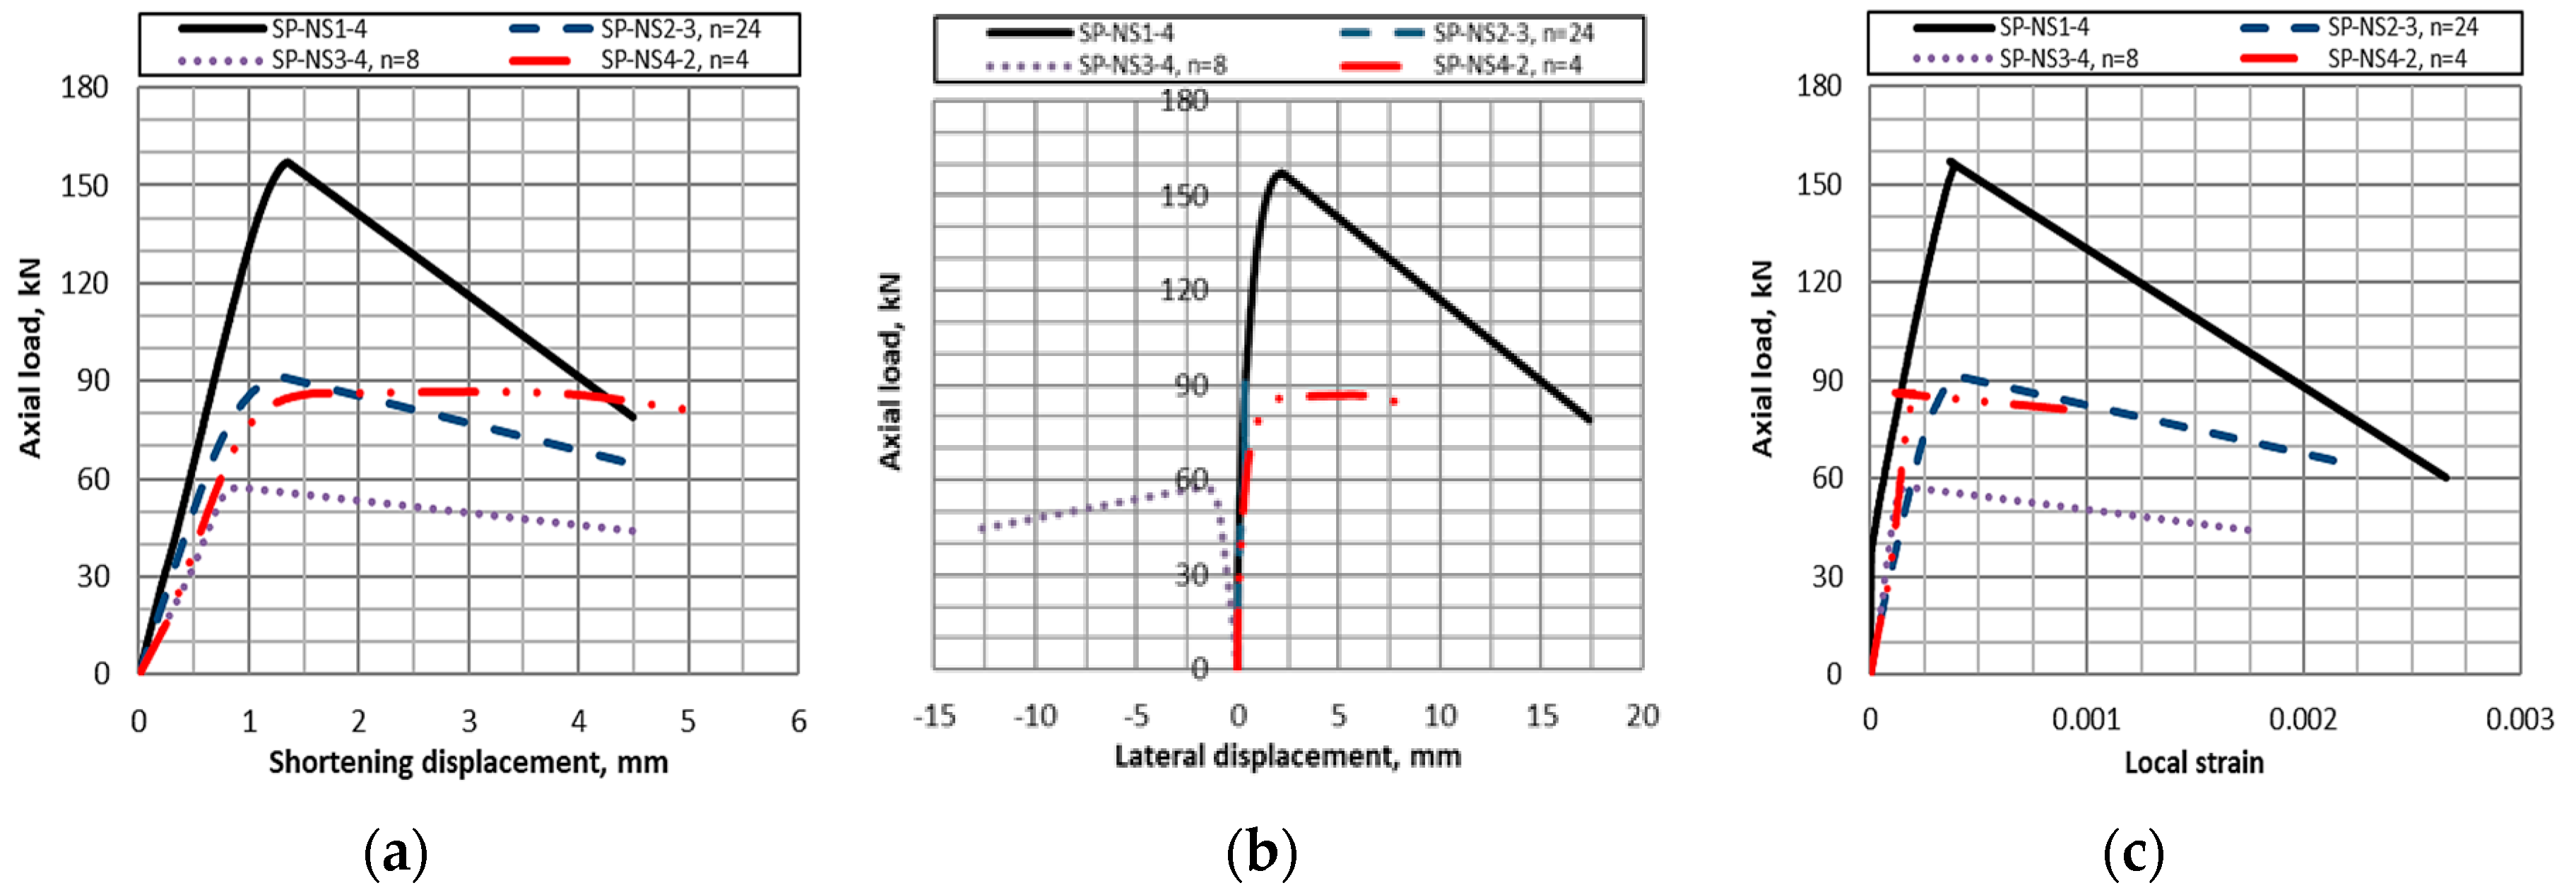
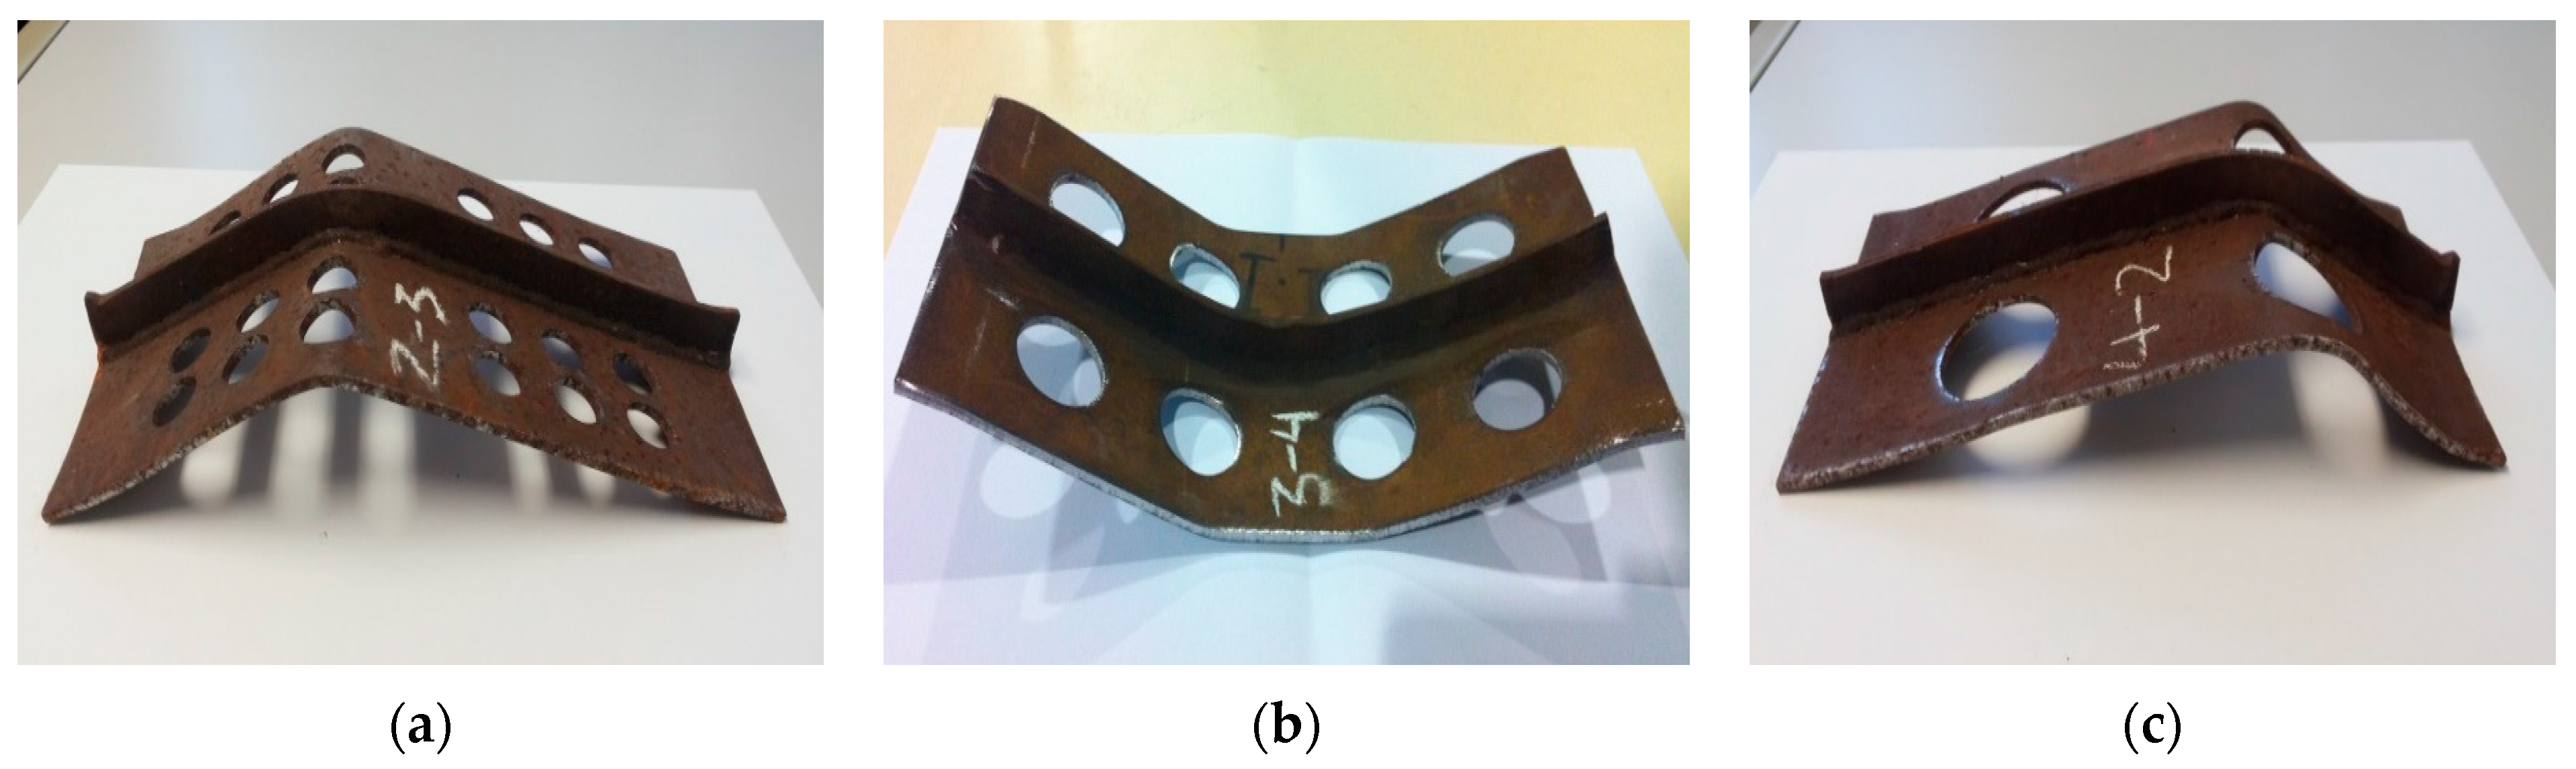
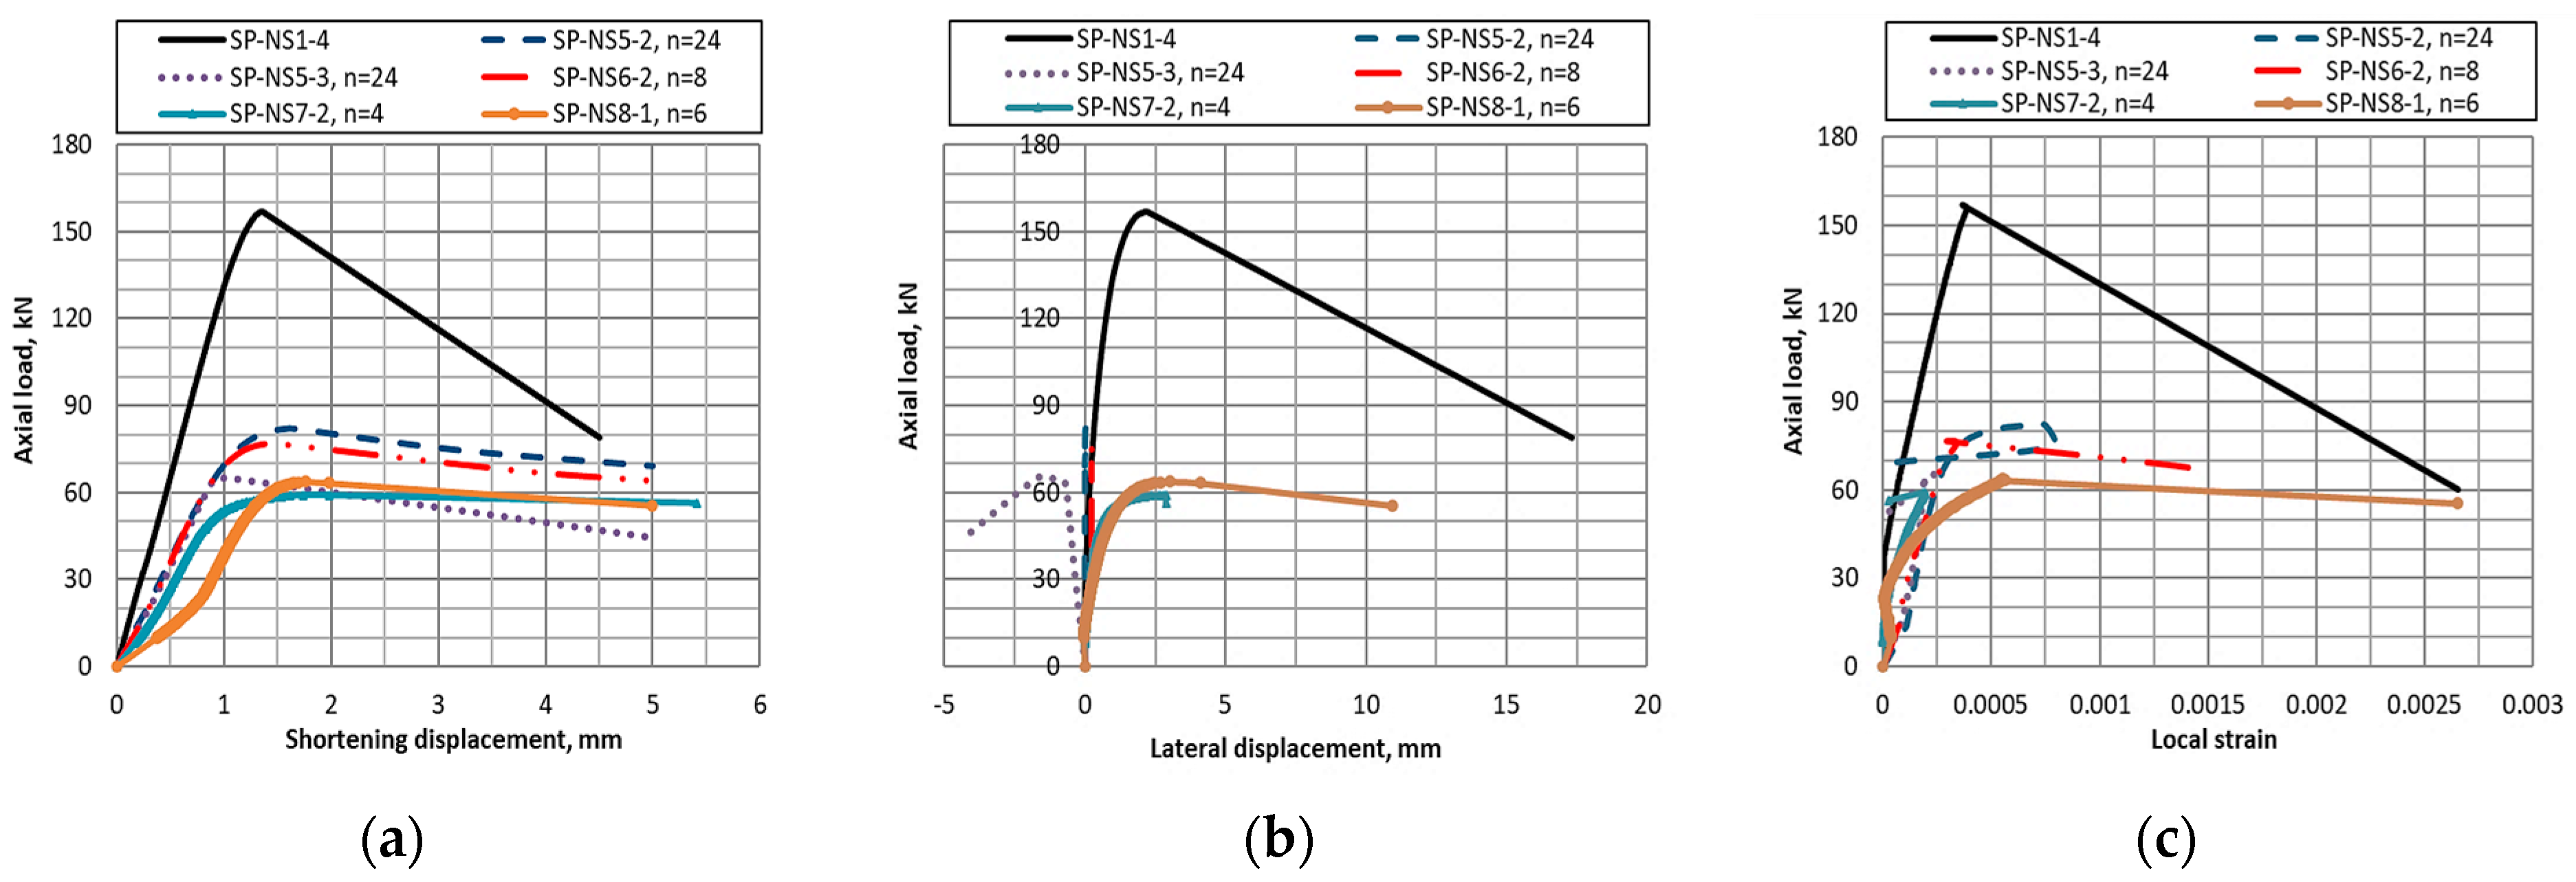
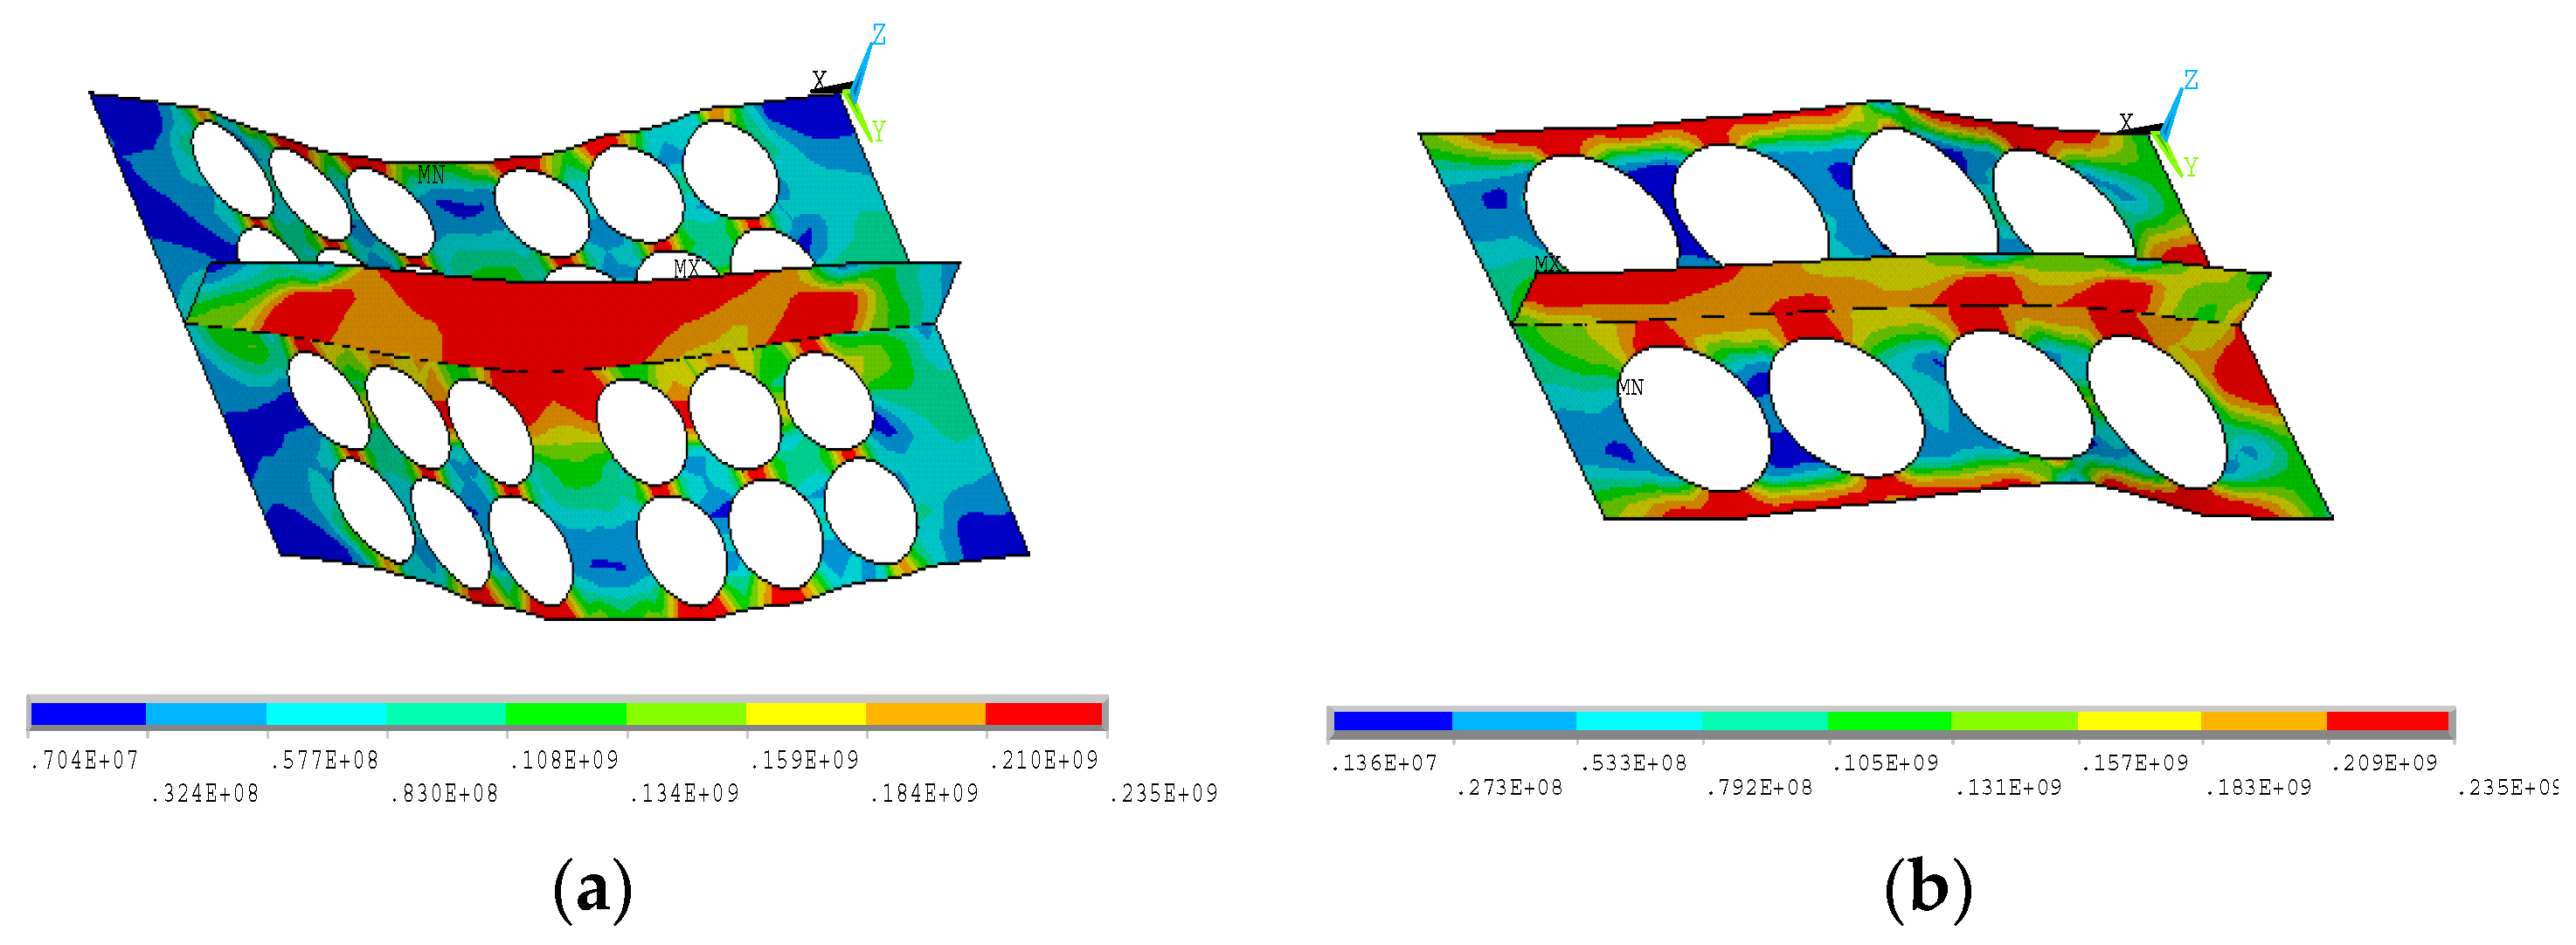
For the first set of DoO = 16.8%, the load-shortening curve is presented in 
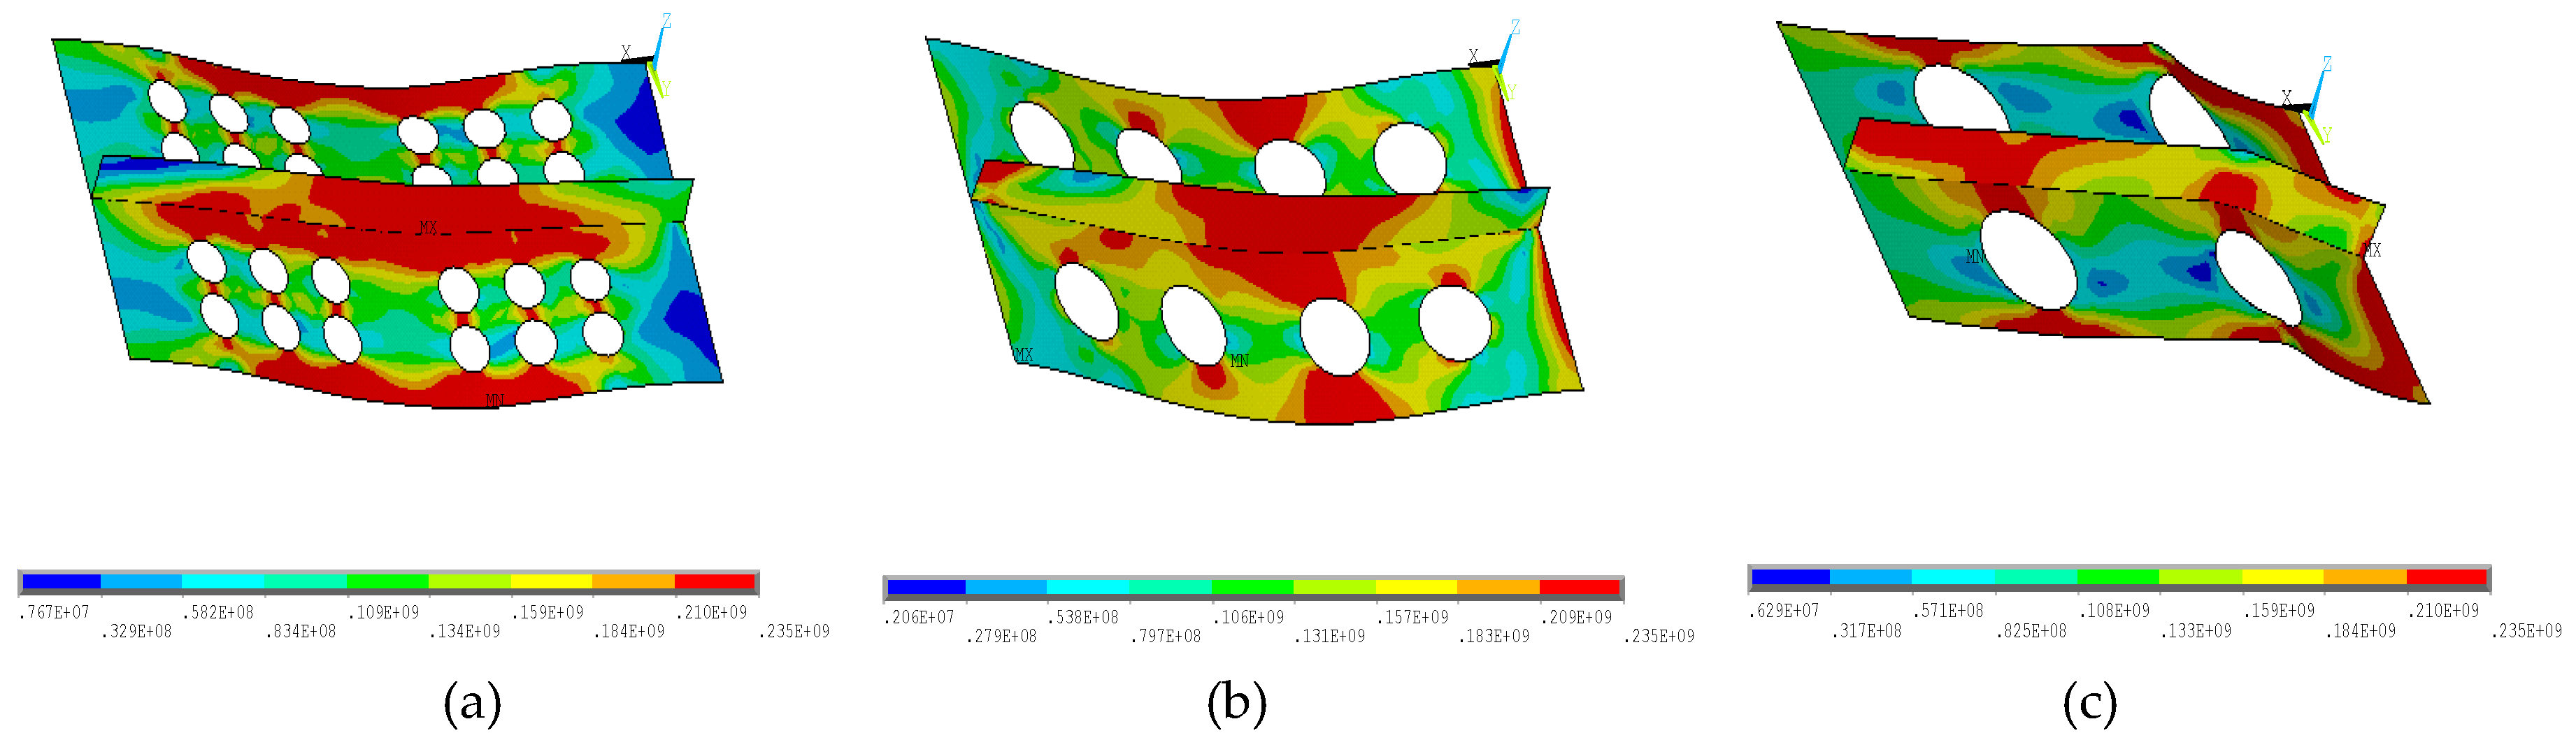
Figure 12a. The deformed shapes are shown in Figure 13. It is obvious that for specimens SP-NS 3-4 and 4-2, the FE distorted shapes (Figure 13b,c) follow the same during the experiment, but with lower capacity for SP-NS4-2 by 19.92% and higher capacity for SP-NS3-4 by 5.11% concerning the experiment. For specimen SP-NS2-3, the FE deformed shape is in the opposite direction (downward) to the experiment (Figure 13a), increasing the ultimate capacity difference to 10.13%, with highly stressed locations (red) within and around the stiffener as well as along the long edges.
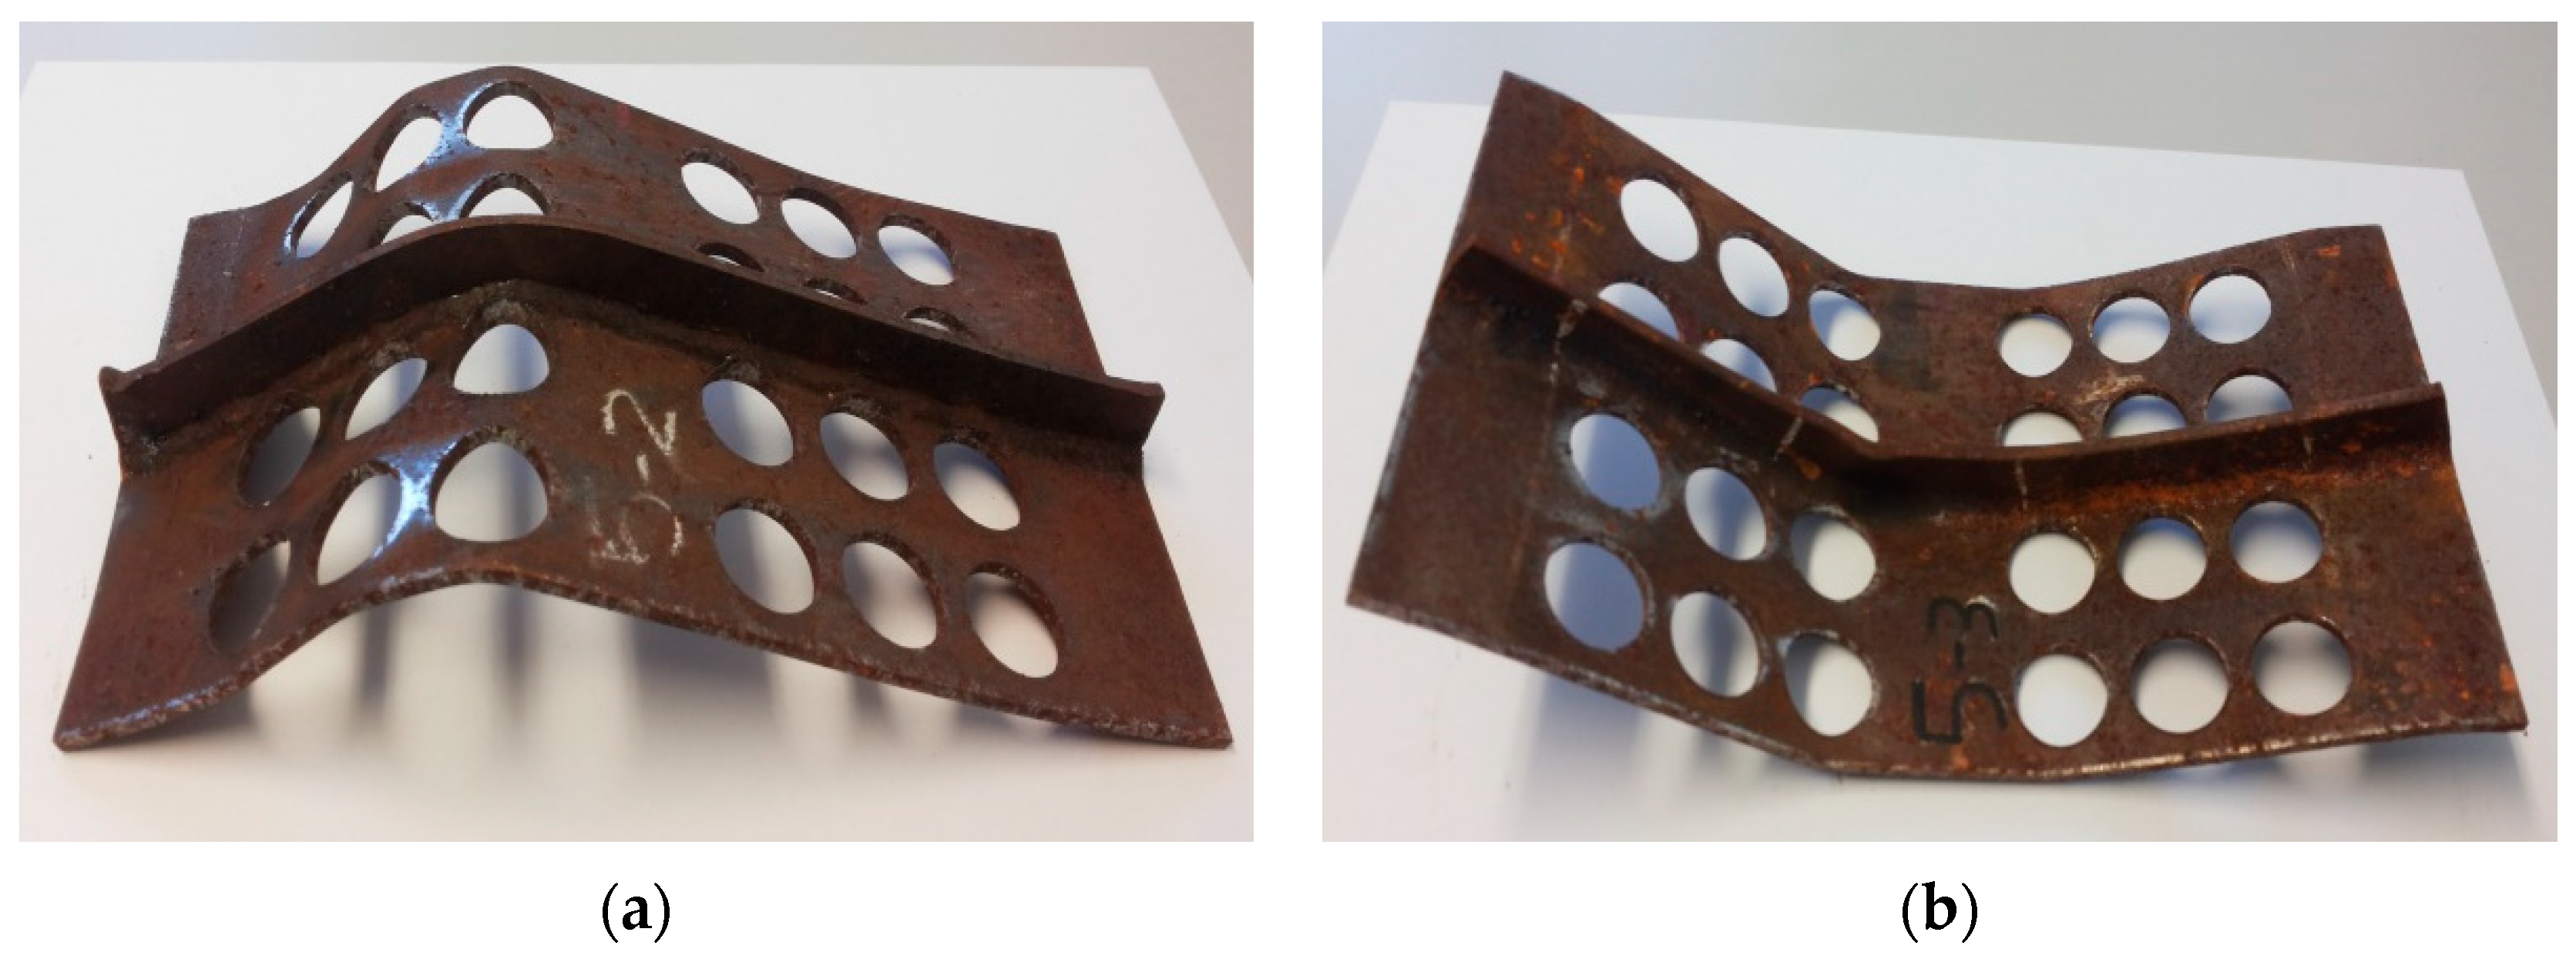
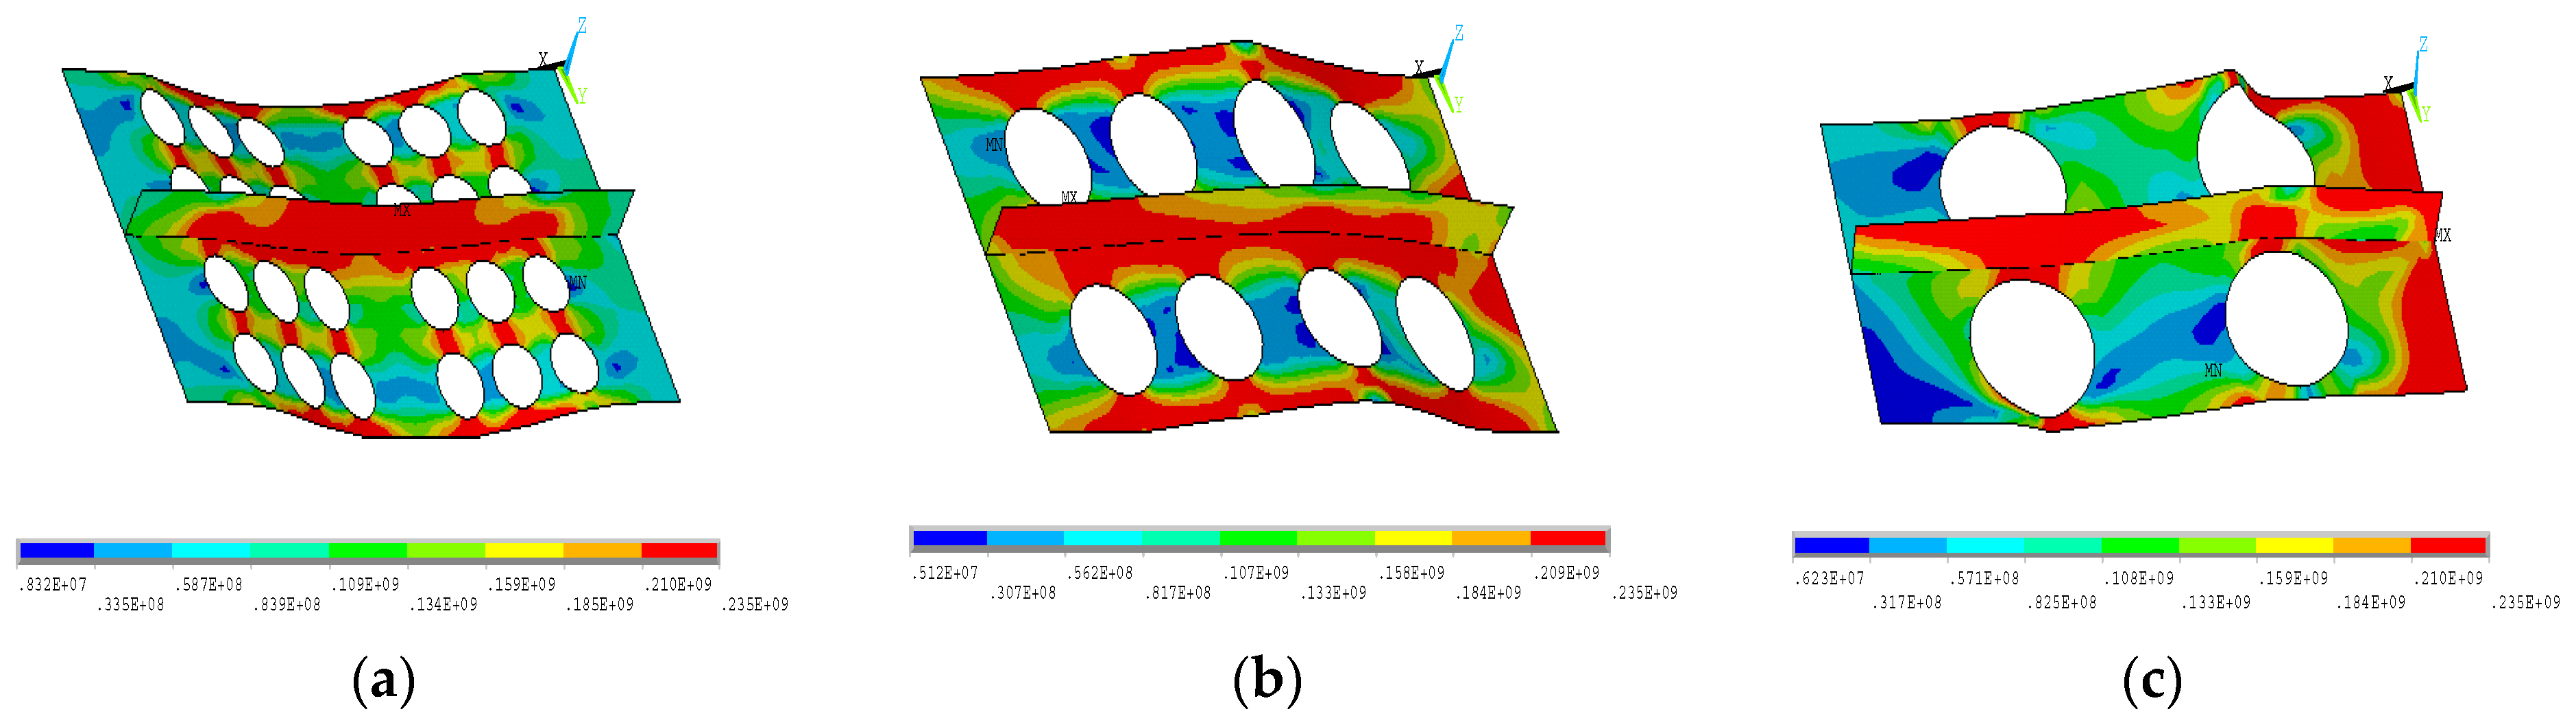
For the second set, DoO = 28.30%, the load-shortening curve and the relevant deformed shapes are plotted in Figure 12b. It may be noticed that the difference in the ultimate carrying capacity between the experiment and FE ranges between 2.09% and 26.80%, and the main reason for such a discrepancy is the deformed shape and the location of formation of plastic hinges, i.e., for specimen SP-NS7-2, the FE deformed shape shows the downward formation of the plastic hinges at the middle of the first column of openings, which is contrary to the experiment (
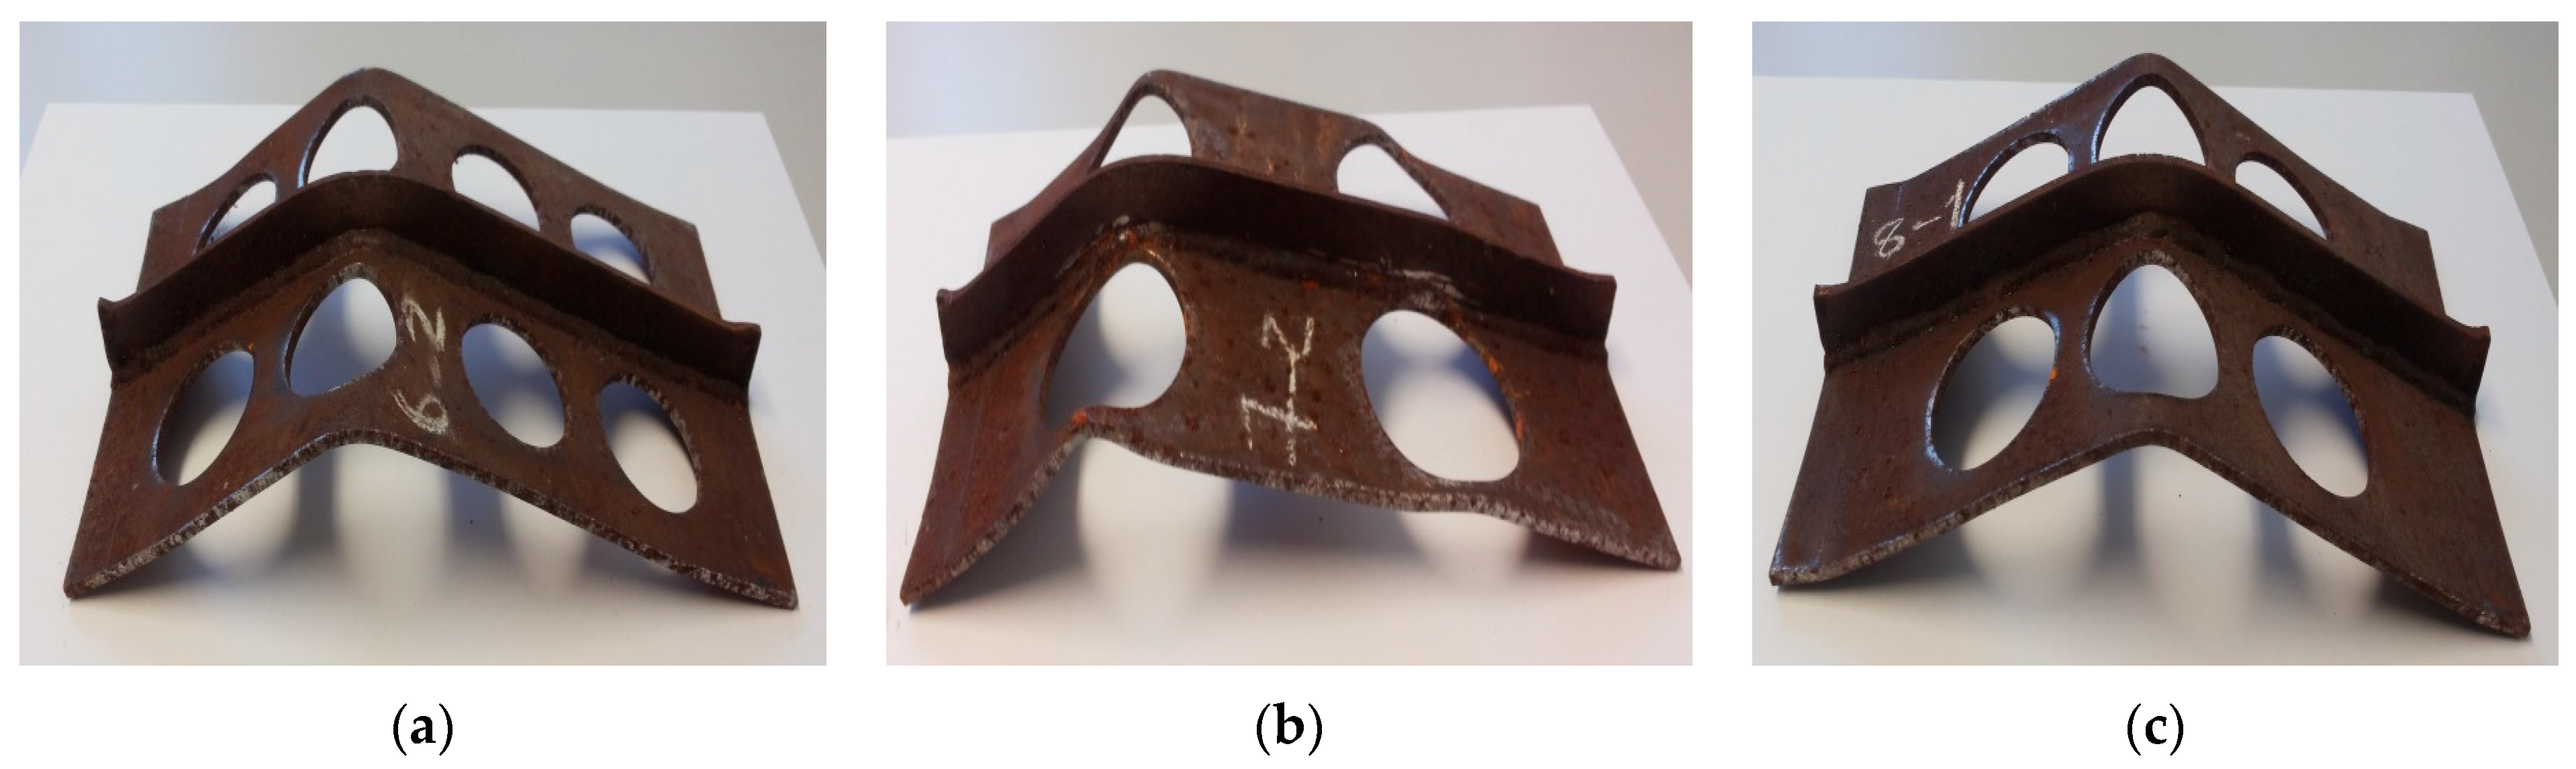
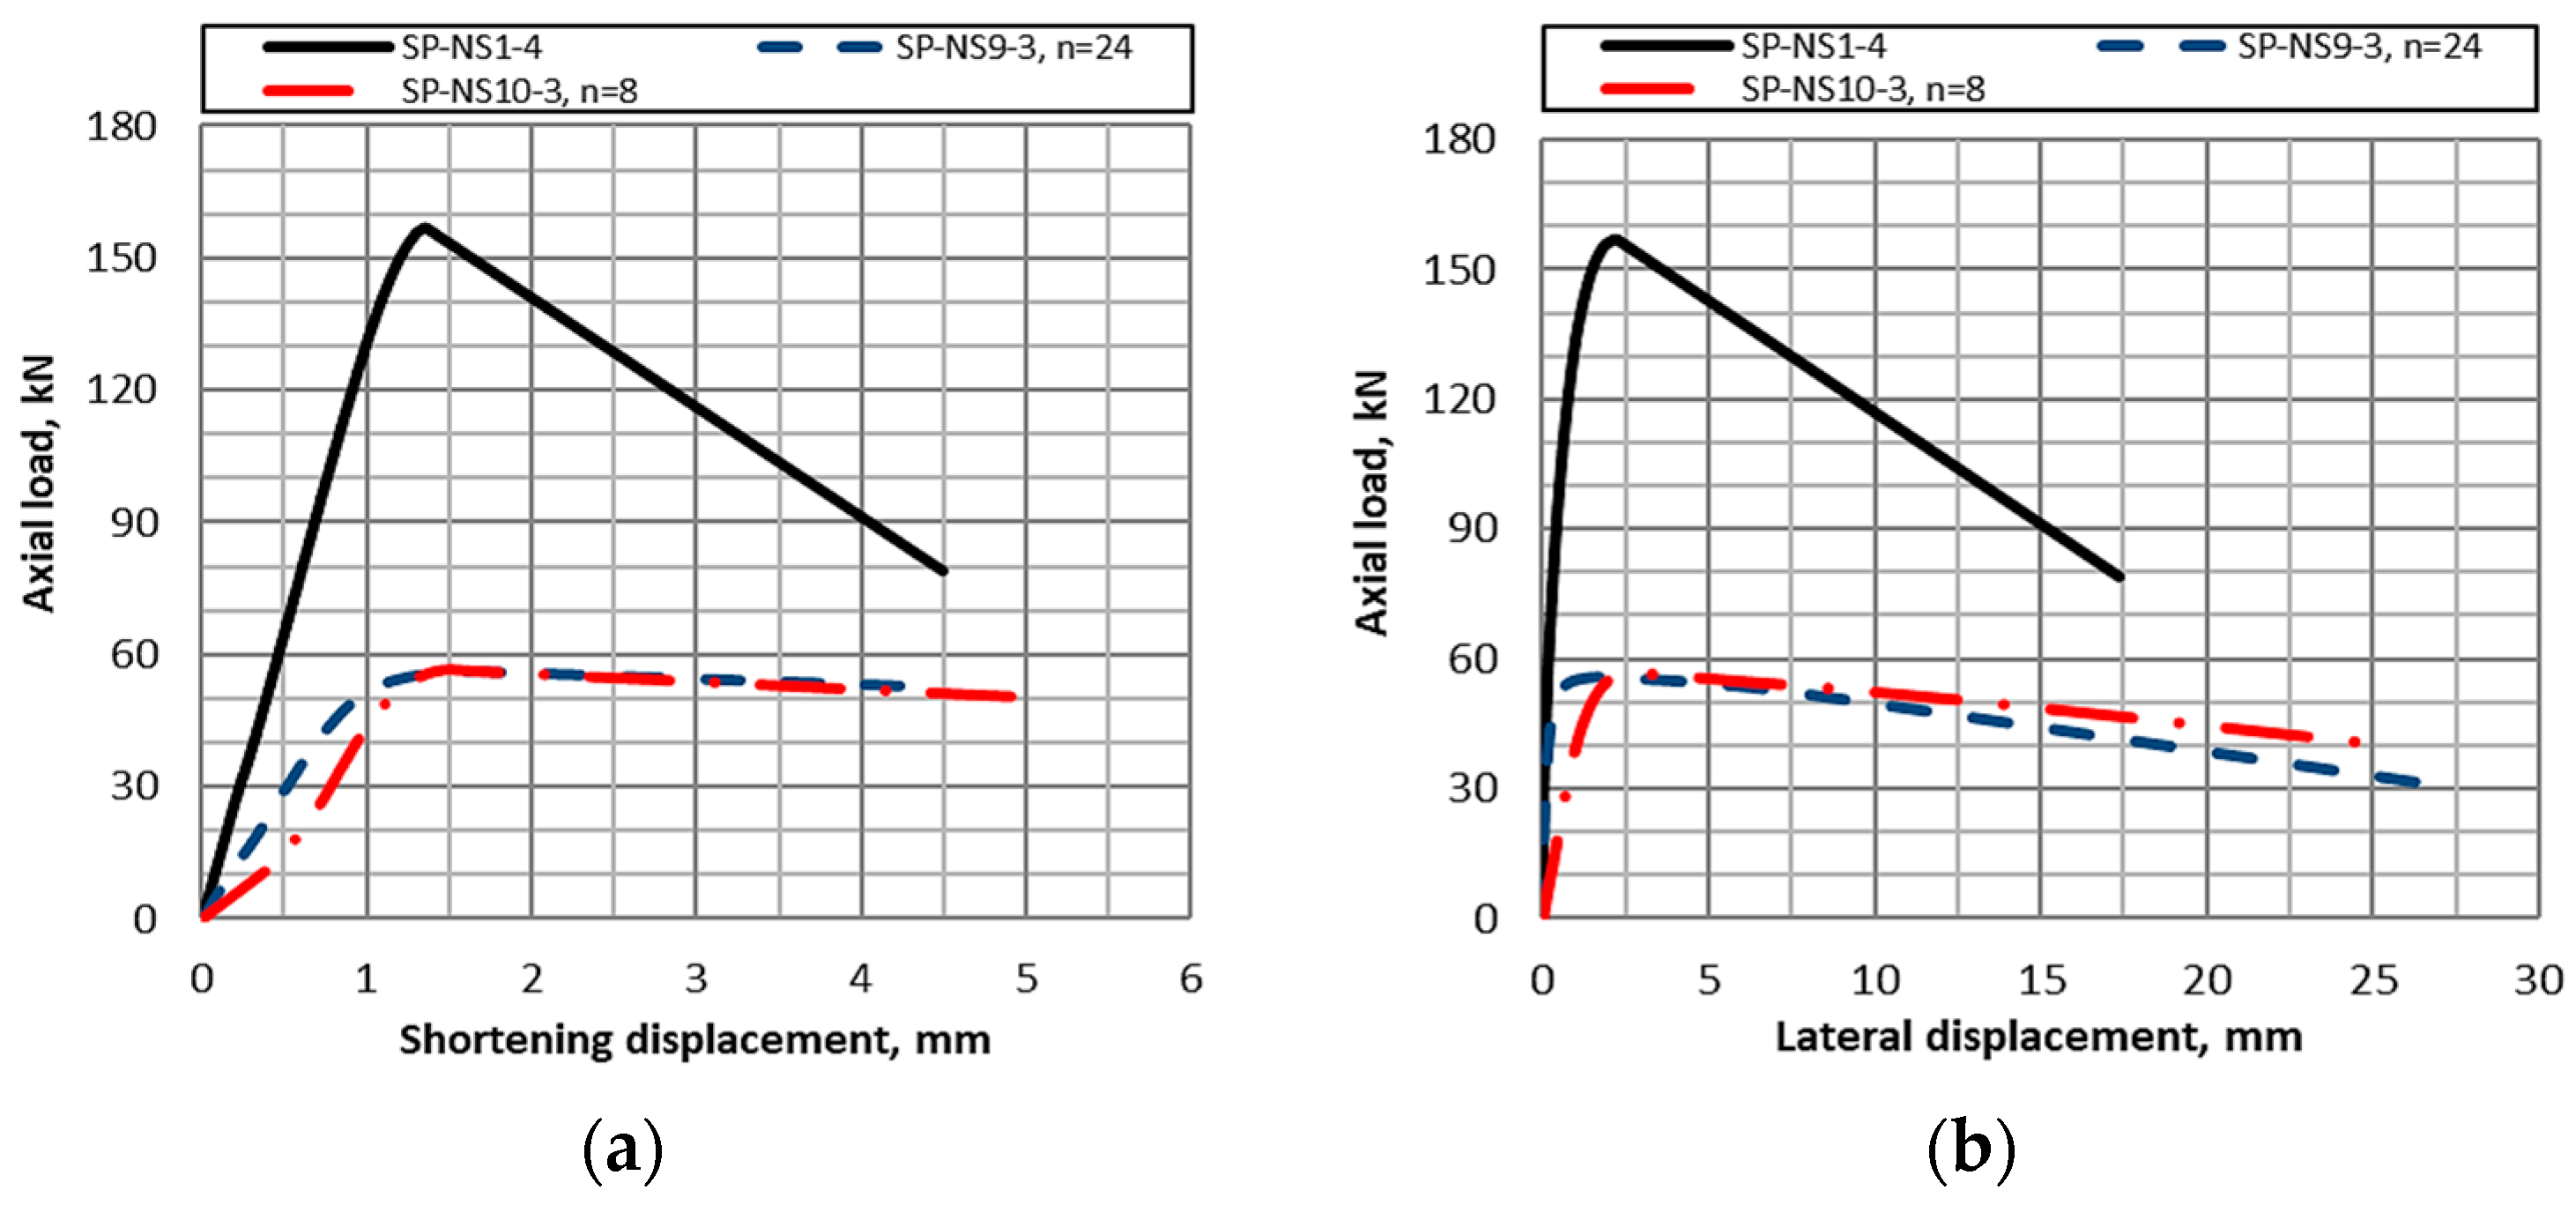
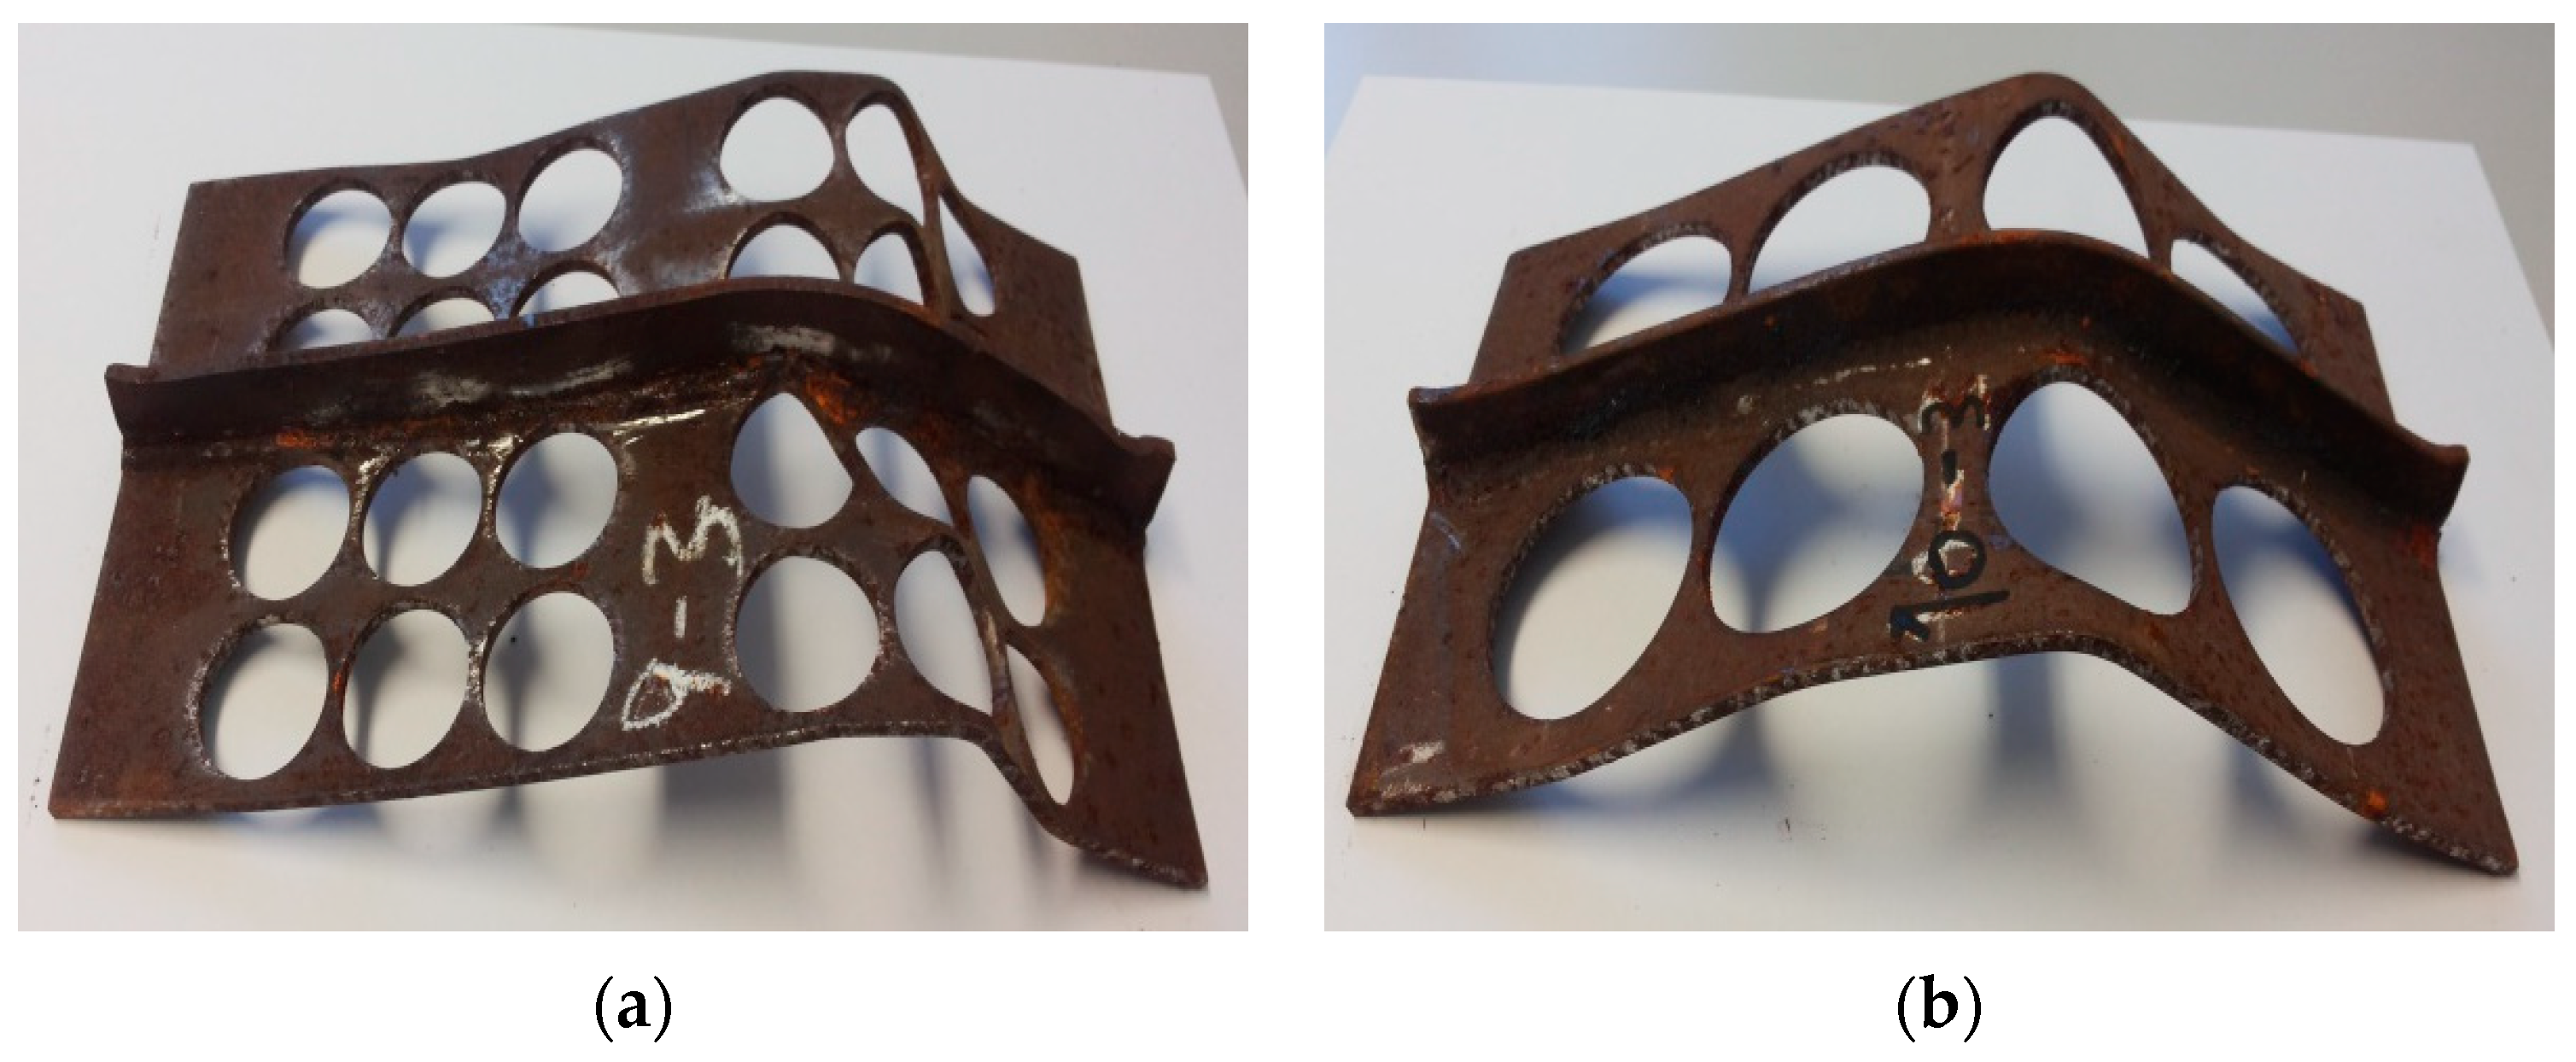
Figure 14). For the last set of openings, DoO = 42.9%, the FE results show an increase in the ultimate capacity difference, which ranges between 5.22% to 27.95% (Figure 12c), which may be related to the rise of the degree of opening and the following of the final deformation shape to the initial condition as for SP-NS 9-3, see Figure 15.
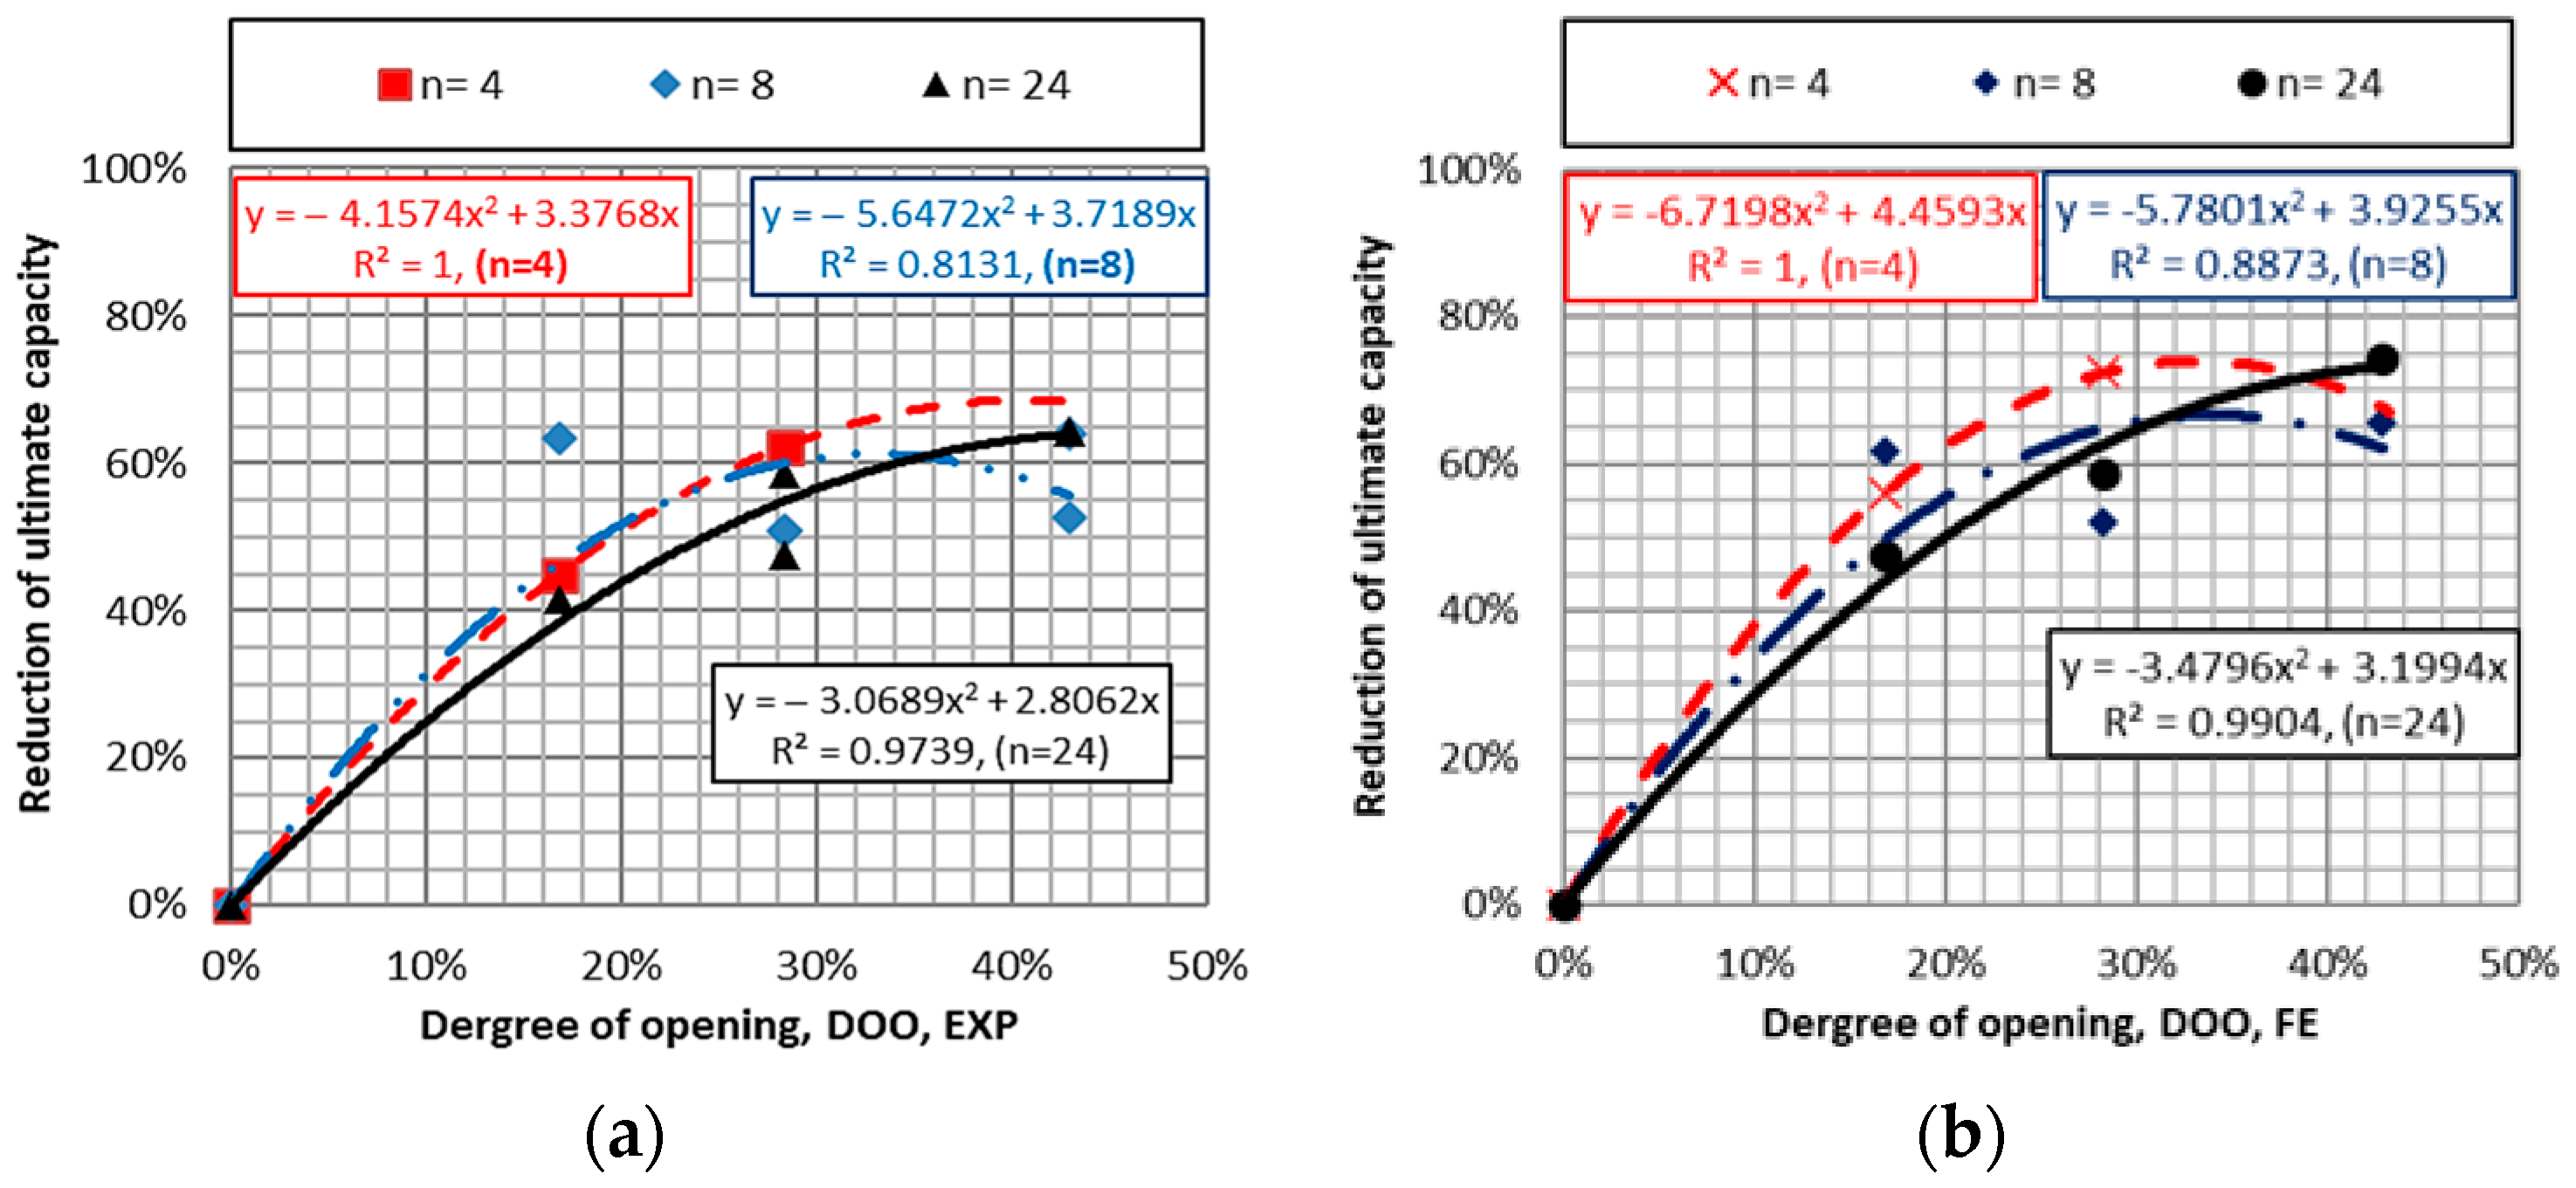
A different number of openings may introduce each degree of opening, and for the present study, the three opening numbers (n) used are 4, 8 and 24. The reduction in ultimate load-carrying capacity for a different number of openings concerning the intact stiffened plate is presented in Figure 16, accounting for both experimental Figure 16a and numerical Figure 16b results. As may be seen, the results of the three openings may be fitted to the second-degree polynomial function. Based on the experimental results, the lower capacity reduction is related to n = 24, while n = 4 and 8 exhibit almost the same behaviour up to DoO = 28.30%. After that, the scatter increases. Therefore, it may be concluded that for better structural capacity of perforated stiffened plates, a higher number of openings is preferable to fewer, which agrees with the work done in [15] for perforated unstiffened aged steel plates.
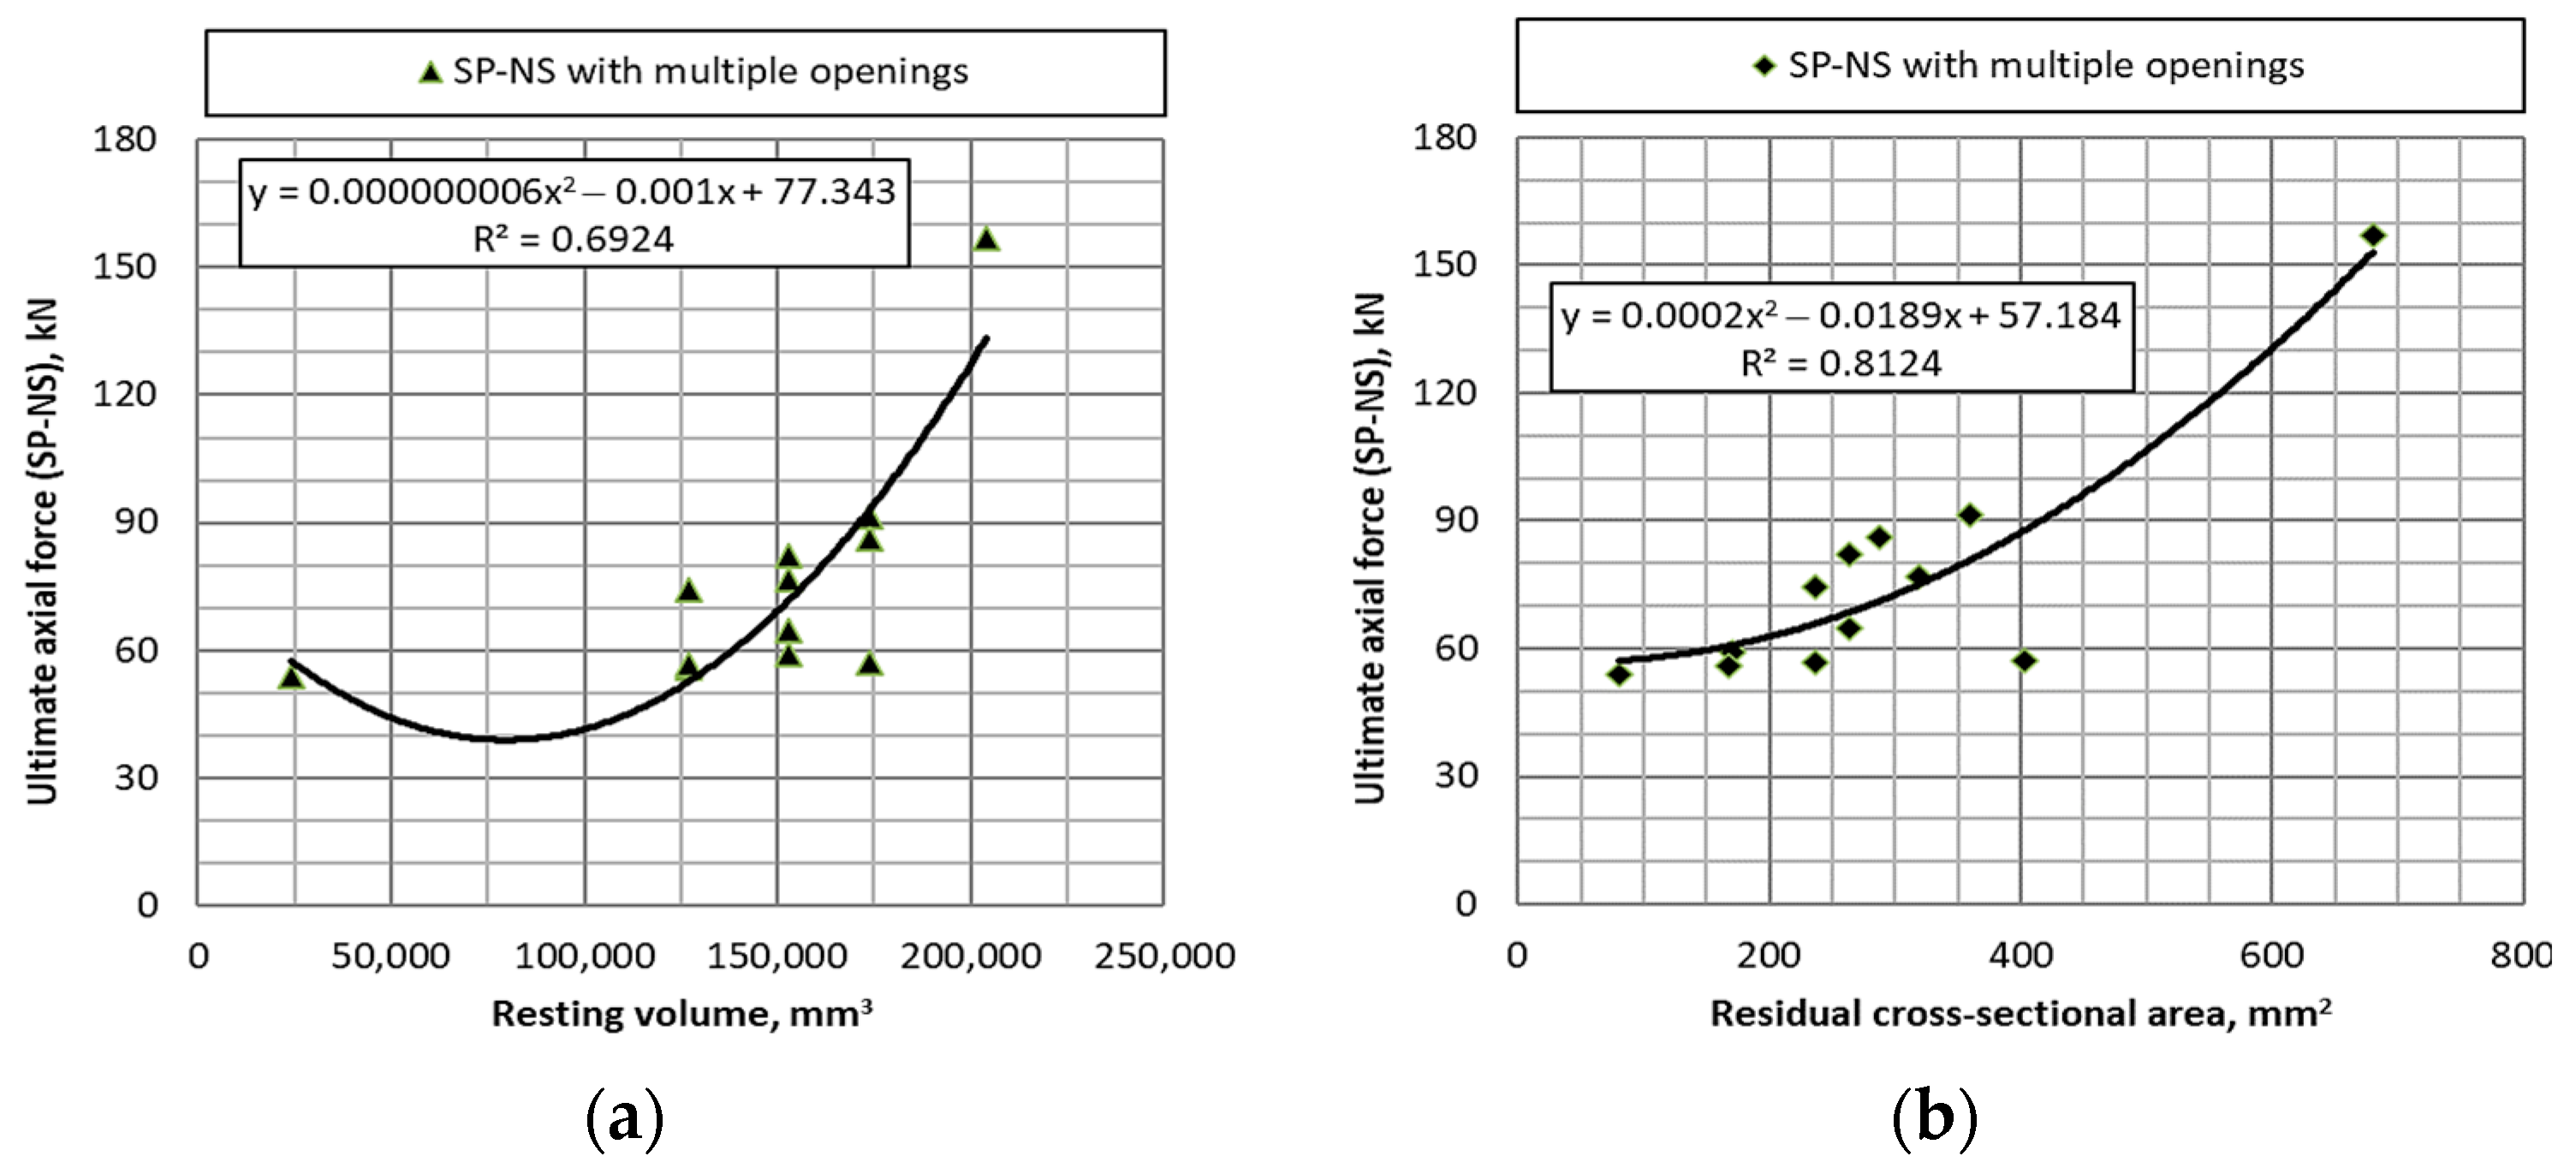
The ultimate load-carrying capacity of the perforated intact and initially corroded steel stiffened plates may be represented as a function of the resting volume, the Vrest of the structural component or the residual cross-sectional area Ares that resists the acting axial load. Assuming that the DoO of the plating is 100%, the stiffener is the only acting structural component. It was noted that the relationships between the resting volume and the ultimate axial force for specimens with different initial imperfections from zero severe excessive are nonlinear and fitting quality decreases as the level of imperfection increases. A plot of the ultimate axial capacity of the perforated stiffened plates as a function of the residual cross-sectional area, Ares, is presented in Figure 17b. The trend may be fitted to a second-degree polynomial function with a better fitting, R2 of 0.8124, than the prediction using the resting volume (Figure 17a).
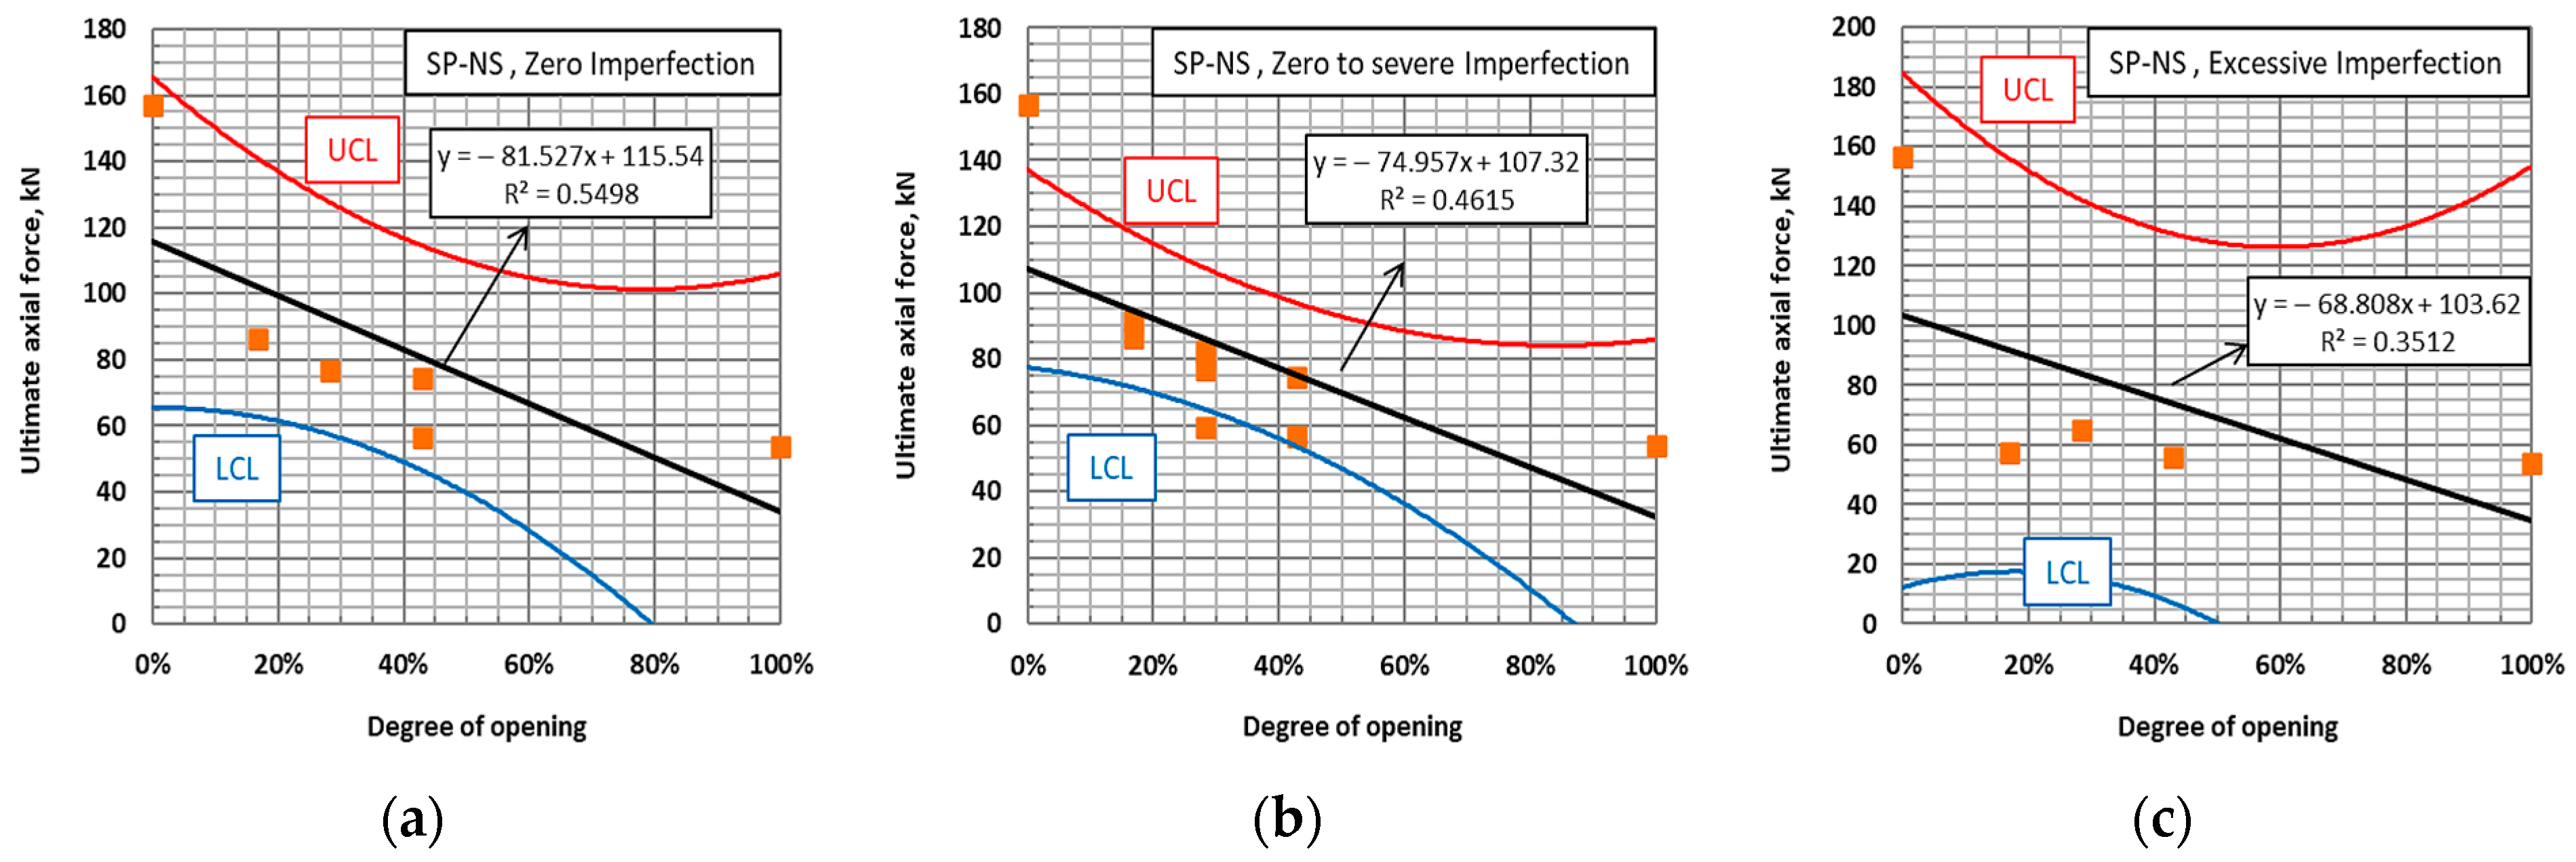
Due to the scatter of the initial imperfection amplitude from zero, severe, and excessive, the regression formulations are developed based on the experimental results for the mean value of the ultimate axial capacity of ordinary steel-stiffened plates with multiple openings as a function of the degree of openings, as presented in Figure 18, with the representation of both upper and lower confidence levels of the 95% confidence intervals for UCL and LCL, respectively. The fitting quality decreases as the initial imperfection level increases, and the deviation in both UCL and LCL increases as the imperfection amplitude increases. Therefore, more tests are needed to enhance the prediction.

5. Comparative Analysis

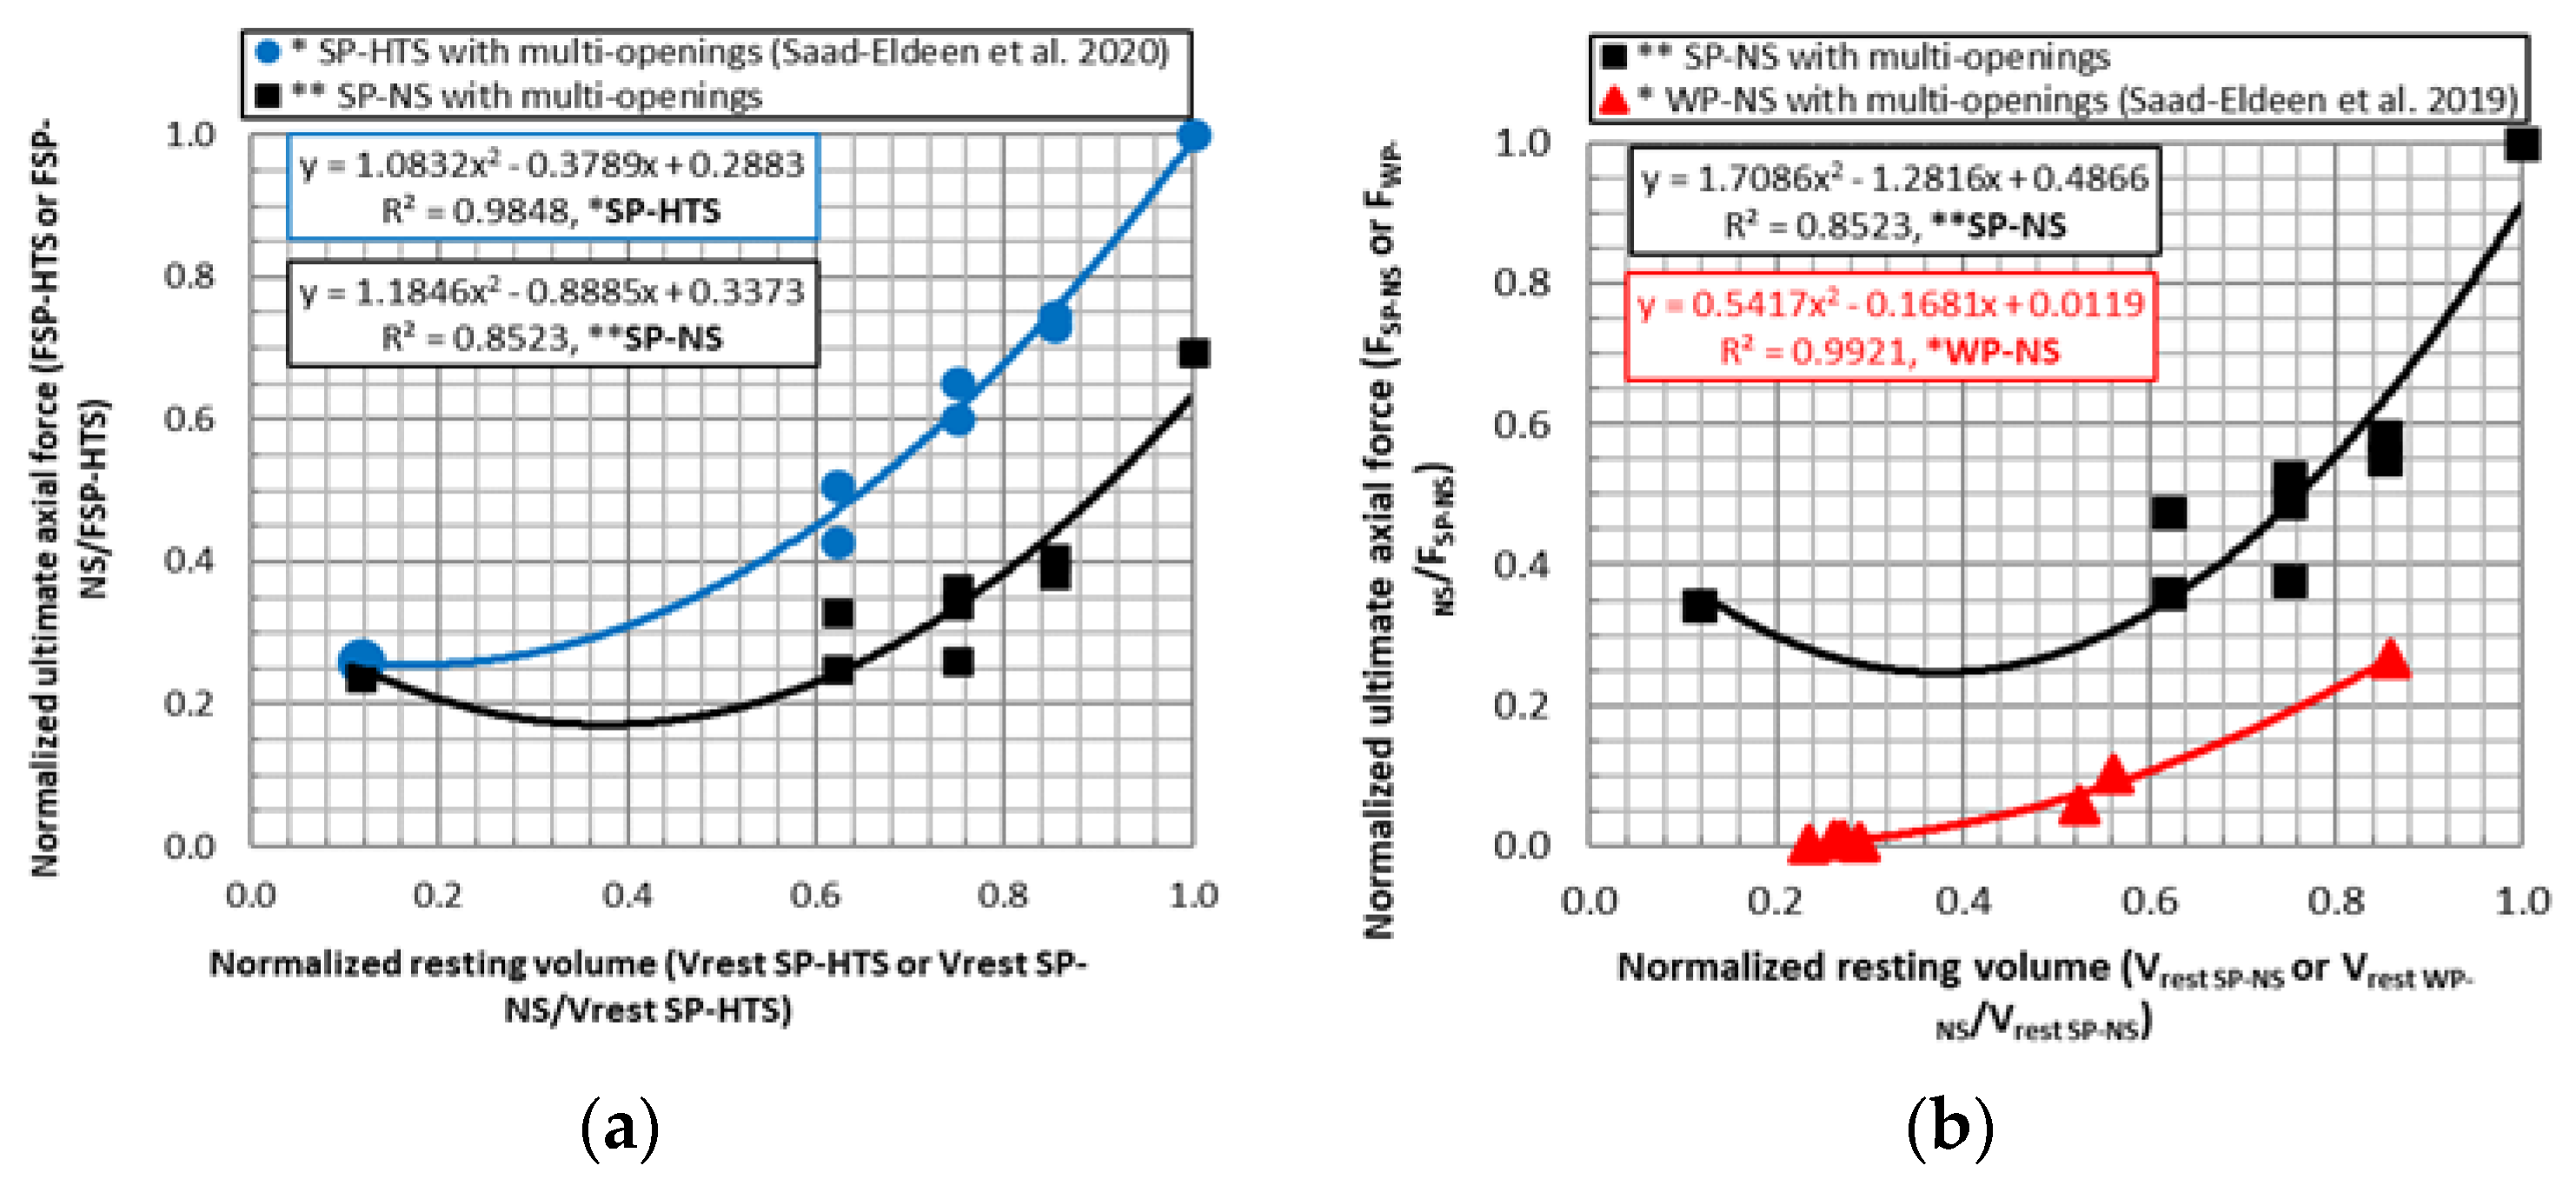
The experimental results of the ultimate load-carrying capacity of the present tested ordinary shipbuilding steel stiffened plates (** SP-NS) are compared with other published experimental results [18] for high-tensile steel-stiffened plates HTS690 specimens with multiple openings (* SP-HTS) of the same geometrical properties. The comparison output is normalised by resting volume and ultimate axial force and presented in Figure 19a. It is evident that the tendency of current ** SP-NS and published * SP-HTS [18] experimental results are similar, with an increase in the trend deviation as the normalised resting volume increases (lower DoO). A comparison between the ultimate capacity for * SP-NS and ** SP-HTS is given in Figure 19a and Table 3 for the same DoO, several openings, and equal resting volume. The axial force Fu related to the ultimate capacity Fu, HTS/Fu, NS ratio is lower than the yield strength σy, HTSy, NS and not proportional for the specimens of different steel grades.
Still, with similar openings and initial imperfection amplitude even in the opposite direction, the ratio of the ultimate capacity is almost the same as the plate slenderness βHTSNS. Generally, the specimens ** SP-HTS are of higher capacity than * SP-NS due to the higher contribution of the material grade (high tensile steel HTS690) rather than the initial imperfection amplitude.
It was noted that the specimens of high-tensile steel show fracture of the stiffener, which is not the case for ordinary steel-stiffened plates. Another comparison with published experimental results of aged steel plates with multiple openings (* WP-NS) experimentally tested in [15] is conducted and presented in Figure 19 (right). The current results for the steel-stiffened plate ** SP-NS is the reference for the comparison. It has to be stressed that the geometry is different where the specimens WP-NS are only plates without attached stiffeners. Additionally, corrosion degradation affects geometry (thickness reduction) and mechanical properties [15]. Such a comparison combines the effect of the geometrical changes and the mechanical properties. The trend for ** SP-NS and * WP-NS is almost the same, regardless of the normalised value for ** SP-NS at Vrest = 0.18, representing the condition for which the stiffener is the only resting structural component. The lower capacity of * WP-NS than ** SP-NS is due to the lower resting volume due to the absence of an attached stiffener and the thinner plating due to corrosion degradation accompanied by changes in the material mechanical properties, yield stress and modulus of elasticity.
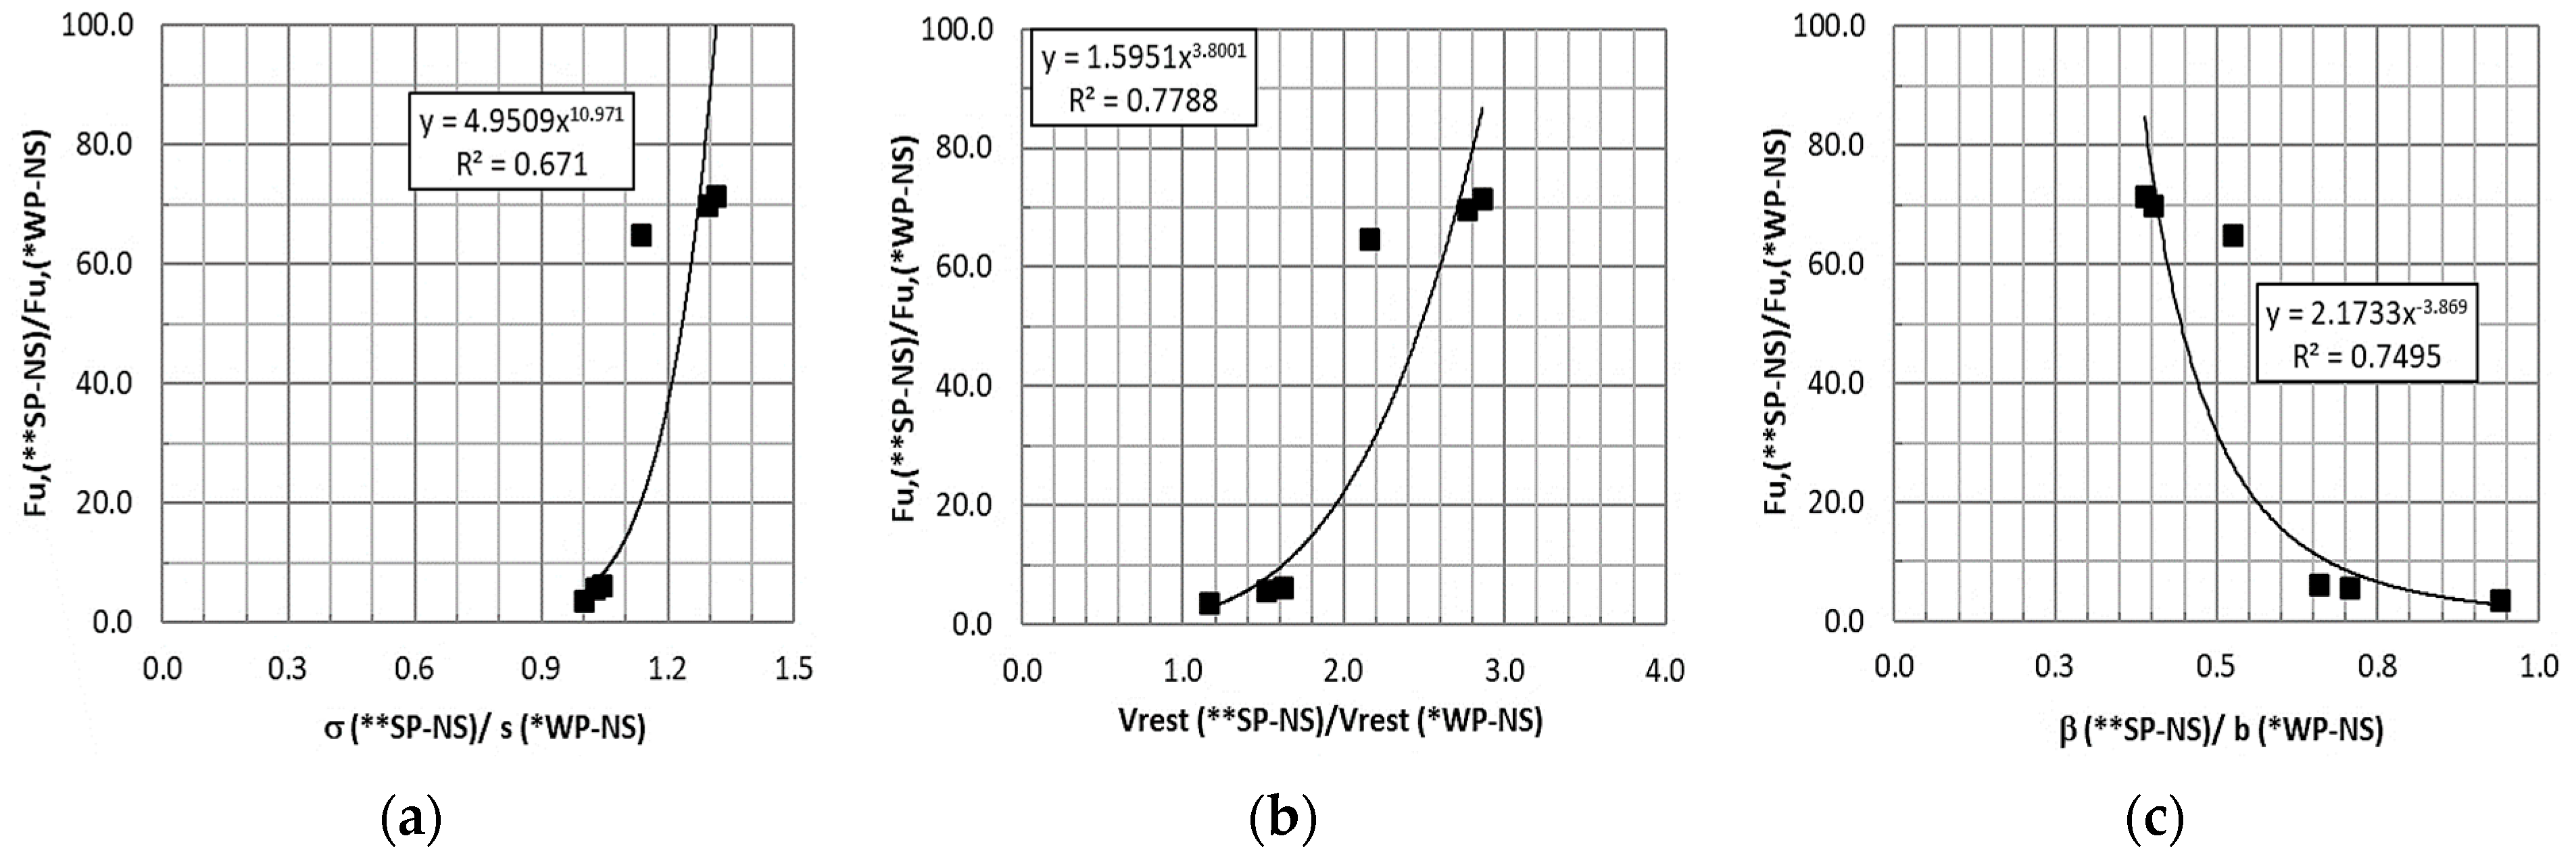
Table 4 and Figure 20 compare the ultimate load-carrying capacity as a function of yield strength, resting volume, and plate slenderness ratio. It may be concluded that for βSPWP < 0.66 and the ratio of the resting volume more significant than 1.62, the ultimate capacity ratio increases dramatically, contrary to βSPWP < 0.66. Therefore, it may be concluded that for plates with multiple openings, the positive effect of attached stiffener and the negative impact of corrosion degradation increase the ultimate capacity ratio nonlinearly and may be fitted to a power function concerning yield strength, resting volume, and plate slenderness ratio.
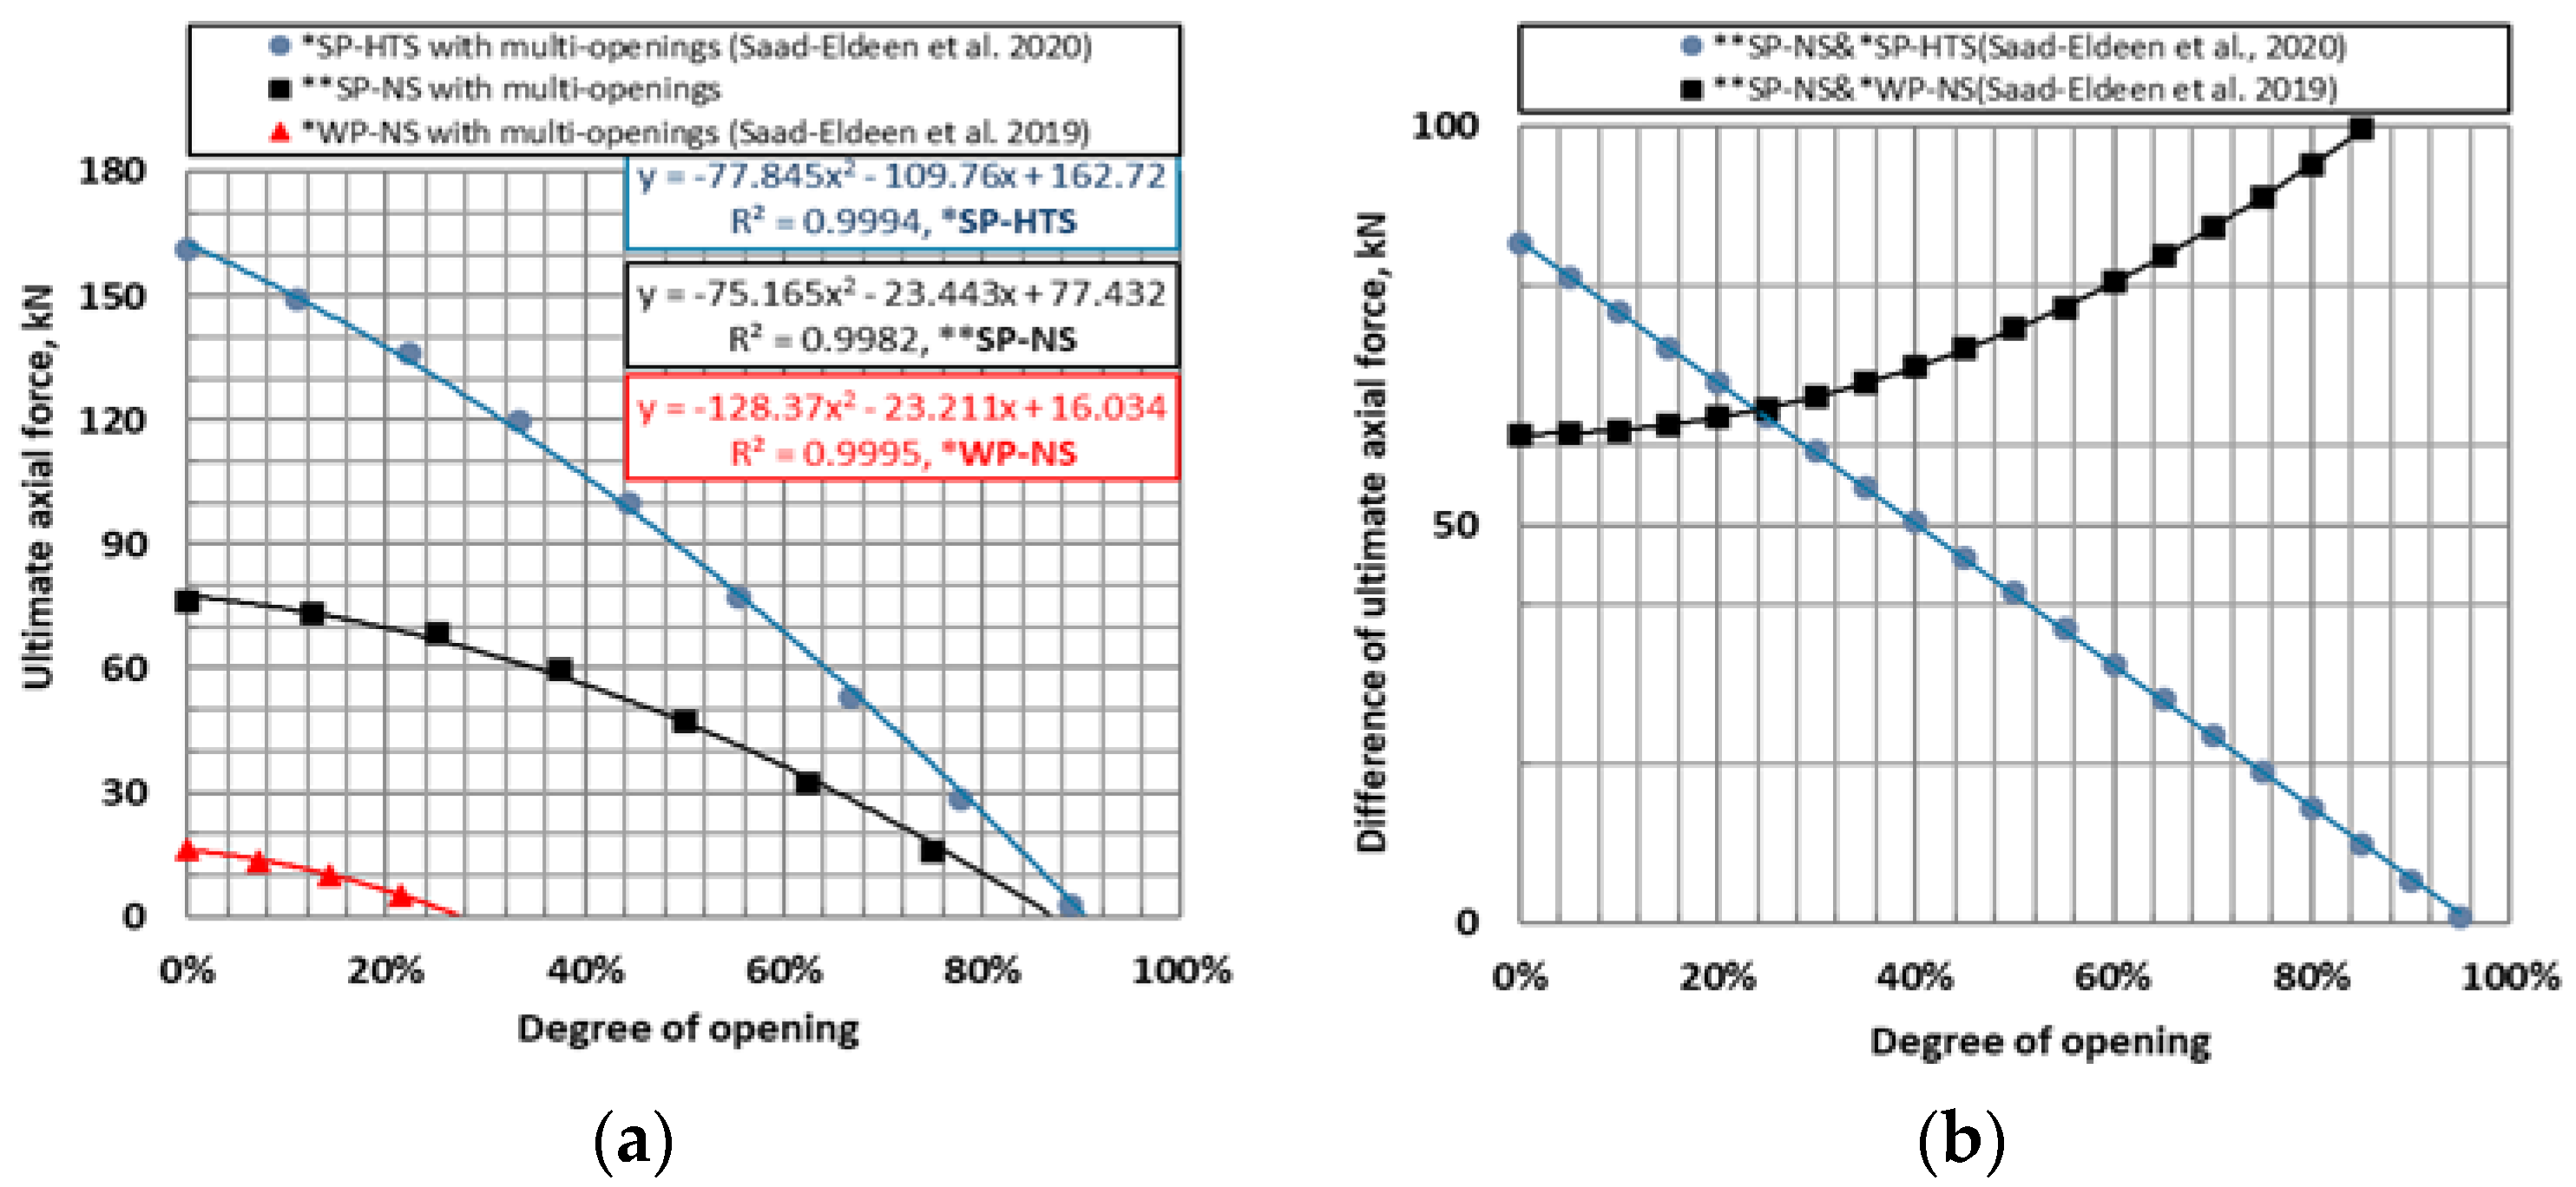
For imperfection amplitude from zero to severe w o ∈[0,3] mm, the failure assessment diagram based on the lower confidence level shows 2.5% (LCL) for the current experimental results ** SP-NS and others presented in [15,18] for * WP-NS and * SP-HTS, respectively, are presented in Figure 21a. The deviation in the predicted structural response between the perforated stiffened plates with different materials * SP-HTS and * SP-NS decreases as the DoO increases (Figure 21b), where the such deviation between the structural components of the same material but with and without stiffener ** SP-NS and * WP-NS increases as the DoO increases. This may lead to the effect of material properties’ difference on the strength capacity decrease as the DoO increases. Furthermore, for the same material, the contribution of the attached stiffener in the ultimate capacity increases as the DoO increases.
The structural component is safe based on the plotted LCL envelope of the ultimate compressive capacity. It behaves conditionally within acceptable limits such that the intersection points between any DoO and acting axial compressive load are above the envelope border for each structural component.

6. Conclusions

The ultimate load-carrying capacity for intact and perforated ordinary shipbuilding steel-stiffened plates was examined experimentally and numerically with different initial distortions. The perforation impact was analysed by three openings, and three opening numbers were introduced in each. It was noticed that the dominating load-carrying capacity controlling parameter is the initial imperfection amplitude, the corresponding collapse mode, and the degree of openings. The strength capacity will be the weakest if the post-collapse mode matches the initial imperfection shape. The occurrence of stiffener tripping is higher if the amplitude of the initial downward imperfection is severe and the related failure mode shows higher capacity reduction rather than a higher degree of opening.
Additionally, the complexity of numerical prediction of both ultimate capacity and deformed shape increases as the degree of opening and the initial imperfection amplitude increases, represented by lower and higher capacity differences concerning the −5.11% and 27.95%, respectively. The effect of material properties on the strength capacity decreases as the degree of openings increases. The ultimate load-carrying capacity ratio is not proportional to yield strength, plate slenderness ratios, or resting volume for structural components with different steel grades. Based on the experimental and numerical results, using more openings is recommended rather than fewer and being located away from the central portion for better structural capacity, which agrees with other published experimental results. Additionally, the residual cross-sectional area better represents the resting volume for designing the stiffened perforated plates.
Additional research is needed for more complex structures, such as multi-bay ones with and without stiffener (web) openings.

Author Contributions

Conceptualisation, S.S.-E. and Y.G.; methodology, S.S.-E. and Y.G.; validation, S.S.-E. and Y.G.; formal analysis, S.S.-E. and Y.G.; writing—original draft preparation, S.S.-E. and Y.G.; writing—review and editing, S.S.-E. and Y.G. All authors have read and agreed to the published version of the manuscript.

Funding

This research received no external funding.

Institutional Review Board Statement

Not applicable.

Informed Consent Statement

Not applicable.

Data Availability Statement

The data presented in this study are available within the article.

Acknowledgments

The study has been supported by the Strategic Research Plan of the Centre for Marine Technology and Ocean Engineering, financed by the Portuguese Foundation for Science and Technology (Fundação para a Ciência e Tecnologia-FCT) under contract UIDB/UIDP/00134/2020.

Conflicts of Interest

The authors declare no conflict of interest. The funders had no role in the design of the study, collection, analyses, or interpretation of data, writing of the manuscript, or decision to publish the results.

References

  1. Faulkner, D. A review of effective plating for use in the analysis of stiffened plating in bending and compression. J. Ship Res. 1975, 19, 1–17. [Google Scholar] [CrossRef]
  2. Guedes Soares, C. Uncertainty modelling in plate buckling. Struct. Saf. 1988, 5, 17–34. [Google Scholar] [CrossRef]
  3. Guedes Soares, C. Design equation for ship plate elements under uniaxial compression. J. Constr. Steel Res. 1992, 22, 99–114. [Google Scholar] [CrossRef]
  4. Masaoka, K.; Mansour, A. Ultimate compressive strength of imperfect unstiffened plates: Simple design equations. J. Ship Res. 2004, 48, 191–201. [Google Scholar] [CrossRef]
  5. Paik, J.K. Ultimate strength of steel plates with a single circular hole under axial compressive loading along short edges. Ships Offshore Struct. 2007, 2, 355–360. [Google Scholar] [CrossRef]
  6. Paik, J.K. Ultimate strength of perforated steel plates under edge shear loading. Thin Walled Struct. 2007, 45, 301–306. [Google Scholar] [CrossRef]
  7. Wang, G.; Sun, H.; Peng, H.; Uemori, R. Buckling and ultimate strength of plates with openings. Ships Offshore Struct. 2009, 4, 43–53. [Google Scholar] [CrossRef]
  8. Kumar, M.S.; Alagusundaramoorthy, P.; Sundaravadivelu, R. Interaction curves for stiffened panel with circular opening under axial and lateral loads. Ships Offshore Struct. 2009, 2, 133–143. [Google Scholar] [CrossRef]
  9. Moen, C.D.; Schafer, B.W. Elastic buckling of thin plates with holes in compression or bending. Thin Walled Struct. 2009, 47, 1597–1607. [Google Scholar] [CrossRef]
  10. Saad-Eldeen, S.; Garbatov, Y.; Guedes Soares, C. Experimental strength assessment of thin steel plates with a central elongated circular opening. J. Constr. Steel Res. 2016, 118, 135–144. [Google Scholar] [CrossRef]
  11. Saad-Eldeen, S.; Garbatov, Y.; Guedes Soares, C. Experimental investigation on the residual strength of thin steel plates with a central elliptic opening and locked cracks. Ocean Eng. 2016, 115, 19–29. [Google Scholar] [CrossRef]
  12. Saad-Eldeen, S.; Garbatov, Y.; Guedes Soares, C. Experimental strength analysis of steel plates with a large circular opening accounting for corrosion degradation and cracks subjected to compressive load along the short edges. Mar. Struct. 2016, 48, 52–67. [Google Scholar] [CrossRef]
  13. Saad-Eldeen, S.; Garbatov, Y.; Guedes Soares, C. Experimental compressive strength analyses of high tensile steel thin-walled stiffened panels with a large lightning opening. Thin Walled Struct. 2017, 113, 61–68. [Google Scholar] [CrossRef]
  14. Saad-Eldeen, S.; Garbatov, Y.; Guedes Soares, C. Structural capacity of plates and stiffened panels of different materials with opening. Ocean Eng. 2018, 167, 45–54. [Google Scholar] [CrossRef]
  15. Saad-Eldeen, S.; Garbatov, Y.; Guedes Soares, C. Buckling collapse tests of deteriorated steel plates with multiple circular openings. Ocean Eng. 2019, 172, 523–530. [Google Scholar] [CrossRef]
  16. Xu, S.; Lin, J.; Liu, B.; Garbatov, Y.; Wang, Y.; Guedes Soares, C. Experimental and numerical buckling analysis of cylindrical pressure hulls with multi-circular openings. Ocean Eng. 2020, 214, 107689. [Google Scholar] [CrossRef]
  17. Cui, J.; Wang, D. An experimental and numerical investigation on ultimate strength of stiffened plates with opening and perforation corrosion. Ocean Eng. 2020, 205, 107282. [Google Scholar] [CrossRef]
  18. Saad-Eldeen, S.; Garbatov, Y.; Guedes Soares, C. Experimental failure assessment of high tensile stiffened plates with openings. Eng. Struct. 2020, 206, 110121. [Google Scholar] [CrossRef]
  19. Zhao, Z.; Zhang, M.; Gao, Y.; Sun, Q. Investigations on shear capacity of steel plates with local opening. J. Constr. Steel Res. 2021, 179, 106518. [Google Scholar] [CrossRef]
  20. Xu, M.C.; Song, Z.J.; Wang, T.; Zhang, W.Z.; Pan, J. Empirical formulae assessment of ultimate strength for perforated stiffened panels under longitudinal compression. Ocean Eng. 2022, 264, 112445. [Google Scholar] [CrossRef]
  21. Liu, H.; Xiong, Y.; Chen, Z.; Ouyang, Y.; Mashrah, W.A.H. Compressive performance of h-shaped aluminium alloy members with web openings. Eng. Struct. 2022, 266, 114595. [Google Scholar] [CrossRef]
  22. Wang, S.; Garbatov, Y.; Chen, B.; Guedes Soares, C. Dynamic structural response of perforated plates subjected to water impact load. Eng. Struct. 2016, 125, 179–190. [Google Scholar] [CrossRef]
  23. Bellezi, C.A.; Cheng, L.Y.; Tetsuo Okada, T.; Arai, M. Optimised perforated bulkhead for sloshing mitigation and control. Ocean Eng. 2019, 187, 106171. [Google Scholar] [CrossRef]
  24. Garbatov, Y.; Saad-Eldeen, S.; Guedes Soares, C. Hull girder ultimate strength assessment based on experimental results and the dimensional theory. Eng. Struct. 2015, 100, 742–750. [Google Scholar] [CrossRef]
  25. Saad-Eldeen, S.; Garbatov, Y.; Guedes Soares, C. Experimental assessment of the ultimate strength of a box girder subjected to four-point bending moment. In Proceedings of the 11th International Symposium on Practical Design of Ships and Other Floating Structures, Rio de Janeiro, Brazil, 19–24 September 2010; pp. 1134–1143. [Google Scholar]
  26. Garbatov, Y.; Guedes Soares, C.; Parunov, J.; Kodvanj, J. Tensile strength assessment of corroded small scale specimens. Corros. Sci. 2014, 85, 296–303. [Google Scholar] [CrossRef]
  27. ANSYS. Online Manuals Release 11; ANSYS: Canonsburg, PA, USA, 2009. [Google Scholar]
  28. Saad-Eldeen, S.; Garbatov, Y.; Guedes Soares, C. Failure assessment of wash plates with different degree of openings. In Progress in Maritime Technology and Engineering; Soares, C.G., Santos, T.A., Eds.; Taylor & Francis Group: London, UK, 2018; pp. 377–384. [Google Scholar]
Figure 1. Geometrical configurations of perforated specimens.
Jmse 11 00842 g001
Figure 2. Compressive testing rig.
Jmse 11 00842 g002
Figure 3. Axial load-shortening displacement (a) mid-lateral displacement (b) and local strain (c) for intact stiffened plate SP-NS1-4.
Jmse 11 00842 g003
Figure 4. Post-collapse deformed shape for intact stiffened plate SP-NS1-4 (a) and SP-HTS1-2 (b,c).
Jmse 11 00842 g004
Figure 5. Axial force versus shortening (a), lateral displacement (b) and local strain (c), DoO = 16.80%.
Jmse 11 00842 g005
Figure 6. Post-collapse deformed shape, DoO = 16.80%, SP-NS2-3 (a), SP-NS3-4 (b) and SP-NS4-2 (c).
Jmse 11 00842 g006
Figure 7. Axial force versus shortening (a), lateral displacement (b) and local strain (c), DoO = 28.30%.
Jmse 11 00842 g007
Figure 8. Post-collapse deformed shape for n = 24 and DoO = 28.30%, SP-NS5-2 (a) and SP-NS5-3 (b).
Jmse 11 00842 g008
Figure 9. Post-collapse deformed shape for n = 8, 6, 4 DoO = 28.30%, SP-NS6-2 (a), SP-NS7-2 (b) and SP-NS8-1 (c).
Jmse 11 00842 g009
Figure 10. Axial force versus shortening (a) and lateral displacement (b) for n = 8 and 24, DoO = 42.90%.
Jmse 11 00842 g010
Figure 11. Post-collapse deformed shape for n = 24, DoO = 42.90%, SP-NS9-3 (a) and SP-NS10-3, n = 8 (b).
Jmse 11 00842 g011
Figure 12. Experimental and numerical results for DoO = 16.80% (a), DoO = 28.30% (b) and DoO = 42.90% (c).
Jmse 11 00842 g012
Figure 13. Deformed shape at the ultimate load step DoO = 16.80% SP-NS2-3 (a) SP-NS3-4 (b) and SP-NS 4-2 (c).
Jmse 11 00842 g013
Figure 14. Deformed shape at the ultimate load step: DoO = 28.30% for SP-NS5-2 (a), SP-NS6-2 (b) and SP-NS7-2 (c).
Jmse 11 00842 g014
Figure 15. Deformed shape at the ultimate load step: DoO = 42.90% for SP-NS 9-3 (a) and SP-NS 10-3 (b).
Jmse 11 00842 g015
Figure 16. Capacity reduction as a function of DoO for different opening numbers, EXP (a) and FE (b).
Jmse 11 00842 g016
Figure 17. Ultimate axial force as a function of resting volume (a) and residual cross-sectional area (b).
Jmse 11 00842 g017
Figure 18. Mean value, UCL and LCL of ultimate axial force as a function degree of opening, SP-NS, (a)-zero imperfection, (b)zero to severe imperfection and (c)-excessive imperfection.
Jmse 11 00842 g018
Figure 19. Normalised ultimate force vs. normalised resting volume for stiffened specimens of ordinary and high-tensile steel SP-HTS [18] (a) and stiffened/unstiffened ordinary steel specimen WP-NS [15] (b).
Jmse 11 00842 g019
Figure 20. Ultimate capacity for SP-NS and WP-NS [15] as a function of yield strength (a), resting volume (b), and plate slenderness ratio (c).
Jmse 11 00842 g020
Figure 21. Ultimate axial force as a function of DoO (a) and trend of the capacity difference for SP-NS, * WP-NS of [15] and * SP-HTS of [18], w o ∈ [0,3] mm (b).
Jmse 11 00842 g021
Table 1. Structural configurations of perforated stiffened plates.
Specimen IDDoO %nr, mm w o ,   mm tp, mmts, mm
SP-NS1-400 04.004.00
SP-NS2-316.8024102 downward
SP-NS3-4817.328 downward
SP-NS4-2424.500
SP-NS5-228.302413.002 downward4.004.00
SP-NS5-32413.007 downward
SP-NS6-2822.520
SP-NS7-2431.852 downward
SP-NS8-1626.000
SP-NS9-342.9024168 downward4.004.00
SP-NS10-3827.710
Table 2. Mechanical properties of analysed SP-NS specimens.
Specimen
ID
DoD, %Modulus of Elasticity E, GPaTensile Strength
σTS, MPa
Yield Stress
σYS, MPa
Total Uniform
Elongation TE, %
Hardening
Parameter KA, MPa
SP-NS11.1119639923522516
Table 3. Comparison between ** SP-NS and * SP-HTS [18].
DoO, %Specimen IDn w o ,   mm Fu, kNFu, HTS/Fu, NSσy, HTS σy, NSβHTSNS
16.80** SP-NS3-48−857.192.952.941.70
* SP-HTS3-20168.81
** SP-NS4-24082.282.37
* SP-HTS4-3−3195.34
28.30** SP-NS6-28076.871.77
* SP-HTS6-30136.05
** SP-NS7-24−259.191.71
* SP-HTS7-32101.21
42.90** SP-NS9-324−855.831.73
* SP-HTS9-2196.85
** SP-NS10-48074.341.55
* SP-HTS10-2−3115.06
* Published experimental results for high-tensile steel-stiffened plates by [18] SP-HTS; ** current experimental results for ordinary steel-stiffened plates SP-NS.
Table 4. Comparison between ** SP-NS and * WP-NS [15].
DoO, %Specimen IDn w o ,   mm Fu, kNFu, SP/Fu, WPσy, SPy, WPβSPWP
0** SP-NS1-400156.863.7410.94
* P041.92
16.80** SP-NS2-324−291.45.641.030.71
* WP2-1016.21
** SP-NS3-48−857.196.201.040.66
* WP3-109.22
28.30** SP-NS5-224−282.1871.461.320.39
* WP5-101.15
** SP-NS6-28076.8768.881.290.40
* WP6-121.1
42.90** SP-NS9-324−855.8364.921.140.52
* WP9-100.86
** SP-NS10-48074.34177.001.250.43
* WP10-420.42
* Published experimental results for high-tensile steel-stiffened plates by [15] WP-NS; ** current experimental results for ordinary steel-stiffened plates SP-NS.
Disclaimer/Publisher’s Note: The statements, opinions and data contained in all publications are solely those of the individual author(s) and contributor(s) and not of MDPI and/or the editor(s). MDPI and/or the editor(s) disclaim responsibility for any injury to people or property resulting from any ideas, methods, instructions or products referred to in the content.

