Article

Development and Application of a GIS for Identifying Areas for Ocean Energy Deployment in Irish and Western UK Waters

MaREI Centre for Marine and Renewable Energy, Environmental Research Institute, University College Cork, P43 C573 Cork, Ireland
*
Author to whom correspondence should be addressed.
J. Mar. Sci. Eng. 2023, 11(4), 826; https://doi.org/10.3390/jmse11040826
Submission received: 16 March 2023 / Revised: 9 April 2023 / Accepted: 11 April 2023 / Published: 13 April 2023
(This article belongs to the Special Issue Changes of the Coastal Zones Due to Climate Change)

Abstract

:
Ireland and the UK possess vast ocean energy resources within their respective maritime areas. However, not all offshore areas are suitable for deployment of ocean energy devices. This article describes the development of a multitude of geospatial data relating to ocean energy site suitability, as well as a Web-GIS tool for hosting and performing analysis on this data. A validation of wave, water depth and seabed character data used in the study revealed good correlation between modelled and in situ data. The data is mapped, and the spatial patterns are discussed with relevance to ORE sector implications. A site selection model, which included much of this data, was developed for this study and the Web-GIS tool. A survey conducted with ocean energy technology developers revealed their desired site criteria. The responses were applied in a case study using the site selection model to uncover potential and optimum areas for deployment of both wave and tidal energy devices. The results reveal extensive areas of the Atlantic Ocean and Celtic Sea appropriate for wave energy deployment and less extensive areas for tidal energy deployment, in the Irish Sea and Inner Seas off the West Coast of Scotland.

1. Introduction

With climate change becoming a major concern across Europe, the UK and Ireland are amongst several nations that have pledged to achieve net-zero carbon emissions by 2050. Energy production and its use are now understood to be responsible for 75% of total greenhouse gas emissions in Europe [1], so naturally, the decarbonisation of this sector is a priority in reaching these ambitious targets. As island nations, with enormous maritime areas, offshore is a logical place to look for answers in both countries. Forming part of the broader Offshore Renewable Energy (ORE) sector, ocean energy devices turn the energy from moving water into electricity which can power society’s energy needs onshore via underwater cables. However, not all offshore areas are suitable for deploying ocean energy devices. Site selection needs to consider several core geospatial criteria to filter out unsuitable sites. Other, less critical criteria may also need consideration before deciding on whether site conditions are optimum for deployment.
A wide range of factors must be considered when planning where to deploy ORE infrastructure. These can be technical, economic, environmental or social acceptance related [2]. All are predominantly spatial in nature, thus promoting the suitability of GIS for the assessment. GIS has played a hugely significant role in energy exploration in recent decades, increasingly so for renewable energy. Some work has focused exclusively on the exploration of the resources [3,4], including offshore options [5,6]. Others apply additional criteria to identify suitable sites for both land-based [7,8,9] and offshore [10,11] renewable energy infrastructure. Many studies have adopted various criteria and methods to conduct on-site identification for ORE in recent years [12,13,14,15], including for wave energy [16,17,18] and tidal energy [19,20,21]. However, a thorough multi-criteria site suitability analysis for wave and tidal energy for the region of interest (see Section 2.1) is lacking. Furthermore, ORE site selection remains an intricate procedure, as the perceived appropriate weighting and number of inputs (along with their associated values and meaning) vary considerably between stakeholders [22,23,24].
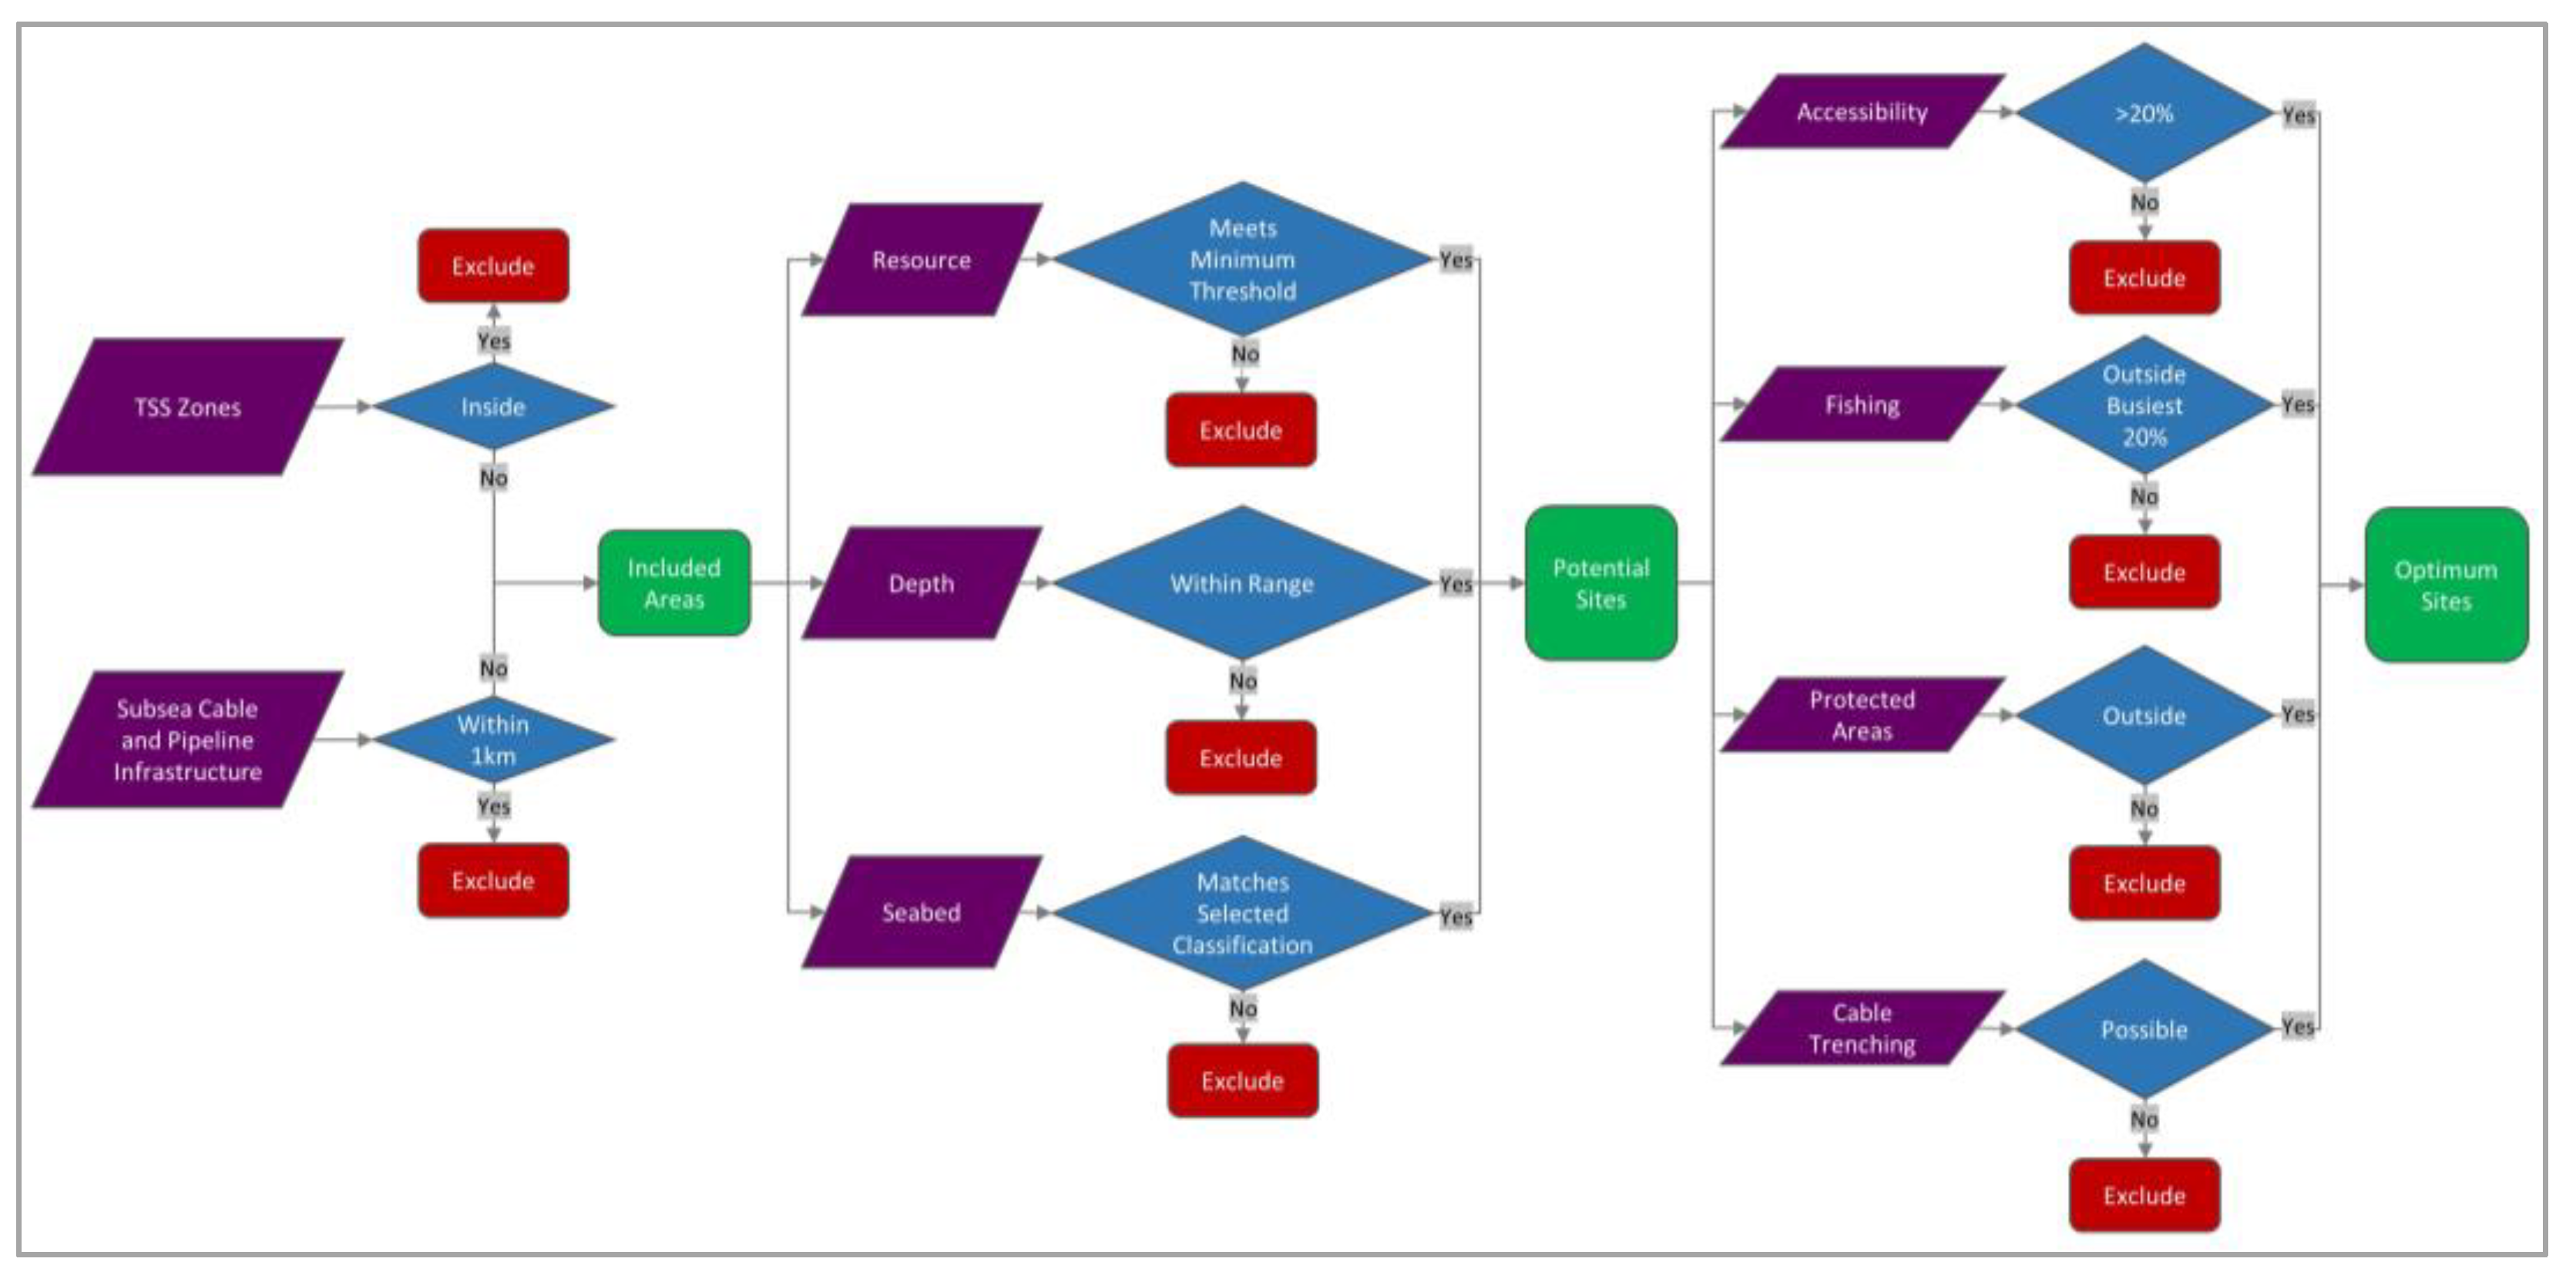
A study of GIS criteria for offshore wind energy noted that the number of parameters feeding site selection could vary between 2 and 14, with a mean of 7 [25]. However, some of these may not necessarily be hard constraints. For example, the environment (i.e., protected areas) may rightly be considered pertinent to the appropriate selection of a site for ORE deployment, this does not mean that such infrastructure cannot be placed within protected areas (such as SACs, SPAs and MCZs). Therefore, it is best not to exclude such areas from development consideration; instead, the user should be made aware that the area is situated within a protected area which will likely have implications at the planning and consenting stage, as per the EU Habitats Directive [26]. The varying perceptions of appropriate input criteria and their associated meanings promotes the merit of interactive web-based GIS tools for facilitating instantaneous user input and flexibility on consideration of relevant criteria.
The recent growth of such powerful online GIS applications, collectively known as Web-GIS, has enhanced the implementation of GIS worldwide, and many examples of these implementations have been examined in detail [27]. Web-GIS tools are particularly effective for sharing common information to a global audience. This concept combines the advantages of GIS with those of the internet to enable easier accessibility, flexibility, organisation and use of a multitude of criteria related to a specific sector, which this paper will demonstrate for ocean energy.
Web-GIS tools relating to coastal and marine matters are referred to as Coastal Web Atlases (CWAs) [28]. Since its foundation in 2008, the International Coastal Atlas Network (ICAN) has encouraged common standards to be applied to CWAs, typically comprising a map area, legends and tools that enable the marine/coastal data to be visualised and queried. Existing CWAs relating to renewable energy have been examined in detail [29], including the Wales Marine Planning Portal [30] and Ireland’s Marine Renewable Energy Atlas [31], which were particularly relevant and helpful to this work. However, the study also revealed the distinct lack of an open-access GIS tool geared to ocean energy applications, particularly site selection and project feasibility analysis.
In this context, the aim of the research was to develop an open-access CWA bespoke to ocean energy applications, incorporating both site selection and project feasibility analysis functionality. The design and development of the CWA would adhere to the standards set out by ICAN. While this article details the elements that are more relevant to site selection, a future article will detail the aspects relating to project feasibility analysis. A wide range of geospatial data/layers are described in this article which relate to ocean energy site identification in Irish and western UK waters. These data have been developed for the CWA and will be made openly accessible via the tool upon its release. Furthermore, analysis and geoprocessing of this data has been performed in a case study to identify potential and optimum sites within the study area for wave and tidal energy project deployment. Where possible, in situ validation of data that are more influential to site selection has been performed, with the accuracy reported here. The CWA, and the data therein, was developed as part of the Selkie project, a cross-border project aiming to boost marine energy in Wales and Ireland by creating a set of multi-use technology, engineering and operation tools, templates, standards and models for use across this growing sector.

2. Materials and Methods

The Selkie CWA contains over eighty layers representing various constraints, restrictions and opportunities at play in determining the suitability of a site for ocean energy deployment. Site selection requires a high volume of data and many different site selection methods, weighting options and input parameters (along with their associated values) are available. Selkie uses core site selection criteria (energy resource, depth range, seabed, subsea pipeline/cable routes and marine traffic) in the site selection model to identify potential sites. In this article, a case study based on industry survey responses reveals such sites. In the CWA, the user can adjust the input values for these criteria and switch on and off a range of additional layers developed for the tool in further stages of the analysis via the layer list. This functionality avoids clustering and is made possible by the interactive web-based design of the tool. The layers which are more pertinent to site suitability are described herein. All layers were projected to the WGS84 geographic reference system. The methodological steps taken for this study are described in this section and are summarised below in Figure 1.

2.1. Study Area

As the Selkie project was specifically focused on Ireland and Wales, the study area needed to include at least the Irish and Welsh territorial seas. However, downloading the geospatial data is generally performed using geographical subsets defined by a bounding box and with geographic coordinates defining the four limits. The coordinates used to define the Selkie CWA study area were 12° W–2° W and 56° N–50° N, as shown in Figure 2. This is comprehensive in the project’s context, covering the entirety of the Irish and Welsh territorial seas (i.e., to the 12 NM limit), the whole of the Irish Sea, the Bristol Channel, the North Channel, the Inner Seas off the West Coast of Scotland, much of the Celtic Sea and the Northeast Atlantic off Ireland (Figure 2). The area extends to approximately 100 km off the Irish west coast at its closest point.

2.2. Data Acquisition

2.2.1. Wave Data

A 20-year hindcast of significant wave height and wave period data for the study area was required. Such data is freely available via the Copernicus Marine Service (CMS) website [32]. Two similar products within this website provide coverage for the study area. The Atlantic-Iberian Biscay Irish—Ocean Wave Reanalysis product covers the extents 19° W–5° W; 56° N–26° N [33], and the Atlantic-European North-West Shelf- Wave Physics Reanalysis product covers the extents of 16° W–13° W; 62.75° N–46° N [34]. Further details of the data downloaded from each product are provided in Table 1.
Computation of each wave layer used the higher resolution Atlantic- European North-West Shelf- Wave Physics Reanalysis product. The variables that affect wave energy are the significant wave height and wave period. Based on the 20-year hindcast of these variables, a layer representing the seasonal average significant wave height (Hs) and wave energy period (Te) values were computed for each of the four seasons. These layers can be found in Figure A1 and Figure A2 of Appendix A. Furthermore, using this same hindcast of Hs and Te, a theoretical Mean Annual Wave Power (kW/m) layer was calculated using Equation (1) [35]:
P = 0.49   H s   T e
where P is the power per unit width of the wave crest. Individual layers for the mean wave power in each season were also produced. All wave power layers appear under the Ocean Energy Resources group layer in the CWA.
Along with the average significant wave heights, the 1-year, 10-year, 50-year and 100-year return period significant wave heights are included as layers in the Selkie tool. Since hourly data was necessary, the Atlantic -Iberian Biscay Irish–Ocean Wave Reanalysis was used to obtain the time series of wave heights using Extreme Value Analysis. Extrema calculations used the Python pyextremes library [36].

2.2.2. Wind Data

Hourly wind data is available from the Copernicus ERA5 database [37]. As with the wave data, this was downloaded in the form of geographic and temporally subset netCDF files. Table 2 provides further details of the data downloaded. This wind data was used in combination with the wave data to produce accessibility layers, as described in greater detail in Section 2.2.3.

2.2.3. Accessibility Layers—Based on Wind and Wave Data

Environmental factors, such as wave heights and wind speeds, determine how accessible a site is for installation, operation and maintenance activities. To map the accessibility of the study area, the Selkie CWA applies maximum limits of 2 m Hs with 15 m/s wind speed to represent the operational limits of a HLV (Heavy Lift Vessel) and 1.5 m Hs with 20 m/s wind speed to represent the operational limits of a CTV (Crew Transfer Vessel). These thresholds are based on the Selkie Logistics O&M model [38]. The layers show the percentage of time throughout the year that the Hs (Atlantic -Iberian Biscay Irish—Ocean Wave Reanalysis) and wind speed (ERA5) are below these limits.

2.2.4. Tidal Data

The ocean current data used for the Oceanography and Ocean Energy Resources layer groups were obtained from the Irish Marine Institute [39]. Their ROMS hydrodynamic model (Regional Ocean Modelling System) covers the entire Selkie study area. Details of the product are provided in Table 3 [39]. Once downloaded, the data were processed in MATLAB to create the layers described in Table 4. Only the Mean peak current velocity (m/s) layer is included in the results, as this was the output chosen to feed the tidal energy site selection model. However, all current speed layers can be viewed in Figure A3 of Appendix A.
The theoretical tidal power density layers were also calculated using this data with Equation (2) [40]:
P = 0.5   ρ   v 3
where ρ is the density of seawater (1025 kg/m3), and v is the current velocity (m/s). These layers are detailed in Table 5 and appear under the Ocean Energy Resources group layer in the CWA as well as in Figure A4 of Appendix A.

2.2.5. Bathymetry

The harmonised EMODnet Digital Terrain Model (DTM), which covers the European sea regions (36° W–43° E; 90° N–15° N), was downloaded in raster format to the geographic extent of the Selkie study area. The 2016 DTM release was the latest available version at the time of download, and its spatial resolution is approximately 115 m. The product has been generated from selected bathymetric survey data sets, composite DTMs and satellite-derived bathymetry products, whilst any data gaps are filled by integration of GEBCO Digital Bathymetry [41,42]. The DTM raster data were pre-processed to make it presentable and fit to share as a web layer that can be integrated into the CWA. This involved masking out areas >300 m deep (beyond the edge of the continental shelf, at which point ORE infrastructure is unlikely to be deployed) and symbolising appropriately for user legibility. A depth contour layer was also developed (selecting a 10 m contour interval) to make it clear what the depth range is at a given area of interest.

2.2.6. Seabed Characteristics

EMODnet also provides seabed substrate data products for the European sea regions comprising multiple datasets at various scales and confidence levels [43]. The data available for the Selkie study area included that at resolutions of 1:50,000, 1:100,000 and 1:250,000. These datasets are updated regularly and have varying levels of confidence (Table 6).
Some parts of the study area, primarily areas off the west coast of Ireland, have no seabed substrate data (Figure 3). The approach taken to harmonise the various datasets was to download the seabed substrate data from the EMODnet Seabed Substrate web page at all three scales, and then to combine the multiple datasets into a single, new output dataset. During this process, due care was taken to use data with the best possible resolution (and confidence level) where possible.
After excluding areas with no data, the 7-point Folk grain size classification system (Folk-7 Scale) was used to map the seabed substrate data in the tool; this was sufficient to inform the development of ORE infrastructure [44]. This classification system divides the various seabed substrate types into the following seven categories:
  • Rock and Boulders
  • Coarse Sediment (Gravel >= 80% (or Gravel >= 5% and Sand >= 90%)
  • Mixed Sediment (Mud 95–10%; Sand < 90%; Gravel >= 5%)
  • Mud (Mud >= 90%; Sand < 10%; Gravel < 5%)
  • Sandy Mud (Mud 50–90%; Sand 10–50%; Gravel < 5%)
  • Muddy Sand (Mud 10–50%; Sand 50–90%; Gravel < 5%)
  • Sand (Mud < 10%; Sand >= 90%; Gravel < 5%)
Following interest from industry, this same dataset was used to map the areas where excavation to shore was and was not possible. This mapping indicates areas where an unobstructed excavatable seabed type (coarse substrate, mixed sediment, sand, muddy sand, sandy mud and mud) continued right up to within 1 km of the coast, information which is apparently highly influential to wave energy site optimisation. This classification was achieved by merging these excavatable seabed types into one feature and extracting the areas where it intersected a 1 km buffer of the coast. The 1 km buffer was used instead of the actual coastline as the seabed dataset did not extend right up to the coast in some areas.

2.2.7. Marine Traffic

TSS act as corridors for large ships, similar to motorways for road vehicles. They are defined by the International Maritime Office (IMO) and are policed at a local level by the Coast Guard. Larger vessels are required to strictly adhere to the TSS, but they are permitted to move freely between them (i.e., from one to the next). As open-access TSS data could not be found, the TSS were traced using Admiralty chart data and then clipped to the extent of the Selkie study area.
To reveal how closely ships adhere to the TSS zones, and since fishing vessels are not required to adhere to them, layers depicting vessel density were also developed using Automatic Identification System (AIS) data. The EMODnet Human Activities web page [45] facilitates access to geographic data on human activities performed in EU waters, one theme of which is vessel density. The vessel density data are based on the AIS, which ships use regularly to report their geographic position. The data are open access and can be viewed on an interactive map of Europe [46]. The spatial resolution of the data is 1 km by 1 km, with each grid square expressing the vessel density in hours per km2 per month. It can be separated by vessel type and downloaded in GeoTIFF format.
For the Selkie tool, a three-year hindcast of this data was downloaded for cargo and tanker vessels together to represent general shipping. Data were downloaded for fishing vessels separately due to the known importance of considering the fishing industry when siting ORE infrastructure. At the time of download, the yearly average values were available for 2017, 2018 and 2019; these were downloaded separately as individual GeoTIFF files. They were then uploaded to ArcGIS Pro and run through a purpose-built model to complete the geoprocessing required for the data to be meaningfully displayed for both general cargo traffic (Figure 4) and for only fishing traffic (Figure 5).
The resulting marine-traffic layers were symbolised to show the 1% and 1.5% busiest areas (in the Irish and UK EEZ) for shipping and the 10% and 20% busiest areas (in the Irish and UK EEZ) in terms of fishing-vessel activity. These thresholds were chosen based on an interview study of offshore development zones [47]. In that study, the majority of respondents agreed that including the TSS as a hard constraint is more important than including the AIS data, as ships need to adhere strictly to the TSS; the AIS data only indicates where they have been over a given period. The majority of respondents also agreed that the 20% busiest fishing areas should be regarded as a constraint to ORE development, but that this should only be guidance as thorough and delicate consultation with the fishing communities is required on a project-by-project basis.

2.2.8. Subsea Cables

Kingfisher Information Service—Offshore Renewable & Cable Awareness (KIS-ORCA) maintains an online database of cable routes for northwestern Europe [48]. From their downloads page, GIS data on this can be obtained. However, subsea pipelines (oil and gas) are not included in this database. These needed to be traced from admiralty chart data, following the same procedure used for the creation of the TSS layer. A 1 km buffer was created around these cables and pipelines and was set as a hard constraint (exclusion zone) in the site selection analysis.

2.2.9. Protected Areas

There are four general categories of protected areas at sea; special areas of conservation (SACs), special protected areas (SPAs), marine protected areas (MPAs) and marine conservation zones (MCZs). Each has a slightly different meaning, but all have the collective aim of conserving biodiversity by protecting the seabed and a wide range of habitats and species of animals and plants. The data for Irish waters were obtained from Ireland’s Open Data Portal [49] and the data for UK waters were obtained from the Joint Nature Conservation Committee (JNCC) [50]. Each one of these has been included in the Selkie CWA as individual layers, and also as a collective layer representing all four categories.

2.3. The Interface and Site Identification

All of the aforementioned data, and more, are hosted online and can be accessed via the Selkie CWA. In order to attract and encourage potential users to engage with this tool, open accessibility and user-friendliness were the primary goals in developing the interface. A web-based approach is most suitable to achieve these goals as it eliminates the requirement for the user to download software on their device. A web-based tool also offers flexible access across device types, seamless updates for the user (no maintenance) and secure, centralised data storage. After considering several options, it was decided that the ArcGIS API for JavaScript would best assist the development of the tool. ESRI (Environmental Systems Research Institute) is an international supplier of GIS software. Their ArcGIS API for JavaScript helps developers to build user-interactive GIS web apps [51,52]. The tool was written in HTML, CSS and JavaScript using the Visual Studio Code Integrated Developer Environment (IDE), a code editor for building and debugging modern web-based applications [53].
A header for the tool consists of a link to the project homepage via the project logo, a title for the web app, a link to an introductory webpage (including an introductory video), a link to the tool description webpage, a help link to a demonstrational video showing the user how to use the tool (giving an example scenario), a contact information link and a print screen button (for printing analysis results). Below the header is the web atlas (Figure 6), with Esri’s Ocean Basemap zoomed into the extent of the Selkie study region by default. Some useful widgets were also coded into the tool, including a measuring function (allowing for the measurement of distances and areas), a draw function (allowing the user to create their own points, lines or polygons) and a data upload button (allowing the user to upload their own GIS data). Another important function within the interface is the layer list. The layer list was developed using a bespoke ArcGIS JavaScript API function and provides access to all layers within the tool, the more salient of which are shown in Section 3 of this article.
The most novel function developed for the interface was the ‘Site Selection Aid’. Without any prior knowledge or experience of GIS, this allows the user to very easily input some core optimal site criteria to reveal potential sites on the atlas for wave or tidal energy deployment. This site-selection feature uses a purpose-built JavaScript function that identifies all the values input by the user for each site selection criteria (SQL statement) and then displays the areas that meet those criteria on the CWA (‘response’ function). An ArcGIS Pro version of the model was also built for the purpose of creating more aesthetically appealing maps to include in this article.
A survey was sent out to wave and tidal energy technology developers to determine appropriate values for running the site selection model. This included minimum theoretical resource values, desired depth range and desired seabed character. These values were then used in a case study to reveal potential deployment sites. TSS zones and areas within a 1 km buffer zone of subsea cables were excluded from consideration. The outputs revealed potentially suitable areas for wave and tidal energy deployment for different technology types. Table 7, Table 8, Table 9 and Table 10 list the input criteria and values to identify the potential sites for wave and tidal energy respectively, and Figure 7 illustrates the associated workflow. Several additional criteria can be overlaid to assess additional site conditions. For the purposes of this case study, the site selection model was adjusted to include accessibility, the busiest fishing 20% areas, protected areas and excavation to shore; the input values for these are given in Table 9 for wave energy and Table 10 for tidal energy. Considering these additional variables allowed for optimum sites to be identified, a process which can be replicated in the Selkie CWA by using the layer list to switch on different criteria.

2.4. In Situ Validation

A validation of the results was performed using in situ data for wave height, wave period, water depth and seabed character within the areas deemed suitable in the case study. The in situ wave data for Ireland were derived from the Marine Institute [54], and the in situ wave data for the UK were derived from the National Network of Regional Coastal Monitoring Programmes (NNRCMP) [55]. The in situ sediment data were derived from the Marine Institute [56] and were gathered on board the RV Celtic Voyager or the RV Celtic Explorer. These data give the depth and seabed character at several points for both Ireland and UK. The wave data validation procedure was more complex than that of the seabed validation and was performed in MATLAB using a purpose-built script that took only the data that were closest in space and time to each other while also being no more than 30 min apart. The bias, root mean square error (RMSE), scatter index (SI) and correlation coefficient (R) were calculated for each of the two products used.

2.5. Methodological Limitations

The method chosen for identifying the suitable sites in this case study is one of many and is by no means a panacea for site identification. There are many other methods and criteria that can be chosen for such analysis, and these have been cited in Section 1. The clear-cut approach taken here was chosen to directly reflect the industry survey responses and apply some of the new geospatial data created for the Selkie CWA. Although substantial work was involved in creating this site suitability analysis, it is important to remember that the approach is based purely on input from the technology developers and may not be representative of other technologies. Nevertheless, this analysis can be easily replicated using alternative user defined inputs in the publicly available web version of the model, the CWA. In terms of the validation, it would have been better to also perform in situ validation of the current speeds, but this could not be achieved due to a lack of available in situ sources on this parameter.

3. Results

The results of the case study are presented here as maps. In Section 3.1, the results of mapping each of the individual criteria pertinent to ocean energy site selection are shown, and their general spatial patterns described. Section 3.2 reveals the results of bringing these criteria together in the site selection model to show potential and optimum sites for deployment based on the aforementioned criteria. Section 3.3 presents the results of the validation procedure.

3.1. Individual GIS Layers

3.1.1. Theoretical Wave Power

The area with the highest theoretical annual wave power resource is the North Atlantic off the west coast of Ireland, and the area with the lowest theoretical resource is the Irish Sea (Figure 8). The winter season produces the highest resource level, and summer produces the lowest (Figure 9). Focusing on the annual resource first, Figure 8 shows that mean annual wave power values of up to 60 kW/m are present in the North Atlantic just off the west coast of Ireland, and 70 kW/m further offshore to the northwest. In the Celtic Sea, approximate values range from 40 kW/m in the west, south of Cork, to 25 kW/m further east, southwest of Wales. A slight exception to this is the presence of lower values sheltered along the southeast coast of Ireland. Approximate values in the Irish Sea range from 25 kW/m in the south to less than 5 kW/m further north.
Figure 9 illustrates that mean theoretical wave power values in winter can reach over 110 kW/m in the North Atlantic just off the west coast of Ireland, and over 130 kW/m further offshore. In contrast, values in summer can fall below 20 kW/m in the same area and below 10 kW/m in the Celtic Sea; in winter, values range from 90 kW/m in the west to just over 30 kW/m further northeast. When spring and autumn are compared, it is clear that autumn is a slightly more productive season with values over 60 kW/m in the North Atlantic during this season, compared to just over 50 kW/m in the same area during spring. The difference in values between spring and autumn is even less pronounced in the Celtic Sea, with those greater than 20 kW/m only extending slightly further east towards Pembrokeshire (southwest Wales) in autumn compared to spring. Throughout the seasons, very little power is available in the Irish Sea, with values not exceeding 20 kW/m, even in winter.

3.1.2. Extreme Wave Characteristics

The extreme wave heights follow a similar spatial pattern to that of the mean theoretical wave power, with the highest values in the Atlantic off the northwest and southwest coasts of Ireland. Figure 10 shows the 50-year return period significant wave height, revealing values more than 15 m throughout these areas. Maximum extreme values in the Celtic Sea are ≤13 m and are ≤11 m in the Irish Sea. In the North Channel and Inner Seas off the West Coast of Scotland, maximum extremes are ≤7 m and ≤13 m, respectively.

3.1.3. Accessibility

Figure 11 shows the percentage accessibility of sites for the entire year when limits of Hs 1.5 m and wind speed 20 m/s are applied; these are typical limitations for a CTV. Since the weather window availability is calculated based on the wave and wind data, it is unsurprising that accessibility levels are lower in the Atlantic. The least accessible areas are far off the northwest coast of Ireland, where values go below 10%. Most areas off the west coast have values less than 20%. Closer to the coast, the accessibility in many bays ranges between 90 and 100%. Values in the Celtic Sea range from 30 to 60%, whilst the vast majority of the Irish Sea has greater than 60% accessibility. Figure 12 shows the percentage accessibility of sites for the entire year when limits of Hs 2 m and wind speed 15 m/s are applied, which are typical limitations for an HLV. The spatial pattern follows that of Figure 11, but with lower values. These generally range from 30 to 50% in the Atlantic, 40 to 60% in the Celtic Sea, and 60 to 100% in the Irish Sea.

3.1.4. Tidal Characteristics

The metric that is most commonly used to identify areas with an adequate tidal energy resource is the mean peak velocity on spring tides (m/s), with minimum threshold values in the technology developer survey responses ranging from 1 m/s to 2.5 m/s. Figure 13 shows that the most promising sea areas for tidal energy based on this metric are the Irish Sea, North Channel and Inner Seas off the West Coast of Scotland. The highest values observed in the study area are west of the Isle of Islay (Inner Seas off the West Coast of Scotland). This is the only place where values exceed 2 m/s. Values above 1.5 m/s are observed in the North Channel, both southeast of Rathlin Island and off the southwest tip of the Mull of Kintyre. In the Irish Sea, values exceeding this 1.5 m/s threshold are only found along the Welsh coast in two areas, just west of Holy Island (Anglesey) and northwest of Ramsey Island (Pembrokeshire). Values exceeding 1 m/s are widespread in each of the aforementioned sea areas and in the Bristol Channel. For the Republic of Ireland, areas northeast of Inishowen, east of Wicklow Head and east of Rosslare have a tidal resource exceeding this threshold.

3.1.5. Water Depth and Seabed Character

The water depth within most of the study area is below 300 m (Figure 14). This is the maximum depth threshold for consideration of deployment identified in the survey responses. This depth threshold is only exceeded at the edge of the continental shelf off the west coast of Ireland. Depths in the Celtic Sea and the Irish Sea do not appear to exceed 160 m. However, further north in the channel, between Northern Ireland and Scotland, the depths appear to exceed 200 m in places. The depth drops sharply north of Antrim (Northern Ireland) from 0 to as much as 240 m.
In terms of the seabed character, Figure 15 shows the extent of each classification based on the Folk-7 scale (given in Section 2.2.6). A higher level of detail is noticeable in areas along the south coast of Ireland. The level of detail in areas further offshore, in the Celtic Sea and in the Atlantic Ocean off the west coast of Ireland, is limited in terms of availability and spatial resolution. Most of the nearshore areas in the study area are mapped; exceptions include the west coast of Ireland (west of Galway and Mayo), parts of the northwest coast of Ireland (west of Donegal), parts of the southwest coast of Ireland (off Kerry) and an area off the northwest coast of England (in the vicinity of Lancashire). The available data show that the nearshore areas along the Irish coast, especially south and west, are more associated with hard substrata than the UK coast, which is relevant in terms of both device deployment and cable trenching to shore.
A more excavatable seabed type is often preferred for the deployment of devices (particularly for wave energy) and is necessary for trenching cable routes. In Figure 16, the yellow represents areas where excavating to shore is possible. Barriers to excavation (in light grey) are most noticeable along the south and west coasts of Ireland, as well as the Cornwall and Anglesey coasts in the UK. Nevertheless, several corridors of excavatable seabed that run toward the coast through these barriers of rock or other hard substrata are still evident at these locations. This is clearly visible when zooming in on the data, as shown in Figure 17, which uses the Cork coast as an example. Here, a number of these corridors are evident, e.g., at Bantry Bay and south of Baltimore, Cork Harbour (narrowly) and Youghal.

3.1.6. Marine Traffic

The layer resulting from the AIS density modelling for general shipping traffic reveals the Irish Sea, the eastern Celtic Sea and the North Channel as the busiest locations in the study area (Figure 18). Here, the major shipping lanes that run between Ireland and the UK and south toward mainland Europe are clearly evident. Figure 18 also shows how closely marine traffic adheres to the TSS corridors as set out by the IMO. This makes a good case for excluding these TSS corridors from consideration for ORE deployments. Other notably busy areas include the approaches to Cork Harbour, Galway, the Shannon Estuary and Lough Foyle.
The geospatial distribution of the AIS density for fishing traffic is far more chaotic than that of the general shipping traffic, as shown in Figure 19. Nevertheless, concentrated clustering is evident in the northwestern part of the Irish Sea, the Firth of Clyde (Scotland) and in the Celtic Sea surrounding Cornwall. Other busy areas of note include the waters off the south, southwest and northwest coasts of Ireland and west of the Aran Islands (Galway). The approaches to the major fishing ports associated with these busy areas are also clearly evident in the layer, with high densities in the immediate vicinity of Castletwonbere (Cork), Rossaveal (Galway) and Killybegs (Donegal), three of Irelands busiest fishing ports.

3.1.7. Subsea Cables

Figure 20 shows the subsea cable and pipeline infrastructure which runs through the study area, along with a 1 km exclusion buffer. Cable and pipeline infrastructure appears to be dense in the North Channel, Irish Sea and Celtic Sea. In these areas, routes traverse between Ireland and Britain and extend from the coastline out to the existing oil, gas and ORE infrastructure in the Irish Sea, mainly west of Merseyside and Lancashire. Numerous routes also occupy the Celtic Sea, where further links between Ireland and Britain are evident, in addition to further routes that extend from south of Cork to the Kinsale Gas Field. The North Atlantic is sparse in comparison, though some routes, apparently extending west to North America, are evident off the southwest coast of Ireland. Routes are also sparse along Ireland’s west coast, with just two routes; one runs between the Aran Islands and the mainland of Co. Galway, and the other extends west of Co. Mayo to the Corrib Gas Field.

3.1.8. Protected Areas

Figure 21 shows all protected areas in the Selkie study area merged into one continuous layer. It is evident that UK waters have far more extensive coverage than Irish waters. Much of the coverage is close to the coast and inside the 12 M limit (territorial seas); the only exception are off the southwest coasts of Ireland and England. This layer feeds the site selection model as an exclusion for identification of the optimum sites.

3.2. Site Suitability

3.2.1. Wave Energy

Running the site selection model reveals suitable areas for wave energy deployment in the Atlantic, the Celtic Sea and the Inner Seas off the West Coast of Scotland (Figure 22). However, by breaking the layers into technology types, Figure 22a reveals little in the way of potential for OWC deployment in the Celtic Sea. Vast areas off the northwest coast do appear suitable for OWC deployment, even with the additional limitations considered (optimum sites). The area northwest of Mayo is only suitable if the additional limitations are ignored. Further promising areas are evident off the southwest coast, particularly west of Clare, including with the additional limitations applied. This is generally the case with all technology types, though somewhat less so for the point absorber (Figure 22b). This technology type appears to have better potential in the Celtic Sea, when the additional limitations are ignored, it also seems to have better potential far off the southwest and northwest coasts. The attenuator shows even more promise for deployment in the Celtic Sea (Figure 22c). Here, suitable areas for deployment extend right up to the southwest coasts of Wales and England. Areas off the southwest and northwest coast of Ireland also appear suitable for this technology type. Figure 22d shows the areas that have the potential to deploy at least one of the technology types, i.e., where the criteria for all four WEC types have been included. This reveals huge potential for wave energy deployment throughout the Selkie study area in general.

3.2.2. Tidal Energy

The extent of suitable areas for tidal energy deployment is far less than that of wave energy. Figure 23a shows some potential for bottom fixed tidal energy deployment in the North Channel, Inner Seas off the West Coast of Scotland and in the Irish Sea. The Inner Seas off the West Coast of Scotland is the only area where the ≥2 m/s on mean springs threshold is met, just off the Isle of Islay (Scotland). This same area reveals further potential when the 1.5 m/s resource threshold is considered, along with areas southeast of Rathlin Island (Northern Ireland), the southwest tip of the Mull of Kintyre (Scotland) and in the Irish Sea along Welsh coasts, both west of Anglesey and around Ramsey Island. With the 1 m/s threshold considered, areas of the Inner Seas off the West Coast of Scotland, extending right across to Inishowen (Donegal), appear suitable, along with an extensive area between the Isle of Man and Luce Bay (Scotland). It is evident from Figure 23b that suitable areas for floating tidal energy deployment are scarce. A small area west of the Isle of Islay appears when the 1.5 m/s resource threshold is considered. When the 1 m/s threshold is selected, another small area northwest of Inishowen appears, along with a pocket just south of the Mull of Galloway (Scotland). There is not much opportunity for floating tidal energy in the Irish Sea, but there are small, isolated pockets scattered off the east coast of Ireland and west coast of Wales. In terms of optimum sites, consideration of the additional criteria has little impact on deployment prospects for fixed bottom tidal energy in the North Channel and Inner Seas off the West of Scotland (Figure 23c). However, further south in the Irish Sea, it is apparent that the previously noted areas with highest potential (≥1.5 m/s on mean springs) along the Welsh coast are removed when the additional criteria considered. When considering the already limited floating TEC potential within the study area, considering the additional criteria has a minimal effects, other than a decrease in the extent of the isolated pockets noted in the Irish Sea (Figure 23d).

3.3. Validation

Once the suitable areas had been revealed, in situ validation points within those areas were selected for accuracy assessment (Figure 24). Two wave buoys were suitable; one in the North Atlantic named ‘WestWave’ and one in the Celtic Sea named ‘WaveHub’. Four sediment sample points were selected at random, one in each of the four sea areas: the Atlantic (wave), Celtic Sea (wave), Irish Sea (tidal) and Inner Seas off the West Coast of Scotland (wave and tidal).
The results of the wave data validation show strong correlation between the modelled significant wave height and the measured significant wave height (Table 11). The average significant wave height correlation coefficient across the two sites was 0.97 for both models. The RMSE for Product 2 was slightly greater than that of Product 1, which also had the lowest significant wave height bias and SI. The agreement between modelled wave period and observed wave period was slightly lower than that of the significant wave height comparison. Unlike with significant wave height, the models were underestimating wave energy period values as shown with the negative bias values for both products at the WestWave site as well as at the WaveHub site for Product 2. There was little difference in RMSE, SI and R for wave energy period between the two products.
The results of the sediment/depth validation showed that modelled depth was consistently lower than in situ measured depth, but never by more than 4 m (Table 12). The closest comparison was the Atlantic site, where there was a difference of two metres between modelled and measured depth. Modelled seabed character was consistent with that measured at each of the four sites.

4. Discussion

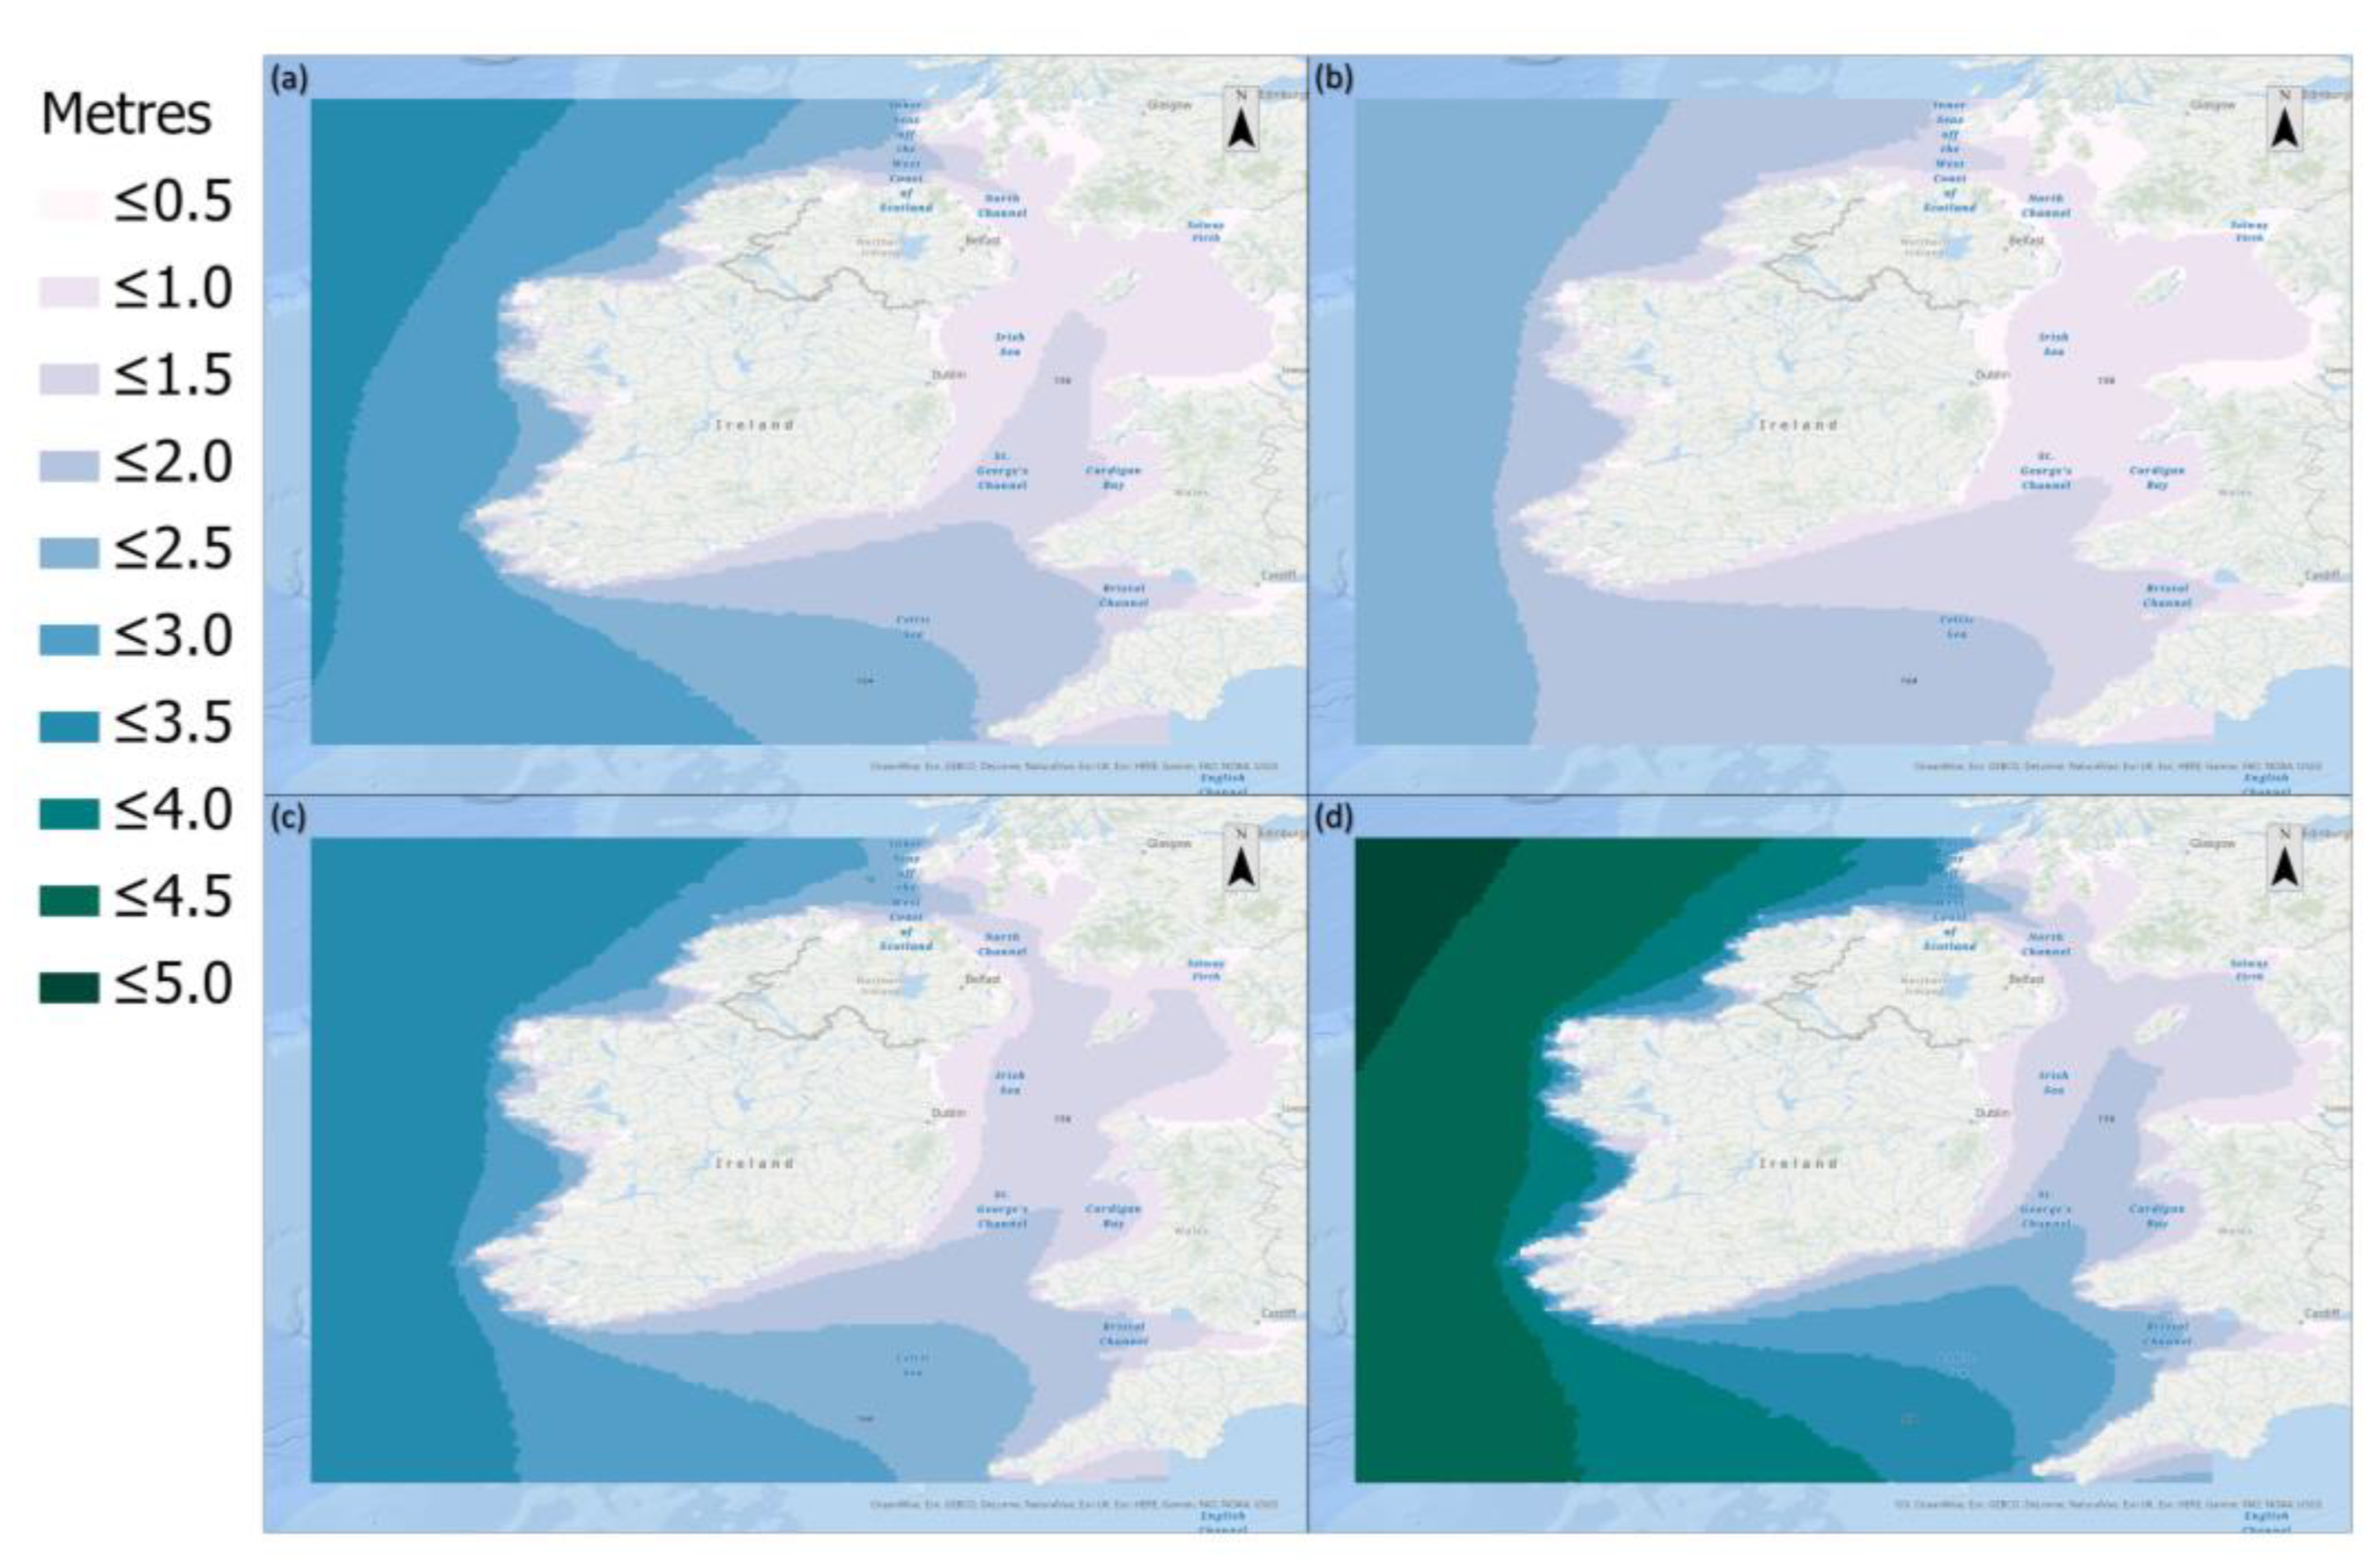
It was expected that the highest wave power in the study area was observed off the west coast of Ireland given its open Atlantic location. The observation, which aligns with previous studies of the resource [57,58,59], further demonstrates the opportunity available for wave energy extraction at this location. Focusing on detail, the highest mean annual values, reaching 70 kW/m off the northwest coast, also match some of the values in previous work [57]. The seasonal observations of the wave climate also correlate with the values and patterns of former studies, with values in winter (most productive season) easily reaching more than 100 kW/m off the west coast of Ireland; studies also show that autumn is a more productive season than spring [57,58]. The much higher resource availability observed in winter compared to summer is also meaningful in that domestic electricity demand is higher in winter; this indicates a positive relationship between demand and supply. However, wave energy devices have operational limits which will need to survive the harshest conditions at sea [60]. As the new extremes data produced for this study show that 50-year return wave heights exceed 15 m throughout the Atlantic area, meaning that the region is also likely to pose a significant risk to both the survivability of such deployments and their operational frequency, considering that maximum operating Hs values can range between 4 and 10 m, depending on the type of WEC [61,62,63,64]. Both technology and project developers will need to give this finding due consideration. The highest extreme values being observed off the northwest and southwest coasts are likely to be associated with the greater depths in these regions off the edge of the continental shelf, meaning there is less energy dissipation due to bottom friction, i.e., along the Rockall Trough and Porcupine Seabight.
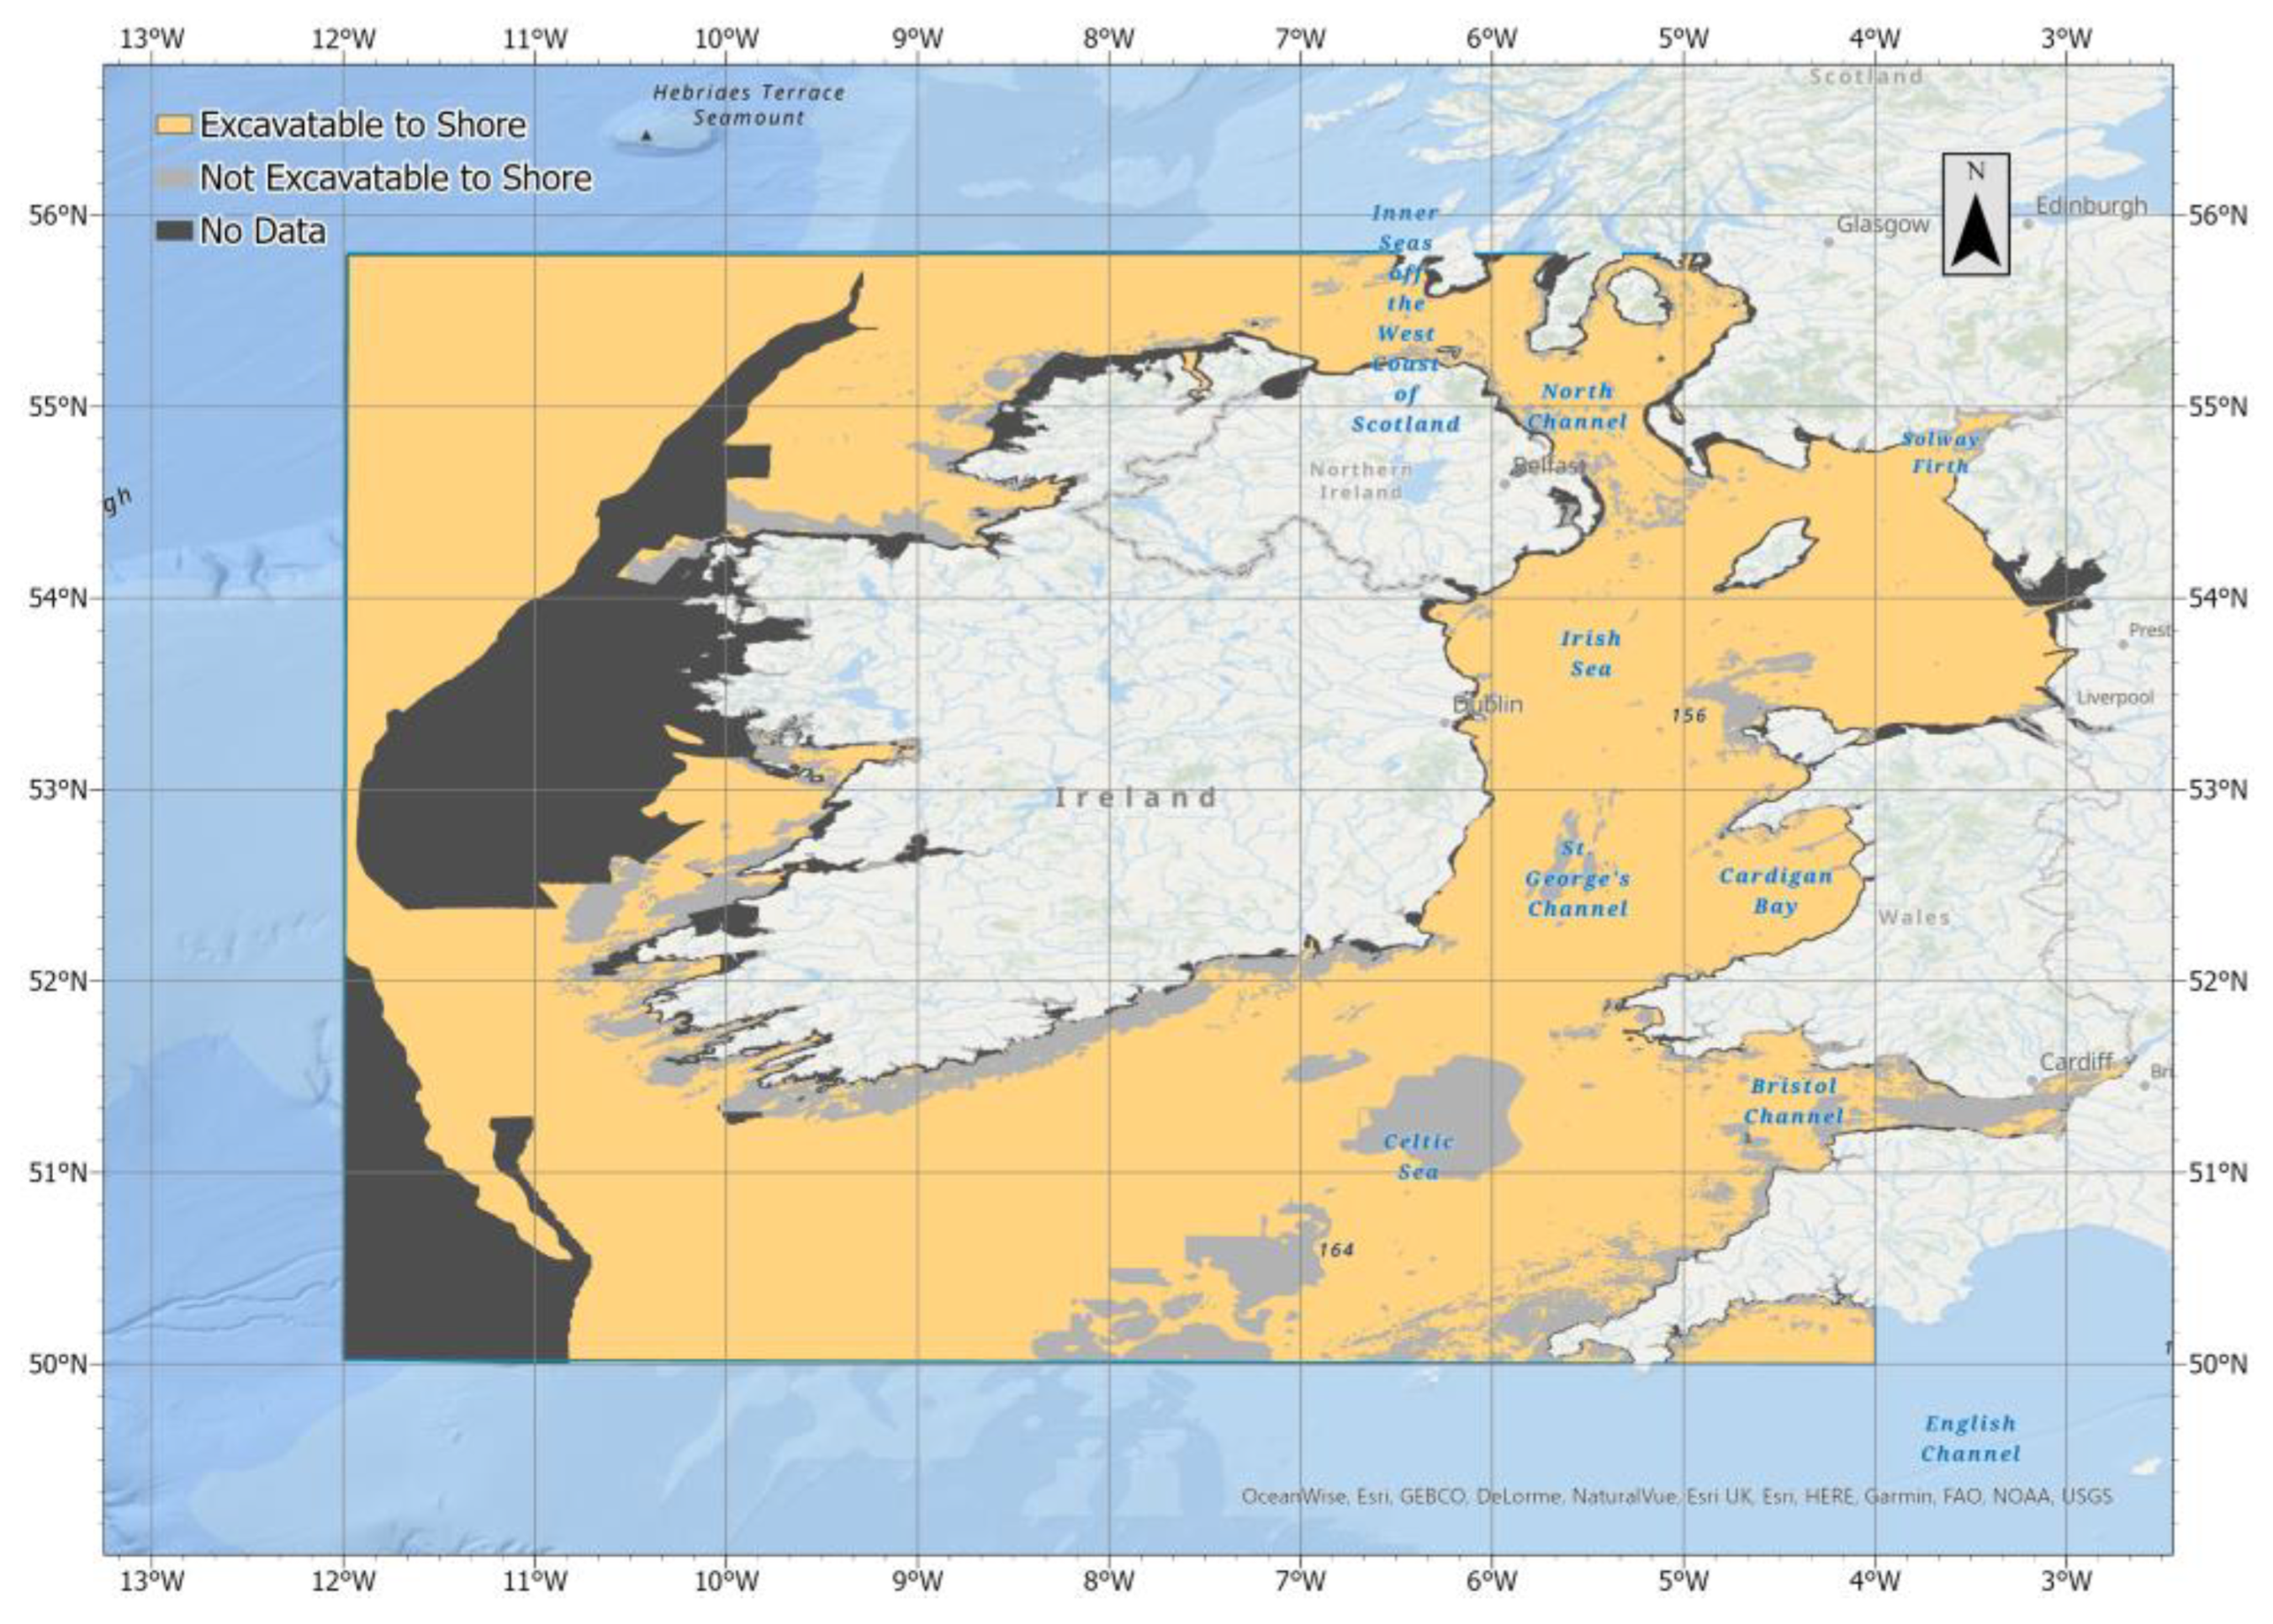
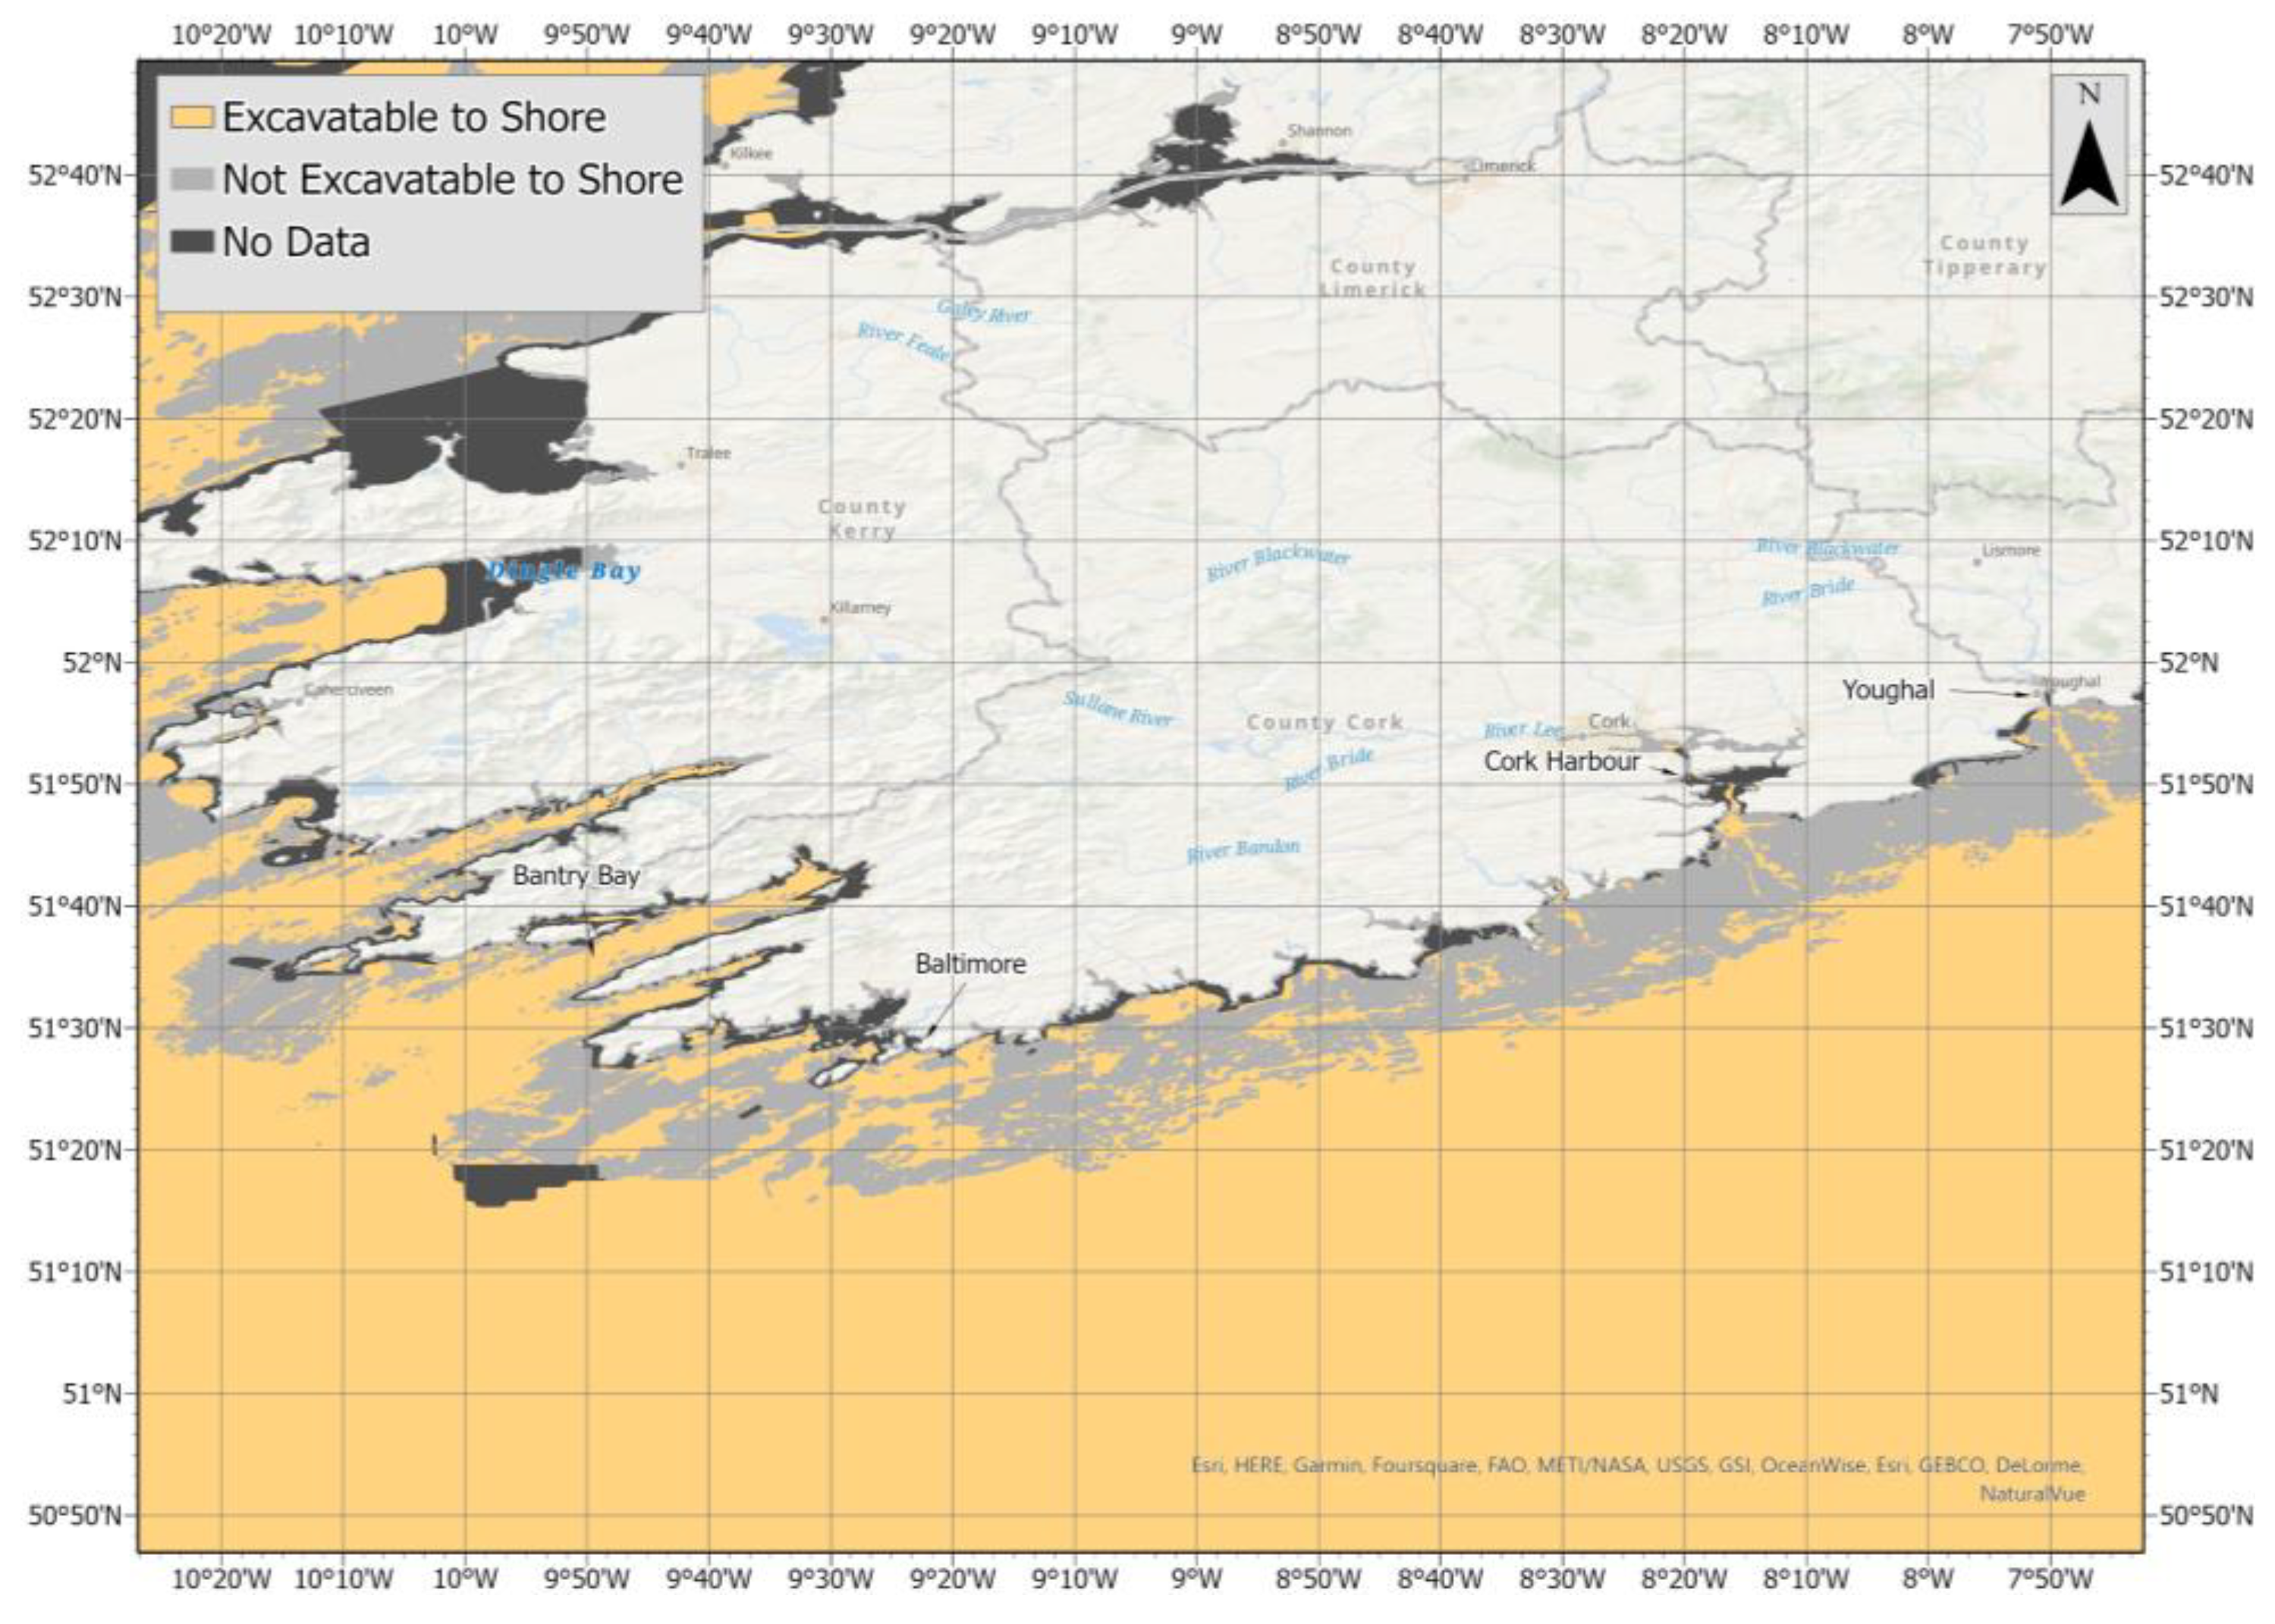
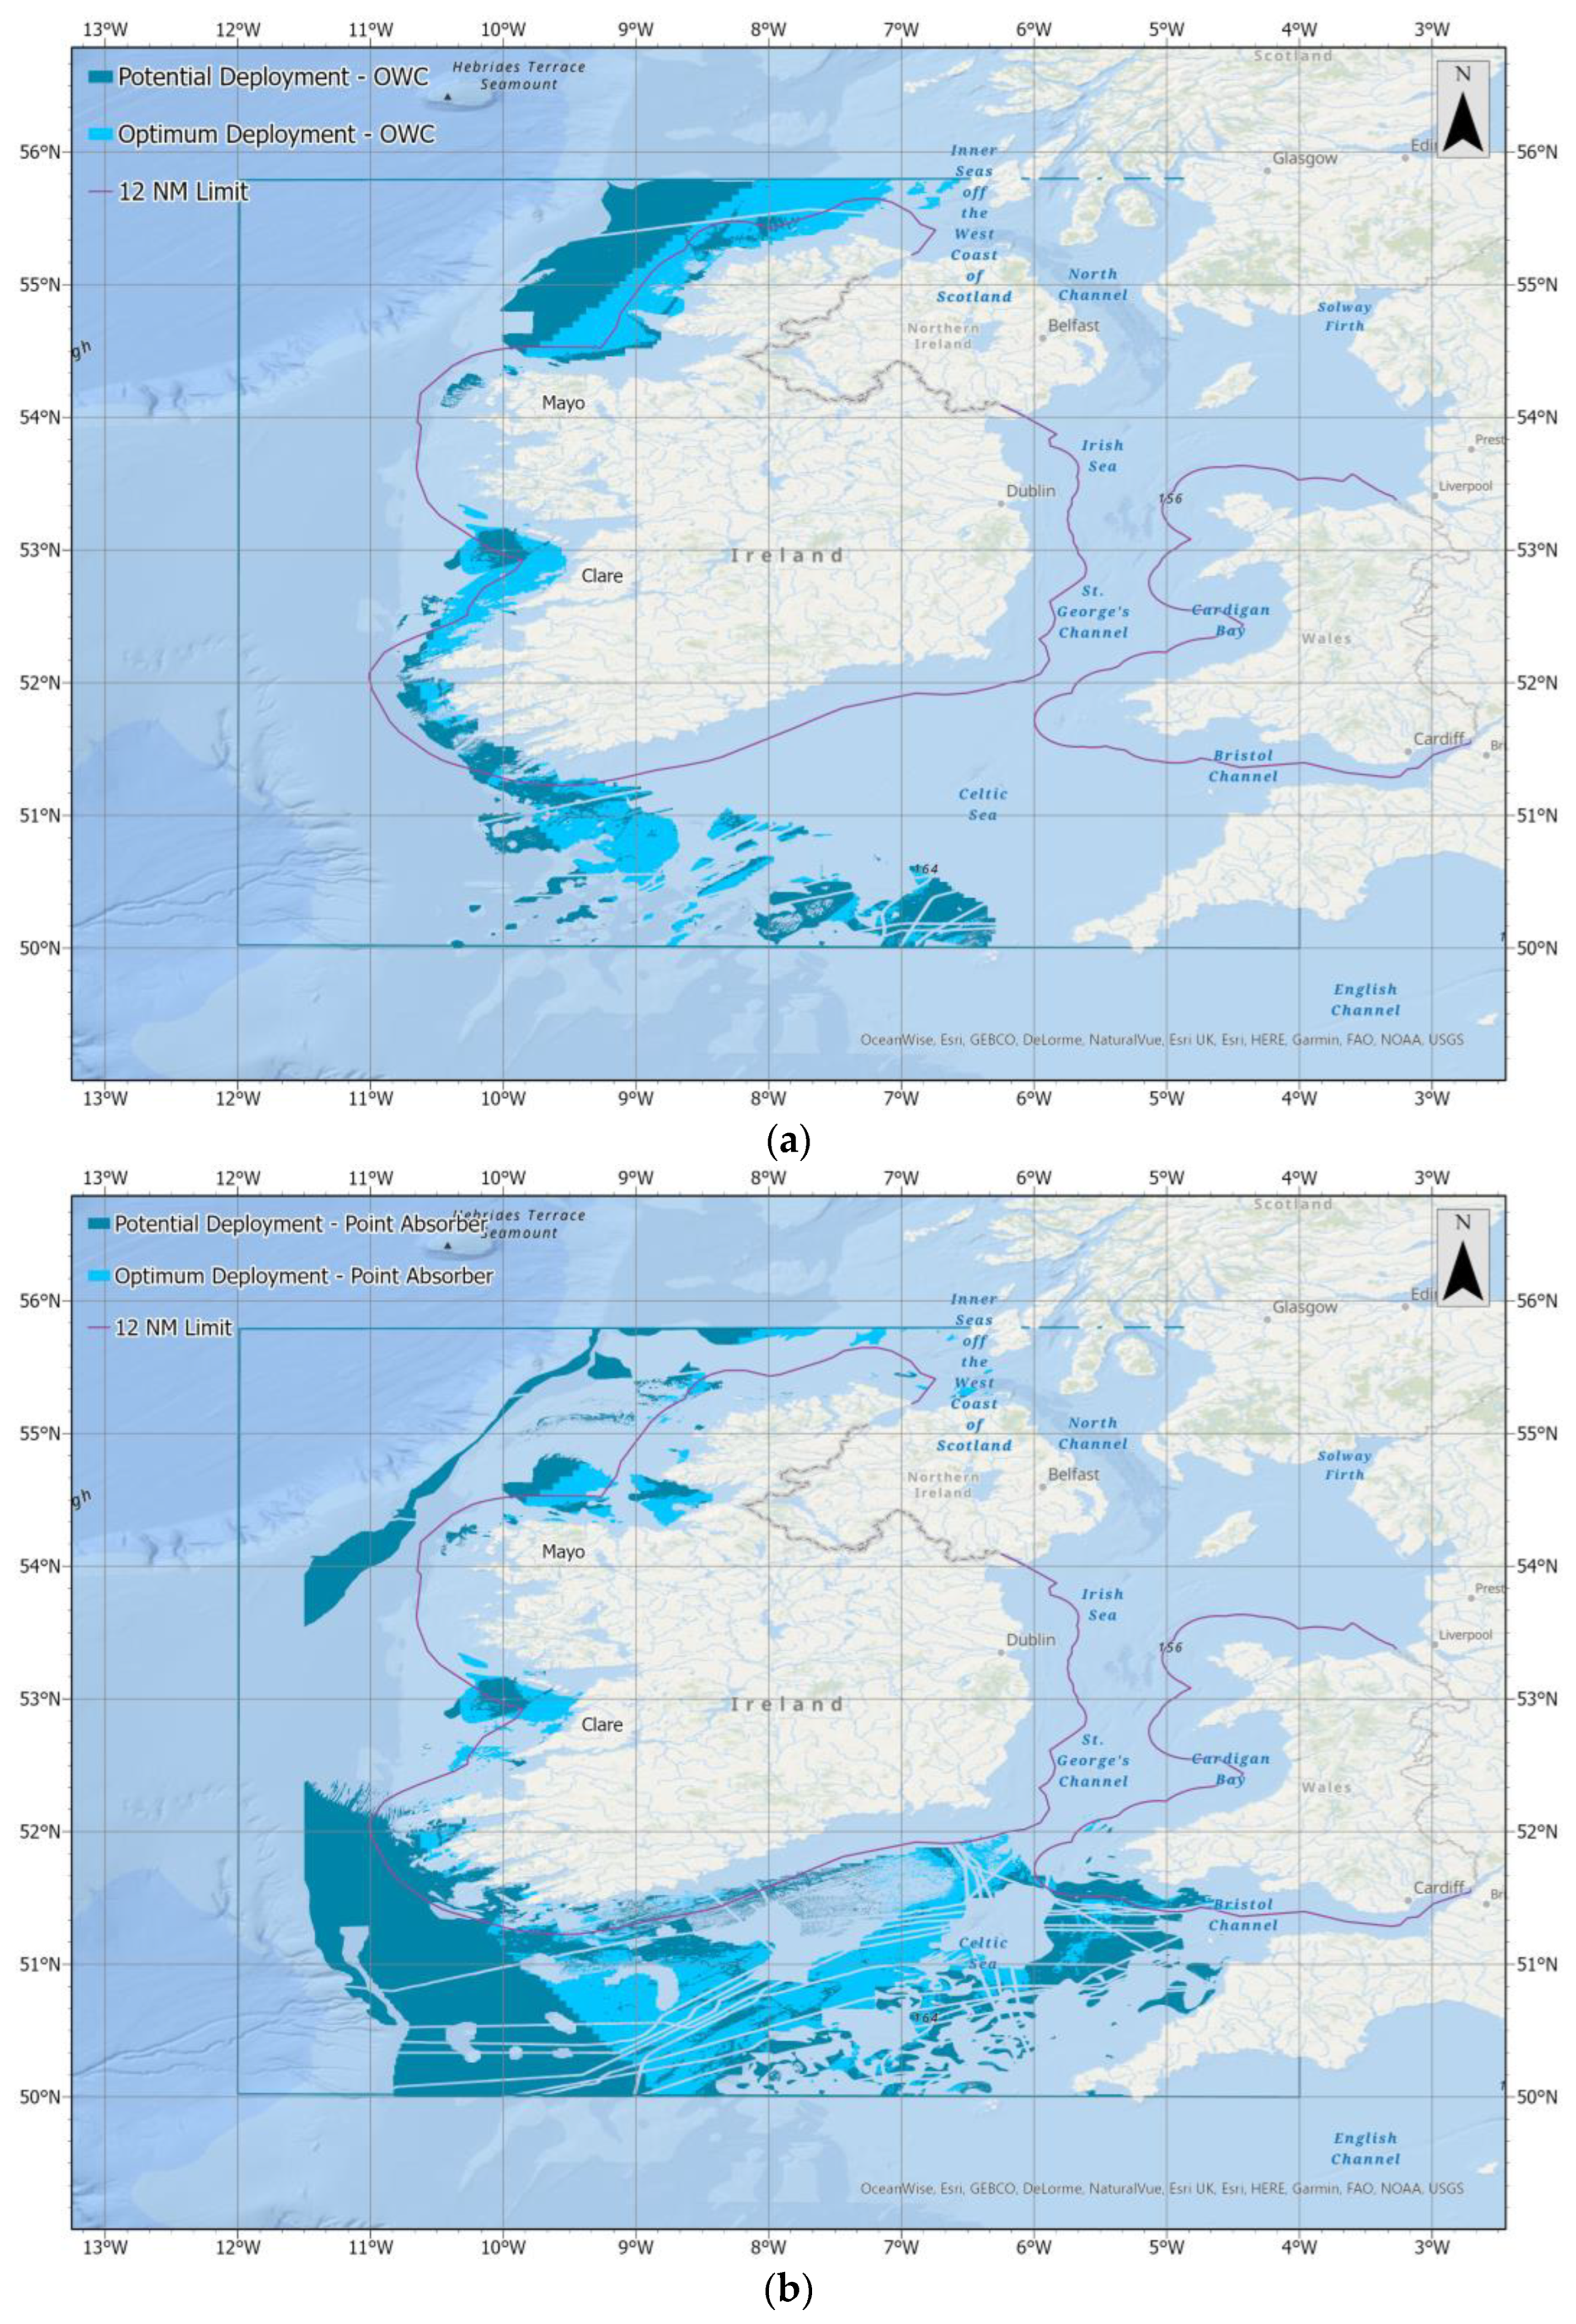
With widespread coverage of suitability in the Celtic Sea, the Attenuator technology appears to be best suited to this area, followed closely by the Point Absorber. Furthermore, with cable access to shore possible along the Cork coast, as previously confirmed (Figure 17), the opportunity for deployment here is pronounced given that Cork has a considerable industrial sector with high energy demands. The OWC has limited suitable coverage in the Celtic Sea because of the technology’s higher resource demand (Table 7). However, the technology does appear to be well suited to Atlantic areas, particularly off the northwest coast of Ireland and the coast of Kerry and Clare. This finding follows a site suitability study which considered an OWC in the same region of interest, though the hypothetical scenario combined the OWC with an offshore wind deployment [15]. In that study, the Atlantic Ocean, west of Ireland (as well as Scotland and the Faroe Islands), ranked highest for deployment, followed by limited potential in the Celtic Sea. The study also considered a point absorber deployment, albeit focusing more on the offshore wind element than the wave element in the hybrid scenario. In contrast to the results of the site suitability analysis performed for the point absorber in this study, that study suggested that the Celtic Sea was not suitable for deployment of this technology type. However, this is almost certainly due to the consideration of a minimum depth threshold of 150 m as opposed to the 30 m minimum depth threshold given in this study for the Point Absorber scenario (Table 8). In accordance with the survey responses, the Point Absorber has suitable areas far offshore in the North Atlantic because of its generous depth range (up to 300 m) (Table 8). However, such areas would have exceedingly high CAPEX and OPEX associated with the considerable distance to port and grid access, and thus would likely be far less feasible for deployment, as shown for offshore wind [65,66]. This will be examined for ocean energy by the authors of this article in a future study. There appears to be considerable deployment potential for all technology types off the Clare coast according to the analysis performed here, an important finding considering that Clare has a 400 kV grid connection point for electricity transmission to Ireland’s capital city Dublin [67].
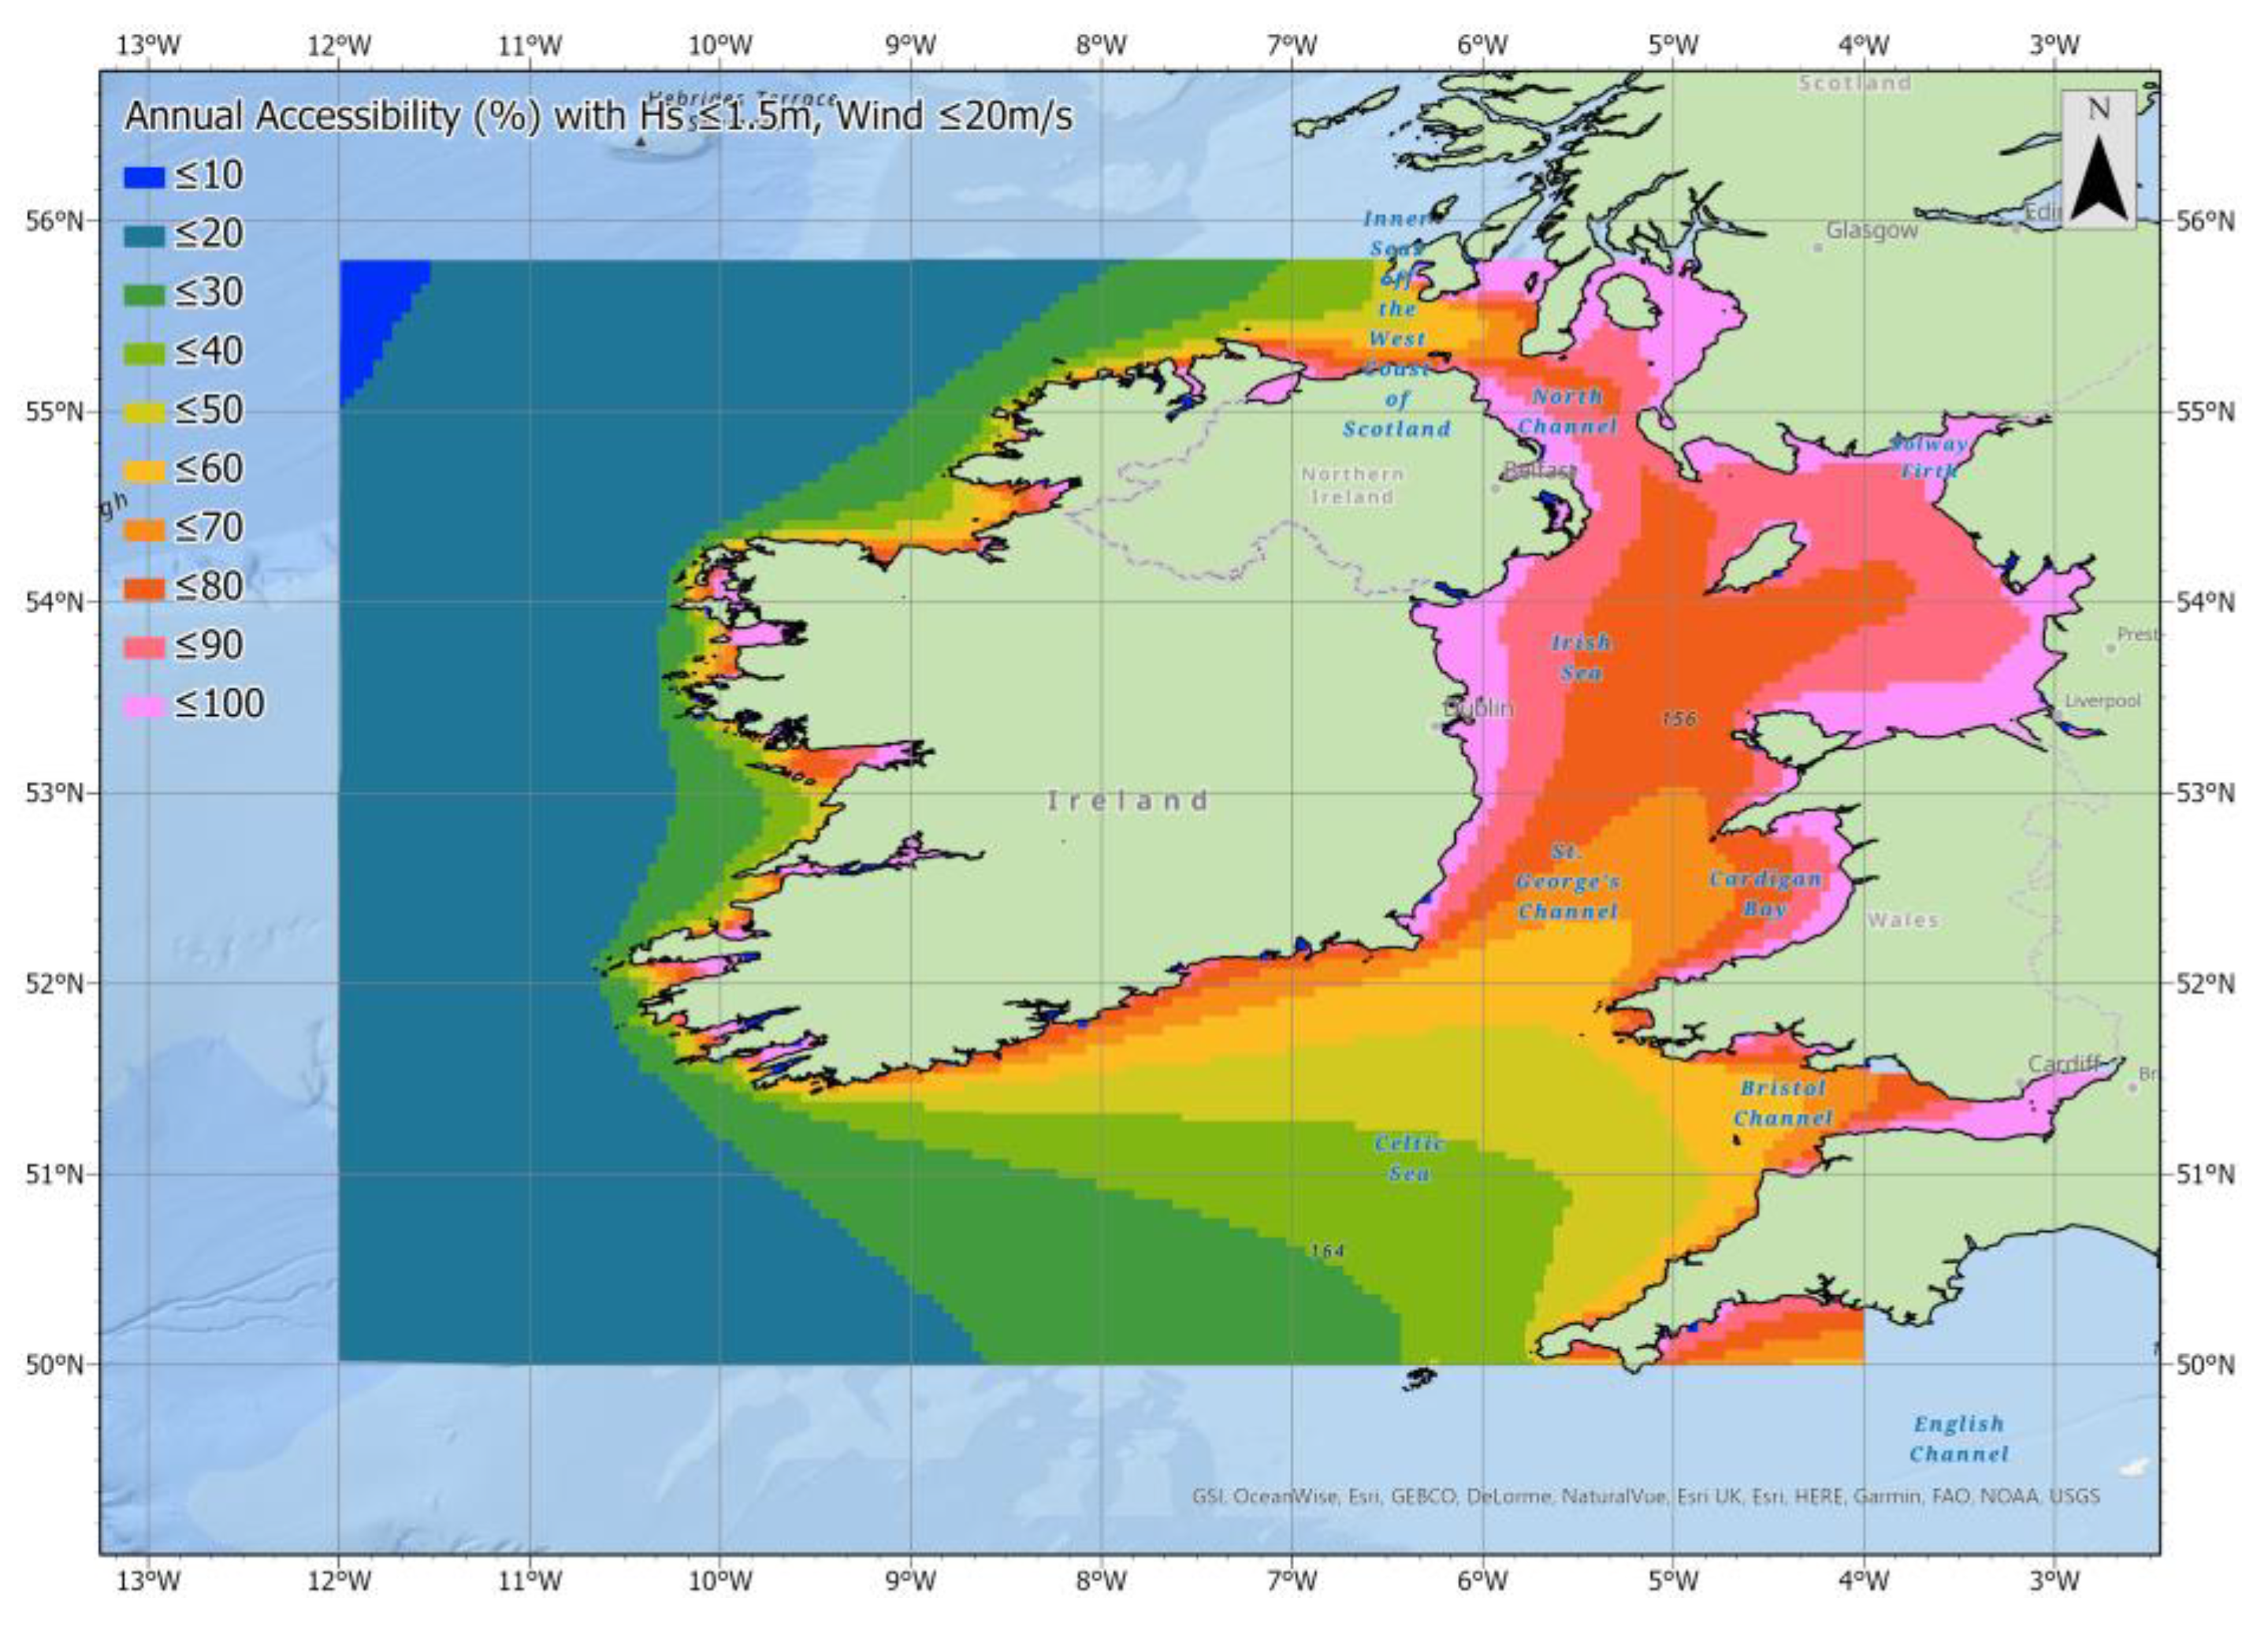
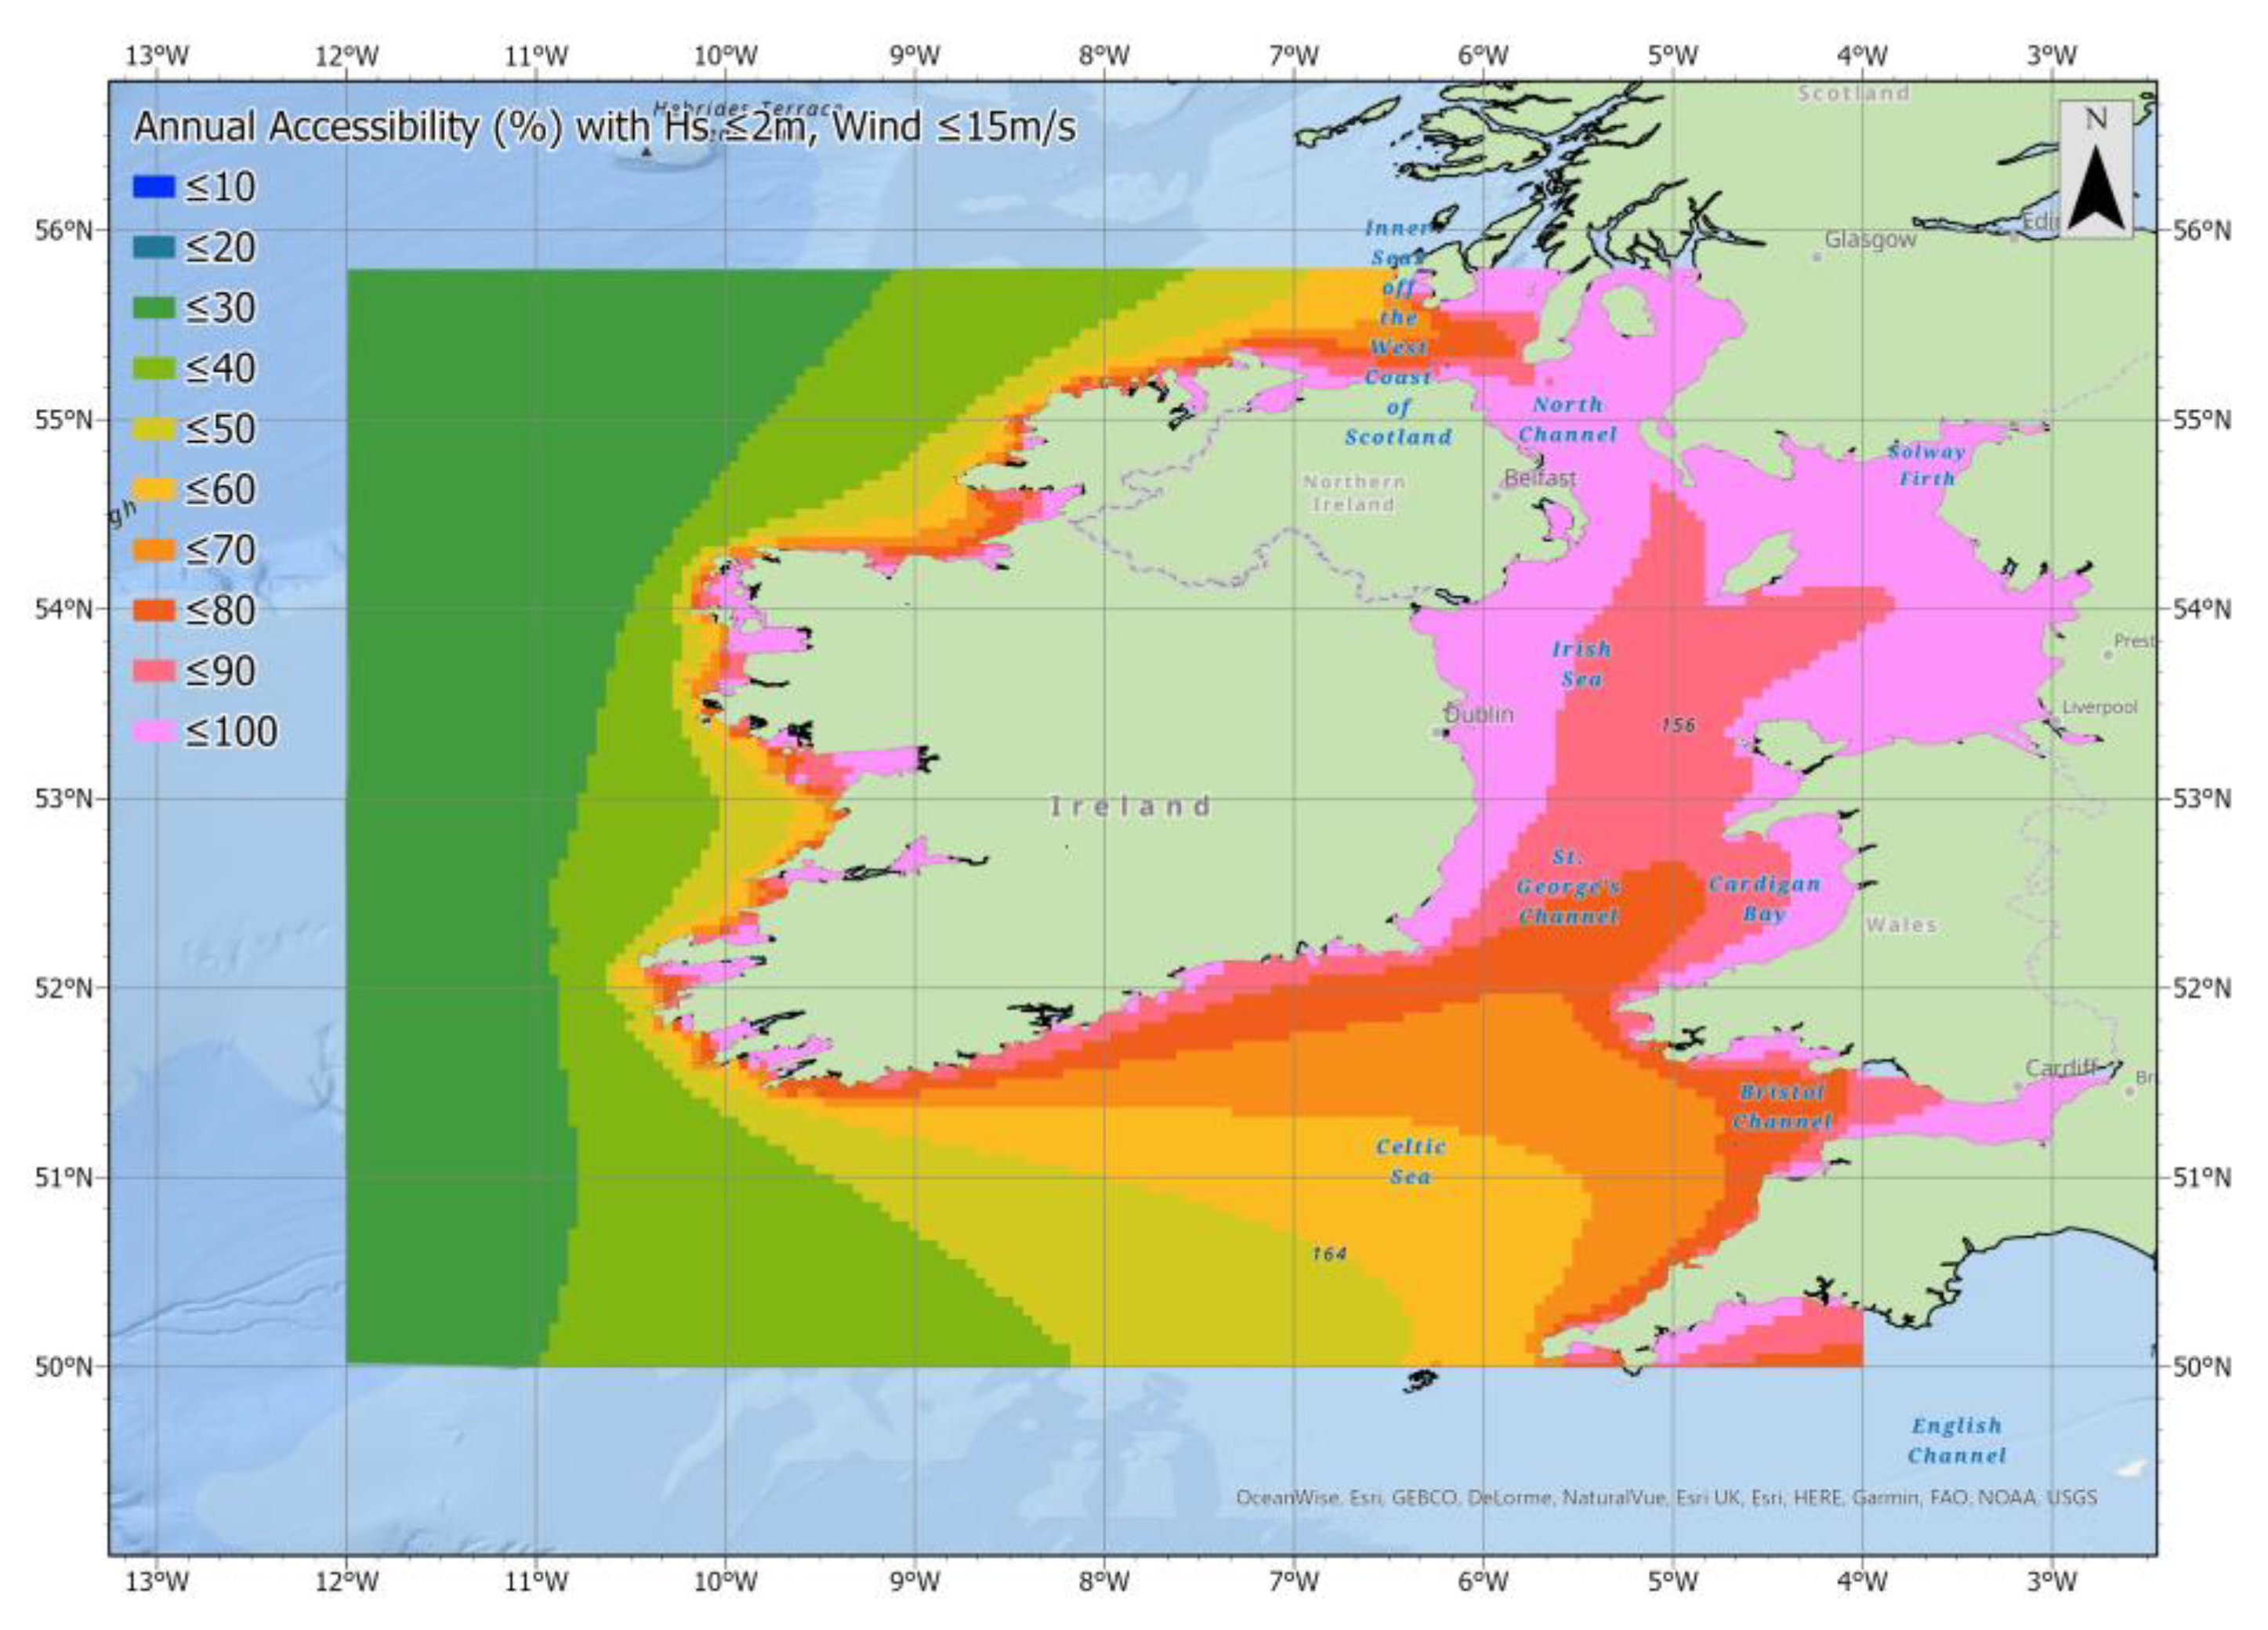
Annual accessibility values of less than 20% off Ireland’s west coast, using the 1.5 m Hs and 20 m/s wind speed limits, are also likely to pose a significant concern in terms of operations and maintenance, particularly considering UK guidelines for offshore wind, which suggest that anywhere having accessibility values below 20% is economically unviable [68]. This finding is significant given that much of the previous work on ORE site selection for the region of interest has not included the geospatial variability of accessibility [15,69]. The difference between the two accessibility maps reveals that wave height appears to have a greater impact on accessibility than wind speed, with higher values throughout the study area when the Hs threshold was increased (from 1.5 m to 2 m) and the wind speed threshold was decreased (from 20 m/s to 15 m/s). Using this >20% accessibility threshold as the benchmark, when the latter cut-off values are applied (Hs 2 m and wind speed 15 m/s), there is little or no impact to ocean energy deployment potential throughout the study area.
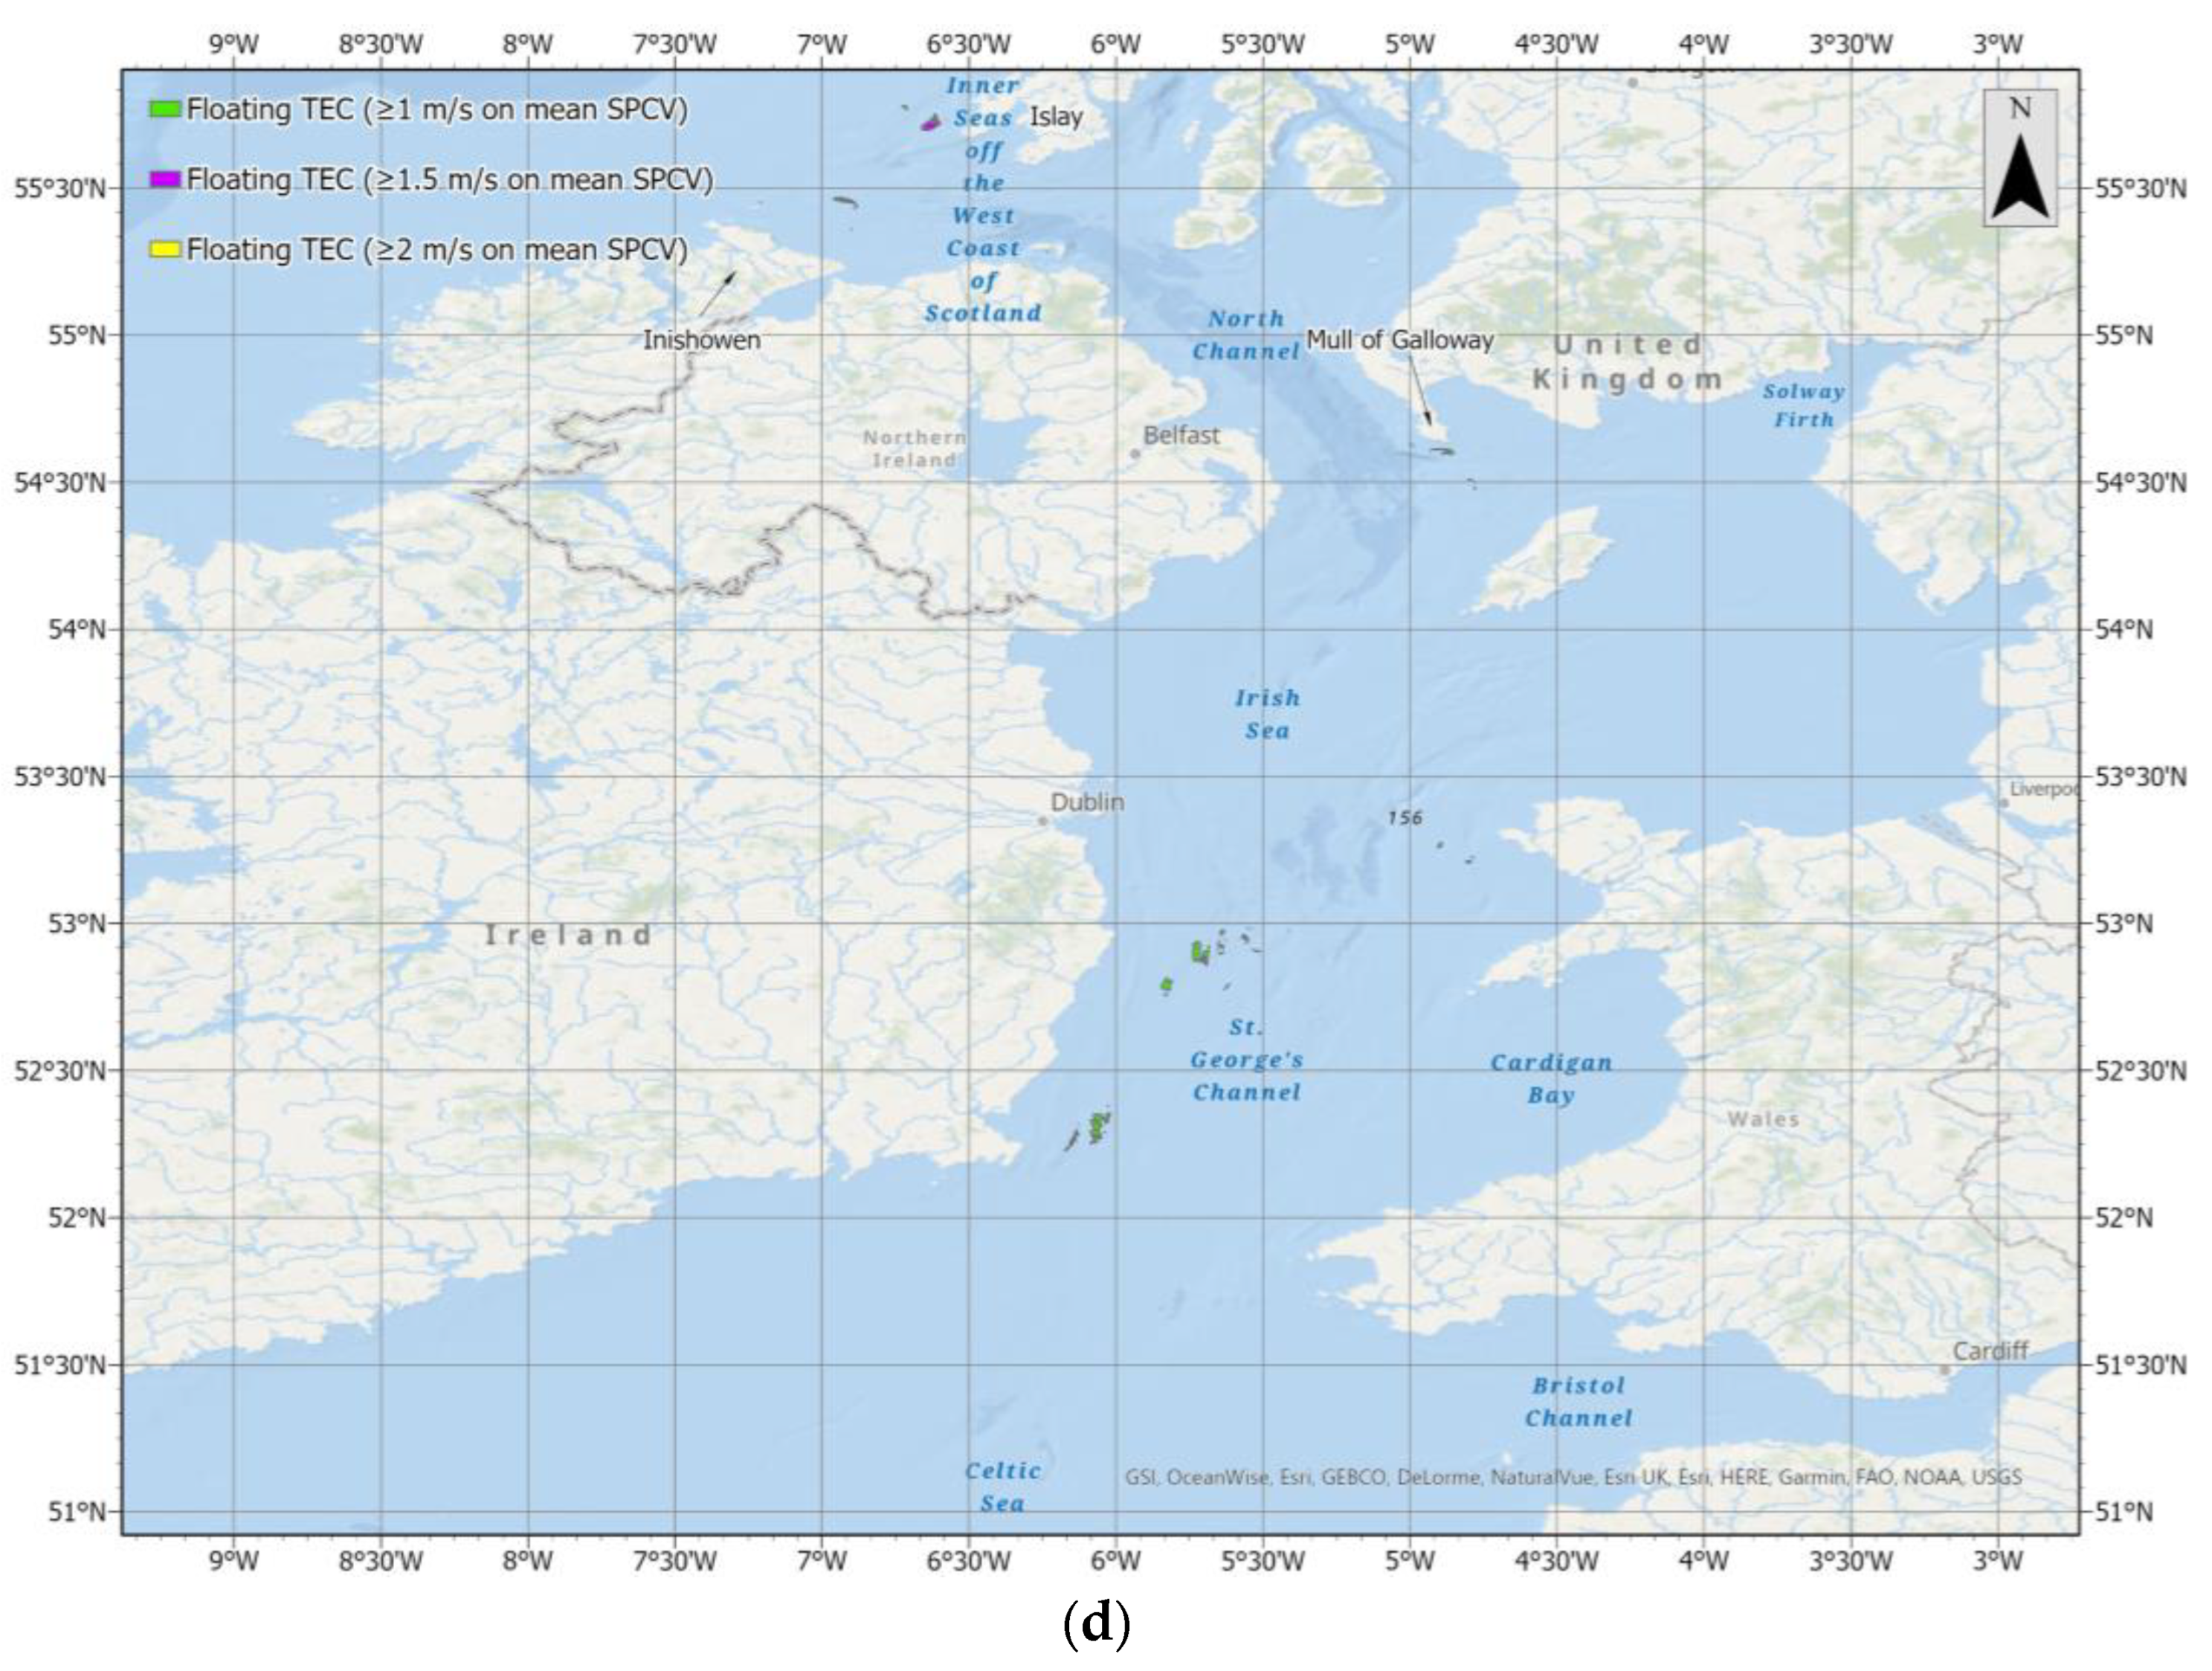
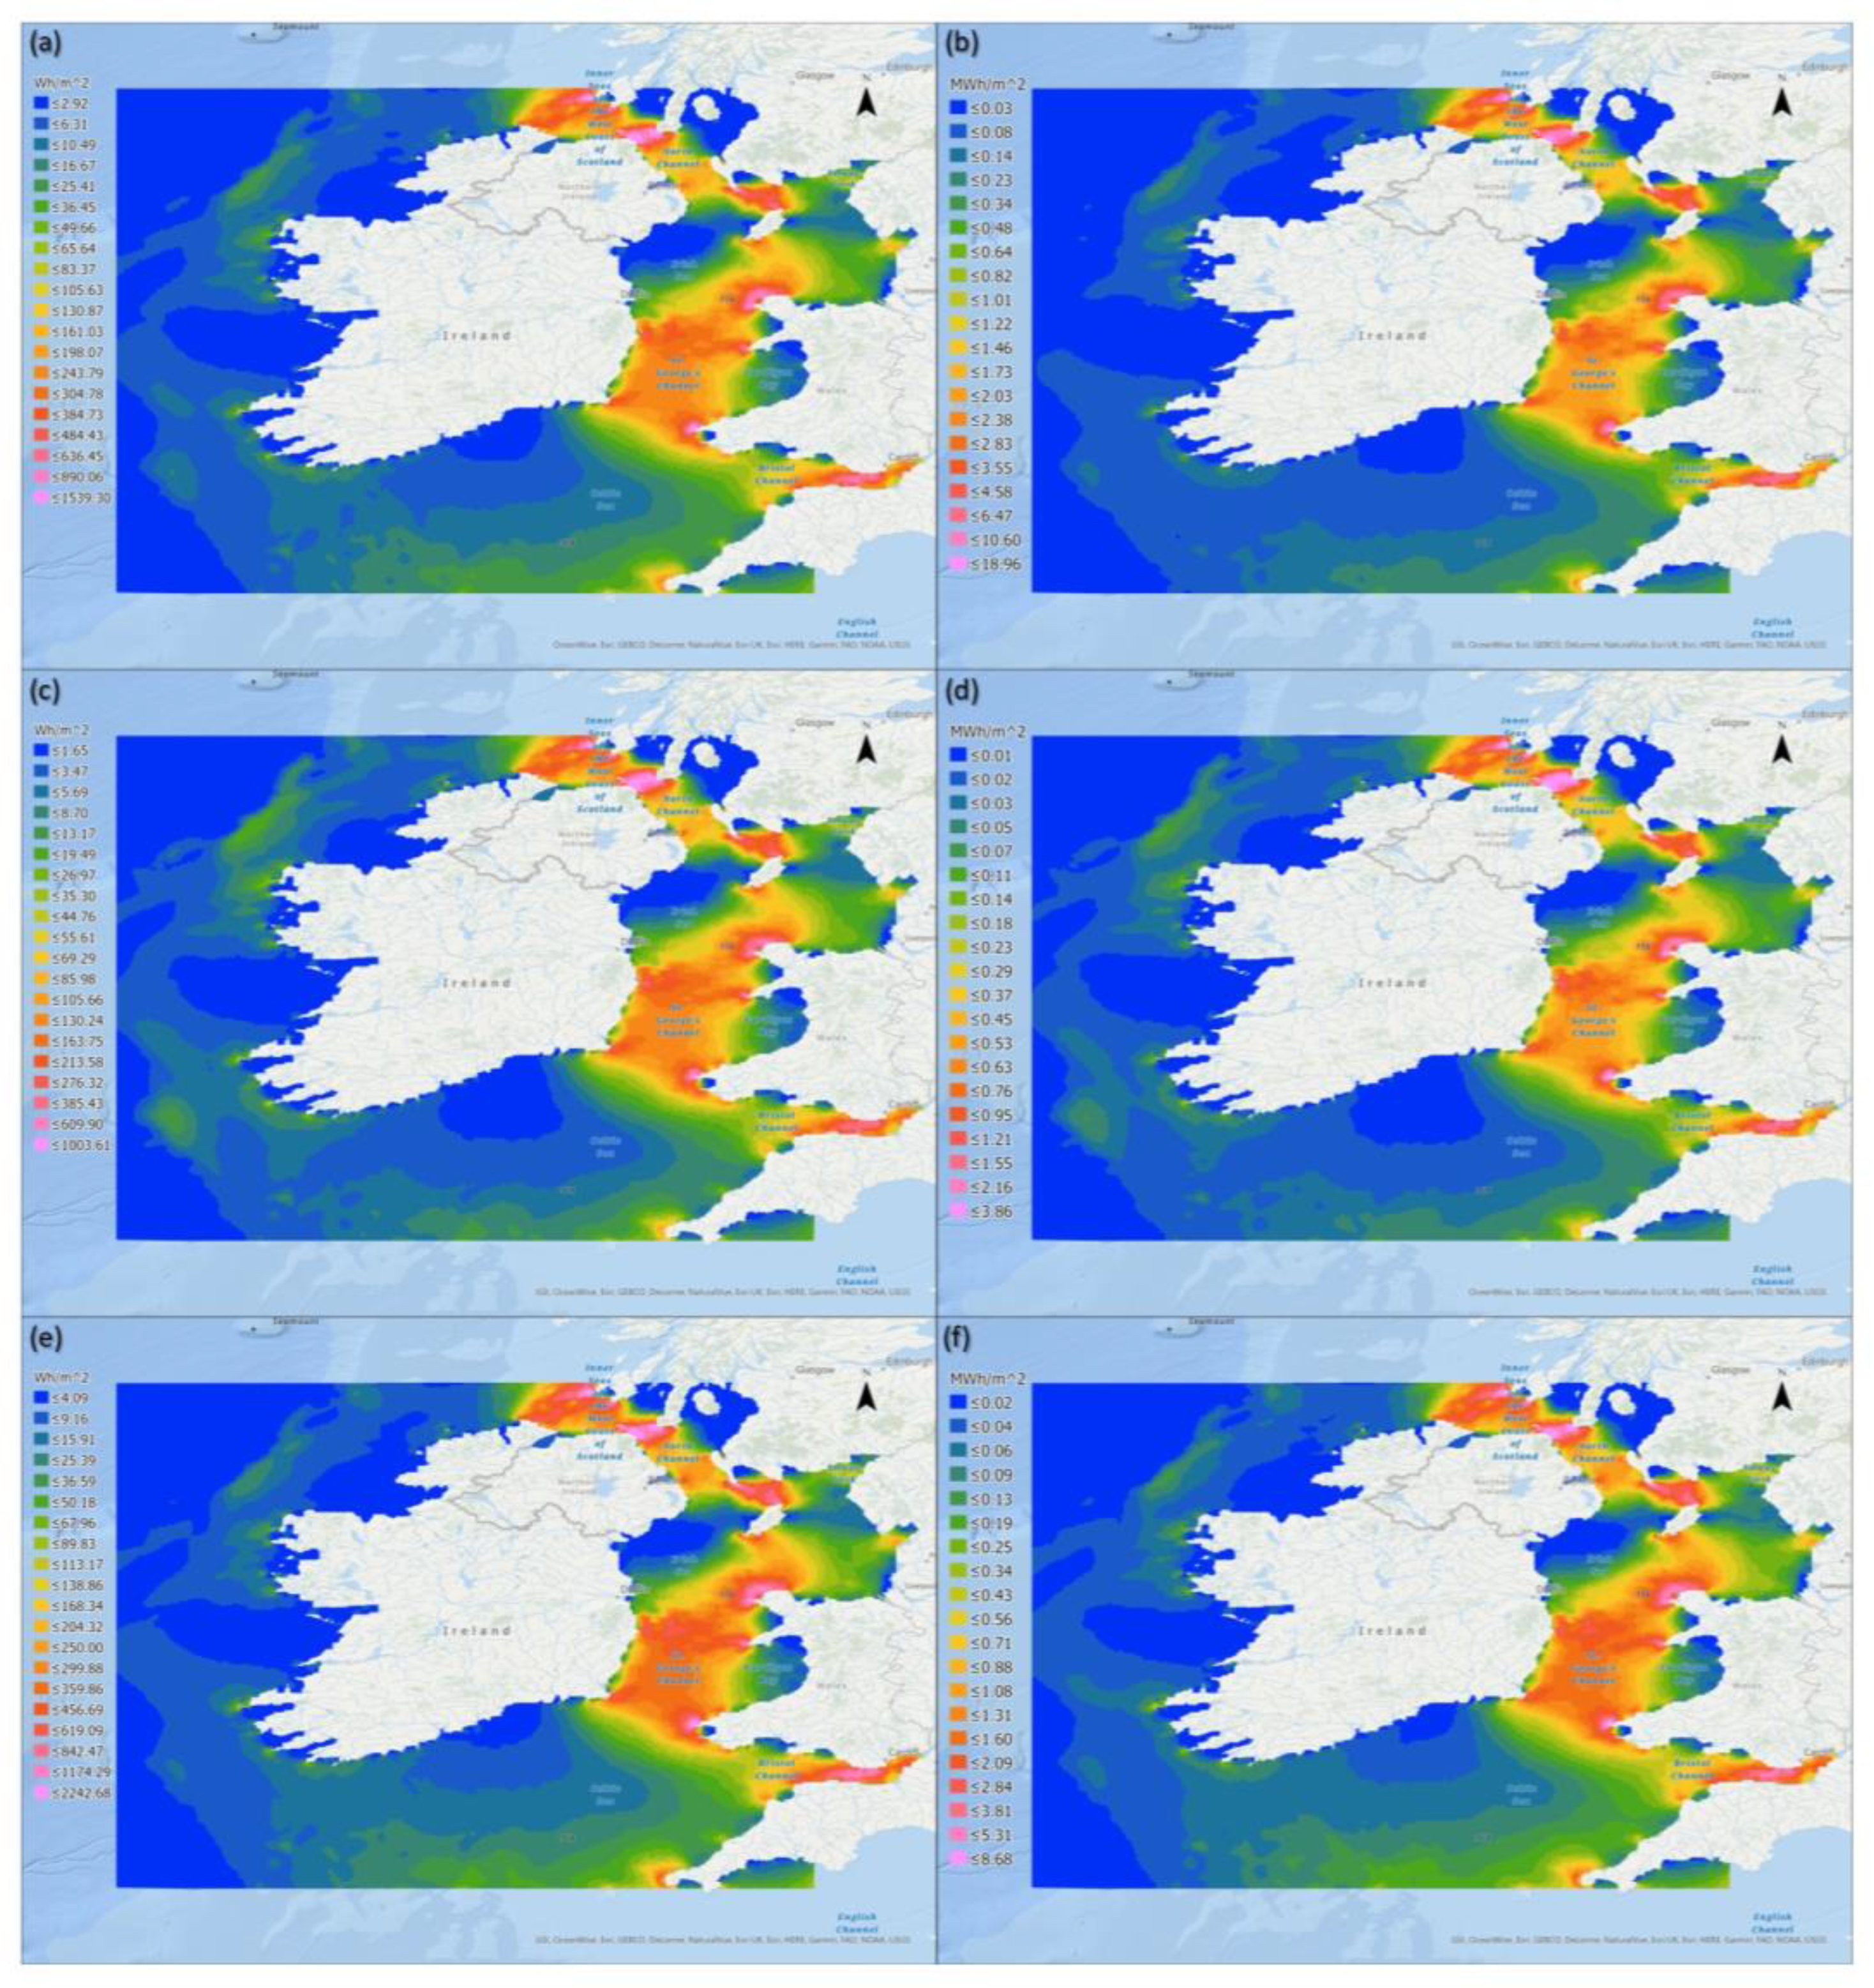
Almost mirroring the spatial distribution of the wave energy resource, the tidal energy resource is most plentiful in the east of the study area, with the higher values found throughout the Bristol Channel, Irish Sea, North Channel and the Inner Seas off the West Coast of Scotland, a finding consistent with previous assessments for both Ireland [70,71] and the UK [72,73]. This is due to the funnelling effect of the tide as it is forced between land masses and around headlands [74]. This was evident throughout the study area. Examples include St. Georges Channel in the Irish Sea and the North Channel between Northern Ireland and Scotland, but particularly around headlands and islands, with highest current speeds on mean springs (>1.5 m/s) evident off Ramsey Island (Wales), Holy Island—Anglesey (Wales), Mull of Galloway (Scotland), Mull of Kintyre (Scotland), Isle of Islay (Scotland) and Rathlin Island (Northern Ireland). Three of these areas, Ramsey Island, Anglesy and Islay, have been previously highlighted as being among the most productive areas for tidal energy in the UK [73]. In that study, the peak values appear to exceed 2 m/s in more locations than those found here. It is difficult to determine why this occurred, but reasons may well be associated with differences in the models used. Although both models had a similar spatial resolution (1.9 km2 and 1.8 km2), they have differing underlying algorithms to determine the depth averaged output. In a prior study of the Irish tidal energy resource [71], the values were more consistent with the results presented here, ranging between 1.2 and 1.5 m/s in the more productive areas of the Irish Sea (east of Wicklow Head and Rosslare), and only exceeding 1.9 m/s in the Inner Seas off the West Coast of Scotland (southeast of Rathlin Island). In that study, other noteworthy areas of potential for tidal energy around the Irish coast included the Shannon Estuary (between Kerry and Clare), Ram Race (northeast of Belfast) Strangford Lough (east of Inishowen) and Gascanane Sound (Cork). The fact that these additional areas of potential were found in that study, and not in the assessment performed here, is almost certainly due to the higher resolution (405 m) of the model used. This promotes the necessity for such higher resolution models in identifying confined areas of potential for tidal energy deployment.
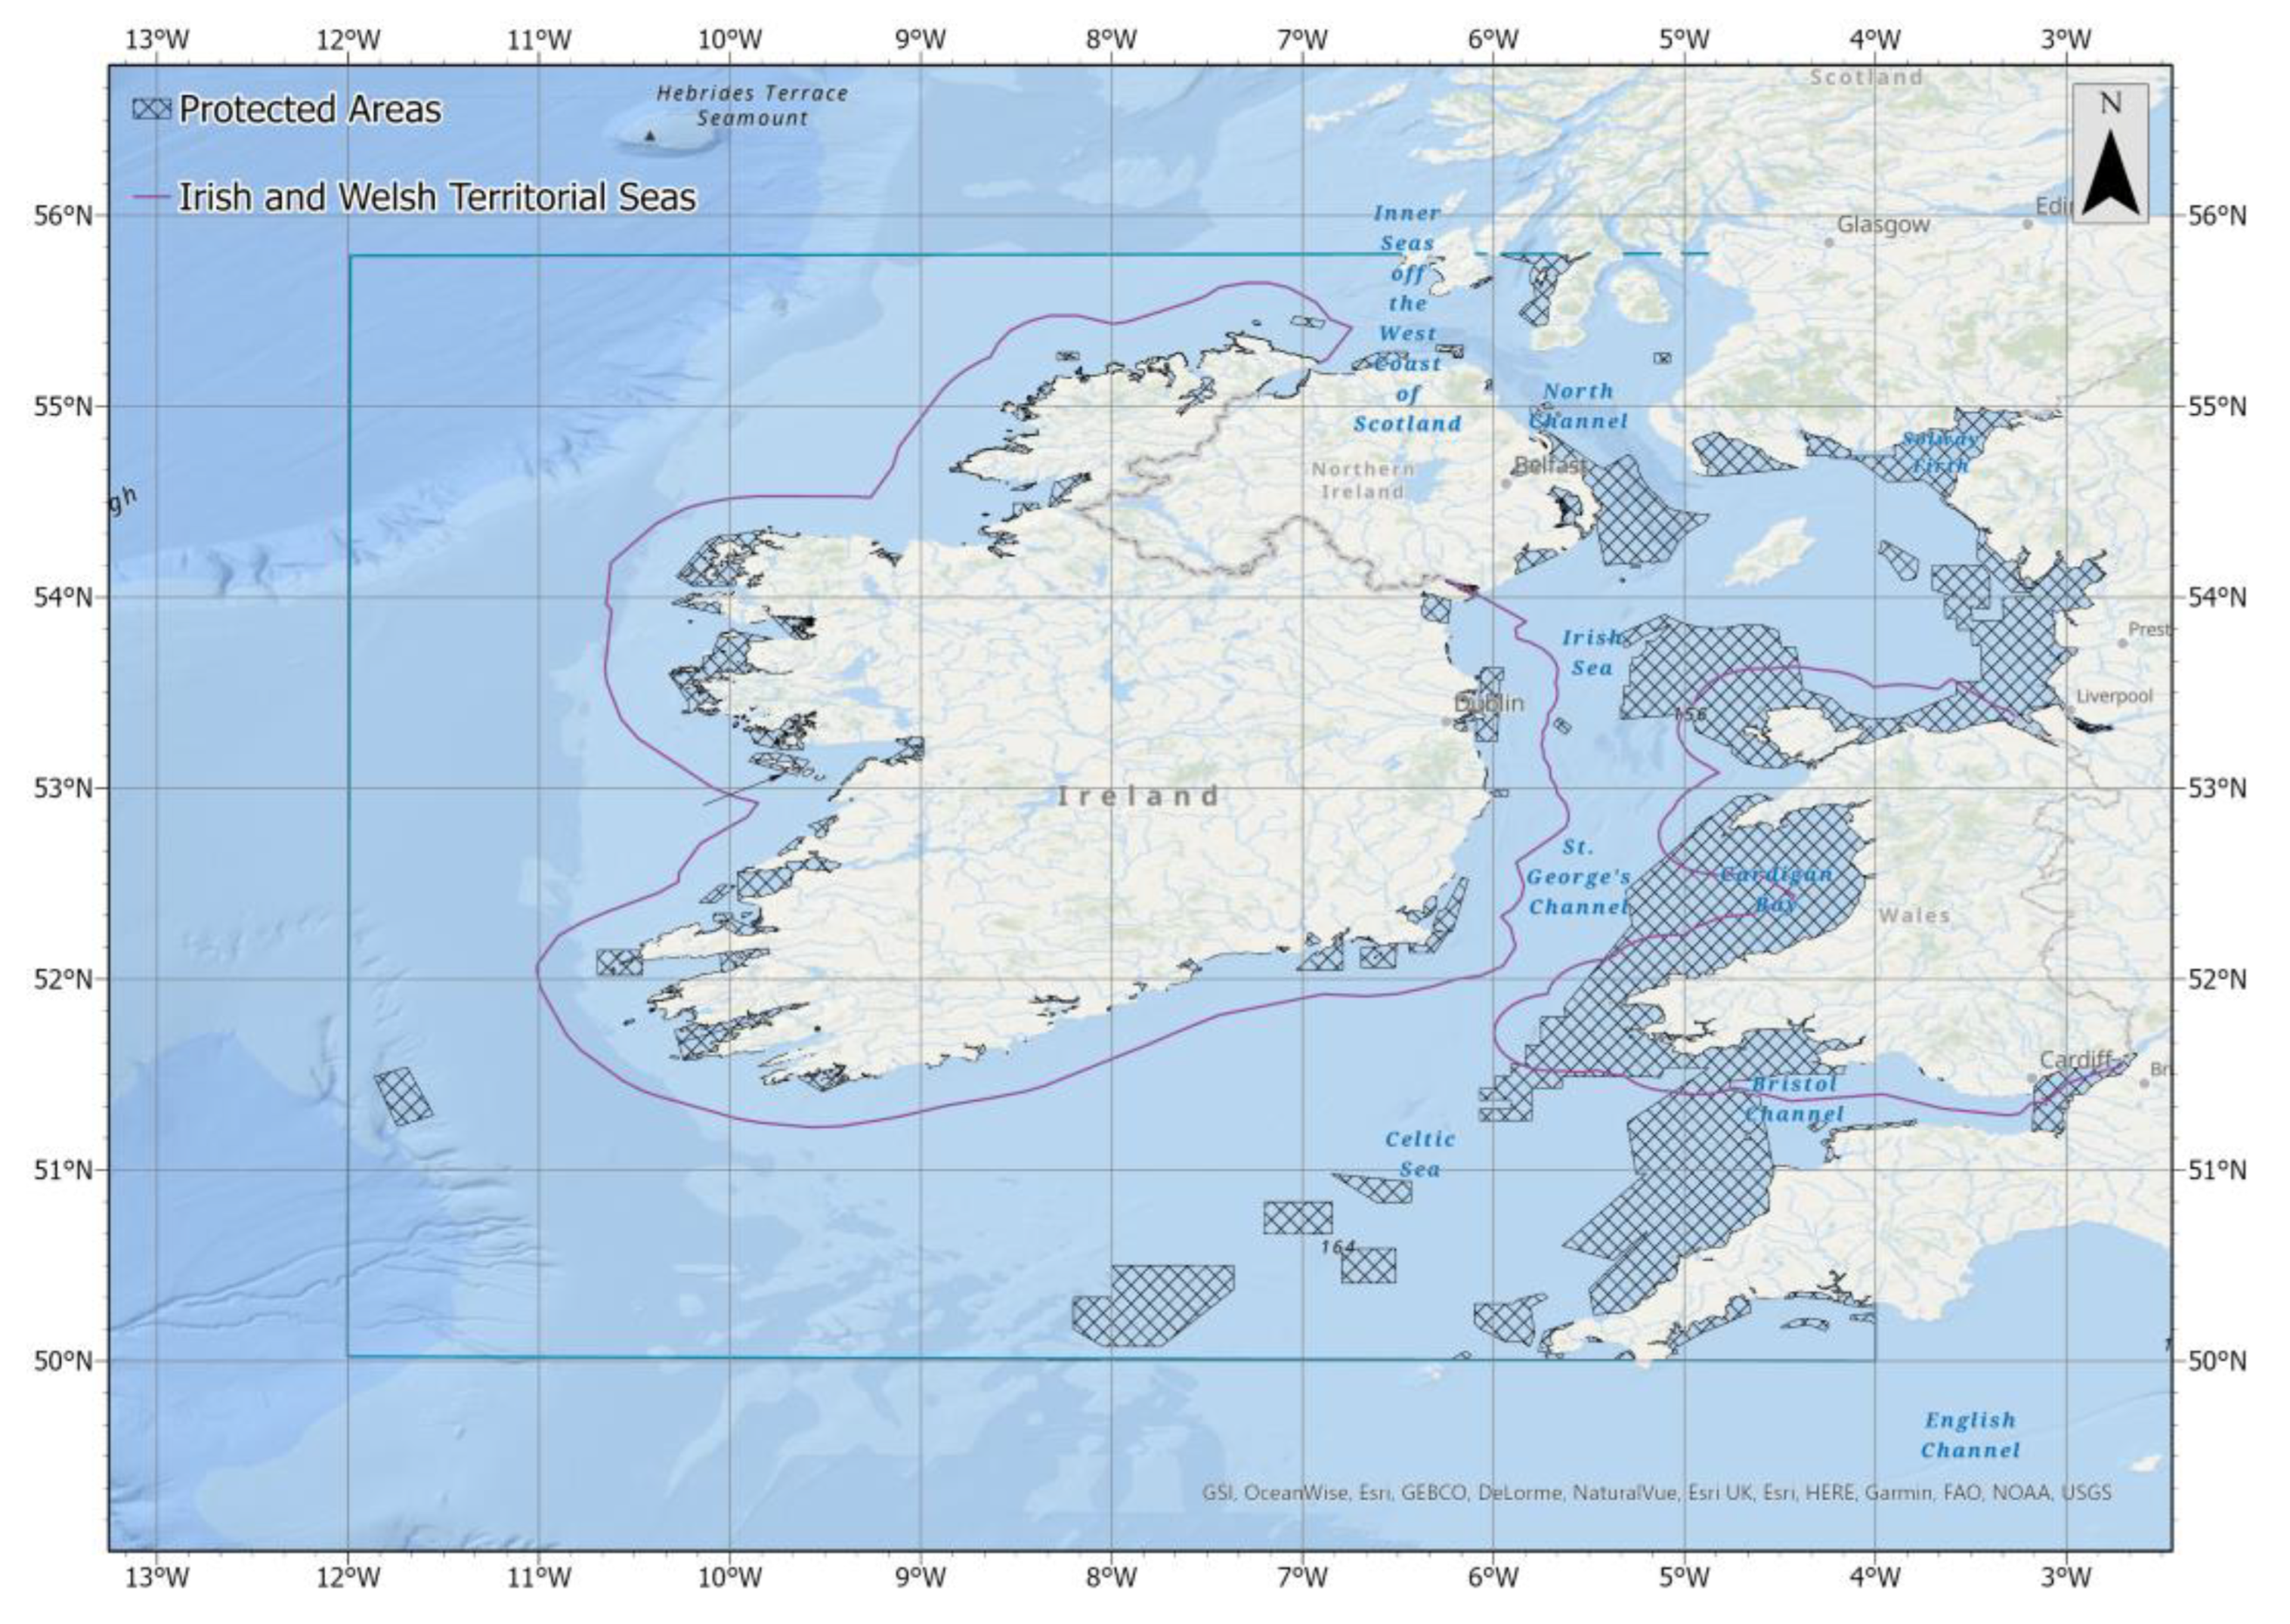
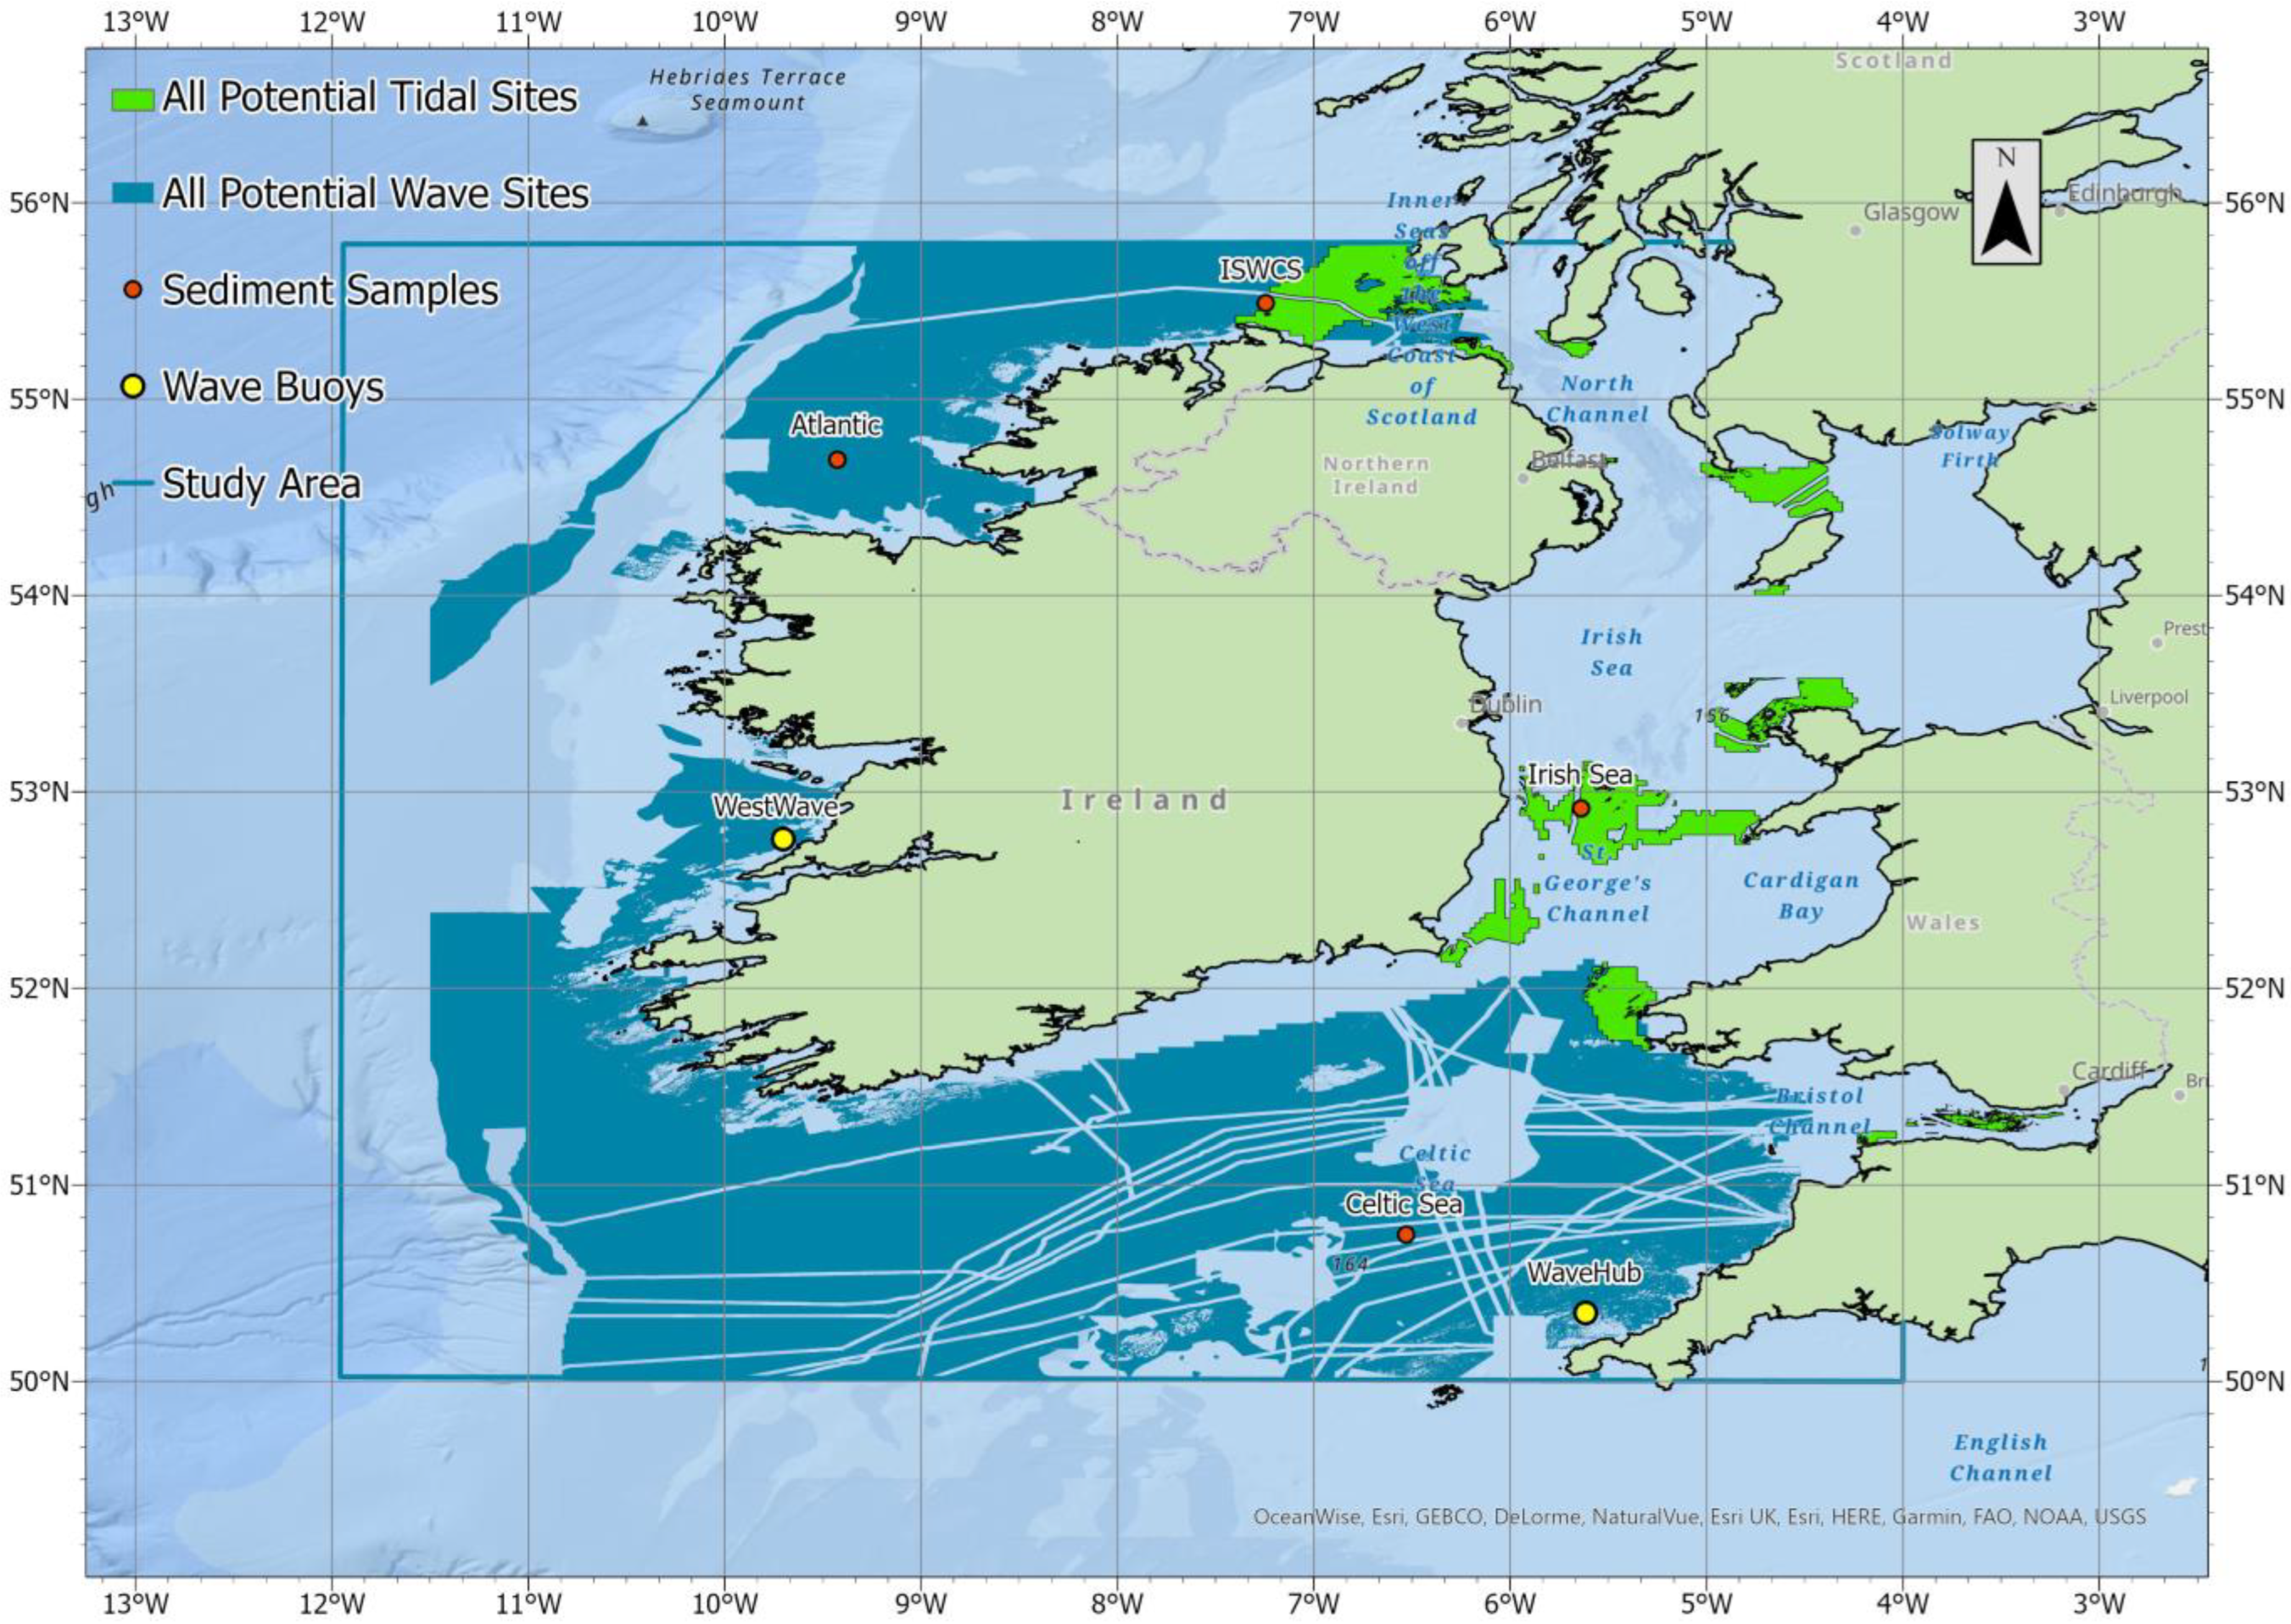
The removal of areas for fixed bottom tidal energy deployment in the optimum site analysis is due to the extensive coverage of protected areas in this region, as previously shown (Figure 21). Although the extent of the potential tidal energy deployment areas is limited in comparison to wave, those with the highest resources are close to the coast. This is beneficial in the sense that deployment in such areas will have lower CAPEX and OPEX values associated with the lower distance to onshore infrastructure, as previously stated for offshore wind energy. With most of these high resource intensity areas surrounding islands, this also presents an opportunity for these islands to achieve energy independence, a subject which has been of keen interest in renewable energy research and the focus of many previous studies [75,76,77,78].
In terms of the tool’s capacity to attract potential interest from the four main user groups defined by ICAN, outlined in the introduction, it can be said that the Selkie CWA will surely be useful and attractive for:
  • The scientific community—to scope out areas (i.e., using the potential site maps) for further and more detailed investigation of localised patterns in the resource,
  • Policy makers, both in Ireland and the UK—to help identify zones to be designated for ocean energy deployment within their respective marine plan areas,
  • The general public—to encourage interest in ORE and realise the enormous potential that the marine space offers Ireland and the UK as they aim to reach carbon neutrality, and,
  • The education sector—enabling students of both engineering and geography to access a freely available database and information source which can help them to learn about ORE resources and the multiple uses of our marine space.
In the accuracy assessment, results from the validation of both wave models correlated strongly with the in situ data, proving the effectiveness of using such freely available data from the Copernicus Marine Service for modelling the wave climate at the region of interest. It should be noted that the wave buoys chosen for the validation were also close to the coast, an area where similar models with a coarser resolution were found to have inaccuracies in a previous study of the region which used a model with no better than 8 km spatial resolution [57]. The higher spatial resolution of ≤5 km in both of the newer models is likely to be the reason for these more accurate results close to the coast. The bathymetry model had errors of up to 4 m when compared to the in situ data, which is not a major concern. The model can still be regarded as being appropriate for a study similar to this one, which is focused on scoping out potential areas within a broad region of interest as opposed to a site-specific study. Nevertheless, higher resolution models will be warranted for such site-specific assessments at the local/farm scale before deployment. Furthermore, although the seabed character model achieved consistent accuracy when compared to the in situ validation points in each sea area, it is still highly recommended to seek higher resolution, up-to-date surveys of the seabed prior to actual deployments; these should include depth to bedrock and seabed stability assessments [44]. With the growing interest and development of the ORE sector in the study region, such services are now available for tender on demand [79].

Limitations

As previously mentioned, it became apparent during this study that the spatial resolution of the model used for the tidal assessment could be improved. This is due to the considerable local variability of the tidal resource, particularly in comparison to the wind and wave climate. The resolution of the available data failed to capture the detail of the tidal resource in some channels where the width was less than the model node spacing. Such narrow channels often possess a considerable tidal resource due to the increased funnelling effect, but they are unlikely to have the capacity necessary for large scale deployments. These areas should be examined using higher resolution models to assess the potential for tidal energy site suitability. The area with no data coverage on the seabed character off the west coast of Galway and Mayo has excluded these areas from consideration for site suitability, yet they are likely to offer good potential for wave energy deployment. This may be revealed when newly available data come online via the ongoing INFOMAR programme [80].

5. Conclusions

This paper describes various geospatial datasets relating to ocean energy farm site suitability, and a CWA tool that will facilitate both access to, and analysis of these data. An analytical case study of the data has revealed potential and optimum sites using input criteria provided by ocean energy technology developers. Certain areas of the Atlantic Ocean and Celtic Sea have been shown to have huge potential for wave energy deployment. The Irish Sea, North Channel and Inner Seas off the West Coast of Scotland have some potential for tidal energy deployment (particularly fixed), yet minimum resource thresholds are not met according to some survey responses. At the national scale, but remaining specific to the study area, it can be concluded that Ireland offers huge potential for wave energy deployment, with vast areas of its Atlantic and Celtic Sea marine space meeting the requirements of technology developers’ preferred site criteria. Wales offers significant potential for tidal energy deployment particularly off the southwest and northwest headlands. However, gaining permission to deploy in these areas may be complex given the vast amounts of protect areas at these locations. There is some potential for wave energy deployment in Wales (off the southwest coast), and for tidal energy deployment in Ireland (off the east and north coasts). Although the entirety of their territorial waters was not captured in this study, it is also apparent that there is potential for wave energy deployment in England (off Cornwall) and Scotland (off Islay). Scotland also appears to have significant potential for tidal energy deployment (off the southwestern headlands). The CWA tool itself should prove useful for the purposes of ocean energy site selection, particularly given the flexibility of user input offered through the interactive design. From performing an accuracy assessment on some of the more pertinent data used in the CWA and case study, it can be concluded that the newly available wave models from CMS chosen for the study perform accurately within the study area, even close to the coast, which was an issue with previous products. This is likely due to the finer resolution of the newer wave products used in this study in comparison to the previous work. However, the spatial resolution of the model used in this study for the tidal energy resource assessment could certainly be improved upon, particularly for identifying confined areas of potential for tidal energy within narrow channels and sounds. The bathymetry and seabed character models can be regarded as sufficient for scoping out potential deployment sites at the regional scale, but site-specific assessments are still highly recommended at the local/farm scale prior to any commissioning of an ocean energy farm.

Future Work

Although this study has revealed potential areas for wave and tidal energy deployment, project feasibility requires further complexity, much of which is also geospatial in nature. A future study will use the wave data and current speed data described here and apply it to wave energy power matrices and tidal energy power curves for real WEC and TEC devices in order to produce maps of the technical resource availability, i.e., annual energy production (AEP), in MWh. Furthermore, the accessibility layers, described here, can be transformed into availability layers which show what percentage of time a device is available to produce energy. This can be subtracted from the AEP to reveal how much energy is realistically extractable throughout the study area. Other additional maps/layers will include those showing the proximity to the nearest port and grid access point, which has techno economic (TE) implications on the feasibility of potential ocean energy projects, the most common measure of which is the Levelised Cost of Energy (LCOE). These TE layers (AEP, availability, proximity to port and proximity to grid) will ultimately be combined with other TE data (relating to CAPEX, OPEX and DECEX) and fed into a bespoke, geospatially-geared algorithm which will create maps of the LCOE for the various technology types. All of these TE and LCOE maps will then be added to the Selkie CWA as additional layers.

Author Contributions

Conceptualization, R.O. and J.M.; methodology, R.O., M.G. and M.C.; software, R.O.; validation, R.O.; formal analysis, R.O.; data curation, R.O., R.F., M.G. and M.C.; writing—original draft preparation, R.O.; writing—review and editing, R.O. and J.M.; visualization, R.O.; supervision, J.M.; project administration, J.M.; funding acquisition, J.M. All authors have read and agreed to the published version of the manuscript.

Funding

This work was carried out as part of the Selkie project, which has received funding from the European Union’s European Regional Development Fund through the Ireland Wales Cooperation programme. Grant number: Selkie 81874.

Data Availability Statement

All research data produced and discussed in this article will be publicly available via the Selkie CWA. This tool will be accessible via the Selkie project website at https://www.selkie-project.eu/ from 1 May 2023.

Acknowledgments

The authors wish to acknowledge the administrative support of the Selkie Project Manager TJ Horgan. The authors also wish to thank Copernicus, the Irish Marine Institute, the European Marine Observation and Data Network (EMODnet), the Joint Nature Conservation Committee (JNCC), the Government of Ireland and the National Network of Regional Coastal Monitoring Programmes (NNRCMP) for freely providing data used in this study.

Conflicts of Interest

The authors declare no conflict of interest.

Nomenclature

AEPAnnual Energy Production
AISAutomatic Identification Systems
CAPEXCapital Expenditure
CMSCopernicus Marine Service
CTVCrew Transfer Vessel
CWACoastal Web Atlas
DECEXDecommissioning Expenditure
DTMDigital Terrain Model
ESRI Environmental Systems Research Institute
GISGeographic Information Systems
HLVHeavy Lift Vessel
ICANInternational Coastal Atlas Network
IMOInternational Maritime Office
ISWCSInner Seas off the West Coast of Scotland
MFWAMMétéo-France Wave Model
O&MOperations and Maintenance
OPEXOperational Expenditure
OREOffshore Renewable Energy
OWCOscillating Water Column
RMSERoot Mean Square Error
SIScatter Index
TE Techno Economic
TECTidal Energy Converter
TSSTraffic Separation Scheme
WECWave Energy Converter

Appendix A

Figure A1. The seasonal mean significant wave height (Hs) in metres for (a) spring, (b) summer, (c) autumn and (d) winter.
Jmse 11 00826 g0a1
Figure A2. The seasonal mean wave period (T) in seconds for (a) spring, (b) summer, (c) autumn and (d) winter.
Jmse 11 00826 g0a2
Figure A3. The values in metres per second for (a) the mean peak current velocity, (b) the maximum peak current velocity, (c) the mean peak current velocity on neap tides, (d) the maximum peak current velocity on neap tides, (e) the mean peak current velocity on spring tides and (f) the maximum peak current velocity on spring tides.
Jmse 11 00826 g0a3
Figure A4. (a) the mean annual tidal energy (Wh/m2), (b) the total annual tidal energy (MWh/m2), (c) the mean annual neap tidal energy (Wh/m2), (d) the total annual neap tidal energy (MWh/m2), (e) the mean annual spring tidal energy (Wh/m2) and (f) the total annual spring tidal energy (MWh/m2).
Jmse 11 00826 g0a4

References

  1. European Commission. Communication from the Commission to the European Parliament, the European Council, the Council, the European Economic and Social Committee and the Committee of the Regions; The European Green Deal. COM/2019/640 final; European Commission: Brussels, Belgium, 2019.
  2. Green, D.R. Geospatial Technologies for Siting Coastal. In Geoinformatics for Marine and Coastal Management; Bartlett, D., Celliers, L., Eds.; Taylor & Francis: Abingdon, UK, 2017; pp. 274–277. [Google Scholar]
  3. Avtar, R.; Sahu, N.; Aggarwal, A.; Chakraborty, S.; Kharrazi, A.; Yunus, A.; Dou, J.; Kurniawan, T. Exploring Renewable Energy Resources Using Remote Sensing and GIS—A Review. Resources 2019, 8, 149. [Google Scholar] [CrossRef] [Green Version]
  4. Wang, Q.; M’Ikiugu, M.; Kinoshita, I. A GIS-Based Approach in Support of Spatial Planning for Renewable Energy: A Case Study of Fukushima, Japan. Sustainability 2014, 6, 2087–2117. [Google Scholar] [CrossRef] [Green Version]
  5. Purba, N.; Kelvin, J.; Sandro, R.; Gibran, S.; Permata, R.; Maulida, F.; Martasuganda, M. Suitable Locations of Ocean Renewable Energy (ORE) in Indonesia Region—GIS Approached. Energy Procedia 2015, 65, 230–238. [Google Scholar] [CrossRef] [Green Version]
  6. Remmers, T.; Cawkwell, F.; Desmond, C.; Murphy, J.; Politi, E. The Potential of Advanced Scatterometer (ASCAT) 12.5 km Coastal Observations for Offshore Wind Farm Site Selection in Irish Waters. Energies 2019, 12, 206. [Google Scholar] [CrossRef] [Green Version]
  7. Resch, B.; Sagl, G.; Törnros, T.; Bachmaier, A.; Eggers, J.; Herkel, S.; Narmsara, S.; Gündra, H. GIS-Based Planning and Modeling for Renewable Energy: Challenges and Future Research Avenues. Int. J. Geo-Inf. 2014, 3, 662–692. [Google Scholar] [CrossRef]
  8. Aydin, N.; Kentel, E.; Duzgun, H. GIS-based site selection methodology for hybrid renewable energy systems: A case study from western Turkey. Energy Convers. Manag. 2013, 70, 90–106. [Google Scholar] [CrossRef]
  9. Martínez-Martínez, Y.; Dewulf, J.; Casas-Ledón, Y. GIS-based site suitability analysis and ecosystem services approach for supporting renewable energy development in south-central Chile. Renew. Energy 2022, 182, 363–376. [Google Scholar] [CrossRef]
  10. Vagiona, D.; Kamilakis, M. Sustainable Site Selection for Offshore Wind Farms in the South Aegean—Greece. Sustainability 2018, 10, 749. [Google Scholar] [CrossRef] [Green Version]
  11. Castro-Santos, L.; Garcia, G.; Simões, T.; Estanqueiro, A. Planning of the installation of offshore renewable energies: A GIS approach of the Portuguese roadmap. Renew. Energy 2019, 132, 1251–1262. [Google Scholar] [CrossRef]
  12. Díaz, H.; Soares, C.G. An integrated GIS approach for site selection of floating offshore wind farms in the Atlantic continental European coastline. Renew. Sustain. Energy Rev. 2020, 134, 110328. [Google Scholar] [CrossRef]
  13. Salvador, C.; Arzaghi, E.; Yazdi, M.; Jahromi, H.; Abbassi, R. A multi-criteria decision-making framework for site selection of offshore wind farms in Australia. Ocean. Coast. Manag. 2022, 224, 106196. [Google Scholar] [CrossRef]
  14. Caceoğlu, E.; Yildiz, H.; Oğuz, E.; Huvaj, N.; Guerrero, J. Offshore wind power plant site selection using Analytical Hierarchy Process for Northwest Turkey. Ocean. Eng. 2022, 252, 111178. [Google Scholar] [CrossRef]
  15. Hosseinzadeh, S.; Etemad-Shahidi, A.; Stewart, R. Site Selection of Combined Offshore Wind and Wave Energy Farms: A Systematic Review. Energies 2023, 16, 2074. [Google Scholar] [CrossRef]
  16. Cradden, L.; Kalogeri, C.; Barrios, I.M.; Galanis, G.; Ingram, D.; Kallos, G. Multi-criteria site selection for offshore renewable energy platforms. Renew. Energy 2016, 87, 791–806. [Google Scholar] [CrossRef] [Green Version]
  17. Kamranzad, B.; Hadadpour, S. A multi-criteria approach for selection of wave energy converter/location. Energy 2020, 204, 117924. [Google Scholar] [CrossRef]
  18. McLean, N.; Holland, M.; Maciver, R.; Bannon, E. Site selection for scaled open water testing of a wave energy converter. Int. Mar. Energy J. 2020, 3, 101–110. [Google Scholar] [CrossRef]
  19. Shao, M.; Zhao, Y.; Sun, J.; Han, Z.; Shao, Z. A decision framework for tidal current power plant site selection based on GIS-MCDM: A case study in China. Energy 2023, 262, 125476. [Google Scholar] [CrossRef]
  20. Marsh, P.; Penesis, I.; Nader, J.; Cossu, R. Multi-criteria evaluation of potential Australian tidal energy sites. Renew. Energy 2021, 175, 453–469. [Google Scholar] [CrossRef]
  21. Sakmani, A.; Lam, W.; Hashim, R.; Chong, H. Site selection for tidal turbine installation in the Strait of Malacca. Renew. Sustain. Energy Rev. 2013, 21, 590–602. [Google Scholar] [CrossRef]
  22. Mostafa, M.; Bahaj, A. Multi criteria decision analysis for offshore wind energy potential in Egypt. Renew. Energy 2018, 118, 278–289. [Google Scholar]
  23. Peters, J.; Cummins, V.; Wheeler, A. Parameter Importance Survey Results and GIS Weights; EirWind Project Deliverable D2.1 Report; MaREI Centre, ERI, University College Cork: Cork, Ireland, 2020. [Google Scholar]
  24. Butschek, F.; Peters, J.; Remmers, T.; Murphy, J.; Wheeler, A. Geospatial dimensions of the renewable energy transition—The importance of prioritisation. Environ. Innov. Soc. Transit. 2023, 47, 100713. [Google Scholar] [CrossRef]
  25. Peters, J.; Remmers, T.; Wheeler, A.; Murphy, J.; Cummins, V. A systematic review and meta-analysis of GIS use to reveal trends in offshore wind energy research and offer insights on best practices. Renew. Sustain. Energy Rev. 2020, 128, 109916. [Google Scholar] [CrossRef]
  26. Directive, H. COUNCIL DIRECTIVE 92 /43 /EEC of 21 May 1992 on the conservation of natural habitats and of wild fauna and flora. Off. J. Eur. Communities 1992, 206, 50. [Google Scholar]
  27. Wright, D.; Dwyer, N.; Cummins, V. Coastal Informatics: Web Atlas Design and Implementation; Hershey: New York, NY, USA, 2011. [Google Scholar]
  28. Kopke, K.; Power, S.; Leadbetter, A.; O’Grady, E. Case Study: The Impact of Coastal Web Atlas Development. In The Coastal Atlas of Ireland; Cork University Press, University College Cork: Cork, Ireland, 2021; pp. 156–157. [Google Scholar]
  29. O’Connell, R.; Murphy, J.; McAuliffe, F.D.; Dalton, G. A review of geographic information system (GIS) and techno economic (TE) software tools for renewable energy and methodology to develop a coupled GIS-TE software tool for marine renewable energy (MRE). J. Eng. Marit. Environ. 2023, 1–18. [Google Scholar] [CrossRef]
  30. Welsh Government. Marine Planning Portal. Available online: http://lle.gov.wales/apps/marineportal/#lat=52.2429&lon=-3.7463&z=8&tgt=false&layers=231,390 (accessed on 3 March 2020).
  31. Marine Institute. Ireland’s Marine Renewable Energy Atlas. 2023. Available online: http://atlas.marine.ie/OceanEnergy.html#?c=53.9108:-15.8862:6 (accessed on 11 January 2022).
  32. Copernicus Marine Service. 2022. Available online: https://marine.copernicus.eu/ (accessed on 11 May 2022).
  33. Martín, L.G.S.; Barrera, E.; Toledano, C.; Amo, A.; Aouf, L.; Sotillo, M. Product User Manual for Atlantic-Iberian Biscay Irish-Wave Reanalysis Product IBI_MULTIYEAR_WAV_005_006; Copernicus Marine Service: Toulouse, France, 2021. [Google Scholar]
  34. Tonani, M.; Saulter, A. Product User Manual for NWS Ocean Waves Reanalysis Product NWSHELF_REANALYSIS_WAV_004_015; Copernicus Marine Service: Toulouse, France, 2021. [Google Scholar]
  35. Cahill, B.; Lewis, T. Wave Period Ratios and the Calculation of Wave Power. In Proceedings of the 2nd Marine Energy Technology Symposium, Seattle, WA, USA, 15–18 April 2014. [Google Scholar]
  36. GitHub. Georgebv/Pyextremes. 2022. Available online: https://github.com/georgebv/pyextremes (accessed on 12 January 2022).
  37. Copernicus. ERA5 Hourly Data on Single Levels from 1959 to Present. 2022. Available online: https://cds.climate.copernicus.eu/cdsapp#!/dataset/reanalysis-era5-single-levels?tab=overview (accessed on 1 December 2022).
  38. Selkie. WP8—Selkie Project. Available online: https://www.selkie-project.eu/tools/wp8/ (accessed on 7 November 2020).
  39. Marine Institute. Ocean Forecasts. 2021. Available online: http://www.marine.ie/Home/site-area/data-services/marine-forecasts/ocean-forecasts (accessed on 22 October 2021).
  40. Lewis, M.; McNaughton, J.; Márquez-Dominguez, C.; Todeschini, G.; Togneri, M.; Masters, I.; Allmark, M.; Stallard, T.; Neill, S.; Goward-Brown, A.; et al. Power variability of tidal-stream energy and implications for electricity supply. Energy 2019, 183, 1061–1074. [Google Scholar] [CrossRef]
  41. Europen Marine Observation and Data Network (EMODnet). Bathymentry. 2020. Available online: https://www.emodnet-bathymetry.eu/data-products (accessed on 4 May 2020).
  42. Europen Marine Observation and Data Network (EMODnet). Bathymetry Viewing and Download Service. 2020. Available online: https://portal.emodnet-bathymetry.eu/ (accessed on 4 May 2020).
  43. Europen Marine Observation and Data Network (EMODnet). Seabed Substrates. 2020. Available online: https://www.emodnet-geology.eu/data-products/seabed-substrates/#:~:text=EMODnet%20Seabed%20Substrate%20data%20products,Geology%20projects%20running%20since%202009 (accessed on 1 November 2021).
  44. Peters, J.L.; Butschek, F.; O’Connell, R.; Cummins, V.; Murphy, J.; Wheeler, A. Geological seabed stability model for informing Irish offshore. Adv. Geosci. 2020, 54, 55–65. [Google Scholar] [CrossRef]
  45. Europen Marine Observation and Data Network (EMODnet). HUMAN ACTIVITIES. 2022. Available online: https://www.emodnet-humanactivities.eu/ (accessed on 3 June 2022).
  46. European Marine Observation and Data Network (EMODnet). View Data. 2022. Available online: https://www.emodnet-humanactivities.eu/view-data.php (accessed on 3 June 2022).
  47. Desmond, C.; Butschek, F. EirWind Offshore Development Zones and Pathways Interviews Summary; University College Cork: Cork, Ireland, 2020. [Google Scholar]
  48. KIS-ORCA—Offshore Renewable & Cable Awareness (KIS-ORKIS-ORCA). Kingfisher Information Service—Offshore Renewable & Cable Awareness. 2021. Available online: https://kis-orca.org/map/ (accessed on 15 October 2021).
  49. Government of Ireland. Ireland’s Open Data Portal. 2020. Available online: https://data.gov.ie/ (accessed on 2 January 2020).
  50. Joint Nature Conservation Committee (JNCC). Search. 2020. Available online: https://hub.jncc.gov.uk/search (accessed on 2 January 2020).
  51. Esri. About Esri. 2022. Available online: https://www.esri.com/en-us/about/about-esri/overview (accessed on 3 May 2022).
  52. Esri. ArcGIS API for JavaScript. 2022. Available online: https://developers.arcgis.com/javascript/latest/ (accessed on 3 May 2022).
  53. VS Code. Code editing Redefined. 2022. Available online: https://code.visualstudio.com/ (accessed on 3 May 2022).
  54. Marine Institute. Wave Buoys. 2021. Available online: http://www.marine.ie/site-area/data-services/real-time-observations/wave-buoys (accessed on 15 November 2022).
  55. NNRCMP. Wave Hub. 2021. Available online: https://coastalmonitoring.org/realtimedata/?chart=116 (accessed on 1 November 2021).
  56. Marine Institute. Ireland’s Marine Atlas. Available online: https://atlas.marine.ie/#?c=53.9108:-15.9082:6 (accessed on 18 April 2020).
  57. O’Connell, R.; de Montera, L.; Peters, J.; Horion, S. An updated assessment of Ireland’s wave energy resource using satellite data assimilation and a revised wave period ratio. Renew. Energy 2020, 160, 1431–1444. [Google Scholar] [CrossRef]
  58. Gallagher, S.; Tiron, R.; Whelan, E.; Gleeson, E.; Dias, F.; McGrath, R. The nearshore wind and wave energy potential of Ireland: A high resolution assessment of availability and accessibility. Renew. Energy 2016, 88, 495–516. [Google Scholar] [CrossRef]
  59. Bento, A.R.; Martinho, P.; Campos, R.; Soares, C.G. Modelling Wave Energy Resources in The Irish West Coast. In Proceedings of the ASME 2011 30th International Conference on Ocean, Offshore and Arctic Engineering, Rotterdam, The Netherlands, 19–24 June 2011. [Google Scholar]
  60. Penalba, M.; Ulazia, A.; Ibarra-Berastegui, G.; Ringwood, J.; Sáenz, J. Wave energy resource variation off the west coast of Ireland and its impact on realistic wave energy converters’ power absorption. Appl. Energy 2018, 224, 205–219. [Google Scholar] [CrossRef]
  61. Alexis, M.; Ringwood, J. Power production assessment for wave energy converters: Overcoming the perils of the power matrix. Proc. Inst. Mech. Eng. Part M J. Eng. Marit. Environ. 2018, 232, 50–70. [Google Scholar]
  62. Hiles, C.; Beatty, S.; De Andres, A. Wave Energy Converter Annual Energy Production Uncertainty Using Simulations. J. Mar. Sci. Eng. 2016, 4, 53. [Google Scholar] [CrossRef] [Green Version]
  63. O’Boyle, I.; Doherty, K.; Hoff, J.V.; Skelton, J. The value of full scale prototype data testing oyster 800 at EMEC. In Proceedings of the 11th European Wave and Tidal Energy Conference (EWTEC), Nantes, France, 6–11 September 2015. [Google Scholar]
  64. De Andres, A.M.; Todalshaug, J.H.; Möller, P.; Bould, D.; Jeffrey, H. Techno-Economic Related Metrics for a Wave Energy Converters Feasibility Assessment. Sustainability 2016, 8, 1109. [Google Scholar] [CrossRef] [Green Version]
  65. Cavazzi, S.; Dutton, A.G. An Offshore Wind Energy Geographic Information System (OWE-GIS) for assessment of the UK’s offshore wind energy potential. Renew. Energy 2015, 87, 212–228. [Google Scholar] [CrossRef]
  66. Martinez, A.; Iglesias, G. Mapping of the levelised cost of energy for floating offshore wind in the European Atlantic. Renew. Sustain. Energy Rev. 2022, 154, 111889. [Google Scholar] [CrossRef]
  67. EirGrid Group. Transmission System; EirGrid Group: Dublin, Ireland, 2021. [Google Scholar]
  68. The Crown Estate. Resource and Constraints Assessment for Offshore Wind: Methodology Report; RPS Energy: London, UK, 2019. [Google Scholar]
  69. Díaz, H.; Loughney, S.; Wang, J.; Soares, C.G. Comparison of multicriteria analysis techniques for decision making on floating offshore wind farms site selection. Ocean. Eng. 2022, 248, 110751. [Google Scholar] [CrossRef]
  70. Sustainable Energy Ireland. Tidal & Current Energy Resources in Ireland; Sustainable Energy Ireland: Dublin, Ireland, 2010.
  71. O’Rourke, F.; Boyle, F.; Reynolds, A. Tidal current energy resource assessment in Ireland: Current status and future update. Renew. Sustain. Energy Rev. 2010, 14, 3206–3212. [Google Scholar] [CrossRef] [Green Version]
  72. Burrows, R.; Yates, N.; Hedges, T.; Li, M.; Zhou, J.; Chen, D.; Walkington, I.; Wolf, J.; Holt, J.; Proctor, R. Tidal energy potential in UK waters. Proc. Inst. Civ. Eng. Marit. Eng. 2009, 162, 155–164. [Google Scholar] [CrossRef]
  73. Iyer, A.; Couch, S.; Harrison, G.; Wallace, A. Variability and phasing of tidal current energy around the United Kingdom. Renew. Energy 2012, 51, 343–357. [Google Scholar] [CrossRef] [Green Version]
  74. Charlier, R. A “sleeper” awakes: Tidal current power. Renew. Sustain. Energy Rev. 2003, 7, 515–529. [Google Scholar] [CrossRef]
  75. Kuang, Y.; Zhang, Y.; Zhou, B.; Li, C.; Cao, Y.; Li, L.; Zeng, L. A review of renewable energy utilization in islands. Renew. Sustain. Energy Rev. 2016, 59, 504–513. [Google Scholar] [CrossRef]
  76. Alves, M.; Segurado, R.; Costa, M. On the road to 100% renewable energy systems in isolated islands. Energy 2020, 198, 117321. [Google Scholar] [CrossRef]
  77. Almoghayer, M.; Woolf, D.; Kerr, S.; Davies, G. Integration of tidal energy into an island energy system—A case study of Orkney islands. Energy 2021, 242, 122547. [Google Scholar] [CrossRef]
  78. Fadaeenejad, M.; Shamsipour, R.; Rokni, S.; Gomes, C. New approaches in harnessing wave energy: With special attention to small islands. Renew. Sustain. Energy Rev. 2014, 29, 345–354. [Google Scholar] [CrossRef]
  79. Green Rebel Marine. Geophysical Surveying. 2023. Available online: https://www.greenrebel.ie/service/marine/ (accessed on 1 April 2023).
  80. Department of the Environment, Climate and Communi, Geological Survey of Ireland and Marine Institute. Mapping Our Seabed. 2020. Available online: https://www.infomar.ie/ (accessed on 12 April 2020).
Figure 1. General flow of steps taken in the methodology of this study.
Jmse 11 00826 g001
Figure 2. The Selkie Study Area extending beyond the Irish and Welsh Territorial Seas.
Jmse 11 00826 g002
Figure 3. The geospatial availability of each seabed substrate dataset and areas with no data coverage.
Jmse 11 00826 g003
Figure 4. The model developed in ArcGIS Pro to process the AIS data for general cargo ships.
Jmse 11 00826 g004
Figure 5. The model developed in ArcGIS Pro to process the AIS data for fishing vessels.
Jmse 11 00826 g005
Figure 6. The CWA tool interface as it appears once opened by the user.
Jmse 11 00826 g006
Figure 7. The workflow for identifying potential and optimum sites in the case study.
Jmse 11 00826 g007
Figure 8. The annual mean wave power resource in kW per linear metre of wave crest (kW/m).
Jmse 11 00826 g008
Figure 9. The seasonal mean wave power resource in kW per linear metre of wave crest for (a) spring, (b) summer, (c) autumn and (d) winter.
Jmse 11 00826 g009
Figure 10. The values in metres for the 50-year return period significant wave height.
Jmse 11 00826 g010
Figure 11. Annual accessibility (%) based on CTV operating limits of 1.5 m Hs and 20 m/s wind speed.
Jmse 11 00826 g011
Figure 12. Annual accessibility (%) based on HLV operating limits of 2 m Hs and 15 m/s wind speed.
Jmse 11 00826 g012
Figure 13. Mean peak current velocity on spring tides (m/s).
Jmse 11 00826 g013
Figure 14. The water depth between 0 and 300 m (values exceeding 300 m are shaded grey).
Jmse 11 00826 g014
Figure 15. The seabed character represented using the Folk-7 classification.
Jmse 11 00826 g015
Figure 16. The areas where trenching to shore is not possible (in light grey) and possible (in orange).
Jmse 11 00826 g016
Figure 17. The excavation layer zoomed in on the Cork coast.
Jmse 11 00826 g017
Figure 18. The busiest 1.5% (orange) and 1% (red) areas for shipping in the Selkie study area based on a three-year time series of AIS data (h/km2/month).
Jmse 11 00826 g018
Figure 19. The busiest 20% (orange) and 10% (red) areas for fishing in the Selkie study area based on a three-year time series of AIS data (h/km2/month).
Jmse 11 00826 g019
Figure 20. The subsea cable and pipeline infrastructure which run through the study area (red lines) and its associated 1 km buffer zones for exclusion (yellow outline).
Jmse 11 00826 g020
Figure 21. Protected areas throughout the Selkie study area.
Jmse 11 00826 g021
Figure 22. (a) Potential (dark blue) and optimum (light blue) sites for wave energy deployment based on survey responses from an OWC WEC technology developer. (b) Potential (dark blue) and optimum (light blue) sites for wave energy deployment based on survey responses from a Point Absorber WEC technology developer. (c) Potential (dark blue) and optimum (light blue) sites for wave energy deployment based on survey responses from an Attenuator WEC technology developer. (d) Potential (dark blue) and optimum (light blue) sites for wave energy deployment based on survey responses from all WEC technology developers.
Jmse 11 00826 g022aJmse 11 00826 g022b
Figure 23. (a) Potential sites for tidal energy deployment based on survey responses from a Fixed Bottom TEC technology developer. (b) Potential sites for tidal energy deployment based on survey responses from a Floating TEC technology developer. (c) Optimum sites for tidal energy deployment based on survey responses from a Fixed Bottom TEC technology developer. (d) Optimum sites for tidal energy deployment based on survey responses from a Floating TEC technology developer.
Jmse 11 00826 g023aJmse 11 00826 g023bJmse 11 00826 g023c
Figure 24. In situ validation points with reference to the potential wave and tidal energy sites.
Jmse 11 00826 g024
Table 1. Details of wave data downloaded.
ParameterProduct 1 DescriptionProduct 2 Description
NameAtlantic- European North-West Shelf- Wave Physics ReanalysisAtlantic -Iberian Biscay Irish—Ocean Wave Reanalysis
Spatial Resolution1.9 km × 1.5 km5 km × 5 km
Temporal ResolutionThree-hourlyHourly
Analysis Period2000–2019 (20 years of data)2000–2019 (20 years of data)
Underlying modelWaveWatch IIIMFWAM (Meteo-France)
Variables selectedSpectral significant wave height (Hm0)’, ‘Spectral moments (−1,0) wave period (Tm-10)’ and ‘Wave period at spectral peak/peak period (Tp)Spectral significant wave height (Hm0)’, ‘Spectral moments (−1,0) wave period (Tm-10)’ and ‘Wave period at spectral peak/peak period (Tp)
Table 2. Details of wind data downloaded.
ParameterDescription
Spatial Resolution17 km × 27.5 km
Temporal ResolutionHourly
Analysis Period2000–2019 (20 years of data)
Variables selected10 m u-component of neutral wind, 10 m v-component of wind
Data used in calculationsRoot mean square of the u and v components of the 10 m wind speed
Spatial Resolution0.25° × 0.25°, which equates to an approximately 17 km × 27.5 km grid at the latitude of Ireland.
Table 3. Details of tidal data downloaded.
ParameterDescription
Spatial Resolution1.9 km × 1.9 km
Temporal ResolutionHourly
Analysis Period1 January 2020 to 30 December 2020 (1 year of data)
Variables selected‘uB’ (U-component barotropic velocity) and ‘vB’ (V-component barotropic velocity)
Underlying model/equationReynolds-averaged Navier–Stokes equations
Table 4. The tidal layers and their descriptions as created for the Oceanography group layer.
LayerDescription
Maximum spring peak current velocity (m/s)Maximum value for the peak flow of the spring current over the complete data time series.
Maximum neap peak current velocity (m/s)Maximum value for the peak flow of the neap current over the complete data time series.
Mean spring peak current velocity (m/s)Average value for the peak flow of the spring current over the complete data time series.
Mean neap peak current velocity (m/s)Average value for the peak flow of the neap current over the complete data time series.
Mean peak current velocity (m/s)Average value for the peak flow of the current, irrespective of spring/neap cycles, over the complete data time series.
Max peak current velocity (m/s)Maximum value for the peak flow of the current, irrespective of spring/neap cycles, over the complete data time series.
Table 5. The tidal layers and their descriptions as created for the Ocean Energy Resources group layer.
LayerDescription
Annual Tidal Energy (Wh/m2)The total annual energy that is theoretically available over the complete data time series.
Annual Neap Tidal Energy (Wh/m2)The total annual energy that is theoretically available with current values taken only from neap tidal cycles.
Annual Spring Tidal Energy (Wh/m2)The total annual energy that is theoretically available with current values taken only from spring tidal cycles.
Table 6. Seabed substrate dataset details.
Dataset ScaleConfidence LevelProducedUpdated
1:50,0004 1 (highest possible score)March 2019September 2021
1:100,0004 1 (highest possible score)March 2019September 2021
1:250,000Unknown 2October 2016September 2021
1 RS Coverage is good (≥90%). Every/almost every class in the map was sampled. Most classes are distinct in the remote sensing data. 2 Confidence information is missing because they were collated as separate data layers.
Table 7. Details of wave site selection inputs based on technology developer survey responses.
Oscillating Water Column WEC
CriteriaMeasureValue
ResourceTheoretical annual average (kW/m)≥35
Depth rangeMetres (m)50–120
Seabed characterFolk 7 classificationSandy Mud, Muddy Sand, Sand, Coarse Substrate, Mixed Sediment
Point Absorber WEC
CriteriaMeasureValue
ResourceTheoretical annual average (kW/m)≥15
Depth rangeMetres (m)30–300
Seabed characterFolk 7 classificationMud, Sandy Mud, Muddy Sand, Sand, Mixed Sediment
Attenuator WEC
CriteriaMeasureValue
ResourceTheoretical annual average resource (kW/m)≥15
Depth rangeMetres (m)10–150
Seabed characterFolk 7 classificationSandy Mud, Muddy Sand, Sand, Coarse Substrate, Coarse Substrate, Mixed Sediment
All/Generic WEC
CriteriaMeasureValue
ResourceTheoretical annual average resource (kW/m)≥15
Depth rangeMetres (m)10–300
Seabed characterFolk 7 classificationSandy Mud, Muddy Sand, Sand, Coarse Substrate, Coarse Substrate, Mixed Sediment
Table 8. Details of tidal site selection inputs based on technology developer survey responses.
Fixed Bottom TEC (Resource Selection 1)
CriteriaMeasureValue
ResourceCurrent velocity on mean spring tides (m/s)≥1
Depth rangeMetres (m)20–100
Seabed characterFolk 7 classificationSandy Mud, Sand, Coarse Substrate, Mixed Sediment, Rock and Boulders
Fixed bottom TEC (resource selection 2)
CriteriaMeasureValue
ResourceCurrent velocity on mean spring tides (m/s)≥1.5
Depth rangeMetres (m)20–100
Seabed characterFolk 7 classificationSandy Mud, Sand, Coarse Substrate, Mixed Sediment, Rock and Boulders
Floating surface TEC (resource selection 1)
CriteriaMeasureValue
ResourceCurrent velocity on mean spring tides (m/s)≥1
Depth rangeMetres (m)40–60
Seabed characterFolk 7 classificationMud, Muddy Sand, Sand
Floating surface TEC (resource selection 2)
CriteriaMeasureValue
ResourceCurrent velocity on mean spring tides (m/s)≥1.5
Depth rangeMetres (m)40–60
Seabed characterFolk 7 classificationMud, Muddy Sand, Sand
Table 9. Details of additional site selection inputs for identification of optimum wave energy sites.
Additional Criteria (All WEC Technologies)
AccessibilityAnnual frequency of Hs < 1.5 m and wind speed < 20 m/s (%)>20
FishingAIS density—hours/km2/monthBusiest 20% (>17,396)
Protected areasSACs, SPAs, MPAs and MCZsExclude all
Cable accessExcavation classificationExcavatable
Table 10. Details of additional site selection inputs for identification of optimum tidal energy sites.
Additional Criteria (All TEC Technologies)
AccessibilityAnnual frequency of Hs < 2 m and wind speed < 15 m/s (%)>20
FishingAIS density—hours/km2/monthBusiest 20% (>17,396)
Protected areasSACs, SPAs, MPAs and MCZsExclude all
Cable accessExcavation classificationExcavatable
Table 11. Results of the wave model validation.
Product 1—Significant Wave Height
BuoyBias (m)RMSESIR
WestWave0.23990.41750.17770.9739
WaveHub0.02560.26660.13410.9729
Product 1—Wave Energy Period
BuoyBias (s)RMSESIR
WestWave−0.049900.88820.12500.8876
WaveHub0.13940.67520.11510.8932
Product 2—Significant Wave Height
BuoyBias (m)RMSESIR
WestWave0.34590.47730.21260.9807
WaveHub0.08790.28460.14770.9721
Product 2—Wave Energy Period
BuoyBias (m)RMSESIR
WestWave−0.57840.88280.12280.9134
WaveHub−0.10810.74100.12120.8923
Table 12. Results of bathymetry and seabed character model validation.
Bathymetry
SiteModelled DepthMeasured Depth
Atlantic97 m99 m
Celtic Sea96 m100 m
Irish Sea63 m67 m
ISWCS47 m50 m
Seabed Character
SiteModelled Folk 7 ClassMeasured Folk 7 Class
AtlanticSandSand
Celtic SeaSandSand
Irish SeaSandSand
ISWCSCoarse SubstrateCoarse Substrate
Disclaimer/Publisher’s Note: The statements, opinions and data contained in all publications are solely those of the individual author(s) and contributor(s) and not of MDPI and/or the editor(s). MDPI and/or the editor(s) disclaim responsibility for any injury to people or property resulting from any ideas, methods, instructions or products referred to in the content.

