Article

Maximizing Green Hydrogen Production from Water Electrocatalysis: Modeling and Optimization

1
Department of Electrical Engineering, College of Engineering in Wadi Alddawasir, Prince Sattam bin Abdulaziz University, Al-Kharj 11991, Saudi Arabia
2
Sustainable Energy & Power Systems Research Centre, University of Sharjah, Sharjah P.O. Box 27272, United Arab Emirates
3
Mechanical Engineering and Design, School of Engineering and Applied Science, Aston University, Aston Triangle, Birmingham B4 7ET, UK
4
Department of Chemical Engineering, Faculty of Engineering, Minia University, Elminia 27272, Egypt
5
Department of Industrial and Systems Engineering, Auburn University, Auburn, AL 36849, USA
6
Department of Mechanical Engineering, Faculty of Engineering, Tafila Technical University, Tafila 66110, Jordan
*
Author to whom correspondence should be addressed.
J. Mar. Sci. Eng. 2023, 11(3), 617; https://doi.org/10.3390/jmse11030617
Submission received: 20 January 2023 / Revised: 11 March 2023 / Accepted: 13 March 2023 / Published: 15 March 2023
(This article belongs to the Special Issue Marine Fuels and Green Energy)

Abstract

:
The use of green hydrogen as a fuel source for marine applications has the potential to significantly reduce the carbon footprint of the industry. The development of a sustainable and cost-effective method for producing green hydrogen has gained a lot of attention. Water electrolysis is the best and most environmentally friendly method for producing green hydrogen-based renewable energy. Therefore, identifying the ideal operating parameters of the water electrolysis process is critical to hydrogen production. Three controlling factors must be appropriately identified to boost hydrogen generation, namely electrolysis time (min), electric voltage (V), and catalyst amount (μg). The proposed methodology contains the following two phases: modeling and optimization. Initially, a robust model of the water electrolysis process in terms of controlling factors was established using an adaptive neuro-fuzzy inference system (ANFIS) based on the experimental dataset. After that, a modern pelican optimization algorithm (POA) was employed to identify the ideal parameters of electrolysis duration, electric voltage, and catalyst amount to enhance hydrogen production. Compared to the measured datasets and response surface methodology (RSM), the integration of ANFIS and POA improved the generated hydrogen by around 1.3% and 1.7%, respectively. Overall, this study highlights the potential of ANFIS modeling and optimal parameter identification in optimizing the performance of solar-powered water electrocatalysis systems for green hydrogen production in marine applications. This research could pave the way for the more widespread adoption of this technology in the marine industry, which would help to reduce the industry’s carbon footprint and promote sustainability.

1. Introduction

Population growth and technological advances have been significant contributors to global warming. The exponential growth of the world’s population has resulted in an increase in demand for goods and services, resulting in the rise of industrialization and the development of new technologies and, thus, an increase in energy consumption. Unfortunately, fossil fuels are the primary energy sources that have resulted in the accumulation of greenhouse gases and, thus, global warming [1,2,3]. The rise in global temperatures has resulted in severe climate changes, such as rising sea levels, droughts, and extreme weather events. As a result, there is a growing need for individuals, businesses, and governments to take action and reduce greenhouse gas emissions in order to mitigate the effects of global warming. In order to combat the effects of global warming, a number of strategies have been put into action. Besides carbon capture and storage [4,5,6], these strategies include enhancing currently operating processes through waste heat recovery, employing highly effective energy conversion devices, such as fuel cells, and shifting toward the use of renewable energy sources. The consensus among experts is that renewable sources of energy offer the best combination of practicability and long-term viability among these choices. Particularly, wind and solar energy have found their way into commercial applications all over the world [7,8,9]. Hydrogen is a clean and versatile form of energy that can be used for a variety of applications, including transportation, residential use, and industrial use, among others. It can be used both as a storage medium for energy and a carrier of that energy. Green hydrogen production from solar-powered water electrocatalysis is a process that uses electricity from solar power to split water molecules into hydrogen and oxygen. The hydrogen produced in this way is considered “green” because it is generated using a renewable energy source rather than fossil fuels. Recently, a substantial amount of studies have been focused on producing hydrogen using renewable energy sources rather than fossil fuels [10,11]. Water electrolysis is a safe, clean, and efficient approach to producing hydrogen, especially if integrated with a renewable energy source, such as wind or solar energy [12,13]. Therefore, there are no greenhouse gas emissions, as the products of water electrolysis are only hydrogen and oxygen, and the water is reproduced again by using hydrogen as a fuel. From a thermodynamic point of view, the energy content of hydrogen is three times greater than that of fossil fuels [14,15]. As a result, hydrogen as a sustainable energy source could replace fossil fuels to create a green and clean environment [16,17]. Approximately one-fourth of all emission levels from the worldwide transportation sector are produced by maritime shipping [18]. The shipping sector, which emits about one billion tons of CO2 annually, faces considerable pressure to reduce carbon emissions in the next few decades [19]. In order to link the shipping sector with the goals of the Paris Climate Agreement, the International Maritime Organization (IMO) has advocated for a 50% decrease in greenhouse gas (GHG) emissions by 2050, corresponding to 2008 levels [20]. The IMO has directed the shipping industry toward adopting carbon-free fuels, hydrogen [21], batteries [22], fuel cells [23,24], and electric propulsion systems [25]. However, adopting the safety and reliability of these innovative technologies can be costly. Therefore, an eco-friendly ship design for affordable marine demonstrations and international collaboration for achieving carbon neutrality in the industry is recommended [26,27].
There are several studies that have been conducted in recent years related to marine fuels. These studies have aimed to address various challenges and issues faced by the marine industry, particularly in terms of fuel stability, composition, and transportation of alternative fuels. Smyshlyaeva et al. [28] analyzed the impact of asphaltene genesis on sedimentation stability in low-sulfur residual marine fuel using the RMG 380 fuel as an example. By analyzing various asphaltenes and crude oil, the study showed that as the asphaltene content increased above 4%, the stability of the fuel composition decreased. The study highlighted the importance of controlling the asphaltene content in marine fuels to maintain their stability. Ershov et al. [29] investigated the characteristics and composition of very-low-sulfur fuel oil and ultra-low-sulfur fuel oil bunkered in key ports worldwide. The key fuel components vary in different regions, with hydrodesulfurized atmospheric residues (ARs) being the most important in Asian ports while low-sulfur components, such as straight-run AR, are widely used in European ports. A mixture of hydrotreated and straight-run fuel oil is used as the base low-sulfur component in Singapore and the Middle East. Bolobov et al. [30] examined the impact of hydrogen on the mechanical properties of pipeline steels and assessed the potential of transporting compressed hydrogen through existing gas pipelines. This technology could be used to power hydrogen-fueled ships, reducing greenhouse gas emissions in the shipping industry. However, the study highlighted the need to address the effects of hydrogen on the mechanical properties of pipeline steels and the potential hydrogen losses through pipeline walls due to diffusion. These challenges must be overcome to ensure the safe and efficient transportation of compressed hydrogen for marine applications.
Eco-friendly fuels have proven critical in addressing environmental challenges associated with fossil fuel use while still satisfying energy demands. Hydrogen is the obvious frontrunner among the several clean fuel options now being tested. Hydrogen is considered a zero-carbon fuel. As a result, it is regarded as an environmentally favorable fuel choice [31,32]. Hydrogen is commercially synthesized via various approaches, including coal gasification and steam-reforming methane (natural gas). However, these approaches are not eco-friendly since they depend on fossil fuels and release carbon dioxide [33,34]. The worldwide yearly hydrogen consumption is 400–500 billion N m3, and it is expected to share 11% of the total energy demand in 2025, rising to 34% by 2050 [35]. In the context of marine manufacturing, the implementation of this green technology can considerably lessen the carbon footprint of the industry by replacing the fossil fuels used in marine vessels and other equipment [28,29] with ammonia and hydrogen [36,37,38]. The technology could also be integrated into offshore platforms and ships to produce hydrogen on-site, reducing the need for the transport and storage of hydrogen [39]. Lee et al. [40] proposed an integrated design of NH3 fuel supply and a re-liquefaction system for a large container ship. The proposed onboard re-liquefaction system has the capability to liquefy boil-off gases (BOGs) from the fuel tank. Furthermore, they recommend introducing this system because it comes at a reasonable cost of less than one million USD. Bertagna et al. [41] compared the use of different fuels (hydrogen, NH3, and LNG) and technologies (fuel cells and internal combustion engines) for a medium/large-sized passenger cruise ship, highlighting the challenges and limitations of each option. Huang et al. [42] investigated the effect of various nitrous oxide emission abatement ratios on reducing emissions and identifying suitable marine fuels. Their findings indicate that using full solar and battery-powered ammonia with a 90% reduction in nitrous oxide emissions is more efficient than methanol. Consequently, ammonia can be a superior alternative for decreasing nitrous oxide emissions. Lee [43] analyzed the environmental impact of marine gas oil, liquefied natural gas, and hydrogen as alternative ship fuels. The study covered their life cycle from production to shipping operations. Hydrogen had the highest GWP due to the significant emissions generated through the steam methane reforming method. Despite its potential as an alternative fuel source for ships, hydrogen initiatives in the marine industry face several barriers, including safety concerns and the lack of necessary infrastructure and market regulation mechanisms [44,45]. Pilot projects have shown promise, but the current risks associated with hydrogen outweigh its potential ecological benefits, making it challenging to implement hydrogen as a mainstream fuel source in the marine industry [46]. To maximize the production of green hydrogen from solar-powered water electrocatalysis, it would be important to optimize the system design and operating conditions. This could include using high-efficiency solar cells and catalysts and developing advanced materials and designs for the electrolyzer itself [47]. Moreover, the system configuration could be optimized to suit the specific conditions of the marine environment, such as the effects of saltwater on the materials and components of the system and the effects of wave motion and other dynamic loads on the solar panels and electrolyzer [48,49,50]. In addition to optimizing the technology, research and development on the economic and regulatory aspects of green hydrogen production, such as hydrogen storage, transport, and distribution, would also be important [51,52]. Wang et al. [53] provided an overview of the present state of the hydrogen energy industry, with a particular emphasis on the development of a hydrogen expressway along the coast using offshore wind power hydrogen production. The study also considered the strategic placement of hydrogen refueling stations along this expressway. Overall, maximizing green hydrogen production from solar-powered water electrocatalysis in marine manufacturing would require a multi-disciplinary approach, including the optimization of technology, materials, and system design, as well as economic and regulatory considerations.
Although water electrolysis is a safe, simple, and clean method of producing hydrogen (4% of the global hydrogen production), the stability and cost of anode and cathode electrodes are still challenges [54]. The platinum (Pt) catalyst is the most electroactive catalyst for hydrogen evolution reactions (HERs), but its high cost and scarcity prevent it from being used in large-scale applications. Many attempts have been conducted to reduce the cost of hydrogen generation by water electrolysis by improving the process efficiency. One of the proposed techniques for large-scale hydrogen generation through water electrolysis is the development of a non-precious electrocatalyst with high HER activity [55]. Several non-Pt electrocatalysts were synthesized and investigated against HERs [56]. Since their d-orbit is less filled, transition metals could be employed as HER cathode electrodes because they can accept and donate electrons easily. Hydrothermal and calcination methods were used to create bifunctional double-layered hydroxides of nitrogen-doped nickel (Ni), zinc (Zn), and copper (Cu) with reduced graphene oxide, N-NiZnCu LDH/rGON, which was used as both an anode and cathode for hydrogen generation [57]. These electrodes were substantially more stable than Pt/C||IrO2. Furthermore, they could be used to treat ammonia, urea, or hydrazine-polluted wastewater while producing hydrogen. Operating temperature and pressure, catalyst type, electrode surface area and porosity, applied voltage, membrane type, pH, and other factors all influence the generation of hydrogen [58,59,60,61]. Choosing the optimal operating conditions is critical for maximizing the process efficiency at the lowest possible cost [62,63]. However, experimental optimization of such conditions is time-consuming, costly, and labor-intensive. There are different optimization methodologies, such as genetic algorithms [64], ANYSYS [65], artificial neural networks [66], and surface methodology [67]. Mathematical and physical models were successful to a large extent in modeling and optimizing the performance of numerous processes [68,69,70,71]. However, mathematical and physical models often depend on assumptions that ultimately decrease the accuracy of the suggested model and outcomes [72,73]. Compared to physical and mathematical models, artificial intelligence (AI) is simpler and more accurate [74,75]. Modeling and process optimization for several processes, including microbial fuel cells [76], fuel cells [77], hydrogen synthesis [78], bio-hydrogen production [79], alternative fuels [80,81,82], biofuels [83,84], etc., are effectively performed using AI. A new hydrogen production approach combined with a photovoltaic/thermal (PVT) solar collector is proposed by Senthilraja et al. [85]. In this work, the thermal efficiency, electrical efficiency, and hydrogen production rate were predicted using ANFIS. Salameh et al. [79] proposed integration between ANFIS and particle swarm optimization to improve the bio-hydrogen production process. The following four parameters are chosen to increase the hydrogen rate: the initial pH value, operating temperature, N/C ratio, and organic (xylose) concentration.
Optimizing the water electrolysis process is considered a viable approach for improving hydrogen evolution reactions. The present study takes advantage of such cooperation and proposes a method to improve the hydrogen production water electrolysis process. ANFIS modeling and parameter identification are the two primary processes used. The ANFIS model was able to accurately predict hydrogen production under various operating conditions regarding electrolysis duration, electric voltage, and catalyst amount using datasets obtained with permission. Following this, a pelican optimization algorithm (POA) optimizer was able to identify the best controlling parameters for maximizing the production of hydrogen. This study highlights the importance of considering multiple factors in the design and operation of water electrolysis systems for hydrogen production and the benefit of using advanced optimization and modeling techniques to enhance the performance of the system. The following are the main contributions of this study:
  • A reliable ANFIS model to replicate the electrolysis of water was developed.
  • For the first time, an innovative application of the pelican optimization algorithm was developed to determine the optimum values for the amount of catalyst, electrolysis time, and electric voltage.
  • Demonstrating the superiority and robustness of the proposed methodology.
  • Boosting the production of hydrogen from the water electrolysis process.
The rest of the paper is organized as follows: A brief description of the data used to model the water electrolysis process is presented in Section 2. The two phases of the proposed methodology are explained in Section 3. The obtained results are presented and discussed in Section 4. Finally, the findings are concluded in Section 5.

2. Experimental Methods

The following part describes the experimental steps to prepare the electrodes and the operating conditions for hydrogen production. Ni foam (NF) was coated with a thin layer of Ni-Cu using an electrodeposition approach. Firstly, after cleaning the NF of 1:1:0.16 cm with distilled water and ethanol, a thin coating of Ni-Cu was galvanostatically electrodeposited on the cleansed NF. For the Ni-Cu deposition on the NF, 1.25% C4H6O6, 1.25% H3BO3, 30% NiSO4·6H2O, and 3% CuSO4·5H2O were utilized. A constant current density of 5 mA/cm2 was supplied during the electrodeposition at varying operating durations calculated using Faraday’s laws to yield different catalyst loadings of 5, 10, and 15 μg. The coated NF electrodes were evaluated for hydrogen generation in a three-electrode cell with Ag/AgCl (the reference electrode) and platinum (the counter electrode) in 1M KOH. The I-V curves were performed in the range of −1.0 V to −1.8 V vs. Ag/AgCl at a scan rate of 0.05 V/s. The electrochemical impedance spectroscopy (EIS) measurements were performed in the range of 100 kHz and 10−2 Hz with a 5 mV amplitude at a cathodic potential of −1.5 V. The hydrogen gas was produced utilizing a two-electrode electrolysis cell configuration, in which the coated NF electrodes served as the cathodes and Pt served as the anodes. The system was constructed by inverting a burette containing 1M KOH over the cathode and applying constant potential values of 2.4, 2.7, and 3.0 V. The quantity of hydrogen gas in the burette was measured for 30 min at each potential. More details are available in [86].

3. Methodology

The methodology includes the two phases of ANFIS-based modeling and parameter identification, as explained in Figure 1. At first, based on experimental data, a reliable ANFIS model to simulate the electrolysis of the water process was developed in terms of the amount of catalyst, electrolysis time, and electric voltage. Then, for the first time, the pelican optimization algorithm was used to identify the optimal parameters of the electrolysis of the water process to increase the hydrogen production rate. During the optimization process, the amount of catalyst, the electrolysis time, and the electric voltage were used as decision variables. The data used in this study were obtained under license number 5467160511103.

3.1. ANFIS Modeling

Membership functions (MFs) in the fuzzification layer [87] allow for non-linear mapping of the inputs for the ANFIS model. In the inference engine phase, the rules of ANFIS were generated, the outputs of the rules were assessed, and the fired rules were combined to generate the final output. Ultimately, the output is converted from fuzzy form to crisp value at the defuzzification layer. Despite this, there are numerous MF forms and defuzzification methods, with the Gaussian shape and weight average receiving the best nomination. The IF-THEN rule represents the relationships between the inputs and outputs in the fuzzy model. The following relationship is an example of a fuzzy rule [88]:
IF m is M and n is N THEN z = f(m, n)
where m and n are the inputs, z is the output, and M and N are the MFs of m and n, respectively. The fuzzy rule demonstrates that the output z depends on the inputs m and n. The output f can be estimated using the outputs of the two rules, f1 and f2 as follows:
f = ω ˜ 1 f 1 + ω ˜ 2 f 2 ( Output   Layer )
Evaluating   ω ˜ 1 g 1 ( x , y )   and   ω ˜ 2 g 2 ( x , y ) ( Defuzzification   Layer )
ω ˜ 1 = ω 1 ω 1 + ω 2   and   ω ˜ 2 = ω 2 ω 1 + ω 2 ( N   Layer )
ω 1 = μ A 1 μ B 1   and   ω 2 = μ A 2 μ B 2 ( π   Layer )
where μ A 1 ,   μ A 2 , μ B 1 ,   a n d   μ B 2 are the MF values of the two inputs (Fuzzification Layer).

3.2. Pelican Optimization Algorithm (POA)

POA has been used to figure out the best electrolysis time, electric voltage, and catalyst quantity to maximize hydrogen generation from water electrolysis. POA is a population-based metaheuristic optimization method inspired by nature that resembles the swarm behavior of pelicans. This algorithm is divided into the following two steps [89]:
  • Phase 1: Moving toward Prey (Exploration Phase)
After a random initialization in the chosen search area, the pelicans locate the prey and then proceed toward it. The prey is created randomly during this phase, allowing the pelican-seeking technique to traverse the whole search field. This stage can be represented mathematically as follows:
x i , n e w 1 = { x i + r ( p I x i ) , f p < f i , n e w 1 x i + r ( x i p ) , e l s e
where xi is the location of the ith pelican, p is the prey position, r is a random, I represents a random number equal to 1 or 2, fp is the prey fitness, and fi is the fitness of the ith pelican. The following are the final positions in this phase, updated based on their fitness:
x i = { x i , n e w 1 , f i , n e w 1 < f i x i , e l s e
  • Phase 2: Winging on the Water Surface (Exploitation Phase)
When the pelicans approach the surface of a pond, they spread their wings to hoist the fish upward, after which they sweep them up in their throat pouches. Because of this strategy, pelicans catch more fish in the attacked zone. This process increases the exploitation potential. To come up with a more accurate response, the places around the pelican spot are explored quantitatively. The following equation analytically models this hunting behavior [89]:
x i , n e w 2 = x i + R ( 1 t t max ) ( 2 r 1 ) x i
where R = 0.2, t is the current iteration number and tmax is the maximum number of iterations. The final positions in this step are updated using the same technique as in Phase 1, as displayed in Equation (2). Figure 2 depicts the detailed operation of this method.
Once the model has been validated, the optimal values for the input parameters can be obtained using a pelican optimization process. The electrolysis time, electric voltage, and catalyst quantity were evaluated as decision variables, where the hydrogen generation is the output. The optimization issue can be expressed as follows:
arg X + m a x   ( f ( X ) )
where f ( X ) is the output of the ANFIS model and X = [ x 1 , x 2 , x 3 ] are the three controlling parameters, which varied in the ranges of x1∈ [10, 30], x2∈ [2.4, 3], and x3∈ [5, 15].

4. Results and Discussion
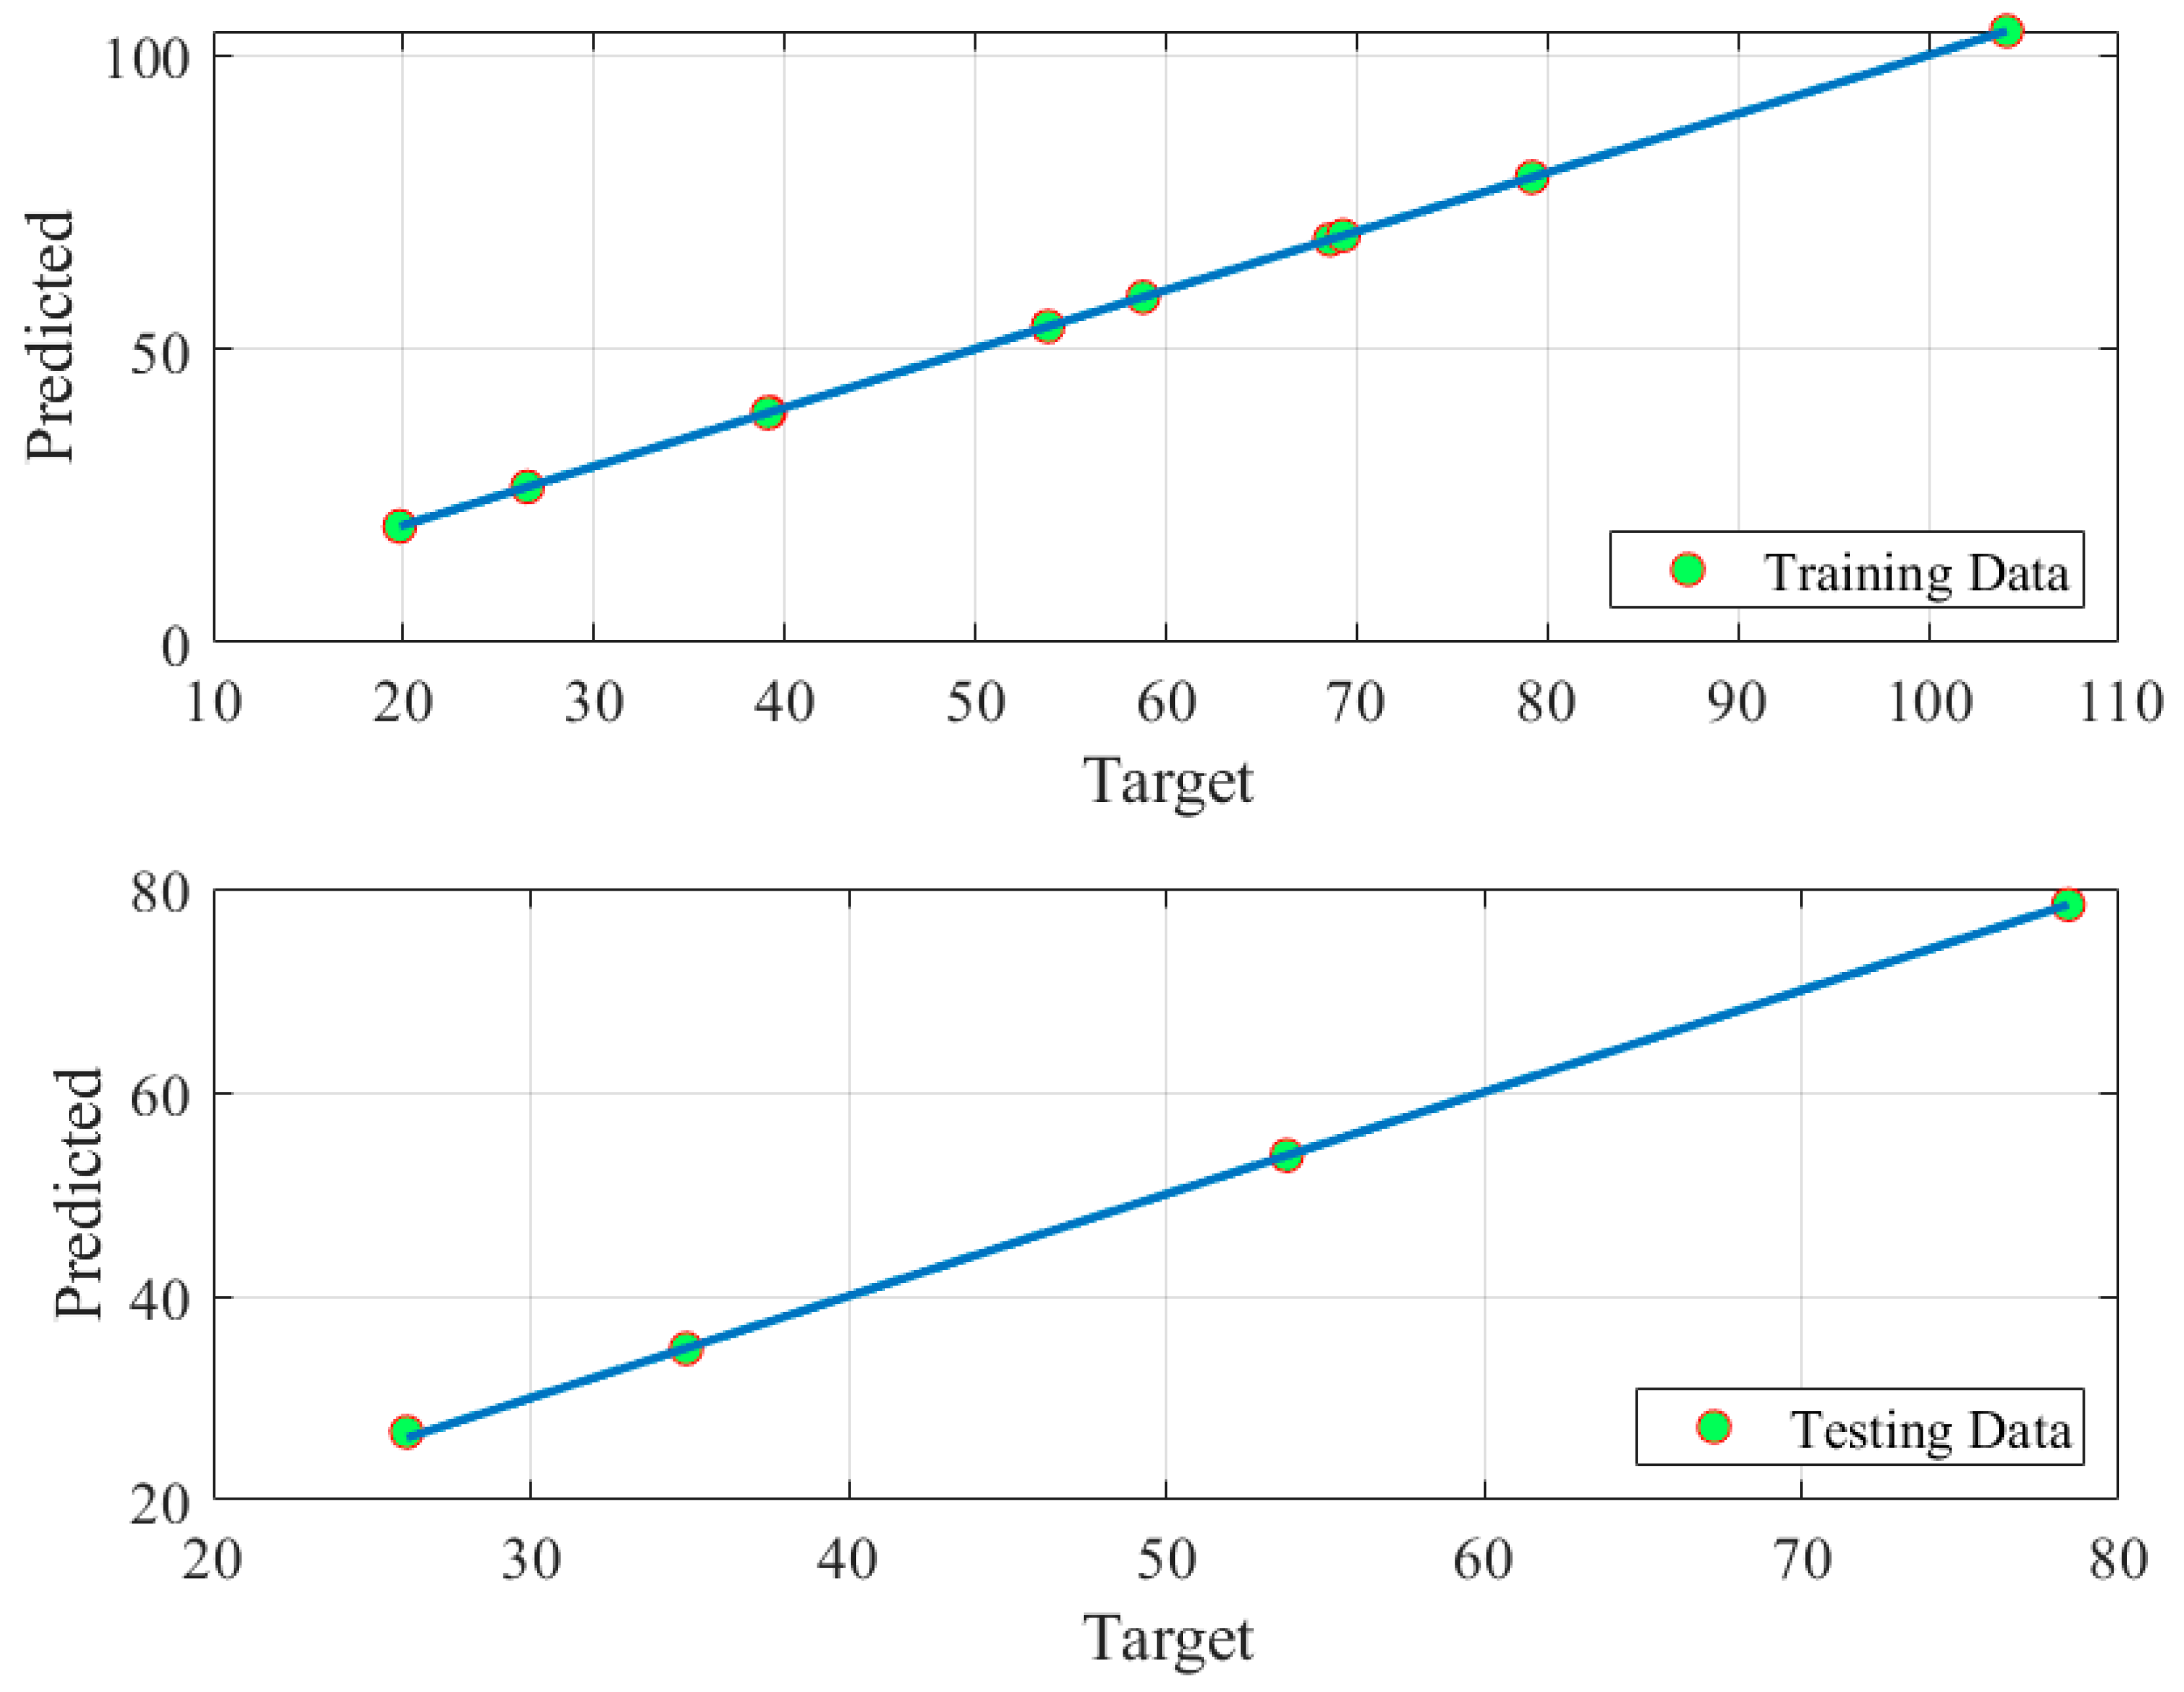
4.1. Modeling Phase

The ANFIS model is built using seventeen experimental data points obtained with permission. The inputs include electrolysis time, electric voltage, and catalyst quantity, with hydrogen generation being the output. The training-to-testing ratio is set at 70 to 30. The root mean square error (RMSE) and R-squared of the model predictions in relation to the datasets are shown in Table 1.
According to Table 1, the RMSE values for training and testing are 3.4 × 10⁻⁶ and 0.2308, respectively. For training and testing, the R-squared values are 1.00 and 0.9999, respectively. The reliability and accuracy of the ANFIS modeling are demonstrated by a very low RMSE and high R-squared values.
Figure 3 depicts the ANFIS model structure, which includes ten rules also presented in the Appendix A. Figure 4 displays the Gaussian-shaped MFs of the inputs. The MFs seem to be consistently distributed, implying that the measured data were generated using uniformly distributed input values. This distribution enables the ANFIS model to accurately select the input–output relationship. In the input space, each colored MF curve represents a cluster.
Examining the input–output relationship caused by the investigated system helps in comprehending the influence of the inputs on the output. Figure 5 depicts the 3D surfaces that connect each of the two inputs to the output. Specifically, Figure 5 demonstrates the influence of various combinations of the controlling factors, namely electrolysis time, electric voltage, and catalyst amount, on the hydrogen generated by the water electrolysis process. It was clear from Figure 5a,c that the applied voltage has a significant effect on hydrogen production, especially at low and high catalyst loadings (Figure 5a) and prolonged electrolysis times (Figure 5c). Moreover, the electrolysis time also has a significant effect on hydrogen production at the various catalyst loadings (Figure 5b) and at a high applied voltage (Figure 5c). The applied voltage is known as the main driving force for splitting water molecules into oxygen and hydrogen. However, a balance between the applied voltage (energy consumption) and hydrogen production (hydrogen energy output) should be optimized to work under the best economic conditions. It was also noticed from Figure 5a that at low applied voltages of 2.4 to 2.7 V, the medium catalyst loading demonstrated better performance than low and high catalyst loadings, and this could be related to the small amount of available catalyst and the agglomeration of the catalyst, respectively. As long as water is available on the catalyst surface and enough voltage is applied, hydrogen production will increase as the electrolysis time is increased.
Figure 6 shows the model predictions versus the corresponding datasets. The predictions in the training scenario, as shown in Table 1, are very comparable to the datasets for both training and testing. The predictions based on the 100% accuracy line are shown in Figure 7. All forecasts are very close to the line of 100% accuracy. This demonstrates that the constructed model is accurate.
Model verification is an important step after completing the ANFIS model. Table 2 compares the verification findings to the measured samples. Experimentally, the hydrogen generation is 106.2 mL for the following parameter values: 30 min, 3 V, and 11.35 μg for electrolysis duration, electric voltage, and catalyst quantity, respectively. Using the response surface approach and ANFIS-based modeling, the predicted generated hydrogen values and catalyst quantity under the same circumstances were 103.677 mL and 105.254 mL, respectively. The prediction error decreased from 2.38% when RSM was used to 0.89 when ANIFIS was used. As a result of the ANFIS-based modeling, the prediction error was reduced by 62.6%.

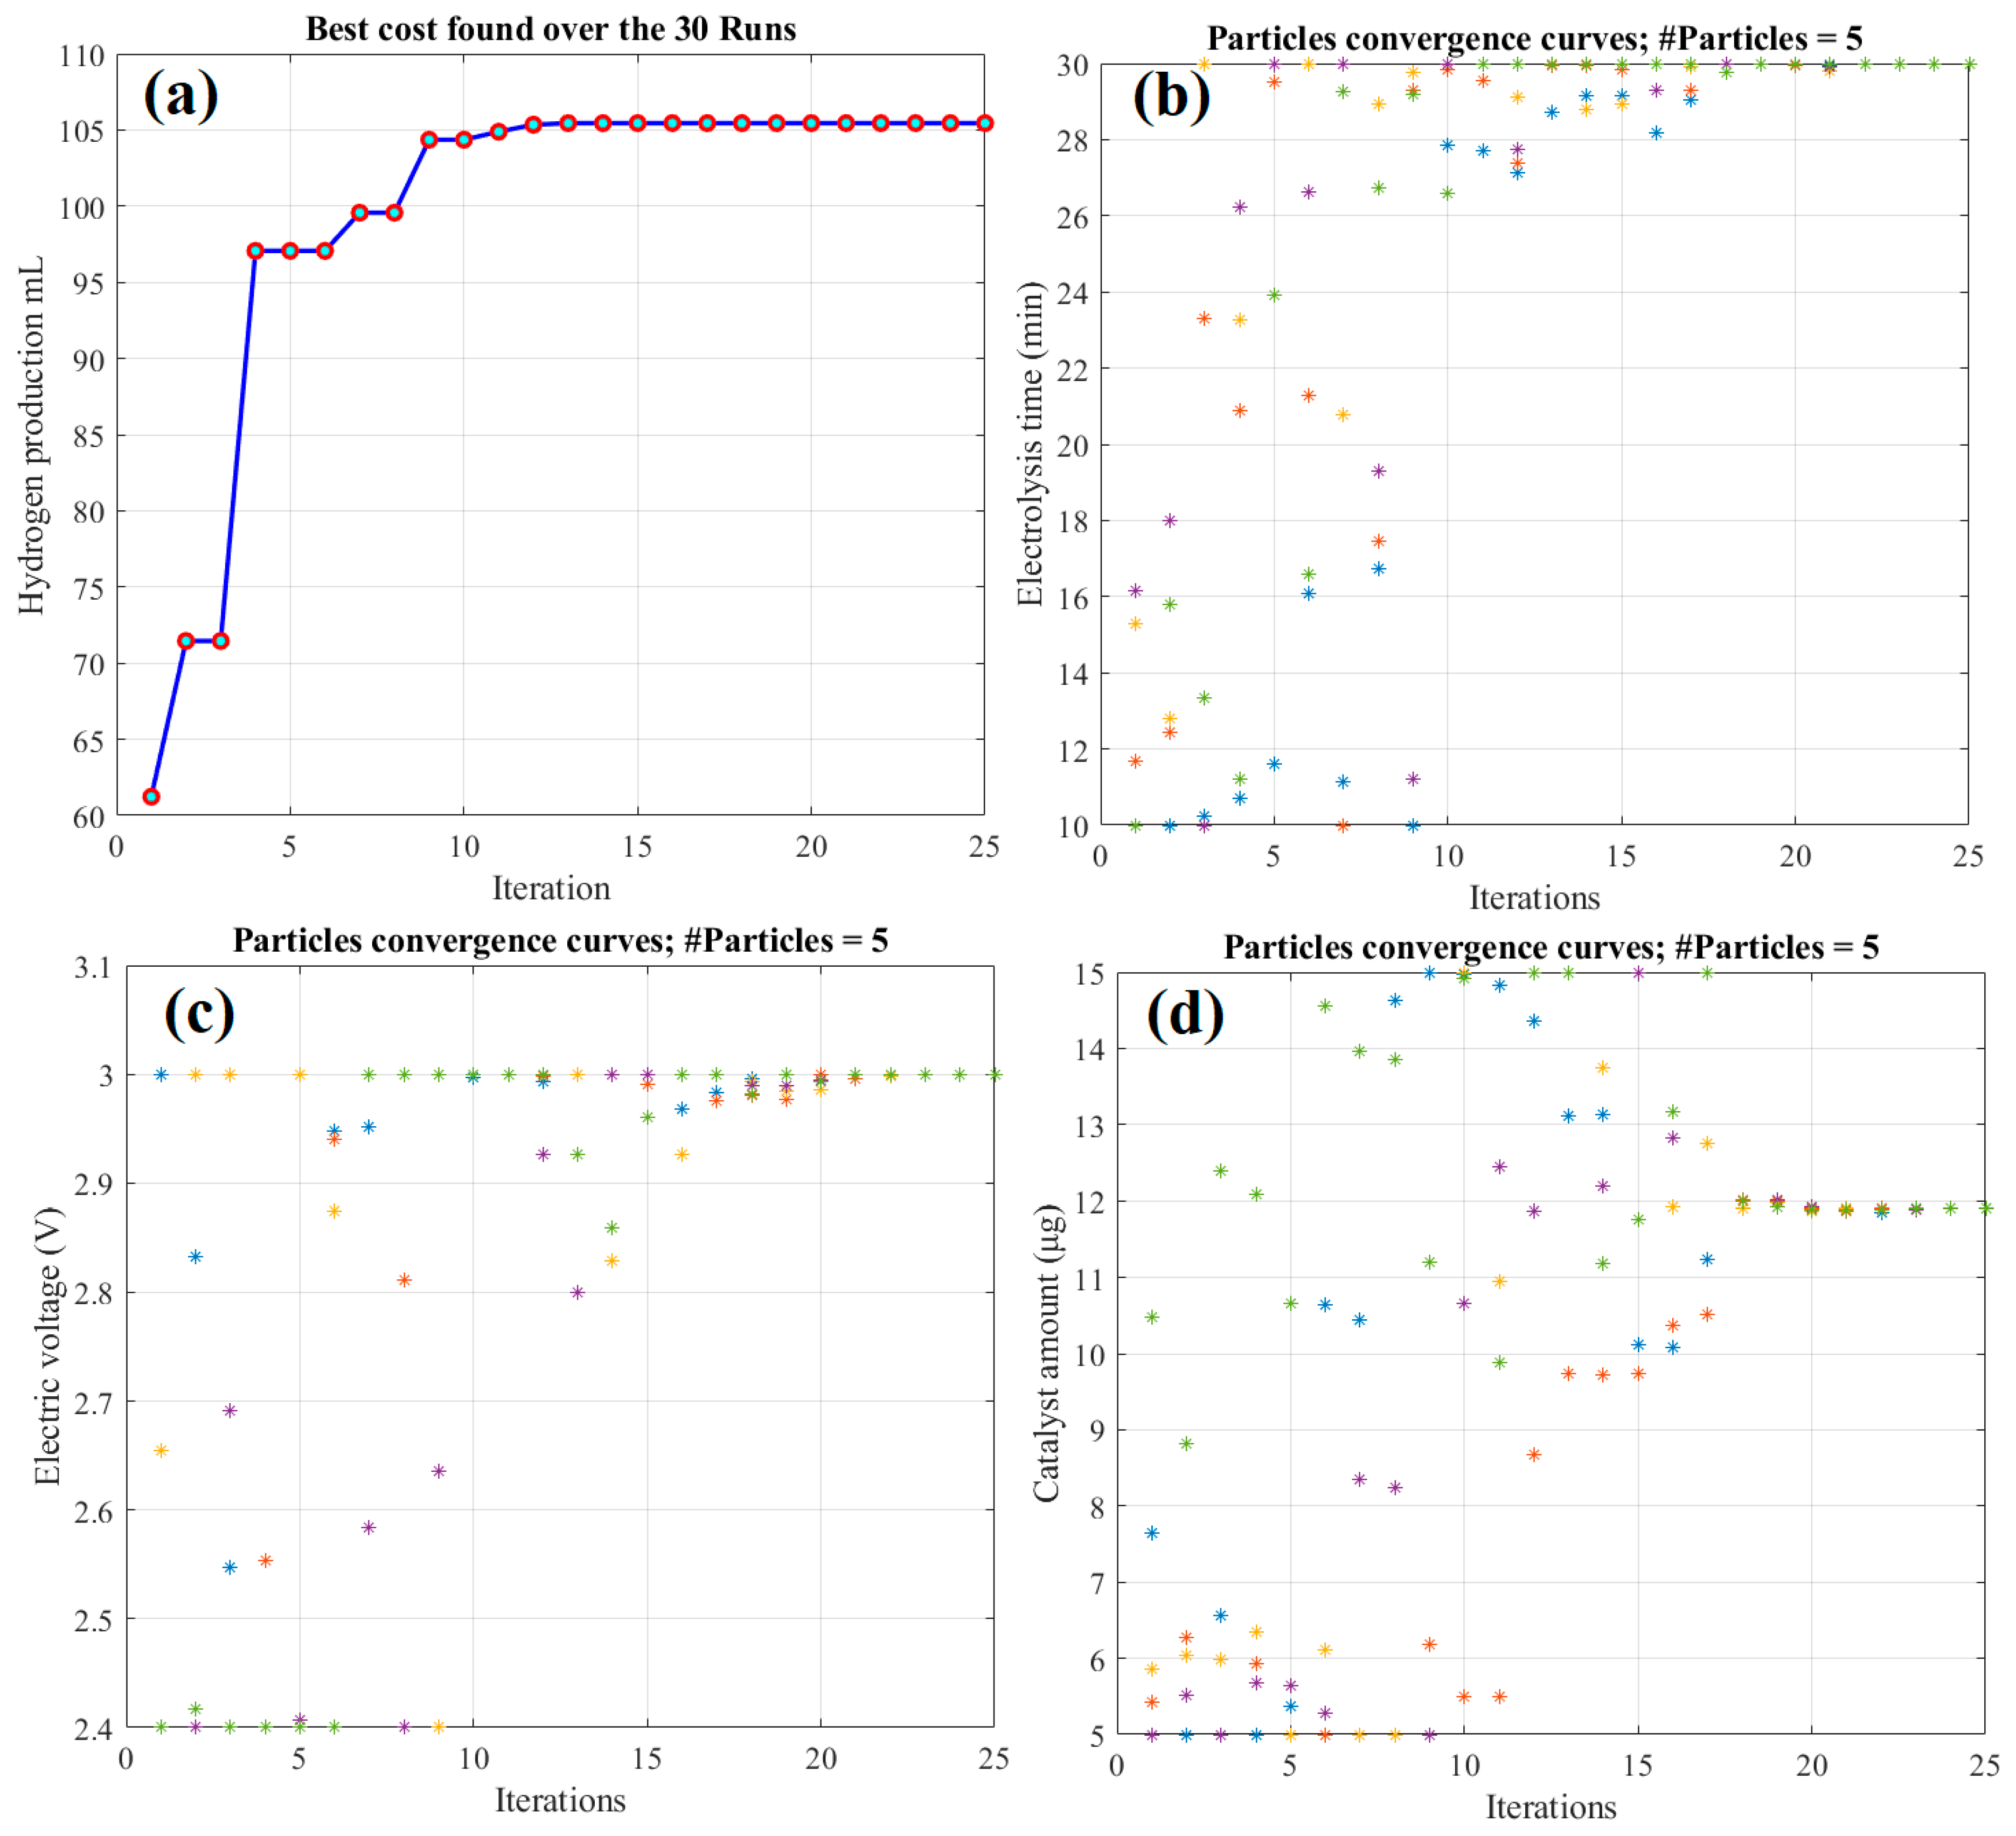
4.2. Optimization Results

POA was compared to a dragonfly optimizer (DO), sine cosine algorithm (SCA), particle swarm optimization (PSO), and gray wolf optimizer (GWO) to illustrate its superiority. The five algorithms under consideration are metaheuristics. Consequently, the optimization procedure must be carried out repeatedly to avoid finding the solution inadvertently. Therefore, the optimization technique was repeated 30 times for each of the five optimizers. Table 3 displays the detailed results of 30 runs. Several statistical studies were conducted and displayed in Table 4 to demonstrate the advantages of POA.
The main cost function values ranged from 102.728 to 105.45 mL. The POA achieved the highest value of 105.45 mL, followed by the GWO, while the PSO obtained the lowest value of 102.728 mL. The standard deviation (STD) values varied from 0.001 to 7.86. POA received the lowest STD value of 0.001, followed by the GWO, while the PSO obtained the highest STD.
An ANOVA test was performed to demonstrate the POA’s superiority; the results are shown in Table 5, and their corresponding ranking is shown in Figure 8. If the value of F exceeds the p-value, the null hypothesis is presumed to be correct. The acquired findings show that the p-value is substantially lower than the F value, indicating that there is a significant difference between the outcomes. As illustrated in Figure 8, the POA outperforms the other commonly used algorithm. The POA has the lowest variation range and the highest mean fitness (maximization problem), proving its resilience and accuracy.
A Tukey’s Honestly Significant Difference (Tukey HSD) post hoc analysis was performed to support the ANOVA findings. The results are displayed in Figure 9. The POA has the best mean fitness, followed by the GWO. The performance of the POA is superior to that of the DO and SCA and considerably superior to that of the PSO.
All of the preceding statistical analyses confirmed that the POA findings were the best. Therefore, it was adopted in this study. Accordingly, the proposed ANFIS and POA algorithms were used to compare the resultant optimum solutions in the case of the experimental and RSM techniques, as demonstrated in Table 6.
In Table 6, the combination of ANFIS and POA enhanced the generated hydrogen by approximately 1.3% and 1.7, respectively, compared to the measured datasets and RSM. Figure 10 shows the comprehensive outcomes of the POA optimization process. For the electrolysis duration, electric voltage, and catalyst quantity, all particles attained optimum solutions of 30 min, 3 V, and 11.9 μg, respectively. Since two of the parameters, electrolysis time and electric voltage, converged to their maximum limits, the constraints were expanded by 5% and 10%, respectively, to predict the system performance. The amount of hydrogen generated increased by 7.19% and 12.6%, respectively, for the extensions of 5% and 10%. This is consistent with the explanation in Figure 4, since increasing the constraint by 10% increases the applied voltage from 3 V to 3.3 V, which has a large influence on the hydrogen generation, and the other two parameters have the same significant effect at such a higher voltage. The favorable impact of these three factors will ultimately have a considerable influence on the hydrogen generation by more than 12%.

5. Conclusions

This study demonstrates the potential of using an ANFIS modeling approach and optimal parameter identification to maximize the production of green hydrogen from solar-powered water electrocatalysis for marine applications. This study proposes a novel strategy to enhance the hydrogen production water electrolysis process by integrating the ANFIS model and a POA optimizer. The following three controlling factors were optimized to increase hydrogen production: electrolysis duration (min), electric voltage (V), and catalyst quantity (μg). The proposed framework was divided into two stages. First, the generated hydrogen was modeled and simulated using ANFIS based on datasets obtained with permission. Following this, a pelican optimization algorithm (POA) was used to figure out the best controlling parameters for maximizing hydrogen production. Furthermore, POA was compared to various optimizers, including DO, SCA, PSO, and GWO, to illustrate its superiority. The findings showed that the applied voltage, which was more than 2.4 V in this study, plays a major role in enhancing hydrogen production. Both the electrolysis period and the catalyst loading have a favorable influence on hydrogen production, such as higher voltages. It is worth noting that extending the optimization process beyond 10% of the constraint resulted in more than 12% higher hydrogen productivity, which might be attributed to the positive effects of time and catalyst loading at high applied voltages. Finally, the combination of ANFIS and POA enhanced the generated hydrogen by approximately 1.3% and 1.7, respectively, compared to the measured datasets and RSM. In future work, integrating the water electrocatalysis process with solar photovoltaic systems will be considered to produce hydrogen from the surplus energy for marine applications.

Author Contributions

Conceptualization, H.R., A.G.O., M.A.A. and E.T.S.; Methodology, H.R. and A.A.; Software, H.R.; Validation, A.A.; Formal analysis, H.R. and M.A.A.; Investigation, H.R. and E.T.S.; Data curation, A.A.; Writing—original draft, H.R., A.G.O., M.A.A., A.A. and E.T.S.; Writing—review & editing, H.R., A.G.O., M.A.A., A.A. and E.T.S.; Supervision, A.G.O. and E.T.S. All authors have read and agreed to the published version of the manuscript.

Funding

The authors would like to express their appreciation to the Deputyship for Research & Innovation, Ministry of Education in Saudi Arabia, for financing this research study under project number IF2/PSAU/2022/01/20906.

Institutional Review Board Statement

Not available.

Informed Consent Statement

Not available.

Data Availability Statement

Not available.

Acknowledgments

The authors would like to express their appreciation to the Deputyship for Research & Innovation, Ministry of Education in Saudi Arabia, for financing this research study under project number IF2/PSAU/2022/01/20906.

Conflicts of Interest

The authors declare no conflict of interest.

Appendix A

ANFIS Rules
‘1. If (in1 is in1cluster1) and (in2 is in2cluster1) and (in3 is in3cluster1) then (Output is out1cluster1) (1)’
‘2. If (in1 is in1cluster2) and (in2 is in2cluster2) and (in3 is in3cluster2) then (Output is out1cluster2) (1)’
‘3. If (in1 is in1cluster3) and (in2 is in2cluster3) and (in3 is in3cluster3) then (Output is out1cluster3) (1)’
‘4. If (in1 is in1cluster4) and (in2 is in2cluster4) and (in3 is in3cluster4) then (Output is out1cluster4) (1)’
‘5. If (in1 is in1cluster5) and (in2 is in2cluster5) and (in3 is in3cluster5) then (Output is out1cluster5) (1)’
‘6. If (in1 is in1cluster6) and (in2 is in2cluster6) and (in3 is in3cluster6) then (Output is out1cluster6) (1)’
‘7. If (in1 is in1cluster7) and (in2 is in2cluster7) and (in3 is in3cluster7) then (Output is out1cluster7) (1)’
‘8. If (in1 is in1cluster8) and (in2 is in2cluster8) and (in3 is in3cluster8) then (Output is out1cluster8) (1)’
‘9. If (in1 is in1cluster9) and (in2 is in2cluster9) and (in3 is in3cluster9) then (Output is out1cluster9) (1)’
‘10. If (in1 is in1cluster10) and (in2 is in2cluster10) and (in3 is in3cluster10) then (Output is out1cluster10) (1)’

References

  1. Olabi, A.G.; Wilberforce, T.; Elsaid, K.; Sayed, E.T.; Maghrabie, H.M.; Abdelkareem, M.A. Large Scale Application of Carbon Capture to Process Industries—A Review. J. Clean. Prod. 2022, 362, 132300. [Google Scholar] [CrossRef]
  2. Olabi, A.-G. 100% Sustainable Energy. Energy 2014, 77, 1–5. [Google Scholar] [CrossRef]
  3. Efimov, I.; Povarov, V.G.; Rudko, V.A. Comparison of UNIFAC and LSER Models for Calculating Partition Coefficients in the Hexane–Acetonitrile System Using Middle Distillate Petroleum Products as an Example. Ind. Eng. Chem. Res. 2022, 61, 9575–9585. [Google Scholar] [CrossRef]
  4. Abdelkareem, M.A.; Lootah, M.A.; Sayed, E.T.; Wilberforce, T.; Alawadhi, H.; Yousef, B.A.A.; Olabi, A.G. Fuel Cells for Carbon Capture Applications. Sci. Total Environ. 2021, 769, 144243. [Google Scholar] [CrossRef]
  5. Osman, A.I.; Hefny, M.; Abdel Maksoud, M.I.A.; Elgarahy, A.M.; Rooney, D.W. Recent Advances in Carbon Capture Storage and Utilisation Technologies: A Review. Environ. Chem. Lett. 2021, 19, 797–849. [Google Scholar] [CrossRef]
  6. Nassef, A.M.; Rezk, H.; Alahmer, A.; Abdelkareem, M.A. Maximization of CO2 Capture Capacity Using Recent RUNge Kutta Optimizer and Fuzzy Model. Atmosphere 2023, 14, 295. [Google Scholar] [CrossRef]
  7. Maghrabie, H.M.; Elsaid, K.; Sayed, E.T.; Abdelkareem, M.A.; Wilberforce, T.; Olabi, A.G. Building-Integrated Photovoltaic/Thermal (BIPVT) Systems: Applications and Challenges. Sustain. Energy Technol. Assess. 2021, 45, 101151. [Google Scholar] [CrossRef]
  8. Ahmed, S.D.; Al-Ismail, F.S.M.; Shafiullah, M.; Al-Sulaiman, F.A.; El-Amin, I.M. Grid Integration Challenges of Wind Energy: A Review. IEEE Access 2020, 8, 10857–10878. [Google Scholar] [CrossRef]
  9. Alsaqoor, S.; Marashli, A.; At-Tawarah, R.; Borowski, G.; Alahmer, A.; Aljabarin, N.; Beithou, N. Evaluation of Wind Energy Potential in View of the Wind Speed Parameters–A Case Study for the Southern Jordan. Adv. Sci. Technol. Res. J. 2022, 16, 275–285. [Google Scholar] [CrossRef]
  10. Pareek, A.; Dom, R.; Gupta, J.; Chandran, J.; Adepu, V.; Borse, P.H. Insights into Renewable Hydrogen Energy: Recent Advances and Prospects. Mater. Sci. Energy Technol. 2020, 3, 319–327. [Google Scholar] [CrossRef]
  11. Rezk, H.; Nassef, A.M.; Inayat, A.; Sayed, E.T.; Shahbaz, M.; Olabi, A.G. Improving the Environmental Impact of Palm Kernel Shell through Maximizing Its Production of Hydrogen and Syngas Using Advanced Artificial Intelligence. Sci. Total Environ. 2019, 658, 1150–1160. [Google Scholar] [CrossRef]
  12. Burton, N.A.; Padilla, R.V.; Rose, A.; Habibullah, H. Increasing the Efficiency of Hydrogen Production from Solar Powered Water Electrolysis. Renew. Sustain. Energy Rev. 2021, 135, 110255. [Google Scholar] [CrossRef]
  13. Abdelkareem, M.A.; Soudan, B.; Mahmoud, M.S.; Sayed, E.T.; AlMallahi, M.N.; Inayat, A.; Al Radi, M.; Olabi, A.G. Progress of Artificial Neural Networks Applications in Hydrogen Production. Chem. Eng. Res. Des. 2022, 182, 66–86. [Google Scholar] [CrossRef]
  14. Wilberforce, T.; Olabi, A.G.; Imran, M.; Sayed, E.T.; Abdelkareem, M.A. System Modelling and Performance Assessment of Green Hydrogen Production by Integrating Proton Exchange Membrane Electrolyser with Wind Turbine. Int. J. Hydrogen Energy 2023. [Google Scholar] [CrossRef]
  15. Salameh, T.; Sayed, E.T.; Abdelkareem, M.A.; Olabi, A.G.; Rezk, H. Optimal Selection and Management of Hybrid Renewable Energy System: Neom City as a Case Study. Energy Convers. Manag. 2021, 244, 114434. [Google Scholar] [CrossRef]
  16. Sharma, S.; Agarwal, S.; Jain, A. Significance of Hydrogen as Economic and Environmentally Friendly Fuel. Energies 2021, 14, 7389. [Google Scholar] [CrossRef]
  17. Qureshi, F.; Yusuf, M.; Kamyab, H.; Vo, D.-V.N.; Chelliapan, S.; Joo, S.-W.; Vasseghian, Y. Latest Eco-Friendly Avenues on Hydrogen Production towards a Circular Bioeconomy: Currents Challenges, Innovative Insights, and Future Perspectives. Renew. Sustain. Energy Rev. 2022, 168, 112916. [Google Scholar] [CrossRef]
  18. Tarkowski, M. On the Emergence of Sociotechnical Regimes of Electric Urban Water Transit Systems. Energies 2021, 14, 6111. [Google Scholar] [CrossRef]
  19. Mersin, K.; Bayirhan, I.; Gazioglu, C. Review of CO2 Emission and Reducing Methods in Maritime Transportation. Therm. Sci. 2019, 23, 2073–2079. [Google Scholar] [CrossRef]
  20. IMO. Third IMO GHG Study 2014 Executive Summary and Final Report; IMO: London, UK, 2014. [Google Scholar]
  21. Stark, C.; Xu, Y.; Zhang, M.; Yuan, Z.; Tao, L.; Shi, W. Study on Applicability of Energy-Saving Devices to Hydrogen Fuel Cell-Powered Ships. J. Mar. Sci. Eng. 2022, 10, 388. [Google Scholar] [CrossRef]
  22. Ritari, A.; Spoof-Tuomi, K.; Huotari, J.; Niemi, S.; Tammi, K. Emission Abatement Technology Selection, Routing and Speed Optimization of Hybrid Ships. J. Mar. Sci. Eng. 2021, 9, 944. [Google Scholar] [CrossRef]
  23. Kim, K.; Park, K.; Roh, G.; Choung, C.; Kwag, K.; Kim, W. Proposal of Zero-Emission Tug in South Korea Using Fuel Cell/Energy Storage System: Economic and Environmental Long-Term Impacts. J. Mar. Sci. Eng. 2023, 11, 540. [Google Scholar] [CrossRef]
  24. Wang, X.; Zhu, J.; Han, M. Industrial Development Status and Prospects of the Marine Fuel Cell: A Review. J. Mar. Sci. Eng. 2023, 11, 238. [Google Scholar] [CrossRef]
  25. Chun, K.W.; Kim, M.; Hur, J.-J. Development of a Marine LPG-Fueled High-Speed Engine for Electric Propulsion Systems. J. Mar. Sci. Eng. 2022, 10, 1498. [Google Scholar] [CrossRef]
  26. Shim, H.; Kim, Y.H.; Hong, J.-P.; Hwang, D.; Kang, H.J. Marine Demonstration of Alternative Fuels on the Basis of Propulsion Load Sharing for Sustainable Ship Design. J. Mar. Sci. Eng. 2023, 11, 567. [Google Scholar] [CrossRef]
  27. Ljulj, A.; Slapničar, V.; Grubišić, I.; Mihanović, L. Concept Design of a Hybrid Offshore Patrol Vessel. J. Mar. Sci. Eng. 2023, 11, 12. [Google Scholar] [CrossRef]
  28. Smyshlyaeva, K.I.; Rudko, V.A.; Kuzmin, K.A.; Povarov, V.G. Asphaltene Genesis Influence on the Low-Sulfur Residual Marine Fuel Sedimentation Stability. Fuel 2022, 328, 125291. [Google Scholar] [CrossRef]
  29. Ershov, M.A.; Savelenko, V.D.; Makhmudova, A.E.; Rekhletskaya, E.S.; Makhova, U.A.; Kapustin, V.M.; Mukhina, D.Y.; Abdellatief, T.M.M. Technological Potential Analysis and Vacant Technology Forecasting in Properties and Composition of Low-Sulfur Marine Fuel Oil (VLSFO and ULSFO) Bunkered in Key World Ports. J. Mar. Sci. Eng. 2022, 10, 1828. [Google Scholar] [CrossRef]
  30. Bolobov, V.I.; Latipov, I.U.; Popov, G.G.; Buslaev, G.V.; Martynenko, Y. V Estimation of the Influence of Compressed Hydrogen on the Mechanical Properties of Pipeline Steels. Energies 2021, 14, 6085. [Google Scholar] [CrossRef]
  31. Psaraftis, H.N.; Kontovas, C.A. Decarbonization of Maritime Transport: Is There Light at the End of the Tunnel? Sustainability 2020, 13, 237. [Google Scholar] [CrossRef]
  32. Rezk, H.; Olabi, A.G.; Abdelkareem, M.A.; Alami, A.H.; Sayed, E.T. Optimal Parameter Determination of Membrane Bioreactor to Boost Biohydrogen Production-Based Integration of ANFIS Modeling and Honey Badger Algorithm. Sustainability 2023, 15, 1589. [Google Scholar] [CrossRef]
  33. Li, S.; Kang, Q.; Baeyens, J.; Zhang, H.L.; Deng, Y.M. Hydrogen Production: State of Technology. In Proceedings of the 10th International Conference on Environment Science and Engineering (ICESE 2020), Vienna, Austria, 18–21 May 2020; IOP Publishing: Bristol, UK, 2020; Volume 544, p. 12011. [Google Scholar]
  34. Amin, M.; Shah, H.H.; Fareed, A.G.; Khan, W.U.; Chung, E.; Zia, A.; Farooqi, Z.U.R.; Lee, C. Hydrogen Production through Renewable and Non-Renewable Energy Processes and Their Impact on Climate Change. Int. J. Hydrog. Energy 2022, 47, 33112–33134. [Google Scholar] [CrossRef]
  35. Demirbas, A. Future Hydrogen Economy and Policy. Energy Sources Part B Econ. Plan. Policy 2017, 12, 172–181. [Google Scholar] [CrossRef]
  36. Mallouppas, G.; Yfantis, E.A. Decarbonization in Shipping Industry: A Review of Research, Technology Development, and Innovation Proposals. J. Mar. Sci. Eng. 2021, 9, 415. [Google Scholar] [CrossRef]
  37. Wang, W.; Liu, Y.; Zhen, L.; Wang, H. How to Deploy Electric Ships for Green Shipping. J. Mar. Sci. Eng. 2022, 10, 1611. [Google Scholar] [CrossRef]
  38. Kim, K.; Roh, G.; Kim, W.; Chun, K. A Preliminary Study on an Alternative Ship Propulsion System Fueled by Ammonia: Environmental and Economic Assessments. J. Mar. Sci. Eng. 2020, 8, 183. [Google Scholar] [CrossRef] [Green Version]
  39. Park, S.W.; Kim, J.H.; Seo, J.K. Explosion Characteristics of Hydrogen Gas in Varying Ship Ventilation Tunnel Geometries: An Experimental Study. J. Mar. Sci. Eng. 2022, 10, 532. [Google Scholar] [CrossRef]
  40. Lee, J.; Choi, Y.; Choi, J. Techno-Economic Analysis of NH3 Fuel Supply and Onboard Re-Liquefaction System for an NH3-Fueled Ocean-Going Large Container Ship. J. Mar. Sci. Eng. 2022, 10, 1500. [Google Scholar] [CrossRef]
  41. Bertagna, S.; Kouznetsov, I.; Braidotti, L.; Marinò, A.; Bucci, V. A Rational Approach to the Ecological Transition in the Cruise Market: Technologies and Design Compromises for the Fuel Switch. J. Mar. Sci. Eng. 2023, 11, 67. [Google Scholar] [CrossRef]
  42. Huang, J.; Fan, H.; Xu, X.; Liu, Z. Life Cycle Greenhouse Gas Emission Assessment for Using Alternative Marine Fuels: A Very Large Crude Carrier (VLCC) Case Study. J. Mar. Sci. Eng. 2022, 10, 1969. [Google Scholar] [CrossRef]
  43. Lee, G.N.; Kim, J.M.; Jung, K.H.; Park, H.; Jang, H.S.; Lee, C.S.; Lee, J.W. Environmental Life-Cycle Assessment of Eco-Friendly Alternative Ship Fuels (MGO, LNG, and Hydrogen) for 170 GT Nearshore Ferry. J. Mar. Sci. Eng. 2022, 10, 755. [Google Scholar] [CrossRef]
  44. Panić, I.; Cuculić, A.; Ćelić, J. Color-Coded Hydrogen: Production and Storage in Maritime Sector. J. Mar. Sci. Eng. 2022, 10, 1995. [Google Scholar] [CrossRef]
  45. Reusser, C.A.; Pérez Osses, J.R. Challenges for Zero-Emissions Ship. J. Mar. Sci. Eng. 2021, 9, 1042. [Google Scholar] [CrossRef]
  46. Litvinenko, V.S.; Tsvetkov, P.S.; Dvoynikov, M.V.; Buslaev, G.V. Barriers to Implementation of Hydrogen Initiatives in the Context of Global Energy Sustainable Development. J. Min. Inst. 2020, 244, 428–438. [Google Scholar]
  47. Dutta, S. Review on Solar Hydrogen: Its Prospects and Limitations. Energy Fuels 2021, 35, 11613–11639. [Google Scholar] [CrossRef]
  48. Badea, G.E.; Hora, C.; Maior, I.; Cojocaru, A.; Secui, C.; Filip, S.M.; Dan, F.C. Sustainable Hydrogen Production from Seawater Electrolysis: Through Fundamental Electrochemical Principles to the Most Recent Development. Energies 2022, 15, 8560. [Google Scholar] [CrossRef]
  49. Du, Z.; Chen, Q.; Guan, C.; Chen, H. Improvement and Optimization Configuration of Inland Ship Power and Propulsion System. J. Mar. Sci. Eng. 2023, 11, 135. [Google Scholar] [CrossRef]
  50. Widera, B. Renewable Hydrogen Implementations for Combined Energy Storage, Transportation and Stationary Applications. Therm. Sci. Eng. Prog. 2020, 16, 100460. [Google Scholar] [CrossRef]
  51. Xu, Y.; Wang, C.; Huang, Y.; Fu, J. Recent Advances in Electrocatalysts for Neutral and Large-Current-Density Water Electrolysis. Nano Energy 2021, 80, 105545. [Google Scholar] [CrossRef]
  52. Ustolin, F.; Campari, A.; Taccani, R. An Extensive Review of Liquid Hydrogen in Transportation with Focus on the Maritime Sector. J. Mar. Sci. Eng. 2022, 10, 1222. [Google Scholar] [CrossRef]
  53. Wang, Z.; Wang, D.; Zhao, F.; Han, F.; Ji, Y.; Cai, W. Hydrogen Refueling Stations and Carbon Emission Reduction of Coastal Expressways: A Deployment Model and Multi-Scenario Analysis. J. Mar. Sci. Eng. 2022, 10, 992. [Google Scholar] [CrossRef]
  54. Rashid, M.D.; Al Mesfer, M.K.; Naseem, H.; Danish, M. Hydrogen Production by Water Electrolysis: A Review of Alkaline Water Electrolysis, PEM Water Electrolysis and High Temperature Water Electrolysis. Int. J. Eng. Adv. Technol. 2015. [Google Scholar]
  55. Gebreslase, G.A.; Martínez-Huerta, M.V.; Sebastián, D.; Lázaro, M.J. NiCoP/CoP Sponge-like Structure Grown on Stainless Steel Mesh as a High-Performance Electrocatalyst for Hydrogen Evolution Reaction. Electrochim. Acta 2023, 438, 141538. [Google Scholar] [CrossRef]
  56. Theerthagiri, J.; Cardoso, E.S.F.; Fortunato, G.V.; Casagrande, G.A.; Senthilkumar, B.; Madhavan, J.; Maia, G. Highly Electroactive Ni Pyrophosphate/Pt Catalyst toward Hydrogen Evolution Reaction. ACS Appl. Mater. Interfaces 2019, 11, 4969–4982. [Google Scholar] [CrossRef]
  57. Hu, S.; Tan, Y.; Feng, C.; Wu, H.; Zhang, J.; Mei, H. Synthesis of N Doped NiZnCu-Layered Double Hydroxides with Reduced Graphene Oxide on Nickel Foam as Versatile Electrocatalysts for Hydrogen Production in Hybrid-Water Electrolysis. J. Power Sources 2020, 453, 227872. [Google Scholar] [CrossRef]
  58. Ogumerem, G.S.; Pistikopoulos, E.N. Parametric Optimization and Control for a Smart Proton Exchange Membrane Water Electrolysis (PEMWE) System. J. Process. Control. 2020, 91, 37–49. [Google Scholar] [CrossRef]
  59. Kumar, S.S.; Himabindu, V. Hydrogen Production by PEM Water Electrolysis–A Review. Mater. Sci. Energy Technol. 2019, 2, 442–454. [Google Scholar]
  60. Kang, Z.; Alia, S.M.; Young, J.L.; Bender, G. Effects of Various Parameters of Different Porous Transport Layers in Proton Exchange Membrane Water Electrolysis. Electrochim. Acta 2020, 354, 136641. [Google Scholar] [CrossRef]
  61. Grigoriev, S.A.; Fateev, V.N.; Bessarabov, D.G.; Millet, P. Current Status, Research Trends, and Challenges in Water Electrolysis Science and Technology. Int. J. Hydrogen Energy 2020, 45, 26036–26058. [Google Scholar] [CrossRef]
  62. Okolie, J.A.; Epelle, E.I.; Nanda, S.; Castello, D.; Dalai, A.K.; Kozinski, J.A. Modeling and Process Optimization of Hydrothermal Gasification for Hydrogen Production: A Comprehensive Review. J. Supercrit. Fluids 2021, 173, 105199. [Google Scholar] [CrossRef]
  63. Yin, L.; Ju, Y. Process Optimization and Analysis of a Novel Hydrogen Liquefaction Cycle. Int. J. Refrig. 2020, 110, 219–230. [Google Scholar] [CrossRef]
  64. Zhu, J.; Wang, G.; Li, Y.; Duo, Z.; Sun, C. Optimization of Hydrogen Liquefaction Process Based on Parallel Genetic Algorithm. Int. J. Hydrogen Energy 2022, 47, 27038–27048. [Google Scholar] [CrossRef]
  65. Li, X.; Zhao, L.; Liu, Z. Topological Optimization of Continuum Structure Based on ANSYS. MATEC Web Conf. 2017, 95, 7020. [Google Scholar] [CrossRef] [Green Version]
  66. Alahmer, A.; Ajib, S. Solar Cooling Technologies: State of Art and Perspectives. Energy Convers. Manag. 2020, 214, 112896. [Google Scholar] [CrossRef]
  67. Kargbo, H.O.; Zhang, J.; Phan, A.N. Optimisation of Two-Stage Biomass Gasification for Hydrogen Production via Artificial Neural Network. Appl. Energy 2021, 302, 117567. [Google Scholar] [CrossRef]
  68. Alahmer, A.; Alsaqoor, S.; Borowski, G. Effect of Parameters on Moisture Removal Capacity in the Desiccant Cooling Systems. Case Stud. Therm. Eng. 2019, 13, 100364. [Google Scholar] [CrossRef]
  69. Wilberforce, T.; Olabi, A.G.; Monopoli, D.; Dassisti, M.; Sayed, E.T.; Abdelkareem, M.A. Design Optimization of Proton Exchange Membrane Fuel Cell Bipolar Plate. Energy Convers. Manag. 2023, 277, 116586. [Google Scholar] [CrossRef]
  70. Mohammed, R.H.; Radwan, A.; Rezk, A.; Olabi, A.G.; Sharma, V.; Hossain, A.K.; Alaswad, A.; Abdelkareem, M.A. Energy and Exergy Study of the Integrated Adsorption-Absorption System Driven by Transient Heat Sources for Cooling and Desalination. Energy Convers. Manag. 2023, 277, 116614. [Google Scholar] [CrossRef]
  71. Alahmer, A.; Alsaqoor, S. Simulation and Optimization of Multi-Split Variable Refrigerant Flow Systems. Ain Shams Eng. J. 2018, 9, 1705–1715. [Google Scholar] [CrossRef]
  72. Nassef, A.M.; Fathy, A.; Sayed, E.T.; Abdelkareem, M.A.; Rezk, H.; Tanveer, W.H.; Olabi, A.G. Maximizing SOFC Performance through Optimal Parameters Identification by Modern Optimization Algorithms. Renew. Energy 2019, 138, 458–464. [Google Scholar] [CrossRef]
  73. Alahmer, H.; Alahmer, A.; Alkhazaleh, R.; Alrbai, M.; Alamayreh, M.I. Applied Intelligent Grey Wolf Optimizer (IGWO) to Improve the Performance of CI Engine Running on Emulsion Diesel Fuel Blends. Fuels 2023, 4, 35–57. [Google Scholar] [CrossRef]
  74. Olabi, A.G.; Abdelkareem, M.A.; Semeraro, C.; Al Radi, M.; Rezk, H.; Muhaisen, O.; Al-Isawi, O.A.; Sayed, E.T. Artificial Neural Networks Applications in Partially Shaded PV Systems. Therm. Sci. Eng. Prog. 2022, 37, 101612. [Google Scholar] [CrossRef]
  75. Alahmer, H.; Alahmer, A.; Alamayreh, M.I.; Alrbai, M.; Al-Rbaihat, R.; Al-Manea, A.; Alkhazaleh, R. Optimal Water Addition in Emulsion Diesel Fuel Using Machine Learning and Sea-Horse Optimizer to Minimize Exhaust Pollutants from Diesel Engine. Atmosphere 2023, 14, 449. [Google Scholar] [CrossRef]
  76. Sayed, E.T.; Rezk, H.; Abdelkareem, M.A.; Olabi, A.G. Artificial Neural Network Based Modelling and Optimization of Microalgae Microbial Fuel Cell. Int. J. Hydrogen Energy 2023. [Google Scholar] [CrossRef]
  77. Wilberforce, T.; Olabi, A.G.; Rezk, H.; Abdelaziz, A.Y.; Abdelkareem, M.A.; Sayed, E.T. Boosting the Output Power of PEM Fuel Cells by Identifying Best-Operating Conditions. Energy Convers. Manag. 2022, 270, 116205. [Google Scholar] [CrossRef]
  78. Nassef, A.M.; Sayed, E.T.; Rezk, H.; Abdelkareem, M.A.; Rodriguez, C.; Olabi, A.G. Fuzzy-Modeling with Particle Swarm Optimization for Enhancing the Production of Biodiesel from Microalga. Energy Sources Part A Recover. Util. Environ. Eff. 2019, 41, 2094–2103. [Google Scholar] [CrossRef]
  79. Salameh, T.; Sayed, E.T.; Olabi, A.G.; Hdaib, I.I.; Allan, Y.; Alkasrawi, M.; Abdelkareem, M.A. Adaptive Network Fuzzy Inference System and Particle Swarm Optimization of Biohydrogen Production Process. Fermentation 2022, 8, 483. [Google Scholar] [CrossRef]
  80. Alahmer, H.; Alahmer, A.; Alkhazaleh, R.; Alrbai, M. Exhaust Emission Reduction of a SI Engine Using Acetone–Gasoline Fuel Blends: Modeling, Prediction, and Whale Optimization Algorithm. Energy Rep. 2023, 9, 77–86. [Google Scholar] [CrossRef]
  81. Alahmer, H.; Alahmer, A.; Alkhazaleh, R.; Al-Amayreh, M.I. Modeling, Polynomial Regression, and Artificial Bee Colony Optimization of SI Engine Performance Improvement Powered by Acetone–Gasoline Fuel Blends. Energy Rep. 2023, 9, 55–64. [Google Scholar] [CrossRef]
  82. Alahmer, A.; Khalid, M.B.; Beithou, N.; Borowski, G.; Alsaqoor, S.; Alhendi, H. An Experimental Investigation into Improving the Performance of Thermoelectric Generators. J. Ecol. Eng. 2022, 23, 100–108. [Google Scholar] [CrossRef]
  83. Alahmer, A.; Alahmer, H.; Handam, A.; Rezk, H. Environmental Assessment of a Diesel Engine Fueled with Various Biodiesel Blends: Polynomial Regression and Grey Wolf Optimization. Sustainability 2022, 14, 1367. [Google Scholar] [CrossRef]
  84. Alahmer, A.; Rezk, H.; Aladayleh, W.; Mostafa, A.O.; Abu-Zaid, M.; Alahmer, H.; Gomaa, M.R.; Alhussan, A.A.; Ghoniem, R.M. Modeling and Optimization of a Compression Ignition Engine Fueled with Biodiesel Blends for Performance Improvement. Mathematics 2022, 10, 420. [Google Scholar] [CrossRef]
  85. Senthilraja, S.; Gangadevi, R.; Köten, H.; Marimuthu, R. Performance Assessment of a Solar Powered Hydrogen Production System and Its ANFIS Model. Heliyon 2020, 6, e05271. [Google Scholar] [CrossRef]
  86. Özgür, C.; Mert, M.E. Prediction and Optimization of the Process of Generating Green Hydrogen by Electrocatalysis: A Study Using Response Surface Methodology. Fuel 2022, 330, 125610. [Google Scholar] [CrossRef]
  87. Olabi, A.G.; Rezk, H.; Sayed, E.T.; Ghoniem, R.M.; Abdelkareem, M.A. Boosting Carbon Dioxide Adsorption Capacity Applying Jellyfish Optimization and ANFIS-Based Modelling. Ain Shams Eng. J. 2022, 14, 101931. [Google Scholar] [CrossRef]
  88. Rezk, H.; Mohammed, R.H.; Rashad, E.; Nassef, A.M. ANFIS-Based Accurate Modeling of Silica Gel Adsorption Cooling Cycle. Sustain. Energy Technol. Assess. 2022, 50, 101793. [Google Scholar] [CrossRef]
  89. Trojovský, P.; Dehghani, M. Pelican Optimization Algorithm: A Novel Nature-Inspired Algorithm for Engineering Applications. Sensors 2022, 22, 855. [Google Scholar] [CrossRef]
Figure 1. Layout of the methodology.
Jmse 11 00617 g001
Figure 2. The process of POA.
Jmse 11 00617 g002
Figure 3. Arrangement of the ANFIS model of the water electrocatalysis process.
Jmse 11 00617 g003
Figure 4. MFs of the inputs of the ANFIS model of the water electrocatalysis process.
Jmse 11 00617 g004
Figure 5. ANFIS surface of the water electrocatalysis process. (a) catalyst amount and electric voltage, (b) catalyst amount and electrolysis time and (c) electric voltage and electrolysis time.
Jmse 11 00617 g005
Figure 6. Predicted versus datasets of ANFIS model of water electrocatalysis process.
Jmse 11 00617 g006
Figure 7. Prediction accuracy of the ANFIS model of the water electrocatalysis process.
Jmse 11 00617 g007
Figure 8. ANOVA ranking.
Jmse 11 00617 g008
Figure 9. Tukey test.
Jmse 11 00617 g009
Figure 10. Details of the POA optimization process: (a) best cost function over 30 runs, (b) particle convergence of electrolysis time, (c) particle convergence of electric voltage, and (d) particle convergence of catalyst amount.
Jmse 11 00617 g010
Table 1. Numerical metrics of the ANFIS model of the water electrocatalysis process.
RMSECoefficient of Determination (R2)
TrainTestAllTrainTestAll
3.4 × 10−60.23080.13711.000.99991.00
Table 2. Validation results.
MethodElectrolysis Time (min)Electric Voltage (V)Catalyst Amount (μg)Hydrogen Production
mL
Prediction Error
%
Dataset [86]30311.35106.20.0
RSM [86]30311.35103.6772.38
ANFIS model30311.35105.2540.89
Table 3. Detailed results of 30 runs.
RunPSODOSCAPOAGWORunPSODOSCAPOAGWO
1105.45105.451105.45105.451105.45116105.336105.451105.148105.451105.449
2105.451105.45105.292105.45105.4511779.048105.451104.418105.45105.451
3105.45105.451105.442105.451105.4518105.448105.449105.44105.451105.451
4105.45105.45105.449105.451105.45119105.43105.451105.111105.451105.451
579.172105.45105.408105.451105.44820105.45105.451104.978105.451105.43
6104.888105.451105.155105.449105.44621105.451105.449104.836105.449105.45
7105.335105.451102.785105.451105.44322105.382105.272105.328105.451105.449
8104.454105.445103.963105.451105.44923105.444105.451104.523105.451105.437
9105.45105.451105.446105.451105.39624105.447102.993105.055105.451105.45
10105.45105.451105.438105.451105.41825105.225101.712100.278105.449104.674
11105.448102.875105.349105.451105.4526105.4599.94105.448105.448105.427
12105.306105.451105.423105.45105.4527105.45101.317105.09105.451105.45
13105.45105.451104.842105.45105.4428105.397101.042105.232105.451105.448
14105.45105.451105.303105.45105.44429104.98105.451105.088105.451105.446
15105.441105.449105.45105.446105.4243079.255105.45104.682105.451105.448
Table 4. Statistical analysis of the five considered optimizers.
PSODOSCAPOAGWO
Best105.451105.451105.45105.451105.451
Worst79.04899.94100.278105.446104.674
Mean102.728104.683104.895105.45105.417
STD7.861.5911.0190.0010.139
MEDIAN61.7722.5311.0381.3 × 10−60.019
Variance105.446105.45105.193105.451105.448
Table 5. ANOVA results.
SourceSSdfMSFp-Value > F
Columns149.49437.37372.760.0298
Error1960.7914513.5227
Total2110.29194
Table 6. Optimum parameter values using the considered methods.
StrategyElectrolysis Time (min)Electric Voltage (V)Catalyst Amount (μg)Hydrogen Production
mL
Change
%
Measured [86]30310104.10.0
RSM [86]30311.35103.677−0.4
ANFIS & POA30311.9105.451.3
Extending the constrains by 5%
ANFIS & POA31.53.1513.3111.587.19
Extending the constrains by 10%
ANFIS & POA333.314.24117.2312.6
Disclaimer/Publisher’s Note: The statements, opinions and data contained in all publications are solely those of the individual author(s) and contributor(s) and not of MDPI and/or the editor(s). MDPI and/or the editor(s) disclaim responsibility for any injury to people or property resulting from any ideas, methods, instructions or products referred to in the content.

