Article

Research on a Novel Combined Cooling and Power Scheme for LNG-Powered Ship

Marine Engineering College, Dalian Maritime University, Dalian 116026, China
*
Author to whom correspondence should be addressed.
J. Mar. Sci. Eng. 2023, 11(3), 592; https://doi.org/10.3390/jmse11030592
Submission received: 11 February 2023 / Revised: 7 March 2023 / Accepted: 8 March 2023 / Published: 10 March 2023
(This article belongs to the Special Issue Advanced Marine Energy Harvesting Technologies)

Abstract

:
Cold energy recovery in LNG-powered vessels can not only improve the utilization efficiency of energy, but also benefit environmental protection. This paper put forward a new cascade scheme for utilizing flue gas waste heat and LNG cold energy comprehensively. The scheme was integrated by a dual organic Rankine circulation system (ORC), a high- and low-temperature cold storage system (TCS), an air conditioning system (ACS) and a seawater desalination system (SDS). The working medium of the dual ORC system was firstly determined by considering exergy efficiency and economic index simultaneously. On this basis, the adaptive weighted particle swarm optimization algorithm was employed to enhance thermodynamic performance of the scheme with the net output power as the optimization objective. The maximum net power and annual net interest rate can reach 725.78 kW and $115,300, respectively. Furthermore, the economic benefit of the scheme was analyzed by referring to the running track and the operation condition of the target ship. The results showed that the proposed scheme is a potential large-scale cryogenic technology and can bring considerable economic benefits to ship navigation.

1. Introduction

Natural gas (NG) is frequently viewed as a link between present-day fossil fuels and upcoming renewable energy resources. The World Energy Statistical Yearbook [1] released by BP. US showed that the global demand for natural gas grew by 5.3% in 2021, returning to the pre-pandemic level in 2019, and the trade volume exceeded 4 trillion cubic meters for the first time. The known policy scenarios predict that by 2050, NG demand will increase by 22% (based on 2020) [2]. Liquefied Natural Gas (LNG) is usually formed by the liquefaction of NG and stored in cryogenic tanks for easy transportation. Its combustion products are mainly water and carbon dioxide, which help to improve environmental quality and promote sustainable development. With the increasingly stringent requirements of IMO (i.e., International Maritime Organization) on vessel emissions, the advancement of LNG fuel-powered ships has become the key direction for future ship development.
LNG must be transformed from the liquid phase (−162 °C) to gas phase (above 0 °C) before being used by different users [3]. If the vast amounts of cold energy released during gasification could be utilized, not only could a large amount of energy be saved, but considerable social and economic benefits could be achieved as well. Therefore, a variety of LNG cold energy recovery technologies have been proposed, including cold energy generation [4], air separation [5], light hydrogen separation [6], low-temperature energy storage [7,8], low-temperature carbon dioxide capture [9], seawater desalination [10], air conditioning refrigeration [11], etc. However, it is worth noting that most of the research on the utilization of LNG cold energy relies on land-based LNG terminals.
Marine energy utilization technology has developed rapidly [12,13]. Regarding the cold energy utilization of LNG-powered vessels, the ORC-based cold energy power generation technology has attracted widespread attention from academia and industry because of its simple structure, low energy consumption and environmentally protective qualities. Many studies have been published on this topic, including studies concerning single-stage ORC, two-stage ORC and even three-stage ORC [14,15,16,17,18], and it has been found that the effective realization of cold energy recovery requires rational ORC scheme design and working medium selection. Sun et al. [19] analyzed the performance of the single-level ORC (SORC), the parallel two-level ORC (PTORC) and the cascading two-level ORC (CTORC). The results showed that the two-stage Rankine cycle performs better than the single-stage Rankine cycle in cold energy utilization of LNG. Lee et al. [20] proposed a new PEMFC system combining organic Rankine cycle and direct expansion cycle (ORC-DEC). Based on the established thermodynamic model, parameters such as working fluid in ORC were studied. Suang and Kim [21] proposed a double-ring ORC for a marine dual-fuel engine. With the n-pentane and R125 being used as the working medium of the preheater and regenerator, respectively, the maximum net power output was increased by 906.4 kW. Sun et al. [22] designed a horizontal three-stage nested Rankine cycle full power generation system with a 100,000-ton LNG-fuel-powered ship as the research object. The maximum power generation capacity per unit mass flow rate of LNG reached 457.41 kW. Zhao et al. [23] proposed a new cogeneration system based on Rankine cycle and natural gas direct expander, and investigated the system performance through dynamic exergy analysis. The exergy efficiency of the system reached 48.97%. Han et al. [24] proposed a triple ORC process for the waste heat and cold energy recovery of LNG-fueled vessels. The working medium was analyzed by the multi-objective adaptive firefly algorithm, and the exergy loss was determined on this basis. It can be seen that the use of the single cold energy generation technology can improve the electrical output of the ships. However, large-scaled vessels have a huge demand for direct cold energy and fresh water during their voyage. Most of these studies only focus on power generation, and the practical consideration of ship energy supply and demand is lacking.
Recently, many researchers have proposed strategies to improve the comprehensive energy utilization efficiency of LNG-powered ships through the rational coupling design of several energy recovery technologies. Yao et al. [25] proposed a comprehensive utilization scheme for LNG cold energy recovery based on the cooling load requirements of cold storage, desalination and air conditioning on board. Su et al. [26] proposed the supercritical and subcritical Rankine cycles to realize the cascade utilization of residual heat and cold energy. The output work, energy efficiency and exergy efficiency reached 270.78 kW, 26.89% and 54.33%, respectively. Ouyang et al. [27] proposed an integrated waste heat and cold heat energy recovery system for marine natural gas engines, which increased the net generation and thermal efficiency by 214.5 kW and 5.14%, respectively, compared with the original engine. Yao et al. [28] designed three different comprehensive cold energy utilization schemes. The performance of the three schemes was optimized and compared.
From the above discussion, it can be seen that the studies on the comprehensive utilization of waste heat and cold energy for LNG-powered vessels are quite limited and most of them do not take into account the energy supply-demand on ships. Furthermore, with changes in ship load, speed and other factors, the load of each cooling unit for LNG ships will also change. It is of great significance to clarify the operation of an LNG cold energy utilization system under different working conditions to improve ship economy. Therefore, this paper proposed a new LNG cold energy step utilization scheme, ORC-TCS-ACS-SDS, by taking the 300,000-ton bituminous tanker as the target ship. The scheme was designed from the perspective of the actual supply-demand matching on large-scaled LNG-fueled vessels, the energy utilization and economic benefits. The integrated scheme was capable of recovering both the waste heat of the main engine and the cold energy of LNG fuel simultaneously, and the cold energy utilization was divided into three temperature zones, i.e., high, middle and low temperature regions, to achieve a high exergy efficiency of cold energy. Furthermore, the thermodynamic performance and economic benefits of the scheme were analyzed by referring to the actual running track and the operation condition of the target ship.

2. Configuration and Model

2.1. Target Vessel

In this paper, the 300,000-tonnage LNG-powered very large crude carrier (VLCC) designed by the COSCO Shipping Group is taken as the target ship. The tanker is equipped with two Type C free-standing LNG tanks with a capacity of 2260 m3, and the maximum operating speed is 15.6 knots. The main ship parameters are shown in Table 1 [29]. The ship has the characteristics of large carrying capacity, long sailing time, wide sailing area, large fuel storage and relatively stable fuel consumption, which provide favorable conditions for the research on fuel cold energy utilization. The main engine of the target ship is the dual-fuel engine and its parameters are displayed in Table 2.

2.2. Scheme Design

The design of the LNG cold energy utilization scheme followed the following principles:
(1)
The design meets the requirements of the cold storage systems.
(2)
The flow rate is rationally arranged according to the corresponding temperature and step utilization.
(3)
The heat transfer details of the evaporators in seawater desalination, low-temperature cold storage, high-temperature cold storage and air conditioning module have not been further considered.
(4)
The system only considers the utilization of LNG and does not consider the vaporized gas.
A cascade cold energy utilization scheme named ORC-TCS-ACS-SDS was proposed, as shown in Figure 1. The ORC-TCS-ACS-SDS scheme consists of four parts, which are the two-stage organic Rankine cycle power generation, the high and low-temperature cold storage, the air conditioning and seawater desalination. The LNG in the tank was extracted by the LNG cryogenic pump and pressurized to 1.6 MPa by the pump, and then heated and vaporized by four LNG heat exchangers, namely HEX-1, HEX-2, HEX-3 and HEX-4, to the desired temperature of the main engine for combustion.
According to the temperature of liquefied natural gas, cold energy utilization was divided into three temperature zones. In specific, in the low temperature zone, LNG was fed into the first Rankine system ORC1, where the waste heat of the main engine flue gas and the high-grade cold energy of LNG were used as the heat sources of the evaporation end and the condensing end of the ORC, respectively. The organic working medium generated electricity through four processes: non-isentropic compression in the pump, constant-pressure heating in the steam generator, non-isentropic expansion in the turbine and constant-pressure heat release in the condenser. The LNG then flowed into the cryogenic cold storage system, where the refrigerant absorbed heat from the three cold storage units (i.e., fish, meat and buffer room) for cooling. The excess energy was further used for high-temperature cold storage (i.e., vegetable and dry storage) and air conditioning. In the middle temperature zone, LNG at about −80 °C was introduced into the second Rankine cycle ORC2 for cold energy power generation, and the thermal process was basically the same as ORC1. Finally, the cold energy of LNG in the high temperature zone was utilized through the seawater desalination system. At present, the main seawater desalination technologies include distillation, membrane, ion exchange, freezing, geothermal and solar method [30]. Frozen seawater desalination (FD) refers to the process of extracting fresh water by collecting and melting ice crystals in frozen feed (sea water or brackish water). It has the advantages of low energy consumption, low operating temperatures, no pretreatment and less fouling [31]. Therefore, this paper adopted the FD method for seawater desalination, in which the LNG cold energy was used to cool and crystalize the raw seawater in the pre-cooler.

2.3. System Analysis Model

2.3.1. Thermodynamic Analysis Model

The exergy analysis method was used to evaluate and optimize the LNG cold energy cascade utilization scheme.
The thermal efficiency of the Rankine circulatory system is calculated as
η e n = W n e t Q i n
where W n e t refers to the net power generated by the ORC system, kW; Q i n refers to the heat released by the flue gas into the evaporator, kW.
The working fluid exergy is calculated by [26]
E x = q m , i T 0 S 0 S i H 0 H i
where q m , i represents the mass flow rate of each fluid, kg/h; S 0   and   H 0 represent the specific entropy and enthalpy of the fluid in the standard state (T0 = 298.15 K, P0 = 101.325 kPa), respectively, kJ / kg · K 1 ,   kJ / kg ; S i   and   H i are the specific entropy and enthalpy of the fluid in a given state, kJ / kg · K 1 and   kJ / kg .
Table 3 [32] shows the calculation formulas of exergy loss and exergy efficiency of each device, in which the subscripts in and out represent the working fluid at the inlet and outlet of a specific device, respectively, and T E V A refers to the temperature of the fluid in the evaporator, K.
The overall exergy efficiency of the system is calculated as [33]
η e x , s y s e m = W e x p + 1 T E V A T 0 Q ( E X L N G , i n E X L N G , o u t ) + W P
where W e x p   and   W P represent the output exergy through expanders and the exergy input through the booster pumps, kW. E X L N G , i n   and   E X L N G , o u t indicate the input and the output exergy of LNG, respectively, kW.
In the seawater desalination system using the FD method, water is preferentially precipitated in the form of ice, and the uncrystallized part is concentrated saline with high salt content. The salt balance in the crystallization process is calculated as
q s w · C 1 = 10 % q f w · C 2 + q b w · C 3
where C 1 , C 2 , C 3 refer to seawater salinity, fresh water salinity and concentrated saline salinity; q s w ,   q f w ,   q b w refer to the seawater flow rate, the fresh water output flow rate and the concentrated brine flow rate, respectively, kg/h.
Thus, the load of seawater desalination system is calculated by
Q s w = q s w c Δ t + q i c e γ
where c is the specific heat capacity of sea water (3.9 kJ·kg°C−1), γ refers to heat of melting ice (334.7 kJ/kg), q s w c Δ t is the load of sea water cooled to freezing point, kW; q i c e γ is the ice crystal load of seawater, kW.

2.3.2. Economic Model

The total investment cost of the system includes the investment cost of main heat exchangers, expanders, pumps, etc. [34,35] The cost of each piece of equipment is calculated according to the following formula [36]:
l g C b = K 1 + K 2 l g Z + K 3   l g Z 2
l g F P = C 1 + C 2 l g P + C 3   L g P 2
The correction coefficient is [37]:
F B M = B 1 + B 2 F a F P B 1   or   F B M = B 1 + B 2 F b F P
The total investment cost is [38]:
C = C b F B M
where C b ,   F P ,   F B M refer to the procurement cost of equipment under basic condition, pressure factor and design pressure; Z refers to the capacity parameters, such as turbine power, power consumption of pump or the area of heat exchangers, P is the pressure of device components. Table 4 shows the constant value of K 1 , K 2 , K 3 , C 1 , C 2 , C 3 , B 1 , B 2 , F a and F b [35].
The total investment cost (TIC) of the system is calculated by
T I C = C × C E P C I 2021 C E P C I 2001
where CEPCI is the cost index, and C E P C I 2018 = 649, C E P C I 2001 = 397 [39].
The cost recovery factor (CRF) and the cost of power generation (PPC) are calculated by
C R F = η 1 + η L C T 1 + η L C T 1
P P C = C R F × T I C + η × T I C W × T W T
where η , L C T , T W T are the annual lending rate, life cycle time and working hours, which are set as 0.05, 15 years and 7500 h, respectively.
The net annual interest rate (ATNI) of the system is calculated as
A N T I = 7300 E P P P C × W
where EP is the current electricity price, which is assumed to be 0.22 $/kW.
The formula for calculating the economic index is as follows:
E C = T A C W n e t
where the total annual consumption cost (TAC) of the system is defined as [22]
T A C = k = 0 n C I N + k = 0 n C O U T
α = i 1 + i N i 1 i N 1
C I N = C I N α δ Y
In which, C I N is the investment cost of each equipment in the system, C I N is the revised investment cost, C O U T is the operating cost of each equipment. α is the capital recovery factor of 0.12, i is the interest rate, N is the component life. The maintenance constant δ is 1.06 and the annual operation time Y is about 8640 h.
In fact, when selecting the working medium of ORC system, both thermodynamic factors and economic index should be considered, so a composite index P is defined, i.e.,
P = η E X E C

3. System Simulation and Model Validation

3.1. Input Parameters

Table 5 shows the composition of liquefied natural gas.
The main input parameters of the system are set according to the requirements of the main engine, as displayed in Table 6.

3.2. System Simulation

Aspen Hysys software was used to perform system simulation of the designed ORC-TCS-ACS-SDS scheme, and the diagram is shown in Figure 2. The physical properties of the reaction components were calculated by the P-R equation. To simplify process simulation, the following assumptions were adopted.
  • The process was assumed to be in steady state;
  • The pressure drop loss in the heat exchangers and the pipelines was ignored;
  • The ambient condition was set to 101.33 kPa and 25 °C.
In the preliminary design of the ORC-TCS-ACS-SDS system, some key parameters as shown in Table 7.

3.3. Model Validation

To confirm the accuracy of the present simulation model, the simulation results of ORC, ACS and SDS were compared with the corresponding experimental data in the literature, respectively. The simulation verification results are exhibited in Table 8. It can be seen that the deviation between the model calculation results and the experiments is within 3.16%, which indicates that the model established by the simulation is reliable.

4. Results and Discussion

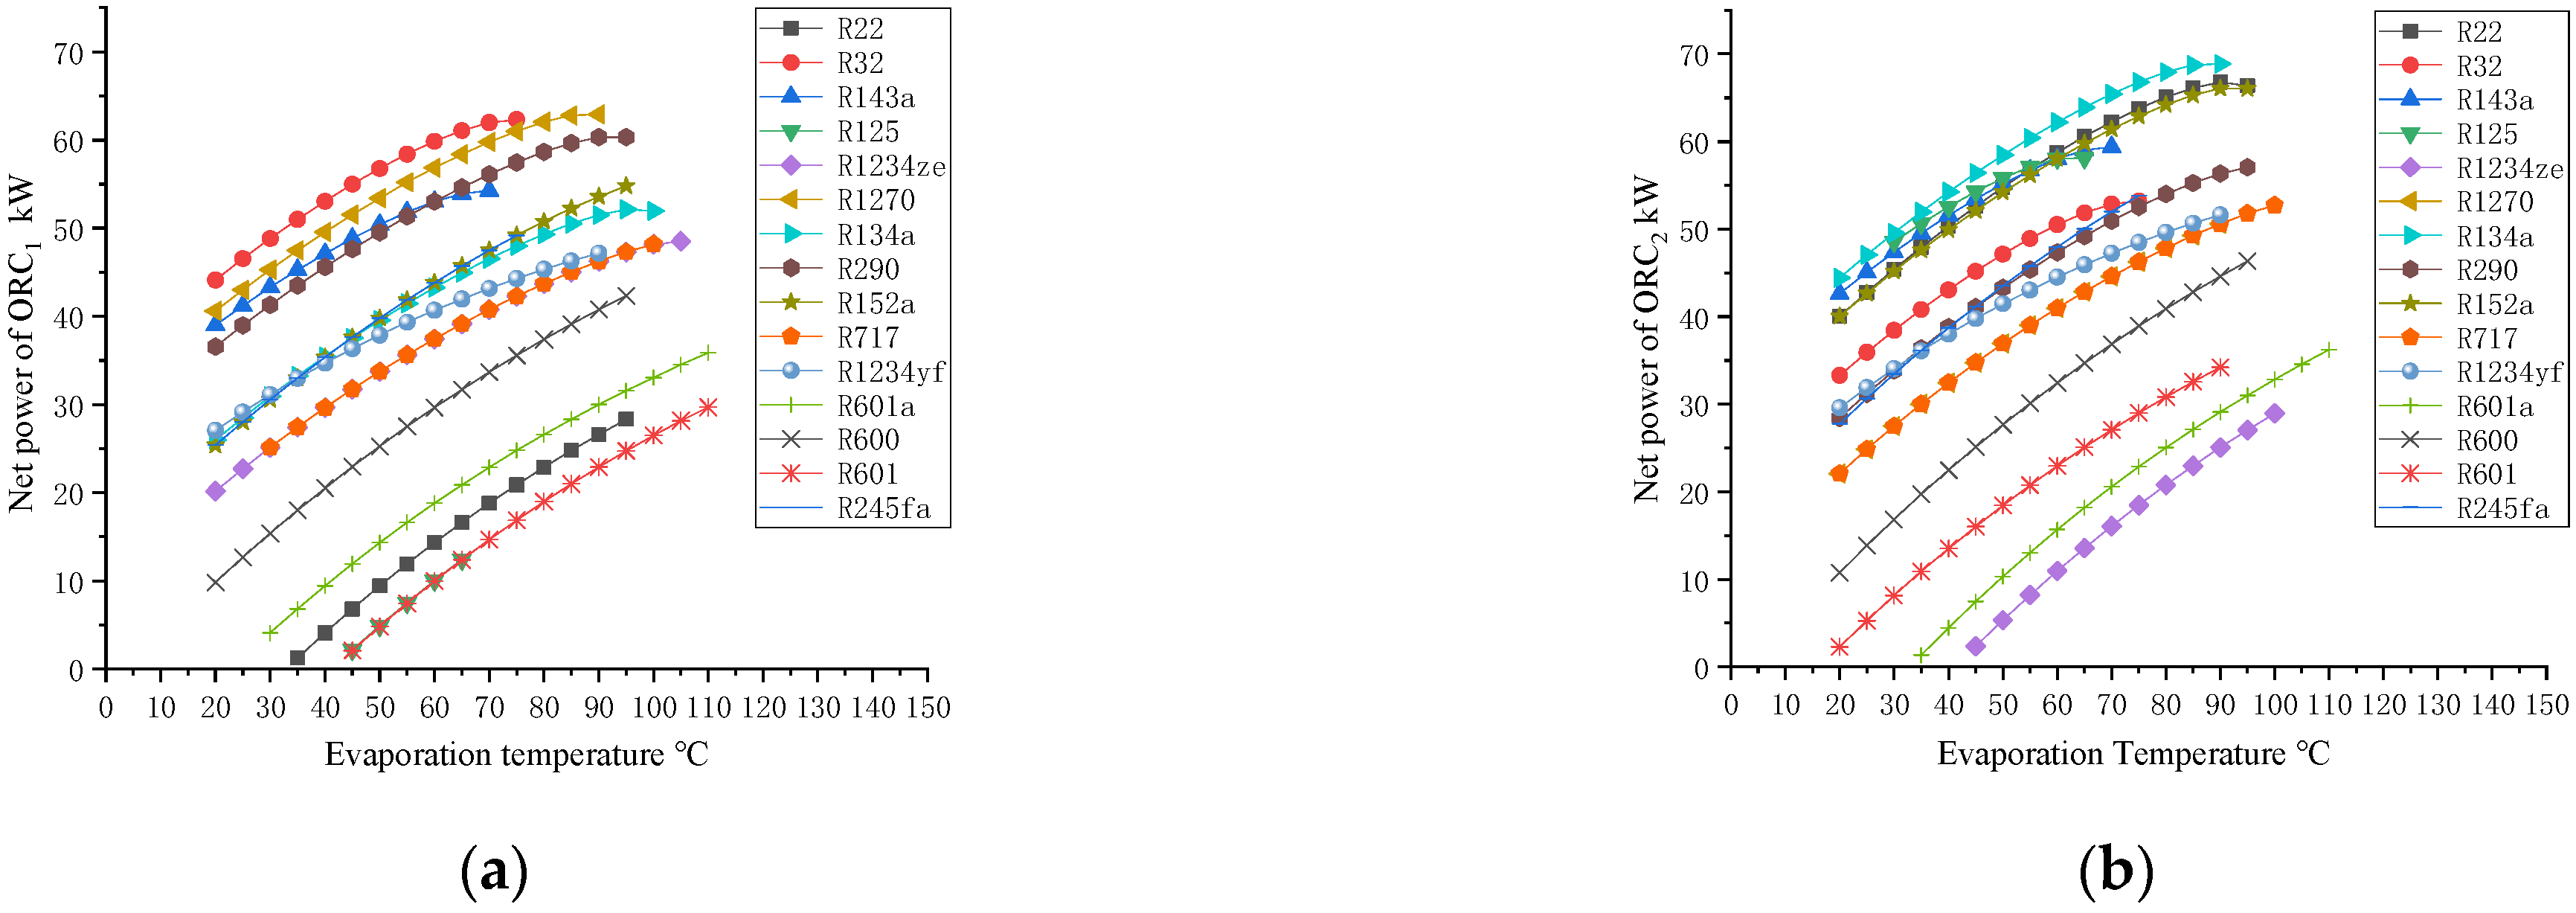
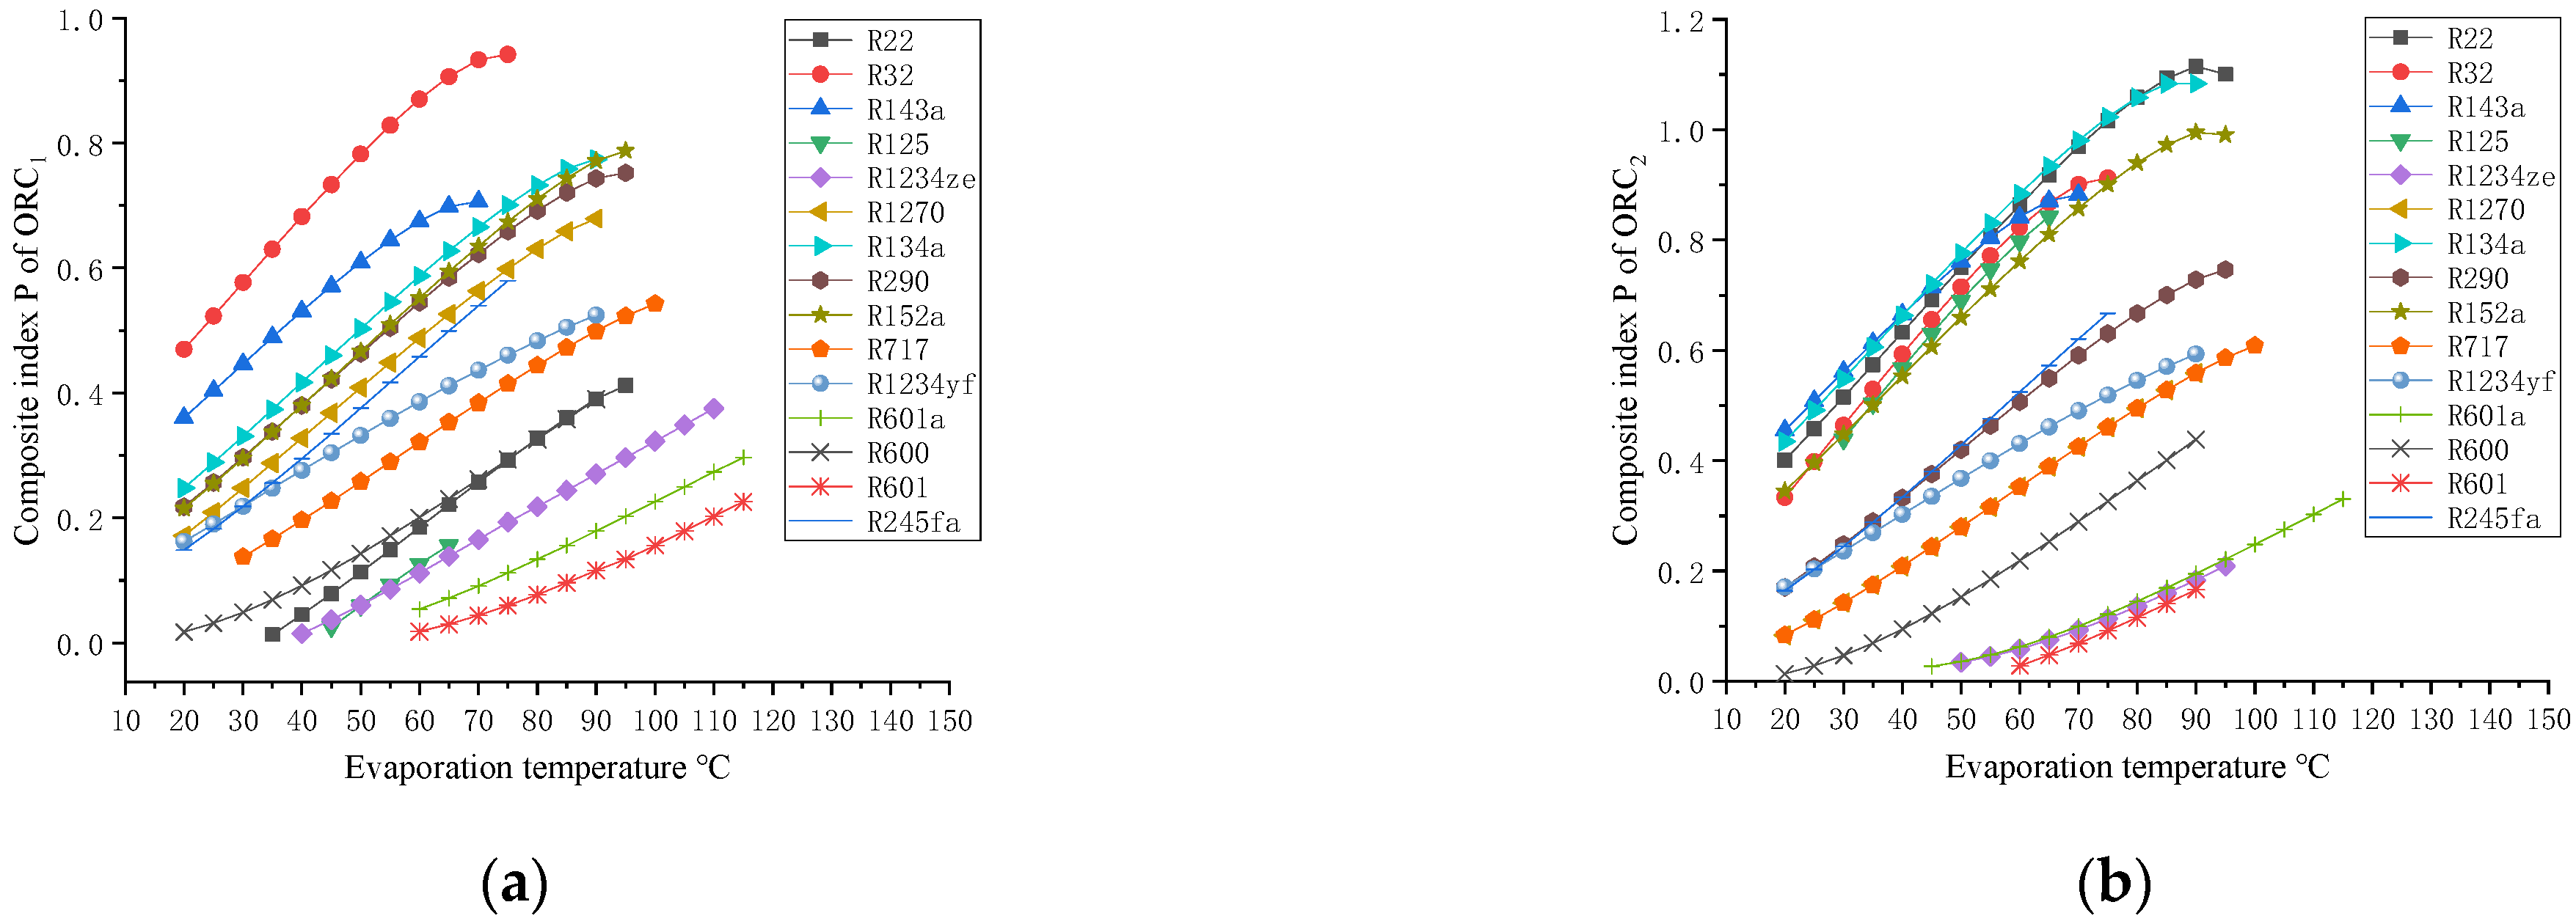
4.1. Working Fluid Selection

The selection of refrigerant for each system is crucial for the stable and efficient operation of the overall scheme. According to the operation temperature of each system, the temperature range of the corresponding refrigerants was determined, as shown in Table 9.
In the low temperature cold storage system, the refrigerant directly exchanges heat with natural gas. When selecting the refrigerant, the low freezing point needs to be considered so as to reduce the risk of pipeline blockage caused by refrigerant condensation. Considering the large demand for cold energy and refrigerant consumption in the cold storage system, it is critical to choose a refrigerant with low cost and easy access. Ethylene glycol solution has the characteristics of large specific heat capacity, stable properties, economic convenience, easy transportation and less corrosion to pipelines. Therefore, ethylene glycol solution with a volume concentration of 60% is used in the low-temperature cold storage. When choosing refrigerant for the high-temperature cold storage and air conditioning systems, they are more inclusive because the systems do not directly exchange heat with low temperature LNG. Here, ethylene glycol solution with a volume concentration of 40% is adopted. The freezing point is about −23 °C, which meets the temperature standards of the high-temperature cold storage and air conditioning on refrigerant temperature.
For the organic Rankine circulation system, the thermodynamic and economic performance of the system depends on the working medium. Therefore, the selection of working fluids over a wide range is the key to achieve optimal thermodynamic efficiency. The operating medium of ORC system shall meet the requirements of chemical stability, non-toxic, non-corrosive or low corrosive and low global warming potential under the designed operating conditions [42]. The working medium should also have a high latent heat of evaporation and a low specific heat in order to reduce equipment size and improve thermal efficiency. Furthermore, a lower three-phase temperature and standard boiling point temperature are desired so that the working range is wide and the refrigerant is not easy to freeze. Therefore, according to the temperature of LNG, the critical temperature range, the triple point temperature range and the normal boiling point temperature range of the ORC working medium are set to [30 °C, 300 °C], [−200 °C, −0 °C] and [−200 °C, 40 °C], respectively. Refprop is a physical property database from the National Institute of Standards and Technology [43]. Based on the Refprop 9.0 database, there are 15 common liquids that can be used as alternative fluids. Figure 3 shows the temperature entropy diagram corresponding to the selected basic working medium, where the lower boundary of the operating temperature is determined according to the triple point and the upper boundary is obtained due to the thermal stability of the working fluid.
Figure 4 and Figure 5 show the effect of working fluid evaporation temperature on the net power and exergy efficiency of the ORC1 and ORC2 system, respectively. It can be seen from the curves in the figure that except for a few wet working substances, such as R32, R134a and R152a, both the net power and exergy efficiency of the two ORC systems increase with the evaporation temperature. This is because increasing the evaporation temperature can effectively raise the inspiratory pressure and rapidly reduce the compression ratio, thus lowering the exhaust temperature. As a result, the average heat-release temperature of the working medium in the condenser is reduced, which leads to the irreversible loss reduction and exergy efficiency improvement of the heat exchanger.
The influence of the working liquid evaporation temperature on the economic indicators of the cascaded ORC system is shown in Figure 6. The optimal design value of the decision variable in the target solution can be determined by normalizing the economic function, that is, scaling all candidate points to a mapping between 0 and 1. For a certain system structure, a smaller EC indicates a higher productivity and a higher return on investment. As can be seen from the figure, the economic performance of an ORC system decreases obviously with the increase of evaporation temperature.
To comprehensively consider the thermodynamic and economic performance of the ORC systems, a composite index P was defined. The variation of the composite index with the evaporation temperature of the working fluid is displayed in Figure 7. As can be seen from the figures, the comprehensive performance of the systems remained optimal over a wide evaporation temperature range, when R32 and R134a were used as the working medium of ORC1 and ORC2. Therefore, R32 and R134a were selected as the working fluids of ORC1 and ORC2, respectively.

4.2. System Optimization

Due to the strong nonlinear relationship among the parameters of the ORC-TCS-ACS-SDS system and the fact that the traditional optimization method cannot take into account the interaction between parameters, the particle swarm optimization algorithm was selected in this paper to optimize the operation performance of the ORC-TCS-ACS-SDS scheme. Taking the net output power as the objective function, the specific optimization process is shown in Figure 8. Notably, the ordinary particle swarm optimization algorithm is easy to fall into local optimal algorithm and cannot obtain the optimal solution, so the adaptive weighted particle swarm optimization algorithm was used [44]. The calculation procedure is as follows:
  • Model the ORC-TCS-ACS-SDS system with Aspen Hysys software based on known conditions.
  • Connect Aspen Hysys with Matlab through Active X components to realize data interaction.
  • Use Matlab to read the simulation results in Hysys and optimize the decision variables with the net output power of the ORC-TCS-ACS-SDS system as the objective function.
  • Import optimized variables into Hysys for process simulation.
  • Repeat step 3 and use Matlab to calculate the system net power.
  • Determine whether the cycle converges. If not, repeat steps (4) and (5). If so, output the optimal decision variables.
Due to the actual requirements of ships in different seasons, the heat load of cold storage and air conditioning system is different. Take summer as an example, the evolution of the optimal adaptive solution is exhibited in Figure 9. The 10 variables that need to be optimized in the system are shown in Table 10. It can be seen that while ensuring the basic cooling energy requirements of the cold storage and air conditioning system, the maximum net power output of the ORC-TCS-ACS-SDS system is 725.78 kW, of which, the output power of ORC1 and ORC2 are 254.02 kW and 471.75 kW, respectively.
Economic indicators are important parameters to characterize system performance. When analyzing the economic performance of the system, both the direct economic benefits and the equipment investment costs need to be considered to draw a comprehensive conclusion. After system optimization, the economic indicators can be obtained, as shown in Table 11.

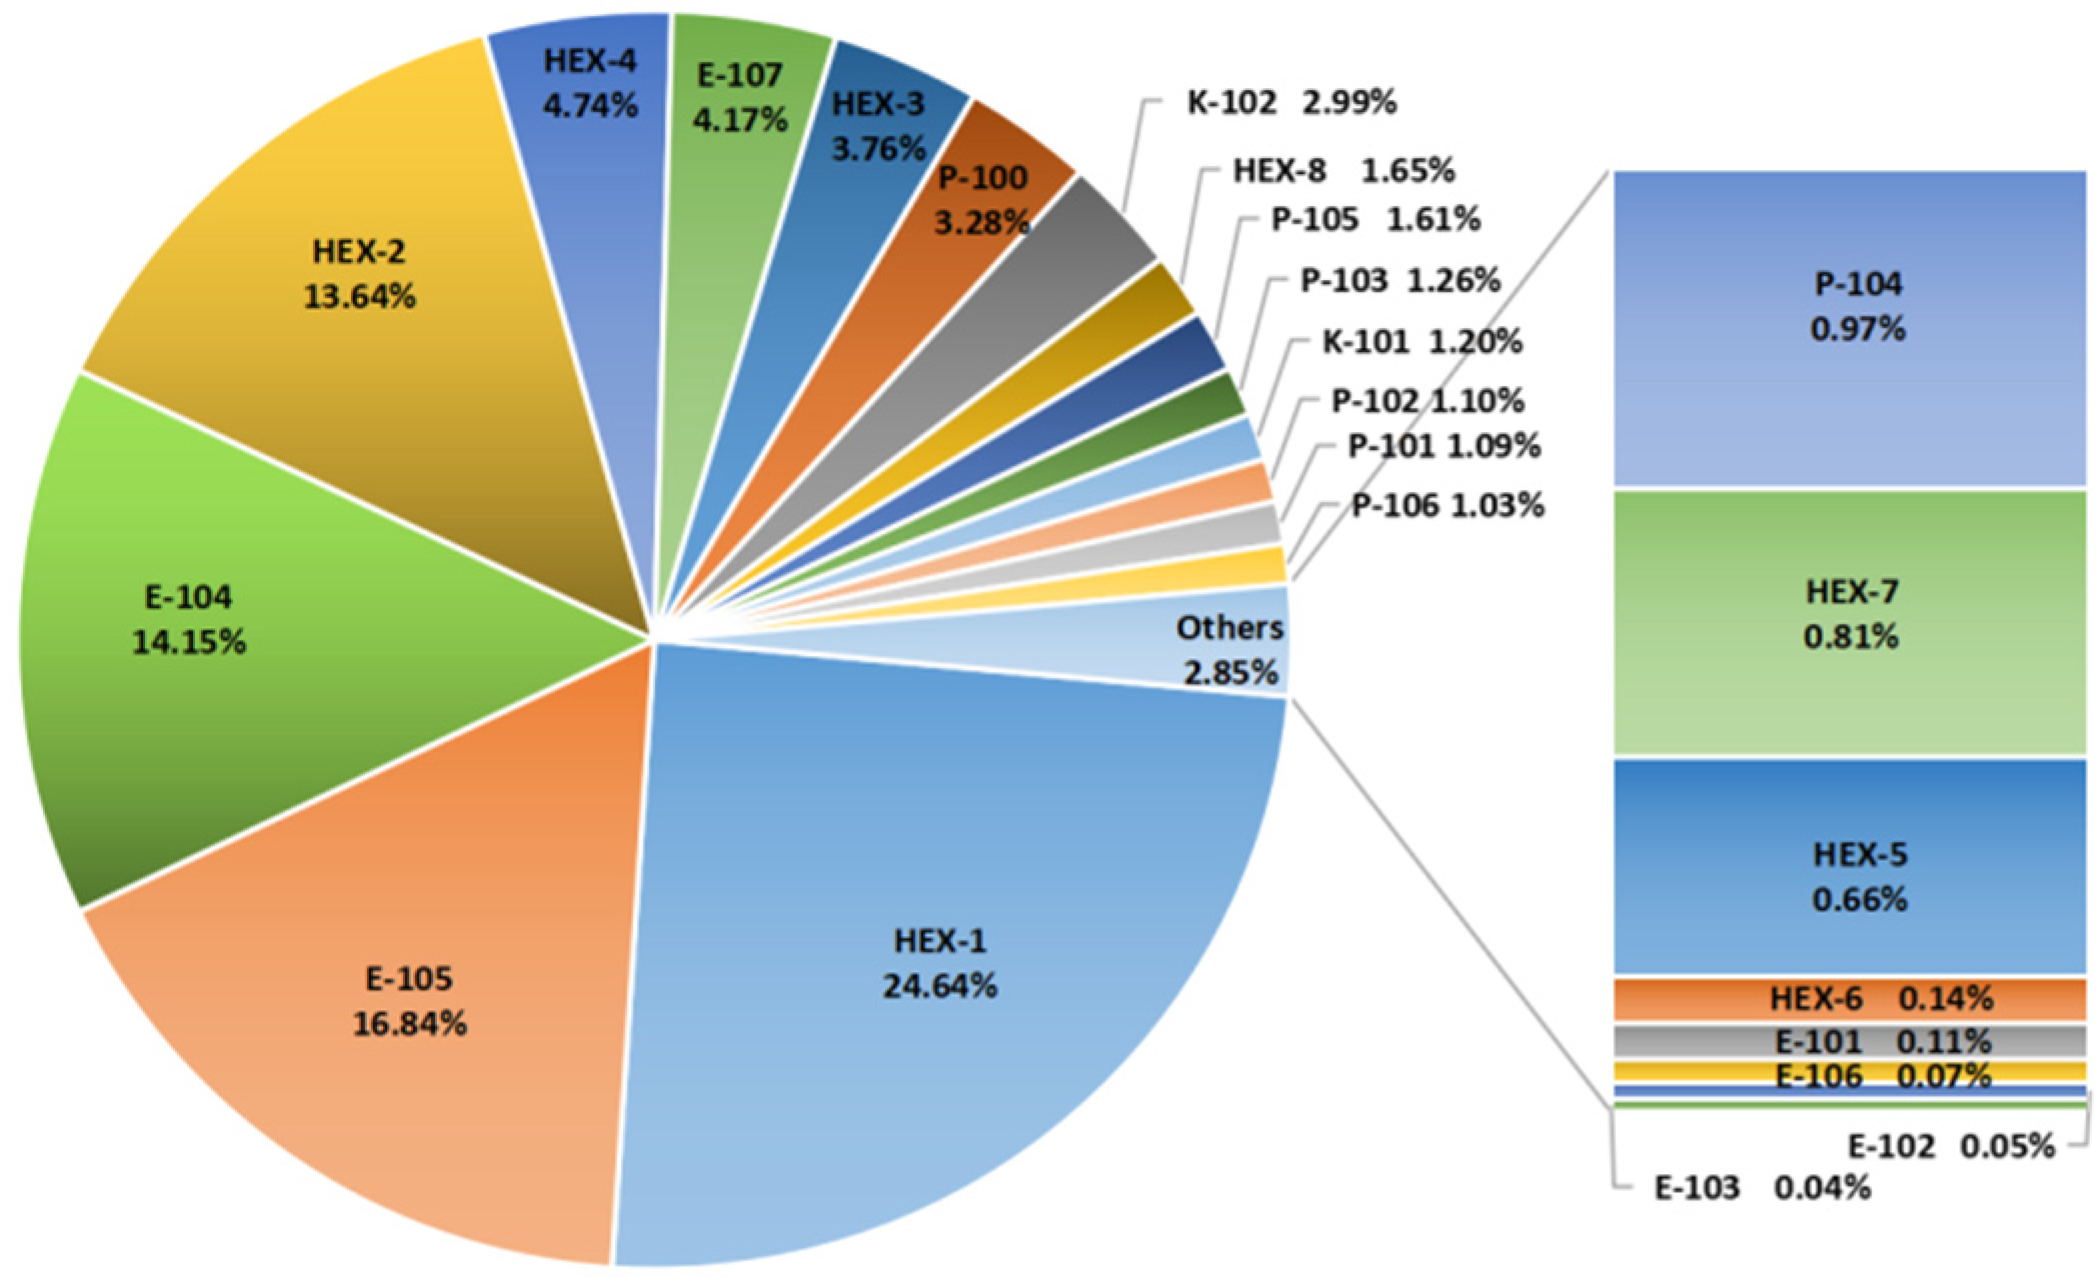
4.3. Exergy Analysis of the System and Equipment

The overall exergy utilization of the ORC-TCS-ACS-SDS system is shown in Figure 10. The input energy of the system includes exhaust waste heat, cold energy from LNG, seawater energy and electricity for some equipment. It can be indicated from the figure that the exergy efficiency and exergy loss are 58.63% and 41.37%, respectively. Among the output exergy, the proportion of electrical generation is the largest, which is 29.56%, and the energy utilized by air conditioning and cold storage is 16.50%, while the energy utilized by seawater desalination is 12.57%.
The ORC-TCS-ACS-SDS system is designed to obtain a high thermodynamic efficiency by energy exchange in different temperature zones. Figure 11 shows the heat transfer curves between LNG and ORC, TCS, SDS systems. The total cold energy of LNG supplied to the ORC-TCS-ACS-SDS system was 1066.70 kW. In the low temperature range, about 126.28 kW and 375.91 kW of cold energy were utilized by the ORC1 and TCS systems, which accounts for 11.84% and 36.24%, respectively. Notably, the mismatch of heat transfer curves between LNG and cold storage leads to the waste of some cold energy. In the middle temperature region, the curves of the LNG and ORC2 system were well matched to achieve efficient cold energy utilization. Specifically, the ORC2 system utilized about 366.36 kW of LNG cold energy and the proportion was 34.34%. Finally, the SDS absorbed about 198.14 kW of LNG cold energy in the high temperature range.
For a more comprehensive understanding of the energy consumption of the whole system, the exergy loss of each equipment was analyzed, and the result is displayed in Figure 12. In general, the heat exchangers have relatively high exergy loss, especially the condenser in ORC1, whose exergy loss reaches 24.64%. The main reason is that the temperature difference between the hot and cold ends of the condenser is large, and the LNG has a high exergy value. The exergy loss of condenser increases under this comprehensive action. Therefore, to further improve the thermodynamic performance of the system, the optimization of heat exchangers structure and heat transfer performance is suggested in the future work.

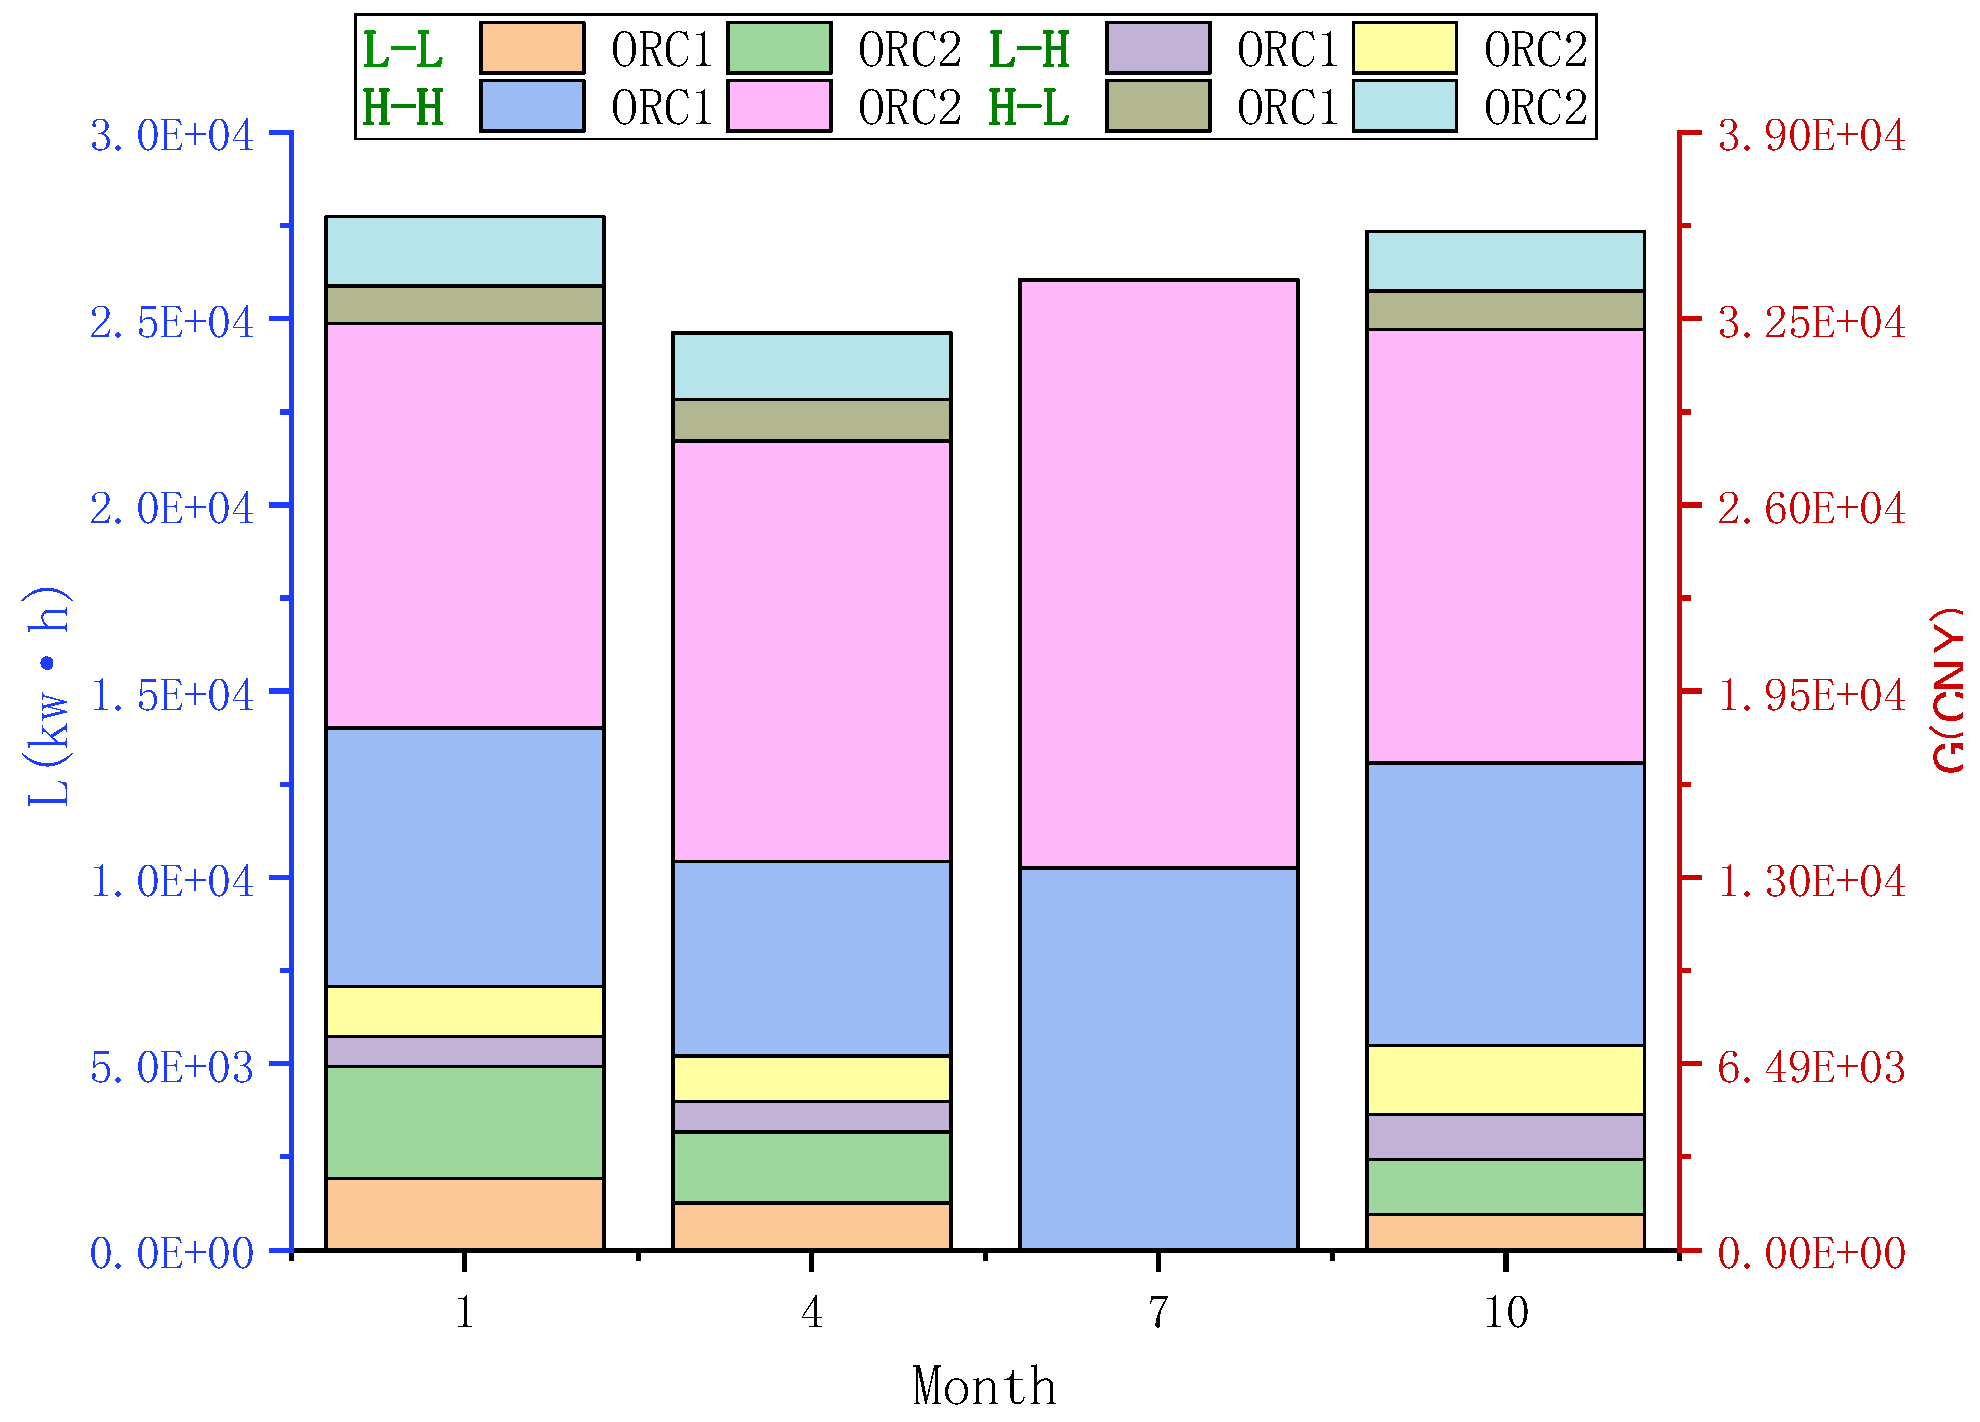
4.4. Economic Analysis of the Target Ship

The LNG-powered VLCC mainly sails in low latitude sea area (Figure 13), and the cold storage and air conditioning systems are affected significantly by the season. Therefore, the economic analysis of the ORC-TCS-ACS-SDS system should take into account the specific factors such as the sailing season and sailing time. In addition, the sailing time and port of call time of the vessel vary in different sea areas, and the operating load and the cold energy utilization are different. In this paper, four typical months (i.e., January, April, July and October) were selected for demonstration.
Through the official website of COSCO Shipping Container Transportation Co., Ltd. and the record of high load and low load in the actual operation process of the ship, the actual operation days of the ship and the cooling consumption in the operation process were obtained, as shown in Figure 14 and Table 12. Here, the low-load and high-load indicate that the vessel operates at 50% and 100% load, respectively. Based to the cooling consumption of the target vessel in January, April, July and November, the maximum net power of the organic Rankine cycle in each month was determined by particle swarm optimization simulation, and the calculation result is shown in Table 13. Figure 15 displays the energy saving L and economic benefit G of the ORC system under different load conditions, where the symbols L-L, L-H, H-H and H-L represent the cold storage and air conditioning system operate in low-low load, low-high load, high-high load, high-low load. It can be seen that the ORC-TCS-ACS-SDS system can produce large economic benefits. The Rankine cycle generated the most electricity when both operated under high load conditions. More specifically, the maximum economic benefit of electricity generated by the Rankine cycle in January is $5221.89. For shipping enterprises with large-scale ocean-going fleets, the ORC-TCS-ACS-SDS system is expected to save significant operating costs every year.
In addition to power generation, the ORC-TCS-ACS-SDS system can use cold energy to supply fresh water through seawater desalination. Table 14 shows the cooling load of seawater desalination in different months. For ease of calculation, the latent heat of solidification when seawater was frozen as desalted ice was set to 320 kJ/kg. It turned out that the amount of fresh water generated in January, April, July and October were 227.85 t, 231.75 t, 281.33 t and 253.4 t, respectively. Taking the fresh water demand of the target vessel as 20t/day, the SDS system can supply freshwater resources to the target ship for 11, 13, 14 and 13 days in January, April, July and November, respectively.

5. Conclusions

In this research, a new LNG cold energy step utilization system ORC-TCS-ACS-SDS was proposed by taking a 300,000-ton asphalt tanker as the target ship. Through the cascade operation of the dual ORC system, cold storage system, air conditioning system and seawater desalination system, the as-designed ORC-TCS-ACS-SDS realized comprehensive and high efficient utilization of LNG cold energy in different temperature ranges. The main conclusions are as follows:
  • A comprehensive LNG cold energy utilization scheme ORC-TCS-ACS-SDS was established and simulated. The integrated scheme was capable of recovering both the waste heat of the main engine and the cold energy of LNG fuel simultaneously, and the cold energy utilization was divided into three temperature zones, i.e., high, middle and low temperature regions, to achieve a high exergy efficiency of cold energy
  • With the maximum net output power of the ORC system as the objective, the performance of the ORC-TCS-ACS-SDS scheme was optimized using the adaptive weighted particle swarm algorithm. The system has a maximum net output power of 725.78 kW, and its energy efficiency is 58.63%. The annual net interest rate is $115,300, and it takes around 10.8 years to repay the cost from an economic standpoint.
  • The economic performance of the scheme in different seasons was analyzed by referring to the running track and working conditions of the LNG-powered VLCC. The ORC-TCS-ACS-SDS scheme can bring substantial economic benefits, among which, the maximum economic benefit of electricity generated in January is up to $5308 and the system can provide fresh water for 11 days at the same time.

Author Contributions

Conceptualization, X.X. (Xiu Xiao) and Z.W.; methodology, X.X. (Xiu Xiao) and X.X. (Xiaoqing Xu); software, X.X. (Xiaoqing Xu) and C.L.; validation, Z.W., C.L. and Y.H.; formal analysis, X.X. (Xiaoqing Xu) and C.L.; investigation, X.X. (Xiaoqing Xu) and Y.H.; resources, X.X. (Xiu Xiao); data curation, Y.H.; writing—original draft preparation, X.X. (Xiaoqing Xu); writing—review and editing, X.X. (Xiu Xiao); supervision, X.X. (Xiu Xiao) and Z.W.; project administration, X.X. (Xiu Xiao); funding acquisition, X.X. (Xiu Xiao). All authors have read and agreed to the published version of the manuscript.

Funding

This research was funded by National Natural Science Foundation of China (Grant Number: 51906029), Department of Science and Technology of Liaoning Province (Grant Number: 2020-HYLH-36) and China Postdoctoral Science Foundation (Grant Number: 2019M661084).

Institutional Review Board Statement

Not applicable.

Informed Consent Statement

Not applicable.

Data Availability Statement

Data is availability on request from the authors.

Conflicts of Interest

The authors declare no conflict of interest.

References

  1. Dale, S. BP Statistical Review of World Energy 2021; BP Plc: London, UK, 2021. [Google Scholar]
  2. Huang, Z.; Soh, K.Y.; Wan, Y.; Islam, M.R.; Chua, K.J. Assessment of an intermediate working medium and cold energy storage (IWM-CES) system for LNG cold energy utilization under real regasification case. Energy 2022, 253, 124080. [Google Scholar] [CrossRef]
  3. Bao, J.; Lin, Y.; Zhang, R.; Zhang, N.; He, G. Effects of stage number of condensing process on the power generation systems for LNG cold energy recovery. Appl. Therm. Eng. 2017, 126, 566–582. [Google Scholar] [CrossRef]
  4. Lim, T.W.; Choi, Y.S.; Hwang, D.H. Optimal working fluids and economic estimation for both double stage organic Rankine cycle and added double stage organic Rankine cycle used for waste heat recovery from liquefied natural gas fueled ships. Energy Convers. Manag. 2021, 242, 114323. [Google Scholar] [CrossRef]
  5. Esfilar, R.; Moosavian], S. Introducing a novel air separation process based on cold energy recovery of LNG integrated with coal gasification, transcritical carbon dioxide power cycle and cryogenic CO2 capture. J. Clean. Prod. 2017, 142, 1749–1764. [Google Scholar]
  6. Shulga, R.N.; Petrov, A.Y.; Putilova, I.V. The Arctic: Ecology and hydrogen energy. Int. J. Hydrog. Energy 2020, 45, 7185–7198. [Google Scholar] [CrossRef]
  7. Peng, X.; She, X.; Li, C.; Luo, Y.; Zhang, T.; Li, Y.; Ding, Y. Liquid air energy storage flexibly coupled with LNG regasification for improving air liquefaction. Appl. Energy 2019, 250, 1190–1201. [Google Scholar] [CrossRef]
  8. Semaskaite, V.; Bogdevicius, M.; Paulauskiene, T.; Uebe, J.; Filina-Dawidowicz, L. Improvement of Regasification Process Efficiency for Floating Storage Regasification Unit. J. Mar. Sci. Eng. 2022, 10, 897. [Google Scholar] [CrossRef]
  9. Mma, B.; Mmmsb, C.; Mar, D. Energy and exergy analyses of a novel power cycle using the cold of LNG (liquefied natural gas) and low-temperature solar energy. Energy 2016, 95, 324–345. [Google Scholar]
  10. Ayou, D.S.; Eveloy, V. Energy, exergy and exergoeconomic analysis of an ultra low-grade heat-driven ammonia-water combined absorption power-cooling cycle for district space cooling, sub-zero refrigeration, power and LNG regasification. Energy Convers. Manag. 2020, 213, 112790. [Google Scholar] [CrossRef]
  11. Li, S.; Ju, Y. Review of the LNG intermediate fluid vaporizer and its heat transfer characteristics. Front. Energy 2021, 247, 114706. [Google Scholar] [CrossRef]
  12. Zhao, T.; Xu, M.; Xiao, X.; Ma, Y.; Li, Z.; Wang, Z.L. Recent progress in blue energy harvesting for powering distributed sensors in ocean. Nano Energy 2021, 88, 106199. [Google Scholar] [CrossRef]
  13. Wu, J.; Qin, L.; Chen, N.; Qian, C.; Zheng, S. Investigation on a spring-integrated mechanical power take-off system for wave energy conversion purpose. Energy 2022, 245, 123318. [Google Scholar] [CrossRef]
  14. He, T.; Ma, H.; Ma, J.; Mao, N.; Liu, Z. Effects of cooling and heating sources properties and working fluid selection on cryogenic organic Rankine cycle for LNG cold energy utilization. Energy Convers. Manag. 2021, 247, 114706. [Google Scholar] [CrossRef]
  15. Chen, F.; Liu, L.; Peng, J.; Ge, Y.; Wu, H.; Liu, W. Theoretical and experimental research on the thermal performance of ocean thermal energy conversion system using the rankine cycle mode. Energy 2019, 183, 497–503. [Google Scholar] [CrossRef]
  16. Sun, X.F.; Yao, S.G.; Xu, J.J.; Feng, G.Z.; Yan, L.K. Design and Optimization of a Full-Generation System for Marine LNG Cold Energy Cascade Utilization. J. Therm. Sci. 2020, 29, 587–596. [Google Scholar] [CrossRef]
  17. Badami, M.; Carlos Bruno, J.; Coronas, A.; Fambri, G. Analysis of different combined cycles and working fluids for lng exergy recovery during regasification. Energy 2018, 159, 373–384. [Google Scholar] [CrossRef]
  18. Joy, J.; Chowdhury, K. Enhancing generation of green power from the cold of vaporizing LNG at 30 bar by optimising heat exchanger surface area in a multi-staged organic Rankine cycle. Sustain. Energy Technol. Assess. 2021, 43, 100930. [Google Scholar] [CrossRef]
  19. Sun, Z.; Lai, J.; Wang, S.; Wang, T. Thermodynamic optimization and comparative study of different ORC configurations utilizing the exergies of LNG and low grade heat of different temperatures. Energy 2018, 147, 688–700. [Google Scholar] [CrossRef]
  20. Lee, H.Y.Y.; Ryu, B.; Anh, D.P.; Roh, G.; Lee, S.G.; Kang, H.K. Thermodynamic analysis and assessment of novel ORC- DEC integrated PEMFC system for liquid hydrogen fueled ship application. Int. J. Hydrog. Energy 2023, 48, 3135–3153. [Google Scholar] [CrossRef]
  21. Sung, T.; Kim, K.C. Thermodynamic analysis of a novel dual-loop organic Rankine cycle for engine waste heat and LNG cold. Appl. Therm. Eng. 2016, 100, 1031–1041. [Google Scholar] [CrossRef]
  22. Bao, J.J.; Zhang, R.X.; Lin, Y.; Zhang, N.; Zhang, X.P.; He, G.H. Simultaneous optimization of system structure and working fluid for the three-stage condensation Rankine cycle utilizing LNG cold energy. Appl. Therm. Eng. 2018, 140, 120–130. [Google Scholar] [CrossRef]
  23. Zhao, L.; Zhang, J.; Wang, X.; Feng, J.; Kong, X. Dynamic exergy analysis of a novel LNG cold energy utilization system combined with cold, heat and power. Energy 2020, 212, 118649. [Google Scholar] [CrossRef]
  24. Han, F.; Wang, Z.; Ji, Y.; Li, W.; Sunden, B. Energy analysis and multi-objective optimization of waste heat and cold energy recovery process in LNG-fueled vessels based on a triple organic Rankine cycle. Energy Convers. Manag. 2019, 195, 561–572. [Google Scholar] [CrossRef]
  25. Yao, S.; Zhang, Z.; Huang, H.; Feng, G.; Xu, J. Exergetic design and optimization of LNG cold energy utilization system for dual-fuel main engine of a container ship. Int. J. Exergy 2021, 36, 1–29. [Google Scholar] [CrossRef]
  26. Su, Z.X.; Ouyang, T.C.; Chen, J.X.; Xu, P.H.; Tan, J.Q.; Chen, N.; Huang, H.Z. Green and efficient configuration of integrated waste heat and cold energy recovery for marine natural gas/diesel dual-fuel engine. Energy Convers. Manag. 2020, 209, 112650. [Google Scholar] [CrossRef]
  27. Ouyang, T.C.; Xie, S.T.; Tan, J.Q.; Wu, W.C.; Zhang, M.L. Optimization of energy-exergy efficiencies of an advanced cold energy utilization system in liquefied natural gas filling station. J. Nat. Gas Sci. Eng. 2021, 95, 104235. [Google Scholar] [CrossRef]
  28. Yao, S.G.; Shen, X.Y.; Luo, J.G.S.; Shen, X.; Luo, J. Design and optimization of LNG cold energy utilization scheme for dual fuel main engine of 37000DWT asphalt ship. Int. J. Green Energy 2021, 18, 1291–1303. [Google Scholar] [CrossRef]
  29. Liu, Z.; Hu, D.; Hao, M. Design and optimization of LNG ship combined power scheme based on HYSYS. Energy Chem. Ind. 2020, 41, 6. [Google Scholar]
  30. Mavukkandy, M.O.; Chabib, C.M.; Mustafa, I.; Al Ghaferi, A.; AlMarzooqi, F. Brine management in desalination industry: From waste to resources generation. Desalination 2019, 472, 114187. [Google Scholar] [CrossRef]
  31. Lin, W.; Huang, M.; Gu, A. A seawater freeze desalination prototype system utilizing LNG cold energy. Int. J. Hydrog. Energy 2017, 42, 18691–18698. [Google Scholar] [CrossRef]
  32. Kelly, S.; Tsatsaronis, G.; Morosuk, T. Advanced exergetic analysis: Approaches for splitting the exergy destruction into endogenous and exogenous parts. Energy 2009, 34, 384–391. [Google Scholar] [CrossRef]
  33. Zhang, H.T.; Janajreh, I.; Ali, M.I.H.; Askar, K. Freezing desalination: Heat and mass validated modeling and experimental parametric analyses. Case Stud. Therm. Eng. 2021, 26, 101189. [Google Scholar] [CrossRef]
  34. Habibi, H.; Zoghi, M.; Chitsaz, A.; Javaherdeh, K.; Ayazpour, M. Thermo-economic analysis and optimization of combined PERC-ORC-LNG power system for diesel engine waste heat recovery. Energy Convers. Manag. 2018, 173, 613–625. [Google Scholar] [CrossRef]
  35. Yang, F.; Cho, H.; Zhang, H.; Zhang, J. Thermoeconomic multi-objective optimization of a dual loop organic Rankine cycle (ORC) for CNG engine waste heat recovery. Appl. Energy 2017, 205, 1100–1118. [Google Scholar] [CrossRef]
  36. Zhang, L.; Pan, Z.; Zhang, Z.E.; Shang, L.Y.; Wen, J.B.; Chen, S.J. Thermodynamic and Economic Analysis Between Organic Rankine Cycle and Kalina Cycle for Waste Heat Recovery from Steam-Assisted Gravity Drainage Process in Oilfield. J. Energy Resour. Technol. Trans. Asme 2018, 140, 122005. [Google Scholar] [CrossRef]
  37. Gholizadeh, T.; Vajdi, M.; Mohammadkhani, F. Thermodynamic and thermoeconomic analysis of basic and modified power generation systems fueled by biogas. Energy Convers. Manag. 2019, 181, 463–475. [Google Scholar] [CrossRef]
  38. Zareh, A.D.; Saray, R.K.; Mirmasoumi, S.; Bahlouli, K. Extensive thermodynamic and economic analysis of the cogeneration of heat and power system fueled by the blend of natural gas and biogas. Energy Convers. Manag. 2018, 164, 329–343. [Google Scholar] [CrossRef]
  39. Gf, A.; Yg, A.; Hab, C.; Rm, D.; Yae, F.; Fjg, H.; Pg, A. Energy and exergy and economic (3E) analysis of a two-stage organic Rankine cycle for single flash geothermal power plant exhaust exergy recovery. Case Stud. Therm. Eng. 2021, 28, 101544. [Google Scholar]
  40. Galloni, E.; Fontana, G.; Staccone, S. Design and experimental analysis of a mini ORC (organic Rankine cycle) power plant based on R245fa working fluid. Energy 2015, 90, 768–775. [Google Scholar] [CrossRef]
  41. Han, Z.; Liu, Q.; Zhang, Y.; Zhang, S.; Liu, J.; Li, W. Feasibility Study on Novel Room Air Conditioner with Natural Cooling Capability. Appl. Therm. Eng. 2016, 108, 1310–1319. [Google Scholar] [CrossRef]
  42. Zhang, X.; Zhang, Y.; Wang, J. Evaluation and Selection of Dry and Isentropic Working Fluids Based on Their Pump Performance in Small-Scale Organic Rankine Cycle. Appl. Therm. Eng. 2021, 191, 116919. [Google Scholar] [CrossRef]
  43. Lemmon, E.W.; Huber, M.L.; Mclinden, M.O. NIST Standard Reference Database 23: Reference Fluid Thermodynamic and Transport Properties-REFPROP. 9.0.; NIST NSRDS; National Institute of Standards and Technology: Gaithersburg, Marylan, 2010. [Google Scholar]
  44. Wang, X.M.; Wang, G.Q.; Wu, Y.X. An Adaptive Particle Swarm Optimization for Underwater Target Tracking in Forward Looking Sonar Image Sequences. IEEE Access 2018, 6, 46833–46843. [Google Scholar] [CrossRef]
Figure 1. Flowchart of the ORC-TCS-ACS-SDS scheme.
Jmse 11 00592 g001
Figure 2. Simulation diagram of ORC-TCS-ACS-SDS system.
Jmse 11 00592 g002
Figure 3. Temperature-entropy diagram of the 15 alternative working medium. (a) Entropy between −2 kJ/(kg·K) and 3 kJ/(kg·K); (b)Entropy between −2 kJ/(kg·K) and 8 kJ/(kg·K).
Jmse 11 00592 g003
Figure 4. Effect of evaporation temperature on the output power of ORC systems. (a) ORC1 system. (b) ORC2 system.
Jmse 11 00592 g004
Figure 5. Effect of evaporation temperature on the exergy efficiency of ORC systems. (a) ORC1 system. (b) ORC2 system.
Jmse 11 00592 g005
Figure 6. Effect of evaporation temperature on the economic index of the ORC systems. (a) ORC1 system. (b) ORC2 system.
Jmse 11 00592 g006
Figure 7. Effect of evaporation temperature on the general factor of the ORC systems. (a) ORC1 system. (b) ORC2 system.
Jmse 11 00592 g007
Figure 8. The optimization process based on particle swarm optimization algorithm.
Jmse 11 00592 g008
Figure 9. Evolution of the optimal adaptive solution.
Jmse 11 00592 g009
Figure 10. Overall exergy utilization of the ORC-TCS-ACS-SDS system.
Jmse 11 00592 g010
Figure 11. Heat transfer curves of the ORC-TCS-ACS-SDS system.
Jmse 11 00592 g011
Figure 12. Exergy loss of each equipment.
Jmse 11 00592 g012
Figure 13. The route chart of VLCC.
Jmse 11 00592 g013
Figure 14. Operating time of the cold storage and air conditioning system.
Jmse 11 00592 g014
Figure 15. Energy saving L and economic benefit G of ORC system.
Jmse 11 00592 g015
Table 1. Main parameters of the VLCC.
ParameterValue
Length of ship/m330
Width of ship/m60
Load/t296,600
Operating speed/kn15.6
Designed Load Draft/m21.5
Main engine power/kW25,480
Daily consumption of LNG/(t/d)70
The boiling point of LNG/°C−160
Table 2. Main parameters of the dual fuel engine.
ParameterValue
Pressure parameter of intake air/MPa≤1.6
Fuel consumption of the main engine/(kg/kW·h)170.7
Calorific value of the fuel oil/(kJ/kg)42,707
Exhaust temperature of the main engine/°C160
Exhaust capacity of the main engine/(kg/h)8000
Table 3. Exergy loss and exergy efficiency of main devices.
EquipmentFormula
Heat ExchangerExergy loss: E x l o s s , H E X = E X 1 , i n E X 1 , o u t E X 2 , o u t E X 2 , i n
Exergy efficiency: η e x , H E X = E X 2 , o u t E X 2 , i n E X 1 , i n E X 1 , o u t
EvaporatorExergy loss: E x l o s s , H E X = E X , i n 1 T E V A T 0 Q E X , o u t
Exergy efficiency: η e x , H E X = 1 T E V A T 0 Q + E X , o u t E X , i n
Booster pumpExergy loss: E x l o s s , P = W P E X , o u t E X , i n
Exergy efficiency: η e x , P = E X , o u t E X , i n W P
ExpanderExergy loss: E x l o s s , E = E X , o u t E X , i n
Exergy efficiency: η e x , E = E X , o u t E X , i n W e x p
Table 4. Basic parameters of each device.
K1K2K3C1C2C3B1B2FaFb
Evaporator2.2853−0.3030.16340.0388−0.1130.08181.63001.66001.0000/
Condenser4.3247−0.3030.16340.00000.00000.00001.63001.66001.0000/
Pump3.38920.05360.15380.0388−0.1120.08181.63001.66001.4000/
Heater4.66500.15500.15400.00000.00000.00000.96001.21001.0000/
Expansion machine3.51400.5890.000000.000000.00000 3.5000
Table 5. Composition of the LNG gas.
ComponentThe Mole Fraction
Methane91.46%
Ethane4.70%
Propane2.59%
Butane0.51%
CO0.05%
CO20.06%
N20.09%
Table 6. The main input parameters for system simulation.
ComponentPhysicalParameter
Booster pumpPressure ratio3280 kPa
Adiabatic efficiency75.00%
ExpanderIsentropic efficiency75.00%
Polytropic efficiency71.90%
Inlet temperature of flue gas160.4 °C
Inlet flow of flue gas5800 kg/h
Import temperature of LNG−160.2 °C
Outlet temperature of LNG20 °C
Table 7. Key thermodynamic parameters of each flow in the ORC-TCS-ACS-SDS system.
StreamFluidT (°C) P (kPa)StreamFluidT (°C) P (kPa)
LNGLNG−162101LC-1160% glycol solution−25470
1LNG/NG−1604000LC-1260% glycol solution−60500
2NG−1304000LC-1460% glycol solution−20470
3NG−804000LC-1560% glycol solution−60500
4NG−404000LC-1660% glycol solution−59470
5NG204000LC-1760% glycol solution−15470
A-1R32−78.920LC-1860% glycol solution−16.2470
A-2R32−78.91728HC-140% glycol solution−1.96470
A-4R32−39.320HC-240% glycol solution−1.96500
B-1R134a−15.5300HC-440% glycol solution−1.96500
B-2R134a−13.42000HC-540% glycol solution−1.96470
B-4R134a−6.3160HC-640% glycol solution−1.96470
LC-160% glycol solution−60470HC-840% glycol solution0460
LC-260% glycol solution−60643HC-940% glycol solution0460
LC-360% glycol solution−60500SD-1R601A−30300
LC-560% glycol solution−25470SD-2R601A−29.9500
LC-660% glycol solution−60500SD-4R601A−63.8300
LC-860% glycol solution−25470AC-140% glycol solution−52.9400
LC-960% glycol solution−60500AC-340% glycol solution−29.8320
LC-1060% glycol solution−59470AC-440% glycol solution10400
Table 8. Model validation results.
StreamParametersLiterature ValueSimulation ResultError
ORC [40]Output work of expander1.170 kW1.147 kW1.91%
Work consumed by pump0.160 kW0.158 kW1.25%
Thermal efficiency9.280%9.280%0.03%
ACS [41] (25 °C)Temperature of condenser25.080 °C24.471 °C2.43%
Temperature of evaporator25.910 °C25.172 °C2.86%
Cooling capacity2.760 kW2.692 kW2.53%
SDS [29]Temperature of evaporation−25.000 °C−24.213 °C3.16%
Outlet temperature of pump−32.000 °C−32.095 °C0.29%
Table 9. Temperature range of the refrigerants.
Form of Cold Energy UtilizationSystem Temperature (°C)Refrigerant Temperature Range (°C)
Low-temperature cold storageRefrigerating temperature
−23~−18
−40~−20
High-temperature cold storageRefrigerating temperature
−5~0
−15~−10
Air conditioningTemperature in the room
22~24
0~10
Seawater desalinationWater condensation point
−5~−2
−20–30
Table 10. The decision variables and the optimized results.
Decision VariableVariable Value RangeOptimization Result
A-1P (kPa)0–30001728
A-2P (kPa)20–10020
A-3T (°C)40–160160
B-1P (kPa)0–30002000
B-2P (kPa)60–300300
B-3T (°C)20–9090
LC-2P (kPa)300–1000643
AC-4T (°C)10–15010
SD-2P (kPa)50–300300
SD-4P (kPa)500–1000500
Table 11. Economic indicators.
Total Investment Cost of the System
TIC ($)
Cost Recovery Factor
CRF
Power Generation Cost
PPC
The Annual Net Interest Rate ATNI ($)Investment Payback Period
IPP (Years)
1.25 × 1070.0960.04831.153 × 10610.8
Table 12. Cooling consumption of cold storage and air conditioning systems in different months.
Operation StateL-TSSH-TSSACS
Low load in January/kW4.71.20
High load in January/kW11.78.697
Low load in April/kW6.72.60
High load in April/kW12.59.2109
Low load in July/kW12.39.10
High load in July/kW13.39.7120
Low load in October/kW11.58.60
High load in October/kW12.89.3115
Table 13. The maximum net power of the system in different months.
MonthTSSACSORC1
(kW)
ORC2
(kW)
Net Power
(kW)
JanuaryLow loadHigh load174.67272.91447.58
Low loadHigh load201.09335.15536.24
AprilHigh loadHigh load267.12417.32684.44
High loadLow load203.37372.87576.24
JulyLow loadLow load179.25271.57450.82
Low loadHigh load273.83408.68682.52
OctoberHigh loadHigh load261.14564.28825.42
High loadLow load280.65445.47726.12
Table 14. Cooling load of low latitude desalination systems.
Month14710
Cooling load (kW)104108126114
Disclaimer/Publisher’s Note: The statements, opinions and data contained in all publications are solely those of the individual author(s) and contributor(s) and not of MDPI and/or the editor(s). MDPI and/or the editor(s) disclaim responsibility for any injury to people or property resulting from any ideas, methods, instructions or products referred to in the content.

