Article

Effect of Composite Bionic Micro-Texture on Bearing Lubrication and Cavitation Characteristics of Slipper Pair

1
School of Mechanical Engineering, Yanshan University, Qinhuangdao 066004, China
2
Hebei Provincial Key Laboratory of Heavy Machinery Fluid Power Transmission and Control, Yanshan University, Qinhuangdao 066004, China
*
Authors to whom correspondence should be addressed.
J. Mar. Sci. Eng. 2023, 11(3), 582; https://doi.org/10.3390/jmse11030582
Submission received: 4 February 2023 / Revised: 2 March 2023 / Accepted: 7 March 2023 / Published: 9 March 2023

Abstract

:
The slipper pair is the crucial friction pair of the seawater axial piston pump. Taking seawater as the working medium will inevitably affect the bearing performance of the slipper pair. In this paper, a seawater axial piston pump slipper pair model with a composite bionic micro-texture of the first-stage circular pit and the second-stage circular ball is established. Using the CFD simulation method, 18 groups of orthogonal tests are designed to explore the effects of seven test factors, such as rotational speed, first-stage diameter, first-stage aspect ratio, second-stage diameter, second-stage aspect ratio, area ratio, and distribution angle, on the bearing characteristics of the water film of the slipper pair. Study whether cavitation can further improve the bearing characteristics of the water film. The research shows that there is a vortex behind the circular pit, and there is a pressure difference in the calculation domain of the water film. The existence of the pressure difference causes the bearing force of the water film surface to increase. The cavitation phenomenon mainly occurs at the divergent wedge behind the circular pit. Among them, the total pressure bearing force of the 5th test group increased by 90% after introducing cavitation effect, and the total pressure bearing force of the 17th test group increased by about 86% compared with other test groups at the same speed. The order of the test factors affecting the water film bearing features is: A (rotational speed) > C (first-stage aspect ratio) > B (first-stage diameter) > E (second-stage aspect ratio) > F (area ratio) > D (second-stage diameter) > G (distribution angle). The optimal model is A6B2C1D3E3F2G3.

1. Introduction

In recent years, the seawater axial piston pump has become a hot issue in mechanical engineering and marine engineering construction. The characteristics of energy conservation, environmental protection, safety, and stability of using seawater instead of mineral oil as the working medium have already played an enormous role in marine engineering equipment [1,2]. However, seawater has the disadvantages of low viscosity, poor lubrication characteristics, and high vaporization pressure, which has a significant impact on the performance of the crucial friction pairs of seawater axial piston pump, especially for the slipper pair with complex working conditions [3,4,5]. Therefore, based on the excellent morphology of the biological surface in nature, this paper carries out the research on the bearing lubrication and cavitation characteristics of the seawater axial piston pump slipper pair with the composite bionic micro-textured surface.
At present, many scholars have carried out research on the microstructure distribution of different friction pairs to ameliorate the friction and wear properties [6,7,8,9]. Kovalchenko et al. [10] systematically studied the lubrication characteristics of textured surfaces, established the lubrication model of the textured mechanical seal under hydrodynamic pressure, studied the influence of surface texture parameters on the bearing force of the lubricating film, and carried out experimental verification. Codrignani et al. [11] studied the influence of surface texture shape parameters on the tribological characteristics of micro-pits. Combining numerical calculation and experimental research, the study showed that the depth of micro-pits could reduce friction, and the influence degree was greater than the diameter of micro-pits. Liu et al. [12] established the optimization method of texture parameters and carried out numerical simulation and experimental research on the tribological properties of textured surfaces. Through the comparative tribological experiments of non-textured and textured samples, it was verified that the textured surface could achieve a significant anti-friction effect. The anti-friction mechanism was mainly attributed to the improvement of bearing capacity. Braun et al. [13] used a pin-on-disk experiment to constant the pit area and depth-to-diameter ratio. The tribological performance of steel sliding friction pairs with a diameter of 15~800 μm under mixed lubrication was studied. They found that friction could be reduced by up to 80% at the optimum diameter at a specific sliding speed. Wang et al. [14,15] compared the friction properties of pits with different shapes. The effects of smooth and unsmooth surfaces on the properties of carbon fiber reinforced polyetheretherketone (CFRPEEK) and 316 L stainless steel had been studied. It was found that the elliptical triangular sample had better performance, followed by the triangular sample, and the spherical triangular sample had worse performance.
Some studies have found that when the fluid flows into a pit or convex body, a low-pressure region is generated behind it, resulting in local cavitation [16,17,18]. Wang et al. [19] studied surface micro-textured sliding bearings and used CFD to compare and analyze the influence of micro-texture distribution characteristics. The study found that the reasonable surface micro-texture could promote the bearing capacity of the lubricating oil film, and the cavitation mechanism was considered to produce further improvement effect. Fang et al. [20] used numerical simulation to analyze the lubrication process of micro-convex texture friction pairs and the regular pattern of induced cavitation effect under different working conditions. They believed that the cavitation caused by micro-texture had a certain influence on improving surface bearing force and reducing friction coefficient. Caramia et al. [21] founded the optimal value of texture by studying the fluid dynamic characteristics of micro-texture between two planes. Geometric shapes of different depth, width, and clearance between two planes were designed, and their velocity distribution and pressure distribution were analyzed in detail. Gropper et al. [22] summarized the optimal texture parameters proposed for typical bearing applications by understanding the influence of surface structure on the tribological properties of lubricating contacts. They analyzed the methods and algorithms of fluid flow, cavitation, micro hydrodynamic effect, and different discretization methods and numerical calculation programs. Chen et al. [23] studied the fluid region of deep and shallow cavity bearings. Taking cavitation effect into account, the impact of different journal rotation speed and eccentricity on the distribution of water film pressure field and gas holdup was studied. So, the particle diameter was the minimum film thickness; the maximum pressure and bearing capacity of the water film were significantly improved.
According to the analysis of previous researchers, few studies have applied bionics theory to the slipper pair of seawater axial piston pumps to realize the characteristics of bearing lubrication and cavitation mechanism. In this paper, the surface structure of a non-smooth swash plate is studied, and the composite bionic micro-texture of the first-stage circular pit + second-stage circular ball is constructed. Eighteen groups of orthogonal tests are designed to analyze the influence of seven factors, such as rotational speed, first-stage diameter, first-stage aspect ratio, second-stage diameter, second-stage aspect ratio, area ratio, and distribution angle of pits, on the bearing lubrication characteristics of the water film of the slipper pair. Then, cavitation is introduced to study whether the cavitation effect can further improve the bearing lubrication characteristics of the water film surface.

2. Research Model and Method

2.1. Establishment of Simulation Model

In this paper, the slipper pair is taken as the research object. With the help of the lotus leaf ‘out of the mud without dyeing’ self-cleaning performance [24], the composite structure of the lotus leaf body surface is introduced into the surface of the slipper pair swashplate. The multi-scale composite micro-texture of the circular pit (first-stage structure) and ball (second-stage convex body) is used to improve the bearing lubrication characteristics of the bionic non-smooth swashplate.
As the slipper in the slipper pair rotates on the swash plate surface, as shown in Figure 1, there will be a thin layer of the water film between the two. To study and calculate the dynamic bearing characteristics of the water film more clearly, the water film between the slipper and the swash plate is studied in this paper. According to the literature [25], when seawater working medium is used, the internal leakage of the pump is nearly 30 times greater than that of mineral oil under the same working condition, resulting in a reduction in volumetric efficiency. If the working efficiency of seawater is not affected, the clearance height between the sliding shoes must be reduced. Generally, the thickness of lubricating film of traditional source pump is 10~20 μm. Then, the water film thickness of the seawater pump should be 3~10 μm. Due to the low viscosity of seawater, the thickness of the water film is thinner than that of traditional mineral oil film when seawater is used as a working medium. Assuming that the thickness h0 of the water film is 10 μm, the fan-shaped region is used as the computational fluid domain.
Figure 2 shows the fan-shaped fluid domain model of composite bionic micro-texture. Ten composite micro-textures are established. h0 is the water film thickness. The radius of the dividing circle R1 = 30 mm, R2 = 32 mm, R3 = 34 mm, and the angle α is −5.4°~5.4°. The inner diameter R4 and outer diameter R5 of the fan-shaped water film are 29 mm and 35 mm. Then,
δ 1 = h 1 d 1
δ 2 = h 2 d 2
S = 90 N d 1 2 ( R 5 2 R 4 2 ) α
where d1 is the first-stage diameter; d2 is the second-stage diameter; h1 is the depth of the first-stage circular pit; h2 is the height of the second-stage circular ball; δ1 is the first-stage aspect ratio; δ2 is the second-stage aspect ratio; S is the ratio of the total area of the first-stage circular pit top to the area of fan-shaped region; N is the number of first-stage circular pit; R4 is the outer diameter of fan-shaped region; R5 is the inner diameter of fan-shaped region; α is the angle of the fan-shaped region.
The actual flow of the slipper pair is complex. The N-S equation is used. The following assumptions are made [26,27,28,29]: (1) incompressible fluid and regardless of the influence of volume force; (2) the slipper pair is a rigid body; (3) steady flow. Based on the above assumptions, the expansion of the N-S equation is
ρ ( u u x + v u y + w u z ) = P x + η ( 2 u x 2 + 2 u y 2 + 2 u z 2 )
ρ ( u v x + v v y + w v z ) = P y + η ( 2 v x 2 + 2 v y 2 + 2 v z 2 )
ρ ( u w x + v w y + w w z ) = P z + η ( 2 w x 2 + 2 w y 2 + 2 w z 2 )
Continuity equation:
u x + v y + w z = 0
where ρ is the density of seawater; u, v, and w are the velocities in the x, y, and z directions, respectively; P is the pressure of the fluid domain; η is the seawater viscosity.
The mixture model is a multiphase flow model, which is often used to simulate multiphase flow with different velocities, isotropic multiphase flow with strong coupling, and multiphase flow with the same velocity [30,31]. In high speed flow, strong turbulence does not allow the growth of bubbles with large radius. It is necessary to assume that the velocity of bubbles is the same as that of seawater flow. Therefore, it is not necessary to solve the slip velocity in the mixed model [32]. The continuity equation of the mixed model:
t ( ρ m ) + · ( ρ m v m ) = m
v m = α k ρ k v k ρ m
ρ m = α k ρ k
where m is the mass of mixed phase; vm is the mixed phase velocity; ρm is the mixed phase density; vk is the velocity of phase k; ρk is the density of phase k; αk is the volume fraction of phase k. The phase k represents the primary and second phases of the mixed phase, wherein the first phase is seawater, and the second phase is water vapor.
This cavitation model is widely used because it combines the effects of turbulent kinetic energy and the presence of air nuclei in water [33]. The model does not need to introduce the bubble breakup condition in the water film. Therefore, the momentum equation, the energy equation and volume fraction equation solved by this model are as follows:
t ( ρ m v m ) + · ( ρ m v m v m ) = Δ p + · [ μ m ( Δ v m + Δ v m T ) ] + ρ m g + F + · ( α k ρ k v d r , k v d r , k )
t ( α k ρ k E k ) + · ( α k v k ( ρ k E k + p ) ) = · ( k e f f Δ T ) + S E
μ m = α k μ k
where Δp is the pressure difference in the flow direction; F is the volume force; μm is the dynamic viscosity coefficient of mixed phase; ▽ is Hamiltonian operator; vdr, k is the slipper velocity of the second phase k. keff is effective heat transfer; SE is the sum of volume heat sources.
Due to the speed of the bubbles mentioned above is the same as that of the seawater flow, so the vdr, k = 0. The volume fraction equation:
t ( α v ρ v ) + · ( α v ρ v v m ) = · ( α v ρ v v d r , v )
where the meaning of each item is the same as before.

2.2. Meshing

The fan-shaped fluid domain model is meshed using FLUENT’s meshing module Meshing. The suitable version of polyhedron cell is used to divide the grid, and the minimum size is 0.008 mm, and the maximum size is 0.1 mm. Given that the thickness of the water film is very thin, the grid of the water film is locally encrypted with the cell size of 0.006 mm. The upper surface of the water film moves following the slipper; therefore, 5 layers of boundary layer are added to the upper surface of the water film according to the common knowledge of fluid mechanics [34]. The grid meshing is shown in Figure 3, and the final number of cells is about 4,995,891.
The appropriate number of grids is crucial to the calculation results of numerical simulation. Figure 4 is the grid independence verification of this calculation method, and the total pressure bearing force does not change in a large range. The total pressure bearing force is taken as the target parameter. As the number of grids increases, the change of the target parameter is controlled within a small range (about 3%), and the number of grids is considered to be appropriate.

2.3. Boundary Conditions Setting

In order to simulate the movement of the slipper pair of the seawater axial piston pump, the idea of the numerical simulation is that the composite bionic micro-texture is built on the surface of the swashplate. The upper surface of the water film will directly contact the slipper, and the slipper will rotate on the surface of the swashplate under the drive of the drive shaft. As shown in Figure 5, Periodic is set on both sides of the fan-shaped fluid domain. The inner and outer circular edges of the fan are formed as Pressure-inlet and Pressure-outlet, respectively. The under surface of the water film, the first-stage circular pit, and the second-stage circular ball are set as Stationary wall. The upper surface of the water film will be set as Moving wall and given a certain rotational speed, obtaining the final result. The above numerical simulation is carried out in combination with the actual test operation.
The cavitation model is the Schnerr–Sauer model. The first phase is seawater, and the second phase is water vapor, and the saturated vapor pressure is set to 3540 Pa. SIMPLE algorithm is used to solve the pressure/velocity coupled solver. The density of seawater is 1.025 × 10³ kg/m3, and the viscosity is 6.15 × 10⁻⁴ kg/(m · s). Due to the low viscosity of seawater, it is easy to cause a local vortex at the pit. The standard kε model is adopted. Spatial differentiation uses the first-order upwind scheme. During calculation, the variable value on the side interface will be taken as the variable value on the control point of the upstream unit. In order to increase the calculation accuracy, the convergence standard of Residual is changed to 10−5. Leave the rest as default.

2.4. Verification of Calculation Method

The two-dimensional rectangular asperity texture friction pair in reference [20] is verified and calculated. The results are analyzed with the results in reference [20] to verify the feasibility and rationality of the solver. The comparison of the calculated results is shown in Figure 6.
It can be seen that the shape of the pressure distribution curve is basically the same, and the difference of the pressure is under 8%. Thus, the feasibility and rationality of the method in this paper are proved.

2.5. Design of Orthogonal Test

Orthogonal test method is to select an appropriate amount of representative test points from a large number of test points by using mathematical statistics and orthogonal principle [35]. L18 (6 × 36), using one six-level factor and six three-level factors. The six-level factor represents that the rotational speed has six different speeds; the six three-level factors represent the first-stage diameter, first-stage aspect ratio, second-stage diameter, second-stage aspect ratio, area ratio, and distribution angle, each of which has three different test data. Eighteen groups of orthogonal tests are obtained by combining two horizontal factors.
As shown in Table 1, 18 orthogonal tests are designed. These 18 groups of orthogonal tests study the effects of working conditions such as rotational speed, first-stage diameter, first-stage aspect ratio, second-stage diameter, second-stage aspect ratio, area ratio, and distribution angle on the bearing force of the water film. The dynamic characteristics of the water film bearing force after introducing cavitation effect. A group of test combinations with optimal bearing lubrication characteristics are summarized by orthogonal test method [25].
To explore the priority of the water film bearing force under different working condition parameters and find the test combined with the optimal bearing force test factor A set six different speeds, 1000 r/min, 1250 r/min, 1500 r/min, 1750 r/min, 2000 r/min, and 2250 r/min; the test factors B, C, D, and E define the size of the second-stage composite structure. The area ratio F represents the proportion of the circular pit in the whole fluid calculation domain. The distribution angle G specifies the angle of the cross-distribution of the adjacent circumferential first-stage pits. The above test factors are combined to study the bearing lubrication characteristics of composite micro-textures with cavitation.

3. Analysis of Simulation Results

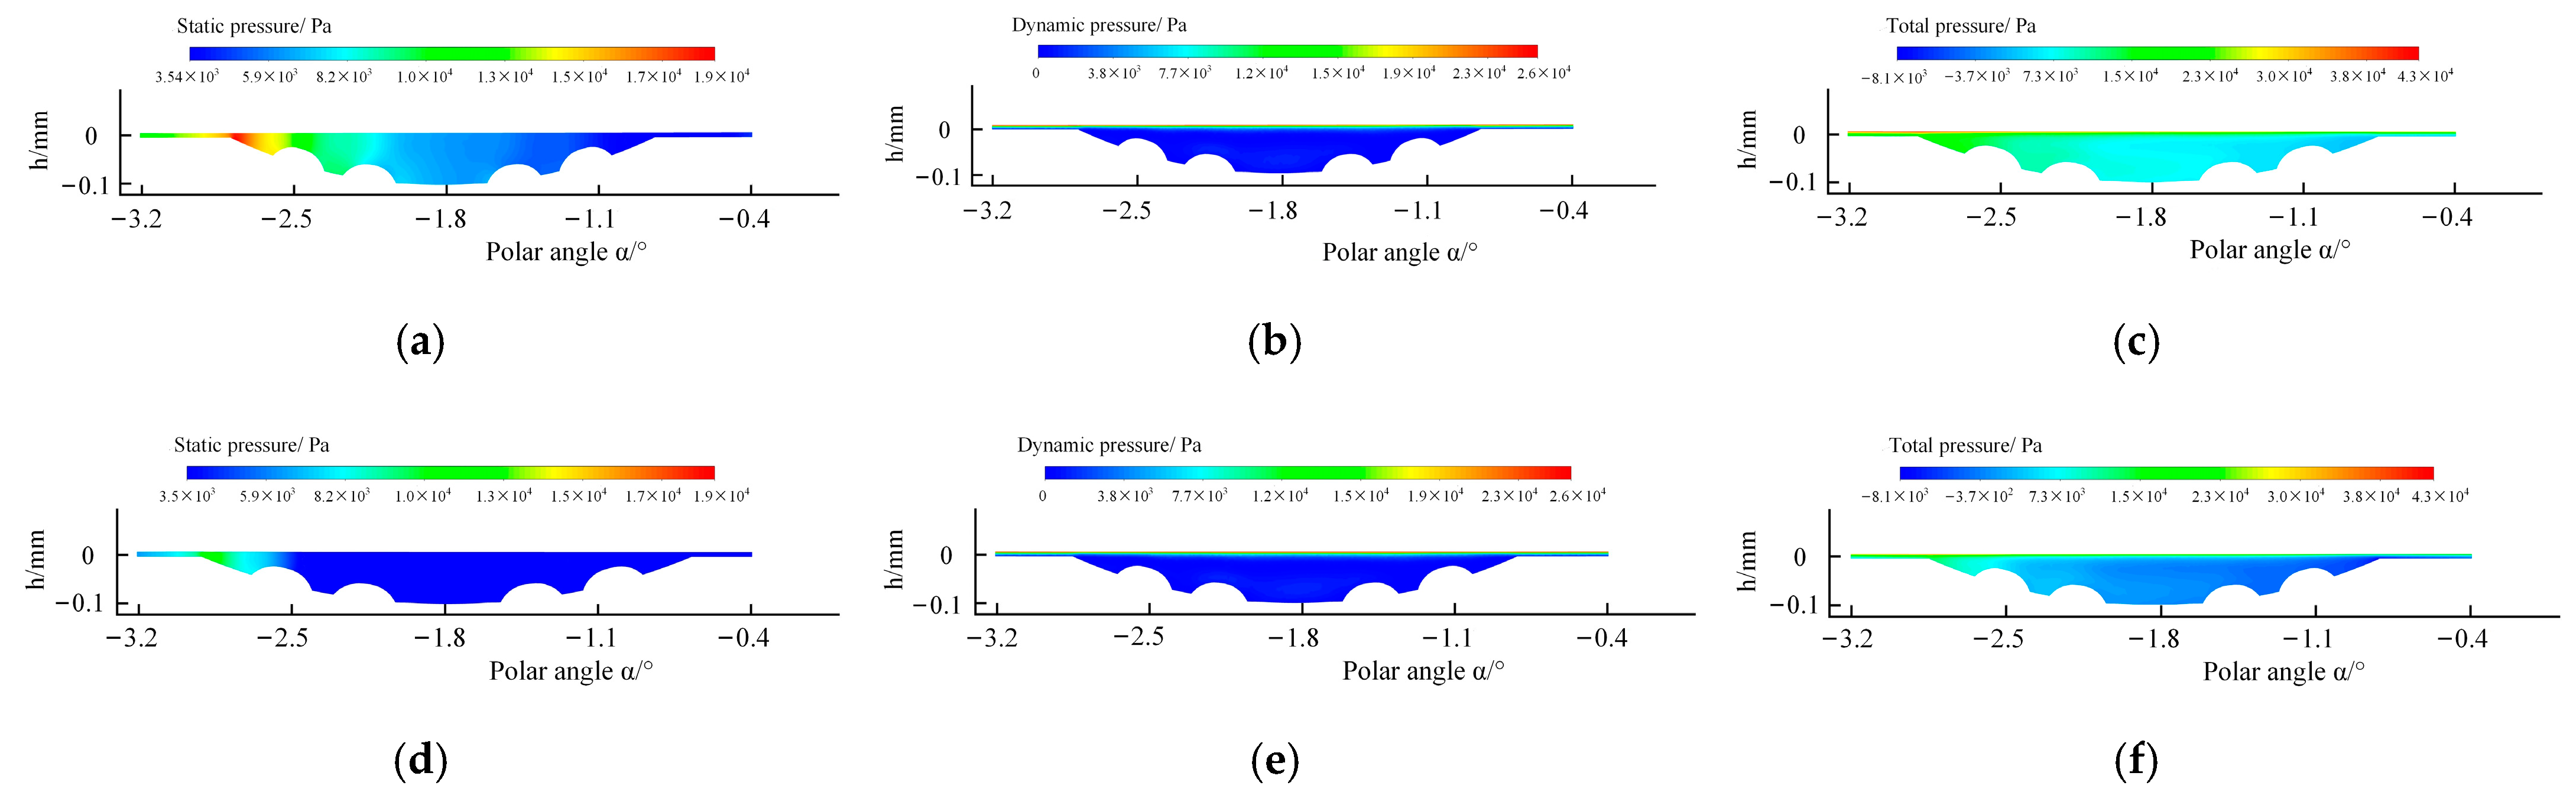
3.1. Effect of Cavitation on Surface Pressure of the Water Film

At standard atmospheric pressure, seawater will dissolve into a certain amount of gas. When the pressure in seawater declines to the air separation pressure, the gas dissolved in the liquid escapes in the form of bubbles, forming air-filled bubbles. If the pressure continues to reduce to the saturated vapor pressure of the liquid, the liquid itself begins to vaporize to create many bubbles, and cavitation occurs [36].
Figure 7 shows the pressure contour of the upper surface of the water film with and without cavitation. By comparing the static pressure contours in Figure 7a,d, after introducing the cavitation effect, the static pressure on the upper surface of the water film increases significantly at the convergence wedge behind the first-stage circular pit, with the maximum static pressure of 18,900 Pa. In Figure 7d, the maximum static pressure is 10,500 Pa, and the pressure increases at the convergence wedge behind the circular pit. It can be seen that the static pressure is improved due to the effect of the convergent wedge of the circular pit. After introducing the cavitation effect, the static pressure increases, and the maximum value increases by about 80%. Because seawater enters the divergent wedge of the circular pit, there will be vortices inside the circular pit, which is low-pressure zone. The saturated vapor pressure is 3540 Pa. When the pressure is lower than 3540 Pa, cavitation will occur, and bubbles will be generated. Cavitation can inhibit the further reduction of static pressure. Therefore, the cavitation effect can improve the carrying capacity of the water film.
Figure 7b,e are the dynamic pressure contours with and without cavitation, respectively. The dynamic pressure of these two increases with the increase of the radius of the dividing circle. The dynamic pressure of the circular pit part in Figure 7b is slightly lower, and the maximum value is 30,000 Pa. The maximum dynamic pressure in Figure 7e is also 30,000 Pa. The dynamic pressure inside the pit decreases, and the dynamic pressure inside the circular pit at different positions is about 14,500 Pa, 21,000 Pa, and 24,000 Pa, which is about 25% lower than that in Figure 7e, indicating that the pressure difference Δp becomes larger after the cavitation effect is introduced. The velocity of seawater inside the circular pit decreases, which leads to the decline of dynamic pressure inside the circular pit. Due to the effect of the convergent wedge of the circular pit, the dynamic pressure increases obviously when the circular pit flows out. The cavitation effect affects the hydrodynamic pressure generated inside the circular pit, resulting in a decrease in the dynamic pressure on the surface of the water film at the circular pit.
Figure 7c,f are the total pressure contours with and without cavitation. The pressure is positive. The total pressure is the sum of static pressure and dynamic pressure. Due to the introduction of the cavitation effect, the static pressure increases significantly, and the dynamic pressure at the circular pit is slightly reduced by the influence of the divergence wedge. In short, the total pressure increases with the increase of R. The total pressure showed an increasing trend, and the maximum value is 46,600 Pa.
As shown in Figure 8, the vapor volume fraction mainly appears at the divergence wedge inside the circular pit, indicating that the pressure there is lower than the saturated vapor pressure, forming a low-pressure zone. The maximum vapor volume fraction on the upper surface of the water film with the radius of the dividing circle of R1 = 30 mm and R3 = 34 mm is about 23%, while the value and area of the vapor volume fraction at the dividing circle of R2 = 32 mm are smaller, which indicates that the distribution angle θ can reduce the cavitation area.
Figure 9 is the circumferential velocity streamline diagram of a single circular pit. Take the radius of the dividing circle in the sector fluid domain R2 = 32 mm and the polar angle α circumferential section plane of a single circular pit with a range of −3.2°~−0.4°. Observe the pressure distribution and velocity streamline distribution inside a single circular pit. Due to the influence of the second-stage sphere, vortices are generated at four positions of−2.7 °, −2.2 °, −1.3 °, and−0.8 °. The velocity value of the water film part is significantly higher than that of the circular pit part, and the maximum velocity inside the circular pit is 2.2 m/s. Combined with the literature [20], when seawater enters the divergent wedge of the circular pit, the velocity inside the circular pit is reduced. The vortex appears, resulting in cavitation. That is the low-pressure area. When seawater flows out of the convergence wedge of the circular pit, the hydrodynamic effect is generated. Combined with the cavitation mechanism, this explains that the dynamic pressure of the circular pit part decreases in Figure 7b, while the dynamic pressure at the convergence wedge increases. This is consistent with the location of cavitation in Reference [20].
Figure 10 describes the pressure contours of the single circular pit with and without cavitation effect at the radius of the dividing circle R2 = 32 mm. Figure 10a,d compare and analyze the static pressure contours of the single circular pit. It is found that when the cavitation effect is not introduced, the static pressure only increases at the convergence wedge, and the maximum value is 13,000 Pa. After introducing the cavitation effect, the maximum value of the static pressure at the convergence wedge reaches 19,000 Pa, which indicates that cavitation can effectively improve the static pressure, and the continuous decrease of water film static pressure is inhibited. Figure 10b,e are the dynamic pressure contours of the single circular pit. The dynamic pressure is generated in the water film part, and there is a little dynamic pressure increase inside the circular pit. Combined with Figure 7b,e, after introducing the cavitation effect, the dynamic pressure decreases at the circular pit divergence wedge. As shown in Figure 9, the generation of bubbles leads to a reduction of dynamic pressure on the surface of the water film, indicating that cavitation affects the dynamic pressure effect generated by the fluid. Figure 10c,f are the total pressure contours, which are affected by static and dynamic pressure. It is found that after introducing the cavitation effect, although the dynamic pressure value decreases, the total pressure increases as a whole. The above figures show that cavitation inside the circular pit can increase the static pressure of the water film; the dynamic pressure is slightly reduced. The total pressure is significantly increased. Cavitation has a beneficial effect on pressure on the surface of the water film.
By observing the velocity streamline figure and vapor volume fraction contour in the single circular pit in Figure 9 and Figure 11, it is found that there is cavitation at the bottom of the circular pit. Due to the influence of the second-stage circular ball, the cavitation is generated at the four positions of −2.7°, −2.2°, −1.3°, and −0.8°. As shown in Figure 11, cavitation occurs when the seawater just enters the divergent wedge of the circular pit. There is cavitation in the rest of the circular pit, but no cavitation occurs. This shows that the pressure at the divergent wedge of the circular pit is lower than the saturated vapor pressure, and the vapor volume fraction is up to 51% (Cavitation occurs when the vapor volume fraction is higher than 50%), resulting in a small number of bubbles. The area where cavitation occurs is a small area where the seawater has just flowed into the interior of the first-stage circular pit, resulting in a small number of bubbles. The above shows that the model is less affected by cavitation.
After the above research and discussion, the effect of the converging wedge and the diverging wedge inside the circular pit causes the pressure difference Δp at the vortex to increase. According to formula (11), the volume force F of the fluid will also increase. Due to the movement speed of bubbles is the same as that of seawater, vdr, k in the fifth item on the right of formula (11) is 0; that is, the greater the pressure difference, the greater the volume force F. After the introducing cavitation effect, the values of static pressure bearing force and total pressure bearing force increase; on the contrary, the dynamic pressure bearing force decreases. According to the energy equation of formula (12), after seawater enters the divergent wedge of the circular pit, due to the existence of a pressure difference, part of the kinetic energy of seawater is converted into the heat energy of water vapor, thus weakening the dynamic pressure effect of seawater. After flowing out of the convergent wedge of the circular pit, the dynamic pressure has a small increase. The application of cavitation effect in the water film of sliding shoe pair can improve the surface bearing force of the water film. However, the negative impact of cavitation is huge, and the generation of cavitation may reduce the working life of axial piston pump.

3.2. Effect of Cavitation on Water Film Bearing Force

Through numerical simulation, the static pressure bearing force, dynamic pressure bearing force, and total pressure bearing force of 18 test arrays are analyzed, and the test factors affecting cavitation are summarized. As shown in Figure 12, without the cavitation effect, the static pressure bearing force of the 13 test arrays of 1, 2, 4, 5, 6, 9, 10, 12, 13, 14, 15, 16, and 18 groups is negative, and the minimum value is −0.3 N. The dynamic pressure bearing force and total pressure bearing force of the 17th test array is the highest, which is affected by rotational speed. But the group is larger than the values of the 16th and 18th under the same rotational speed. As shown in Figure 12a, under the premise of without the cavitation effect, the static pressure bearing force of each test array has a certain improvement and is positive. However, the dynamic pressure decreases, which is caused by the energy conversion between gas and liquid phases. As shown in Figure 13, the 17th test array is the test array with the highest total pressure bearing force among the 18 test arrays.
Figure 13 is a line figure of bearing force with and without the cavitation effect. Each three test groups are a group of six groups. Each group is set with different rotational speeds. The test factor A shown in Table 1 can be found. By observing Figure 13a, it is found that the static pressure bearing force of each test group increases significantly after introducing the cavitation effect. Except for the 17th test array, the static pressure bearing force of the other test arrays is about 0.15 N, and the static pressure bearing force of the 17th test array is about 0.25 N.
The dynamic pressure bearing force of the 18 test arrays is shown in Figure 13b; the dynamic pressure bearing force without the cavitation effect is higher than that with cavitation effect. As explained in Figure 7b,e, cavitation conditions affect the dynamic pressure of seawater, which also affects the dynamic pressure bearing force of the water film. The dynamic pressure bearing force of the 5th test group is overtaken, and its rotation speed is 1250 r/min, which indicates that the structural size of the water film of the test array could provide good dynamic pressure bearing force. The dynamic pressure bearing force of the 17th test array is the highest, but the dynamic pressure bearing force with cavitation is lower than that without cavitation effect.
Figure 13c shows the change of total pressure bearing force with rotational speed. The total pressure bearing force without cavitation effect and the total pressure bearing force with the cavitation effect in the 5th test group are 0.20 N and 0.38 N, which are increased by about 90%. The total pressure bearing force of the 17th test group is 0.9 N and 1.05 N, which increase by about 18%. Compared with the same speed condition, the total pressure bearing force of the other two groups increase by 86.9%. It can be seen that the 5th test group has the best bearing force improvement effect, and the 17th test group has the highest total pressure bearing force.

3.3. Analysis of Orthogonal Test Results

Table 1 sets up 18 groups of orthogonal tests and uses the orthogonal test method to obtain the priority of the influence of six test factors except for the rotational speed. According to the numerical simulation results of the literature [37] and the contents of Figure 13, the rotational speed can directly affect the water film bearing force. That is, the water film surface bearing force will increase with the increase of rotational speed.
Combined in Table 2, the sum of the bearing force of the test factor E1 under introducing the cavitation effect is 2.982 N; the sum of the bearing force of E3 is 2.991 N; and E3 is 0.3% higher than E1. Although the sum of the bearing force of the test factor E1 without the cavitation effect is 2.427 N, the sum of the bearing force of E3 is 2.418 N, and E1 is 0.3% higher than E3. In general, the sum of the bearing force of the test factor E with the cavitation effect is about 0.564 N larger than that without the cavitation effect. Considering the introduction of cavitation effect, the bearing force of surface of the water film is better, and the experimental factor E3 with the cavitation effect is further improved than E1, so E3 is selected.
As shown in Table 3, the first-stage aspect ratio C is the most influential factor in the whole test arrays, followed by the first-stage aspect B, the second-stage aspect ratio E, and the area ratio F. However, the second-stage diameter D and the distribution angle G with cavitation effect are different from the influence priority without the cavitation effect. As shown in Figure 9, due to the existence of a micro-convex body with a second-stage circular ball inside the first-stage circular pit, a small weak vortex will be formed behind the second-stage circular ball while the vortex is generated, which is a further slight increase in the bearing force of the water film surface. This leads to the inconsistency of priority D and G with or without cavitation effect in Table 3. The bearing characteristics of the water film are improved by appropriately increasing the height of the second-stage diameter h2 or increasing the aspect ratio of the second-stage diameter δ2. Figure 8 shows that the change of distribution angle θ can weaken the generation of cavitation but does not increase the bearing force of the water film. As shown in Figure 11, the cavitation area of the model inside the circular pit only accounts for about 1.2%. After the above discussion, the priority of the second-stage diameter D should be higher than the distribution angle G.
Table 3 shows the optimal combination of test factors. For the difference in the optimal combination of the two groups, the range analysis method is used to obtain the sum of the bearing force of the 18 groups of orthogonal tests containing the test factors E1 and E3. The final priority is A > C > B > E > F > D > G, and the optimal combination is A6B2C1D3E3F2G3.

4. Conclusions

In this paper, the composite bionic micro-texture of the slipper pair is constructed to improve the bearing characteristics of the upper surface of the water film. The cavitation is introduced to study the bearing lubrication mechanism of the water film of the slipper pair. Eighteen orthogonal tests are designed. By summarizing the performance of various text factors on the bearing characteristics of the water film, the following conclusions are drawn:
(1)
When seawater enters the divergence wedge of the circular pit, the static pressure decreases; when the convergence wedge flows out, the static pressure increases. The maximum dynamic pressure appears in the water film part. The divergent wedge of the circular pit can generate a low-pressure zone. Due to the pressure difference, the upper surface of the water film has a bearing capacity, so introducing the cavitation effect can improve the bearing lubrication characteristics of the water film of the slipper pair. The vapor volume fraction behind the crater is the largest, and there is a high probability of cavitation.
(2)
Introducing the cavitation effect can improve the static pressure value and total pressure value of the water film. Although the dynamic pressure value is slightly reduced, the total pressure bearing force of the water film with the cavitation effect is significantly improved compared with the total pressure carrying force of the water film without the cavitation effect. Among them, the total pressure bearing force of the 5th test group increased by about 90% after introducing the cavitation effect, and the total pressure bearing force of the 17th test group increased by about 86.9% compared with the 16th test group and the 18th test group at the same speed. Through the summary and analysis of these two test groups, the optimal second-stage composite structure size is obtained.
(3)
Rotational speed is the first test factor affecting bearing force. The influence of the test factors is as follows: rotational speed > first-stage aspect ratio > first-stage diameter > second-stage aspect ratio > area ratio > second-stage diameter > distribution angle. And the optimal combination is A6B2C1D3E3F2G3.

Author Contributions

Conceptualization, Y.L. and D.G.; methodology, Y.L.; software, C.W. and W.W.; validation, W.W. and Z.Z.; formal analysis, H.X. and C.W.; investigation, Y.L. and C.W.; resources, Y.L.; data curation, Z.Z.; writing—original draft preparation, Y.L., C.W. and Z.Z.; writing—review and editing, D.G., W.W., C.W. and H.X.; supervision, D.G.; project administration, D.G.; funding acquisition, Y.L. and D.G. All authors have read and agreed to the published version of the manuscript.

Funding

This research was supported by the National Natural Science Foundation of China (Grant No. 52005428), was supported by Hebei Natural Science Foundation (Grant No. E2020203107 and Grant No. E2021203099), and was supported by the Open Fund Project of Shaanxi Provincial Key Laboratory of Hydraulic Technology (No. YYJS2022KF04).

Institutional Review Board Statement

Not applicable.

Informed Consent Statement

Not applicable.

Data Availability Statement

All data generated or analyzed during this study are included in this article.

Conflicts of Interest

The authors declare no conflict of interest.

References

  1. Liu, Y.; Wu, D.; Li, D. Applications and research progress of hydraulic technology in deep sea. J. Mech. Eng. 2018, 54, 14–23. [Google Scholar] [CrossRef]
  2. Guo, X.; Xing, T.; Ruan, J. Industrial application and new progress of hydraulic technology. Chin. High Technol. Lett. 2020, 30, 644–654. [Google Scholar]
  3. Wang, W.; Wen, H.; Chen, W. Research status on tribological behaviors of materials under seawater environment. Mater. Rep. 2017, 31, 51–58. [Google Scholar]
  4. Chen, B.; Wang, J.; Yan, F. Comparative investigation on the tribological behaviors of CF/PEEK composites under sea water lubrication. Tribol. Int. 2012, 52, 170–177. [Google Scholar] [CrossRef]
  5. Yang, Y.; Yankey, R.; Li, H. Research on the Friction Pairs in Water Hydraulic Piston Pumps. J. Phys. Conf. Ser. 2022, 2218, 012067. [Google Scholar] [CrossRef]
  6. Gachot, C.; Rosenkranz, A.; Hsu, S.M.; Costa, H.L. A critical assessment of surface texturing for friction and wear improvement. Wear 2017, 372–373, 21–41. [Google Scholar] [CrossRef]
  7. Wang, Z.; Ye, R.; Xiang, J. The performance of textured surface in friction reducing: A review. Tribol. Int. 2023, 177, 108010. [Google Scholar] [CrossRef]
  8. Mohammad, A.; Dinesh, K.S.; Saurabh, K.; Nitin, S. Implication of Surface Texture and Slip on Hydrodynamic Fluid Film Bearings: A Comprehensive Survey: Review. Tribol. Online 2020, 15, 265–282. [Google Scholar]
  9. Philipp, G.G.; Francisco, J.P.; Andreas, R. Multi-Scale Surface Texturing in Tribology—Current Knowledge and Future Perspectives. Lubricants 2019, 7, 95. [Google Scholar]
  10. Kovalchenko, A.M.; Erdemir, A.; Ajayi, O.O.; Etsion, I. Tribological Behavior of Oil-Lubricated Laser Textured Steel Surfaces in Conformal Flat and Non-Conformal Contacts. Mater. Perform. Charact. 2017, 6, 1–23. [Google Scholar] [CrossRef]
  11. Codrignani, A.; Frohnapfel, B.; Magagnato, F.; Schreiber, P.; Schneider, J.; Gumbsch, P. Numerical and experimental investigation of texture shape and position in the macroscopic contact. Tribol. Int. 2018, 122, 46–57. [Google Scholar] [CrossRef]
  12. Liu, W.; Ni, H.; Chen, H.; Wang, P. Numerical simulation and experimental investigation on tribological performance of micro-dimples textured surface under hydrodynamic lubrication. Int. J. Mech. Sci. 2019, 163, 105095. [Google Scholar] [CrossRef]
  13. Braun, D.; Greiner, C.; Schneider, J.; Gumbsch, P. Efficiency of laser surface texturing in the reduction of friction under mixed lubrication. Tribol. Int. 2014, 77, 142–147. [Google Scholar] [CrossRef]
  14. Wang, Z.; Fu, Q.; Wood, R.; Wu, J.; Wang, S. Influence of bionic non-smooth surface texture on tribological characteristics of carbon-fiber-reinforced polyetheretherketone under seawater lubrication. Tribol. Int. 2019, 144, 106100. [Google Scholar] [CrossRef]
  15. Wang, Z.; He, H.; Wu, S.; Xiang, J.; Ni, J. Effect of surface topography and wettability on friction properties of CFRPEEK. Tribol. Int. 2022, 171, 107573. [Google Scholar] [CrossRef]
  16. Hamilton, D.B.; Walowit, J.A.; Allen, C.M. A theory of lubrication by micro-irregularities. Fluids Eng. 1966, 88, 177–185. [Google Scholar]
  17. Dowson, D.; Taylor, C.M. Cavitation in bearings. Annu. Rev. Fluid Mech. 1979, 11, 35–65. [Google Scholar] [CrossRef]
  18. Cao, S.; Tang, P.; Xu, J. The Influence of slip velocity on the cavitation effect of surface texture. Mach. Tool Hydraul. 2017, 45, 37–40. [Google Scholar]
  19. Wang, L.; Guo, S.; Yin, G. Research on micro-textured journal bearing characteristics considering the effect of cavitation. Lubr. Eng. 2018, 43, 65–69. [Google Scholar]
  20. Fang, X.; Yan, Z.; Wang, J. Effect of micro-convex texture on lubrication performance of friction pair considering cavitation phenomenon. Lubr. Eng. 2020, 45, 32–41. [Google Scholar]
  21. Caramia, G.; Carbone, G.; De Palma, P. Hydrodynamic lubrication of micro-textured surfaces: Two dimensional CFD-analysis. Tribol. Int. 2015, 88, 162–169. [Google Scholar] [CrossRef]
  22. Gropper, D.; Wang, L.; Harvey, T.J. Hydrodynamic lubrication of textured surfaces: A review of modeling techniques and key findings. Tribol. Int. 2016, 94, 509–529. [Google Scholar] [CrossRef] [Green Version]
  23. Chen, C.; Zhang, H.; Liu, Q. Research on load carrying capacity of multi-phase flow water film of hybrid bearing based on CFD method. Lubr. Eng. 2017, 42, 79–83. [Google Scholar]
  24. Barthlott, W.; Neinhuis, C. Purity of the sacred lotus, or escape from contamination in biological surfaces. Planta 1997, 202, 1–8. [Google Scholar] [CrossRef]
  25. Liang, Y. Research on Lubrication and Drag Reduction Mechanism and Friction and Wear of Slipper Pair with Bionic Non-Smooth Surface in Seawater Axial Piston Pump. Ph.D. Thesis, Yanshan University, Qinhuangdao, China, 2017. [Google Scholar]
  26. Bai, S.; Peng, X.; Li, Y.; Sheng, S. Gas Lubrication Analysis Method of Step-Dimpled Face Mechanical Seals. J. Tribol. 2012, 134, 011702. [Google Scholar] [CrossRef]
  27. Wang, H.; Song, Y.; Song, Y. Flow distribution simulation about slipper pair of hydraulic axial ram pump. J. Syst. Simul. 2015, 27, 634–642. [Google Scholar]
  28. Zhang, J.; Ma, Q.; Sun, S. Simulation of sliding boots vices in axial piston pump based on CFD. New Technol. New Process 2012, 8, 1–3. [Google Scholar]
  29. ZeinEldin, R.A.; Ullah, A.; Khalifa, H.A.E.-W.; Ayaz, M. Analytical Study of the Energy Loss Reduction during Three-Dimensional Engine Oil-Based Hybrid Nanofluid Flow by Using Cattaneo–Christov Model. Symmetry 2023, 15, 166. [Google Scholar] [CrossRef]
  30. Yan, W. Selection and application of three multiphase flow models based on FLUENT. Yunnan Chem. Technol. 2020, 47, 43–44. [Google Scholar]
  31. Chen, D.; Wan, Y.; Cai, Y. Friction Simulation Analysis of Hydraulic Valve Core by Multiphase Flow Based on Fluent. Mach. Tool Hydraul. 2016, 44, 134–139. [Google Scholar]
  32. Pan, L.; Wang, Q.; He, Z. Practical Multiphase Flow Numerical Simulation—ANSYS Fluent Multiphase Flow Model and Its Engineering Application, 1st ed.; Science Press: Beijing, China, 2020; pp. 20–22. [Google Scholar]
  33. Alharbi, K.A.M.; Ullah, A.; Ikramullah; Fatima, N.; Khan, R.; Sohail, M.; Khan, S.; Khan, W.; Ali, F. Impact of viscous dissipation and coriolis effects in heat and mass transfer analysis of the 3D non-Newtonian fluid flow. Case Stud. Therm. Eng. 2022, 37, 102289. [Google Scholar] [CrossRef]
  34. Shah, Z.; Ullah, A.; Musa, A.; Vrinceanu, N.; Ferrandiz, B.S.; Iqbal, S.; Deebani, W. Entropy Optimization and Thermal Behavior of a Porous System With Considering Hybrid Nanofluid. Front. Phys. 2022, 10, 509. [Google Scholar] [CrossRef]
  35. He, W.; Xue, W.; Tang, B. Optimized Test Design Method and Data Analysis, 1st ed.; Chemical Industry Press: Beijing, China, 2012; pp. 1–10. [Google Scholar]
  36. Zhu, H. Cavitation and cavitation erosion and their application. Yunnan Chem. Technol. 2020, 47, 20–23. [Google Scholar]
  37. Liang, Y.; Gao, D.; Wu, S. Hydrodynamic lubrication calculation for slipper/swash plate pair with bionic non-smooth concave surface. J. Mech. Eng. 2015, 51, 153–160. [Google Scholar] [CrossRef]
Figure 1. The structural profile of slipper pair.
Jmse 11 00582 g001
Figure 2. Fan-shaped fluid domain model of composite bionic micro-texture and circumferential, longitudinal sectional view of the single circular pit.
Jmse 11 00582 g002
Figure 3. Grid meshing.
Jmse 11 00582 g003
Figure 4. Verification of grid independence.
Jmse 11 00582 g004
Figure 5. The setting of boundary conditions.
Jmse 11 00582 g005
Figure 6. Verification of the calculation solver. (a) Pressure distribution obtained in the literature [20]; (b) Pressure distribution obtained by the calculation method in this paper.
Jmse 11 00582 g006
Figure 7. Pressure contours of the upper surface of water film with and without cavitation effect. (a) Contour of static pressure introducing cavitation effect; (b) Contour of dynamic pressure introducing cavitation effect; (c) Contour of total pressure introducing cavitation effect; (d) Contour of static pressure without cavitation effect; (e) Contour of dynamic pressure without cavitation effect; (f) Contour of total pressure without cavitation effect.
Jmse 11 00582 g007
Figure 8. The contour of vapor volume fraction on the upper surface of the water film.
Jmse 11 00582 g008
Figure 9. Circumferential profile velocity streamlines of the single circular pit.
Jmse 11 00582 g009
Figure 10. Pressure contours of the single circular pit with the radius of R2 = 32 mm with and without cavitation. (a) Contour of static pressure introducing cavitation effect; (b) Contour of dynamic pressure introducing cavitation effect; (c) Contour of total pressure introducing cavitation effect; (d) Contour of static pressure without cavitation effect; (e) Contour of dynamic pressure without cavitation effect; (f) Contour of total pressure without cavitation effect.
Jmse 11 00582 g010
Figure 11. Vapor volume fraction contour of the circumferential profile of a Single circular pit with a radius of R2 = 32 mm.
Jmse 11 00582 g011
Figure 12. Histogram of bearing force of 18 groups of orthogonal tests with and without cavitation effect. (a) With cavitation effect; (b) Without cavitation effect.
Jmse 11 00582 g012
Figure 13. Line diagram of bearing force with and without cavitation effect. (a) Line diagram of static pressure; (b) Line diagram of dynamic pressure; (c) Line diagram of total pressure.
Jmse 11 00582 g013
Table 1. Numerical simulation table of L18 (6 × 36) orthogonal tests.
Test NumberTest Factors
A
Rotational Speed n/(r/min)
B
First-Stage Diameter d1/mm
C
First-Stage Aspect Ratio
δ1
D
Second-Stage Diameter
d2/mm
E
Second-Stage Aspect Ratio
δ2
F
Area Ratio
S/%
G
Distribution Angle
θ/°
11 (1000)1 (0.7)1 (0.1)1 (0.07)1 (0.1)1 (10)1 (0)
212 (1.0)2 (0.3)2 (0.1)2 (0.3)2 (20)2 (1.8)
313 (1.3)3 (0.5)3 (0.13)3 (0.5)3 (30)3 (2.7)
42 (1250)112233
52223311
62331122
73 (1500)121323
83232131
93313212
104 (1750)133221
114211332
124322113
135 (2000)123132
145231213
155312321
166 (2250)132312
176213123
186321231
Table 2. Sum of bearing force including test factors E1 and E3.
Sum of Bearing ForceE1E3
With cavitation effect2.982 N2.991 N
Without cavitation effect2.427 N2.418 N
Table 3. Optimal combination of test factors.
TypePriorityOptimal Combination
With cavitation effectC > B > E > F > D > GB2C1D3E3F2G3
Without cavitation effectC > B > E > F > G > DB2C1D3E1F2G3
Disclaimer/Publisher’s Note: The statements, opinions and data contained in all publications are solely those of the individual author(s) and contributor(s) and not of MDPI and/or the editor(s). MDPI and/or the editor(s) disclaim responsibility for any injury to people or property resulting from any ideas, methods, instructions or products referred to in the content.

