Article

A Numerical Study on the Effects of Ship-Generated Waves on a Moored Ship in Restricted Waterways Considering Initial Acceleration Process

1
School of Naval Architecture, Ocean and Civil Engineering, Shanghai Jiao Tong University, Shanghai 200240, China
2
State Key Laboratory of Ocean Engineering, Shanghai Jiao Tong University, Shanghai 200240, China
*
Author to whom correspondence should be addressed.
J. Mar. Sci. Eng. 2023, 11(3), 483; https://doi.org/10.3390/jmse11030483
Submission received: 1 January 2023 / Revised: 19 February 2023 / Accepted: 21 February 2023 / Published: 23 February 2023
(This article belongs to the Special Issue Hydrodynamic Analysis on Ship Performance)

Abstract

:
In order to develop a reliable numerical method to investigate the effects of ship-generated waves on a moored ship in restricted waterways, this paper takes the MASHCON2022 benchmark model test case as the study object and simulates the whole process of a ship passing a moored ship by using the unsteady Reynolds-Averaged Navier-Stokes (URANS) method coupled with the dynamic overset mesh technique. The initial acceleration process of the passing ship before approaching the moored ship is considered in the numerical simulations to reproduce the benchmark model tests more realistically. The numerical simulations with four acceleration modes are conducted. The comparisons among the numerical results and the test data verify that the prediction accuracy considering the acceleration process is obviously higher than that without the acceleration process, especially for the solitary wave system, and the results based on the linear acceleration agree with the test data best. The flow field results indicate that the impacts of the solitary wave system and the primary wave system on the moored ship are different: the solitary wave system induces significant positive pressures on the hull, while the primary wave system leads to remarkable negative pressures; both result in pronounced attitude variations of the moored ship, but the hydrodynamic forces and moments affected by the primary wave system are more pronounced.

1. Introduction

A ship’s hydrodynamic performance is significantly affected by the ship-generated waves, especially in restricted waterways, where the hydrodynamic impacts on ships are more pronounced due to the shallow-water and blockage effects. The problem of the passing ship effects on moored ships in restricted waterways is a very representative case, where the waves induced by the passing ship have significant effects on the moored ships: the hydrodynamic forces/moments are large in magnitude, causing additional ship motions and affecting the loading/unloading processes of the moored ships in port. It may also result in the break of mooring lines or even cause the moored ships to collide with the quay wall in severe cases. Pinkster and Keuning [1] showed that 40% of damages to the mooring systems in the Netherlands were due to passing ship effects. In addition, it was reported that the solitary waves induced by barges entering canal resulted in damage to the mooring systems in the port of Rotterdam [2]. Therefore, it is very important to study passing ship effects on moored ships in restricted waterways by considering the effects of ship-generated waves.
Most of the passing ship problems are associated with the primary wave system, especially in confined waterways. The primary wave system mainly includes the bow waves, the stern waves, and a notable water level drop at the midship (also called ‘drawdown’) [3,4]. It is a long-period wave system and can bring out an obvious variation in the water level because of its large wave trough and length [5]. In addition, it needs to be emphasized that when a ship starts to move from a static state in waterways, the solitary wave induced by the ship will also affect the moored ships [2,6,7].
So far, the main methods to investigate the passing ship effects on moored ships include model tests and numerical methods [8]. Remery [9], Vantorre et al. [10], Duffy and Renilson [11] carried out a large number of captive model tests for investigating the passing ship problem. The International Conference on Ship Maneuvering in Shallow and Confined Water (MASHCON) has set up a series of in-depth studies on ship-ship interaction problems in confined waters [12,13]. The latest 6th conference (MASHCON2022) focused on “Passing Ship Effects in Shallow and Confined Water” [13] and specified the benchmark test cases about the passing effects on moored ships with high blockage in confined waters. The systematic model tests were conducted by Flanders Hydraulics Research (FHR) and the benchmark test data were provided for the comparative studies to improve the prediction accuracy. Although the model tests have high reliability, their long test period, high facility requirements, and costs are unavoidable.
Numerical methods include potential flow methods with inviscid fluid assumption and Computational Fluid Dynamics (CFDs) methods considering the fluid viscosity. Given the advantage of efficient computations by ignoring the fluid viscosity, the potential flow methods were adopted by many scholars in the past to study the passing ship effect problems. For example, Pinkster and Ruijter [2] developed potential flow codes to investigate the effects of passing ships on moored ships and demonstrated that the waves generated by the passing ship had significant impacts on the moored ship. Based on a potential flow model, van der Molen et al. [14] calculated the forces on a moored ship induced by a passing ship. Talstra and Bliek [15] studied the contributions of passing ship-generated waves to the passing effects on a moored ship, which showed that the free-surface elevations cannot be neglected when the Froude number is larger than 0.3. Similar conclusions were found by Yuan et al. [16] and Degrieck et al. [17]. Because of ignoring the fluid viscosity, the potential flow methods cannot capture the flows accurately in complex cases such as those where the ship-ship, ship-bank distances, or water depth are very small.
With the rapid development of numerical methods in the past two decades, more scholars tend to use the CFD methods by solving the Reynolds-Averaged Navier-Stokes (RANS) equations to study the passing ship problems. In view of the present progress, improving the numerical prediction accuracy and enhancing the knowledge of physical mechanisms are the most concerned issues from both academic and engineering communities. Carrying out validation investigations with the benchmark cases is a reliable way to evaluate and improve the prediction accuracy. For example, based on the MASHCON benchmark test data, Sadat-Hosseini et al. [18], Zou and Larsson [19], Kwon and Yeon [20], Yu et al. [21], and Zheng et al. [22] carried out in-depth numerical investigations on ship-ship interaction problems. Denehy [23] carried out a numerical study on the effects of a passing ship on a moored ship in restricted waterways, and three numerical methods were developed to predict the interaction forces and moments on the moored ship, from which some foundational conclusions were obtained. Due to the high computation cost and the difficulties in applying CFD methods, many simplifications were made in numerical simulations in previous studies, such as the quasi-steady assumptions and the neglect of free-surface elevation, which unavoidably brought numerical errors [24]. Specially, Alisal [25] and Mao et al. [26] demonstrated that the process of ships being accelerated to a steady speed helped to avoid abrupt disturbances on the free-surface elevations caused by the ships in model tests. Similarly, Terziev et al. [27] and Li et al. [28] illustrated that the acceleration process considered in numerical simulations was helpful to stabilize the flow field. Moreover, Lungu [29] numerically investigated the effects of ship-generated waves on the channel with the acceleration process.
To the authors’ best knowledge, for the ship-ship interaction problems, the acceleration process was usually ignored in numerical simulations and the passing process was normally simulated with constant speeds, which may lead to accuracy problems when comparing with the experimental data. Therefore, aiming at improving the prediction accuracy, this paper takes the MASHCON2022 benchmark model test case as the study object, and uses the unsteady Reynolds-Averaged Navier-Stokes (URANS) method coupled with the dynamic overset mesh technique to simulate the whole process of a moving ship passing a moored ship including the initial acceleration process, as in the model tests. Since the ship speed during the acceleration process in the model tests was not given explicitly, this paper considers four acceleration modes, and the numerical results based on different modes are compared with the test data to explore the influences of the acceleration process on the prediction accuracy. On the basis of the validated method, the physical mechanisms are analyzed and some fundamental conclusions on the effects of waves induced by the passing ship on the moored ship in restricted waterways are obtained.

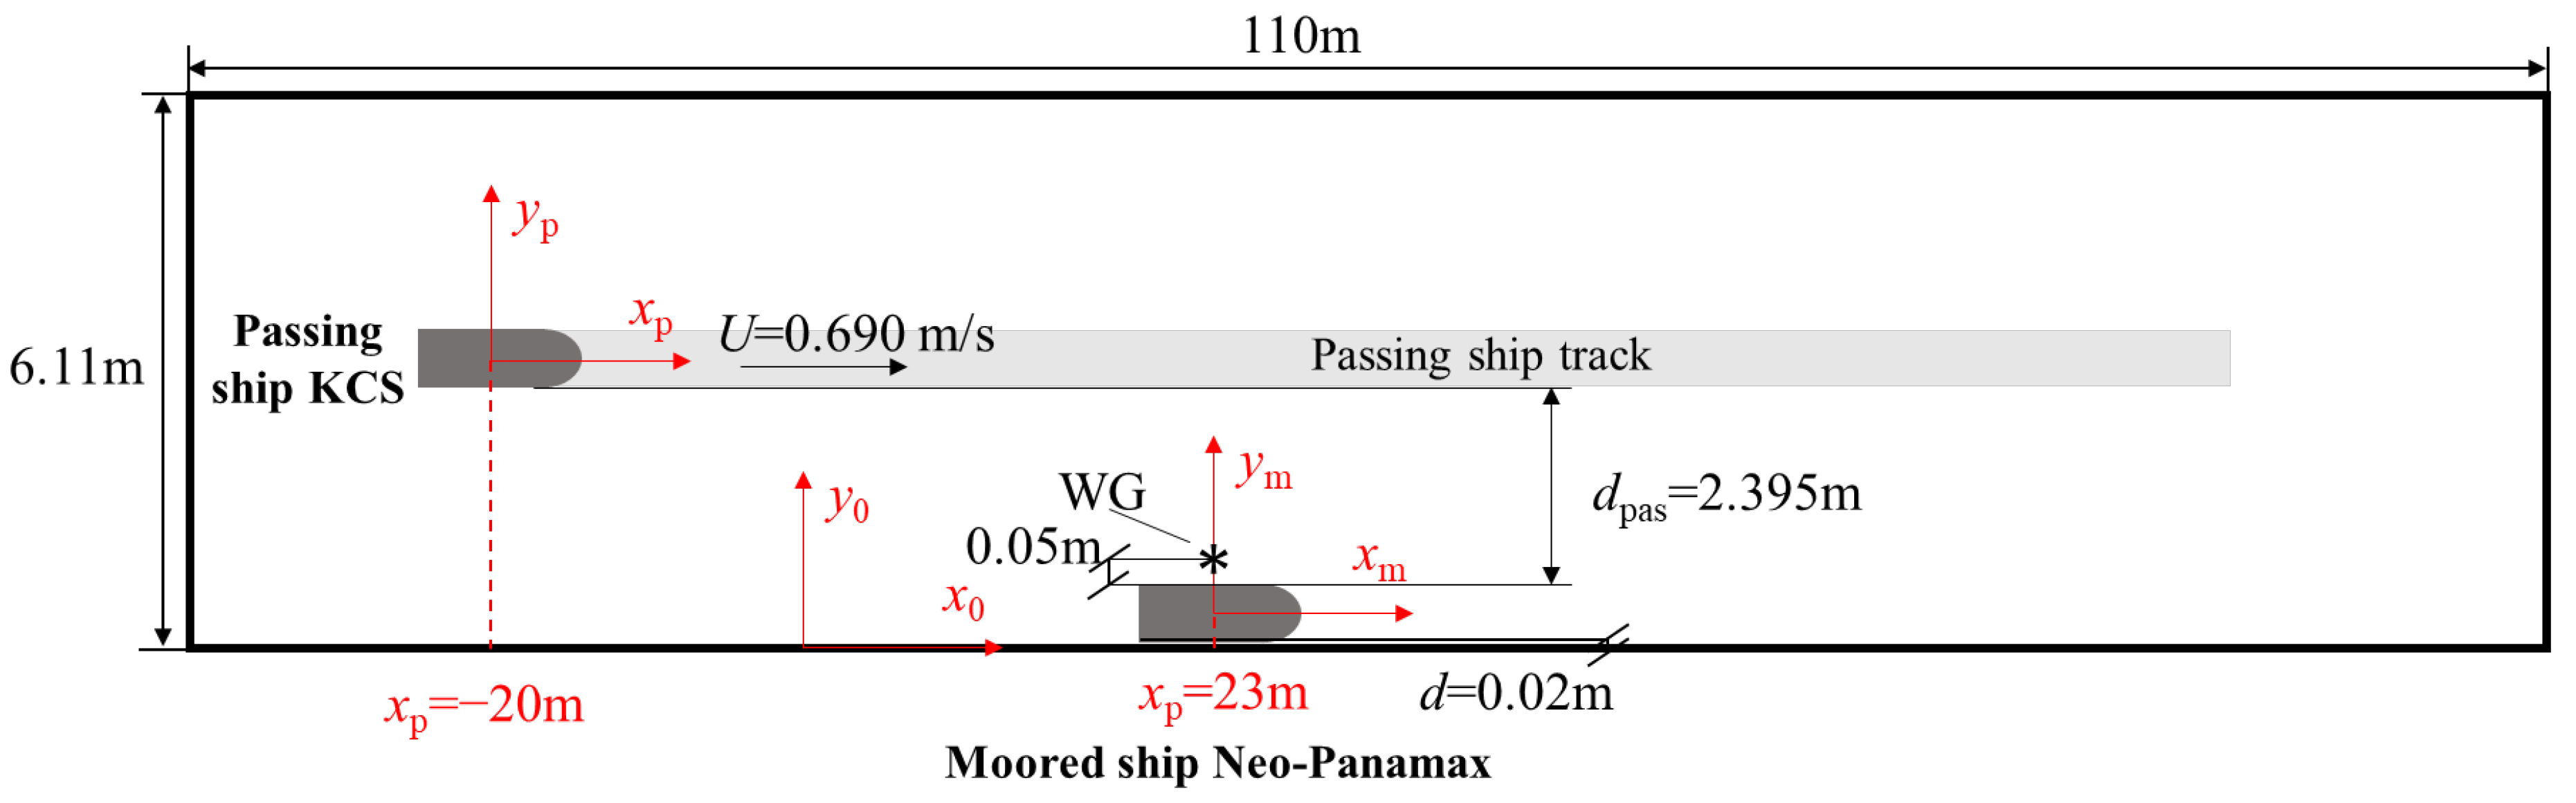
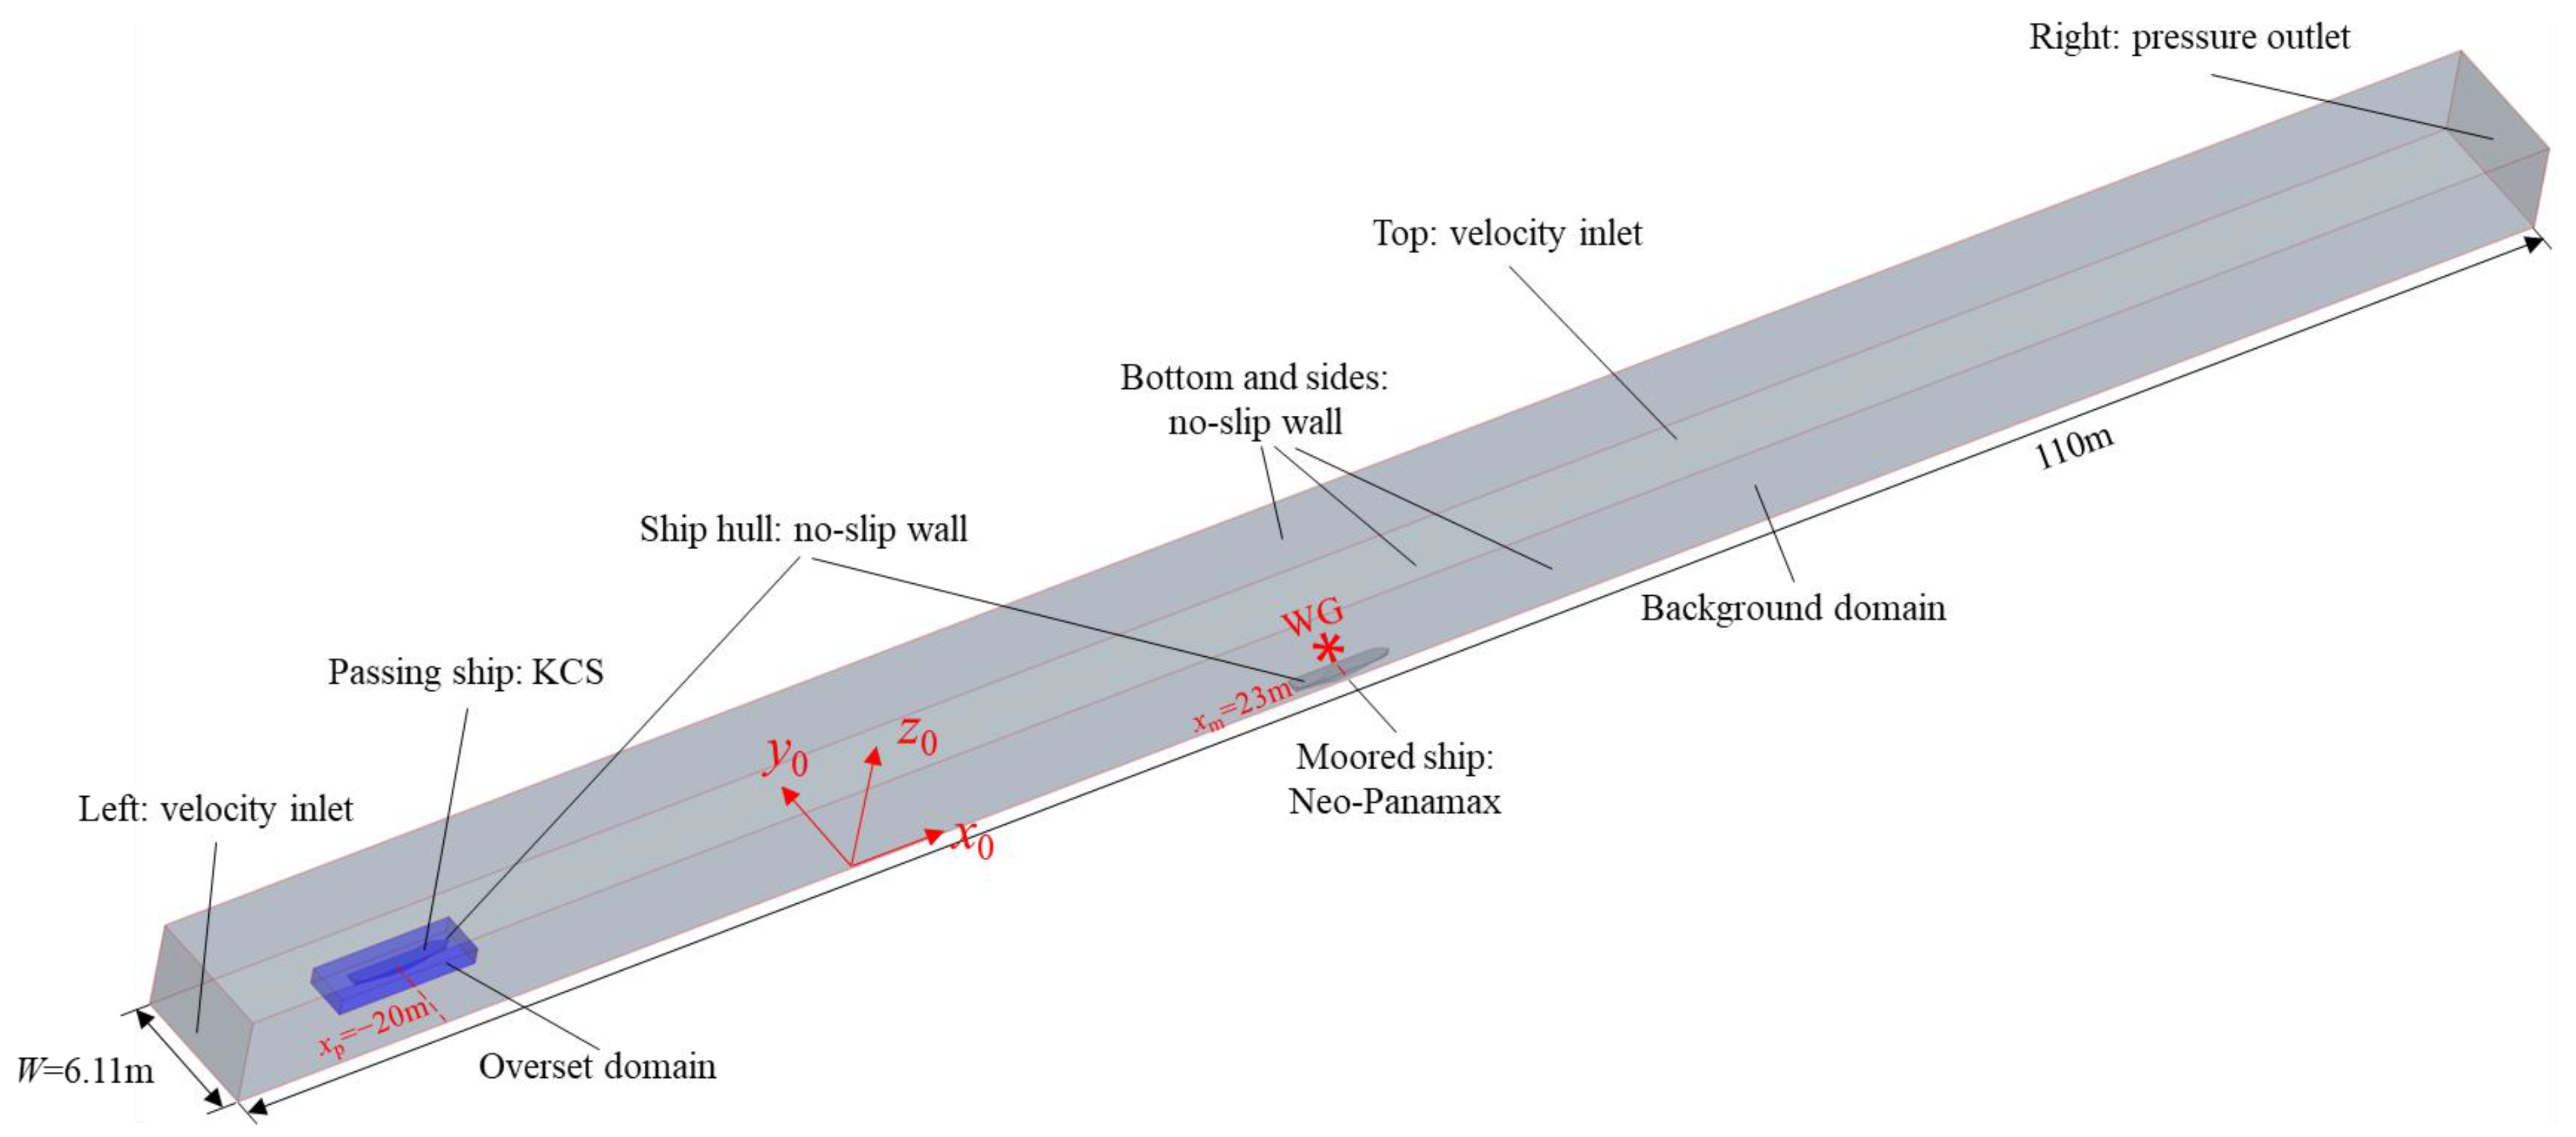
2. Problem Description

According to the MASHCON2022 benchmark test case [13], the two container ships KCS and Neo-Panamax are selected as the passing ship with a constant forward speed and the moored ship without speed, respectively. The hull geometries of the two ships without appendages are shown in Figure 1, and the main particulars are given in Table 1.
Figure 2 shows a schematic diagram for the passing problem. In the present study, three right-handed coordinate systems are adopted. The first one is the earth-fixed coordinate system O0-x0y0z0, with the O0-x0y0 plane on the undisturbed free surface, x0-axis pointing toward the moving direction of the passing ship, y0-axis perpendicular to the sides of the virtual towing tank and z0-axis pointing upwards. The other two coordinate systems are set up for the two ships respectively, with the origins fixed at the corresponding midships: the coordinate system Op-xpypzp for the passing ship and the coordinate system Om-xmymzm for the moored ship. Their x-axes are positive to the bow, y-axes are positive to the port side, and z-axes are positive upward. The relative longitudinal distance between the passing ship and the moored ship is defined by a non-dimensional longitudinal distance ξ = 2 ( x p x m ) / ( L p p , p + L p p , m ) , where xp and xm are the longitudinal coordinates of the passing ship and the moored ship in the earth-fixed coordinate system, respectively; Lpp,p and Lpp,m are their lengths between the perpendiculars. Additionally, the lateral passing distance between the two ships is denoted by dpas. The numerical settings are kept similar to those in the test conditions, as given in Figure 2 and Table 2. The moored ship Neo-Panamax is berthed along the towing tank wall, and the distance between its starboard side and the tank wall is only 0.02 m. The lateral passing distance dpas = 2.395 m, and the non-dimensional longitudinal distance ξ is a monotonous function increasing with time. The passing process in the model tests can be divided into three phases [13]:
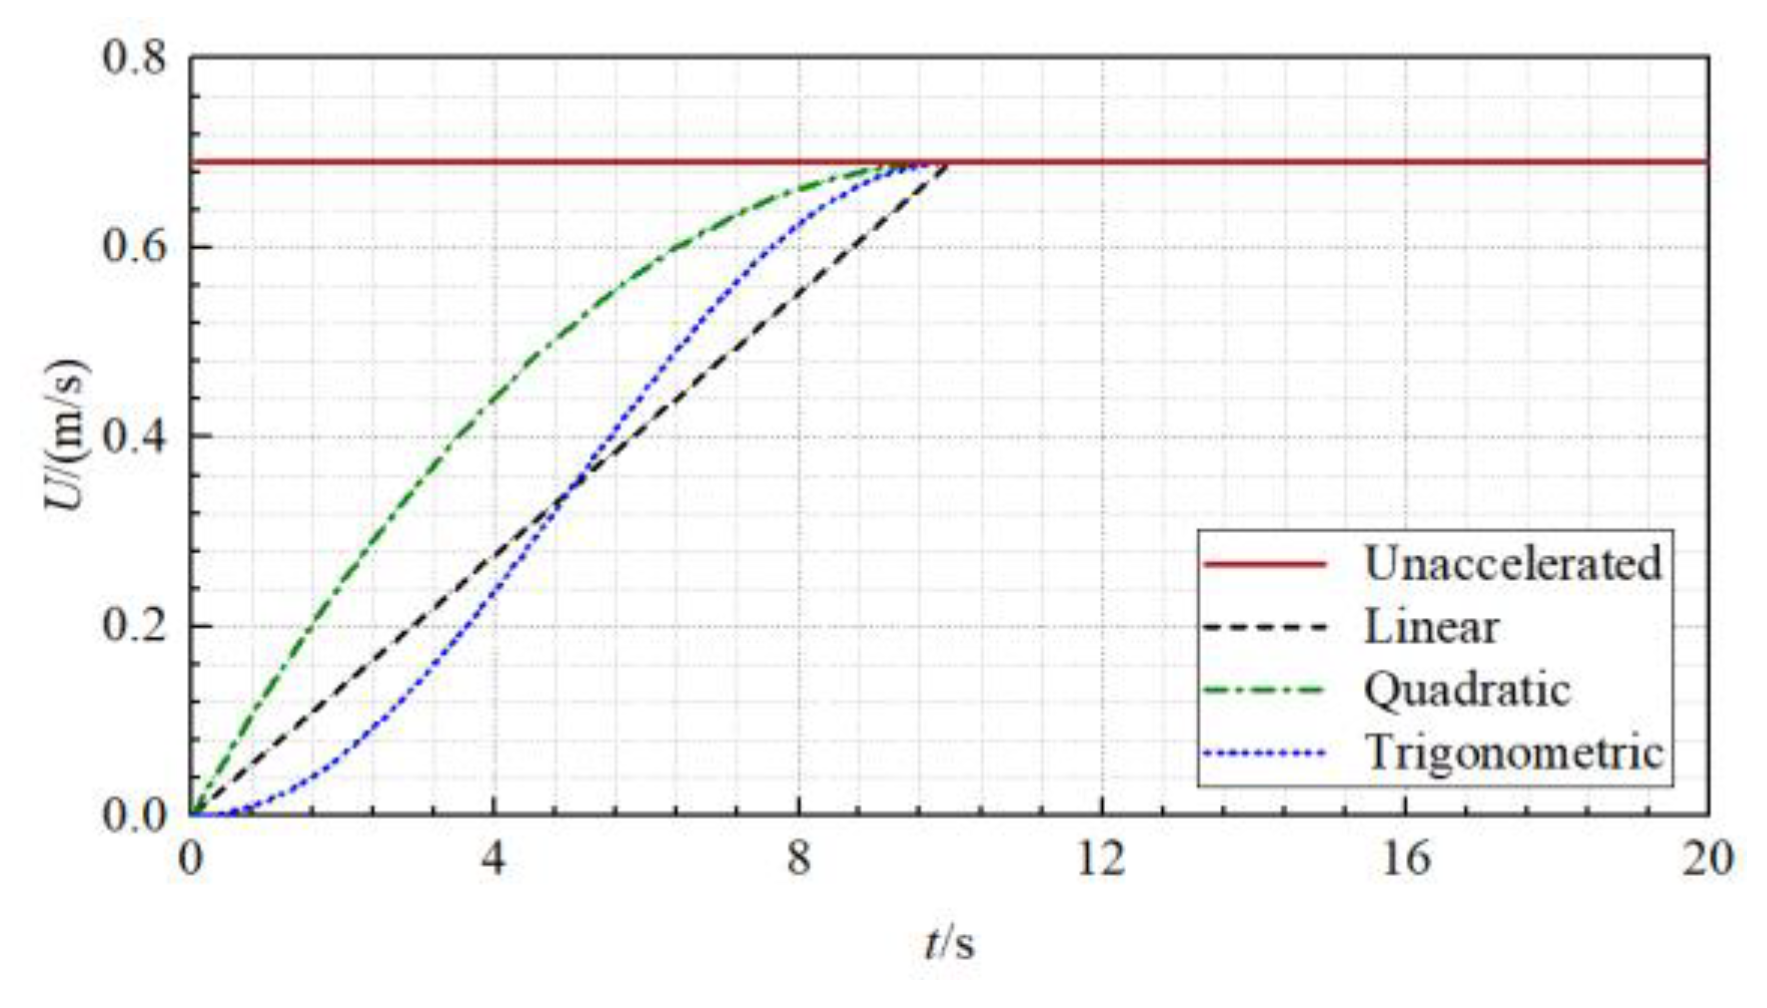
  • Acceleration process: starting from the static state, the passing ship is accelerated to the specified passing speed U by a carriage.
  • Constant-speed process: the passing ship passes the moored ship with the constant speed U.
  • Deceleration process: after the passing ship has moved away from the moored ship, it is decelerated to zero speed.
Figure 2. Schematic diagram of test layout and conditions.
Jmse 11 00483 g002
Table 2. Test conditions.
Main ParticularsSymbolUnitsValue
Water depthhm0.285
Under keel clearanceUKC-50%
Tank widthWm6.11
Passing speedUm/s0.690
Froude number based on the passing ship lengthFr-0.1055
Froude number based on water depthFrh-0.4128
Passing distancedpasm2.395
In the previous numerical investigations, usually only the constant speed process was simulated. In order to reproduce the benchmark model test more realistically to further improve the prediction accuracy, both the initial acceleration and the constant speed processes are numerically simulated in the present study, while the deceleration process is ignored to reduce the computation cost. As the ship speed value in the initial acceleration process of the model test was not given, this paper establishes four simple speed functions for describing the acceleration modes in the numerical simulations, including: (1) zero acceleration with constant speed U0; (2) linear acceleration U1; (3) quadratic acceleration U2; and (4) trigonometric function acceleration U3. All the initial acceleration processes are completed within 10 s, and the functional expressions of the four speeds are as follows:
U 0 = 0.69   m / s
U 1 = 0.069 t   m / s ,   t < 10   s 0.69   m / s ,   t 10   s
U 2 = 0.0069 ( t 10 ) 2 + 0.69   m / s ,   t < 10   s 0.69   m / s ,   t 10   s
U 3 = 0.345 cos π 10 t + 0.345   m / s ,   t < 10   s 0.69   m / s ,   t 10   s
From Equations (3) and (4), it can be seen that U ˙ 2 t = 10   s = 0 and U ˙ 3 t = 0 ,   10   s = 0 , which demonstrates that the passing speed varies more smoothly at the start and end of the acceleration process.
In the model tests, the two ships were only free to heave and pitch. In the numerical simulations, the DOFs (Degrees of Freedom) of the moored ship keep the same as in the model tests, while the passing ship is only free in its heave to reduce the impact of the unstable flows in the simulations. This is also helpful to save on the computation cost, since the attitudes and the hydrodynamic quantities of the moored ship are the main focuses of the present study, just as in the benchmark model tests. From this point of view, these treatments are regarded as reasonable. The numerically predicted quantities include the sinkage and trim, the longitudinal force X, lateral force Y, roll moment K, yaw moment N of the moored ship, and the free-surface elevation at a given position near the midship of the moored ship, corresponding to the wave gauge WG in the model tests (as shown in Figure 2). For comparisons, all quantities are presented in non-dimensional forms. The non-dimensional sinkage, trim, and free-surface elevation z are defined as:
Sinkage = Sinkage / L p p , m
Trim = z a , m z f , m L p p , m
z = z / L p p , m
where za,m and zf,m are the sinkage of the moored ship at aft-perpendicular and fore-perpendicular, respectively. The non-dimensional hydrodynamic quantities are defined as:
C F = F 1 2 ρ U 2 S m
C M = M 1 2 ρ U 2 S m L p p , m
where F and M are the hydrodynamic force and moment on the moored ship, ρ is the fluid density, and Sm is the wetted surface area of the moored ship.

3. Governing Equations and Numerical Methods

3.1. Governing Equations and Turbulence Model

The fluid is assumed to be incompressible, and the viscous flow is simulated using the software STAR-CCM+. To describe the flow, the time-averaged continuity equation and the URANS equations are adopted as the governing equations:
u ¯ i x i = 0 u ¯ i t + x j u ¯ i u ¯ j = 1 ρ p ¯ x i + 1 ρ x j σ ¯ j i ρ u i u j ¯ + f i
where u ¯ i ( j ) , p ¯ and σ ¯ j i denote the time-averaged velocity, pressure, and stress tensor components (i, j = 1, 2, 3); fi is the body force, which is regarded as a constant term; ρ u i u j ¯ are the Reynolds stresses resulting from the time-averaging process, which should be solved by turbulence modeling. In the present study, the realizable k-ε turbulence model [30] is applied to close the governing equations, which is demonstrated to be applicable to the passing ship problems by Wnęk et al. [31], Zhou et al. [7], and Zheng et al. [22].

3.2. Dynamic Overset Meth Technique

In order to handle the problem involving the variations of relative distance between the two ships during the entire passing process, the dynamic overset mesh technique [32] is used to simulate the movement of the passing ship. Applying this technique, the computational domain is divided into a background domain including the moored ship and an overset domain covering the passing ship, and the overset domain is embedded in the background domain. Besides, the mesh cells are grouped into active cells, inactive cells, and acceptor cells. In the numerical simulations, only within the active cells the discretized governing equations are solved. The acceptor cells are located on the overset interface where flow quantities are interpolated from the active cells to the acceptor cells through the interface between the two domains. When the overset domain moves with the passing ship, the interface changes too. The movement of the passing ship and the attitude changes in the two ships in response to the hydrodynamic interactions are realized using the Dynamic Fluid Body Interaction (DFBI) module [33] in STAR-CCM+.

3.3. Numerical Settings

Figure 3 shows the computational domain in the numerical simulations. The width of the computational domain (6.11 m) is identical to the towing tank width, but the domain length (110 m) is longer than that in the model tests to eliminate the disturbances of reflected waves from the boundaries. Additionally, the initial distance between the two ships (43 m) is longer to ensure that the flow field is fully developed before the two ships meet each other. For the present problem, the velocity inlet condition is applied on the left and top boundaries; the no-slip wall condition is set on the ship hulls, tank bottom, and side boundaries; the pressure outlet condition is applied on the right boundary. In addition, the Volume of Fluid (VOF) method is used to capture the free-surface elevation. To increase the accuracy of free-surface simulations, the High-Resolution Interface Capturing (HRIC) scheme is adopted along with the VOF method. According to the ITTC recommendations [34], when the two-equation turbulence model is applied in numerical calculations, the time step should be smaller than 0.01 Lpp,p/U (0.063 s). A smaller time-step of 0.04 s is adopted in the study. The stopping criterion for the computations is set as ξ > 2 to ensure that the simulation covers the initial acceleration and constant speed processes.

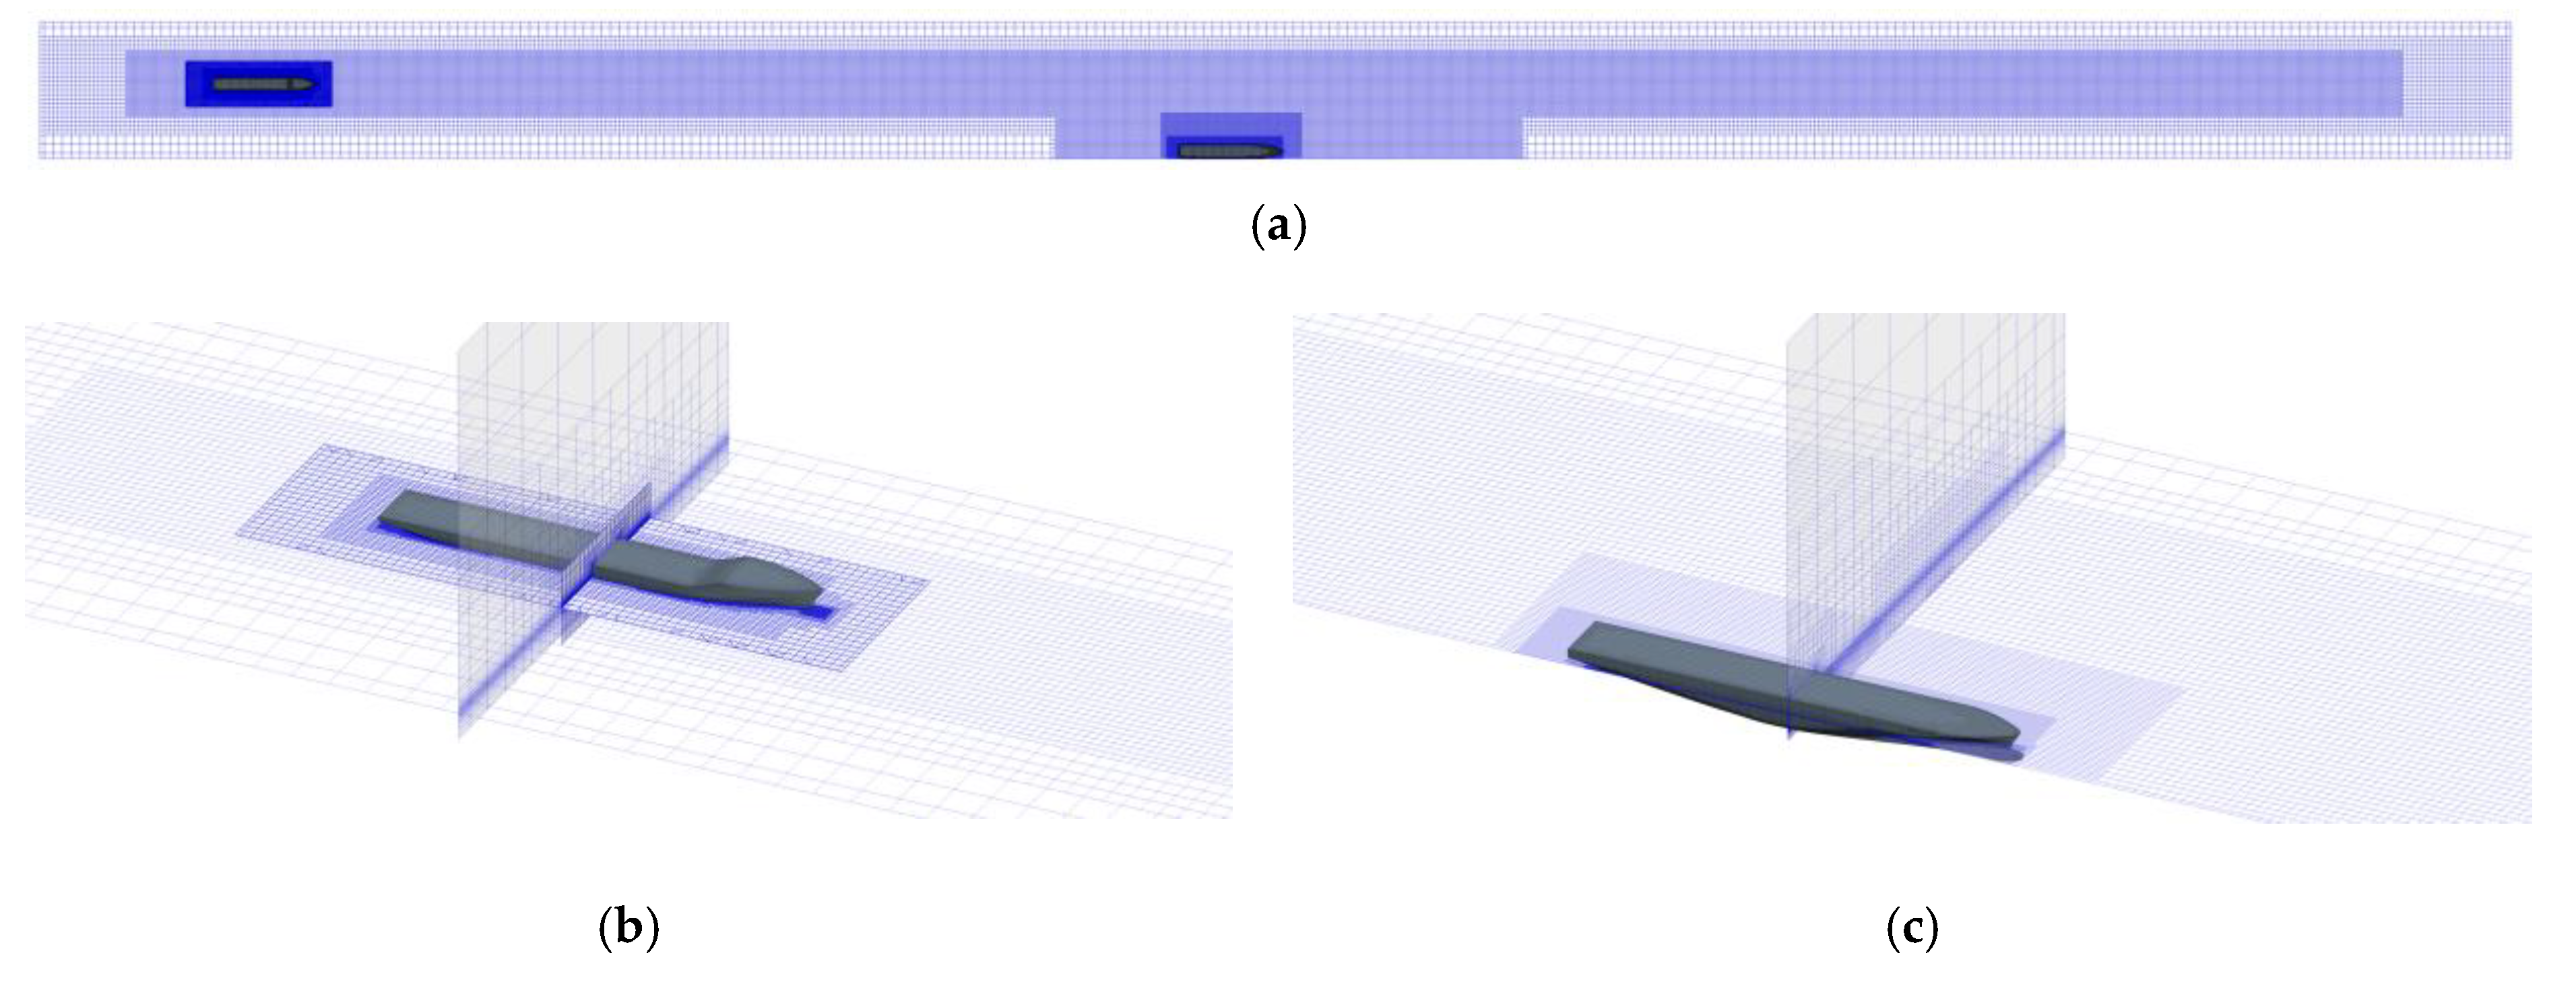
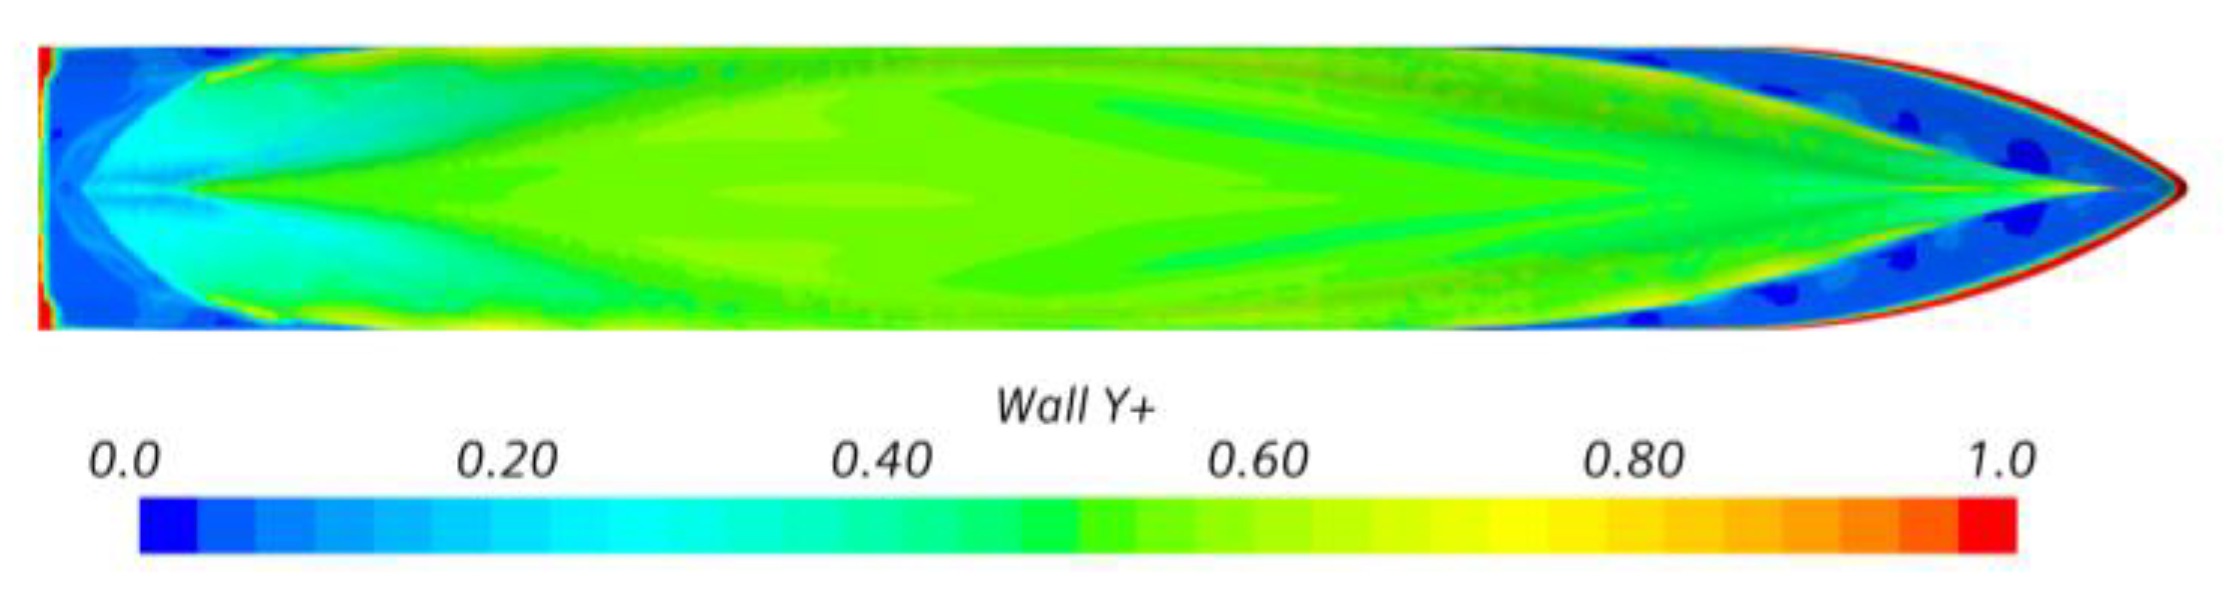
3.4. Mesh Generation

The trimmed meshes and the prism layer meshes are applied to discretize the fluid domain, and the mesh distributions are shown in Figure 4. The prism layer meshes are used to generate orthogonal prismatic cells next to the hull surface of the passing ship, and the all-y+ wall treatment with y+ < 1 is implemented for the near-wall flow simulation, as shown in Figure 5. As the moored ship has no speed, only the trimmed meshes are applied to generate cells around the moored ship. To improve the accuracy of flow capturing, mesh refinements are adopted in the complex flow regions, such as the near wall region, gaps between the hulls, and the solid walls, and the regions where the two ships are close to each other. Moreover, in order to decrease the discretization errors and to guarantee the interpolation accuracy, the mesh sizes of the two domains on the interface are similar.

4. Mesh Convergence Study

In order to estimate the numerical errors and uncertainties due to the spatial discretization in the simulations, the Grid Convergence Index (GCI) method [35] is adopted in this paper. Three systematically refined mesh sets are set up with a uniform refinement ratio r, and their numerical solutions are utilized to obtain the convergence ratio R, from which the convergence type of the numerical simulations can be determined:
R = ε 21 ε 32
ε 21 = ϕ 2 ϕ 1
ε 32 = ϕ 3 ϕ 2
where ϕi represents the numerical solution of ith mesh and i = 1, 2, 3 indicate the fine, medium, and coarse meshes, respectively. According to the value of R, the convergence types are determined as: monotonic convergence (0 < R < 1), oscillatory convergence (−1 < R < 0), and divergence (R > 1 or R < −1). The order of accuracy pRE and the extrapolated solution ϕ0 based on the Richardson extrapolation (RE) can be calculated by the following expressions:
p R E = ln ε 32 / ε 21 ln r
ϕ 0 = ϕ 1 ε 21 r P R E 1
Then, the relative error ei between ϕi and ϕ0, and the fine-mesh convergence index GCI are calculated using the following expressions:
e i = ϕ 0 ϕ i ϕ 0
G C I = 1.25 r p R E ϕ 1 ϕ 2 ϕ 1
Taking the simulation with the linear acceleration as an example, three sets of meshes with the refinement ratio r = 2 4 are established. The mesh configurations are listed in Table 3. The peak values of the hydrodynamic forces/moments on the moored ship are selected for evaluation, which reflect the severity of the passing ship effects. The peak values and the obtained results from the study are given in Table 4. It shows that all the hydrodynamic quantities achieve convergence, and the lateral force is relatively more difficult to converge. In general, the errors and uncertainties of the hydrodynamic quantities are reasonably small, which verifies the reliability of the numerical model. For the sake of more efficient simulations, the medium mesh is adopted in the subsequent numerical simulations.

5. Numerical Results

5.1. Effects of Ship-Generated Waves

The passing ship speeds are monitored in the numerical simulations to verify that the passing ship moves at the prescribed speed. The time histories of passing speed are shown in Figure 6, which demonstrates that the prescribed passing speeds are accurately implemented in the URANS simulations. When the passing ship is accelerated to the given speed, the longitudinal distances between the two ships are 39.55 m (linear acceleration), 38.40 m (quadratic acceleration), and 39.55 m (trigonometric function acceleration), respectively.
In order to clearly analyze the effects of waves induced by the passing ship on the moored ship, this section takes the numerical results based on the linear acceleration mode as an example. Figure 7 shows the wave patterns during the passing process. Figure 8 shows the time histories of the predicted moored ship attitudes, hydrodynamic quantities, and free-surface elevations at the wave gauge position (denoted by WG). For a better illustration, both the time (t) and the corresponding varying longitudinal distance between the two ships (ξ) are given in the horizontal axis. It should be noted that the fluctuation of numerical results when t < 5 s in Figure 8 is due to the unstable flows in the initial numerical simulation. It can be found that when the acceleration process is completed, there is still a distance of 39.55 m between the two ships (about 9.09 times the moored ship length), which means that the waves around the passing ship and the flow field can be fully developed before the passing ship approaches the moored ship. As shown in Figure 7 and Figure 8, the effects of ship-generated waves on the moored ship can be divided into two parts:
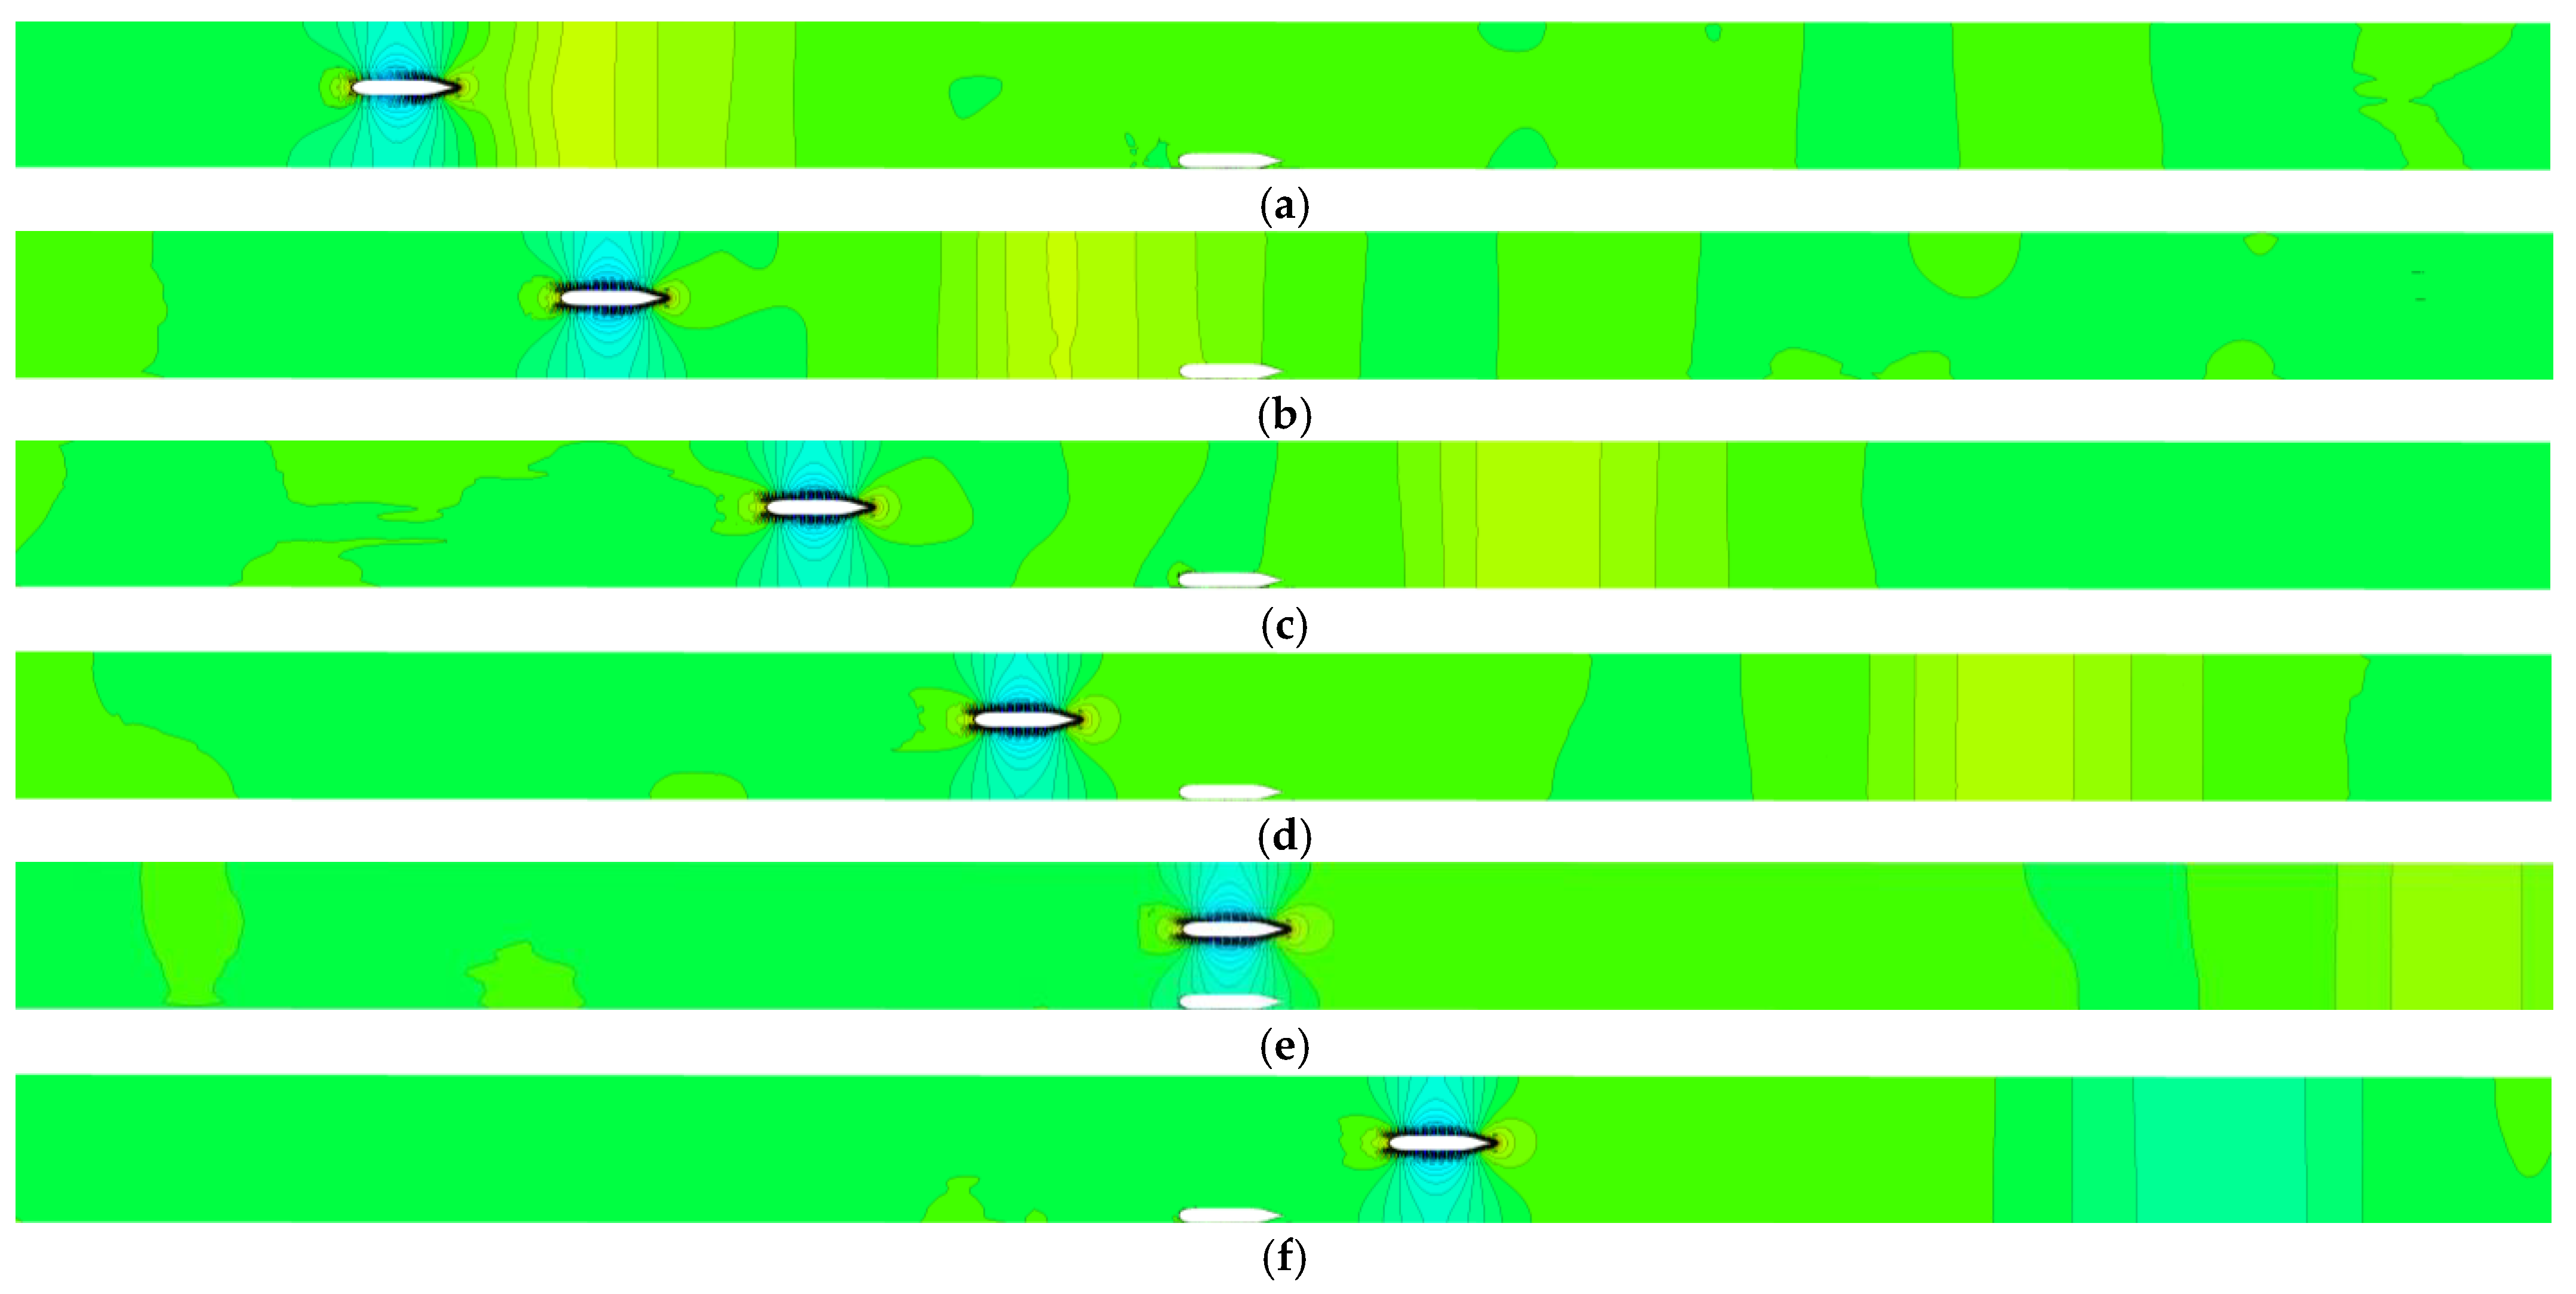
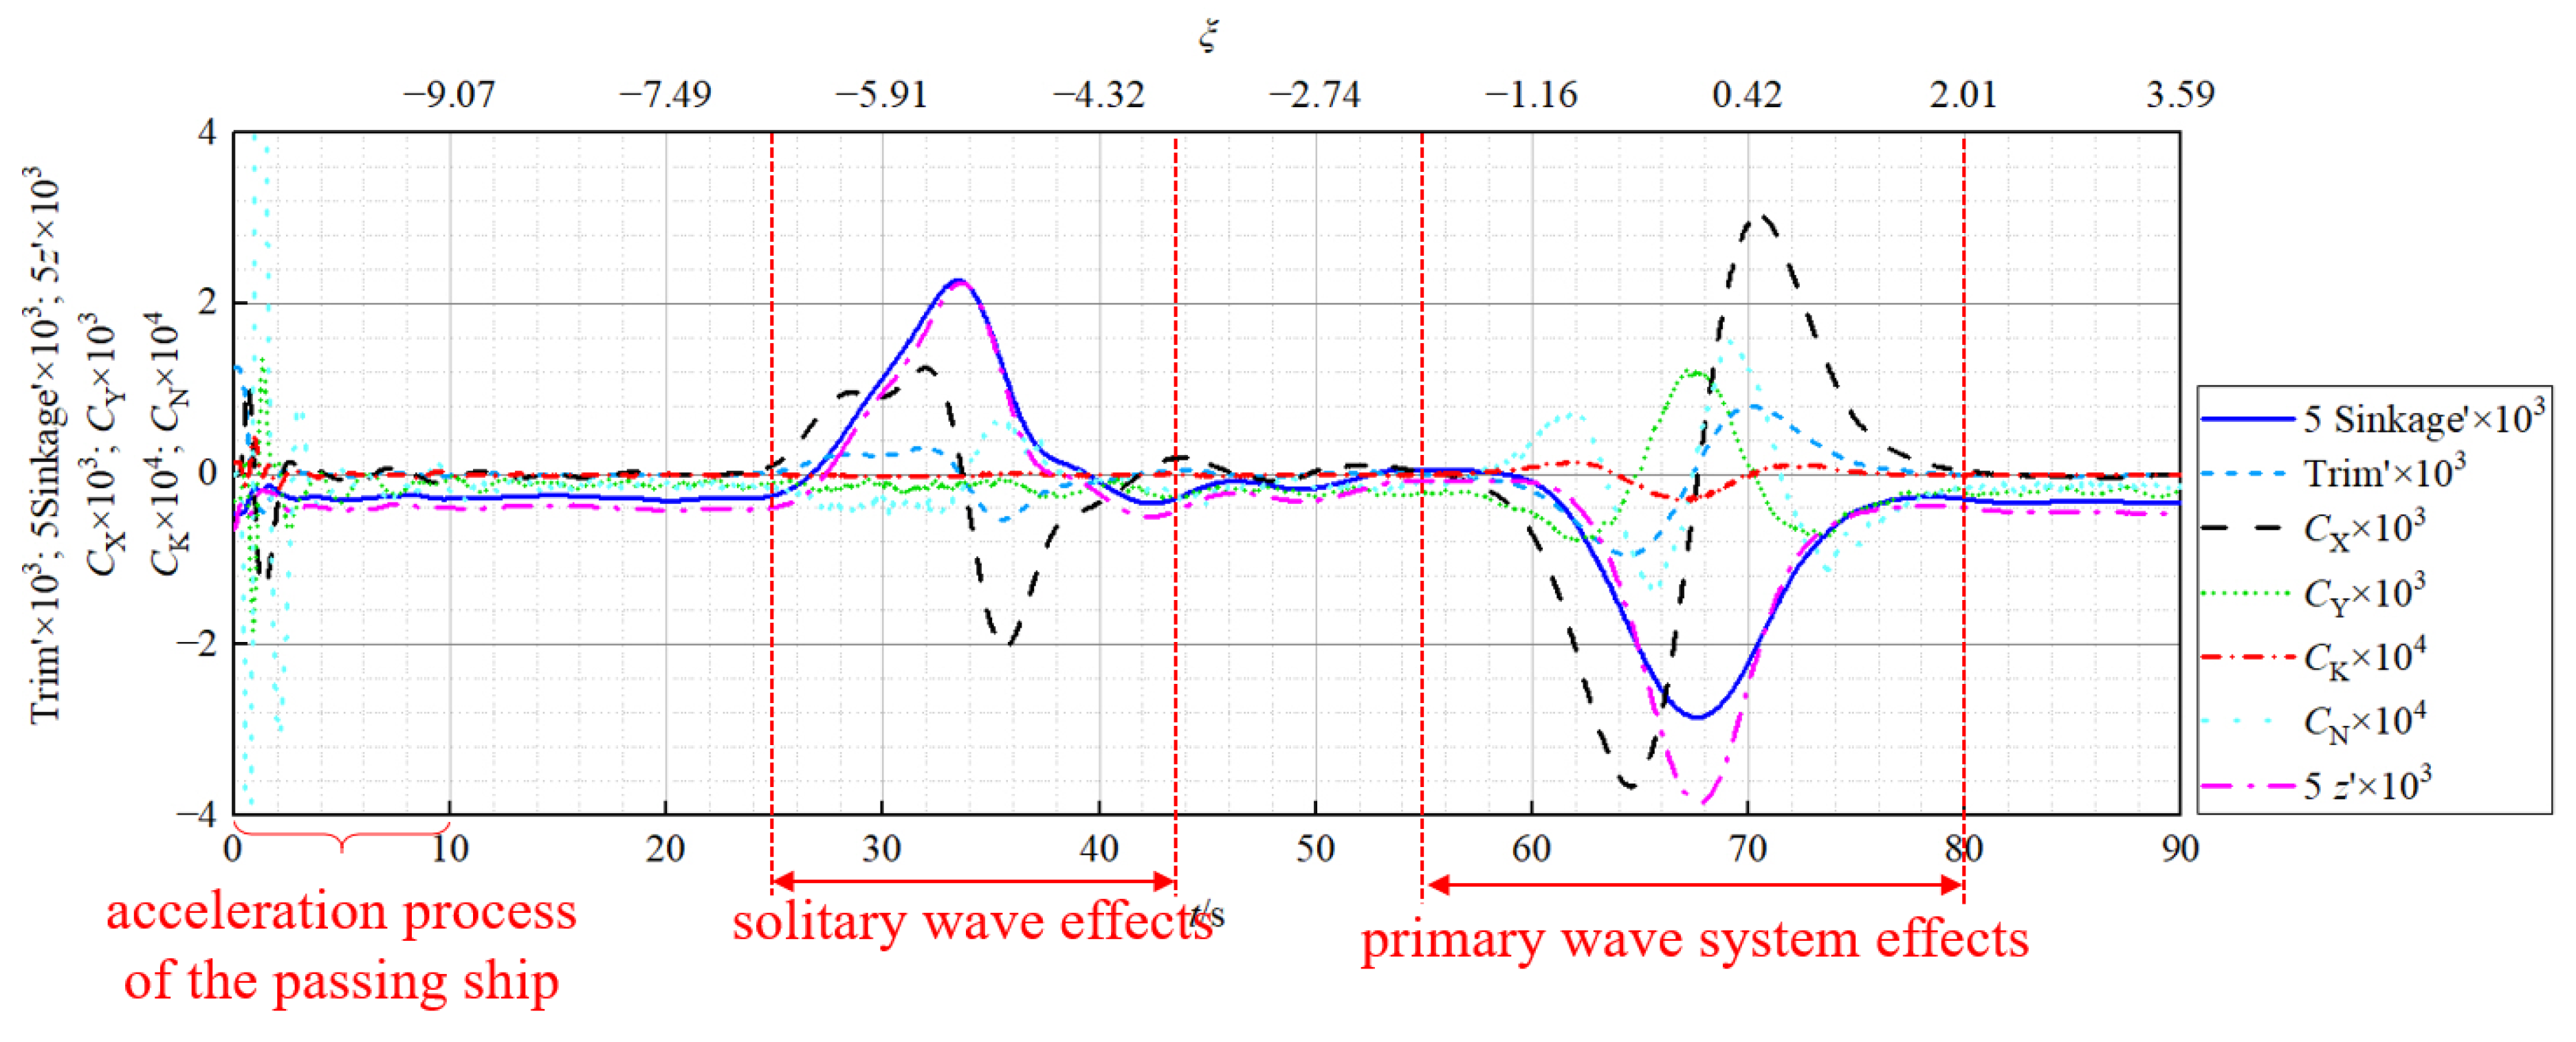
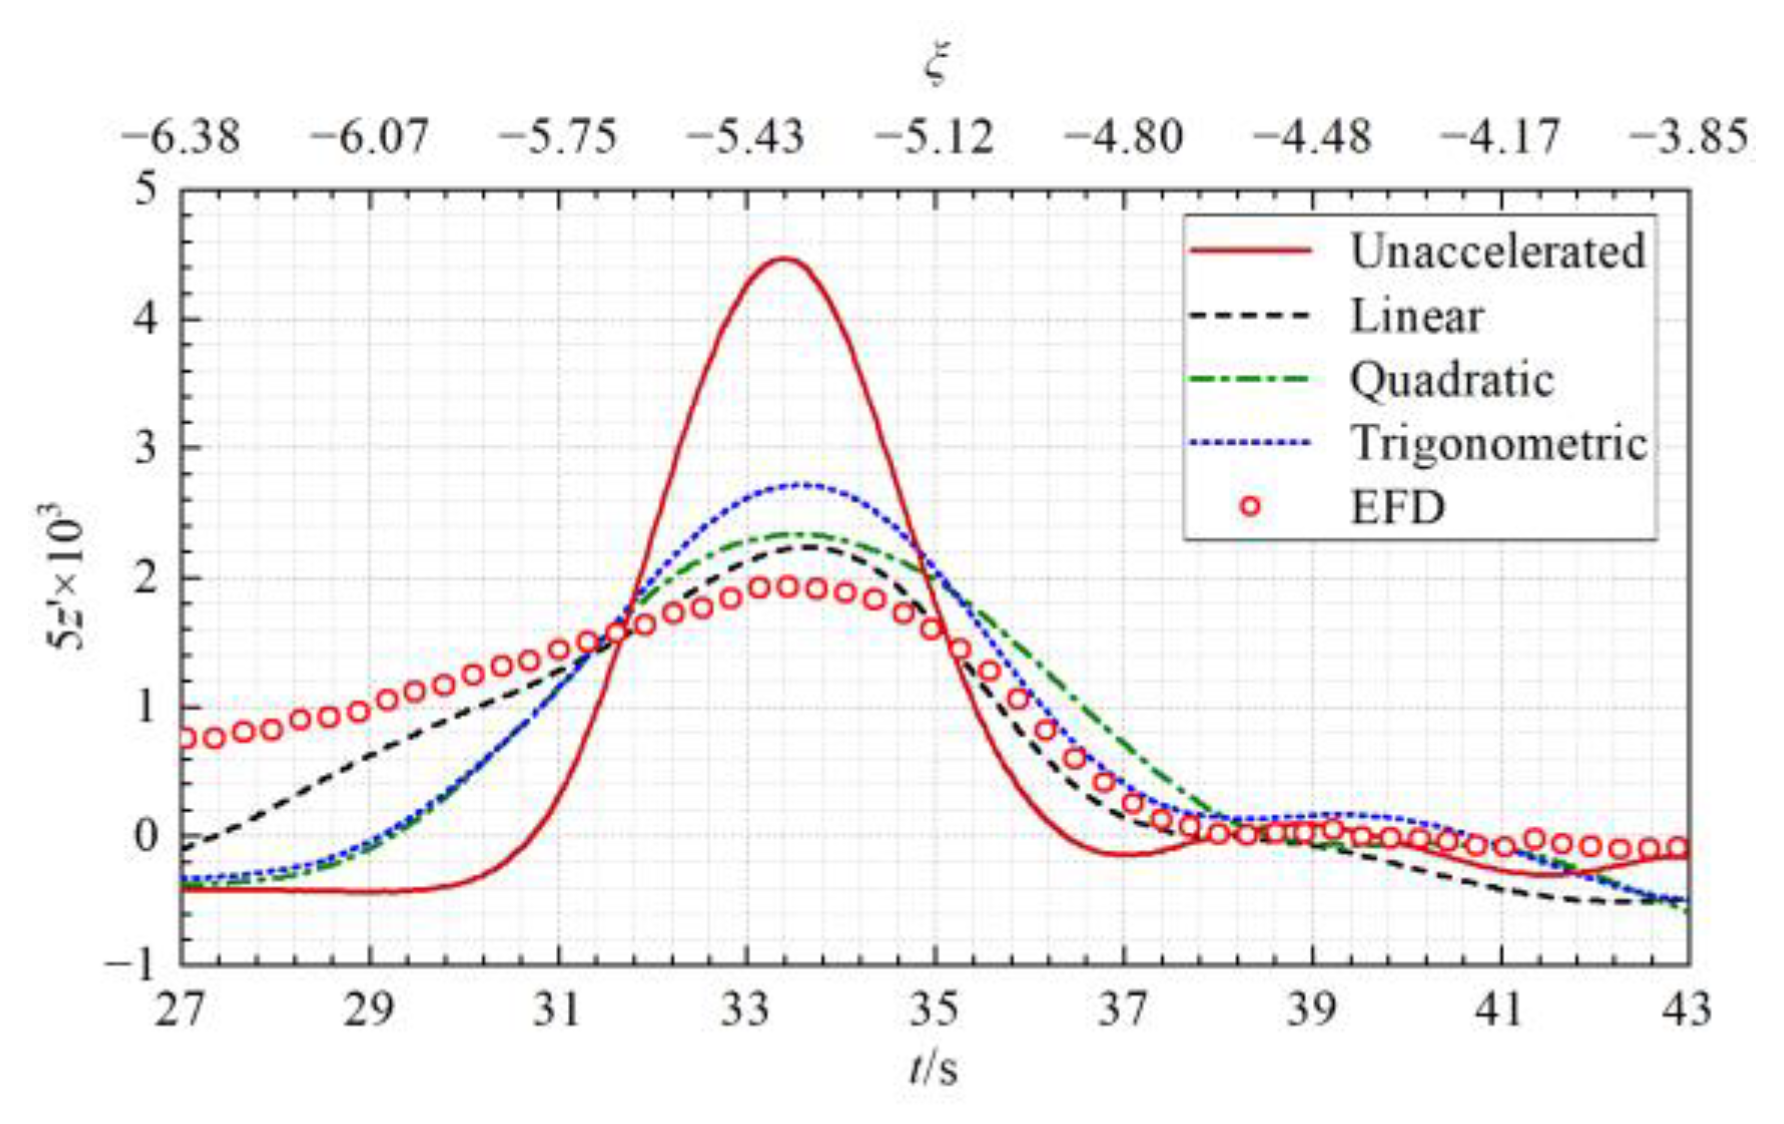
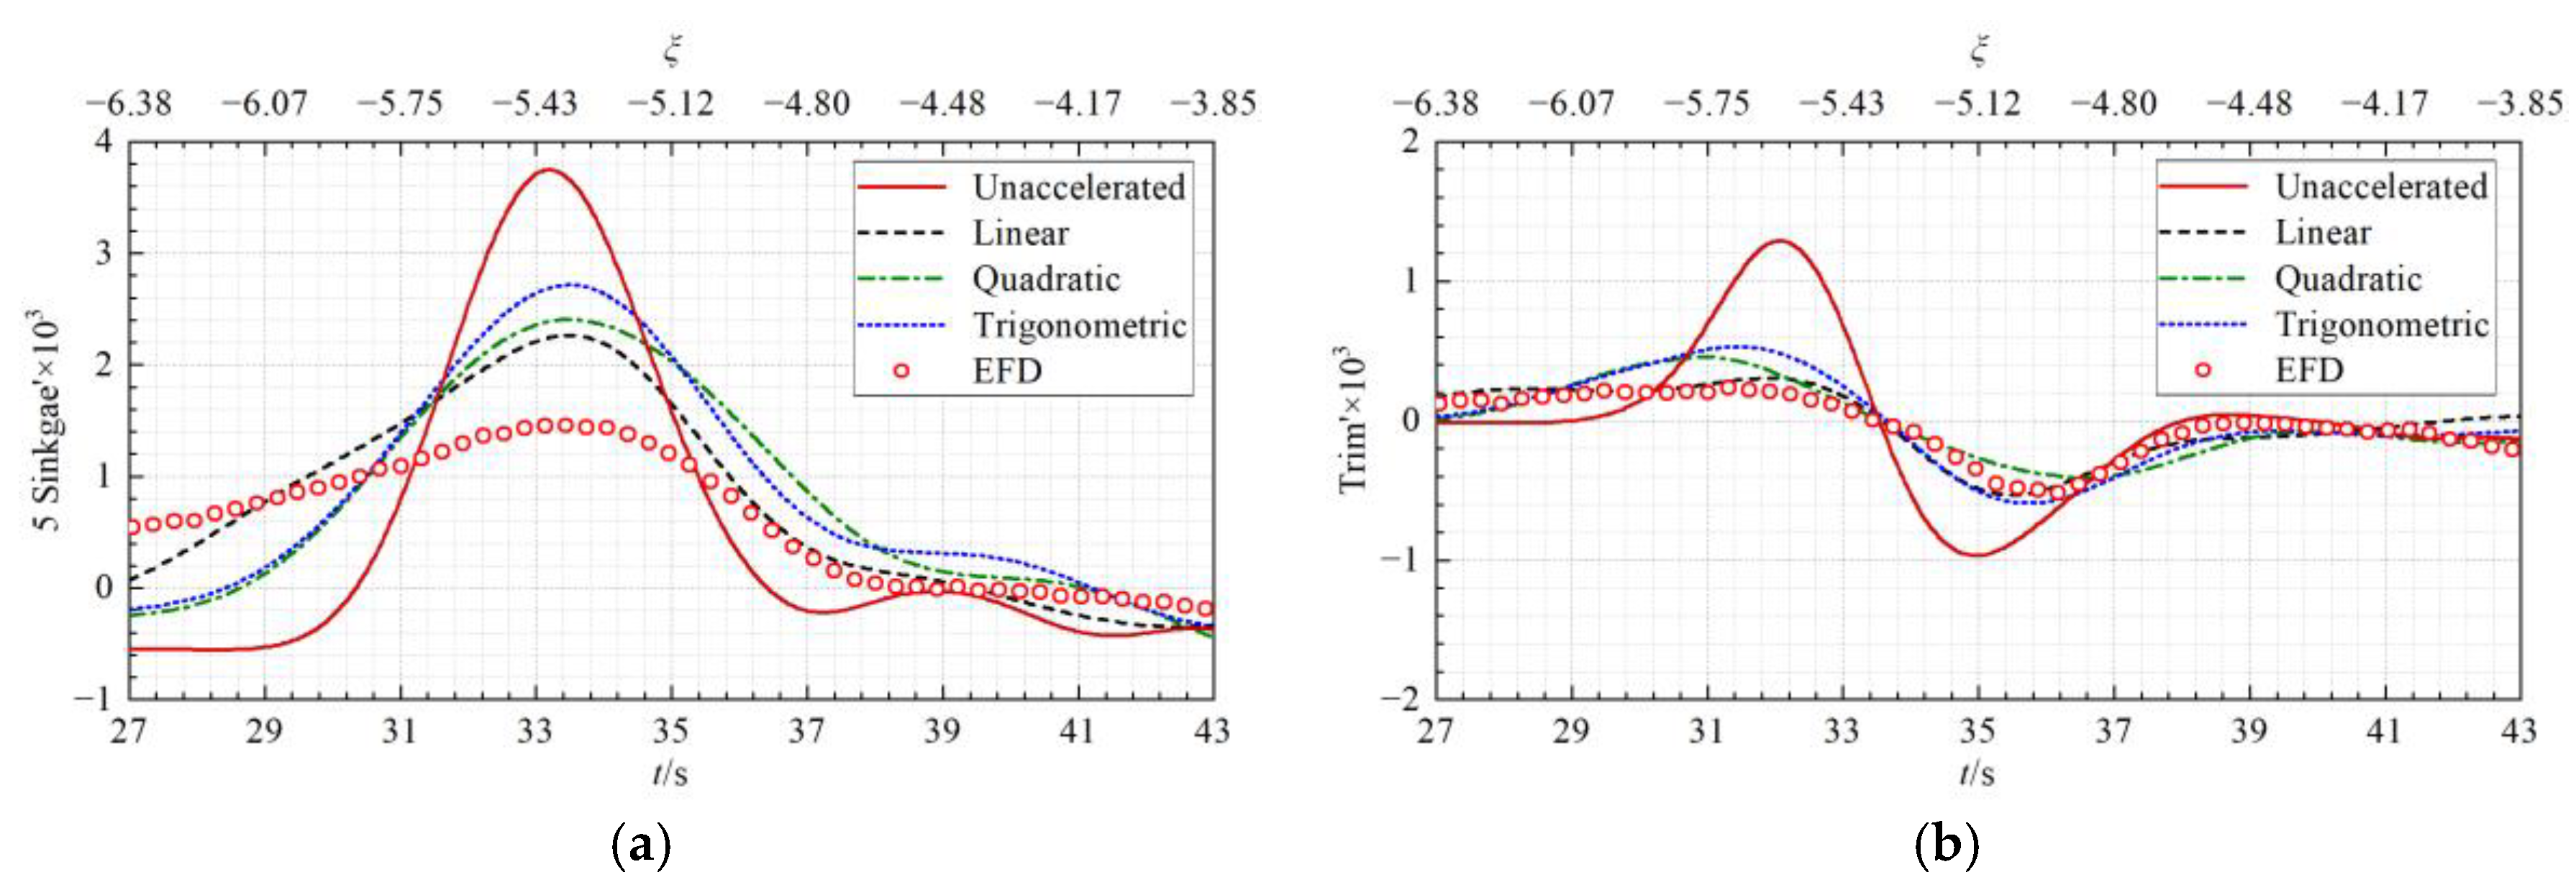
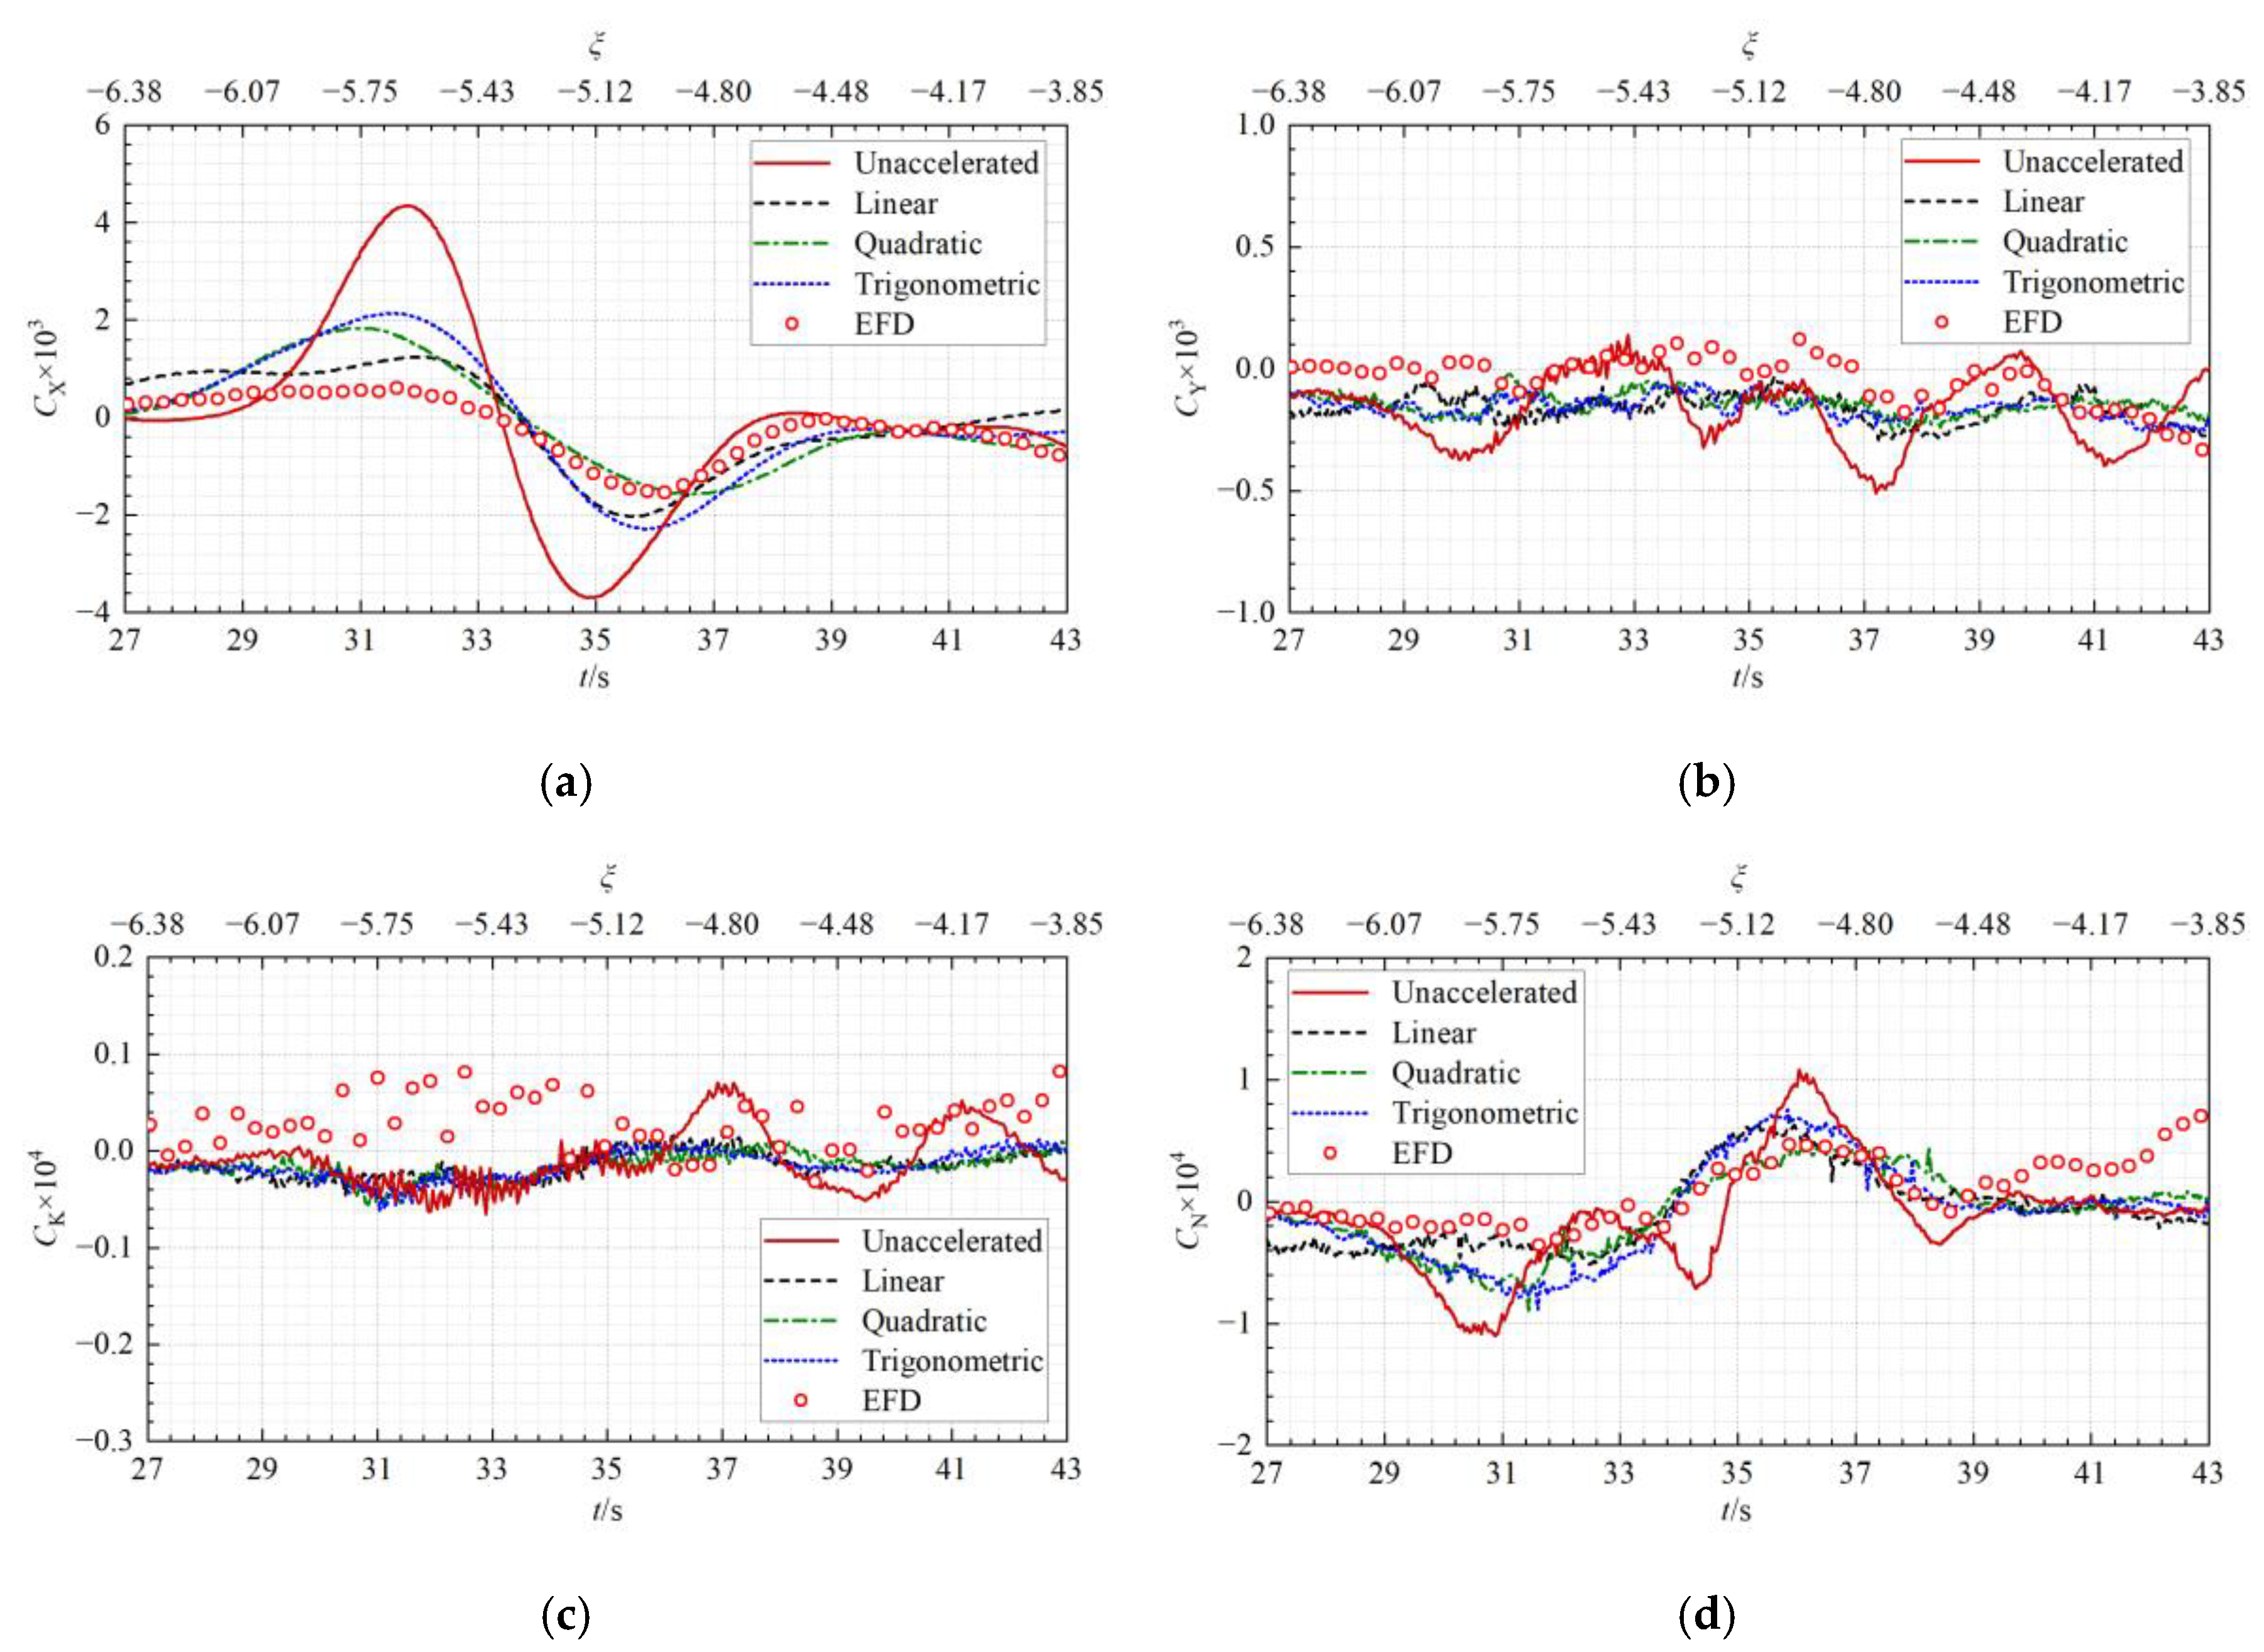
  • Solitary wave effects: During the initial passing process, a solitary wave induced by the passing ship propagates steadily from the ship through the tank. This phenomenon was also recorded in the model tests by van Zwijnsvoorde et al. [13]. When the solitary wave is passing the moored ship (27 s < t < 43 s or −6.38 < ξ < −3.85), there is still a long distance between the two ships (27.82~16.78 m, about 6.39~3.86 times the moored ship length), and the moored ship obviously rises and the longitudinal force X on it varies significantly. After the solitary wave travels away from the moored ship (t > 50 s), the attitudes and the hydrodynamic quantities of the moored ship return to zero.
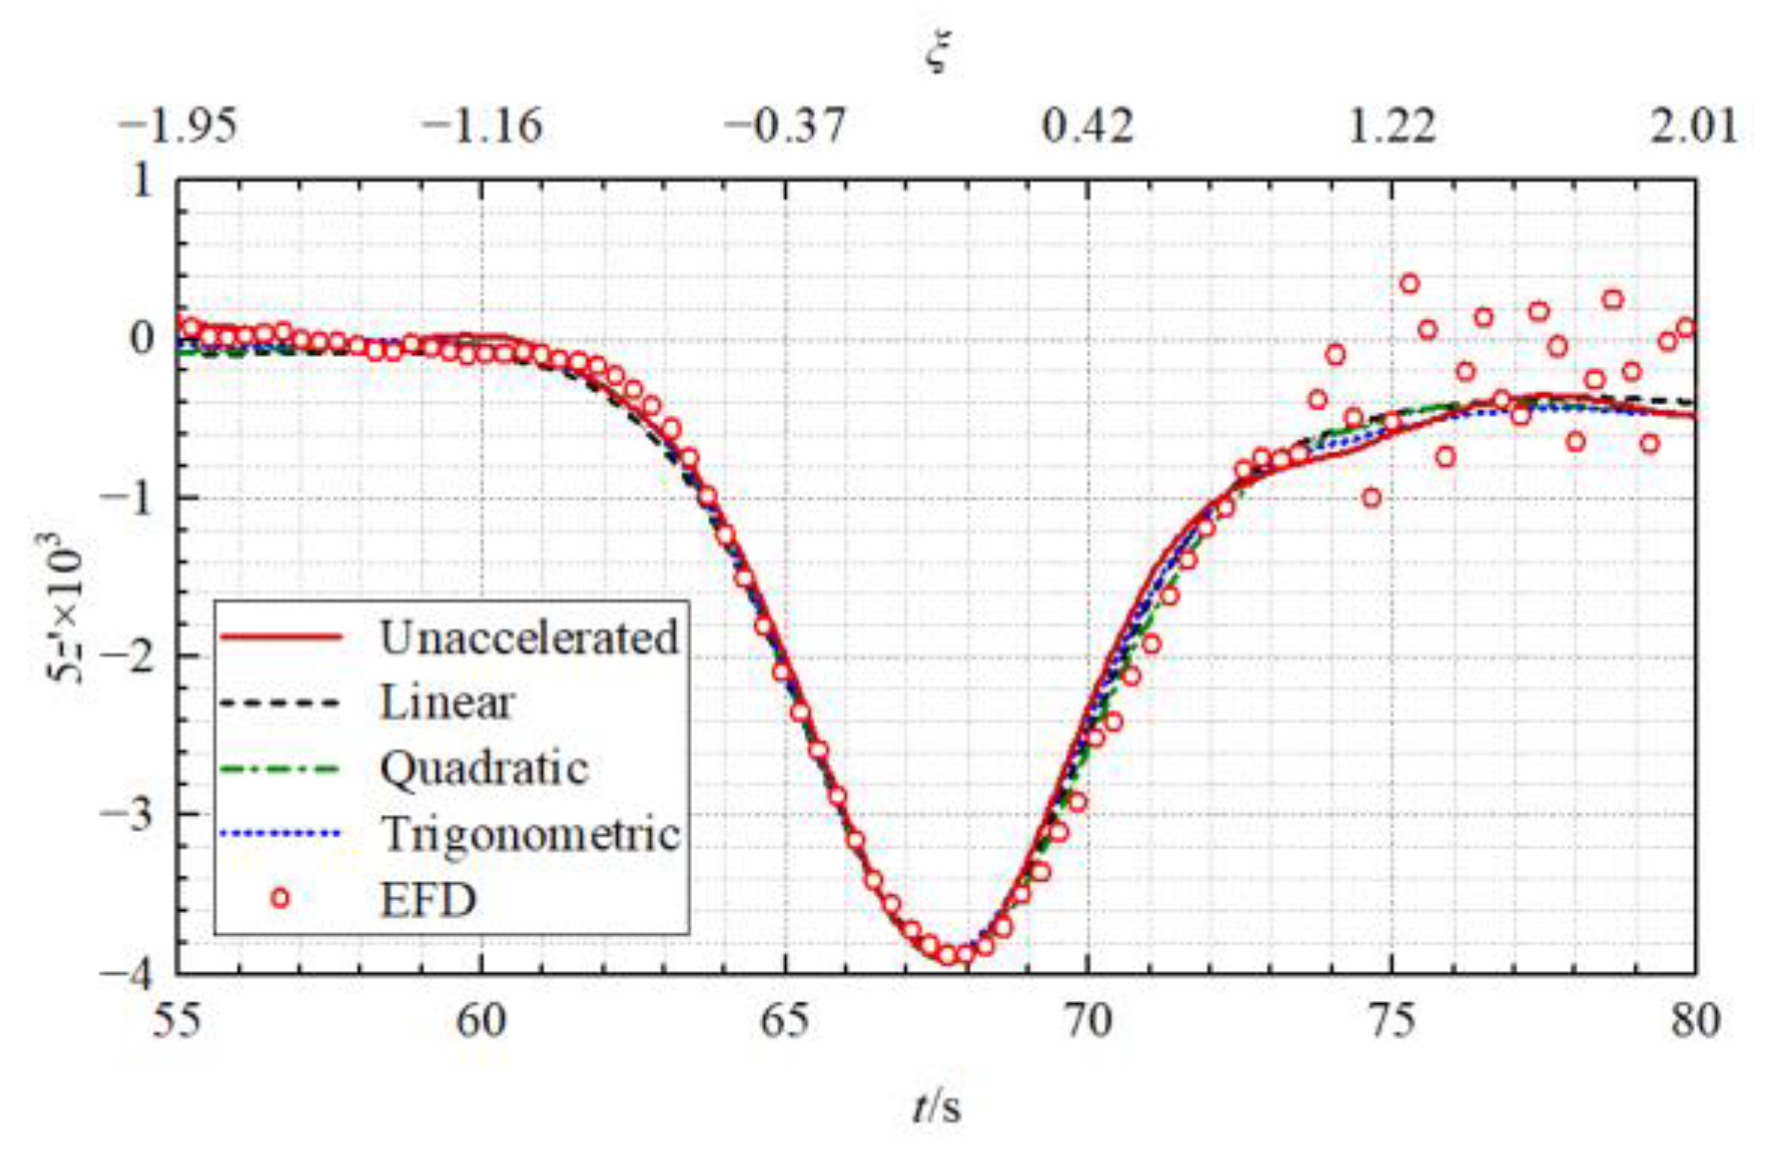
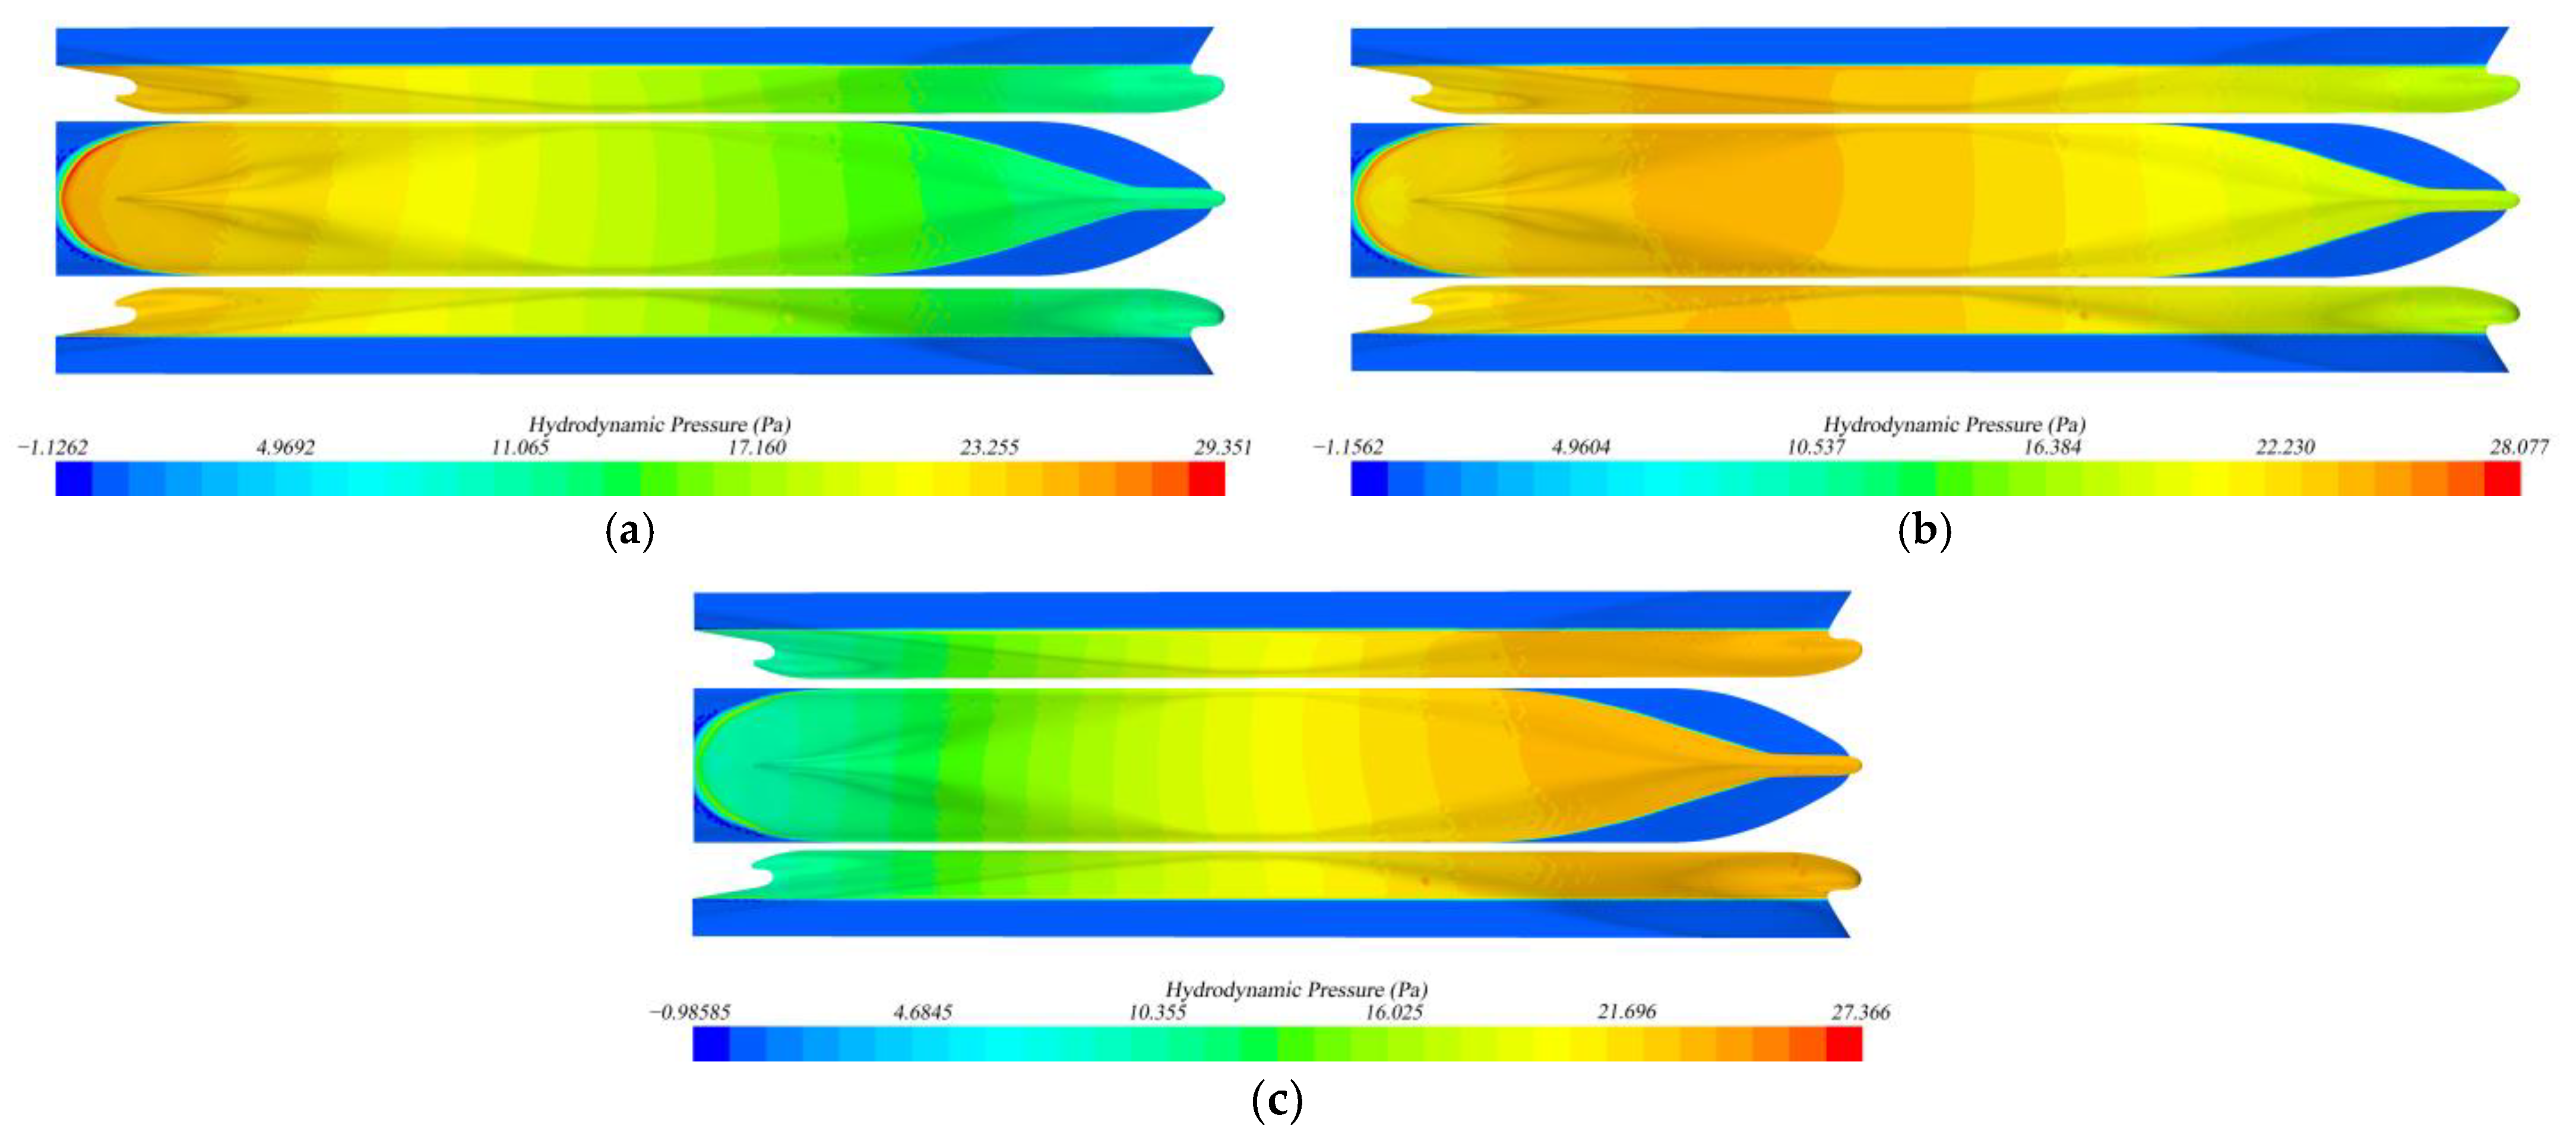
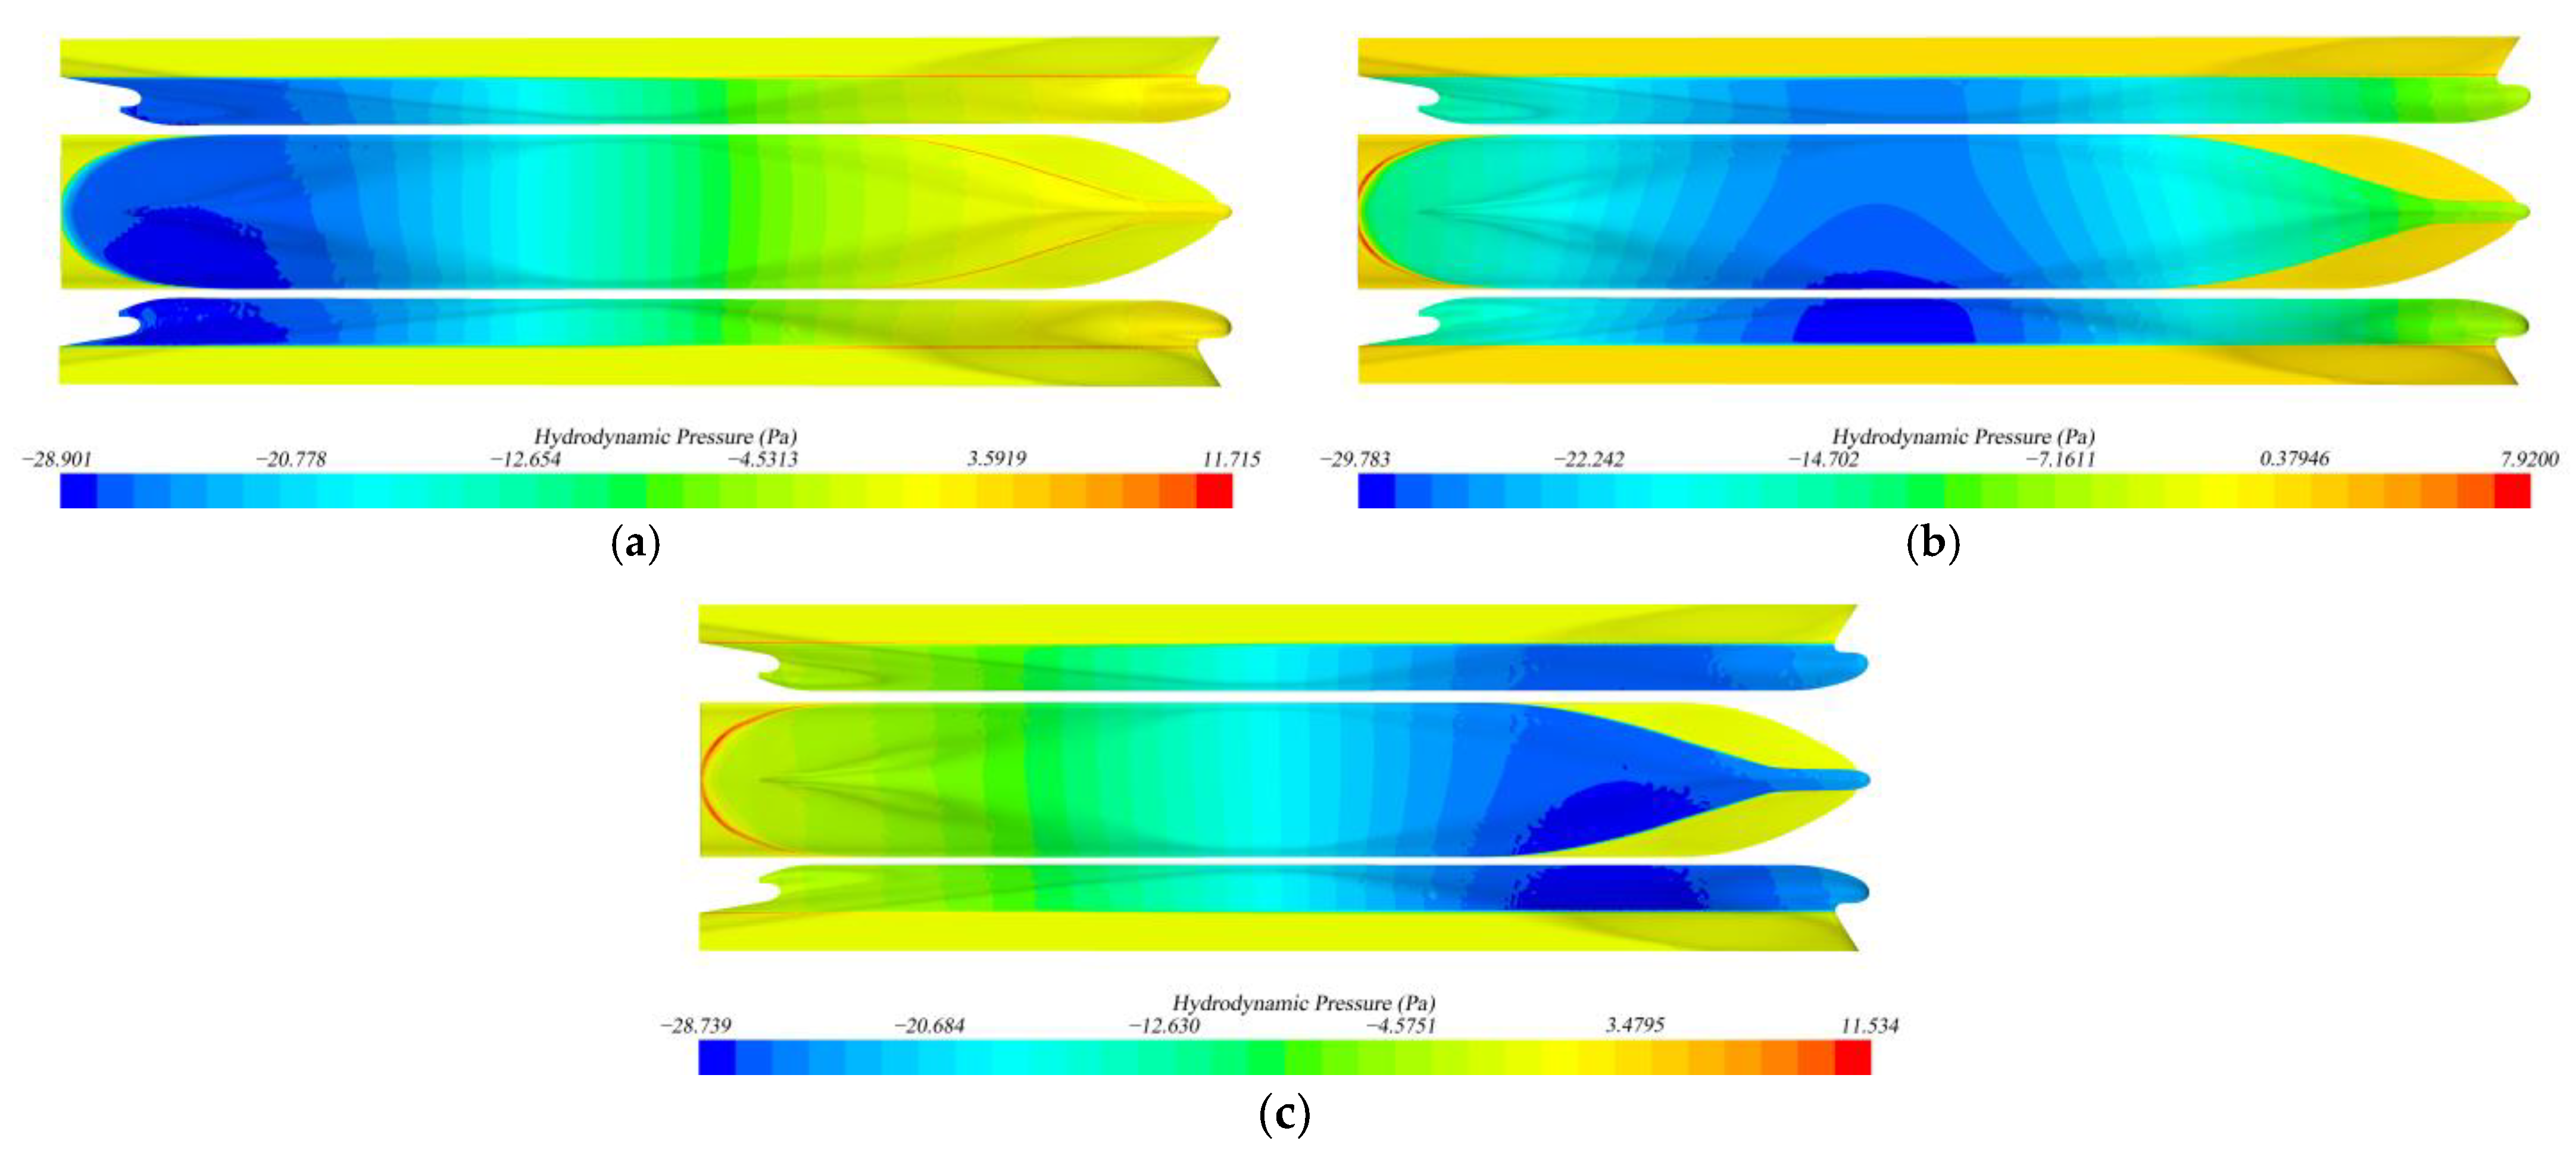
  • Primary wave system effects: The wave systems generated by a moving ship are typically classified into the near-field part and the far-field part [5,7]. The former is attributed to the primary wave system resulting from low-frequency pressure variations due to the presence of the passing ship, which is the dominant part at low speeds, especially under the impacts of confined water effects, while the latter is associated with the high-frequency free waves (Kelvin wave or secondary wave system) generated by the passing ship at higher speeds. It should be noted that the primary wave system is often a major concern for passing ship problems in confined waterways, because it usually causes significant impacts on the ships in the vicinity, while the far-field disturbances by the Kelvin wave system are not negligible when the passing ship is at a high speed. As can be seen from the simulated wave patterns in Figure 7, at a low speed (Fr = 0.1055) of the passing ship, the Kelvin wave system is not evident, while the primary wave system is more prominent. Thus, the impact of the Kelvin wave is negligible. Besides, the primary wave system travels with the passing ship all the time. When the ship is passing the moored ship (55 s < t < 80 s or −2 < ξ < 2), the primary wave system has pronounced hydrodynamic impacts on the moored ship, which generates additional motions of the moored ship, namely more remarkable variations of the ship attitudes, and also more pronounced hydrodynamic forces and moments on the ship.
The flow field results illustrate that the solitary wave and the primary wave system generated by the passing ship are captured well using the present numerical method.
Figure 7. Snapshots of wave patterns (linear acceleration). (a) ξ = −8, (b) ξ = −6, (c) ξ = −4, (d) ξ = −2, (e) ξ = 0, (f) ξ = 2.
Jmse 11 00483 g007aJmse 11 00483 g007b
Figure 8. Time histories of the moored ship attitudes, hydrodynamic quantities, and free-surface elevations (linear acceleration).
Jmse 11 00483 g008

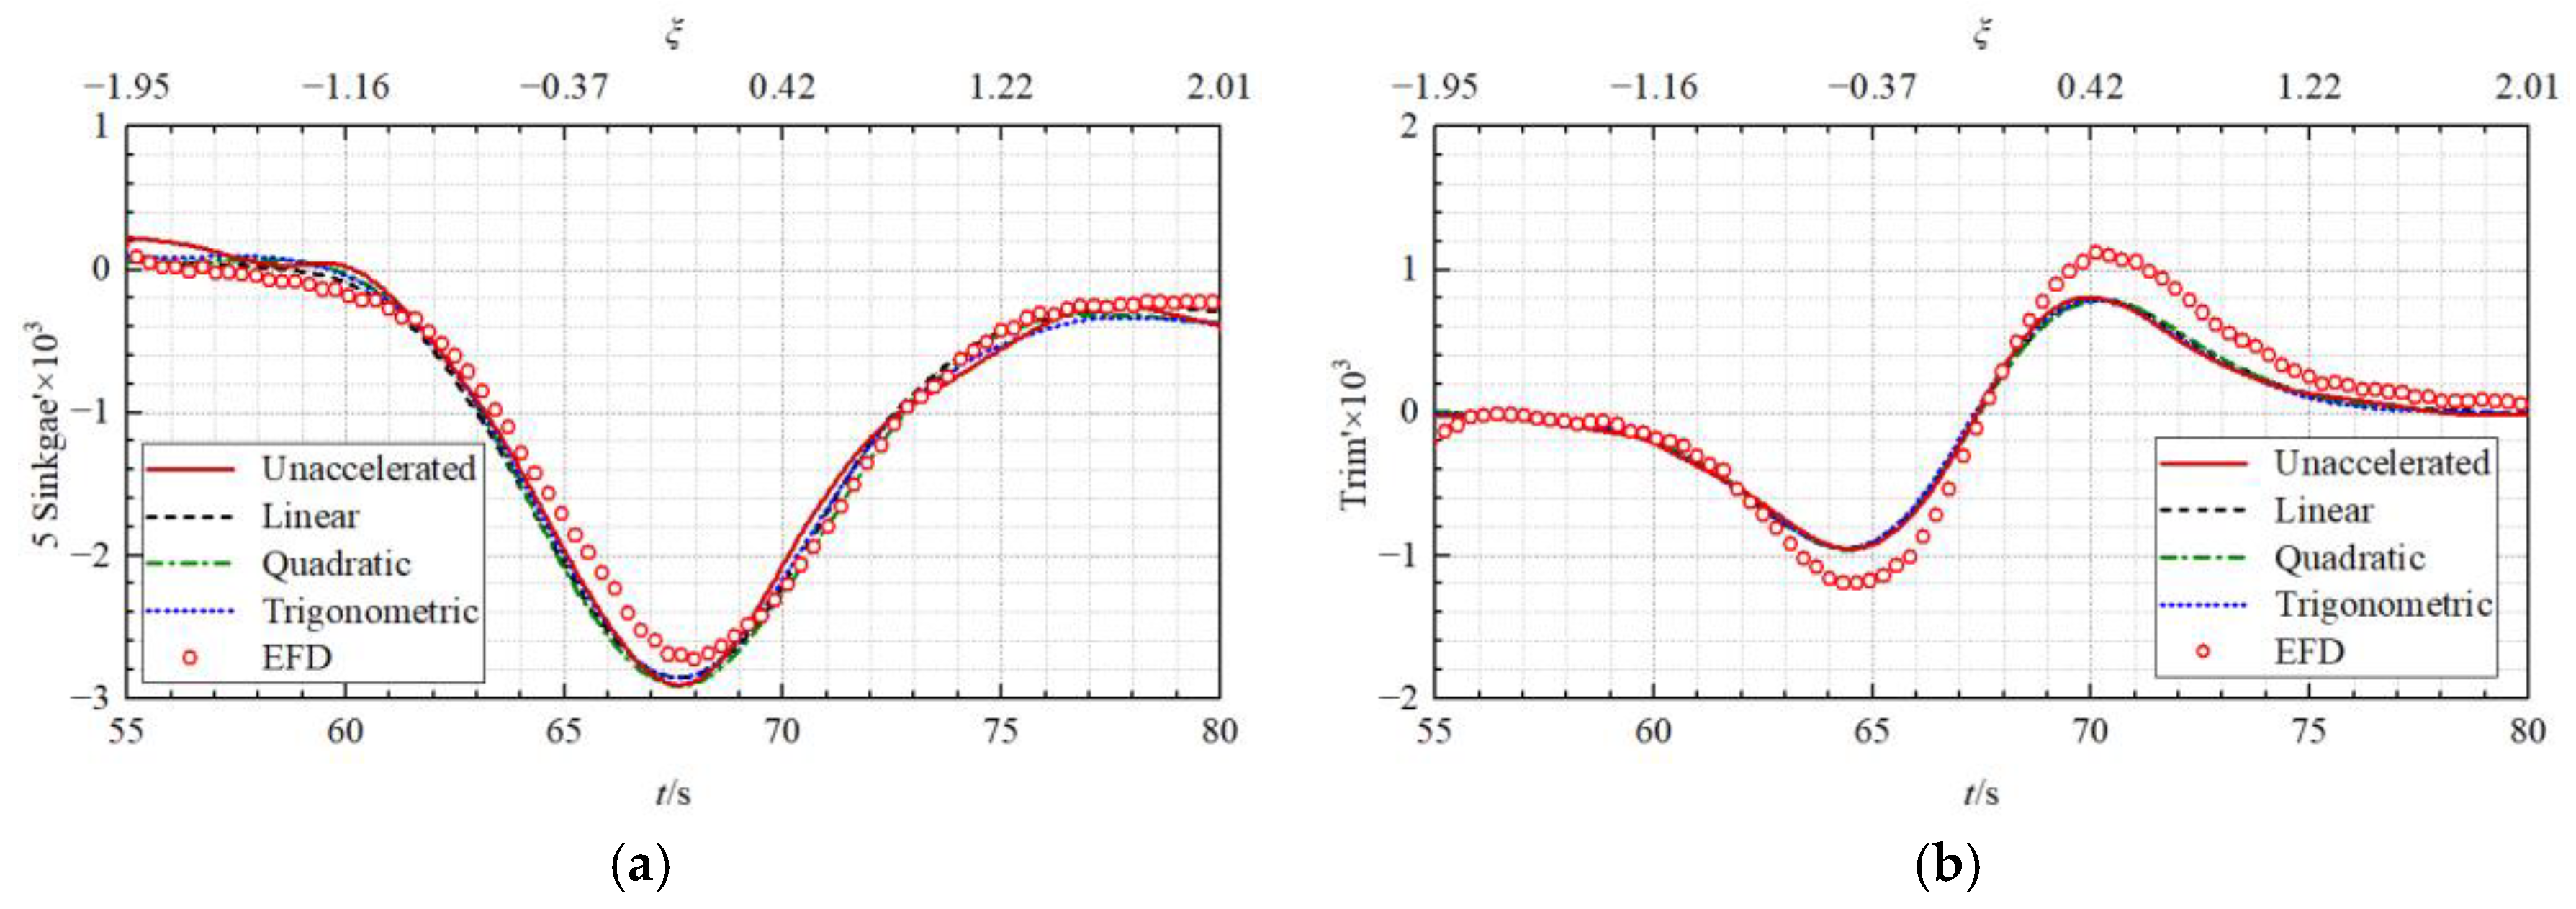
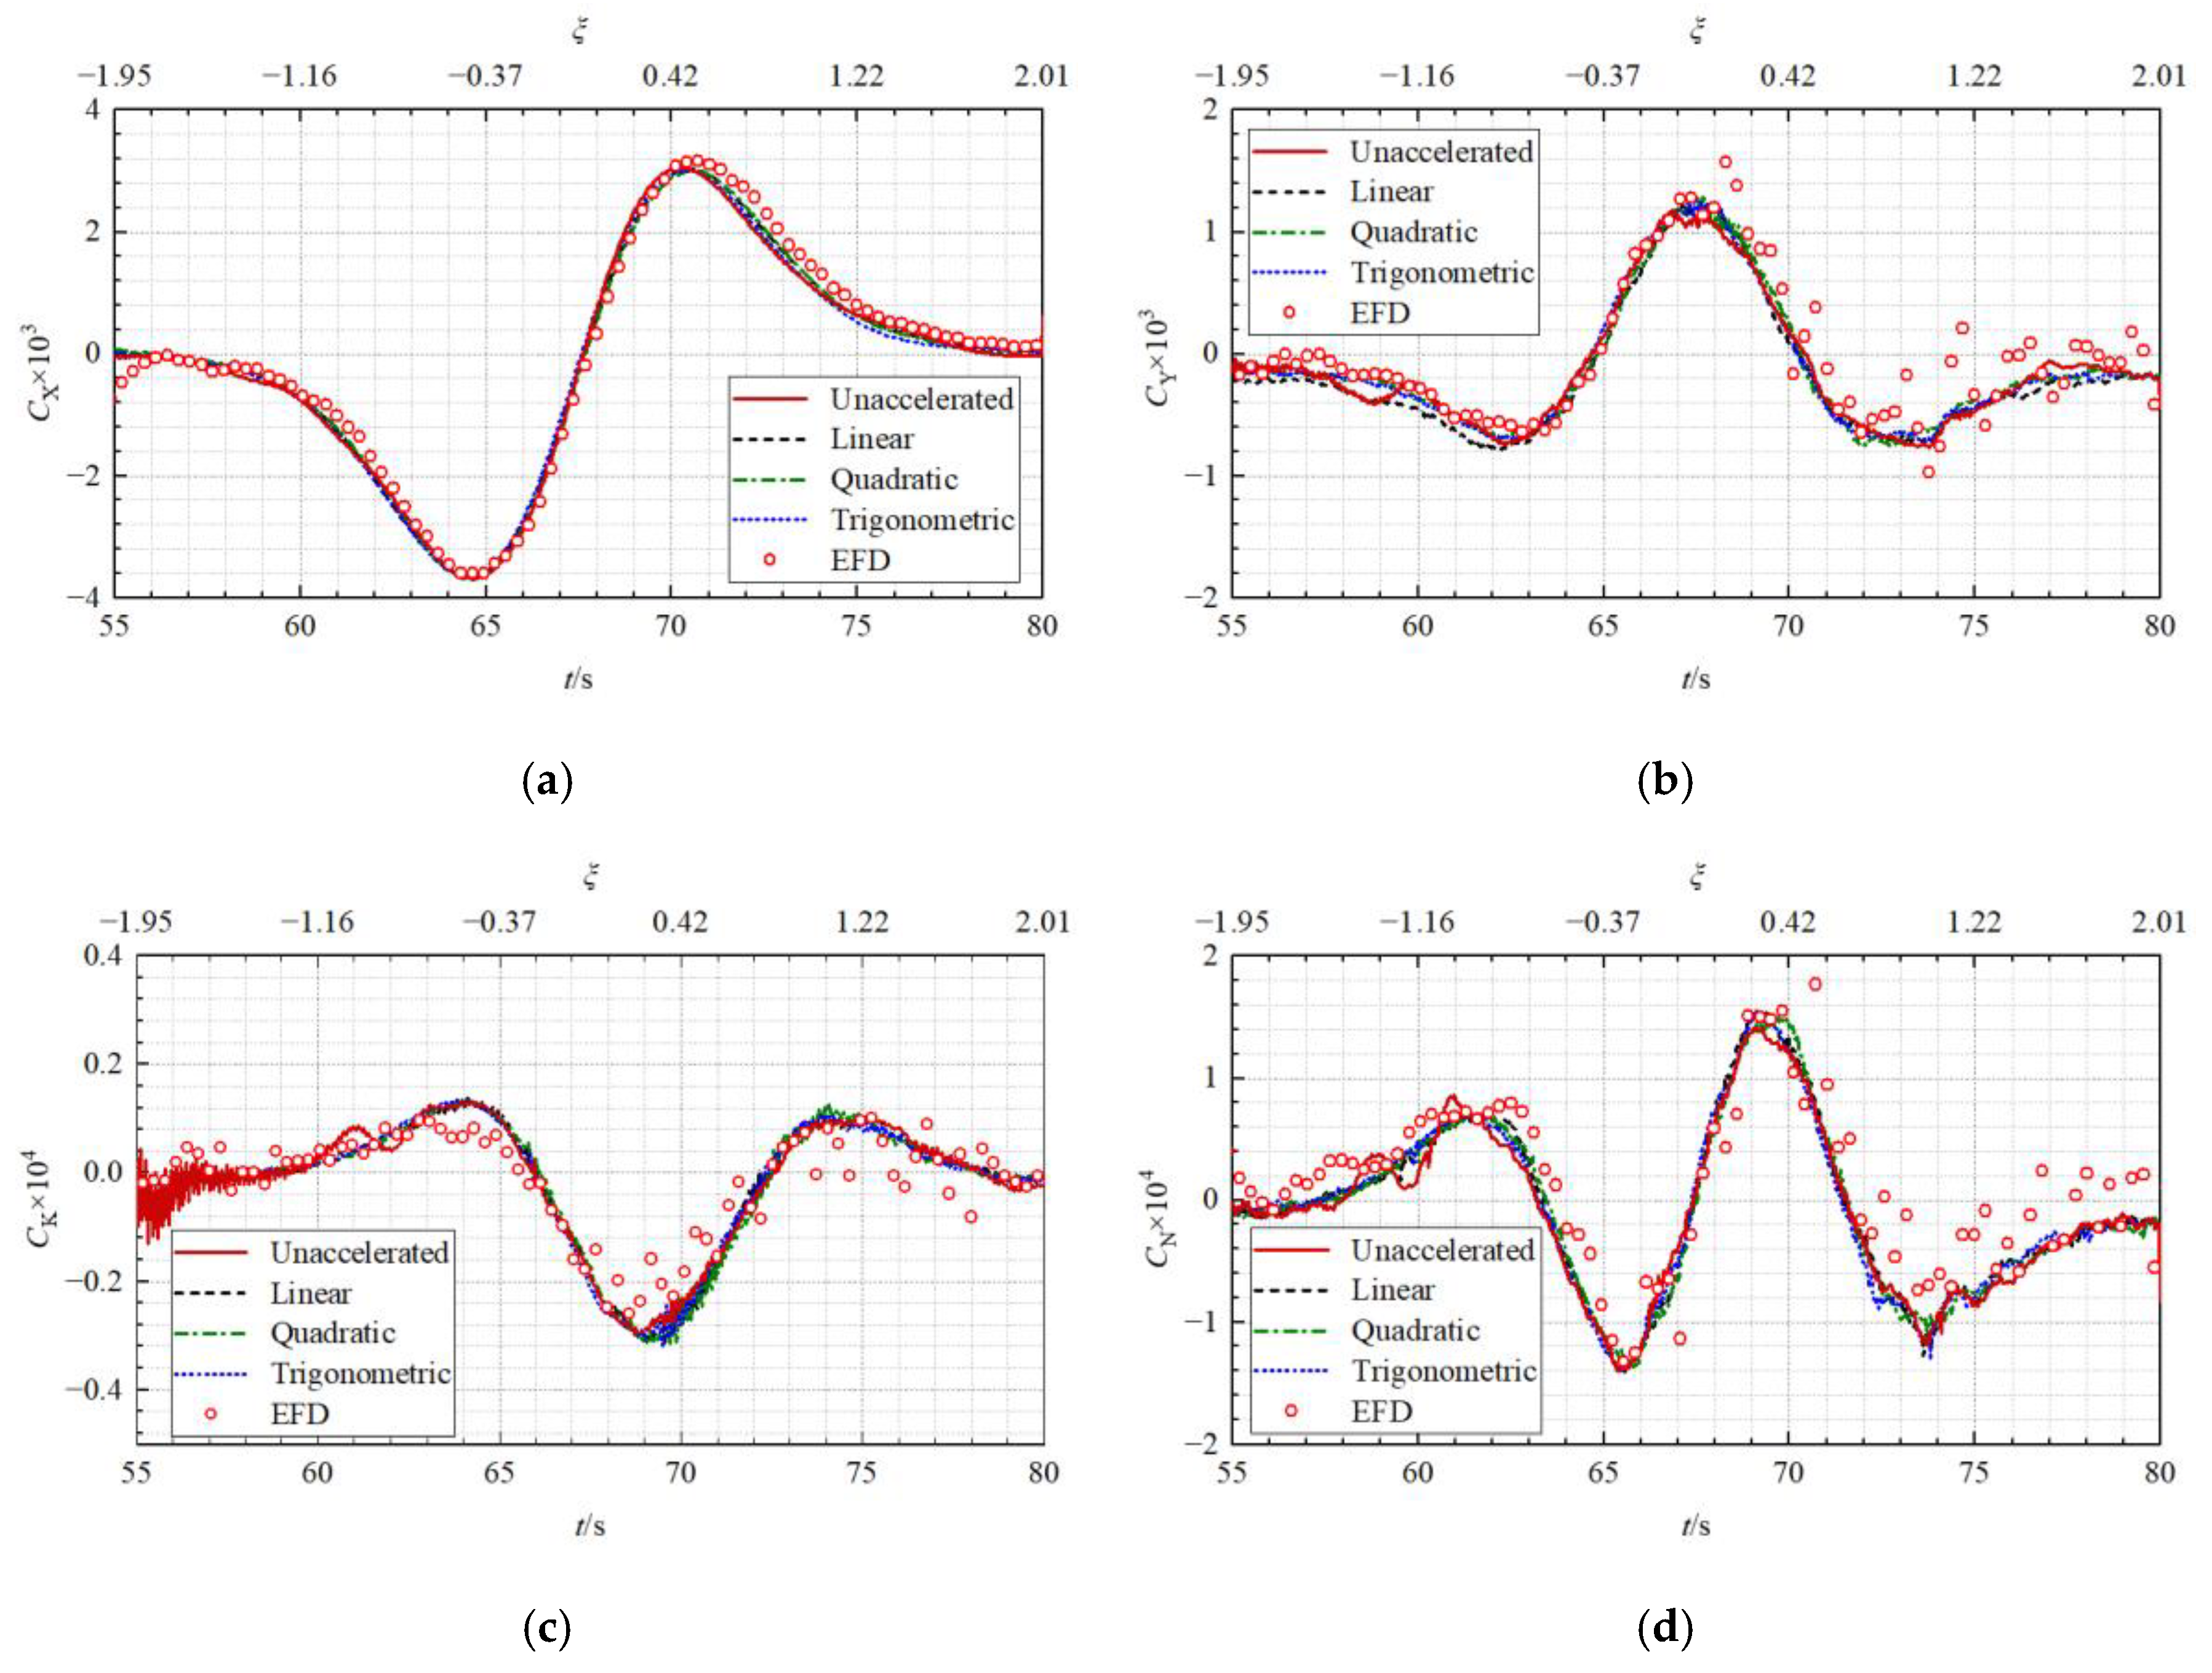
5.2. Influences of Acceleration Process

5.2.1. Accuracy of the Predicted Solitary Wave

In this section, the influences of the acceleration process on the numerical prediction accuracy are discussed. Firstly, the influences of the acceleration modes on the prediction accuracy of the solitary wave and the resulting effects on the moored ship are discussed. Figure 9 shows the time histories of predicted free-surface elevations at the wave gauge position based on different acceleration modes in comparison with the test data (EFD) [13] under the influence of the solitary wave (27 s < t < 43 s or −6.38 < ξ < −3.85). Compared with the test data, the error of the predicted solitary wave without the acceleration process is larger with higher wave height and stronger nonlinearity, while the results considering the acceleration process agree better with the test data, especially under the linear acceleration mode. Figure 10 and Figure 11 present the attitudes and the hydrodynamic quantities of the moored ship under the impact of the solitary wave, which demonstrate again that the numerical predictions based on the linear acceleration mode are better than those without the acceleration process. In addition, it can be found that when the solitary wave is close to the moored ship (30 s < t < 38 s), the ship attitudes, the longitudinal force X, and yaw moment N vary significantly, while the lateral force Y and roll moment K do not obviously change. Overall, although different hydrodynamic quantities are diversely affected by the solitary wave, since the safety of the moored ship is closely related to the additional forces and moments on the ship and the changes in ship attitudes, it is important to consider the initial acceleration process in the numerical simulations to guarantee the prediction accuracy of the solitary wave.

5.2.2. Accuracy of the Predicted Primary Wave System

The influences of the acceleration process on the prediction accuracy of the primary wave system and the resulting effects on the moored ship are discussed in this section. Figure 12 shows the free-surface elevations at the wave gauge position when the moving ship passes the moored ship (55 s < t < 80 s or −2 < ξ < 2), which illustrates that the predicted primary wave systems with different acceleration modes agree with the test data with a high level of accuracy. Figure 13 and Figure 14 illustrate the time histories of the attitudes and the hydrodynamic quantities of the moored ship affected by the primary wave system. It can be found that there are no significant differences between the numerical results with and without the acceleration process, and they are all in good agreement with the test data. Thus, the acceleration process has no obvious influence on the prediction accuracy of the primary wave system. This is understandable since the primary wave system around the passing ship is shown to be stable after the passing ship reaches the constant speed.
In general, the prediction accuracy considering the ship acceleration process is obviously higher than that without the acceleration process, especially for the solitary wave effects, where the numerical results based on the linear acceleration mode agree with the test data best. Since the whole passing process is considered in the present study, the influences of the initial acceleration on both wave systems should be considered.

5.3. Physical Mechanism Analyses

Based on the simulated flow field, this section takes the results of the linear acceleration mode as an example to analyze the physical mechanism of the effects of ship-generated waves on the moored ship. Figure 15 shows the pressure distributions on the moored ship when the solitary wave crest passes the stern (t ≈ 32.5 s or ξ ≈ −5.51), the midship (t ≈ 34 s or ξ ≈ −5.27), and the bow (t ≈ 35.5 s or ξ ≈ −5.04) of the moored ship. As the figure demonstrates, the solitary wave causes a positive pressure region on the hull, along with the dominant upward sinkage of the moored ship; when the solitary wave is approaching the midship, the sinkage reaches its maximum value. When the solitary wave is close to the stern or the bow of the moored ship, it results in a positive-to-negative change in the trim of the moored ship since the pressures on the aft-part and the fore-part are not balanced with each other (see Figure 10). In addition, the longitudinal force and yaw moment acting on the moored ship (see Figure 11) are also due to the imbalance of pressure distributions.
Figure 16 shows the pressure distributions on the moored ship affected by the primary wave system when the passing ship approaches the stern (t = 64.79 s or ξ = −0.4), the midship (t = 67.32 s or ξ = 0), and the bow (t = 69.84 s or ξ = 0.4) of the moored ship, which is helpful to explain the features of the above-mentioned hydrodynamic quantities. It should be noted that the most significant difference between the effects of the solitary wave and the primary wave system is that the former causes a positive pressure region on the hull of the moored ship, while the latter induces a negative pressure region. This is because the solitary wave system behaves like a crest, while the primary wave system mainly behaves like a trough or drawdown (i.e., a notable water level drop). Contrary to the solitary wave, the primary wave system results in a remarkable downward sinkage and a negative-to-positive change in trim (see Figure 13), as well as a more pronounced lateral force and roll moment. Moreover, the longitudinal force and the yaw moment affected by the primary wave system (Figure 14) vary in an opposite way to those under the impact of the solitary wave (Figure 11).

6. Conclusions

Aiming at developing a reliable numerical method to predict and investigate the effects of ship waves generated by a passing ship on a moored ship in restricted waterways, this paper takes the benchmark model test case in the MASHCON2022 conference as the study object and numerically simulates the whole process of a ship passing a moored ship by solving the URANS equations along with the dynamic overset mesh technique. The initial acceleration process of the passing ship is considered in the numerical simulations to reproduce the benchmark model test more realistically. In the present study, the numerical simulations with four acceleration modes are conducted, and the numerical results are compared with the model test data. The results show that the effects of waves generated by the passing ship on the moored ship in restricted waterways can be divided into the solitary wave effects and the primary wave effects. The comparisons between the numerical results and the test data indicate that the prediction accuracy considering the ship acceleration process is obviously higher than that without the acceleration process, especially for the predictions of the solitary wave effects, where the numerical results based on the linear acceleration mode agree best with the test data. On this basis, the physical mechanisms of the effects of ship-generated waves on the moored ship in restricted waterways are analyzed. It is found that the solitary wave with pronounced crest features causes significant positive pressures on the hull of the moored ship, while the primary wave system with pronounced trough or drawdown features induces remarkable negative pressures. Both wave systems have significant impacts on the attitude variations of the moored ship, which are closely related to the stability or safety of the moored ship. Therefore, the influences of both wave systems should be considered during the whole passing process.
Moreover, the present paper applies a sufficiently long initial distance between the passing ship and the moored ship in the simulations to obtain more stable flow fields. It would be helpful to evaluate the value of the distance to balance the computational accuracy and cost for the ship-ship interactions in restricted waters. This will be the focus of the future study.

Author Contributions

Conceptualization, Z.Z. (Ziqiang Zheng) and L.Z.; methodology, Z.Z. (Ziqiang Zheng); software, Z.Z. (Ziqiang Zheng); validation, Z.Z. (Ziqiang Zheng), L.Z. and Z.Z. (Zaojian Zou); formal analysis, Z.Z. (Ziqiang Zheng); investigation, L.Z.; resources, Z.Z. (Ziqiang Zheng); data curation, L.Z.; writing—original draft preparation, Z.Z. (Ziqiang Zheng); writing—review and editing, L.Z. and Z.Z. (Zaojian Zou); visualization, Z.Z. (Ziqiang Zheng); supervision, L.Z. and Z.Z. (Zaojian Zou); project administration, L.Z.; funding acquisition, L.Z. All authors have read and agreed to the published version of the manuscript.

Funding

This work is supported by the National Natural Science Foundation of China [Grant No. 51979164].

Institutional Review Board Statement

Not applicable.

Informed Consent Statement

Not applicable.

Data Availability Statement

The data in this article are true and valid. The data presented in this study are available in this article.

Acknowledgments

The authors thank Flanders Hydraulics Research and Ghent University for providing the MASHCON benchmark test data and for the constructive discussions.

Conflicts of Interest

The authors declare no conflict of interest. The funders had no role in the design of the study; in the collection, analyses, or interpretation of data; in the writing of the manuscript; or in the decision to publish the results.

References

  1. Pinkster, J.A.; Keuning, J.A. Prediction of the effects of fast passing vessels on moored vessels. In Proceedings of the 32nd International Conference on Ocean, Offshore and Arctic Engineering, New York, NY, USA, 9–14 June 2013. [Google Scholar]
  2. Pinkster, J.A.; Ruijter, M.N. The influence of passing ships on ships moored in restricted waters. In Proceedings of the Offshore Technology Conference, Houston, TX, USA, 3–6 May 2004. [Google Scholar]
  3. Almström, B.; Larson, M. Measurements and analysis of primary ship waves in the Stockholm Archipelago, Sweden. J. Mar. Sci. Eng. 2020, 8, 743. [Google Scholar] [CrossRef]
  4. Göransson, G.; Larson, M.; Althage, J. Ship-generated waves and induced turbidity in the Göta Älv River in Sweden. J. Waterw. Port Coast. Ocean Eng. 2014, 140, 04014004. [Google Scholar] [CrossRef]
  5. Pinkster, J.A.; Rotterdam, B.V. Suction, seiche and wash effects of passing ships in ports. In Proceedings of the SNAME Maritime Convention, Rotterdam, The Netherlands, 21 October 2009; pp. 99–124. [Google Scholar]
  6. Pinkster, J.A.; Naaijien, P. Predicting the effect of passing ships. In Proceedings of the 18th International Workshop on Water Waves and Floating Bodies, Le Croisic, France, 6–9 April 2003. [Google Scholar]
  7. Zhou, L.; Abdelwahab, H.S.; Guedes Soares, C. Experimental and CFD investigation of the effects of a high-speed passing ship on a moored container ship. Ocean Eng. 2021, 228, 108914. [Google Scholar] [CrossRef]
  8. Maneuvering Committee of International Towing Tank Conference. Final Report and Recommendations to the 29th ITTC. In Proceedings of the 29th International Towing Tank Conference, Virtual, 13–18 June 2021.
  9. Remery, G.F. Mooring forces induced by passing ships. In Proceedings of the Offshore Technology Conference, Houston, TX, USA, 5–7 May 1974. [Google Scholar]
  10. Vantorre, M.; Verzhbitskaya, E.; Laforce, E. Model test based formulations of ship-ship interaction forces. Ship Technol. Res. 2002, 49, 124–141. [Google Scholar]
  11. Duffy, J.T.; Renilson, M.R. The importance of the form of time domain forces and moments on berthed ship interaction. In Proceedings of the 2nd International Conference on Ship Manoeuvering in Shallow and Confined Water: Ship to Ship Interactions, Trondheim, Norway, 18–20 May 2011; pp. 107–116. [Google Scholar]
  12. Lataire, E.; Vantorre, M.; Vandenbroucke, J.; Eloot, K. Ship to ship interaction forces during lightering operations. In Proceedings of the 2nd International Conference on Ship Manoeuvring in Shallow and Confined Water: Ship to Ship Interaction, Trondheim, Norway, 18–20 May 2011; pp. 211–221. [Google Scholar]
  13. Van Zwijnsvoorde, T.; Delefortrie, G.; Lataire, E. Passing ship effects in shallow and confined water: Open model test data for validation purposes. In Proceedings of the 6th MASHCON International Conference on Ship Manoeuvring in Shallow and Confined Water, Glasgow, UK, 22–26 May 2022; pp. 255–283. [Google Scholar]
  14. Van der Molen, W.; Moes, J.; Swiegers, P.B.; Vantorre, M. Calculation of forces on moored ships due to passing ships in shallow water. In Proceedings of the 2nd International Conference on Ship Manoeuvring in Shallow and Confined Water: Ship to Ship Interaction, Trondheim, Norway, 18–20 May 2011; pp. 369–374. [Google Scholar]
  15. Talstra, H.; Bliek, A.J. Loads on moored ships due to passing ship in a straight harbour channel. In Proceedings of the 33rd PIANC International Navigation Congress, San Francisco, CA, USA, 1–5 June 2014; pp. 206–224. [Google Scholar]
  16. Yuan, Z.M.; Li, L.; Yeung, R.W. Free-surface effects on interaction of multiple ships moving at different speeds. J. Ship Res. 2019, 63, 251–267. [Google Scholar] [CrossRef]
  17. Degrieck, A.; Uyttersprot, B.; Sutulo, S.; Guedes Soares, C.; Van Hoydonck, W.; Vantorre, M.; Lataire, E. Hydrodynamic ship-ship and ship-bank interaction: A comparative numerical study. Ocean Eng. 2021, 230, 108970. [Google Scholar] [CrossRef]
  18. Sadat-Hosseini, H.; Wu, P.C.; Toda, Y.; Carrica, P.; Stern, F. URANS studies of ship-ship interactions in shallow water. In Proceedings of the 2nd International Conference on Ship Manoeuvring in Shallow and Confined Water: Ship to Ship Interaction, Trondheim, Norway, 18–20 May 2011; pp. 299–308. [Google Scholar]
  19. Zou, L.; Larsson, L. Numerical predictions of ship-to-ship interaction in shallow water. Ocean Eng. 2013, 72, 386–402. [Google Scholar] [CrossRef]
  20. Kwon, C.; Yeon, S. A study on the numerical captive model tests for ships in shallow and confined waters using CFD: Comparative study for PESCA (passing effects in shallow and confined areas) project. In Proceedings of the 6th MASHCON International Conference on Ship Manoeuvring in Shallow and Confined Water, Glasgow, UK, 22–26 May 2022; pp. 119–127. [Google Scholar]
  21. Yu, J.; Liu, L.; Zhang, Z.; Yao, C.; Feng, D.; Wang, X. Numerical investigation of passing ship effects in shallow and confined water using Ship-HUST code. In Proceedings of the 6th MASHCON International Conference on Ship Manoeuvring in Shallow and Confined Water, Glasgow, UK, 22–26 May 2022; pp. 310–318. [Google Scholar]
  22. Zheng, Z.Q.; Zou, L.; Zou, Z.J. A numerical investigation on the ship-ship interaction between a passing ship and a moored ship in restricted waterways. In Proceedings of the 6th MASHCON International Conference on Ship Manoeuvring in Shallow and Confined Water, Glasgow, UK, 22–26 May 2022; pp. 344–355. [Google Scholar]
  23. Denehy, S.P. Modelling of Berthed Ship-Passing Ship Interaction Forces and Moments in Shallow and Confined Water. Ph.D. Thesis, University of Tasmania, Tasmania, Australia, 2022. [Google Scholar]
  24. Pawar, R.; Bhar, A.; Dhavalikar, S. Numerical prediction of hydrodynamic forces on a moored ship due to a passing ship. Proc. Inst. Mech. Eng. Part M J. Eng. Marit. Environ. 2019, 233, 575–585. [Google Scholar] [CrossRef]
  25. Alisal, S.M. Some experimental results with ship model acceleration waves. J. Ship Res. 1981, 25, 181–190. [Google Scholar] [CrossRef]
  26. Mao, L.; Li, X.; Chen, Y. Numerical investigation of ship waves and associated hydrodynamics over a sloping bed with a non-hydrostatic model. J. Offshore Mech. Arct. Eng. 2022, 145, 031201. [Google Scholar] [CrossRef]
  27. Terziev, M.; Zhao, G.; Tezdogan, T.; Yuan, Z.M.; Incecik, A. Virtual replica of a towing tank experiment to determine the Kelvin half-angle of a ship in restricted water. J. Mar. Sci. Eng. 2020, 8, 258. [Google Scholar] [CrossRef] [Green Version]
  28. Li, M.; Yuan, Z.M.; Yeung, R.W. Unsteady wave-making resistance of an accelerating ship. In Proceedings of the 39th International Conference on Ocean, Offshore and Arctic Engineering, Virtual Online, 3–7 August 2020. [Google Scholar]
  29. Lungu, A. CFD prediction of ship-bank interaction. In Proceedings of the 7th Conference of the Sustainable Solutions for Energy and Environment, Virtual Online, 21–24 October 2020. [Google Scholar]
  30. Shih, T.H.; Liou, W.W.; Shabbir, A.; Yang, Z.; Zhu, J. A new k-ε eddy viscosity model for high Reynolds number turbulent flows. Comput. Fluids 1995, 24, 227–238. [Google Scholar] [CrossRef]
  31. Wnęk, A.D.; Sutulo, S.; Guedes Soares, C. CFD analysis of ship-to-ship hydrodynamic interaction. J. Mar. Sci. Appl. 2018, 17, 21–37. [Google Scholar] [CrossRef]
  32. Hadzic, H. Development and Application of Finite Volume Method for the Computation of Flows around Moving Bodies on Unstructured, Overlapping Grids. Ph.D. Thesis, Technische Universität Hamburg, Hamburg, Germany, 2005. [Google Scholar]
  33. Ohmori, T. Finite-volume simulation of flows about a ship in maneuvering motion. J. Mar. Sci. Technol. 1998, 3, 82–93. [Google Scholar] [CrossRef]
  34. Maneuvering Committee of International Towing Tank Conference. Final Report and Recommendations to the 28th ITTC. In Proceedings of the 28th International Towing Tank Conference, Wuxi, China, 17–22 September 2017.
  35. Celik, I.B.; Ghia, U.; Roache, P.J.; Freitas, C.J.; Coleman, H.; Raad, P.E. Procedure for estimation and reporting of uncertainty due to discretization in CFD applications. J. Fluids Eng. 2008, 130, 078001. [Google Scholar]
Figure 1. Hull geometries of the two ships. (a) KCS, (b) Neo-Panamax.
Jmse 11 00483 g001
Figure 3. Computational domain and boundary conditions.
Jmse 11 00483 g003
Figure 4. Mesh distributions. (a) Mesh distributions on the undisturbed free surface, (b) Mesh distributions around the passing ship, (c) Mesh distributions around the moored ship.
Jmse 11 00483 g004
Figure 5. Distributions of y+ on the passing ship hull.
Jmse 11 00483 g005
Figure 6. Time histories of passing speed in the numerical simulations.
Jmse 11 00483 g006
Figure 9. Time histories of free-surface elevations at the wave gauge position under the impacts of the solitary wave system.
Jmse 11 00483 g009
Figure 10. Time histories of attitudes of the moored ship under the impacts of the solitary wave system. (a) Sinkage’, (b) Trim’.
Jmse 11 00483 g010
Figure 11. Time histories of hydrodynamic quantities of the moored ship under the impacts of the solitary wave system. (a) CX, (b) CY, (c) CK, (d) CN.
Jmse 11 00483 g011
Figure 12. Time histories of free-surface elevations at the wave gauge position under the impacts of the primary wave system.
Jmse 11 00483 g012
Figure 13. Time histories of the attitudes of the moored ship under the impacts of the primary wave system. (a) Sinkage’, (b) Trim’.
Jmse 11 00483 g013
Figure 14. Time histories of hydrodynamic quantities of the moored ship under the impacts of the primary wave system. (a) CX, (b) CY, (c) CK, (d) CN.
Jmse 11 00483 g014
Figure 15. Pressure distributions on the moored ship affected by the solitary wave system. (a) Solitary wave crest passing the stern, (b) Solitary wave crest passing the midship, (c) Solitary wave crest passing the bow.
Jmse 11 00483 g015
Figure 16. Pressure distributions on the moored ship affected by the primary wave system. (a) Primary wave trough passing the stern, (b) Primary wave trough passing the midship, (c) Primary wave trough passing the bow.
Jmse 11 00483 g016
Table 1. Main particulars of the two ships.
Main ParticularsSymbolUnitsKCSNeo-Panamax
Scale ratioλ-1/801/80
Length between perpendicularsLppm4.3674.350
BreadthBm0.6110.610
DraftTm0.1900.190
Ship massmkg320.6326.2
Wetted surface areaSm23.3043.361
Longitudinal centre of gravityxGm−0.048−0.114
Vertical centre of gravityzGm0.003−0.002
Inertia moment around x-axisIxxkgm211.911.2
Inertia moment around y-axisIyykgm2367.4396.6
Inertia moment around z-axisIzzkgm2385.8376.1
Table 3. Mesh configurations.
Mesh SetBasic Size (m)Number of Mesh Cells (Million)
BackgroundOversetTotal
Coarse0.11891.470.832.29
Medium0.12.411.123.53
Fine0.08413.801.615.41
Table 4. Mesh convergence results.
CXCYCKCN
ϕ1−3.745 × 10−31.332 × 10−3−0.305 × 10⁻⁴−1.399 × 10⁻⁴
ϕ2−3.667 × 10−31.224 × 10−3−0.316 × 10⁻⁴−1.403 × 10⁻⁴
ϕ3−3.552 × 10−31.484 × 10−3−0.337 × 10⁻⁴−1.610 × 10⁻⁴
R0.68−0.410.560.02
Convergence typeMon. Con.Osc. Con.Mon. Con.Mon. Con.
ϕ0−3.908 × 10−31.408 × 10−3−0.290 × 10⁻⁴−1.399 × 10⁻⁴
e14.17%5.42%5.04%0.01%
e26.16%13.09%9.02%0.36%
GCI5.44%7.17%5.99%0.01%
Disclaimer/Publisher’s Note: The statements, opinions and data contained in all publications are solely those of the individual author(s) and contributor(s) and not of MDPI and/or the editor(s). MDPI and/or the editor(s) disclaim responsibility for any injury to people or property resulting from any ideas, methods, instructions or products referred to in the content.

