
Life-Cycle Cost Assessment Using the Power Spectral Density Function in a Coastal Concrete Bridge


Abstract
:1. Introduction
2. Materials and Methods
2.1. Goal and Scope Definition
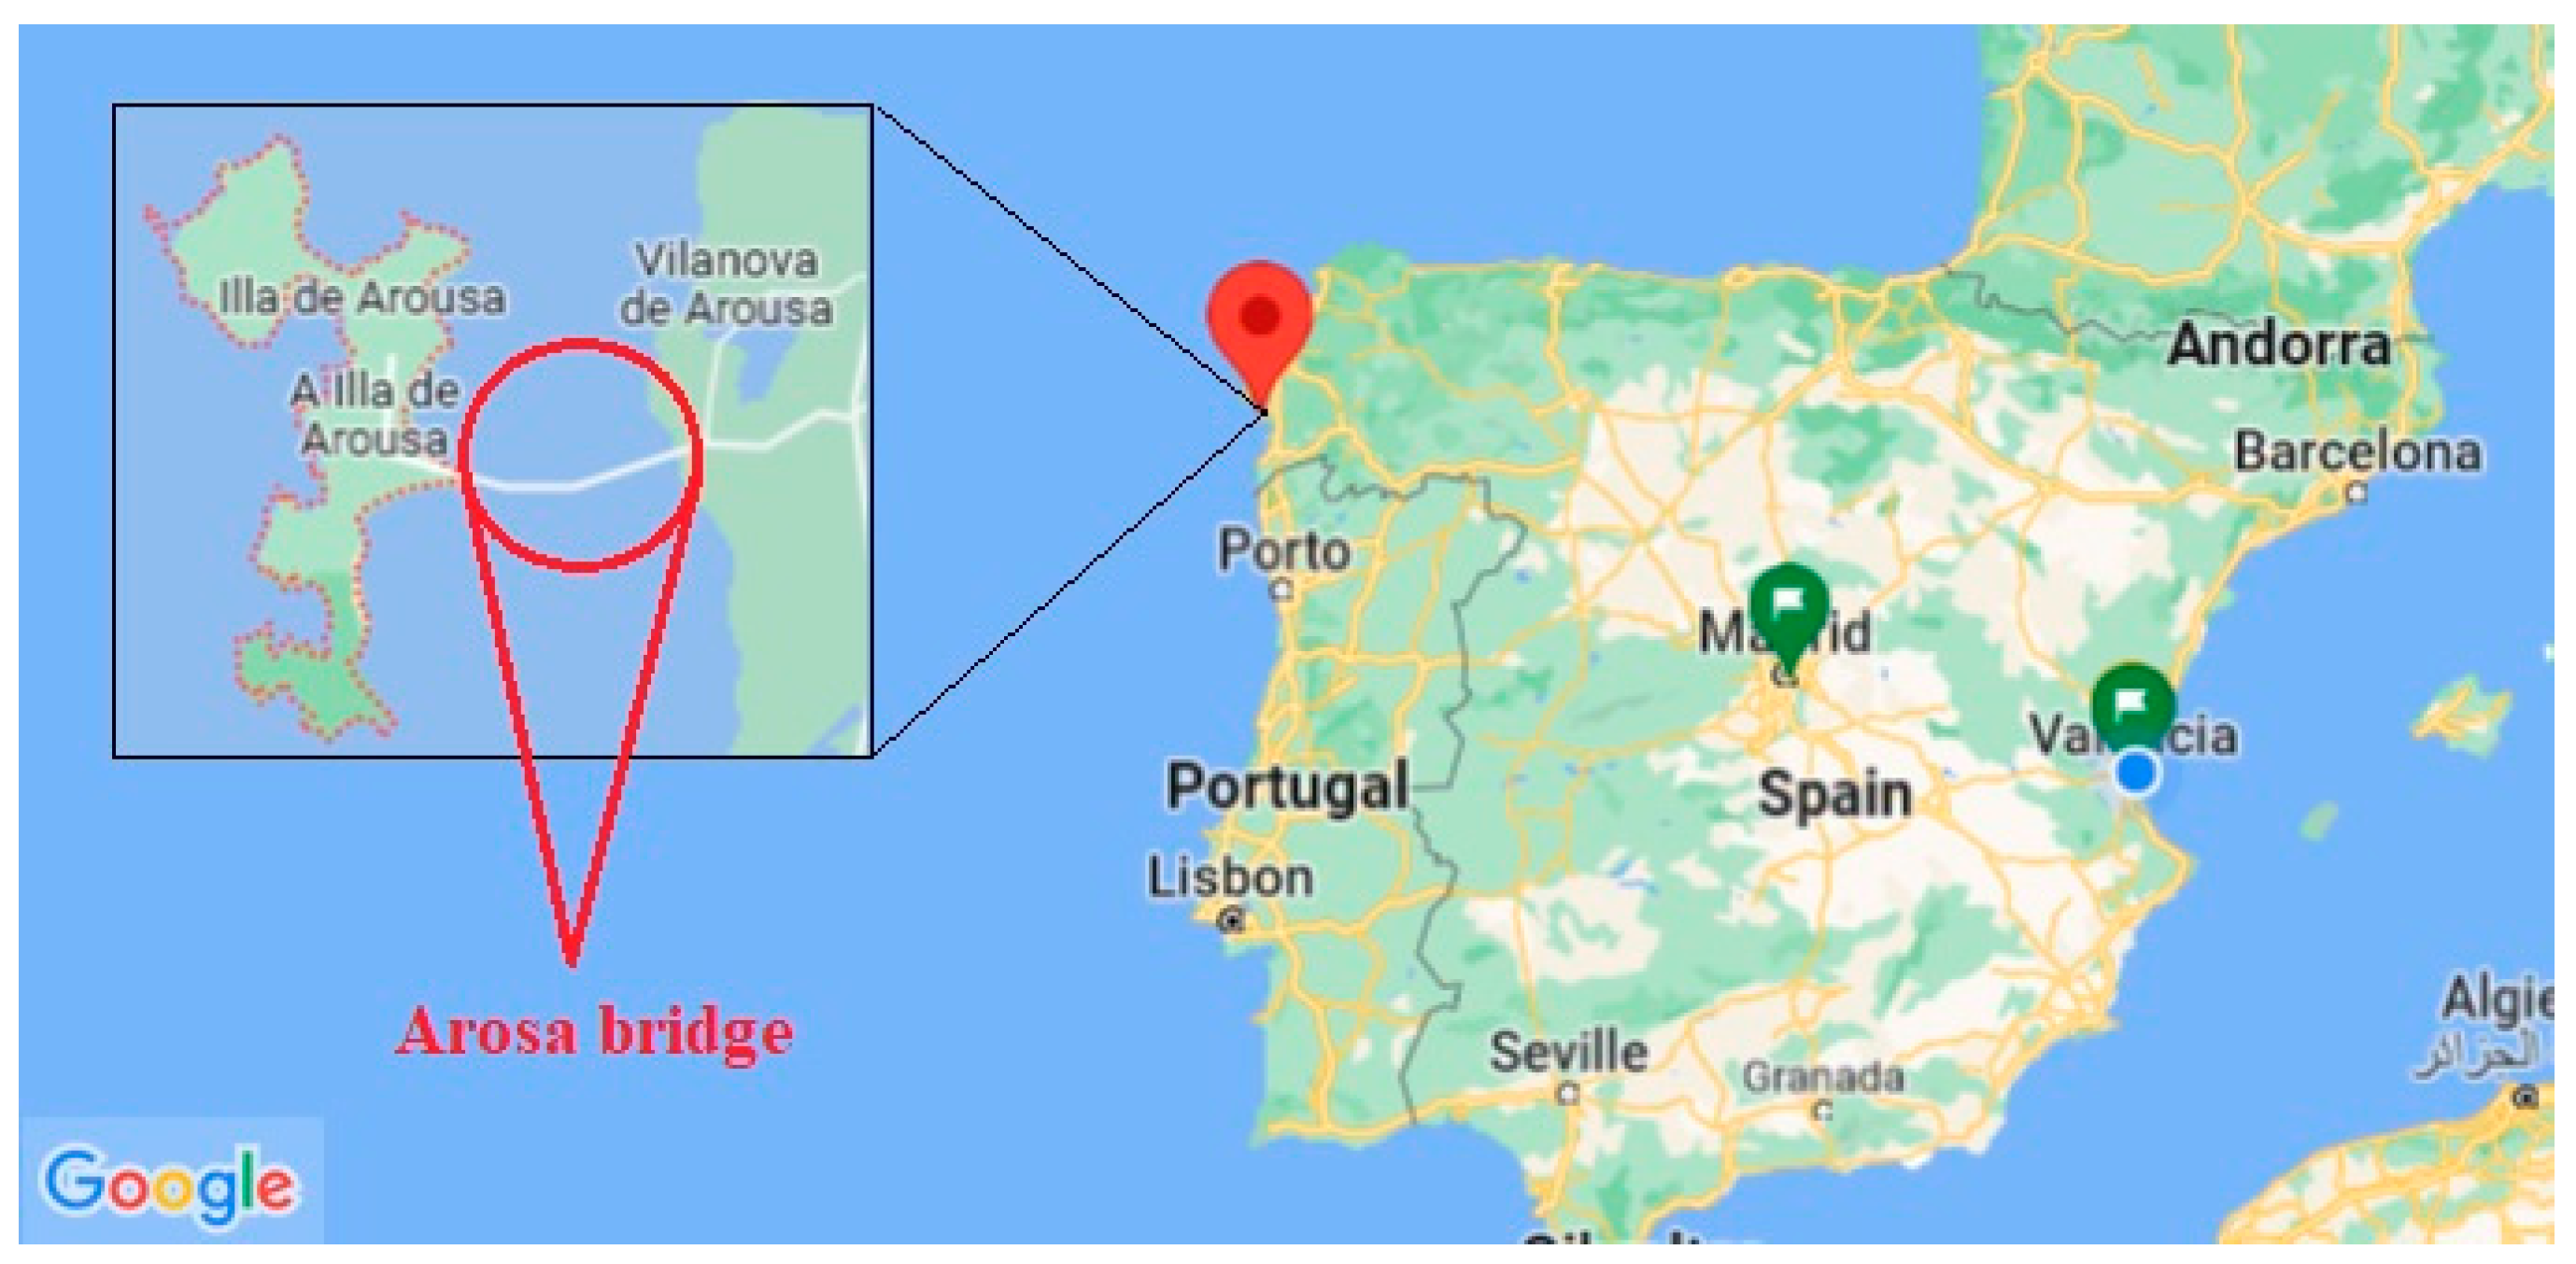
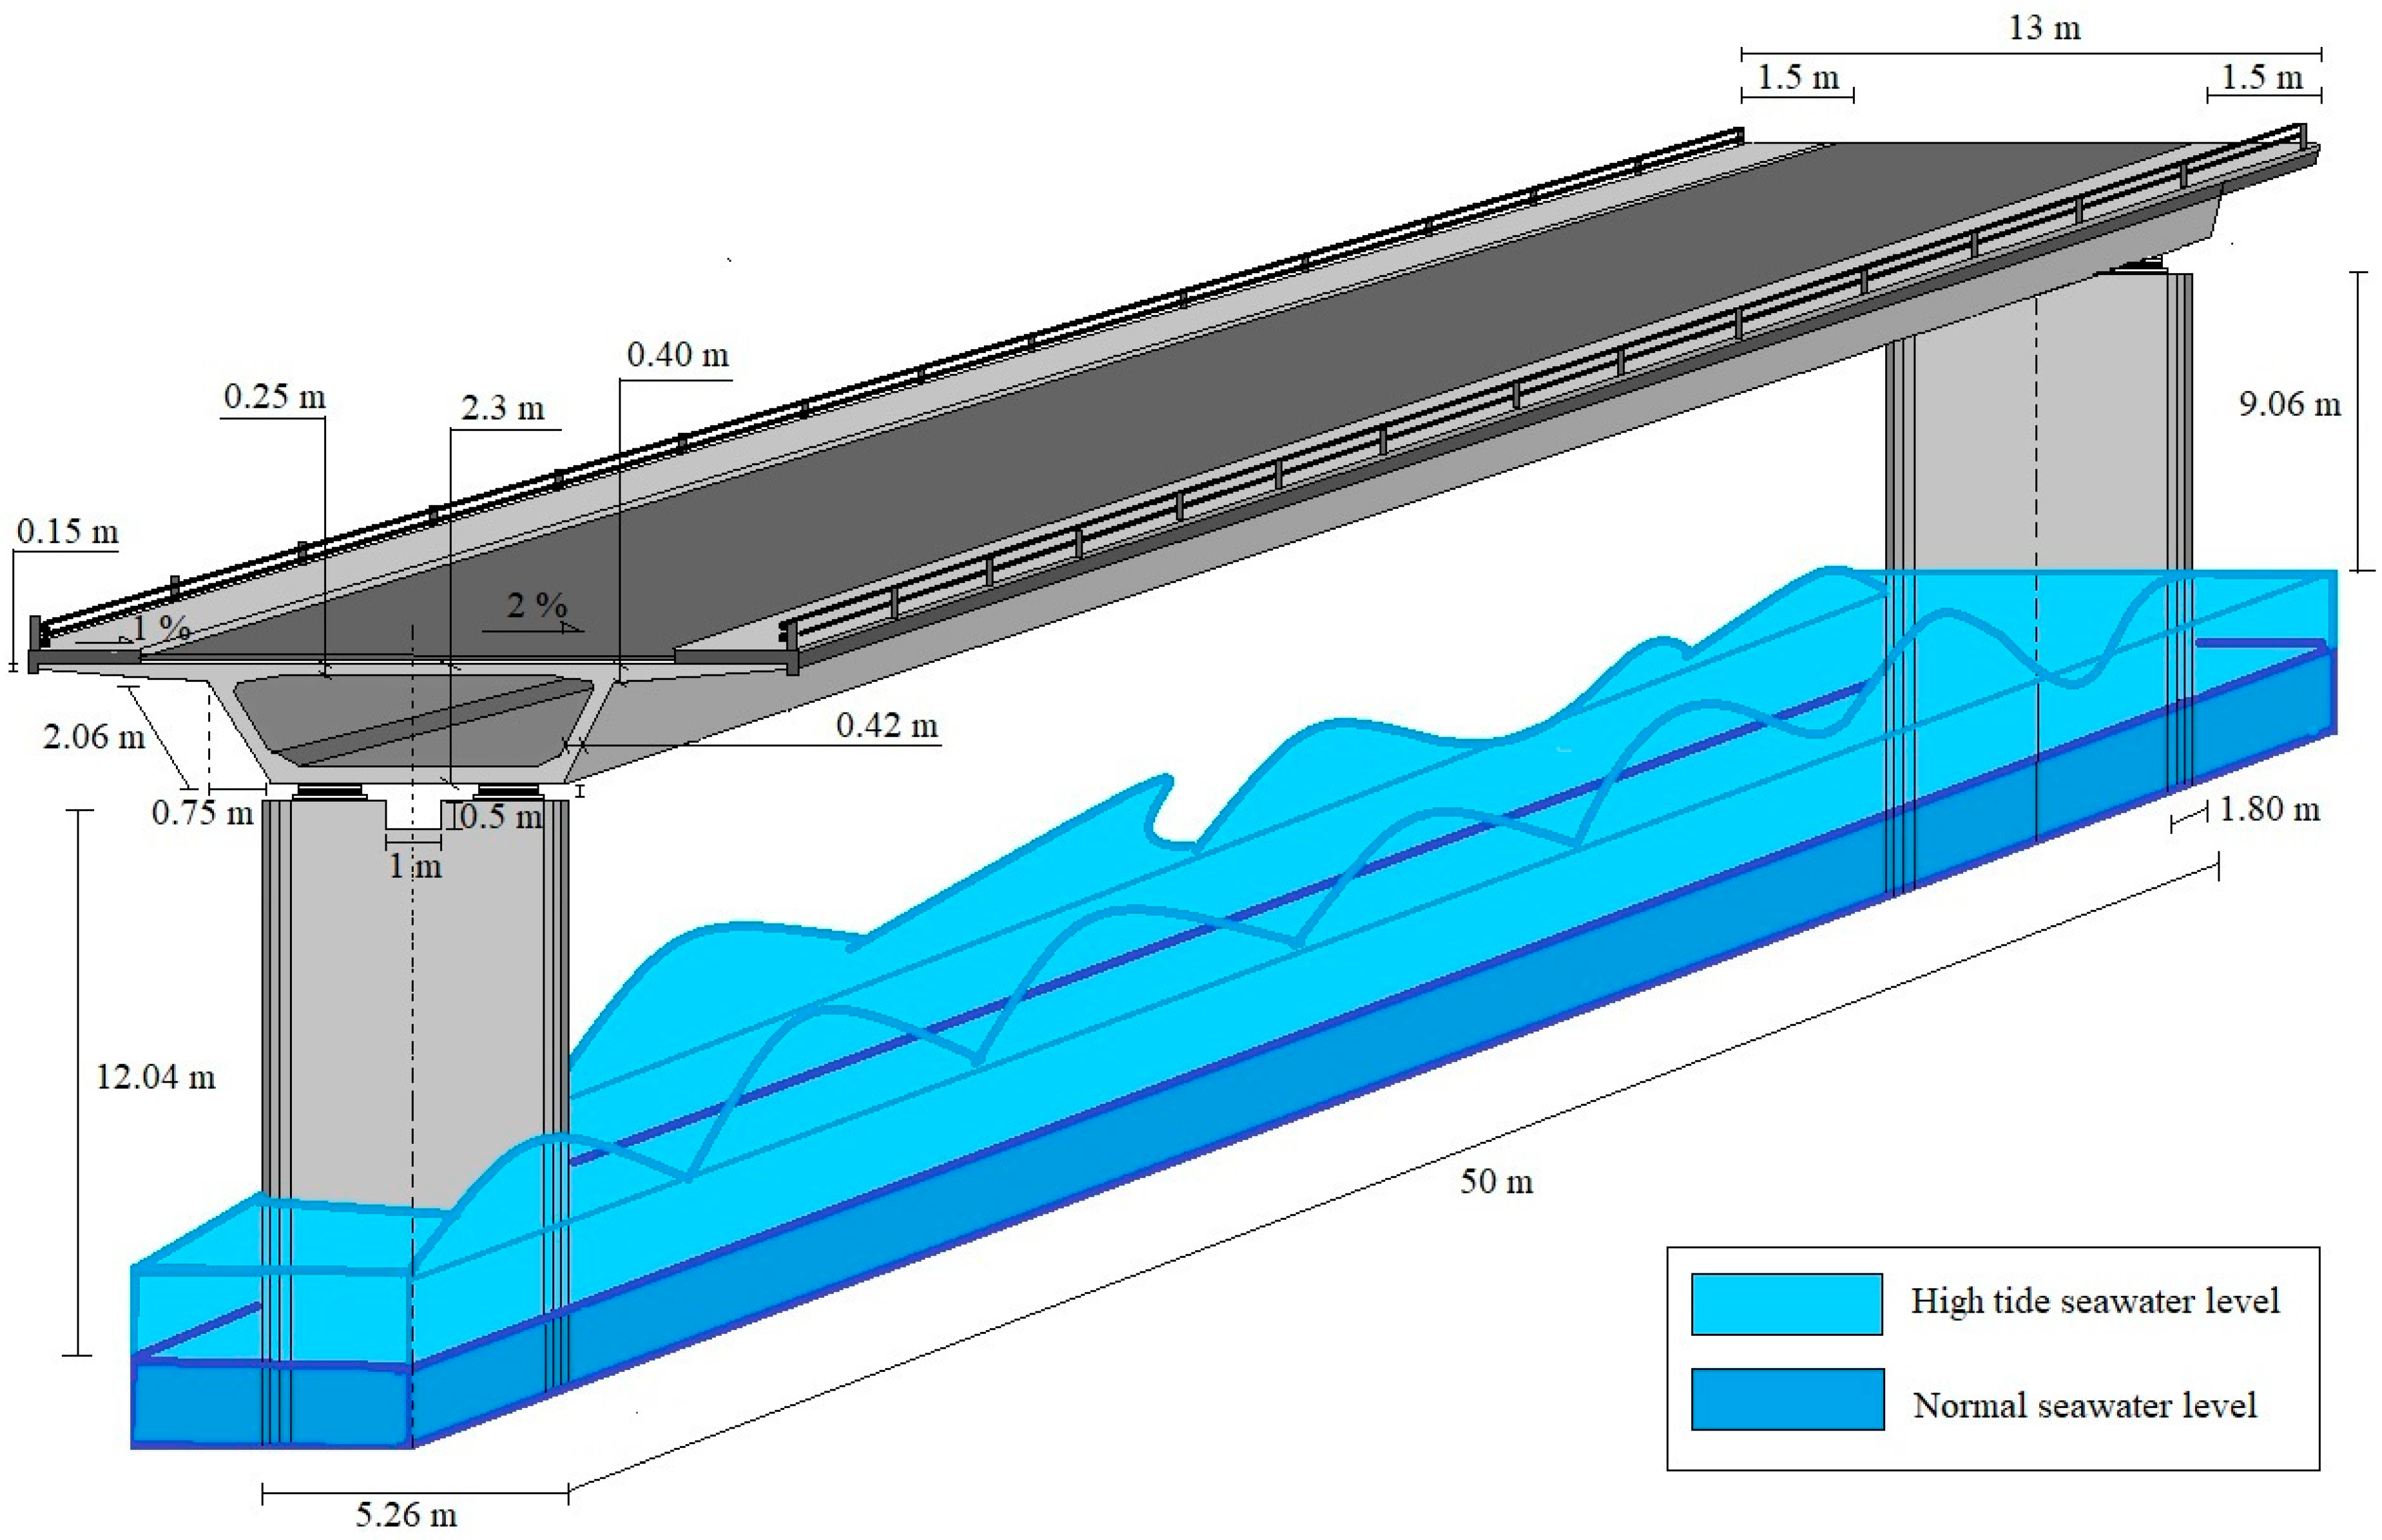
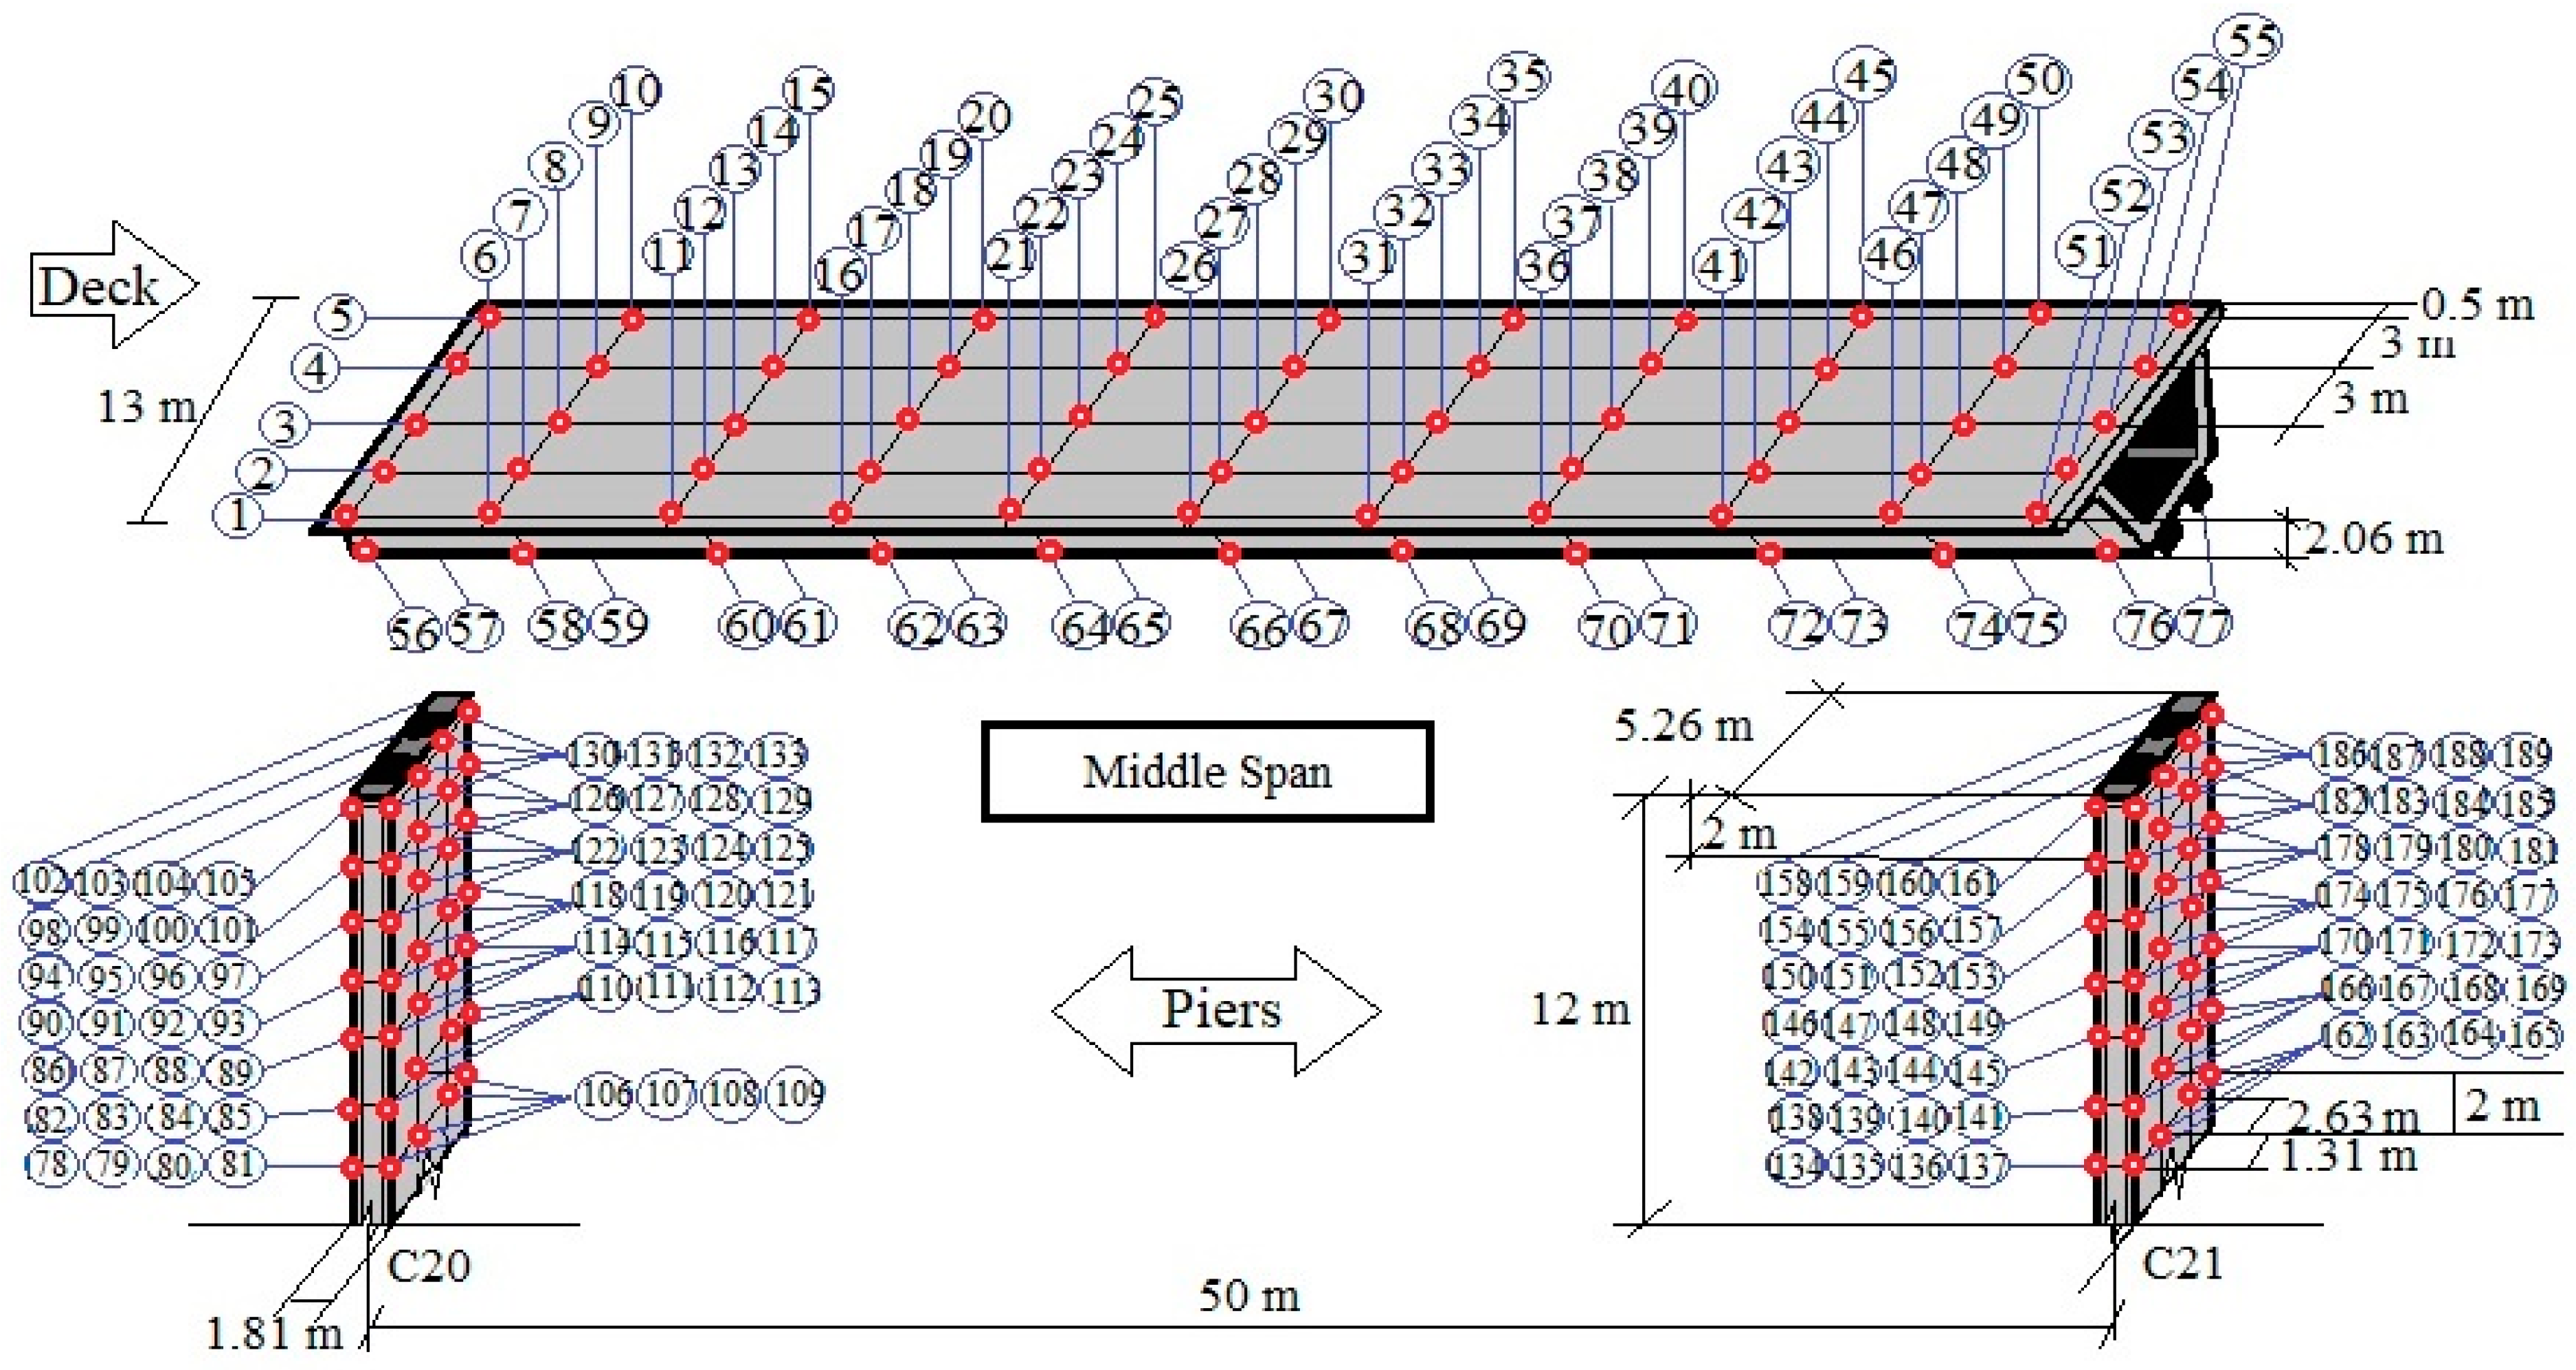
2.1.1. Model Description
2.1.2. Functional Unit
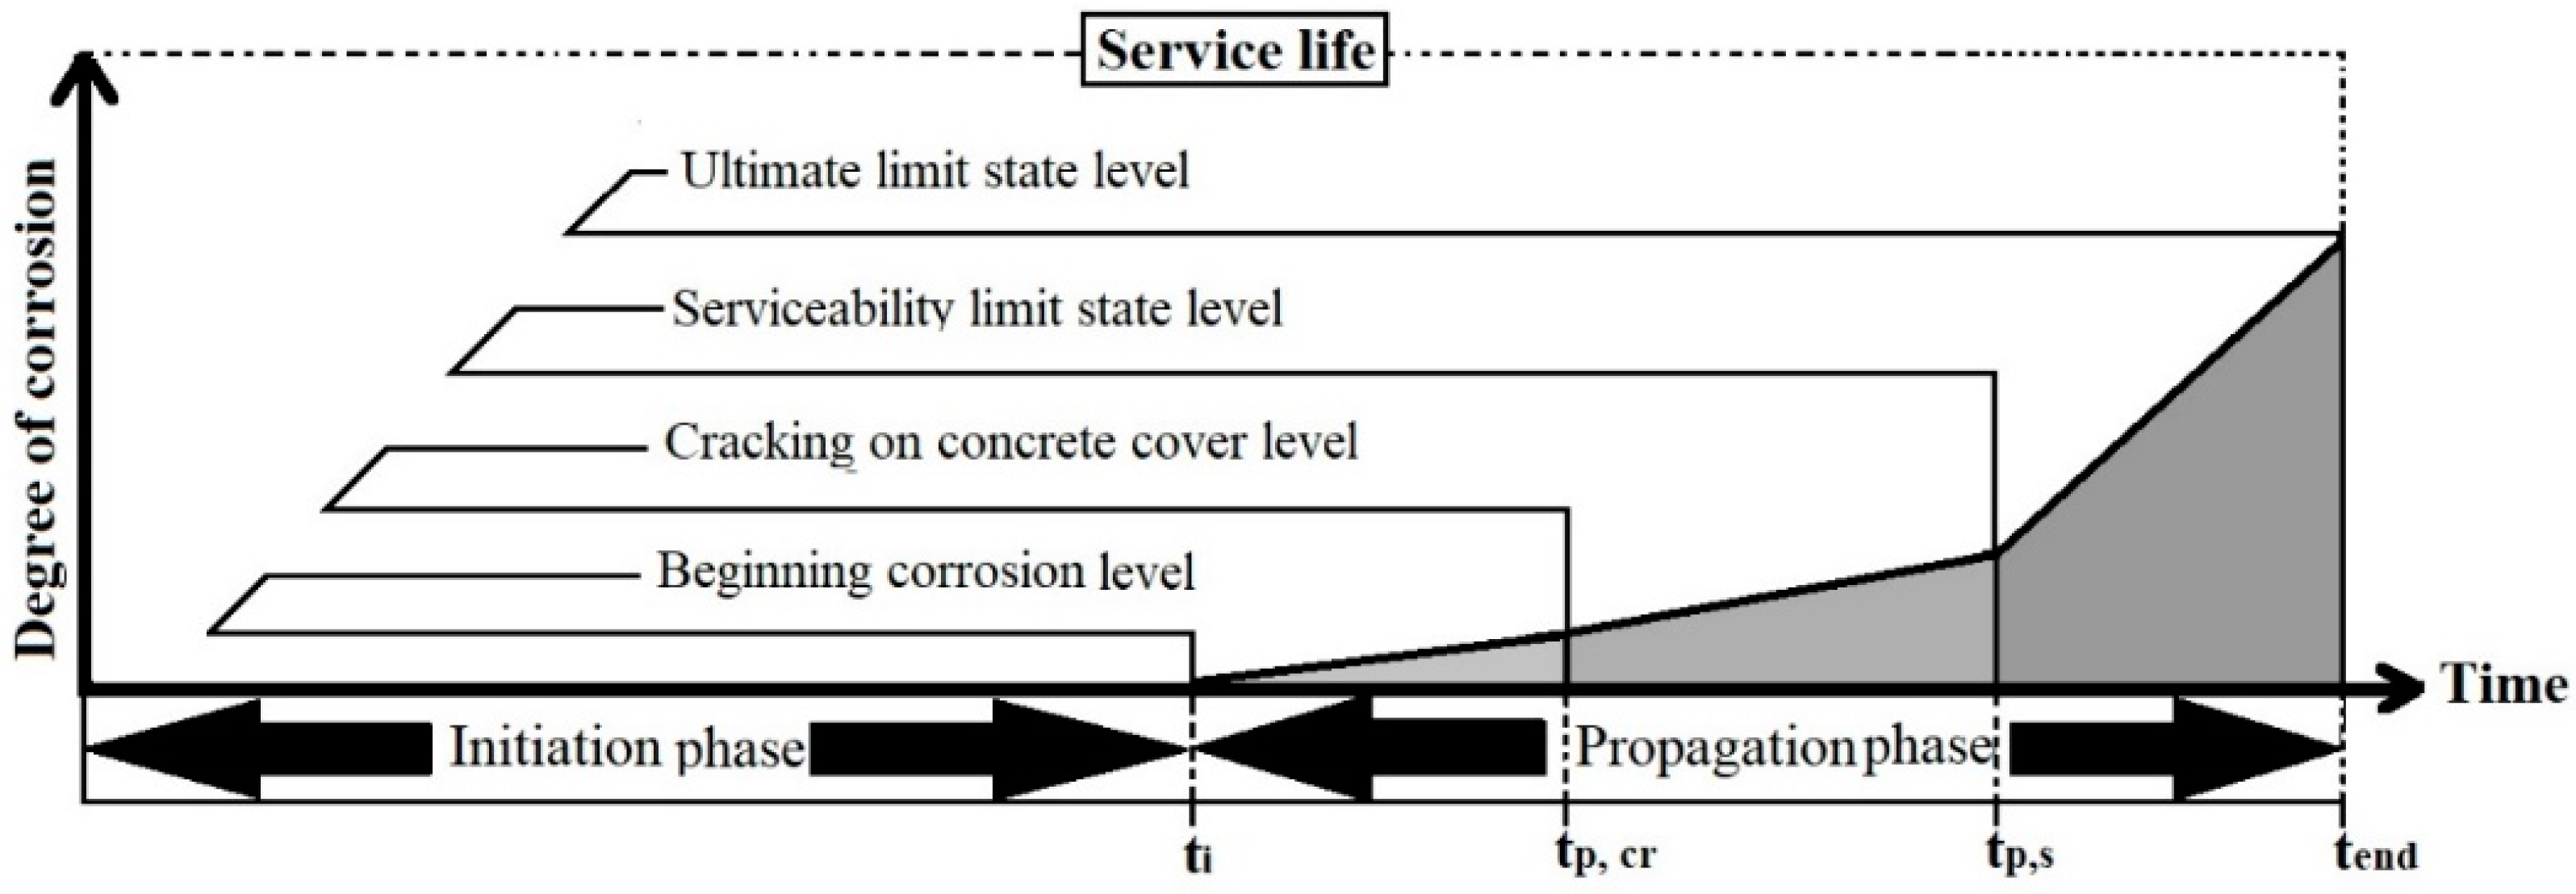
2.2. Service Life Prediction
2.2.1. Prediction Techniques for Chloride Degradation in RC Rebars
2.2.2. Damage Detection using the PSD Method
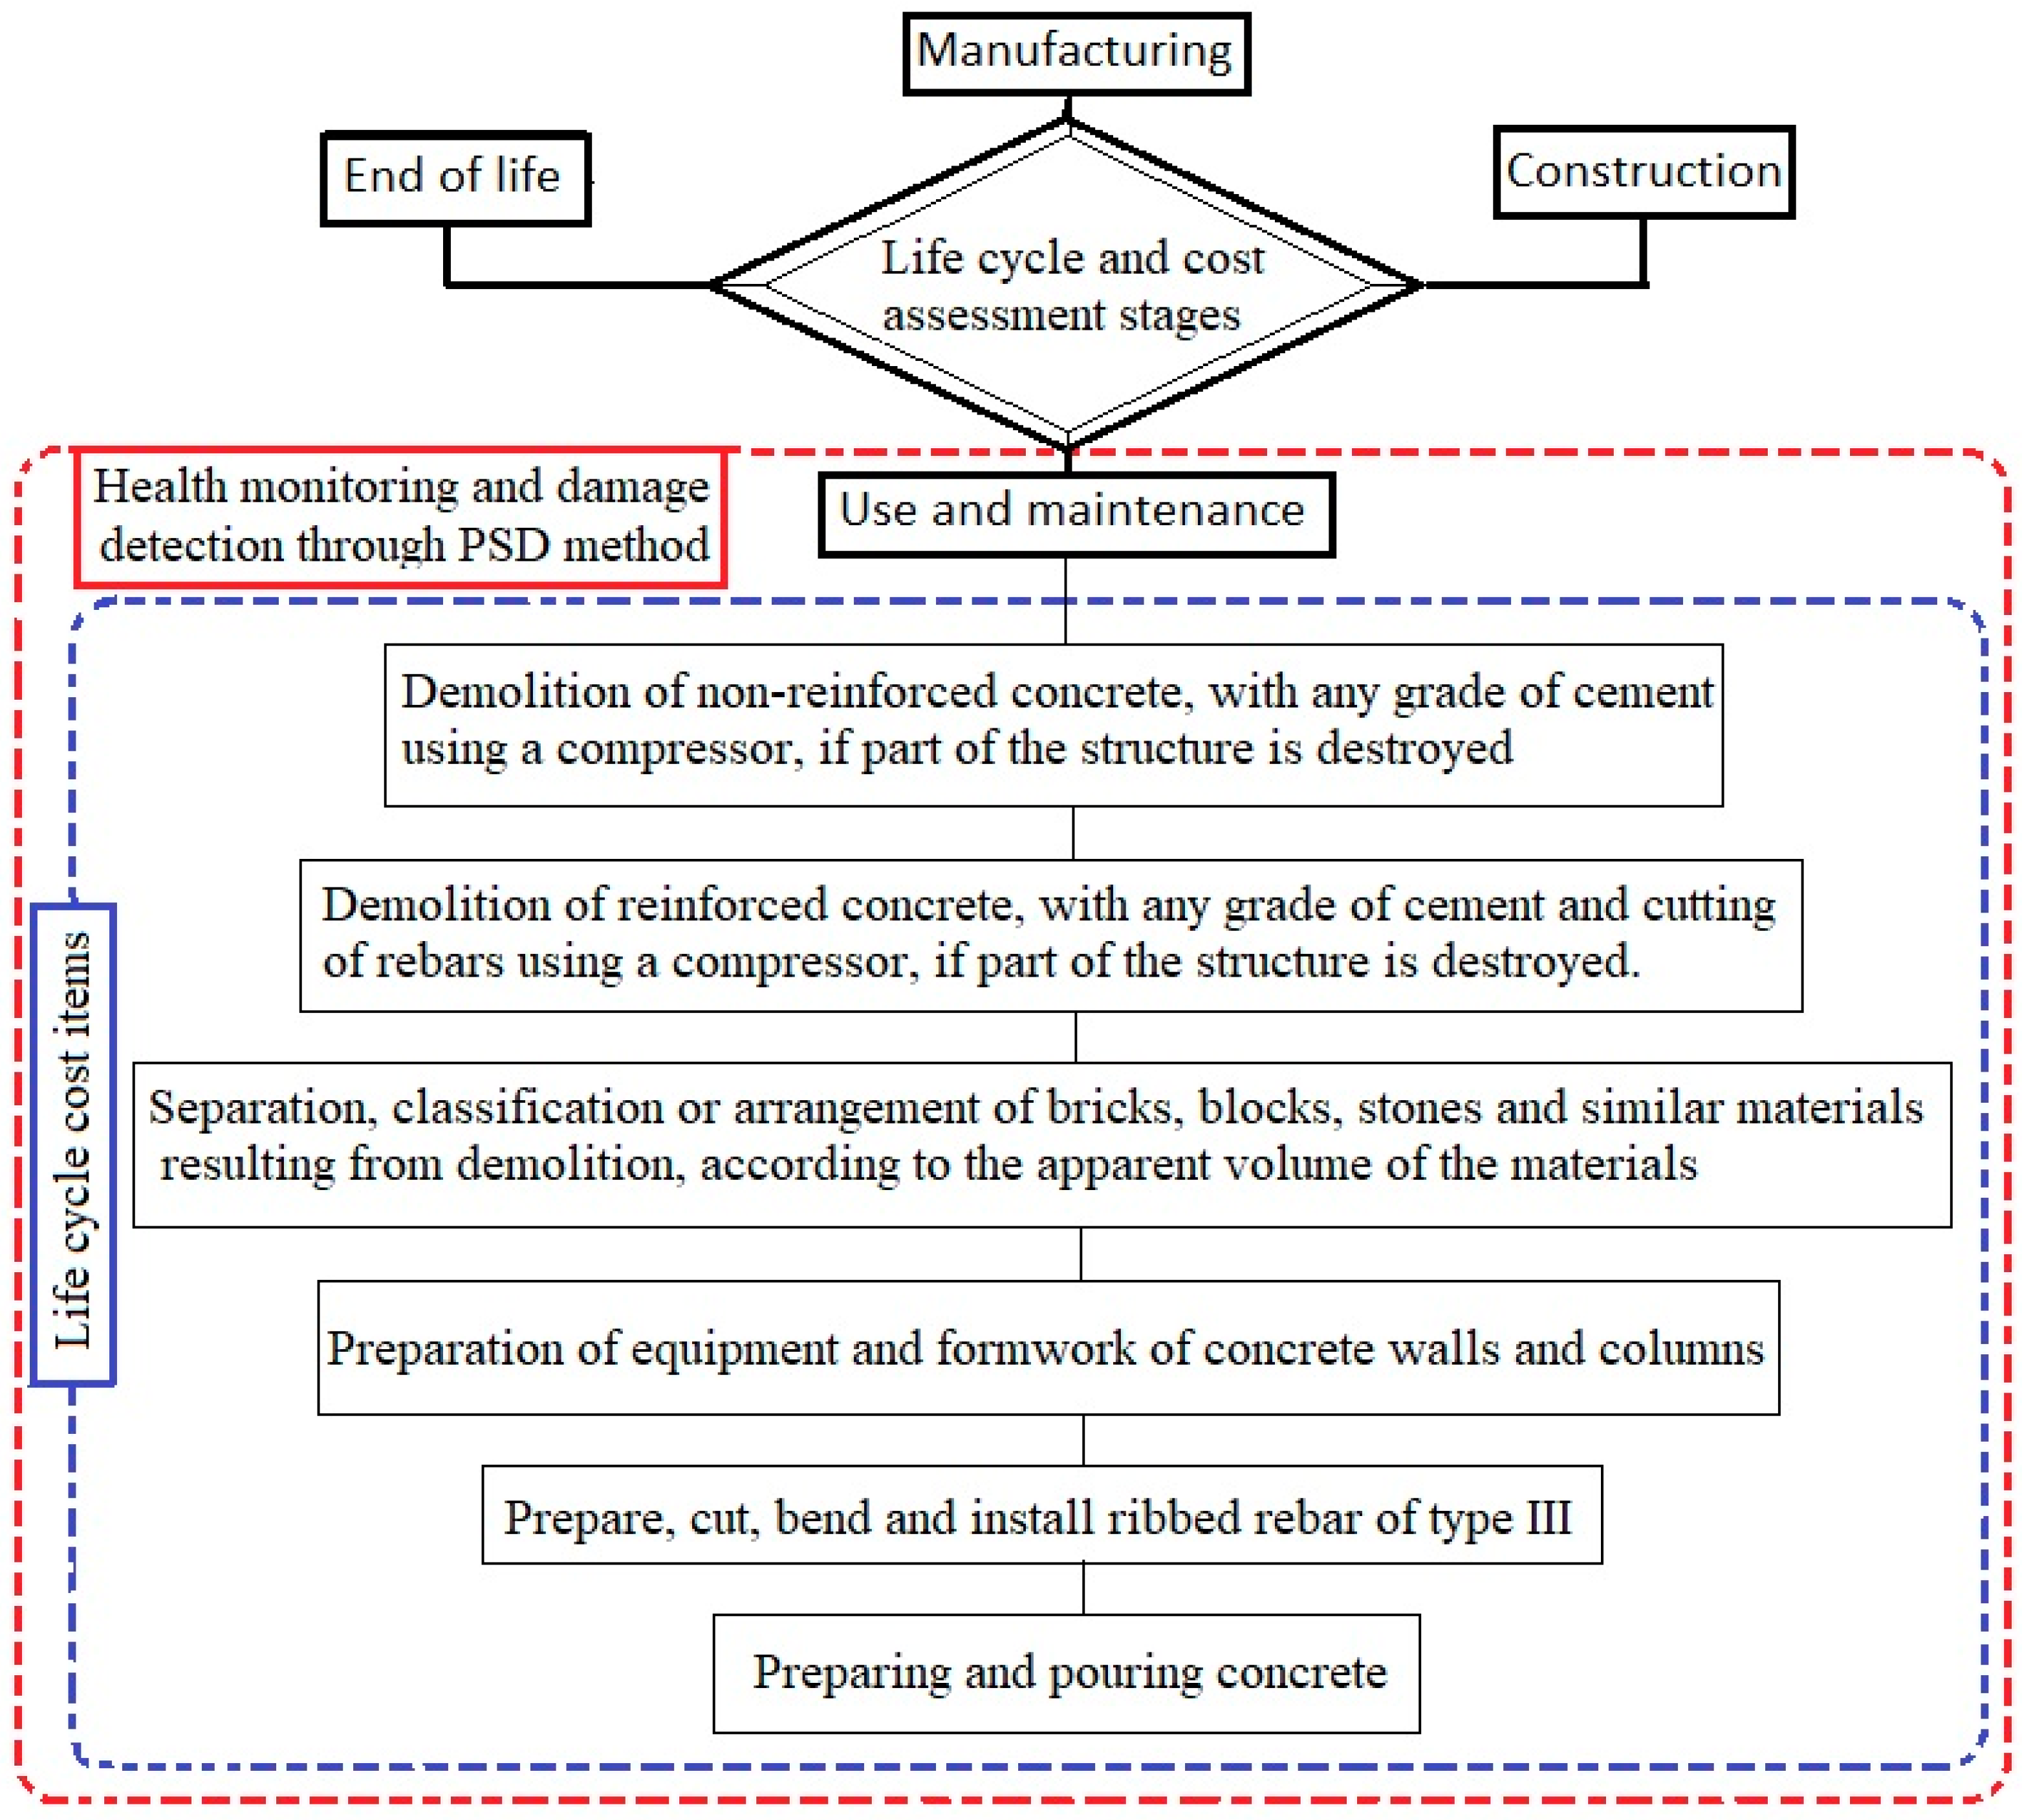
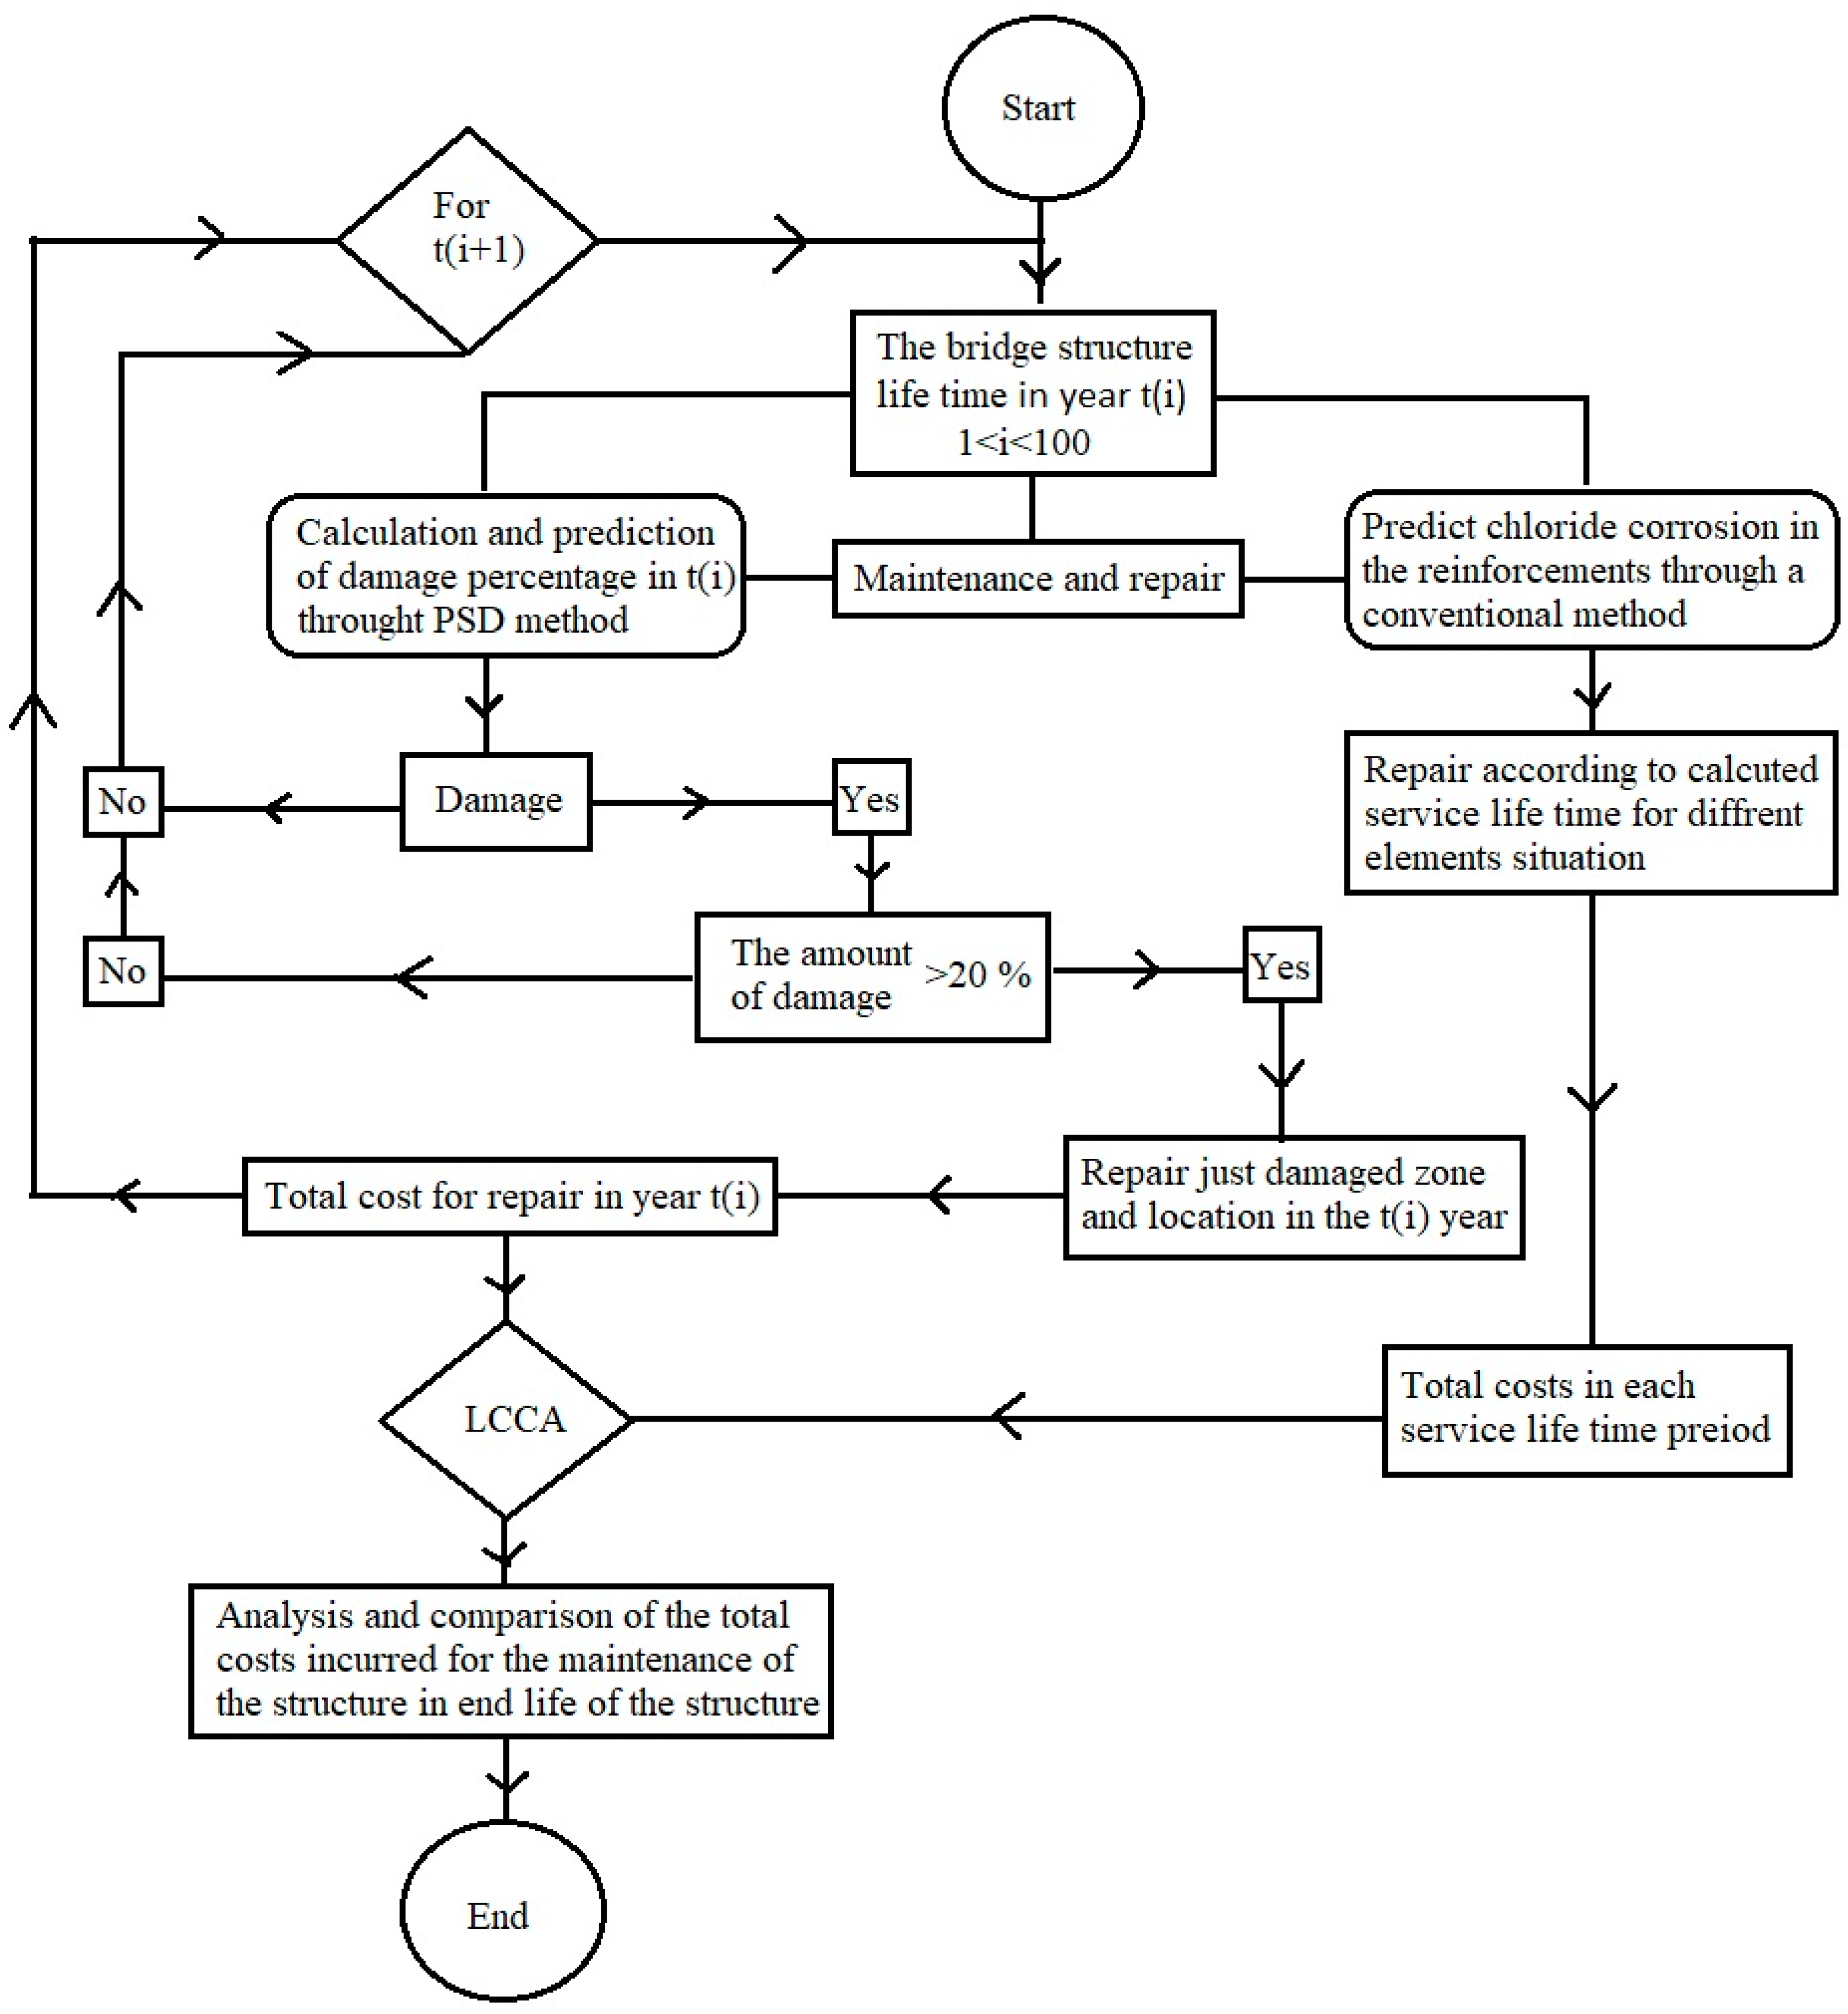
2.3. Calculation Procedure for LCCA
3. Description of the Numerical Model
4. Results
5. Conclusions
Author Contributions
Funding
Institutional Review Board Statement
Informed Consent Statement
Data Availability Statement
Conflicts of Interest
References
- Rathod, H.; Gupta, R. Sub-surface simulated damage detection using Non-Destructive Testing Techniques in reinforced-concrete slabs. Constr. Build. Mater. 2019, 215, 754–764. [Google Scholar] [CrossRef]
- Yang, Y.; Zhang, Y.; Tan, X. Review on Vibration-Based Structural Health Monitoring Techniques and Technical Codes. Symmetry 2021, 13, 1998. [Google Scholar] [CrossRef]
- Aloisio, A.; Alaggio, R.; Fragiacomo, M. Time-domain identification of the elastic modulus of simply supported box girders under moving loads: Method and full-scale validation. Eng. Struct. 2020, 215, 110619. [Google Scholar] [CrossRef]
- Yu, H.; Wang, B.; Xia, C.; Gao, Z.; Li, Y. Efficient non-stationary random vibration analysis of vehicle-bridge system based on an improved explicit time-domain method. Eng. Struct. 2021, 231, 111786. [Google Scholar] [CrossRef]
- Pérez, M.A.; Font-Moré, J.; Fernández-Esmerats, J. Structural damage assessment in lattice towers based on a novel frequency domain-based correlation approach. Eng. Struct. 2021, 226, 111329. [Google Scholar] [CrossRef]
- Ronchei, C.; Vantadori, S.; Carpinteri, A.; Iturrioz, I.; Rodrigues, R.I.; Scorza, D.; Zanichelli, A. A frequency-domain approach for damage detection in welded structures. Fatigue Fract. Eng. Mater. Struct. 2021, 44, 1134–1148. [Google Scholar] [CrossRef]
- Wu, Z.; Zhang, Z.; Wu, J.; Liang, J.; Ge, J.; Liu, X.; Fang, G. A new time-frequency domain simulation method for damage accumulation and life prediction of composite thin-wall structures under random cyclic loadings. Compos. Struct. 2022, 281, 114999. [Google Scholar] [CrossRef]
- Tran, K.T.; Nguyen, T.D.; Hiltunen, D.R.; Stokoe, K.; Menq, F. 3D full-waveform inversion in time-frequency domain: Field data application. Appl. Geophys. 2020, 178, 104078. [Google Scholar] [CrossRef]
- Najafabadi, A.A.; Daneshjoo, F.; Bayat, M. A novel index for damage detection of the deck and dynamic behavior of horizontally curved bridges under moving load. J. Vibroeng. 2017, 19, 5421–5433. [Google Scholar] [CrossRef] [Green Version]
- Seyedpoor, S.M.; Ahmadi, A.; Pahnabi, N. Structural damage detection using time-domain responses and an optimization method. Inverse Probl. Sci. Eng. 2019, 27, 669–688. [Google Scholar] [CrossRef]
- Arora, V. Comparative study of finite element model updating methods. J. Vib. Control 2011, 17, 2023–2039. [Google Scholar] [CrossRef]
- Hou, R.; Xia, Y.; Zhou, X. Structural damage detection based on l1 regularization using natural frequencies and mode shapes. Struct. Control Health Monit. 2018, 25, e2107. [Google Scholar] [CrossRef]
- Xu, W.; Zhu, W.; Cao, M.; Wu, H.; Zhu, R. A novel damage index for damage detection and localization of plate-type structures using twist derivatives of laser-measured mode shapes. JSV 2020, 481, 115448. [Google Scholar] [CrossRef]
- Dessi, D.; Camerlengo, G. Damage identification techniques via modal curvature analysis: Overview and comparison. Mech. Syst. Signal. Process. 2015, 52, 181–205. [Google Scholar] [CrossRef]
- Ganguli, R. Modal Curvature Based Damage Detection. In Structural Health Monitoring; Springer: Singapore, 2020; pp. 37–78. [Google Scholar] [CrossRef]
- Pooya, S.M.; Massumi, A. A novel and efficient method for damage detection in beam-like structures solely based on damaged structure data and using mode shape curvature estimation. Appl. Math. Model. 2021, 91, 670–694. [Google Scholar] [CrossRef]
- Wang, Y. Adaptive Finite Element Algorithm for Damage Detection of Non-Uniform Euler-Bernoulli Beams with Multiple Cracks Based on Natural Frequencies. In Adaptive Analysis of Damage and Fracture in Rock with Multiphysical Fields Coupling; Springer: Singapore, 2021; pp. 73–103. [Google Scholar] [CrossRef]
- Khan, M.W.; Akmal Din, N.; Ul Haq, R. Damage detection in a fixed-fixed beam using natural frequency changes. Vibroeng. Procedia 2020, 30, 38–43. [Google Scholar] [CrossRef] [Green Version]
- Arefi, S.L.; Gholizad, A. Damage identification of structures by reduction of dynamic matrices using the modified modal strain energy method. Struct. Monit. Maint. 2020, 7, 125–147. [Google Scholar] [CrossRef]
- Khosravan, A.; Asgarian, B.; Shokrgozar, H.R. Improved Modal Strain Energy Decomposition Method for damage detection of offshore platforms using data of sensors above the water level. Ocean Eng. 2021, 219, 108337. [Google Scholar] [CrossRef]
- Rahmatalla, S.; Eun, H.C.; Lee, E.T. Damage detection from the variation of parameter matrices estimated by incomplete FRF data. Smart. Struct. Syst. 2012, 9, 55–70. [Google Scholar] [CrossRef] [Green Version]
- Niu, Z. Frequency response-based structural damage detection using Gibbs sampler. JSV 2020, 470, 115160. [Google Scholar] [CrossRef]
- Zheng, Z.D.; Lu, Z.R.; Chen, W.H.; Liu, J.K. Structural damage identification based on power spectral density sensitivity analysis of dynamic responses. Comput. Struct. 2015, 146, 176–184. [Google Scholar] [CrossRef]
- Pedram, M.; Esfandiari, A.; Khedmati, M.R. Damage detection by a FE model updating method using power spectral density: Numerical and experimental investigation. JSV 2017, 397, 51–76. [Google Scholar] [CrossRef]
- Gao, D.Y.; Yao, W.X.; Wen, W.D.; Huang, J. Equivalent Spectral Method to Estimate the Fatigue Life of Composite Laminates Under Random Vibration Loadings. Mech. Compos. Mater. 2021, 57, 101–114. [Google Scholar] [CrossRef]
- Aquino, R.E.; Barbosh, M.; Sadhu, A. Comparison of Time-Domain and Time-Frequency-Domain System Identification Methods on Tall Building Data with Noise. In Dynamics of Civil Structures; Springer: Berlin/Heidelberg, Germany, 2021; Volume 2, pp. 179–184. [Google Scholar] [CrossRef]
- Barbosh, M.; Singh, P.; Sadhu, A. Empirical mode decomposition and its variants: A review with applications in structural health monitoring. SMS 2020, 29, 093001. [Google Scholar] [CrossRef]
- Silik, A.; Noori, M.; Altabey, W.A.; Ghiasi, R.; Wu, Z. Analytic Wavelet Selection for Time-Analysis of Big Data Form Civil Structure Monitoring. In Proceedings of the International Workshop on Civil Structural Health Monitoring, Naples, Italy, 31 March–2 April 2021; Springer: Berlin/Heidelberg, Germany, 2021; pp. 431–455. [Google Scholar] [CrossRef]
- Li, J.T.; Zhu, X.Q.; Samali, B. Bridge operational modal identification using sparse blind source separation. In ACMSM25; Springer: Singapore, 2020; pp. 911–920. [Google Scholar] [CrossRef]
- Nilsson, A.; Liu, B. Frequency domain. In Vibro-Acoustics; Springer: Berlin/Heidelberg, Germany, 2015; Volume 1, pp. 31–66. [Google Scholar] [CrossRef] [Green Version]
- Bayat1a, M.; Ahmadi, H.R.; Mahdavi3b, N. Application of power spectral density function for damage diagnosis of bridge piers. Struct. Eng. Mech. 2019, 71, 57–63. [Google Scholar] [CrossRef]
- Gunawan, F.E. Reliability of the power spectral density method in predicting structural integrity. Int. J. Innov. Comput. Inf. Control 2019, 15, 1717–1727. [Google Scholar] [CrossRef]
- Hadizadeh-Bazaz, M.; Navarro, I.J.; Yepes, V. Performance comparison of structural damage detection methods based on Frequency Response Function and Power Spectral Density. DYNA 2022, 97, 493–500. [Google Scholar] [CrossRef]
- Molina-Moreno, F.; García-Segura, T.; Martí, J.V.; Yepes, V. Optimization of buttressed earth-retaining walls using hybrid harmony search algorithms. Eng. Struct. 2017, 134, 205–216. [Google Scholar] [CrossRef]
- Penadés-Plà, V.; García-Segura, T.; Martí, J.V.; Yepes, V. An optimization-LCA of a prestressed concrete precast bridge. Sustainability 2018, 10, 685. [Google Scholar] [CrossRef] [Green Version]
- Navarro, I.J.; Penadés-Plà, V.; Martínez-Muñoz, D.; Rempling, R.; Yepes, V. Life cycle sustainability assessment for multi-criteria decision making in bridge design: A review. J. Civil. Eng. Manag. 2020, 26, 690–704. [Google Scholar] [CrossRef]
- Frangopol, D.M.; Dong, Y.; Sabatino, S. Bridge life-cycle performance and cost: Analysis, prediction, optimization, and decision-making. Struct. Infrastruct. Eng. 2017, 13, 1239–1257. [Google Scholar] [CrossRef]
- Goh, K.C.; Goh, H.H.; Chong, H.Y. Integration model of fuzzy AHP and life-cycle cost analysis for evaluating highway infrastructure investments. J. Infrastruct. Syst. 2019, 25, 04018045. [Google Scholar] [CrossRef]
- Heidari, M.R.; Heravi, G.; Esmaeeli, A.N. Integrating life-cycle assessment and life-cycle cost analysis to select sustainable pavement: A probabilistic model using managerial flexibilities. J. Clean. Prod. 2020, 254, 120046. [Google Scholar] [CrossRef]
- Kleingesinds, S.; Lavan, O.; Venanzi, I. Life-cycle cost-based optimization of MTMDs for tall buildings under multiple hazards. Struct. Infrastruct. Eng. 2021, 17, 921–940. [Google Scholar] [CrossRef]
- Kamariotis, A.; Chatzi, E.; Straub, D. Value of information from vibration-based structural health monitoring extracted via Bayesian model updating. Mech. Syst. Signal Process. 2022, 166, 108465. [Google Scholar] [CrossRef]
- Mitseas, I.P.; Kougioumtzoglou, I.A.; Beer, M. Nonlinear stochastic dynamic analysis for performance based multi-objective optimum design considering life cycle seismic loss estimation. In Proceedings of the 12th International Conference on Applications of Statistics and Probability in Civil Engineering (ICASP), Vancouver, BC, Canada, 12–15 July 2015; Available online: https://open.library.ubc.ca/cIRcle/collections/53032/items/1.0076149 (accessed on 21 May 2015).
- Micheli, L.; Alipour, A.; Laflamme, S.; Sarkar, P. Performance-based design with life-cycle cost assessment for damping systems integrated in wind excited tall buildings. Eng. Struct. 2019, 195, 438–451. [Google Scholar] [CrossRef]
- Chu, X.; Cui, W.; Zhao, L.; Ge, Y. Life-Cycle Assessment of Long-Span Bridge’s Wind Resistant Performance Considering Multisource Time-Variant Effects and Uncertainties. J. Struct. Eng. 2022, 148, 04022092. [Google Scholar] [CrossRef]
- ISO 14040:2006; Environmental Management—Life Cycle Assessment—Principles and Framework. International Standards Organization: Geneva, Switzerland, 2006.
- ISO 14044:2006; Environmental Management—Life Cycle Assessment—Requirements and Guidelines. International Standards Organization: Geneva, Switzerland, 2006.
- Navarro, I.J.; Yepes, V.; Martí, J.V. Social life cycle assessment of concrete bridge decks exposed to aggressive environments. Environ. Impact Assess. Rev. 2018, 72, 50–63. [Google Scholar] [CrossRef]
- Navarro, I.J.; Yepes, V.; Martí, J.V.; González-Vidosa, F. Life cycle impact assessment of corrosion preventive designs applied to prestressed concrete bridge decks. J. Clean. Prod. 2018, 196, 698–713. [Google Scholar] [CrossRef]
- Penadés-Plà, V.; Martí, J.V.; García-Segura, T.; Yepes, V. Life-cycle assessment: A comparison between two optimal post-tensioned concrete box-girder road bridges. Sustainability 2017, 9, 1864. [Google Scholar] [CrossRef] [Green Version]
- León, J.; Prieto, F.; Rodríguez, F. Proyecto de rehabilitación del puente de la Isla de Arosa. Hormig Acero 2013, 270, 75–89. [Google Scholar]
- Pérez-Fadón Martínez, S. Puente a la Isla de Arosa. Hormigón y Acero 1985, 36, 157. [Google Scholar]
- Pérez-Fadón Martínez, S. Puente sobre la Ría de Arosa. Rev. Obras Publicas 1986, 3243, 1–16. [Google Scholar]
- Tuutti, K. Corrosion of Steel in Concrete; Report. Cement-och Betonginst 1982, 4, 468. [Google Scholar]
- Hájková, K.; Šmilauer, V.; Jendele, L.; Červenka, J. Prediction of reinforcement corrosion due to chloride ingress and its effects on serviceability. Eng. Struct. 2018, 174, 768–777. [Google Scholar] [CrossRef]
- Zhang, D.; Zeng, Y.; Fang, M.; Jin, W. Service life prediction of precast concrete structures exposed to chloride environment. Adv. Civ. Eng. 2019, 2019, 3216328. [Google Scholar] [CrossRef]
- Spanish Ministry of Public Works. EHE-08 Instrucción del Hormigón Estructural; Spanish Ministry of Public Works: Madrid, Spain, 2008; ISBN 978-84-498-0899-9. [Google Scholar]
- FIB. Model Code for Service Life Design; Federation Internationale du Beton, fib. Bulletin: Lausanne, Switzerland, 2006; No. 34. [Google Scholar]
- Khan, M.U.; Ahmad, S.; Al-Gahtani, H.J. Chloride-induced corrosion of steel in concrete: An overview on chloride diffusion and prediction of corrosion initiation time. Int. J. Corros. 2017, 2017, 5819202. [Google Scholar] [CrossRef] [Green Version]
- Crank, J. The Mathematics of Diffusion—Appendix A Solution of Fick’s Second Law, 2nd ed.; Oxford University Press: Oxford, UK, 2004. [Google Scholar]
- Alonso, M.C.; Sanchez, M. Analysis of the variability of chloride threshold values in the literature. Corros. Mater. 2009, 60, 631–637. [Google Scholar] [CrossRef]
- Navarro, I.J.; Marti, J.V.; Yepes, V. Reliability-based maintenance optimization of corrosion preventive designs under a life cycle perspective. Environ. Impact Assess. Rev. 2019, 74, 23–34. [Google Scholar] [CrossRef]
- Bru, D.; González, A.; Baeza, F.J.; Ivorra, S. Seismic behavior of 1960’s RC buildings exposed to marine environment. Eng. Fail. Anal. 2018, 90, 324–340. [Google Scholar] [CrossRef] [Green Version]
- Frontera, A.; Cladera, A. Long-term shear strength of RC beams based on a mechanical model that consid-ers reinforcing steel corrosion. Struct. Concr. 2022, 1–16. [Google Scholar] [CrossRef]
- Hadizadeh-Bazaz, M.; Navarro, I.J.; Yepes, V. Power Spectral Density method performance in detecting damages by chloride attack on coastal RC bridge. Struct. Eng. Mech. 2023, 85, 197–206. [Google Scholar] [CrossRef]
- Esfandiari, A.; Bakhtiari-Nejad, F.; Rahai, A.; Sanayei, M. Structural model updating using frequency response function and quasi-linear sensitivity equation. JSV 2009, 326, 557–573. [Google Scholar] [CrossRef]
- Frangopol, D.M.; Lin, K.Y.; Estes, A.C. Life-cycle cost design of deteriorating structure. J. Struct. Eng. 1997, 123, 1390. [Google Scholar] [CrossRef]
- Dong, Y.; Frangopol, D.M. Probabilistic time-dependent multihazard life-cycle assessment and resilience of bridges considering climate change. J. Perform. Constr. Facil. 2016, 30, 04016034. [Google Scholar] [CrossRef]
- Yeo, G.L. Stochastic Characterization and Decision Bases under Time-Dependent Aftershock Risk in Performance-Based Earthquake Engineering; Stanford University: Stanford, CA, USA, 2005. [Google Scholar]
- MITMA. Reference Price Base of the General Directorate of Highways; Ministry of Transport, Mobility and Urban Agenda: Madrid, Spain, 2022. [Google Scholar]
- Lee, K.M.; Cho, H.N.; Cha, C.J. Life-cycle cost-effective optimum design of steel bridges considering environmental stressors. Eng. Struct. 2006, 28, 1252–1265. [Google Scholar] [CrossRef]


| Properties (Units) | Water (L/m3) | Cement (kg/m3) | Gravel (kg/m3) | Sand (kg/m3) | fcm (MPa) | Ec (GPa) | w/c (%) |
|---|---|---|---|---|---|---|---|
| Amount | 218.5 | 485.6 | 926.7 | 827.9 | 40 | 29 | 0.45 |
| Marine Exposure Class | (% of Concrete Weight) | (μm/year) | (×10−12 m2/s) | (%) | (m) | |
|---|---|---|---|---|---|---|
| Deck | Piers | |||||
| Aerial (IIIa) | 0.14 | 20 | 10.0 | 0.6 | 0.035 | 0.045 |
| Submerged (IIIb) | 0.72 | 4 | ||||
| In tidal zone (IIIc) | 0.50 | 50 | ||||
| No. | Maintenance and Repair Activities | Description/Includes | Price per Unit (EUR) | Unit |
|---|---|---|---|---|
| 1 | Demolition of the unreinforced concrete parts | Debris clearing, loading, and transport of demolished material to authorized manager up to a distance of 60 km | 30.20 | m3 |
| 2 | The reinforced concrete parts demolition | Debris clearing, loading, and transport of demolished material to authorized manager up to a distance of 60 km | 33.07 | m3 |
| 3 | Management, separation, and categorization of debris resulting from destruction | Loading and transport of non-hazardous construction (except earth and stones) consisting of bricks, tiles, and ceramic materials or a mixture of these | 7.78 | ton |
| 4 | Install and subsequently remove formwork for repair concrete activity | Executed with double-folded, wood cleaning, wetting, application of release agent, and use of complementary elements for its stability and adequate execution | 33.91 | m2 |
| 5 | Repair and replace damaged bar steel with corrugated bar steel with improved ductility characteristics | Including cutting and bending, placement of overlaps, breakout, and binding annealed wire and separators | 1.81 | kg |
| 6 | Prepare and pour concrete | Concrete activities in the elevation of piles, stirrups, headboards, beams, deck boards, slabs, walls, and frames | 121.35 | m3 |
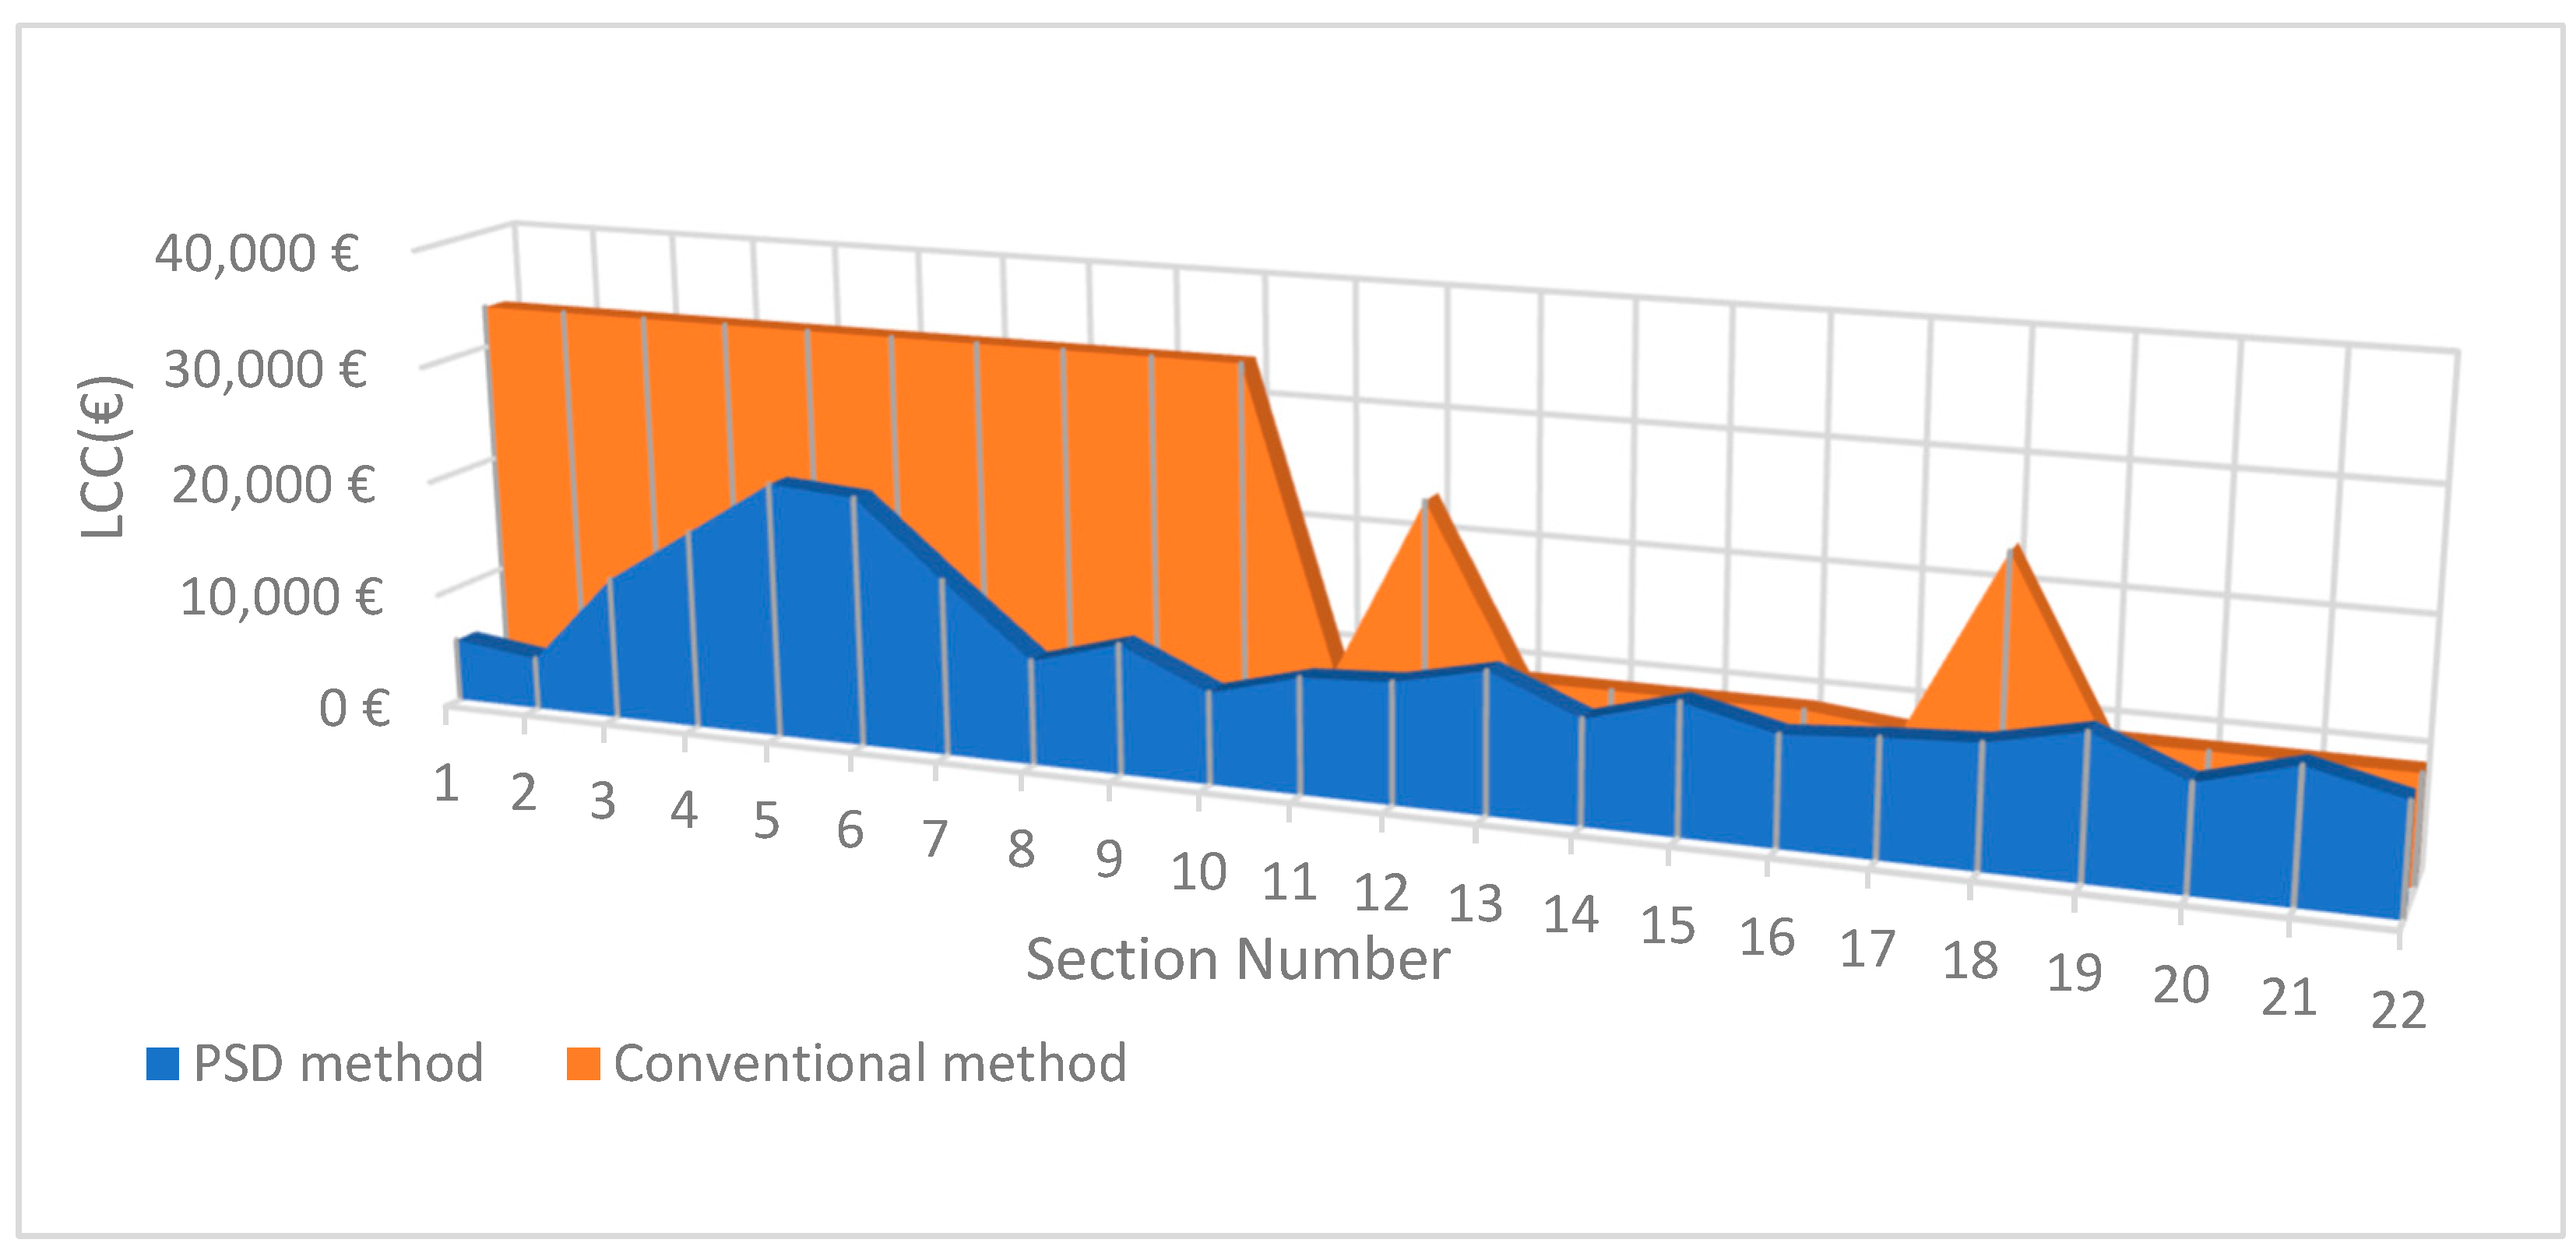
| Section No. | Location | Service Life and Repair Period (for Damage More Than 20%) | ||||
|---|---|---|---|---|---|---|
| Damage-Prediction Methods | ||||||
| Area No. | The Zone between Points | PSD | Conventional | |||
| Damage (%) | Repair Time (year) | Damage (%) | Repair Time (years) | |||
| S1 (Deck) | A1 | p1, p2, p6, p7 | - | 100 | 26.67 | 6 |
| A2 | p2, p3, p7, p8 | 20.04 | 65 | |||
| A3 | p3, p4, p8, p9 | 20.04 | 65 | |||
| A4 | p4, p5, p9, p10 | - | 100 | |||
| A5 | p1, p6, p56, p58 | 20.05 | 32 | |||
| A6 | p56, p57, p58, p59 | 20.16 | 27 | |||
| A7 | p5, p10, p57, p59 | 20.05 | 32 | |||
| S2 (Deck) | A8 | p6, p7, p11, p12 | 20.04 | 65 | 26.67 | 6 |
| A9 | p7, p8, p12, p13 | 20.07 | 51 | |||
| A10 | p8, p9, p13, p14 | 20.07 | 51 | |||
| A11 | p9, p10, p14, p15 | 20.04 | 65 | |||
| A12 | p6, p11, p58, p60 | 20.15 | 42 | |||
| A13 | p58, p59, p60, p61 | 20.06 | 36 | |||
| A14 | p10, p15, p59, p61 | 20.15 | 42 | |||
| S3 (Deck) | A15 | p11, p12, p16, p17 | 20.05 | 32 | 26.67 | 6 |
| A16 | p12, p13, p17, p18 | 20.22 | 30 | |||
| A17 | p13, p14, p18, p19 | 20.22 | 30 | |||
| A18 | p14, p15, p19, p20 | 20.05 | 32 | |||
| A19 | p11, p16, p60, p62 | 20.16 | 27 | |||
| A20 | p60, p61, p62, p63 | 20.20 | 22 | |||
| A21 | p15, p20, p61, p63 | 20.16 | 27 | |||
| S4 (Deck) | A22 | p16, p17, p21, p22 | 20.22 | 19 | 26.67 | 6 |
| A23 | p17, p18, p22, p23 | 20.95 | 19 | |||
| A24 | p18, p19, p23, p24 | 20.95 | 19 | |||
| A25 | p19, p20, p24, p25 | 20.22 | 19 | |||
| A26 | p16, p21, p62, p64 | 20.50 | 18 | |||
| A27 | p62, p63, p64, p65 | 21.14 | 18 | |||
| A28 | p20, p25, p63, p65 | 20.50 | 18 | |||
| S5 (Deck) | A29 | p21, p22, p26, p27 | 21.77 | 18 | 26.67 | 6 |
| A30 | p22, p23, p27, p28 | 22.41 | 18 | |||
| A31 | p23, p24, p28, p29 | 22.41 | 18 | |||
| A32 | p24, p25, p29, p30 | 21.77 | 18 | |||
| A33 | p21, p26, p64, p66 | 21.77 | 18 | |||
| A34 | p64, p65, p66, p67 | 22.41 | 18 | |||
| A35 | p25, p30, p65, p67 | 21.77 | 18 | |||
| S6 (Deck) | A36 | p26, p27, p31, p32 | 21.77 | 18 | 26.67 | 6 |
| A37 | p27, p28, p32, p33 | 22.41 | 18 | |||
| A38 | p28, p29, p33, p34 | 22.41 | 18 | |||
| A39 | p29, p30, p34, p35 | 21.77 | 18 | |||
| A40 | p26, p31, p66, p68 | 20.50 | 18 | |||
| A41 | p66, p67, p68, p69 | 21.14 | 18 | |||
| A42 | p30, p35, p67, p69 | 20.50 | 18 | |||
| S7 (Deck) | A43 | p31, p32, p36, p37 | 20.16 | 27 | 26.67 | 6 |
| A44 | p32, p33, p37, p38 | 20.20 | 22 | |||
| A45 | p33, p34, p38, p39 | 20.20 | 22 | |||
| A46 | p34, p35, p39, p40 | 20.16 | 27 | |||
| A47 | p31, p36, p68, p70 | 20.05 | 32 | |||
| A48 | p68, p69, p70, p71 | 20.22 | 30 | |||
| A49 | p35, p40, p69, p71 | 20.05 | 32 | |||
| S8 (Deck) | A50 | p36, p37, p41, p42 | 20.15 | 42 | 26.67 | 6 |
| A51 | p37, p38, p42, p43 | 20.06 | 36 | |||
| A52 | p38, p39, p43, p44 | 20.06 | 36 | |||
| A53 | p39, p40, p44, p45 | 20.15 | 42 | |||
| A54 | p36, p41, p70, p72 | 20.05 | 84 | |||
| A55 | p70, p71, p72, p73 | 20.07 | 51 | |||
| A56 | p40, p45, p71, p73 | 20.05 | 84 | |||
| S9 (Deck) | A57 | p41, p42, p46, p47 | 20.06 | 36 | 26.67 | 6 |
| A58 | p42, p43, p47, p48 | 20.22 | 30 | |||
| A59 | p43, p44, p48, p49 | 20.22 | 30 | |||
| A60 | p44, p45, p49, p50 | 20.06 | 36 | |||
| A61 | p41, p46, p72, p74 | - | 100 | |||
| A62 | p72, p73, p74, p75 | 20.99 | 24 | |||
| A63 | p45, p50, p73, p75 | - | 100 | |||
| S10 (Deck) | A64 | p46, p47, p51, p52 | - | 100 | 26.67 | 6 |
| A65 | p47, p48, p52, p53 | 20.07 | 51 | |||
| A66 | p48, p49, p53, p54 | 20.07 | 51 | |||
| A67 | p49, p50, p54, p55 | - | 100 | |||
| A68 | p46, p81, p74, p76 | 20.50 | 32 | |||
| A69 | p74, p75, p76, p77 | 20.16 | 27 | |||
| A70 | p50, p55, p75, p77 | 20.50 | 32 | |||
| S11 (Column20) | A71 | p78, p79, p82, p83, p106, p107, p110, p111 | 21.1 | 14 | 20 | 17 |
| A72 | p79, p80, p83, p84, p107, p108, p111, p112 | 21.1 | 14 | |||
| A73 | p80, p81, p84, p85, p108, p109, p112, p113 | 21.1 | 14 | |||
| S12 (Column20) | A74 | p82, p83, p86, p87, p110, p111, p114, p115 | 24.23 | 15 | 50 | 14 |
| A75 | p83, p84, p87, p88, p111, p112, p115, p116 | 24.23 | 15 | |||
| A76 | p84, p85, p88, p89, p112, p113, p116, p117 | 24.23 | 15 | |||
| S13 (Column20) | A77 | p86, p87, p90, p91, p114, p115, p118, p119 | 26.63 | 16 | 20 | 18 |
| A78 | p87, p88, p91, p92, p115, p116, p119, p120 | 26.63 | 16 | |||
| A79 | p88, p89, p92, p93, p116, p117, p120, p121 | 26.63 | 16 | |||
| S14 (Column20) | A80 | p90, p91, p94, p95, p118, p119, p122, p123 | 21.48 | 17 | 20 | 18 |
| A81 | p91, p92, p95, p96, p119, p120, p123, p124 | 21.48 | 17 | |||
| A82 | p92, p93, p96, p97, p120, p121, p124, p125 | 21.48 | 17 | |||
| S15 (Column20) | A83 | p94, p95, p98, p99, p122, p123, p126, p127 | 26.45 | 19 | 20 | 18 |
| A84 | p95, p96, p99, p100, p123, p124, p127, p128 | 26.45 | 19 | |||
| A85 | p96, p97, p100, p101, p124, p125, p128, p129 | 26.45 | 19 | |||
| S16 (Column20) | A86 | p98, p99, p102, p103, p126, p127, p130, p131 | 22.11 | 19 | 20 | 18 |
| A87 | p99, p100, p103, p104, p127, p128, p131, p132 | 22.11 | 19 | |||
| A88 | p100, p101, p104, p105, p128, p129, p132, p133 | 22.11 | 19 | |||
| S17 (Column21) | A89 | p134, p135, p138, p139, p162, p163, p166, p167 | 21.1 | 14 | 20 | 17 |
| A90 | p135, p136, p139, p140, p163, p164, p167, p168 | 21.1 | 14 | |||
| A91 | p136, p137, p140, p141, p164, p165, p168, p169 | 21.1 | 14 | |||
| S18 (Column21) | A92 | p138, p139, p142, p143, p166, p167, p170, p171 | 24.23 | 15 | 50 | 14 |
| A93 | p139, p140, p143, p144, p167, p168, p171, p172 | 24.23 | 15 | |||
| A94 | p140, p141, p144, p145, p168, p169, p172, p173 | 24.23 | 15 | |||
| S19 (Column21) | A95 | p142, p143, p146, p147, p170, p171, p174, p175 | 26.63 | 16 | 20 | 18 |
| A96 | p143, p144, p147, p148, p171, p172, p175, p176 | 26.63 | 16 | |||
| A97 | p144, p145, p148, p149, p172, p173, p176, p177 | 26.63 | 16 | |||
| S20 (Column21) | A98 | p146, p147, p150, p151, p174, p175, p178, p179 | 21.48 | 17 | 20 | 18 |
| A99 | p147, p148, p151, p152, p175, p176, p179, p180 | 21.48 | 17 | |||
| A100 | p148, p149, p152, p153, p176, p177, p180, p181 | 21.48 | 17 | |||
| S21 (Column21) | A101 | p150, p151, p154, p155, p178, p179, p182, p183 | 26.45 | 19 | 20 | 18 |
| A102 | p151, p152, p155, p156, p179, p180, p183, p184 | 26.45 | 19 | |||
| A103 | p152, p153, p156, p157, p180, p181, p184, p185 | 26.45 | 19 | |||
| S22 (Column21) | A104 | p154, p155, p158, p159, p182, p183, p186, p187 | 22.11 | 19 | 20 | 18 |
| A105 | p155, p156, p159, p160, p183, p184, p187, p188 | 22.11 | 19 | |||
| A106 | p156, p157, p160, p161, p184, p185, p188, p189 | 22.11 | 19 | |||
Disclaimer/Publisher’s Note: The statements, opinions and data contained in all publications are solely those of the individual author(s) and contributor(s) and not of MDPI and/or the editor(s). MDPI and/or the editor(s) disclaim responsibility for any injury to people or property resulting from any ideas, methods, instructions or products referred to in the content. |
© 2023 by the authors. Licensee MDPI, Basel, Switzerland. This article is an open access article distributed under the terms and conditions of the Creative Commons Attribution (CC BY) license (https://creativecommons.org/licenses/by/4.0/).
Share and Cite
Hadizadeh-Bazaz, M.; Navarro, I.J.; Yepes, V. Life-Cycle Cost Assessment Using the Power Spectral Density Function in a Coastal Concrete Bridge. J. Mar. Sci. Eng. 2023, 11, 433. https://doi.org/10.3390/jmse11020433
Hadizadeh-Bazaz M, Navarro IJ, Yepes V. Life-Cycle Cost Assessment Using the Power Spectral Density Function in a Coastal Concrete Bridge. Journal of Marine Science and Engineering. 2023; 11(2):433. https://doi.org/10.3390/jmse11020433
Chicago/Turabian StyleHadizadeh-Bazaz, Mehrdad, Ignacio J. Navarro, and Víctor Yepes. 2023. "Life-Cycle Cost Assessment Using the Power Spectral Density Function in a Coastal Concrete Bridge" Journal of Marine Science and Engineering 11, no. 2: 433. https://doi.org/10.3390/jmse11020433