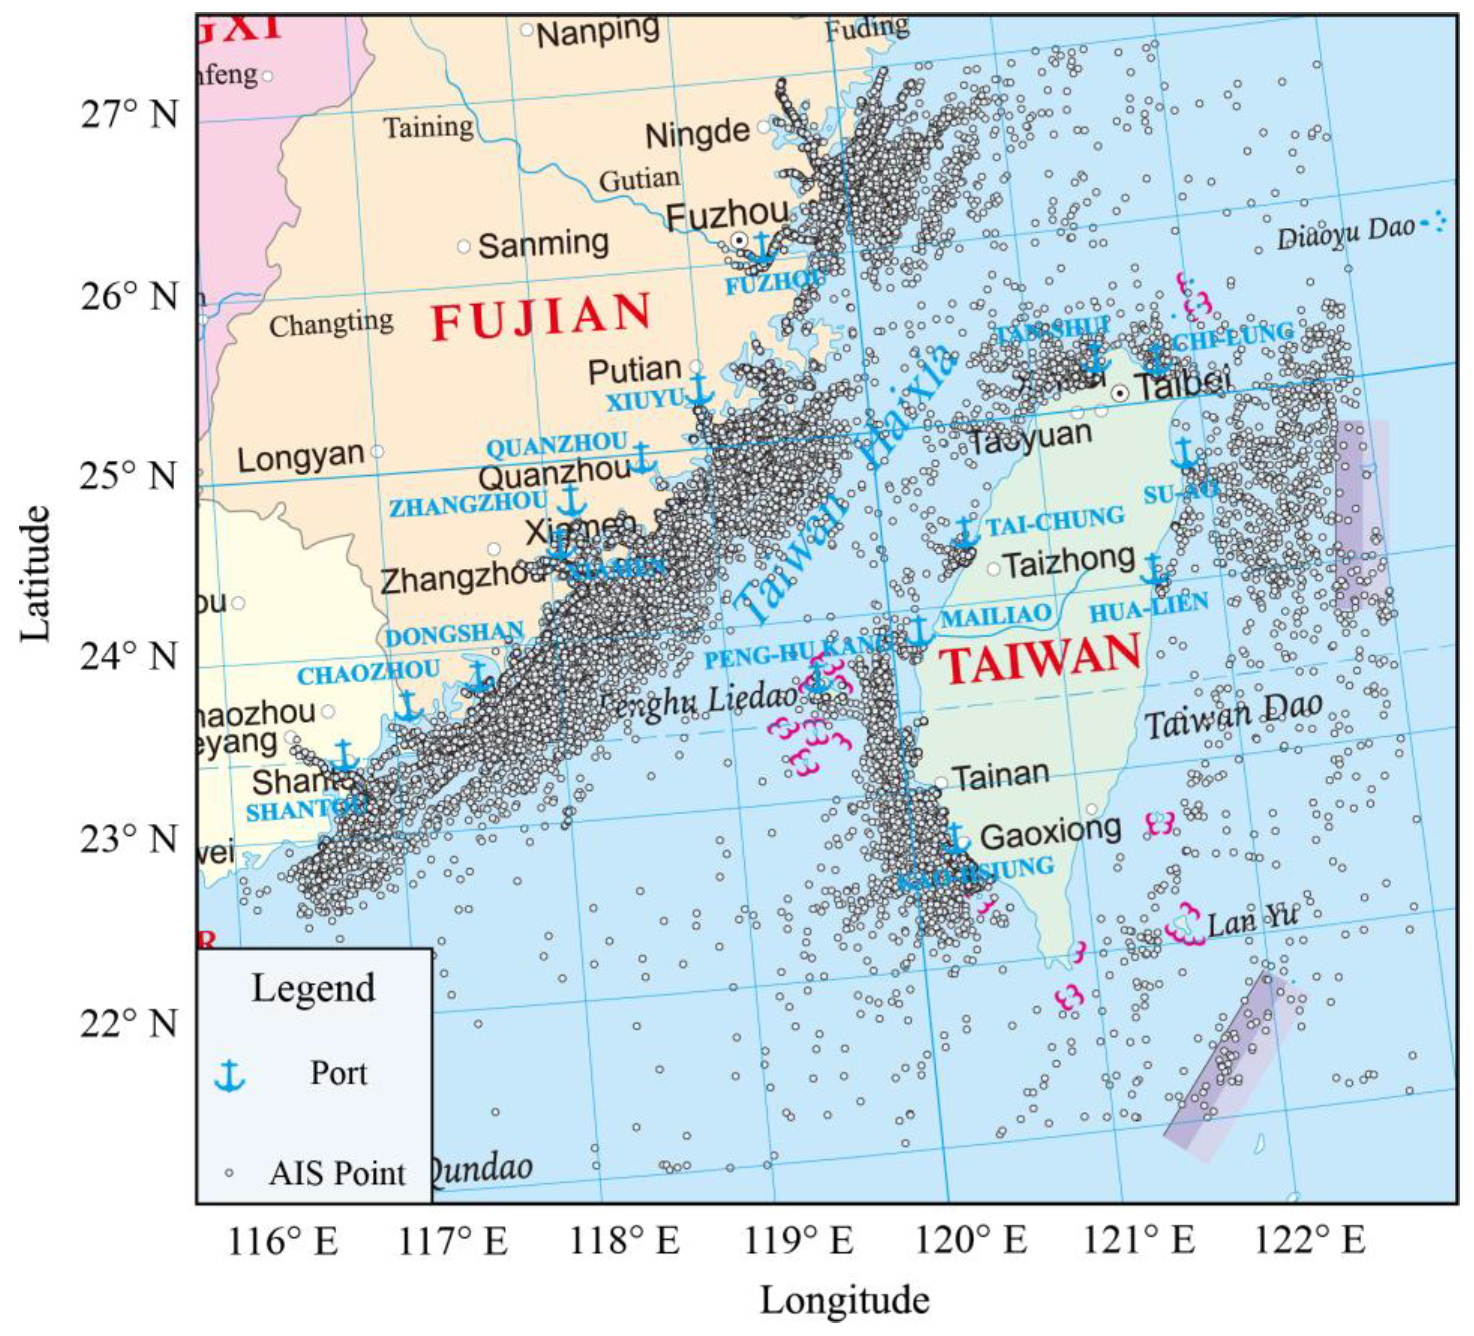
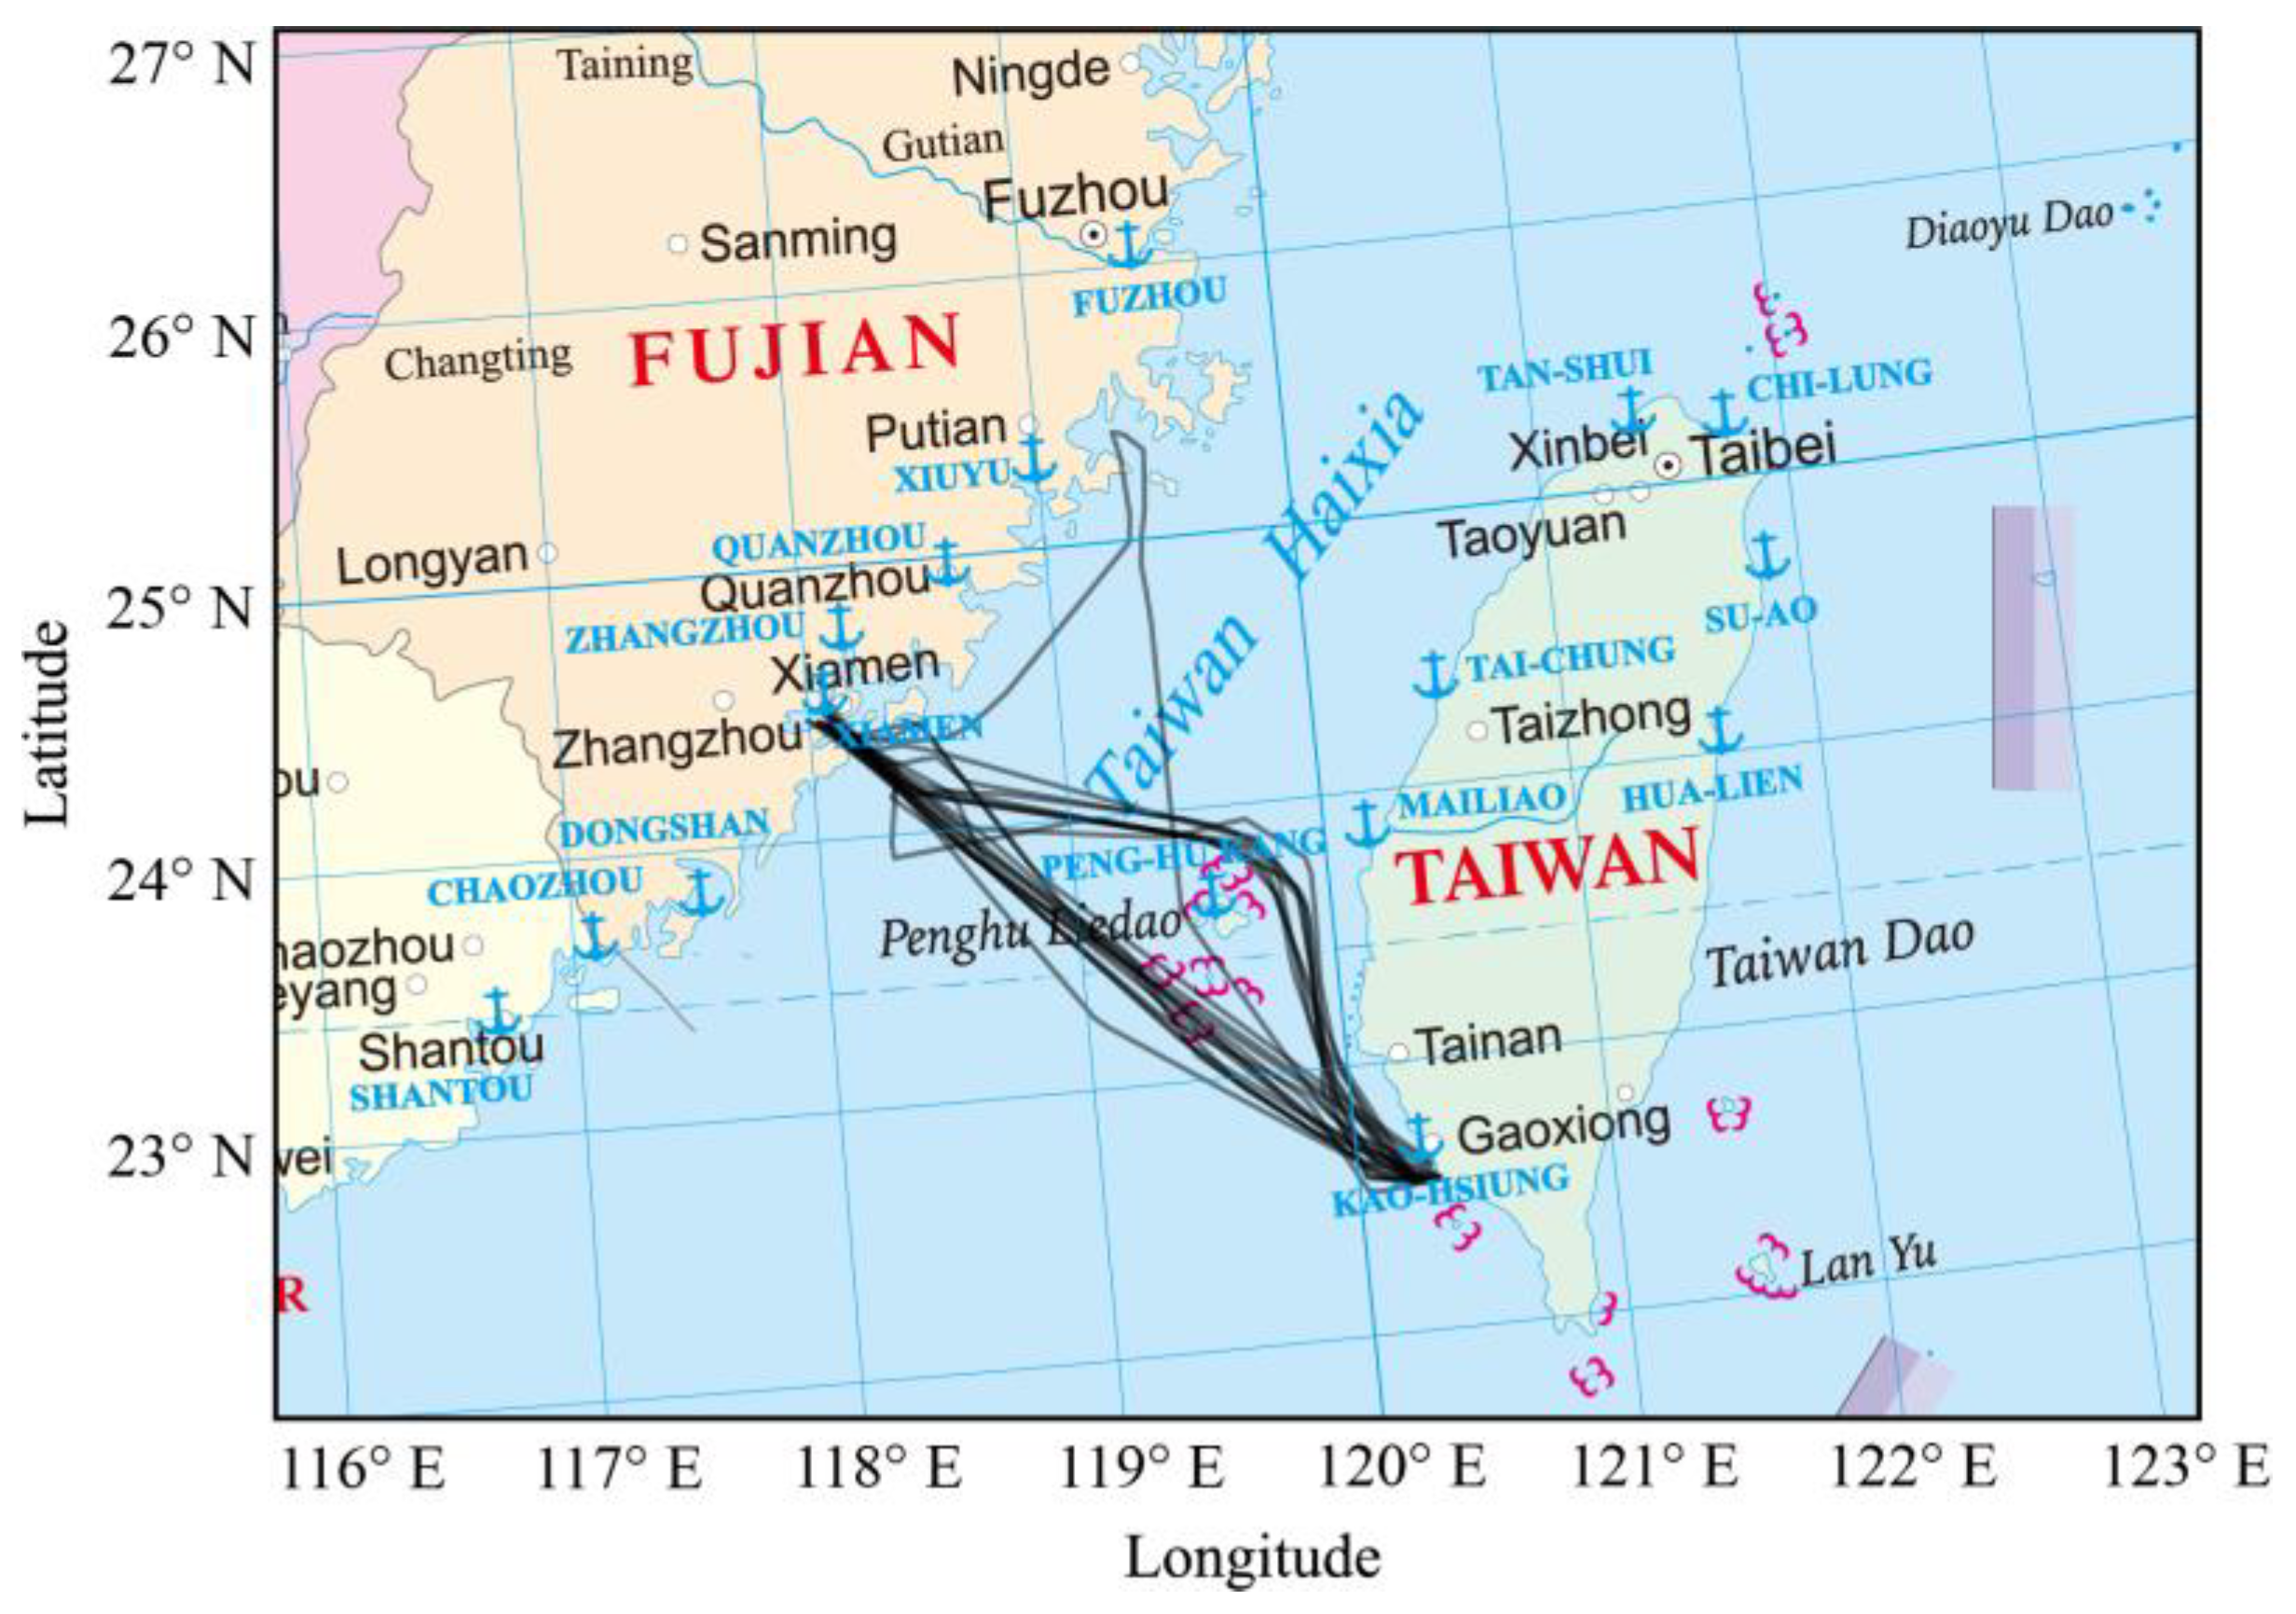
Figure 1.
Study area and AIS data. Only 5% of overall AIS data is shown due to mapping effect. The background image is the standard map of the Ministry of Natural Resources of China, and the review number is GS(2020)4634.
Figure 1.
Study area and AIS data. Only 5% of overall AIS data is shown due to mapping effect. The background image is the standard map of the Ministry of Natural Resources of China, and the review number is GS(2020)4634.
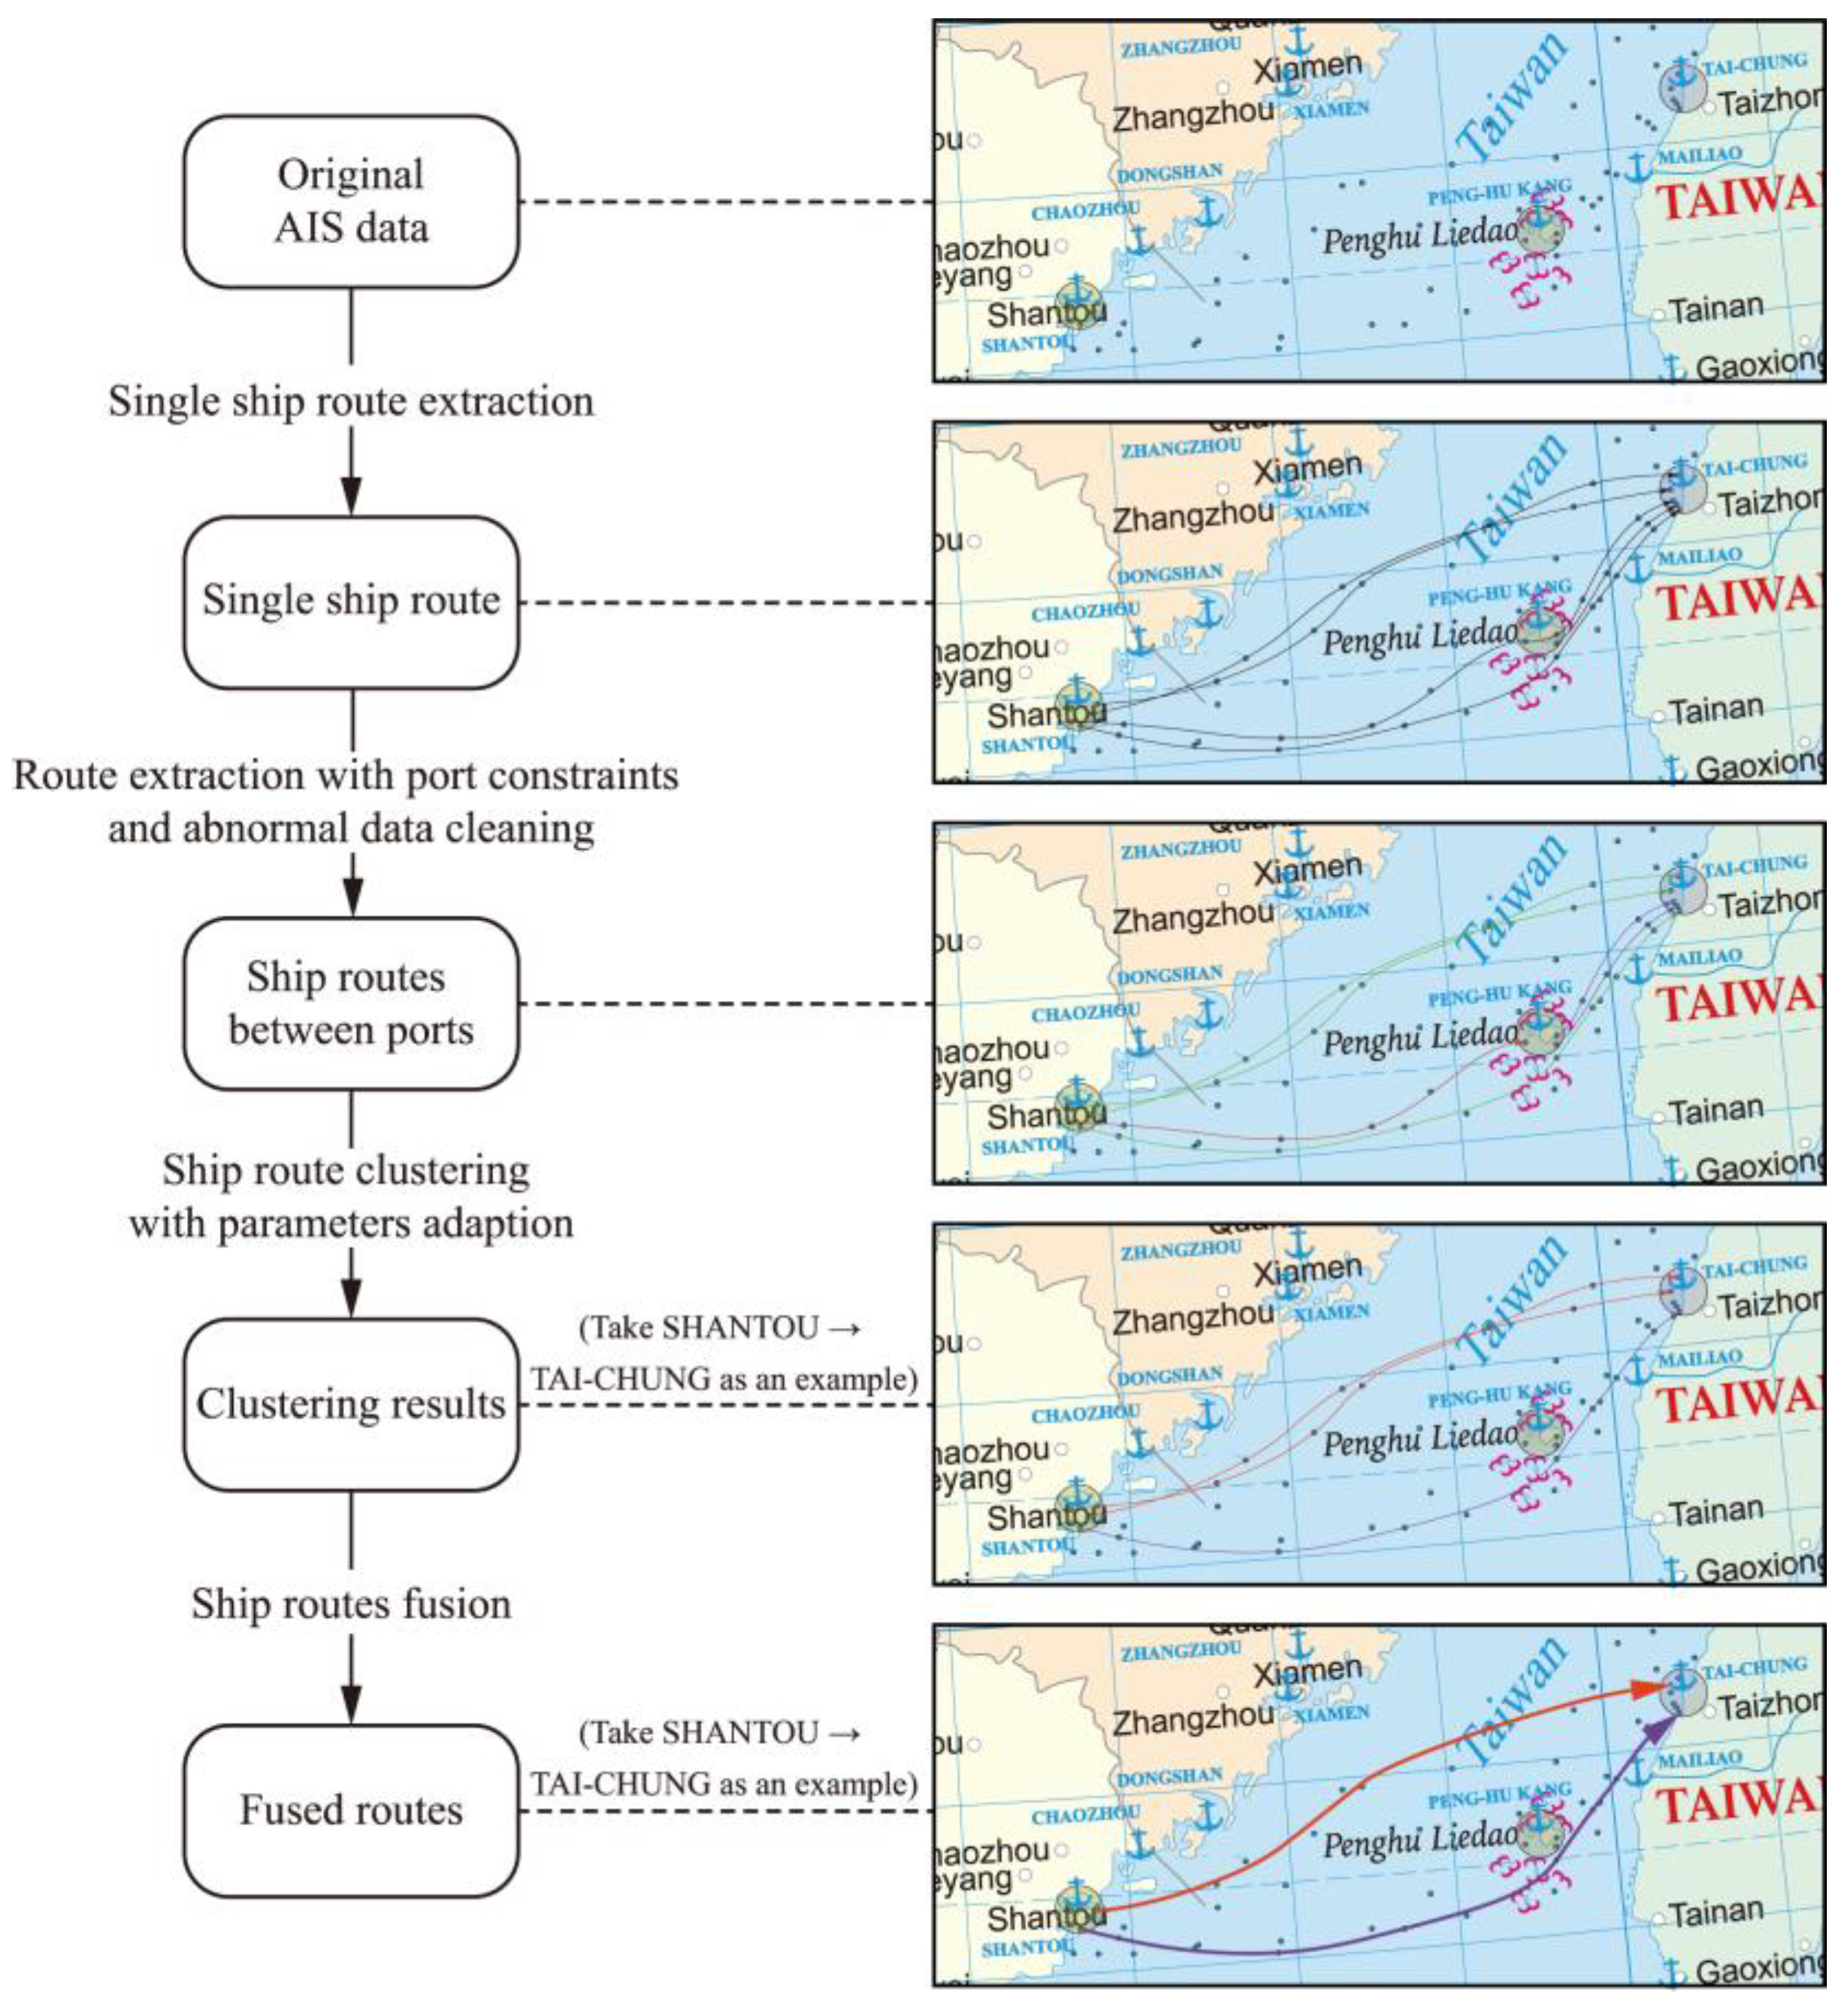
Figure 2.
Flowchart of BIRCH clustering based on resampling.
Figure 2.
Flowchart of BIRCH clustering based on resampling.
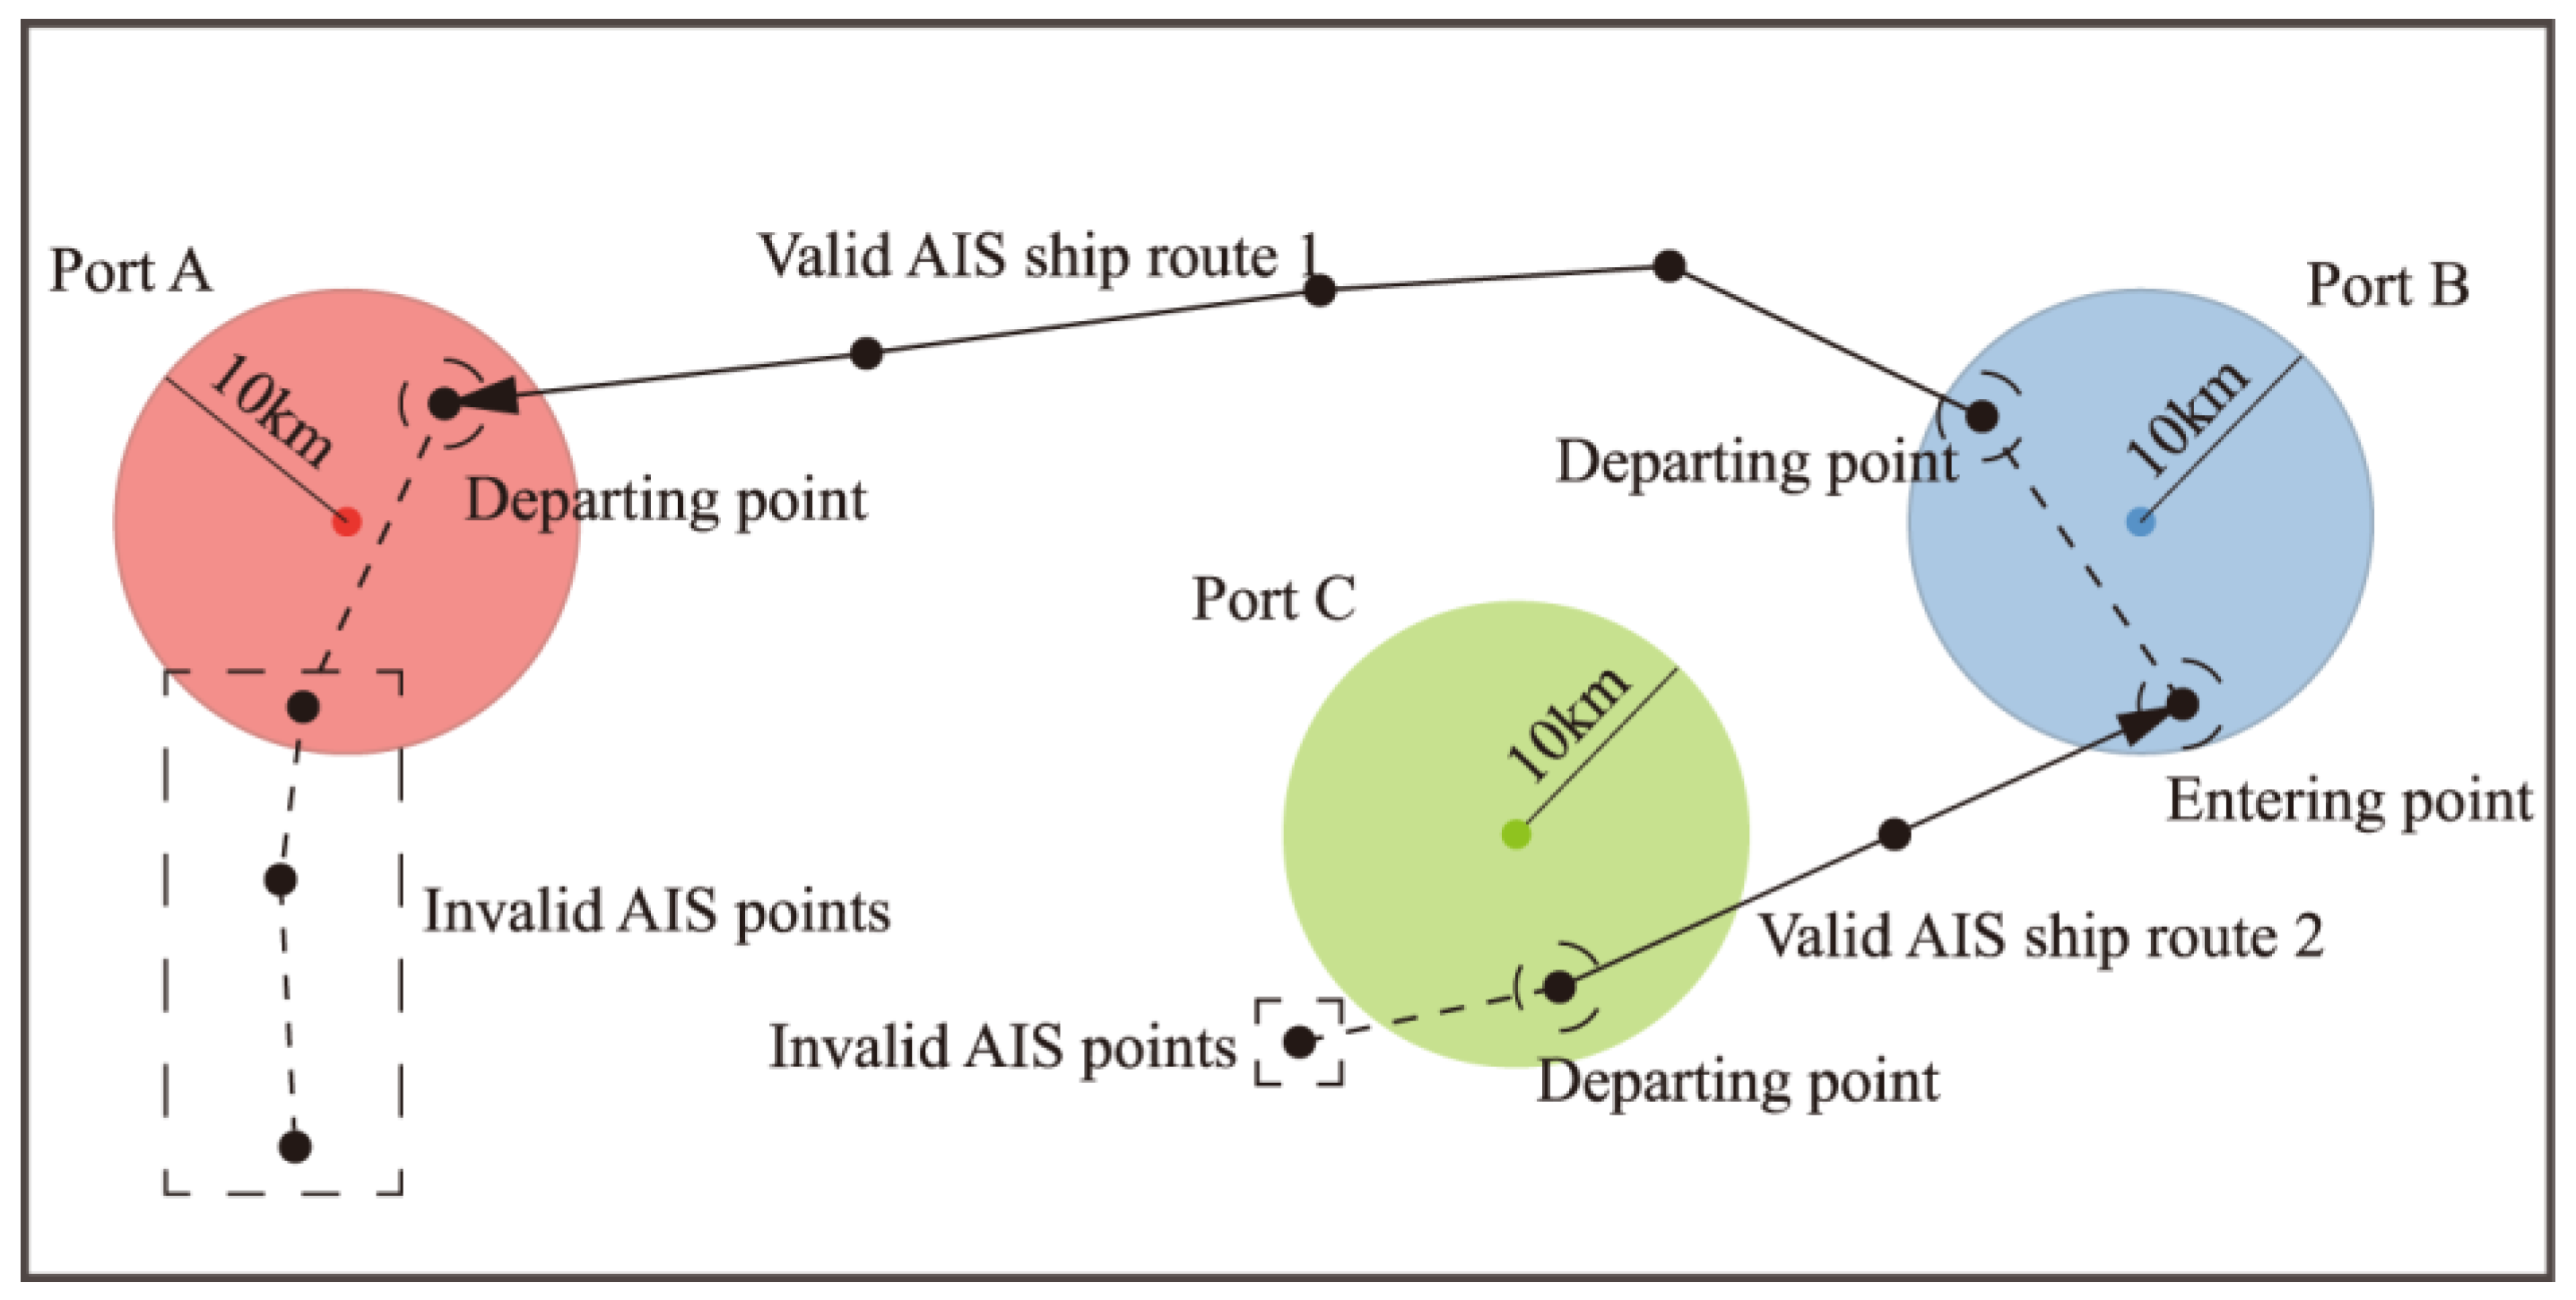
Figure 3.
Schematic diagram of single-ship voyage division based on inbound and outbound identification.
Figure 3.
Schematic diagram of single-ship voyage division based on inbound and outbound identification.
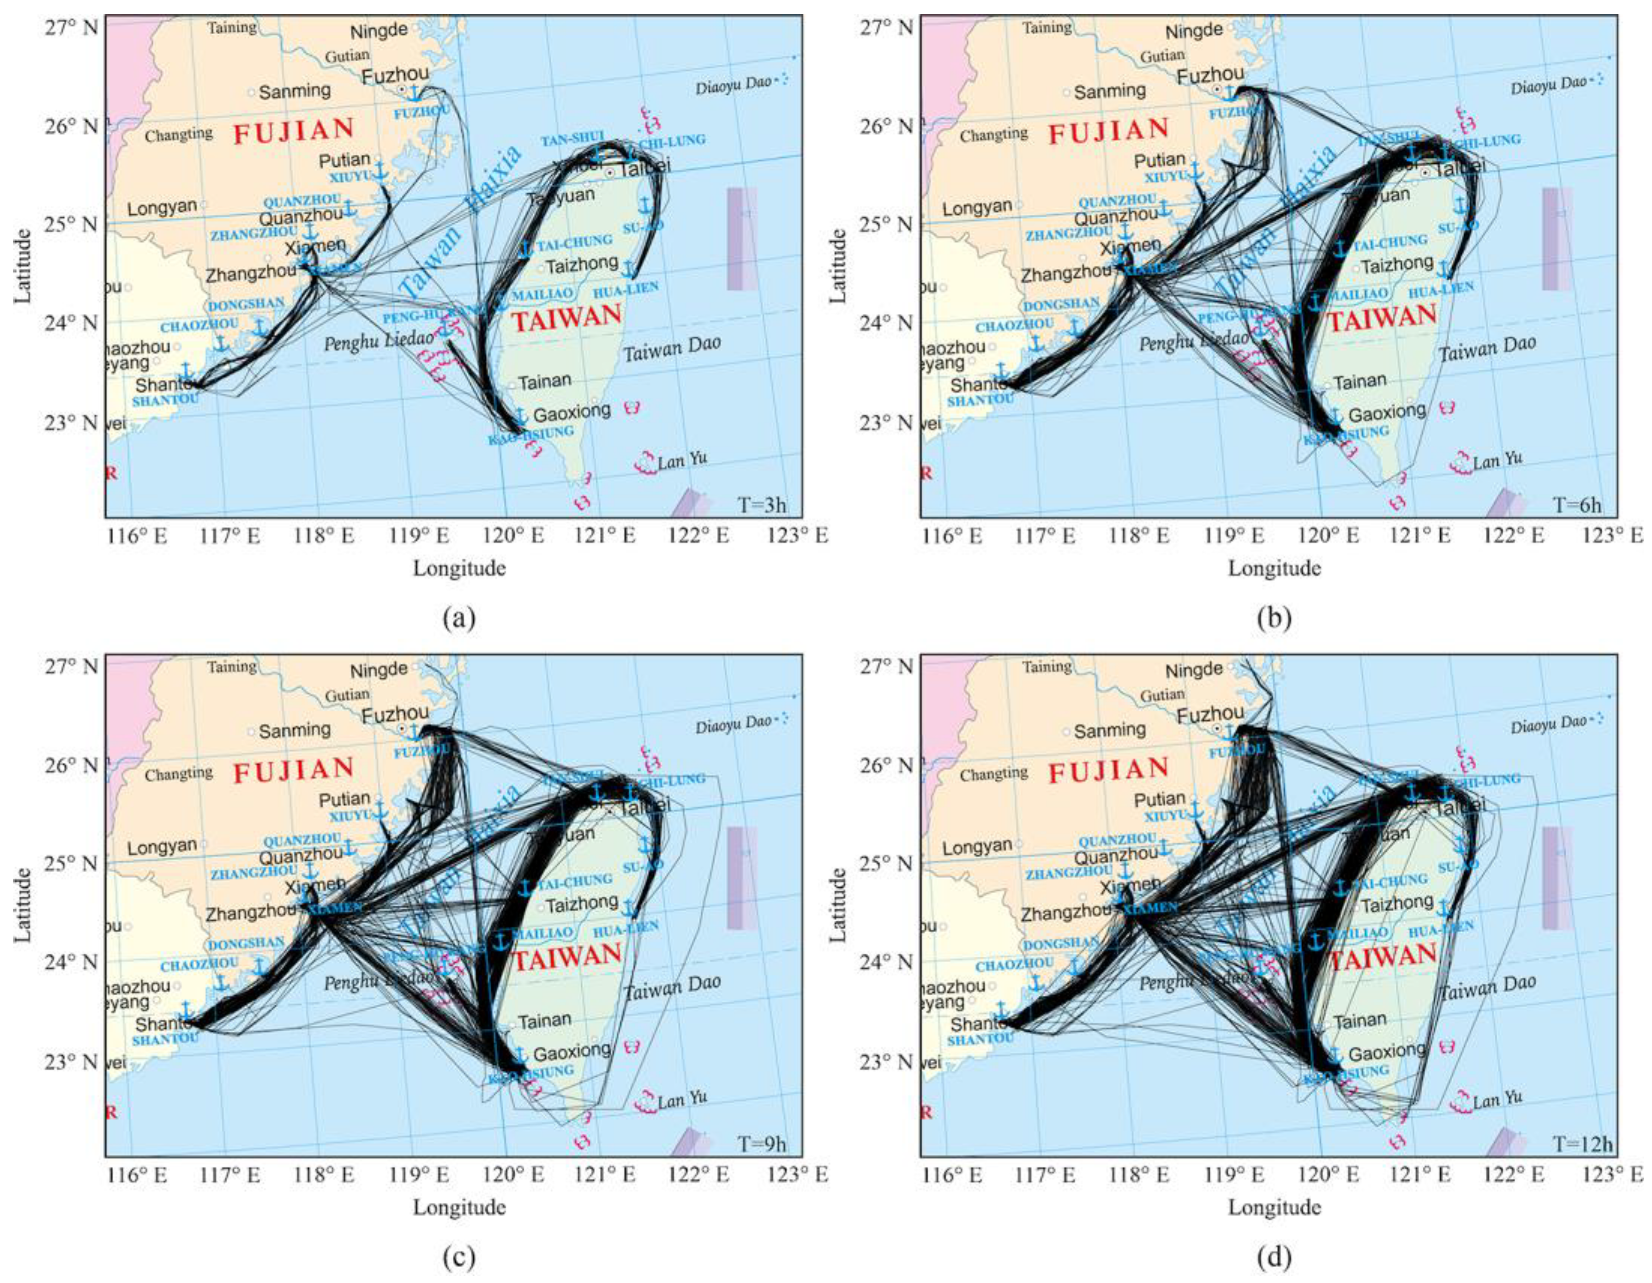
Figure 4.
Ship trajectories obtained with different time difference thresholds between consecutive trajectory points. (a–d) correspond to the time difference thresholds of 3 h, 6 h, 9 h, and 12 h, respectively.
Figure 4.
Ship trajectories obtained with different time difference thresholds between consecutive trajectory points. (a–d) correspond to the time difference thresholds of 3 h, 6 h, 9 h, and 12 h, respectively.
Figure 5.
Ship trajectory map from Kaohsiung Port to Xiamen Port.
Figure 5.
Ship trajectory map from Kaohsiung Port to Xiamen Port.
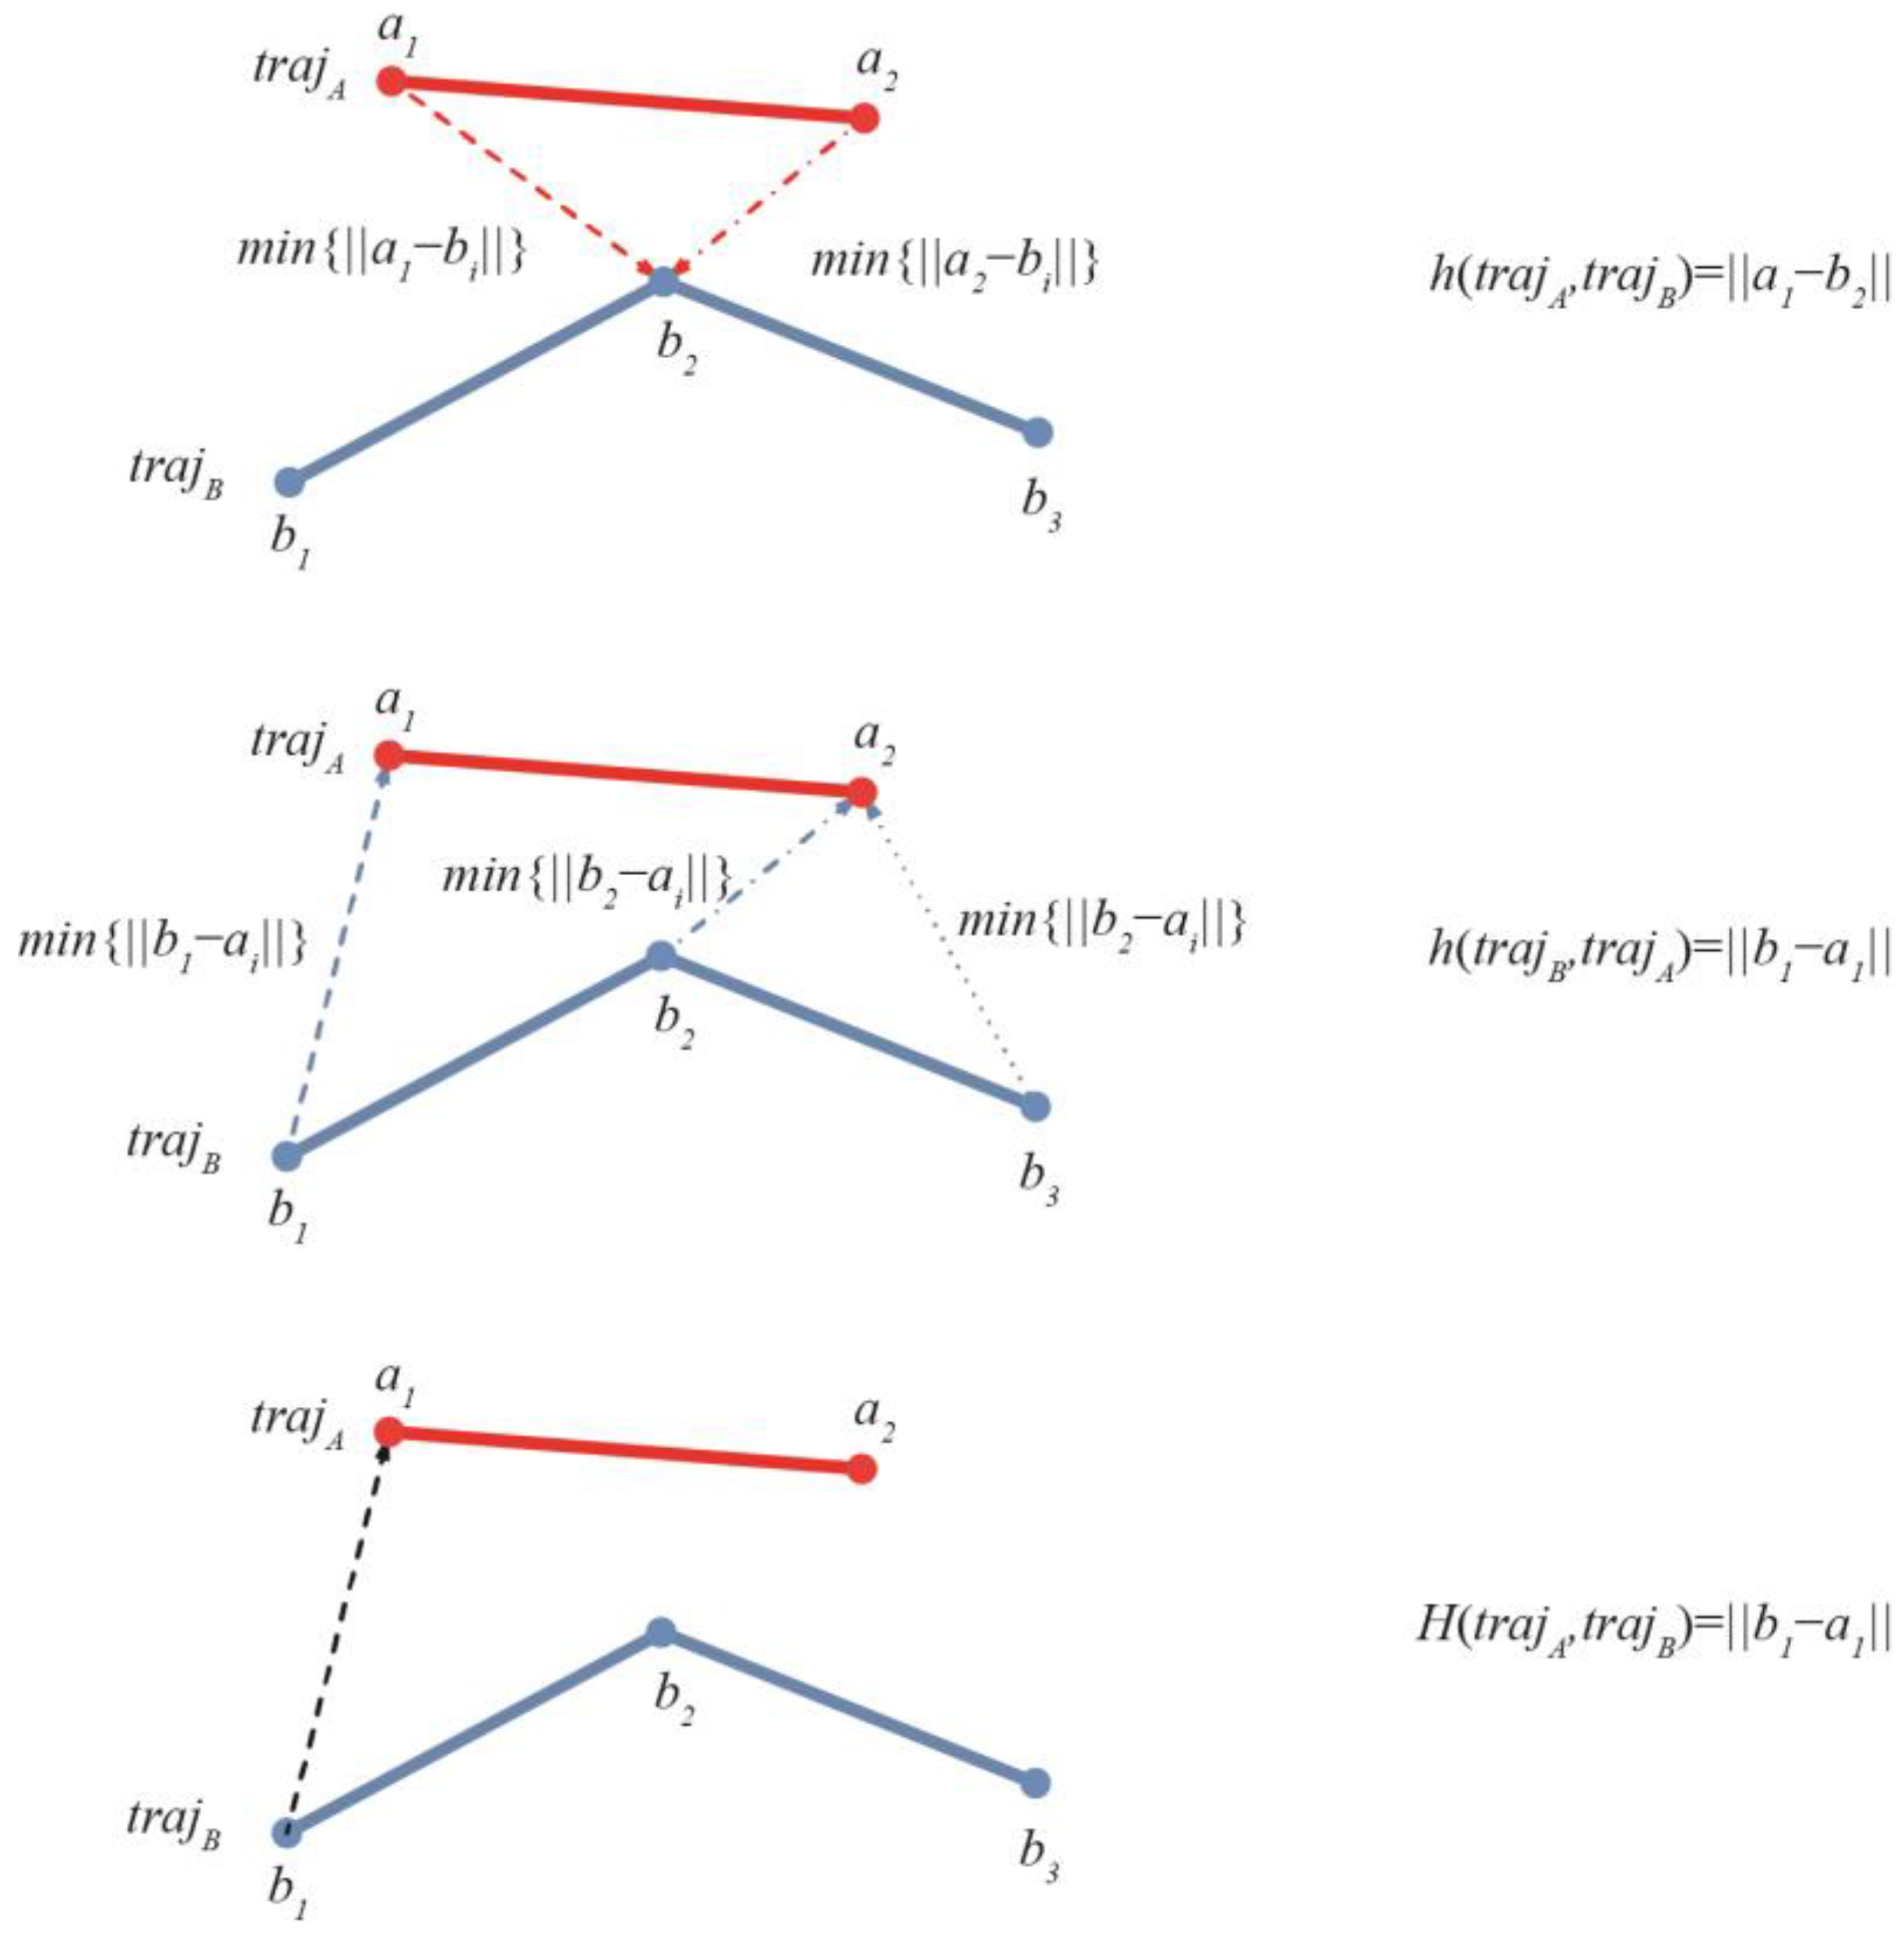
Figure 6.
Schematic diagram of Hausdorff distance.
Figure 6.
Schematic diagram of Hausdorff distance.
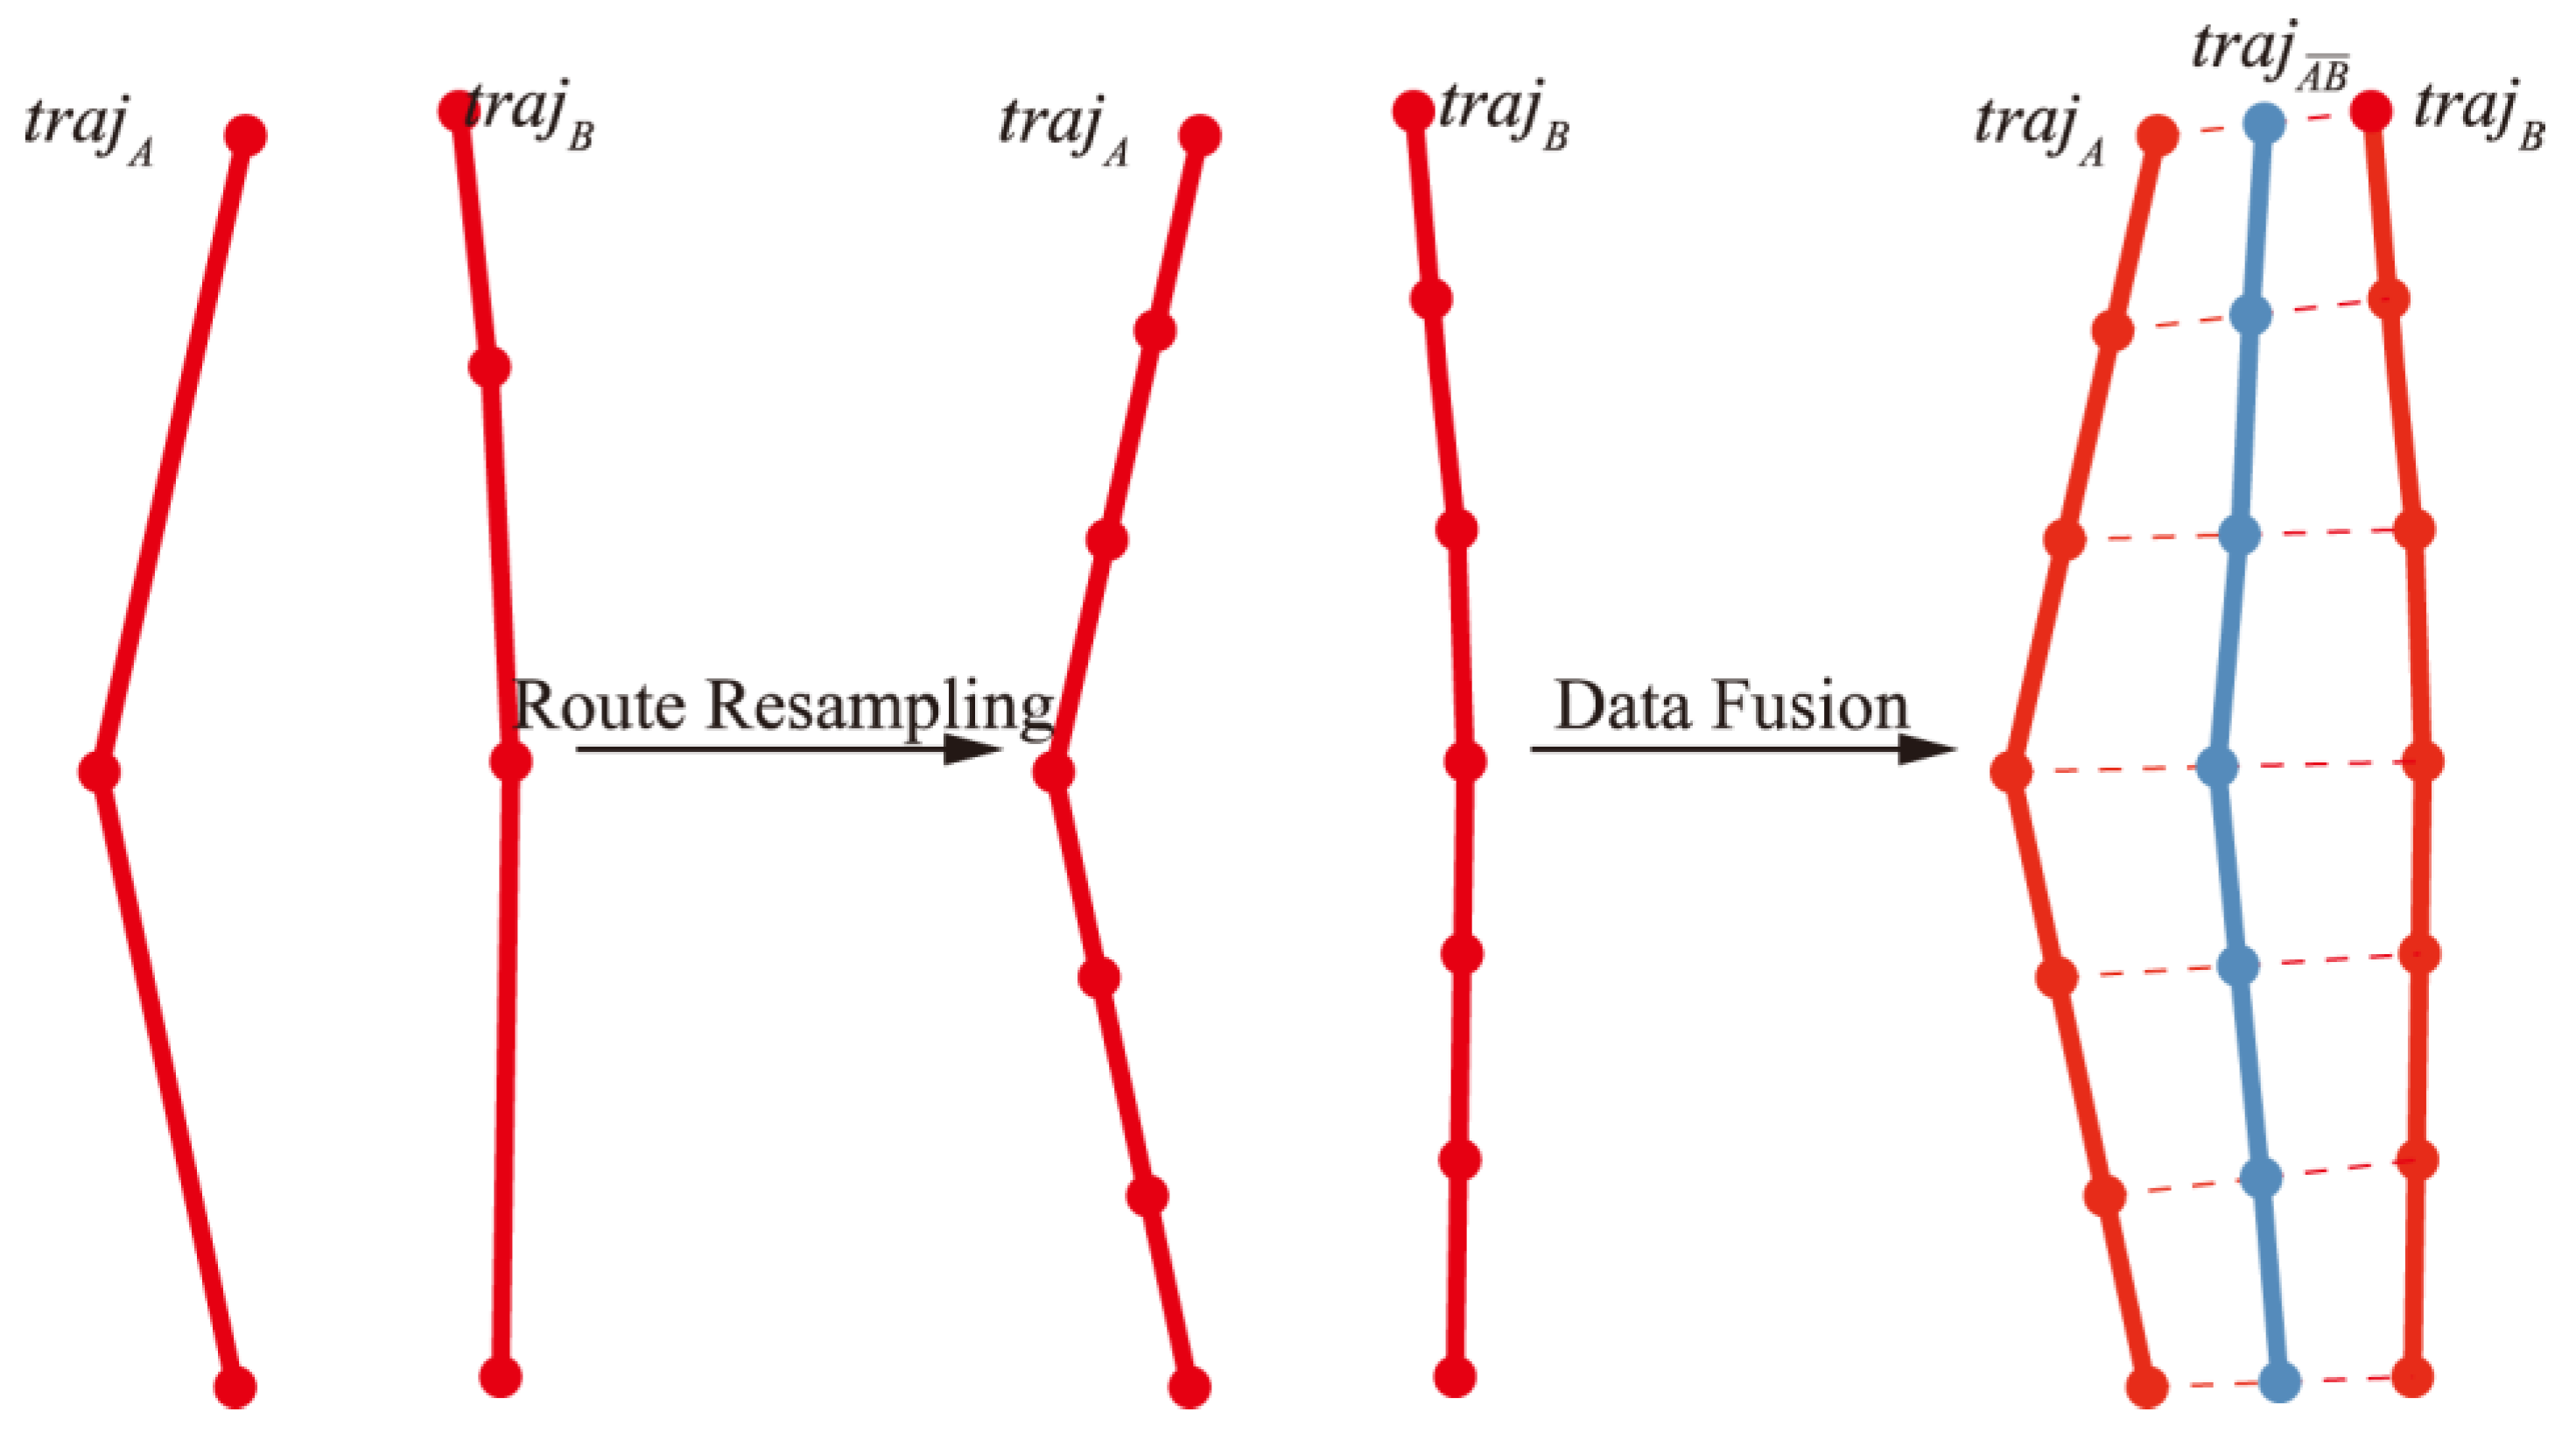
Figure 7.
Ship trajectory fusion extraction.
Figure 7.
Ship trajectory fusion extraction.
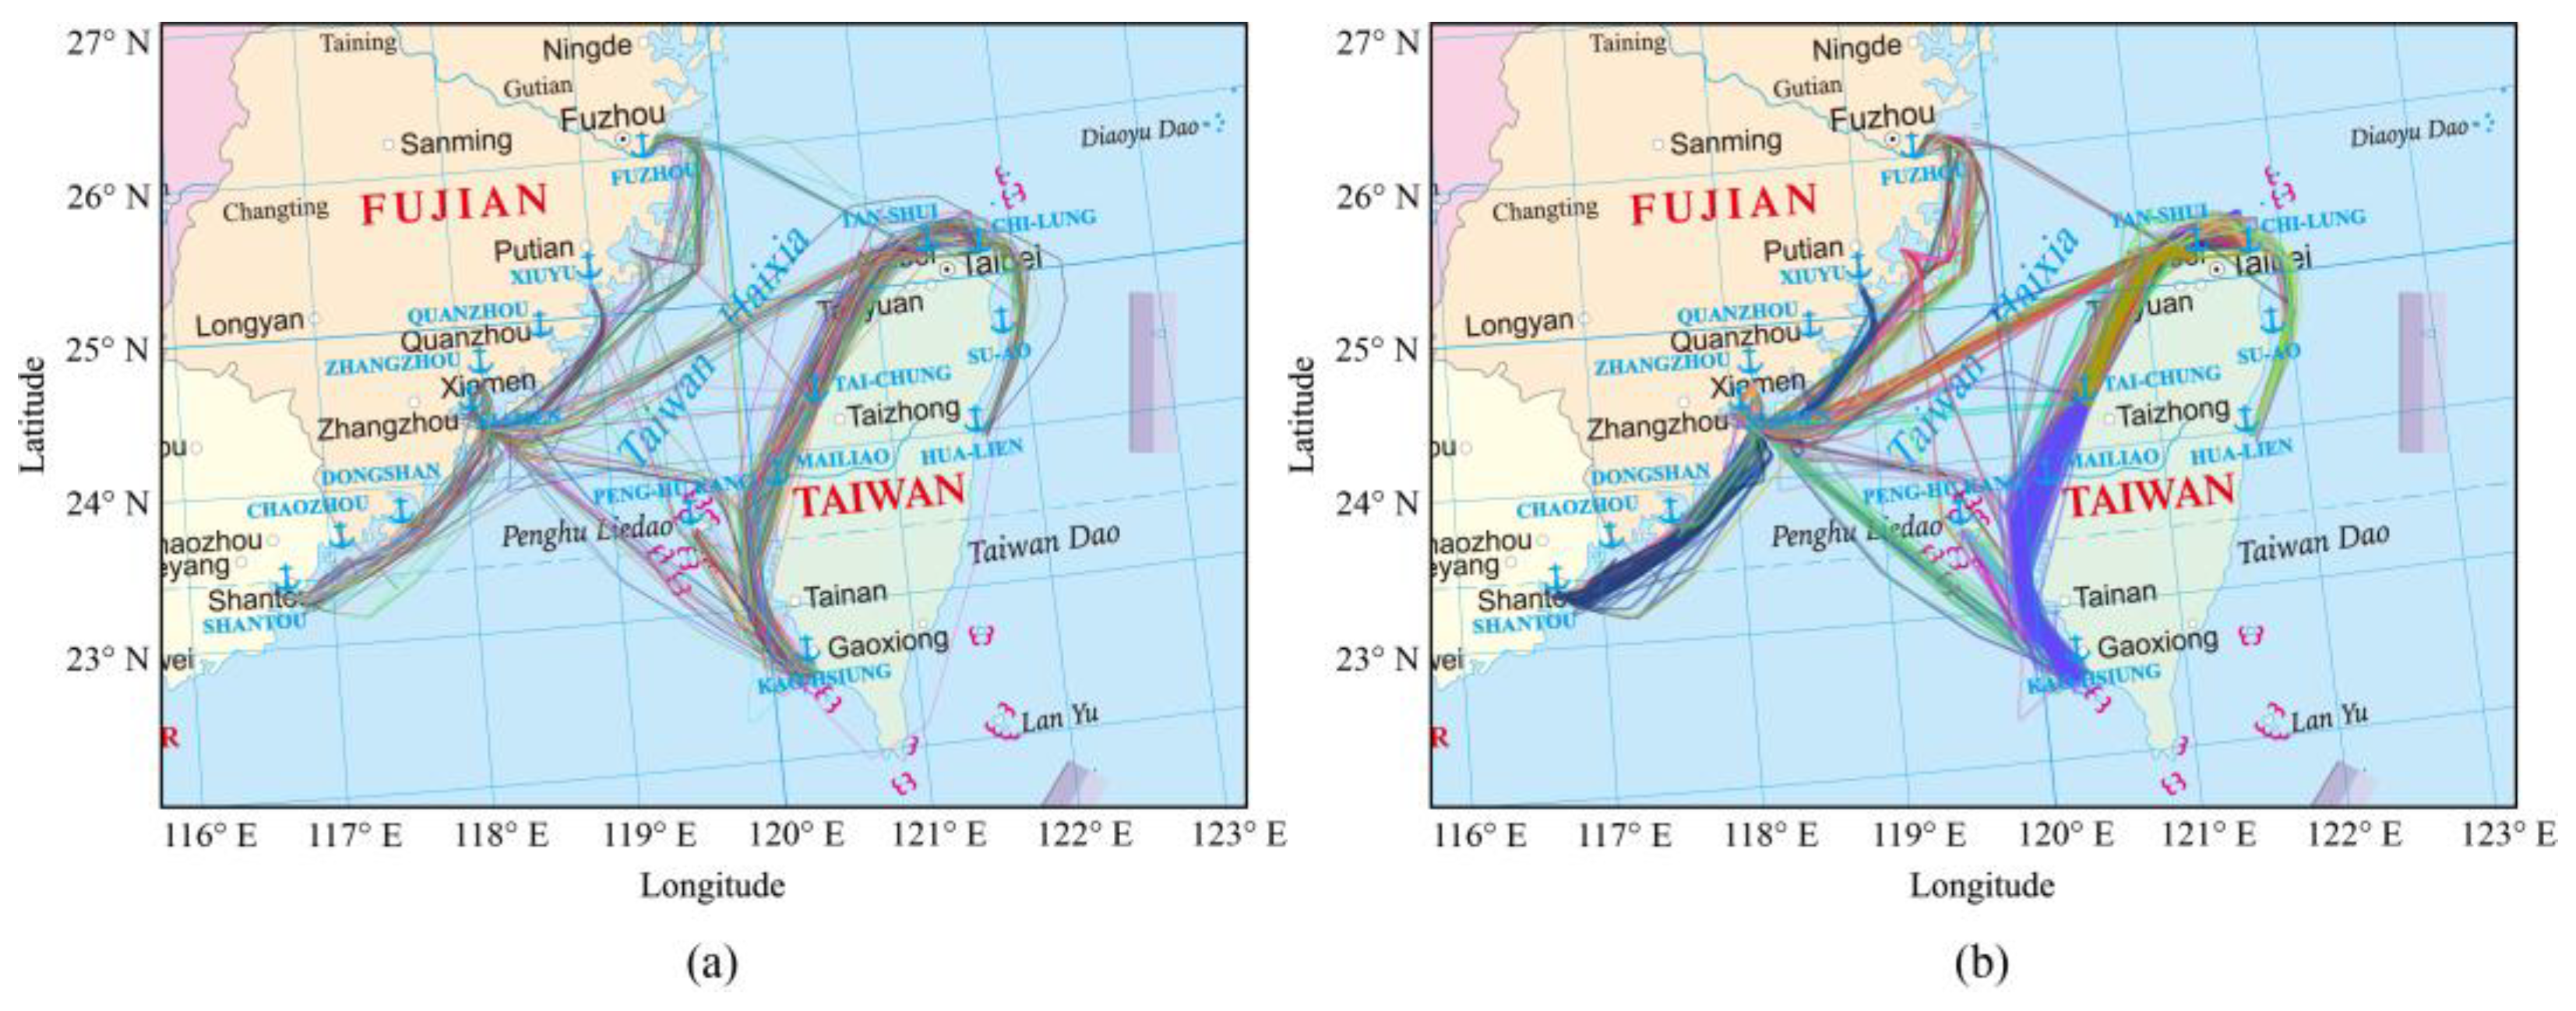
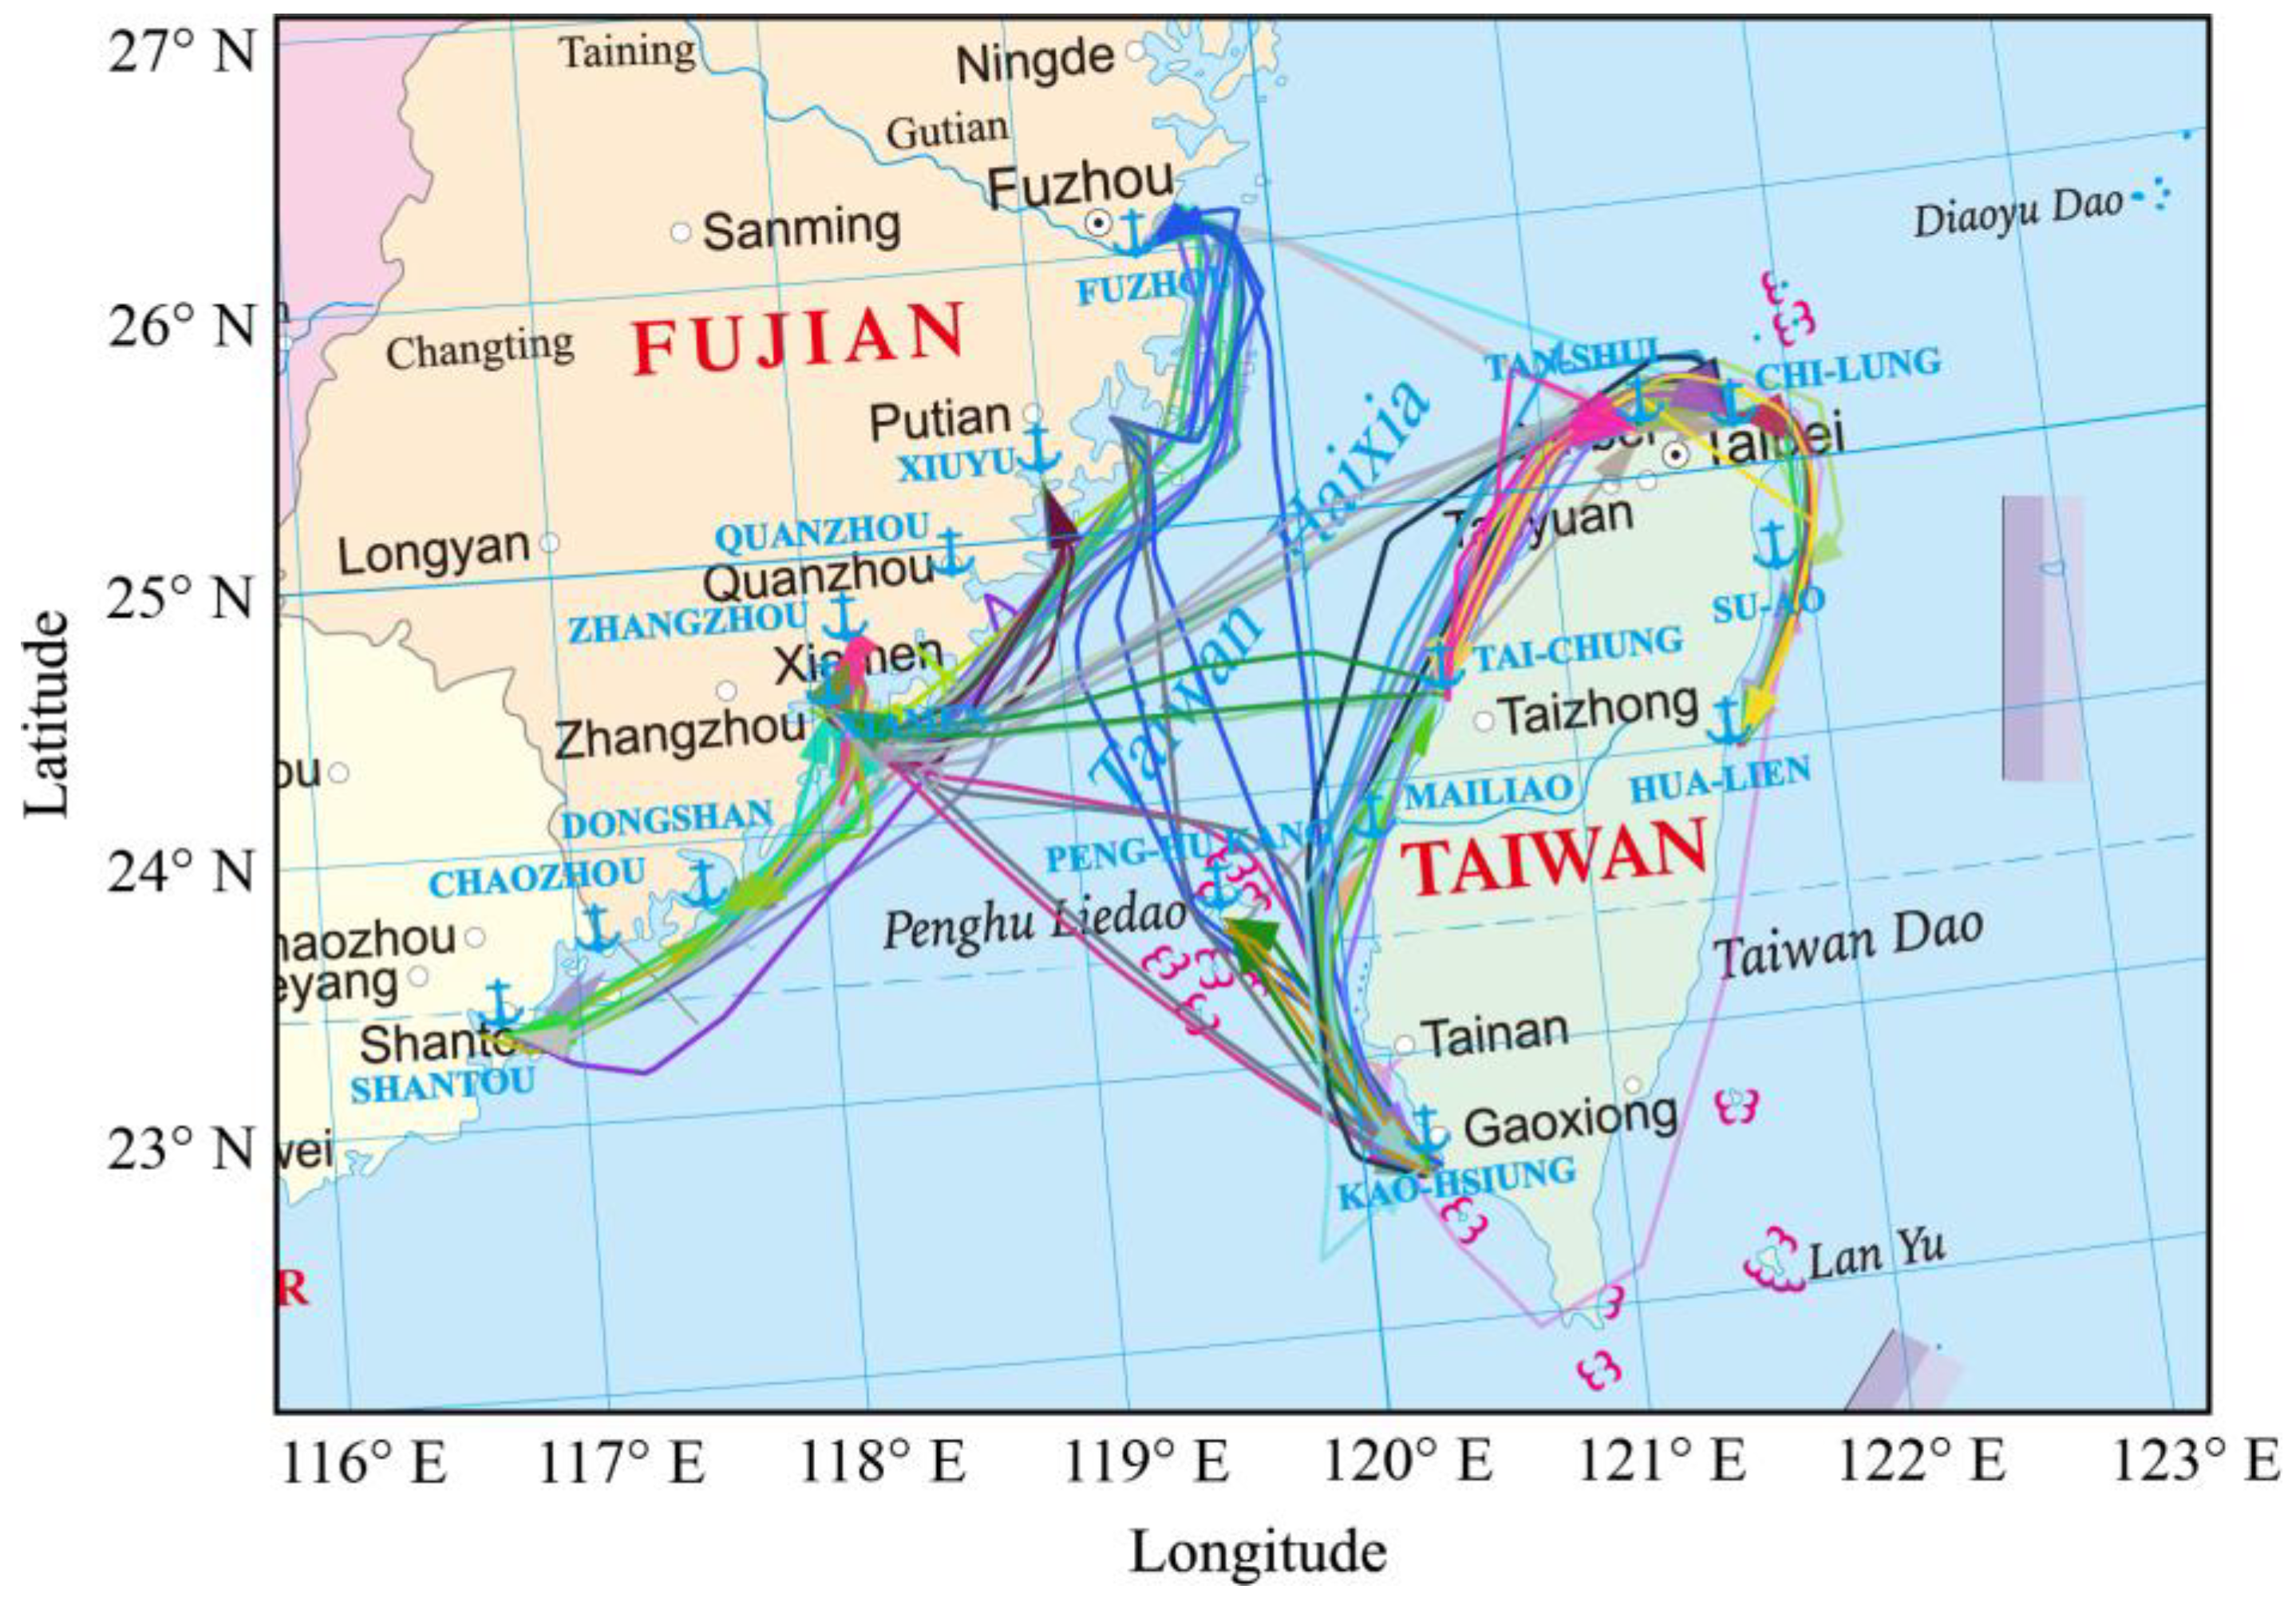
Figure 8.
Spatial distribution of ship trajectories and trajectory clustering results between ports in the study area. (a) shows the ship trajectories extracted based on AIS data. (b) shows the clustering result of ship trajectories, where trajectories with the same color belong to the same clustering class.
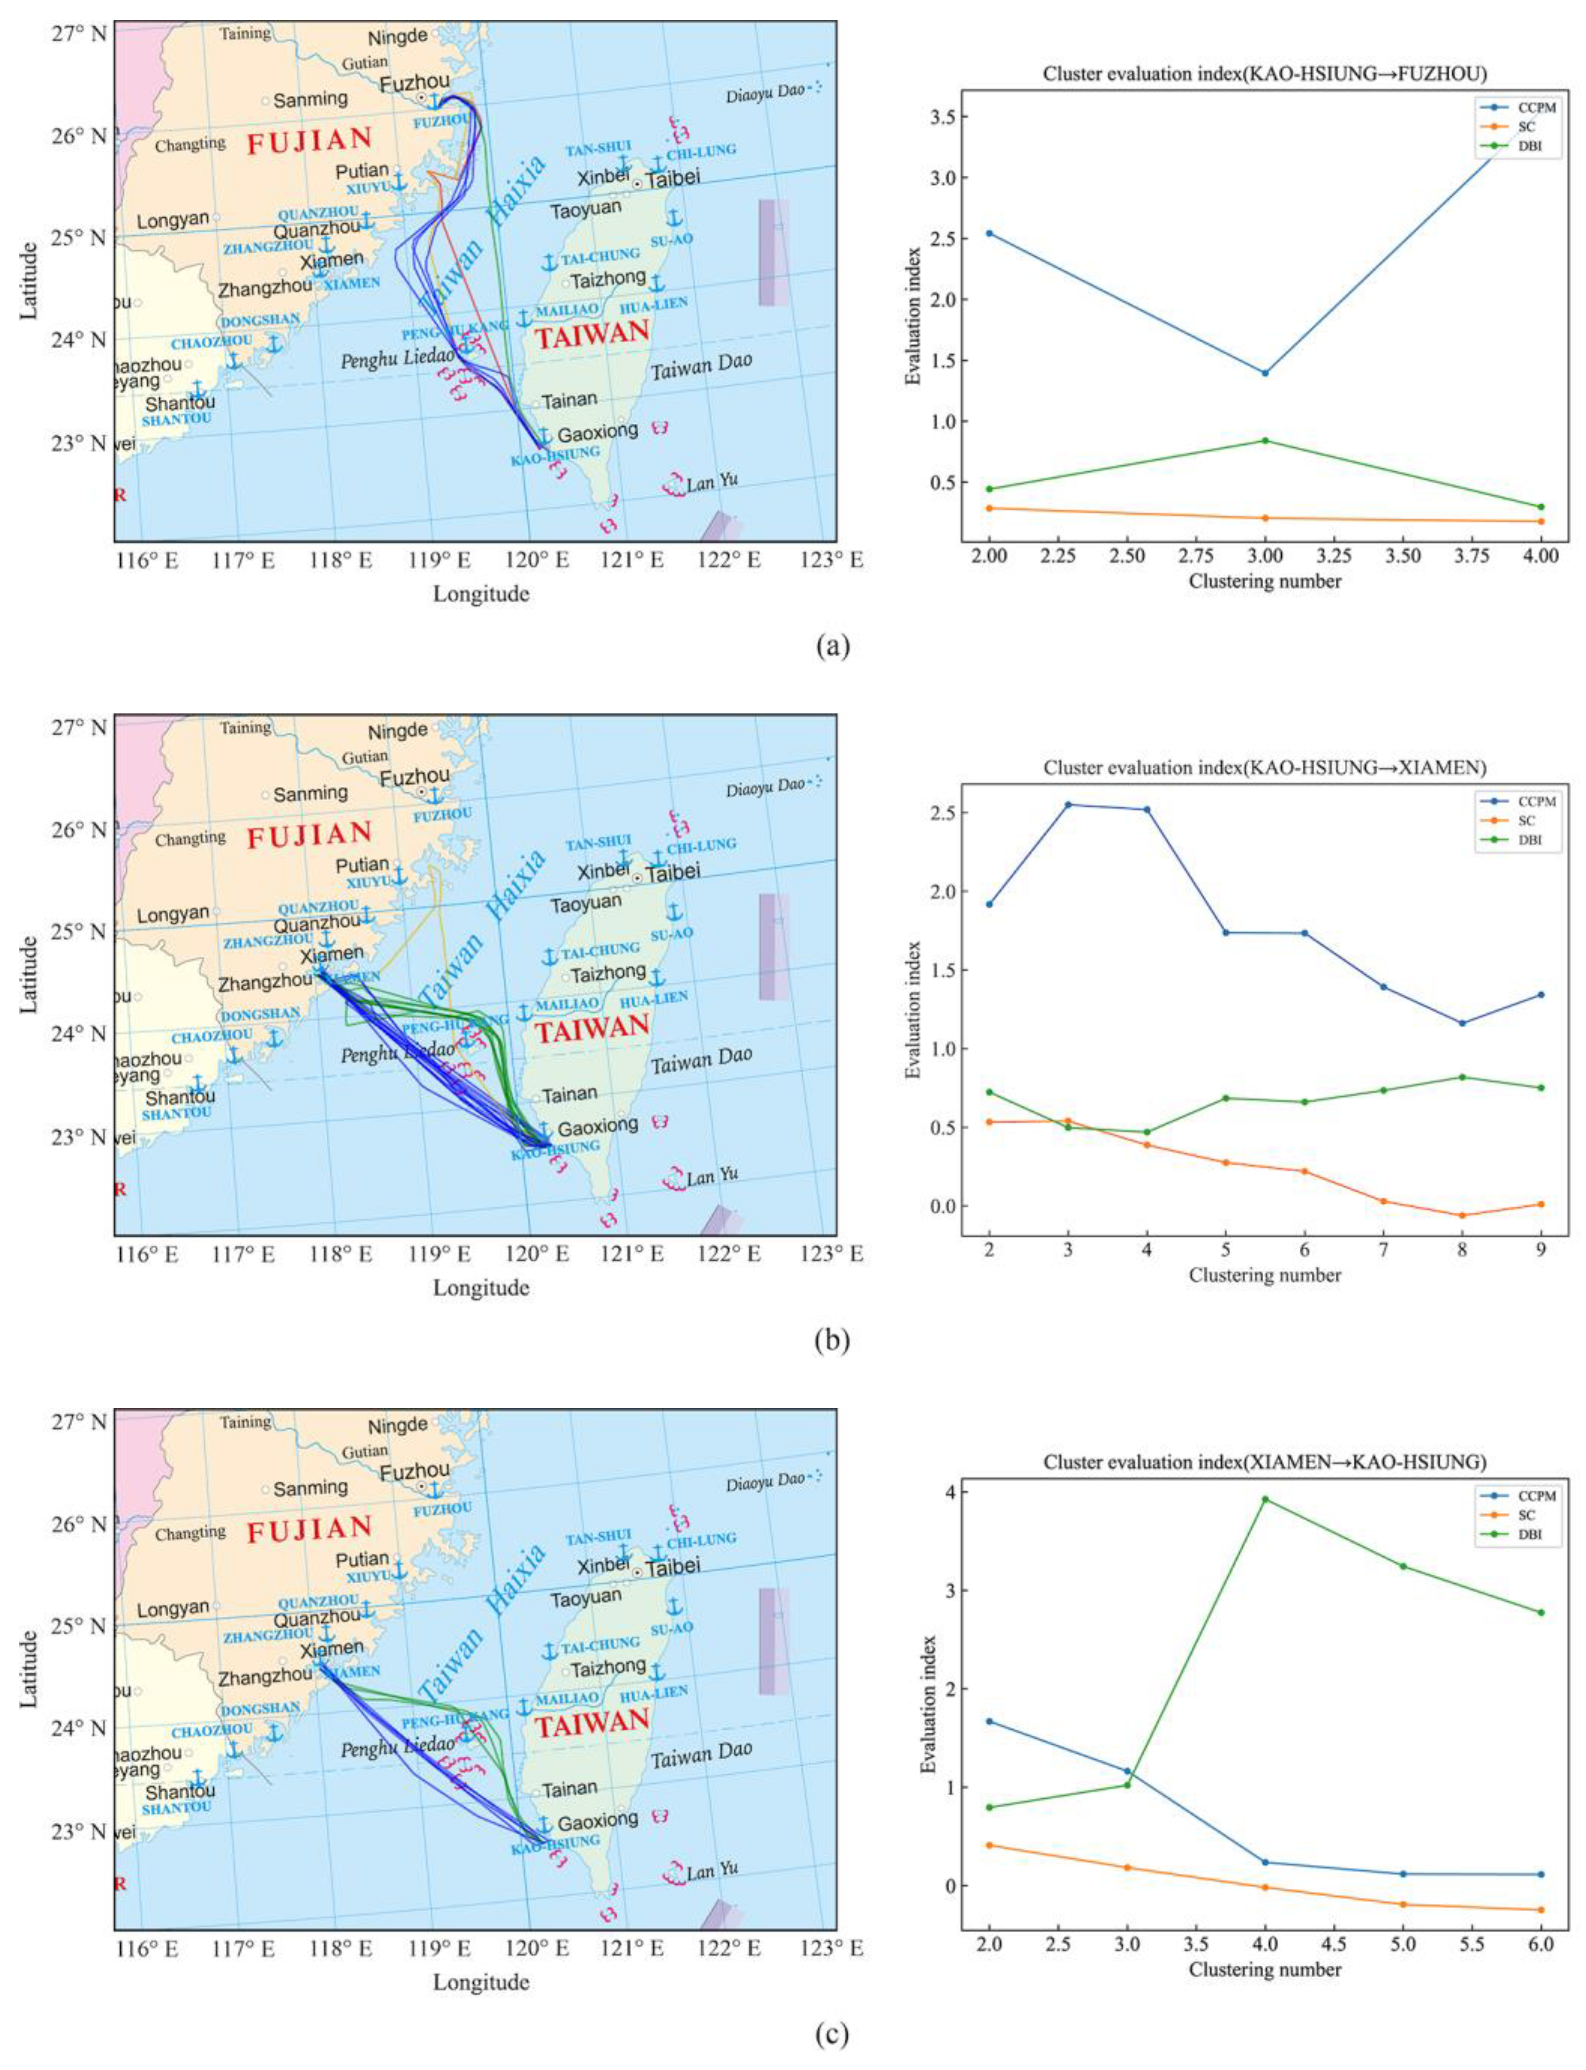
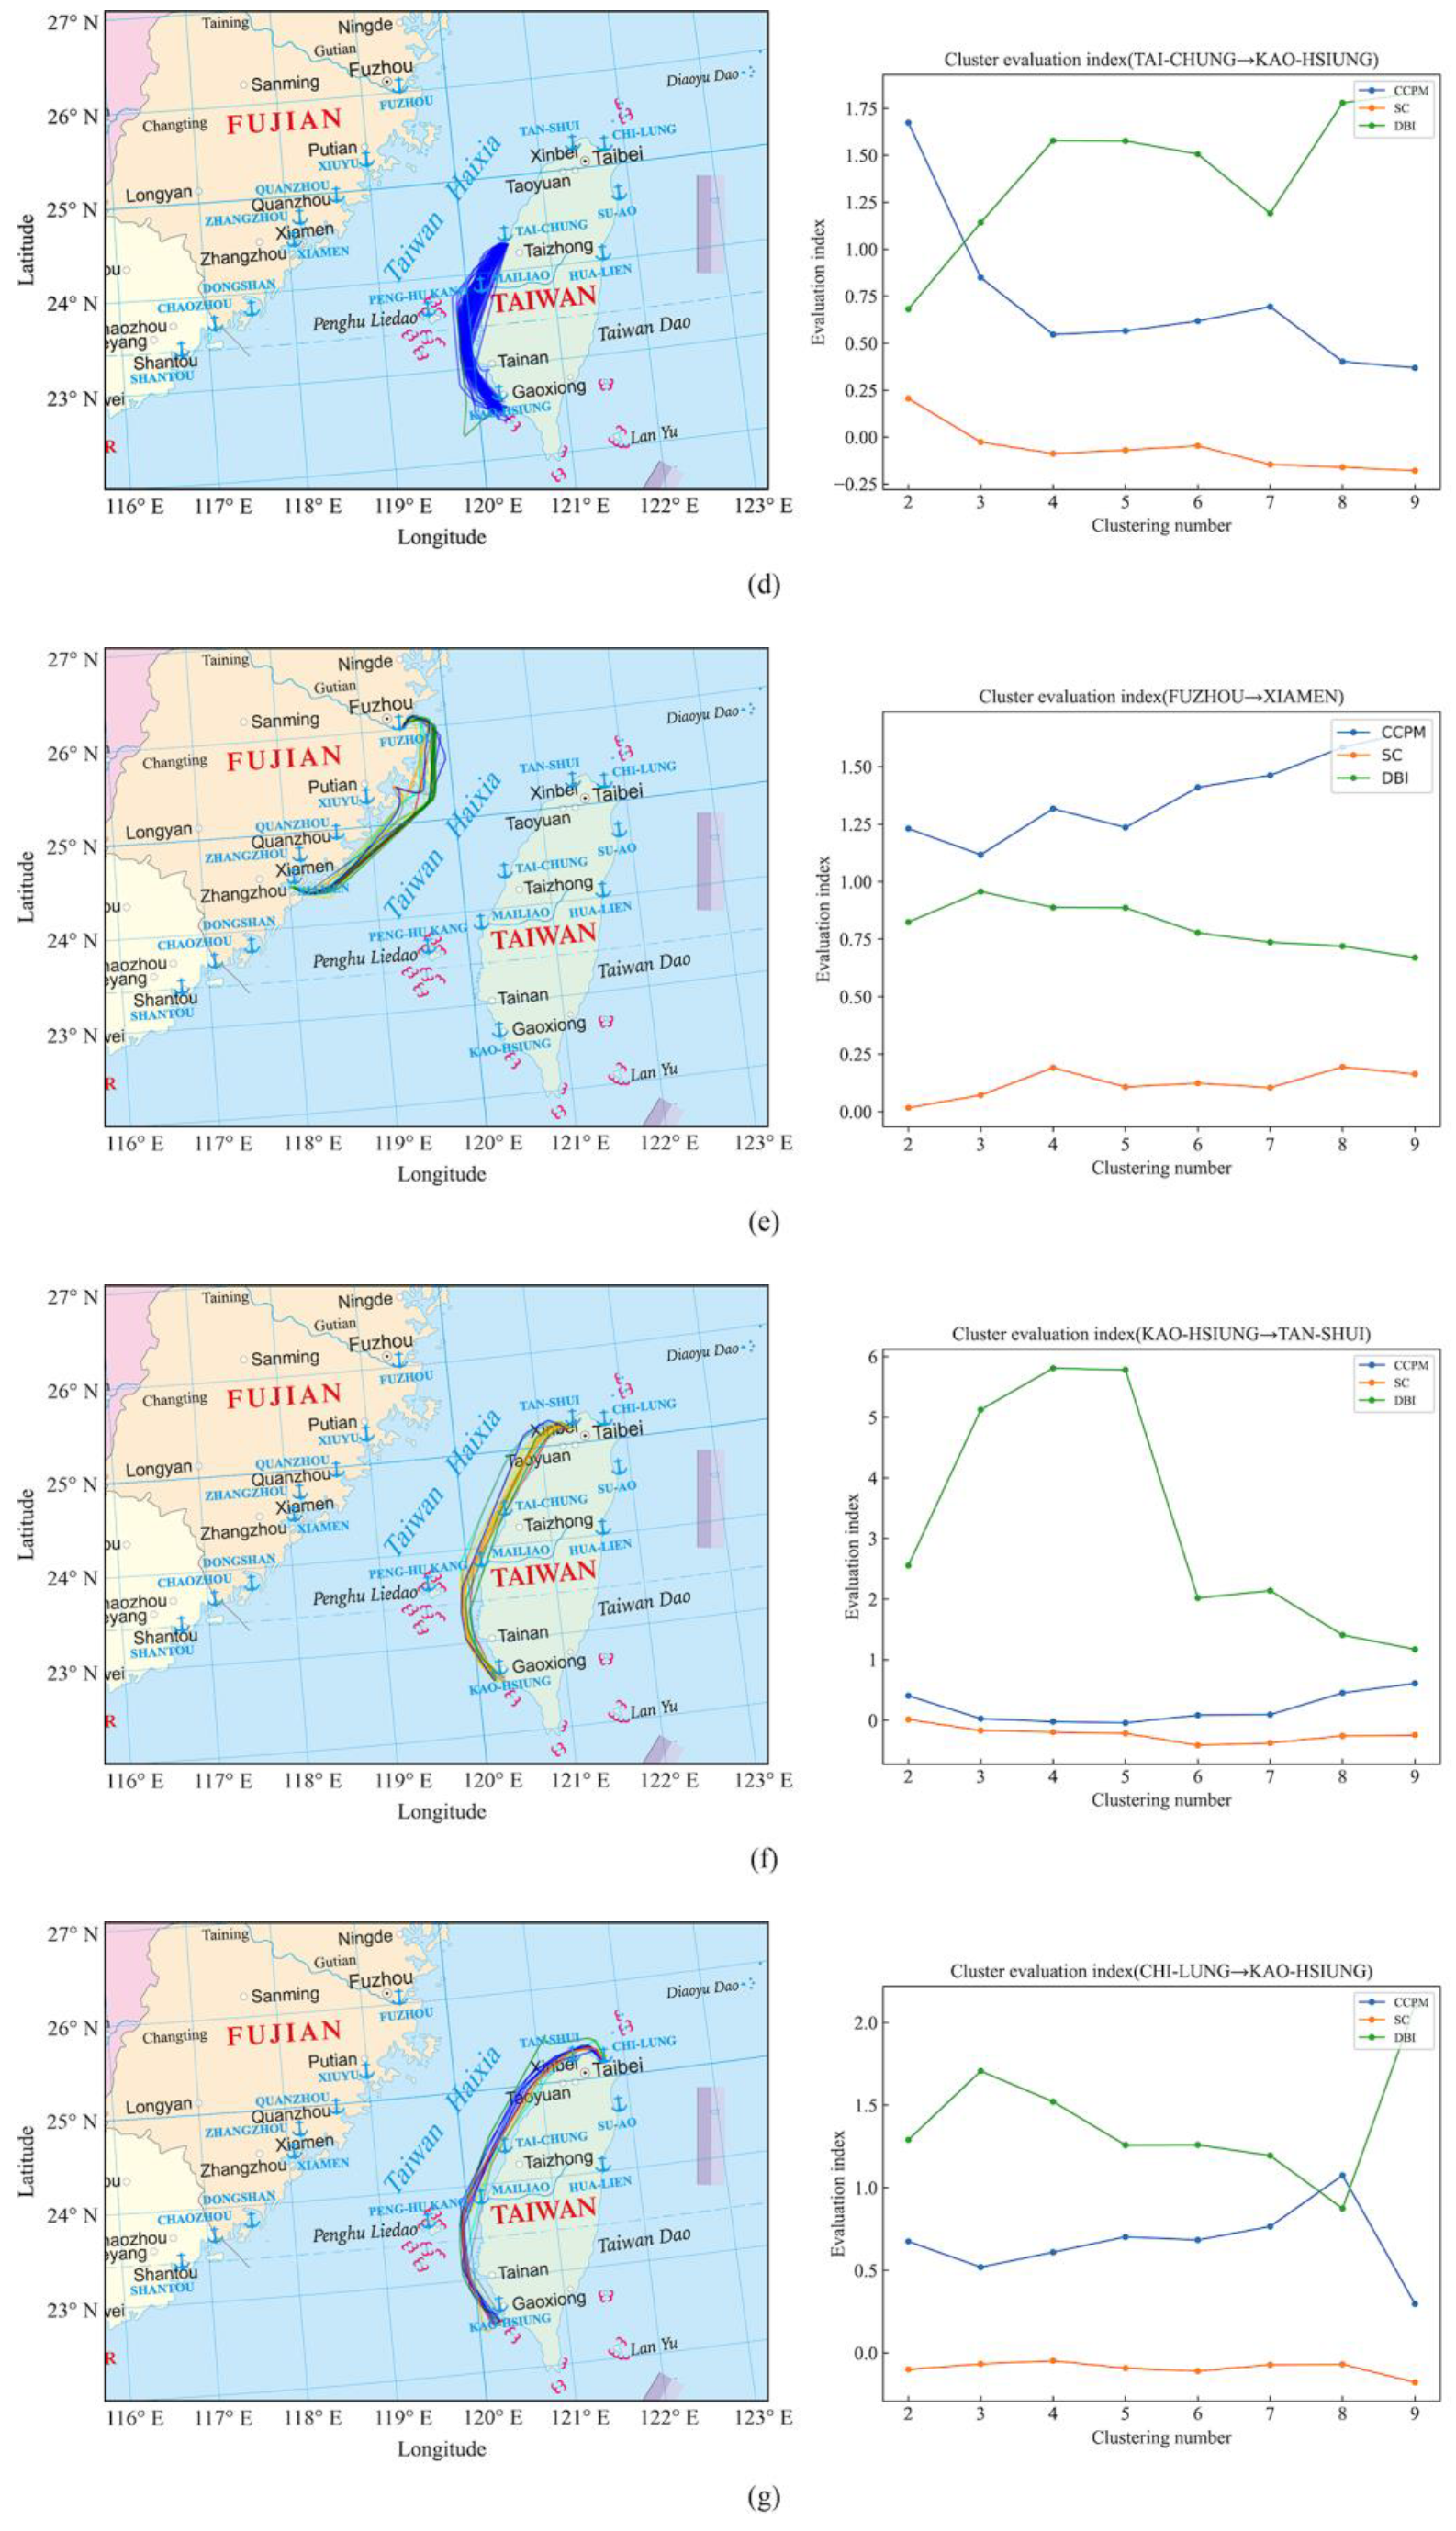
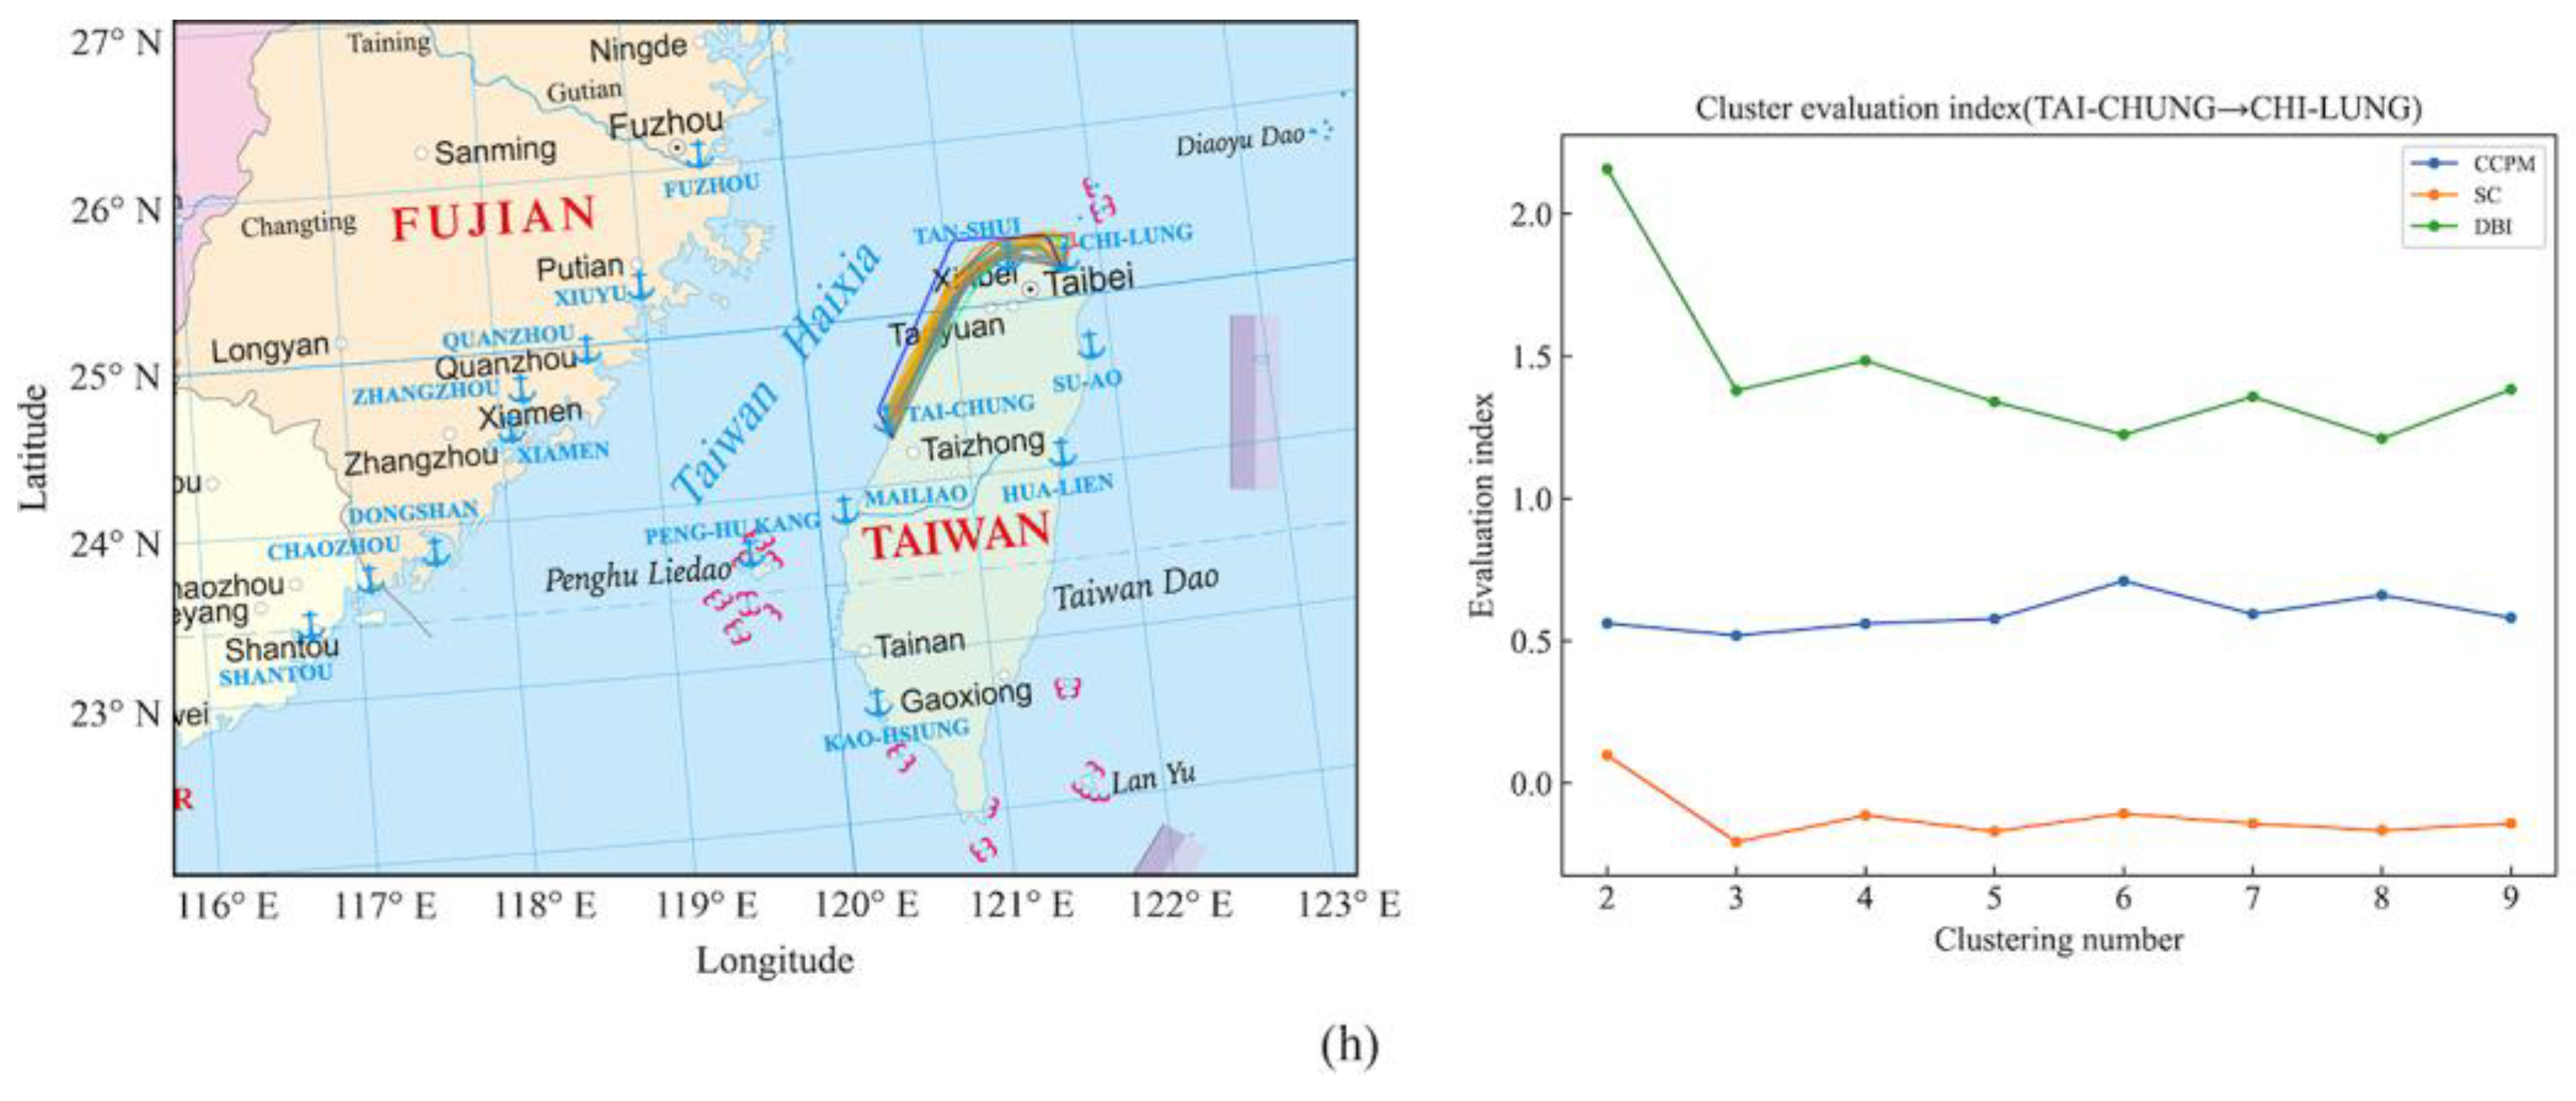
Figure 9.
(a) Clustering results of ship trajectories from Kaohsiung Port to Fuzhou Port, and four groups of ship trajectory clusters were obtained. (b) Clustering results of ship trajectories from Kaohsiung Port to Xiamen Port, and three groups of ship trajectory clusters were obtained. (c) Clustering results of ship trajectories from Xiamen Port to Kaohsiung Port, and two groups of ship trajectory clusters were obtained. (d) Clustering results of ship trajectories from Taichung Port to Kaohsiung Port, and two groups of ship trajectory clusters were obtained. (e) Clustering results of ship trajectories from Fuzhou Port to Xiamen Port, and nine groups of ship trajectory clusters were obtained. (f) Clustering results of ship trajectories from Taoyuan Port to Kaohsiung Port, and nine groups of ship trajectory clusters were obtained. (g) Clustering results of ship trajectories from Keelung Port to Kaohsiung Port, and eight groups of ship trajectory clusters were obtained. (h) Clustering results of ship trajectories from Taichung Port to Keelung Port, and six groups of ship trajectory clusters were obtained.
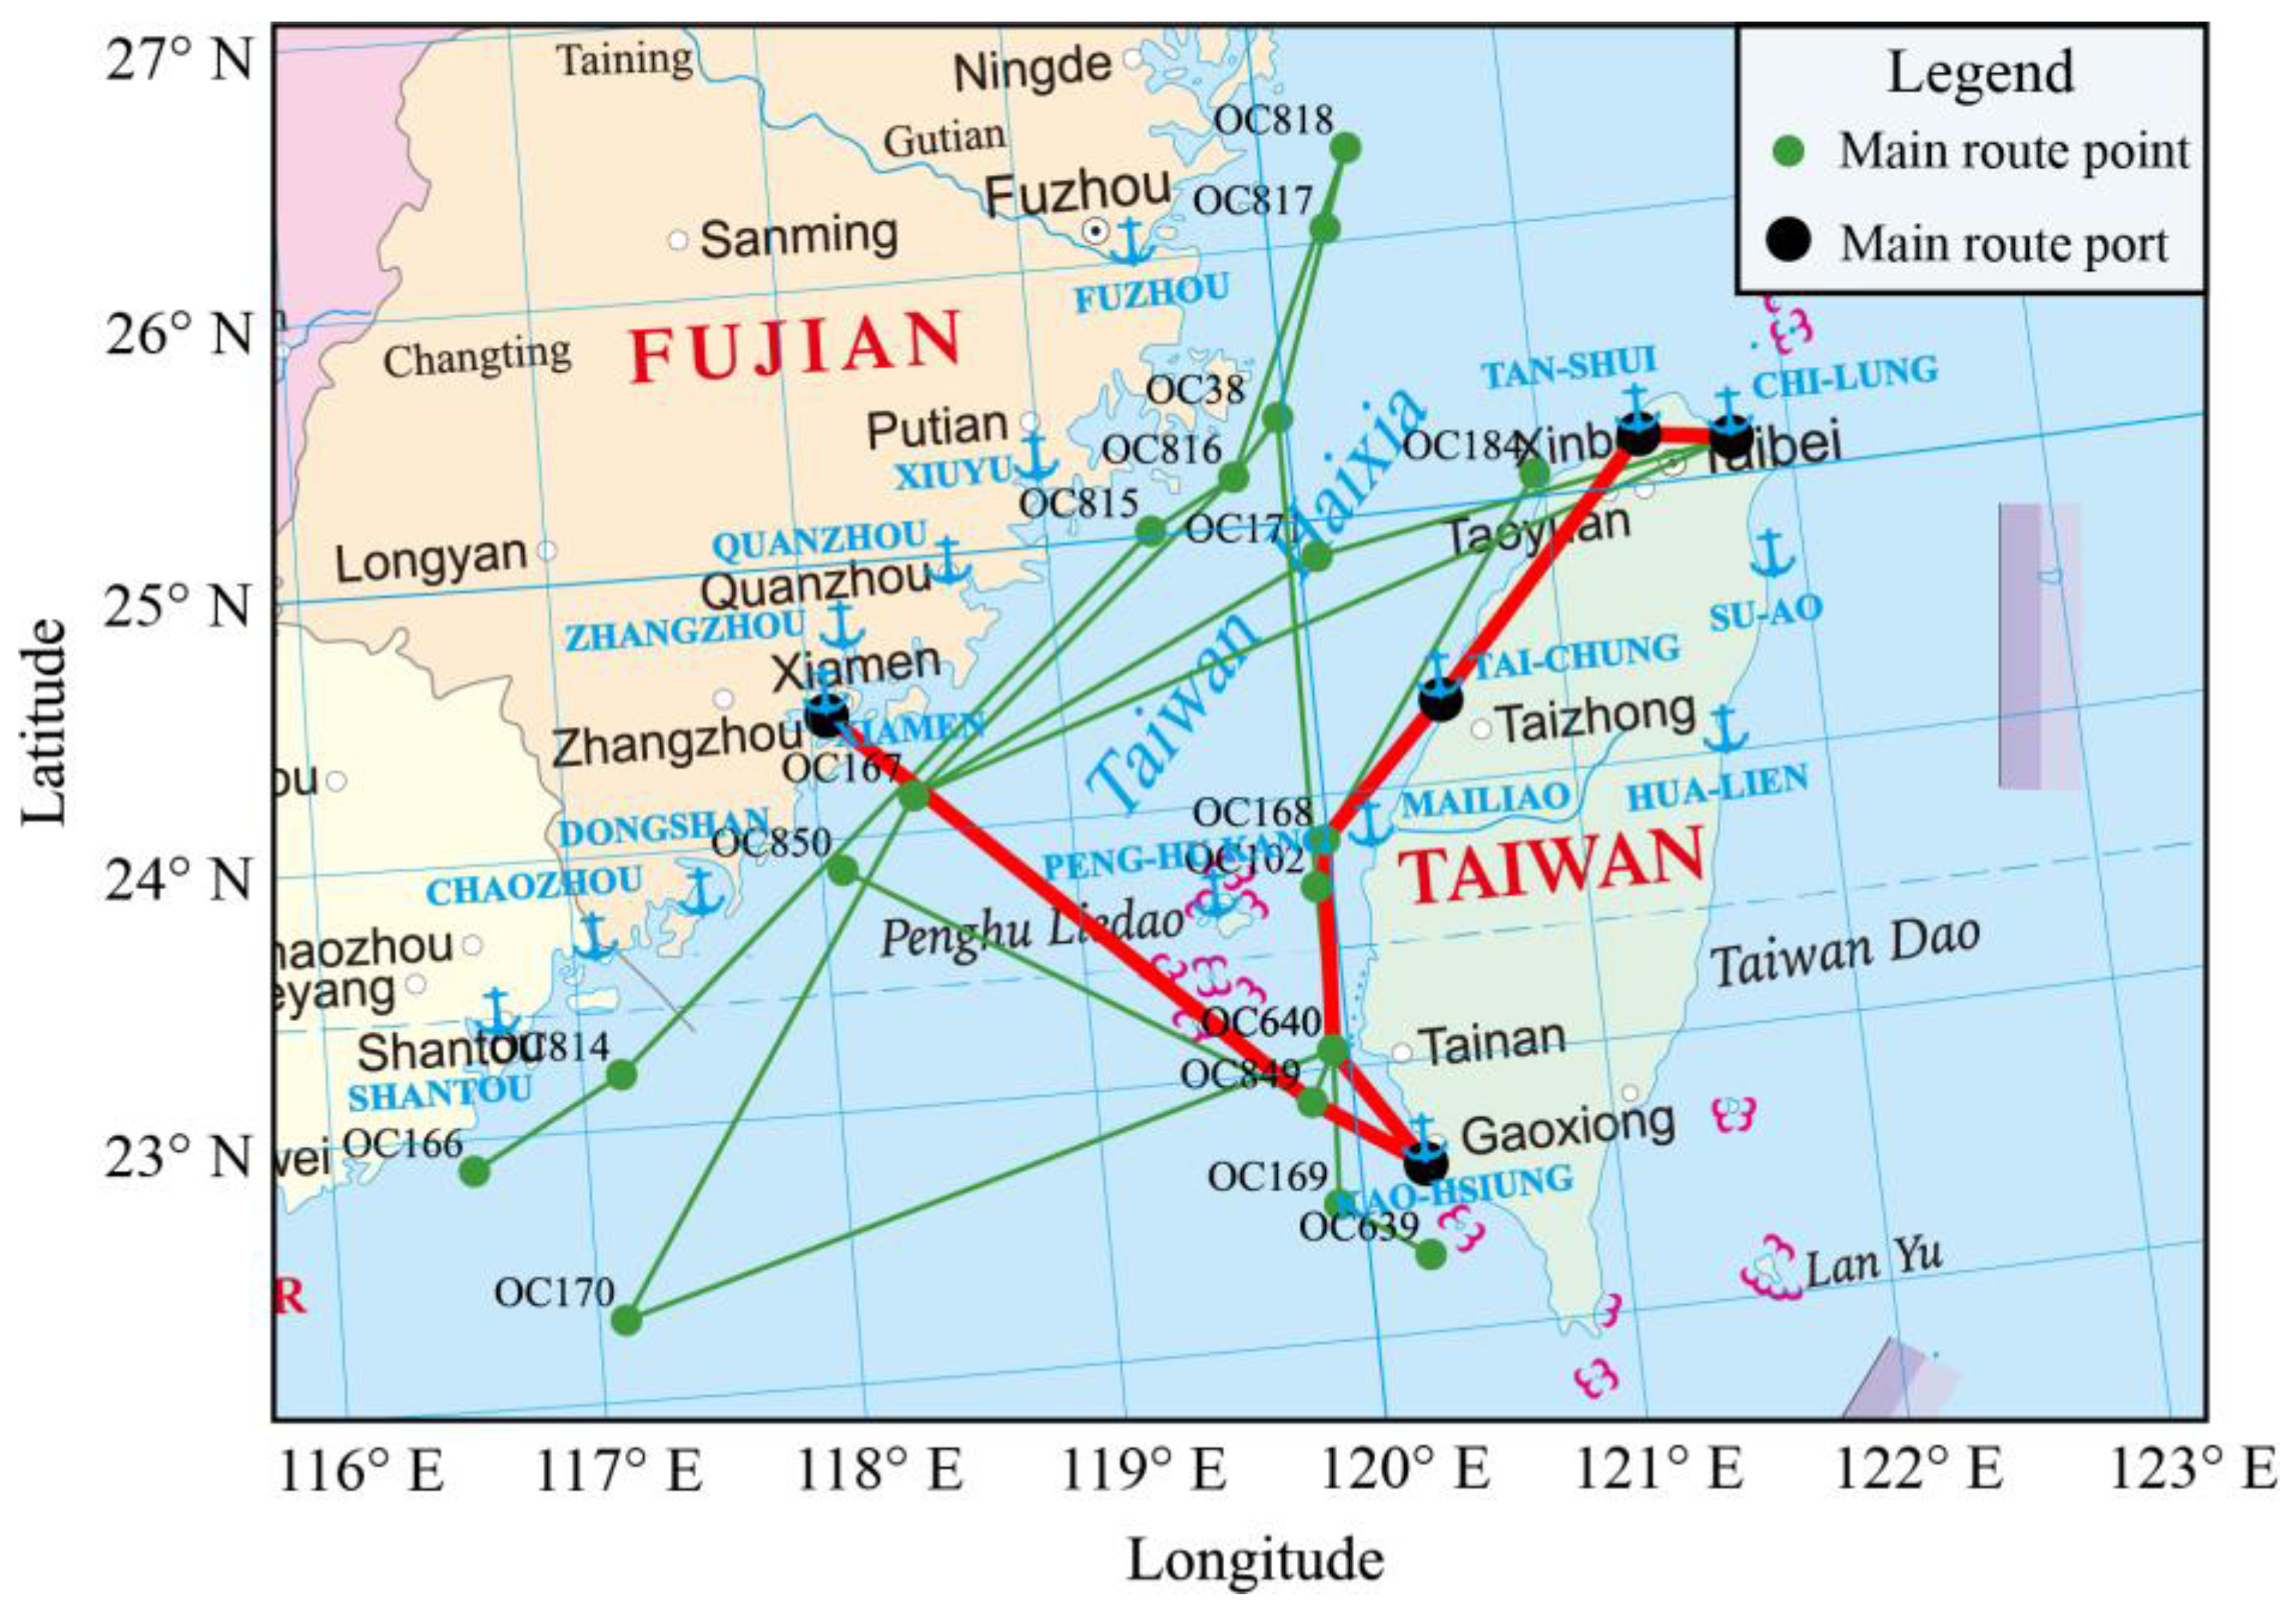
Figure 10.
Extraction results of the ship navigation main routes in the Taiwan Strait.
Figure 10.
Extraction results of the ship navigation main routes in the Taiwan Strait.
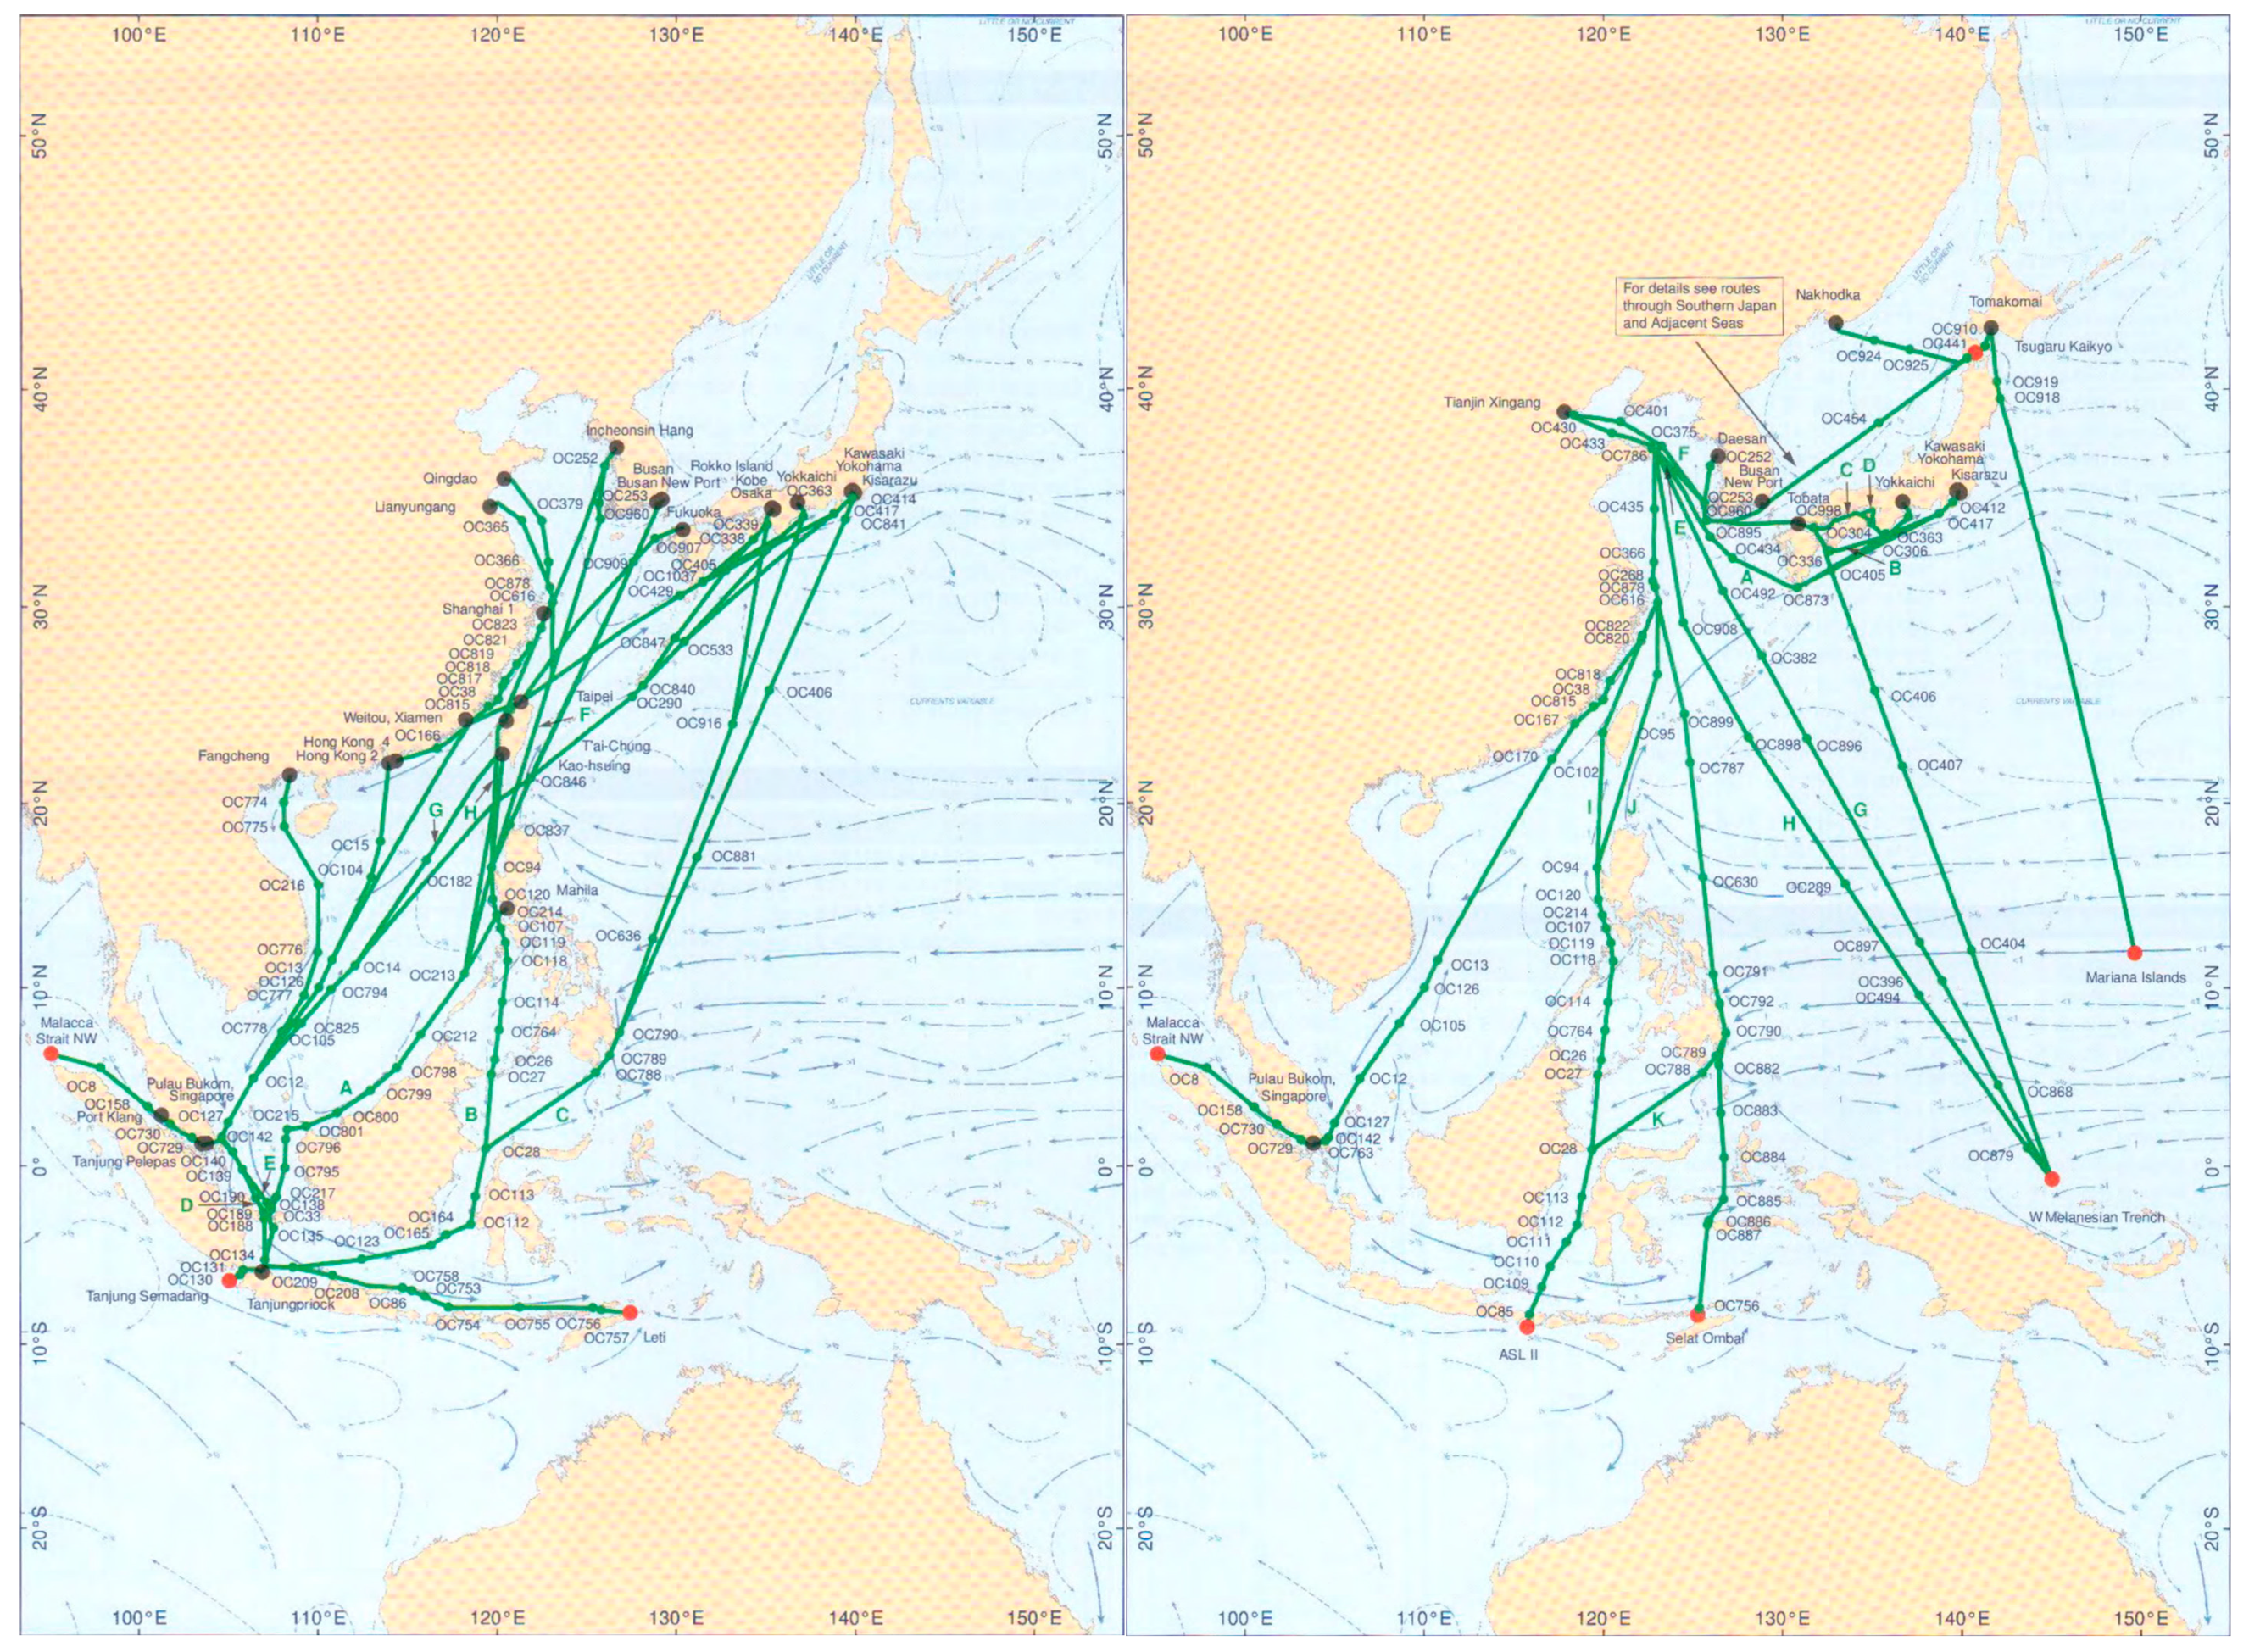
Figure 11.
Some routes in the Taiwan Strait shown in the Ocean Passages for the World.
Figure 11.
Some routes in the Taiwan Strait shown in the Ocean Passages for the World.
Figure 12.
Route map of Taiwan Strait based on the Ocean Passages for the World.
Figure 12.
Route map of Taiwan Strait based on the Ocean Passages for the World.
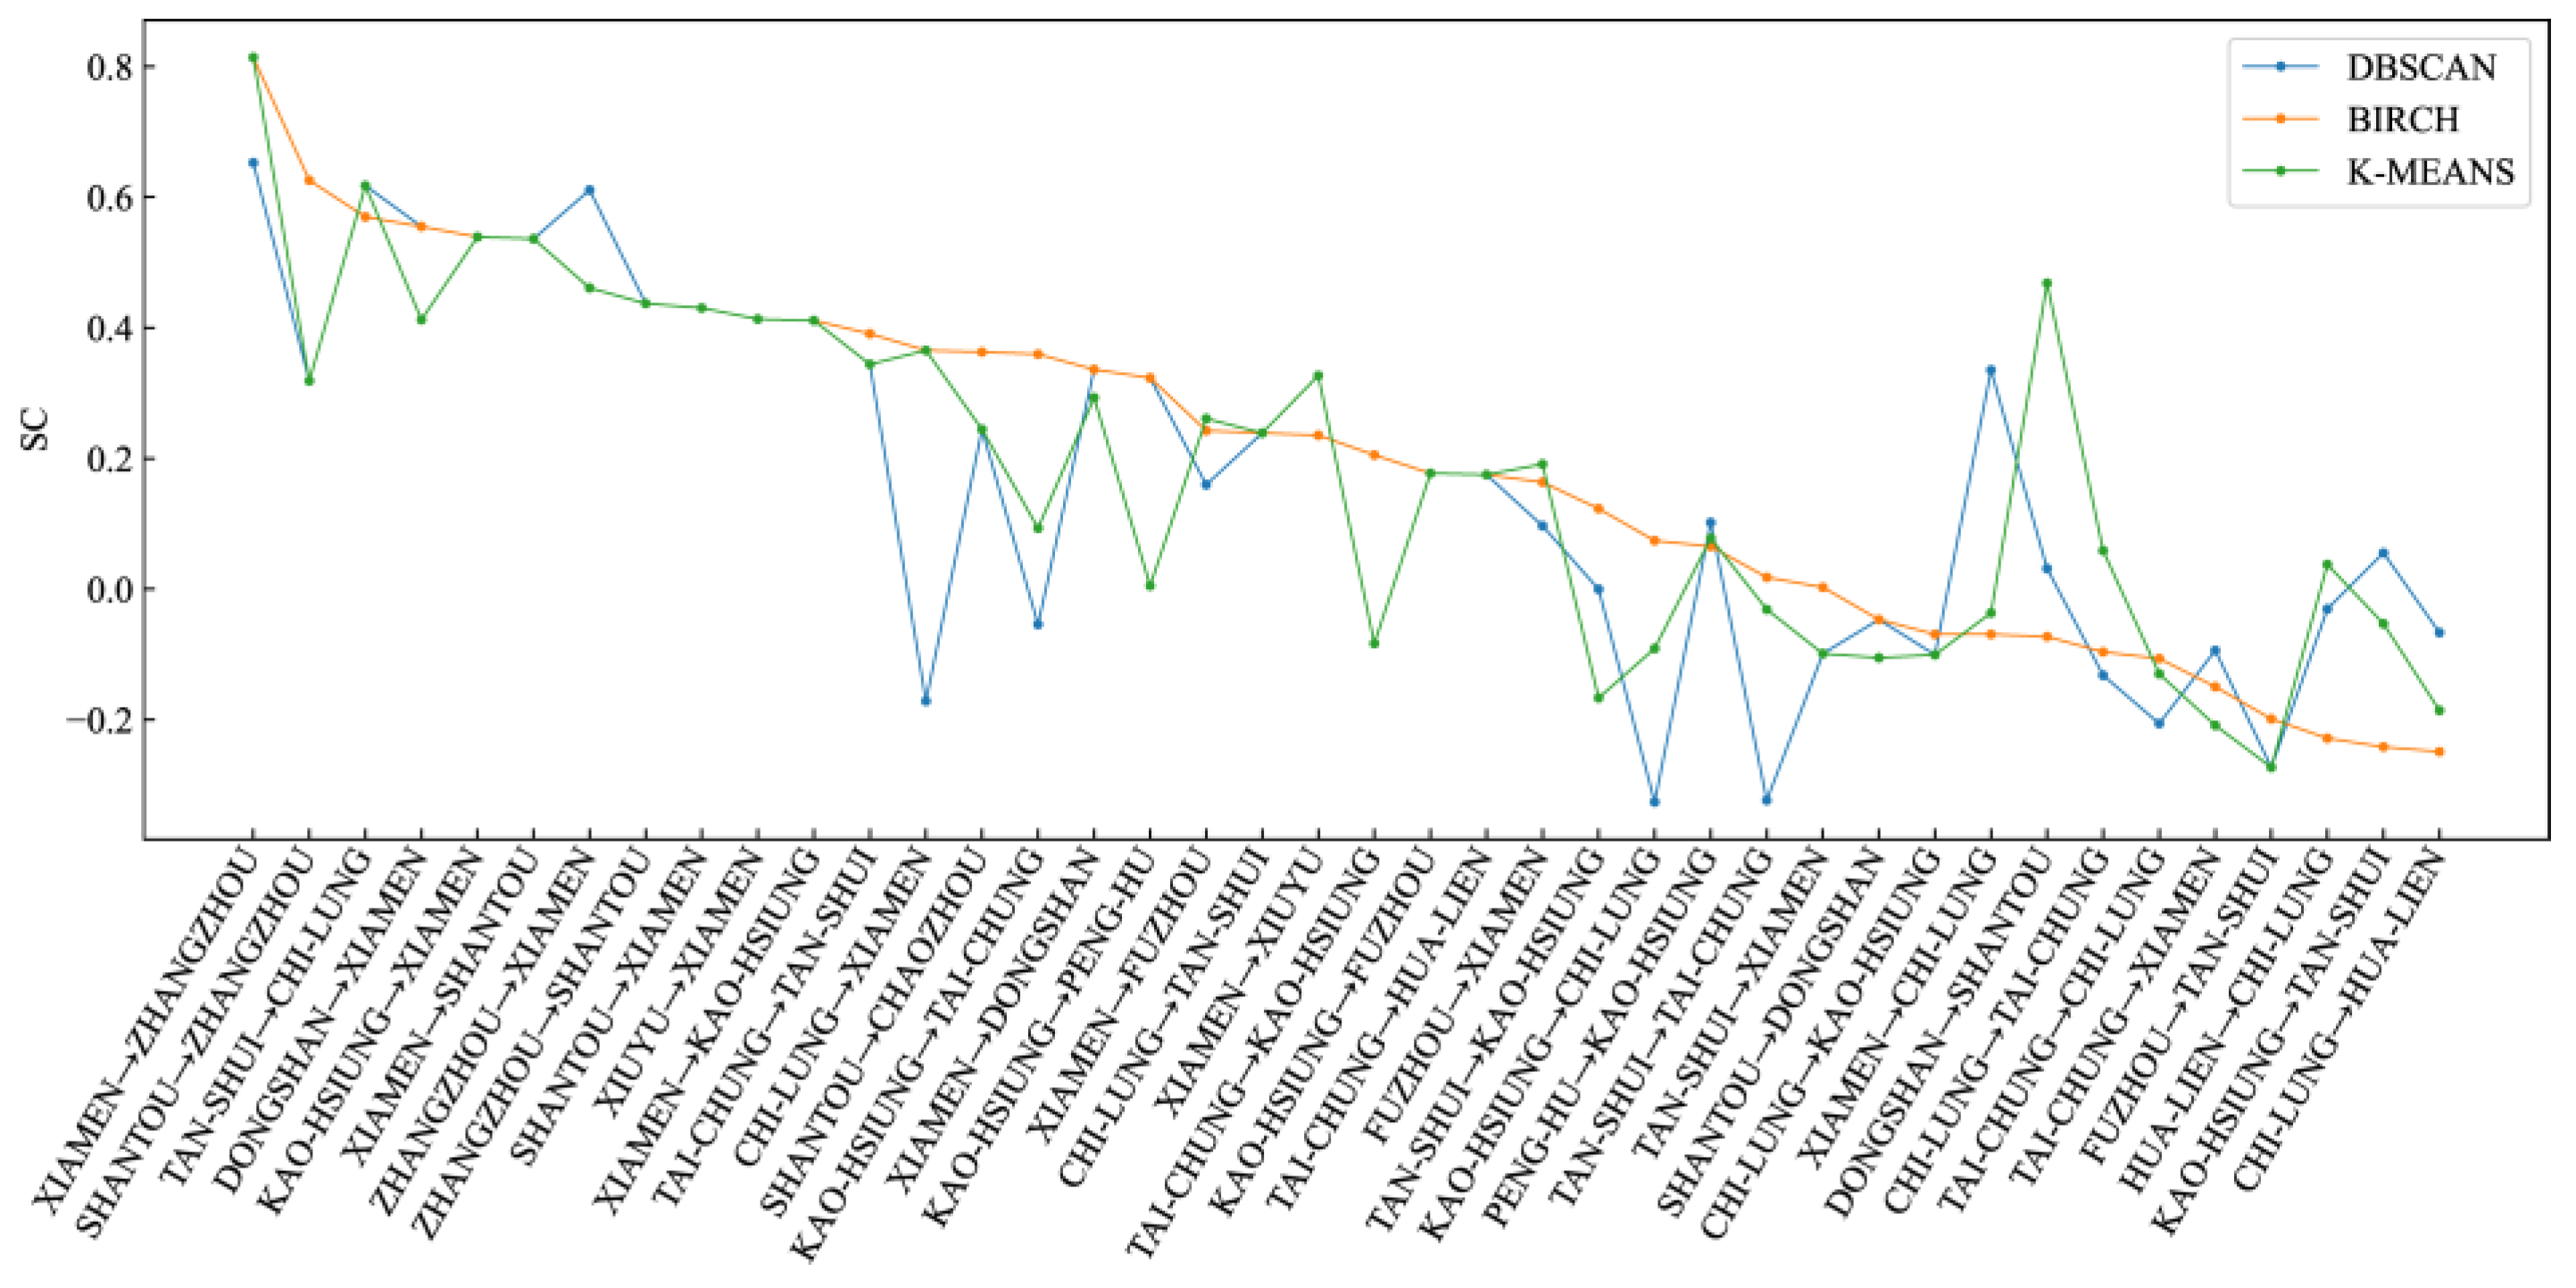
Figure 13.
Comparison of SC evaluation indices for different clustering algorithms.
Figure 13.
Comparison of SC evaluation indices for different clustering algorithms.
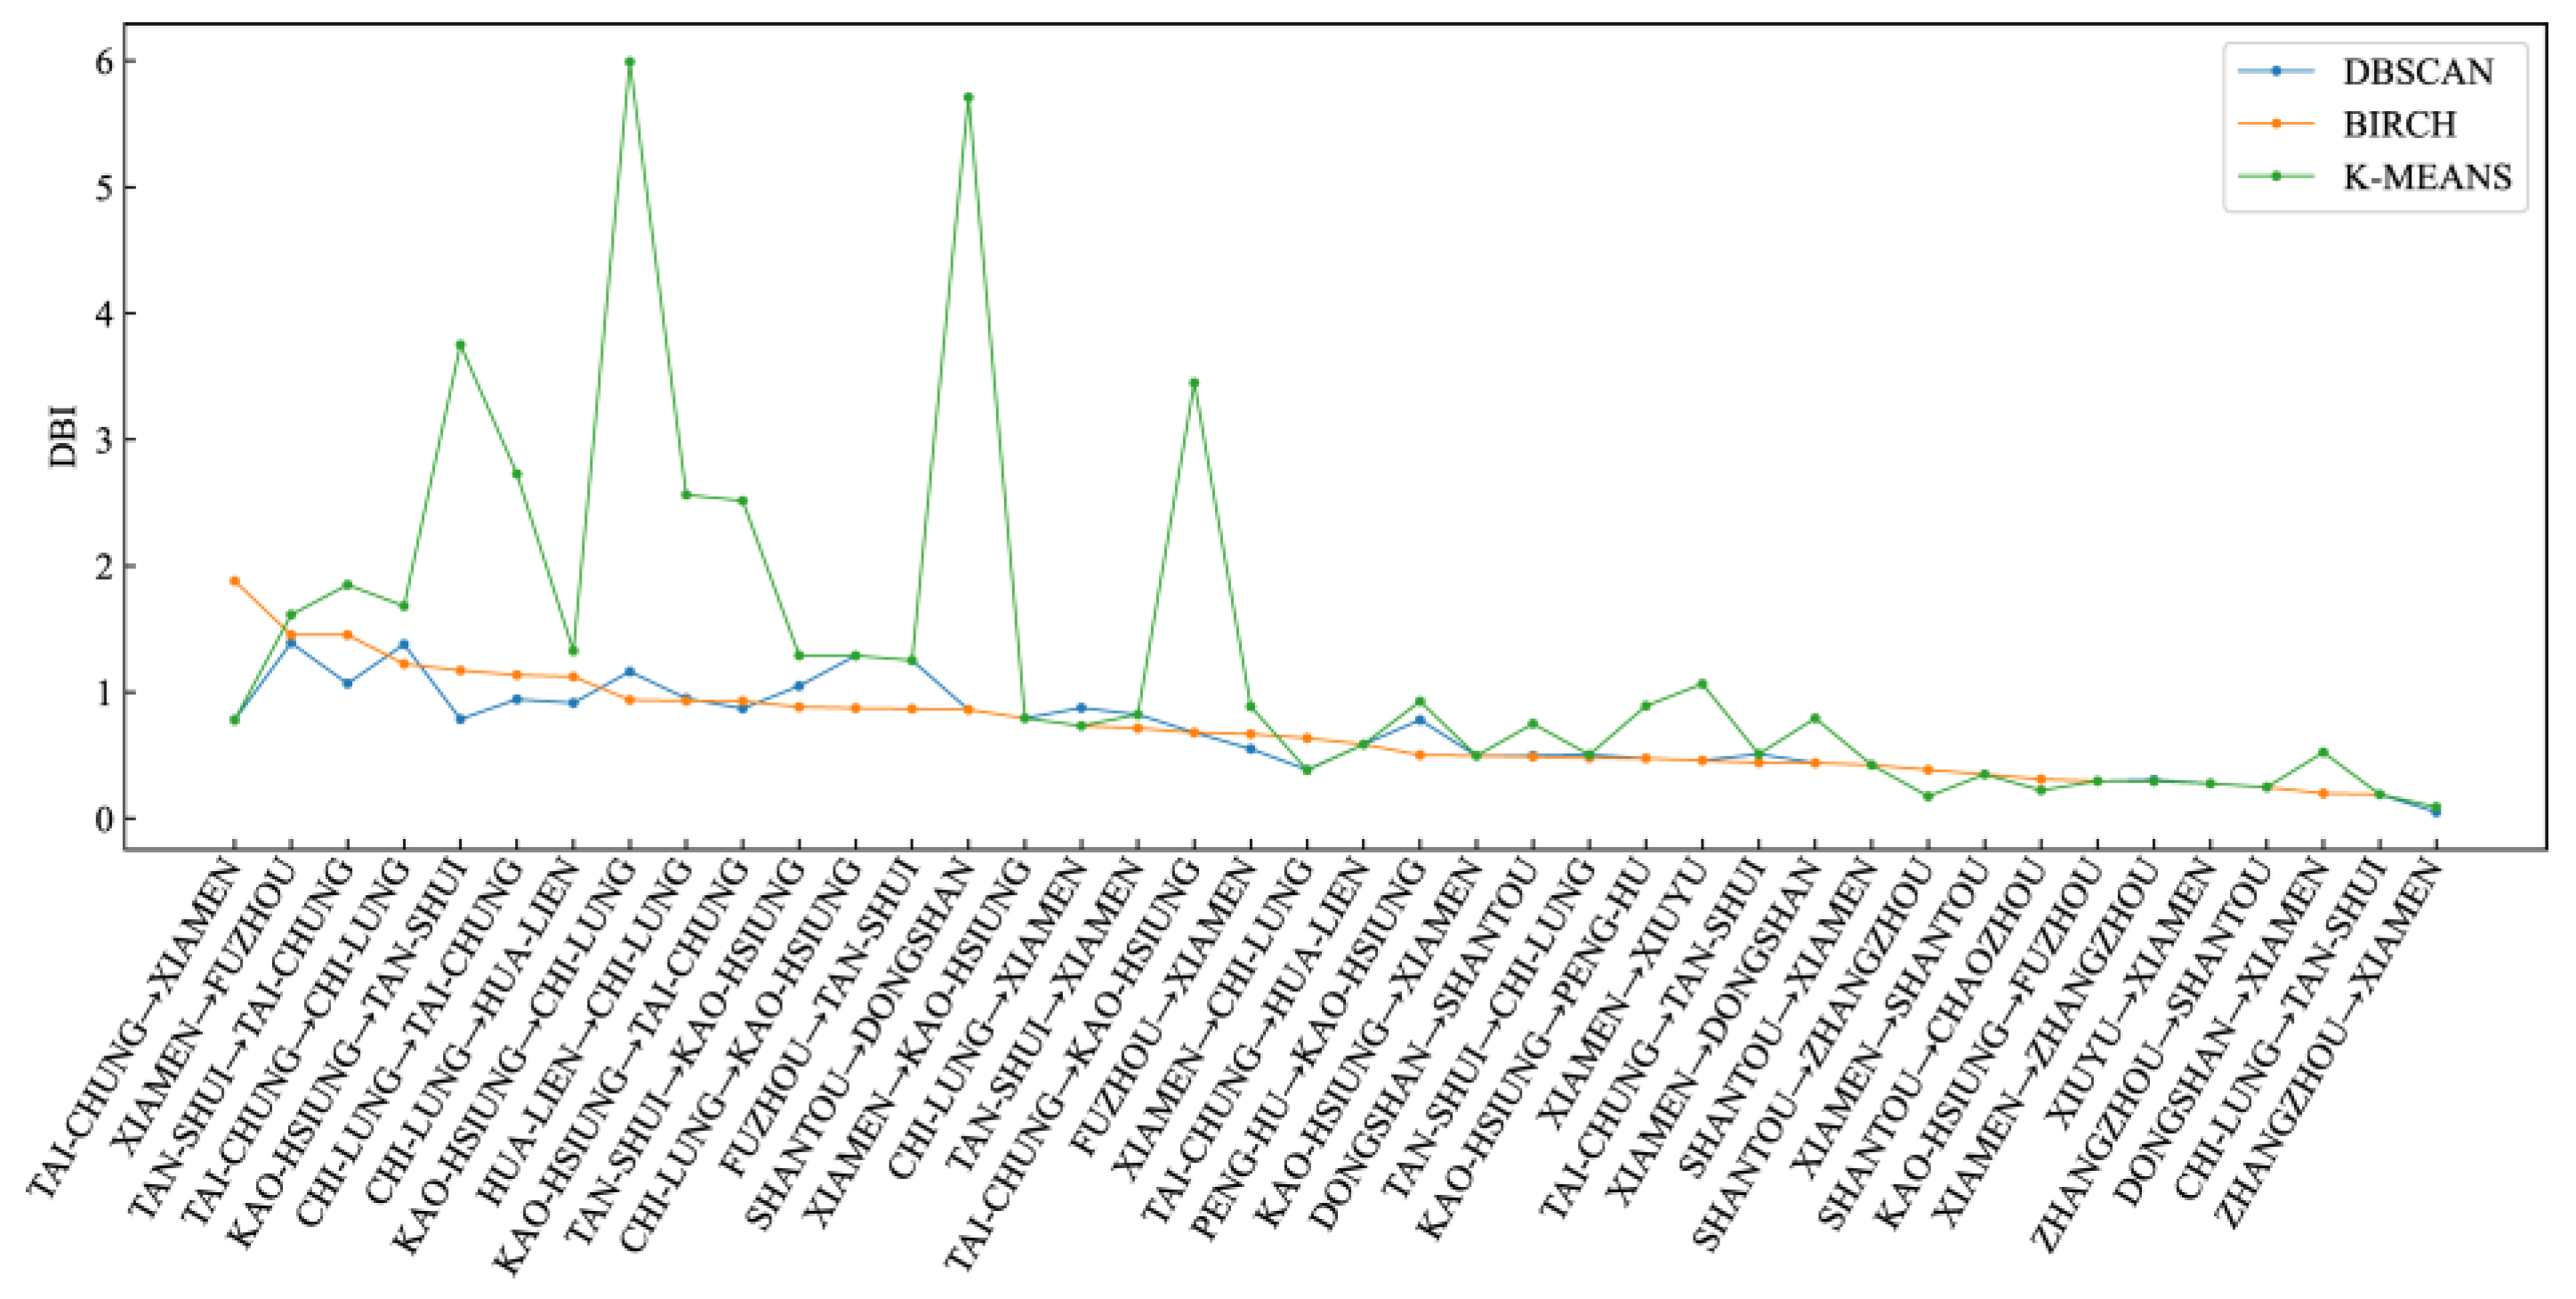
Figure 14.
Comparison of DBI evaluation indices for different clustering algorithms.
Figure 14.
Comparison of DBI evaluation indices for different clustering algorithms.
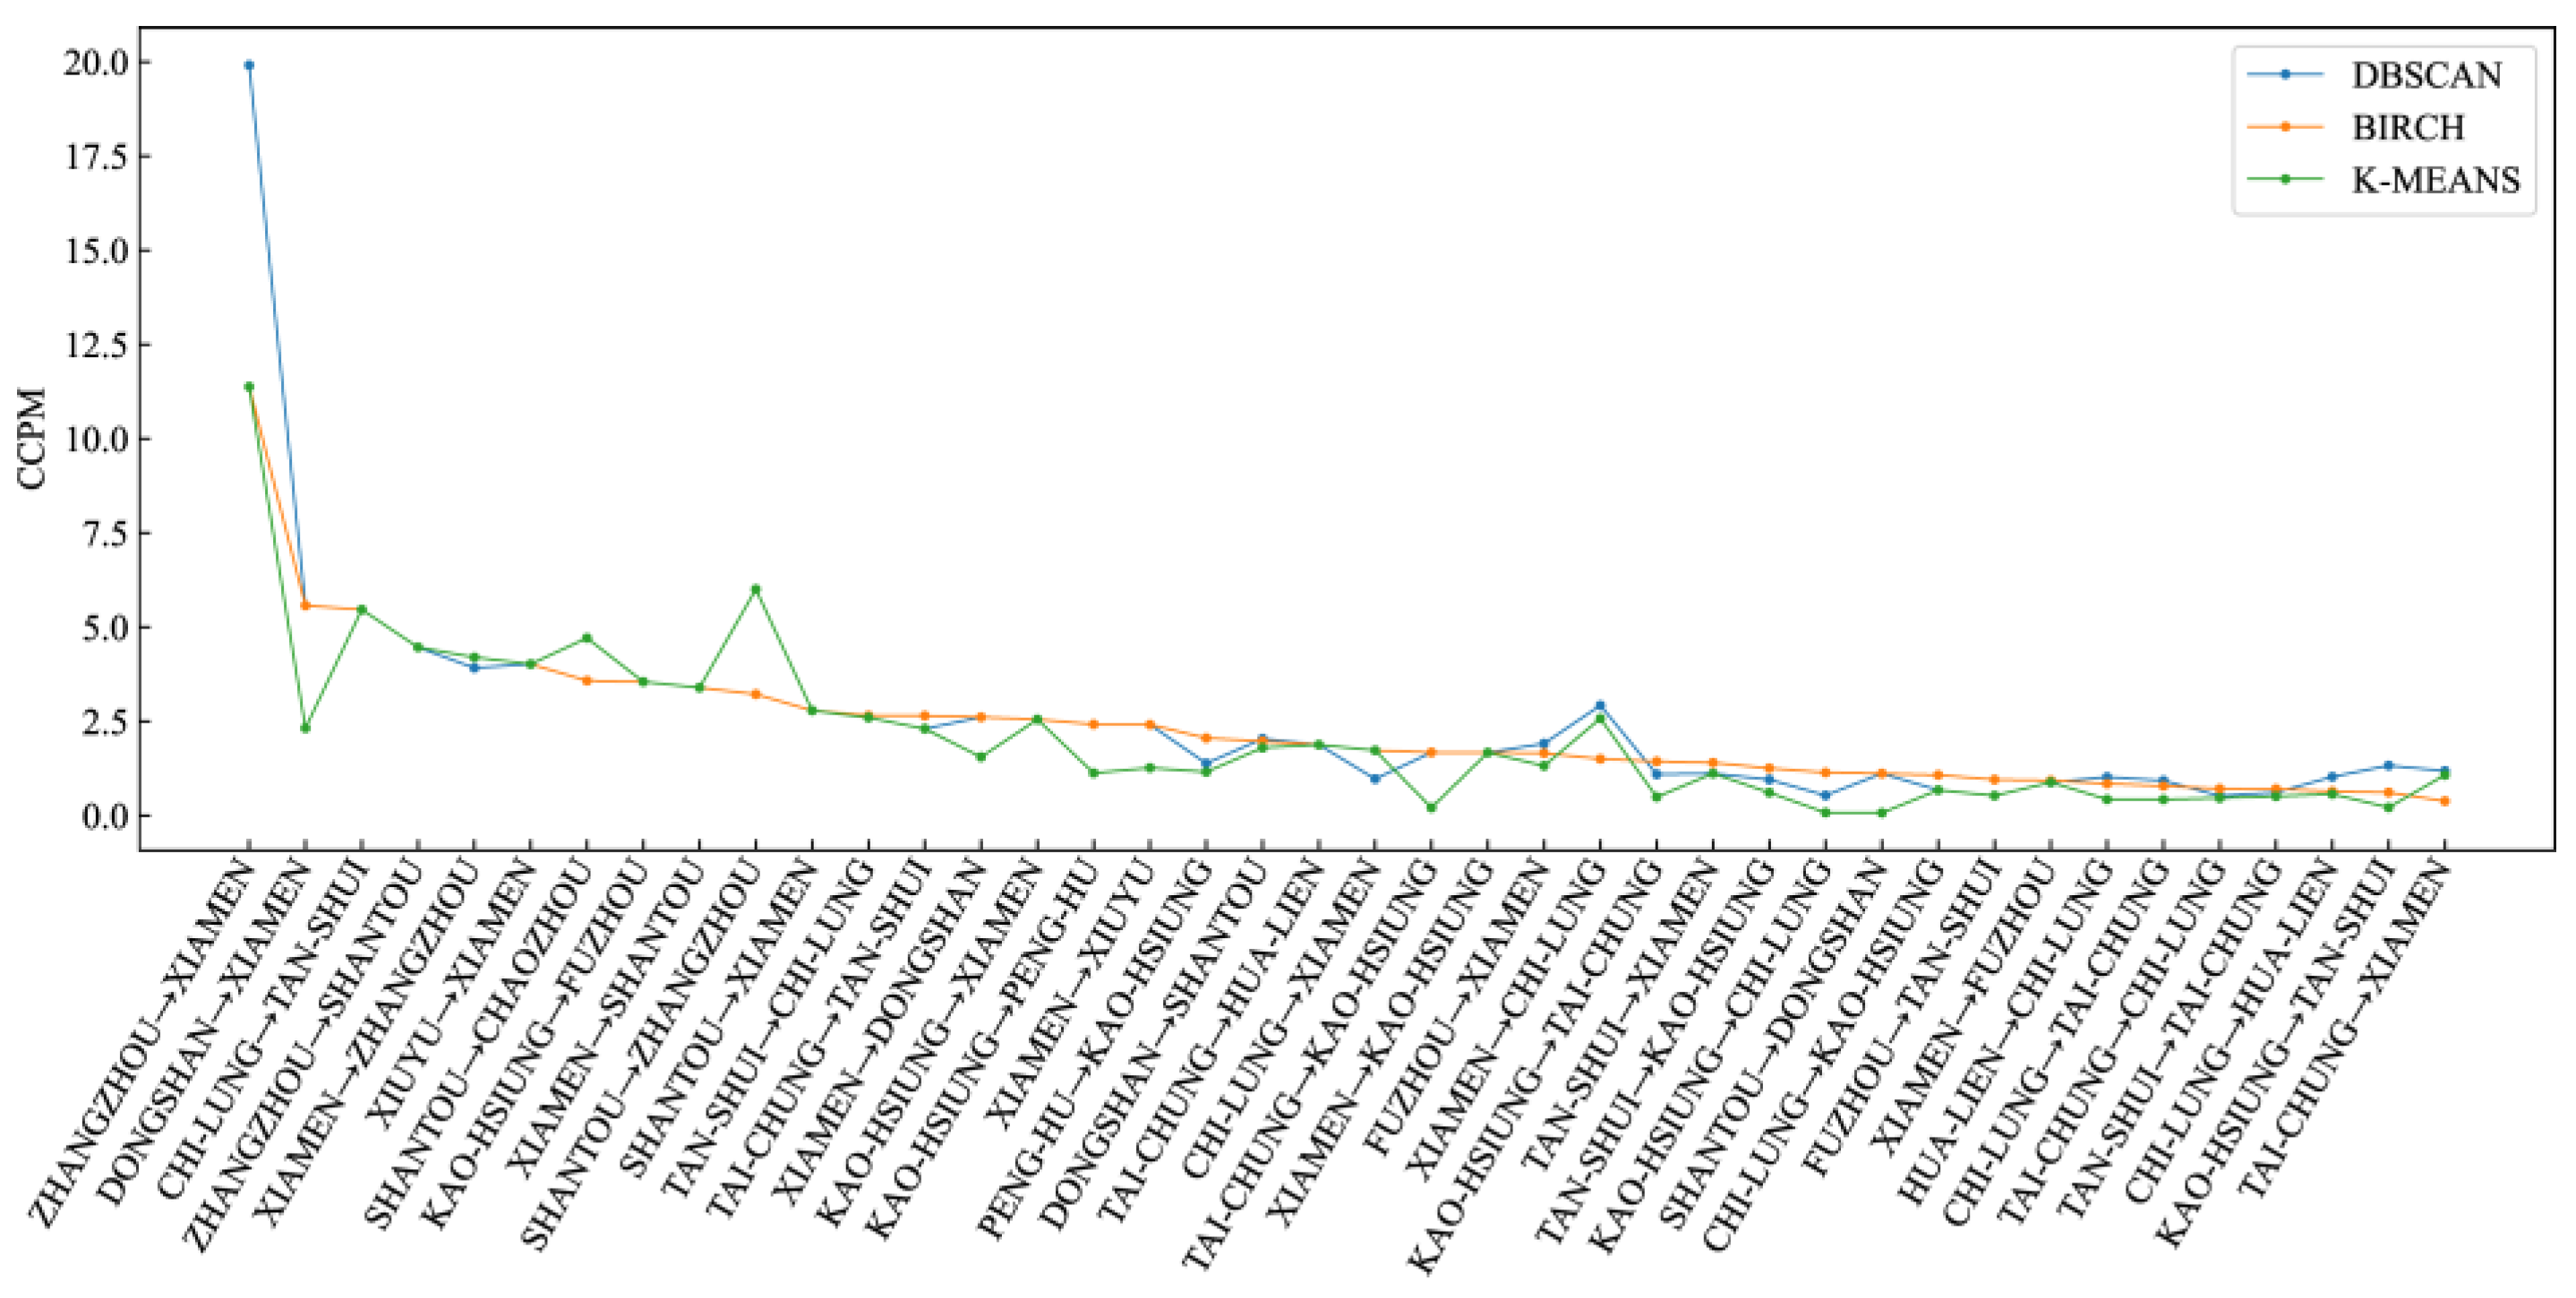
Figure 15.
Comparison of CCPM evaluation indices for different clustering algorithms.
Figure 15.
Comparison of CCPM evaluation indices for different clustering algorithms.
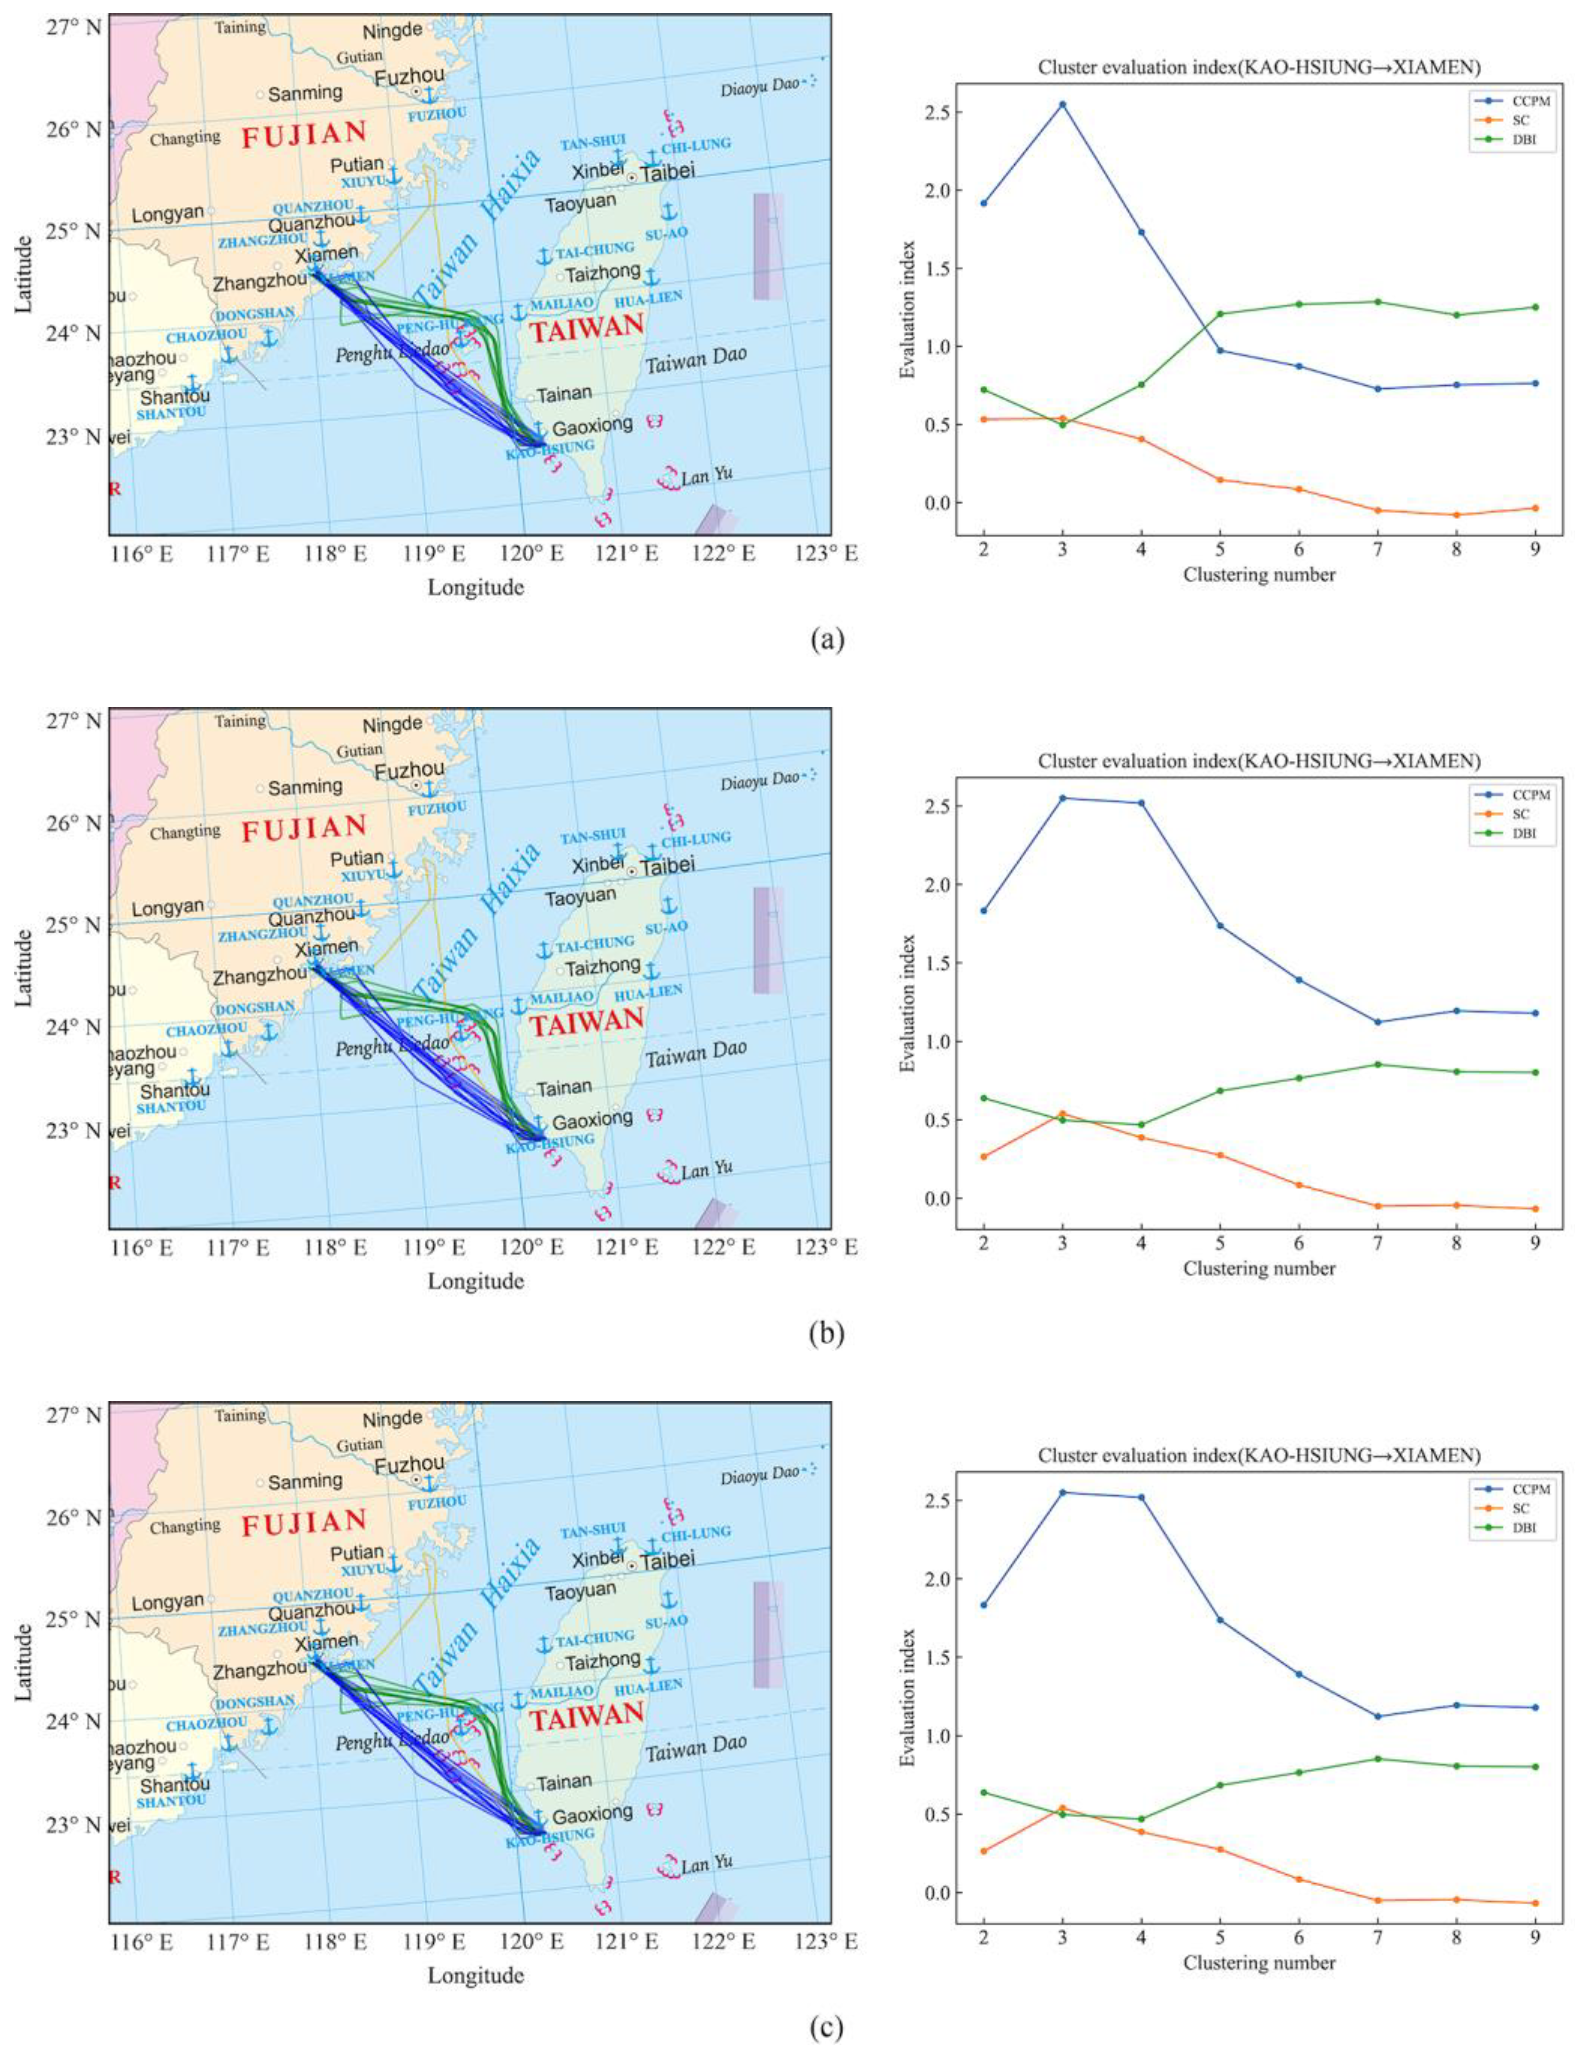
Figure 16.
(a) K-Means clustering results and quantitative evaluation results of the ship trajectories from Kaohsiung Port to Xiamen Port. (b) DBSCAN clustering results and quantitative evaluation results of the ship trajectories from Kaohsiung Port to Xiamen Port. (c) BIRCH clustering results and quantitative evaluation results of the ship trajectories from Kaohsiung Port to Xiamen Port.
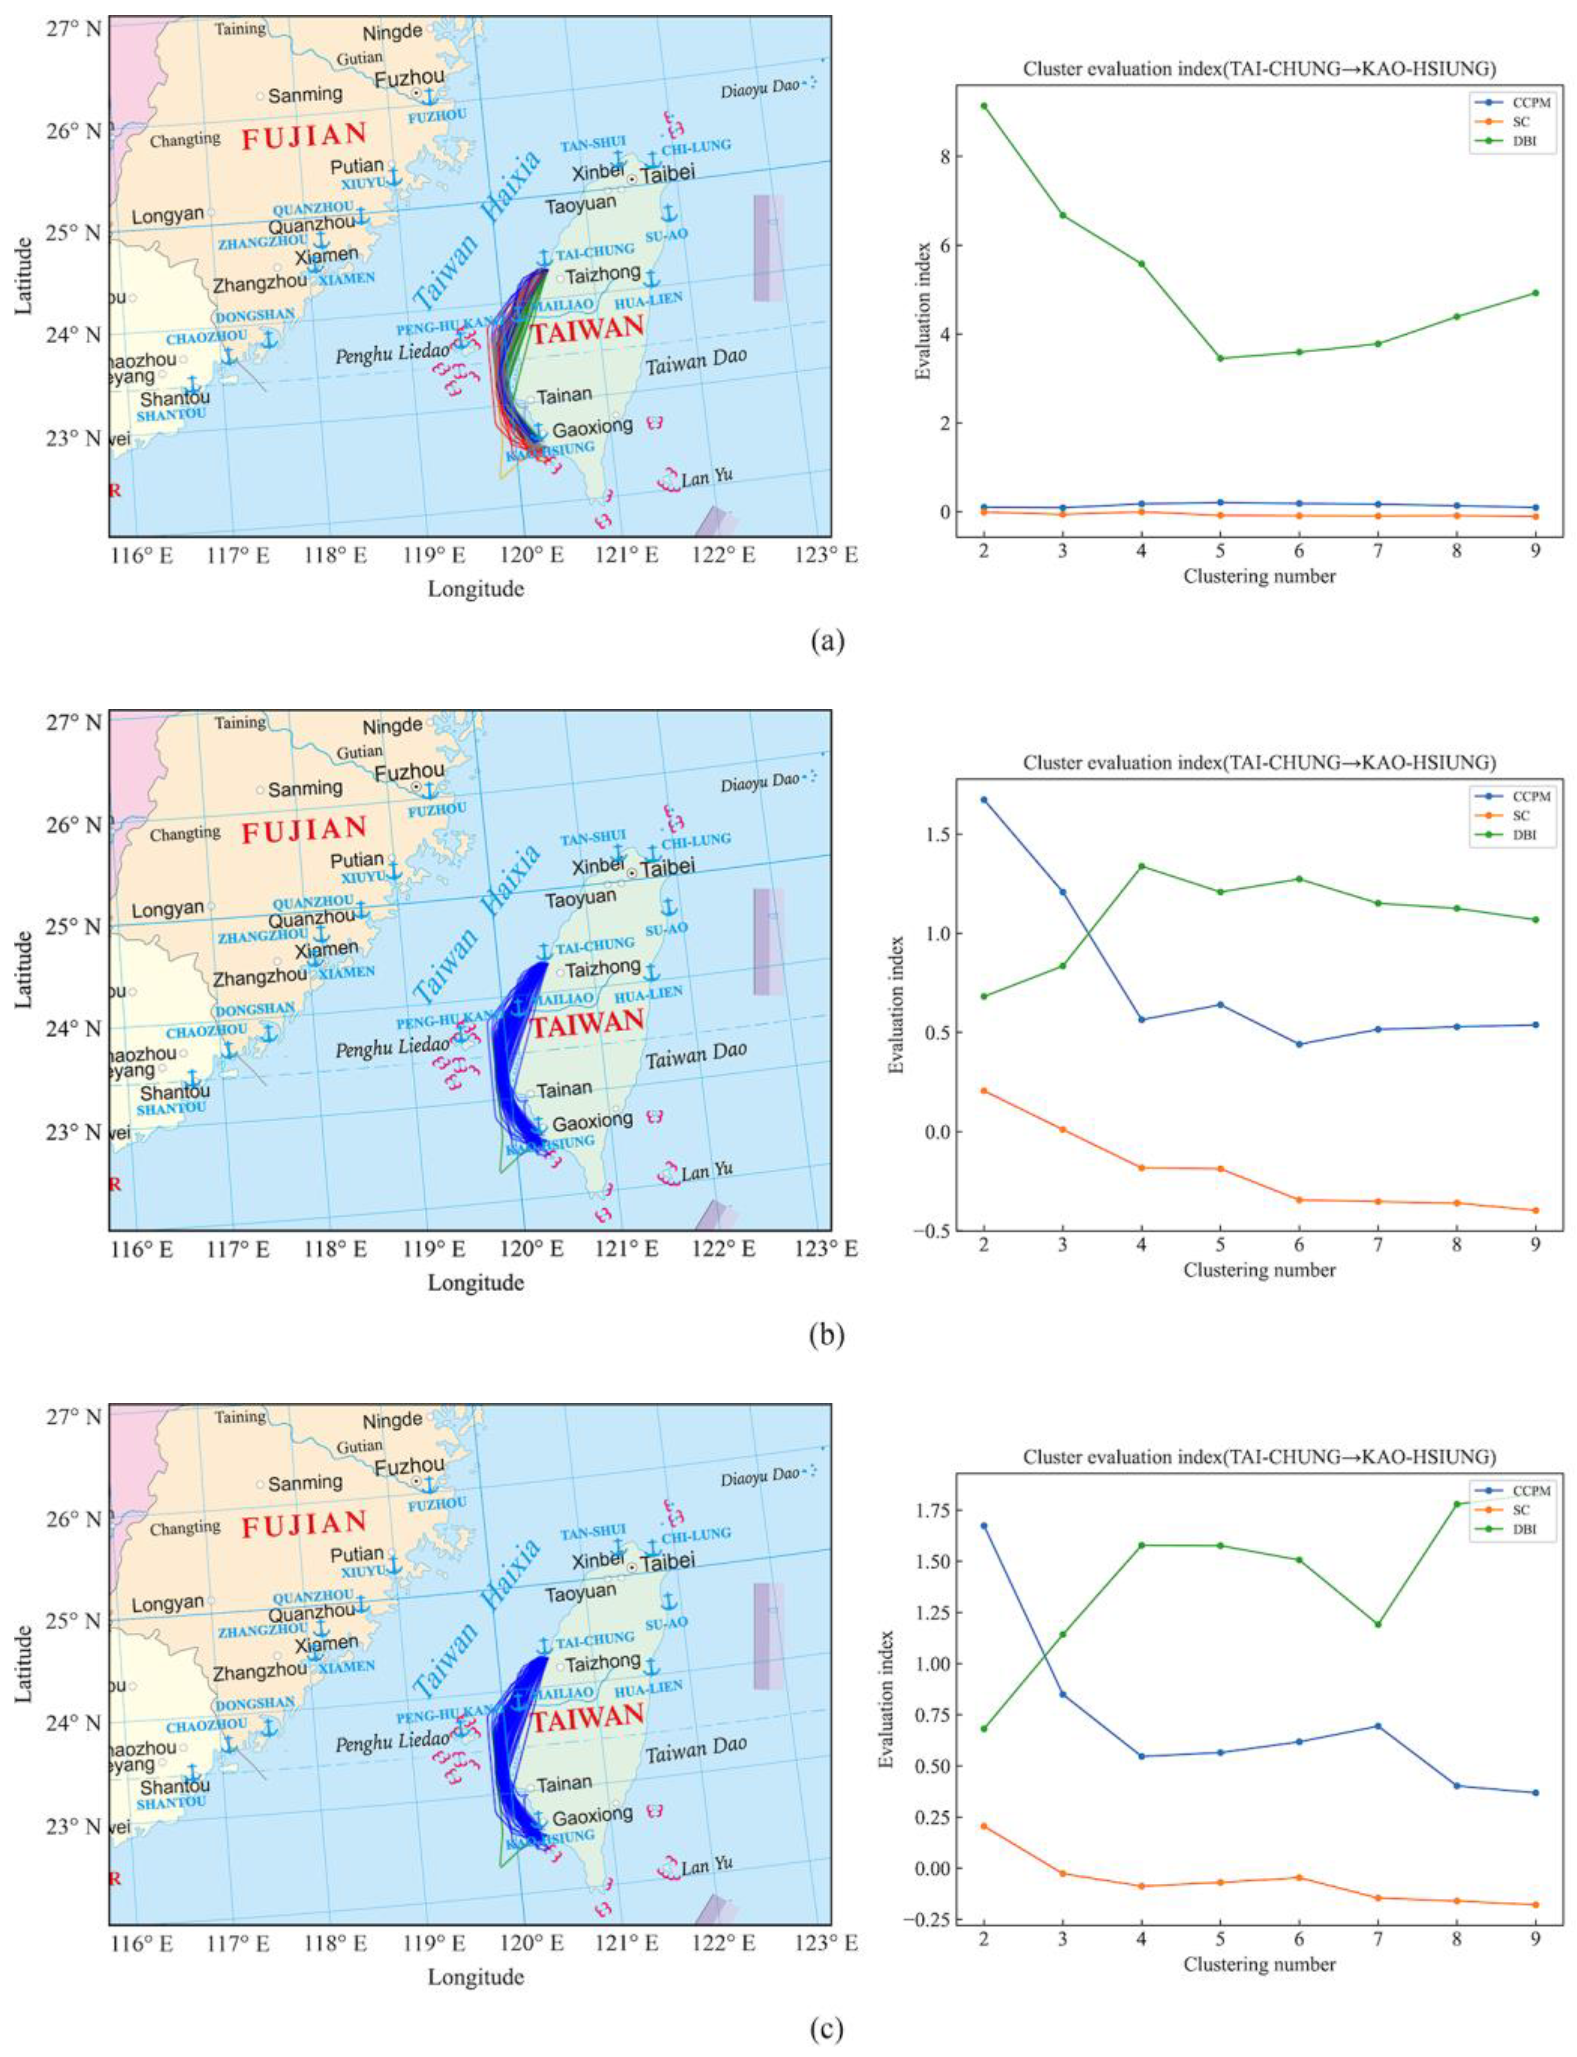
Figure 17.
(a) K-Means clustering results and quantitative evaluation results of the ship trajectories from Taichung Port to Kaohsiung Port. (b) DBSCAN clustering results and quantitative evaluation results of the ship trajectories from Taichung Port to Kaohsiung Port. (c) BIRCH clustering results and quantitative evaluation results of the ship trajectories from Taichung Port to Kaohsiung Port.
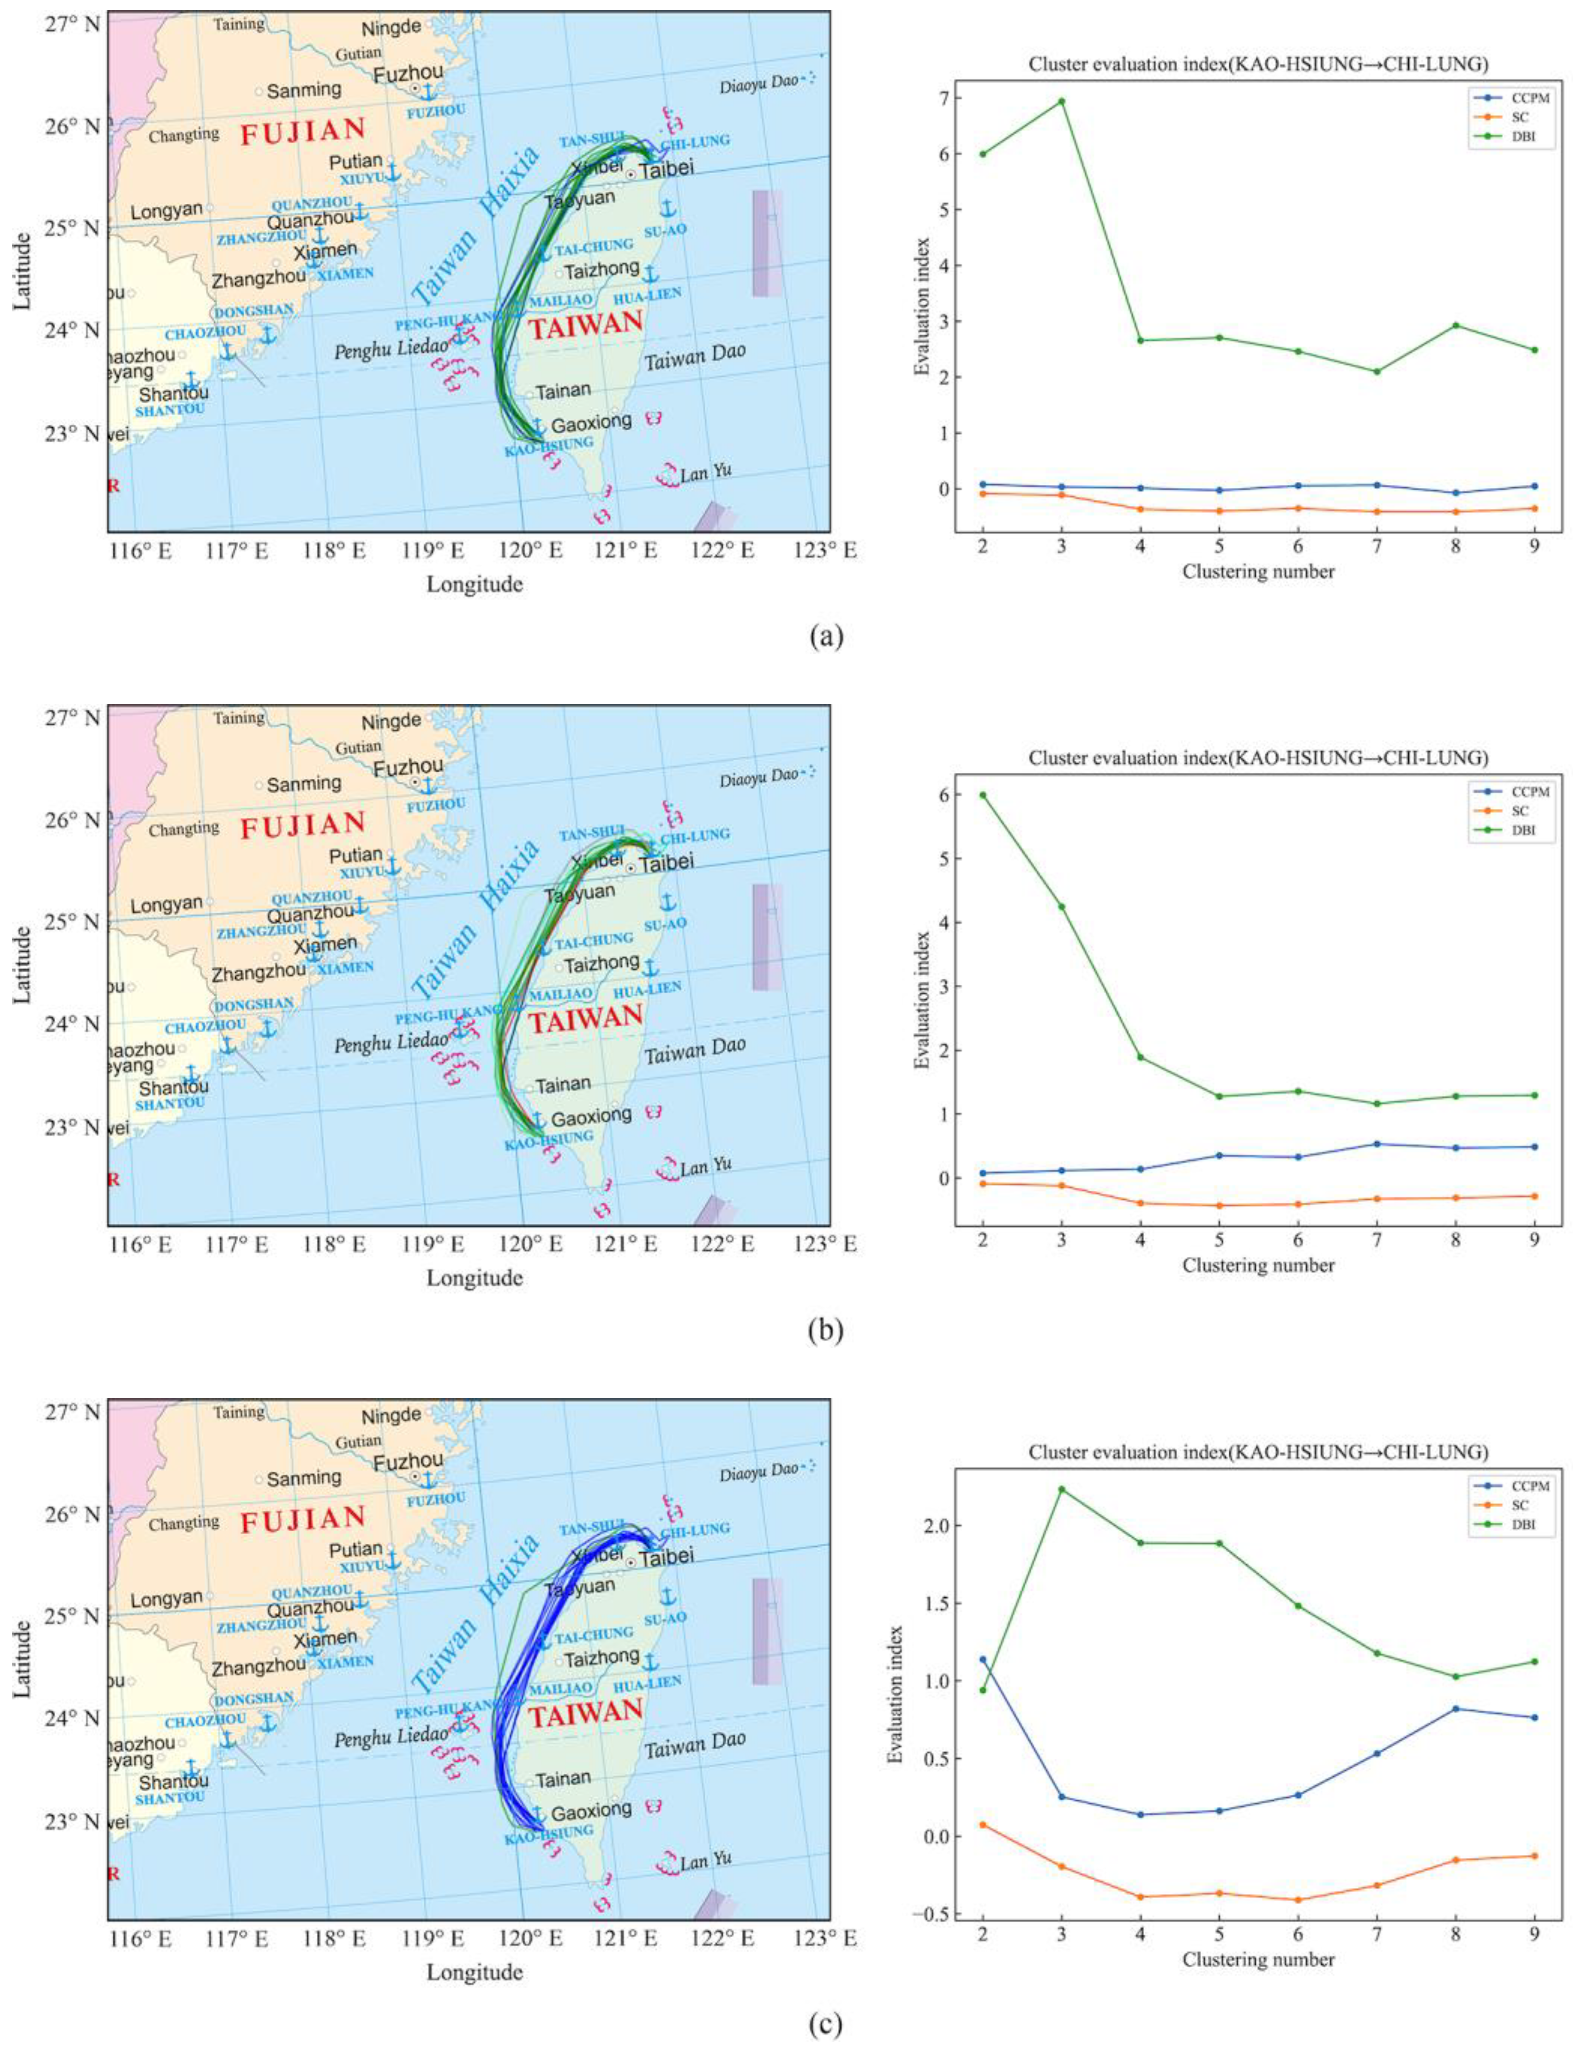
Figure 18.
(a) K-Means clustering results and quantitative evaluation results of the ship trajectories from Kaohsiung Port to Keelung Port. (b) DBSCAN clustering results and quantitative evaluation results of the ship trajectories from Kaohsiung Port to Keelung Port. (c) BIRCH clustering results and quantitative evaluation results of the ship trajectories from Kaohsiung Port to Keelung Port.
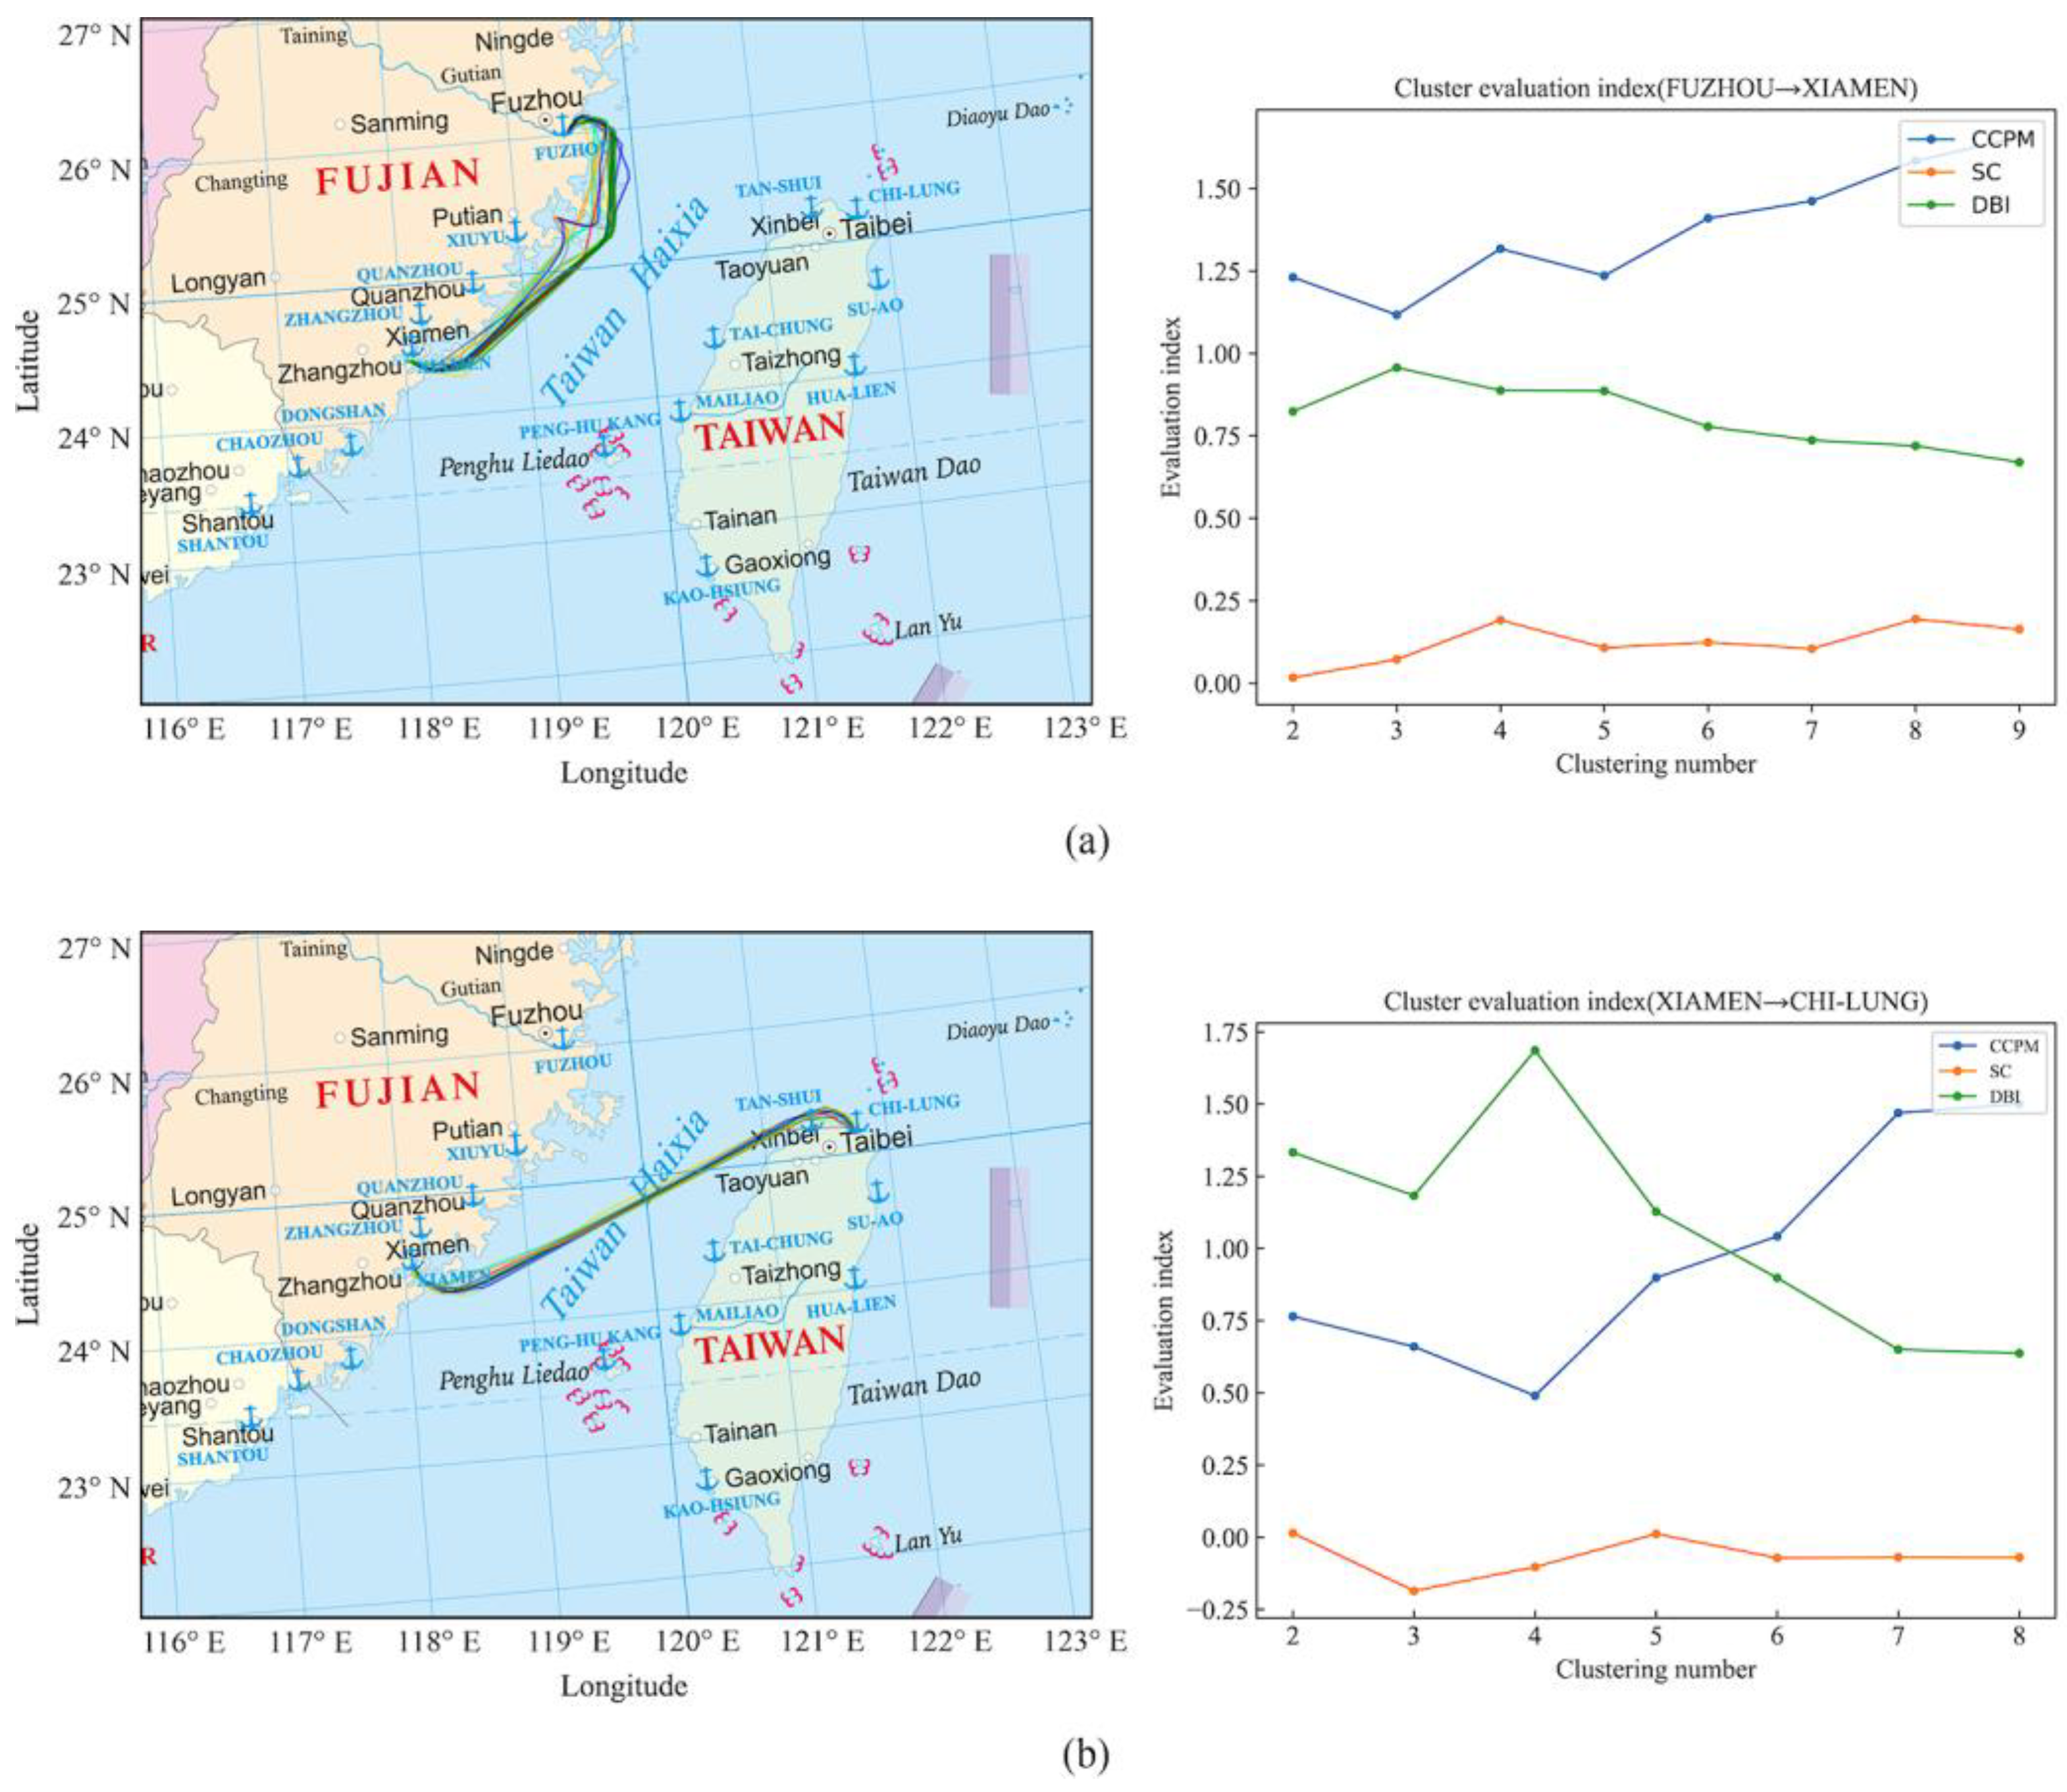
Figure 19.
(a) BIRCH clustering results and quantitative evaluation results of the ship trajectories from Fuzhou Port to Xiamen Port. (b) BIRCH clustering results and quantitative evaluation results of the ship trajectories from Xiamen Port to Keelung Port.
Figure 19.
(a) BIRCH clustering results and quantitative evaluation results of the ship trajectories from Fuzhou Port to Xiamen Port. (b) BIRCH clustering results and quantitative evaluation results of the ship trajectories from Xiamen Port to Keelung Port.
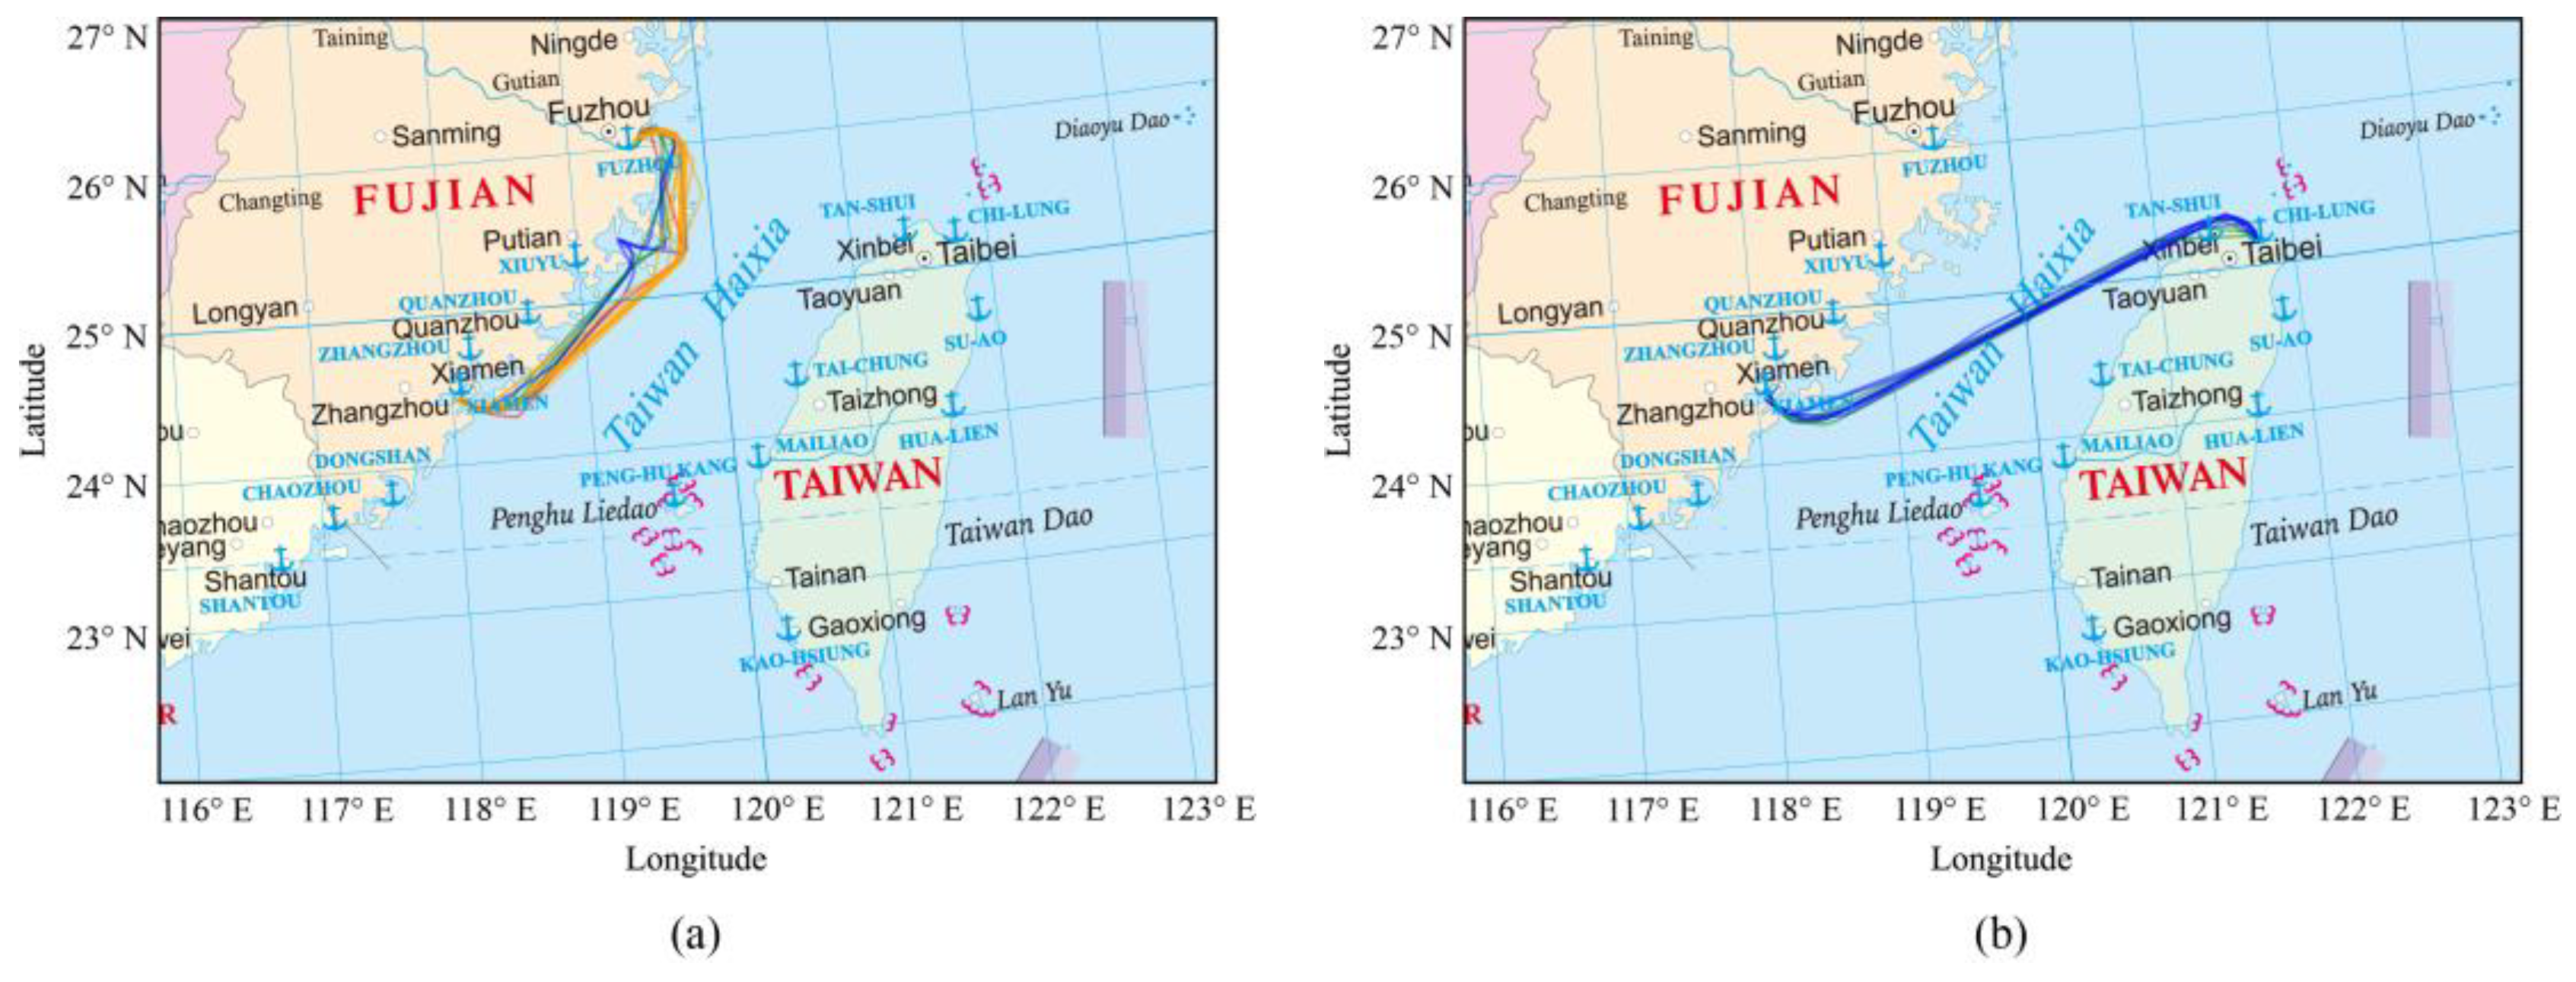
Figure 20.
The modified clustering results of ship trajectories in
Figure 20 based on the enhanced BIRCH algorithm. (
a) shows the clustering results of ship trajectories from Fuzhou Port to Xiamen Port, where the ship trajectories are clustered into four groups. (
b) shows the clustering results of ship trajectories from Xiamen Port to Keelung Port, where the ship trajectories are clustered into two groups.
Table 1.
Key attributes of AIS data used in this study.
Table 1.
Key attributes of AIS data used in this study.
| Field | Significance | Example |
|---|
| MMSI | Maritime mobile service identification number, which is the unique identification mark of the ship. | 412357870 |
| vessel_type | Ship type, such as tankers, cargo ships, fishing vessels, etc. | Cargo ship |
| sog | Ship speed in knots, expressed in nautical miles per hour. | 25.5 |
| longitude | Longitude of the ship’s position in the WGS84 coordinate system, in degrees. | E |
| latitude | Latitude of the ship’s position in the WGS84 coordinate system, in degrees. | N |
| utc | Coordinated universal time indicates the time when this AIS record generated. | 1484102760 |
Table 2.
Ports in the study area.
Table 2.
Ports in the study area.
| ID | Port Name | Country | Longitude | Latitude |
|---|
| 0 | Fuzhou | CN | N | E |
| 1 | Shantou | CN | N | E |
| 2 | Xiamen | CN | N | E |
| 3 | Keelung | CN | N | E |
| 4 | Suao | CN | N | E |
| 5 | Hualien | CN | N | E |
| 6 | Kaohsiung | CN | N | E |
| 7 | Tanshut | CN | N | E |
| 8 | Penghu | CN | N | E |
| 9 | Taichung | CN | N | E |
| 10 | Mailiao | CN | N | E |
| 11 | Chaozhou | CN | N | E |
| 12 | Dongshan | CN | N | E |
| 13 | Quanzhou | CN | N | E |
| 14 | Xiuyu | CN | N | E |
| 15 | Zhangzhou | CN | N | E |
Table 3.
Hausdorff distance matrix of ship trajectories from Kaohsiung Port to Xiamen Port.
Table 3.
Hausdorff distance matrix of ship trajectories from Kaohsiung Port to Xiamen Port.
| Ship Trajectory ID | 0 | 1 | 2 | 3 | 4 | 5 | 6 | … | 22 |
|---|
| 0 | 0 | 82.67 | 96.72 | 97.86 | 90.29 | 97.33 | 91.21 | … | 88.33 |
| 1 | 82.67 | 0 | 99.11 | 87.99 | 100.82 | 113.42 | 84.96 | … | 40.75 |
| 2 | 96.72 | 99.11 | 0 | 21.08 | 26.55 | 17.46 | 117.42 | … | 115.28 |
| 3 | 97.86 | 87.99 | 21.08 | 0 | 33.31 | 37.56 | 117.53 | … | 125.09 |
| … | … | … | … | … | … | … | … | … | … |
| 22 | 88.33 | 40.75 | 115.28 | 125.09 | 122.69 | 109.8 | 81.72 | … | 0 |
Table 4.
Similarity matrix of ship trajectories from Kaohsiung Port to Xiamen Port.
Table 4.
Similarity matrix of ship trajectories from Kaohsiung Port to Xiamen Port.
| Ship Trajectory ID | 0 | 1 | 2 | 3 | 4 | 5 | 6 | … | 22 |
|---|
| 0 | 1 | 0.607 | 0.449 | 0.439 | 0.494 | 0.463 | 0.576 | … | 0.587 |
| 1 | 0.607 | 1 | 0.448 | 0.530 | 0.432 | 0.368 | 0.633 | … | 0.897 |
| 2 | 0.449 | 0.448 | 1 | 0.958 | 0.934 | 0.973 | 0.360 | … | 0.362 |
| 3 | 0.439 | 0.530 | 0.958 | 1 | 0.898 | 0.879 | 0.358 | … | 0.301 |
| … | … | … | … | … | … | … | … | … | … |
| 22 | 0.587 | 0.897 | 0.362 | 0.301 | 0.313 | 0.417 | 0.673 | … | 1 |
Table 5.
Quantitative evaluation of ship trajectory clustering from Kaohsiung Port to Xiamen Port with different resampling thresholds.
Table 5.
Quantitative evaluation of ship trajectory clustering from Kaohsiung Port to Xiamen Port with different resampling thresholds.
| Resampling Value | Average Cluster Number | Average DBI | Average SC | Average CCPM |
|---|
| 5 | 4.990886 | 1.750512 | −0.01113 | 1.05724 |
| 6 | 4.990886 | 1.750512 | −0.01113 | 1.05724 |
| 7 | 4.990886 | 1.750512 | −0.01113 | 1.05724 |
| 8 | 4.990886 | 1.750512 | −0.01113 | 1.05724 |
| 9 | 4.990886 | 1.750512 | −0.01113 | 1.05724 |
| 10 | 4.738936 | 1.770629 | −0.00365 | 1.06221 |
| 11 | 5.222826 | 1.725781 | −0.01795 | 1.063864 |
| 12 | 5.222826 | 1.725781 | −0.01795 | 1.063864 |
| 13 | 5.222826 | 1.725781 | −0.01795 | 1.063864 |
| 14 | 5.222826 | 1.725781 | −0.01795 | 1.063864 |
| 15 | 5.211191 | 1.721574 | −0.01756 | 1.073352 |
| 16 | 5.222826 | 1.725781 | −0.01795 | 1.063864 |
| 17 | 5.222826 | 1.725781 | −0.01795 | 1.063864 |
| 18 | 5.222826 | 1.725781 | −0.01795 | 1.063864 |
| 19 | 5.222826 | 1.725781 | −0.01795 | 1.063864 |
| 20 | 4.713233 | 1.773299 | −0.00289 | 1.061604 |
| 25 | 4.713233 | 1.773299 | −0.00289 | 1.061604 |
| 30 | 4.713233 | 1.773299 | −0.00289 | 1.061604 |
| 35 | 4.713233 | 1.773299 | −0.00289 | 1.061604 |
| 40 | 4.72555 | 1.778805 | −0.00332 | 1.049663 |
| 45 | 4.72555 | 1.778805 | −0.00332 | 1.049663 |
| 50 | 4.72555 | 1.778805 | −0.00332 | 1.049663 |
| 55 | 4.72555 | 1.778805 | −0.00332 | 1.049663 |
| 60 | 4.72555 | 1.778805 | −0.00332 | 1.049663 |
| 65 | 4.72555 | 1.778805 | −0.00332 | 1.049663 |
| 70 | 4.72555 | 1.778805 | −0.00332 | 1.049663 |
| 75 | 4.72555 | 1.778805 | −0.00332 | 1.049663 |
| 80 | 4.72555 | 1.778805 | −0.00332 | 1.049663 |
| 85 | 4.72555 | 1.778805 | −0.00332 | 1.049663 |
| 90 | 4.72555 | 1.778805 | −0.00332 | 1.049663 |
| 95 | 4.72555 | 1.778805 | −0.00332 | 1.049663 |
| 100 | 4.75124 | 1.776065 | −0.00407 | 1.050397 |
Table 6.
Description of the three clustering algorithms.
Table 6.
Description of the three clustering algorithms.
| Clustering Algorithm | Description |
|---|
| K-Means | A distance-based iterative algorithm for cluster analysis requires a pre-specified value of K [40]. |
| DBSCAN | A density-based clustering algorithm that finds arbitrarily-shaped clusters in a noisy spatial database [41]. |
| Enhanced BIRCH | A distance-based hierarchical clustering algorithm that first uses a bottom-up hierarchical algorithm and then improves the results by iterative repositioning [38]. |


