Article

Ecological Response to the Diluted Water in Guangxi during the Spring Monsoon Transition in 2021

1
Key Laboratory of Tropical Marine Ecosystem and Bioresource, Fourth Institute of Oceanography, Ministry of Natural Resources, Beihai 536000, China
2
Guangxi Key Laboratory of Beibu Gulf Marine Resources, Environment and Sustainable Development, Fourth Institute of Oceanography, Ministry of Natural Resources, Beihai 536000, China
3
Observation and Research Station of Coastal Wetland Ecosystem in Beibu Gulf, Ministry of Natural Resources, Beihai 536000, China
*
Author to whom correspondence should be addressed.
J. Mar. Sci. Eng. 2023, 11(2), 387; https://doi.org/10.3390/jmse11020387
Submission received: 31 December 2022 / Revised: 2 February 2023 / Accepted: 3 February 2023 / Published: 9 February 2023

Abstract

:
Based on the field survey data of the Guangxi offshore voyage in May 2021, the distribution characteristics of the wind field during the spring monsoon transition period, the temporal and spatial changes in the diluted water path, and the corresponding ecological responses were analyzed. The results show the following: the core region of diluted water is located along the coast of Guangxi, and the diluted water expands to the east and west at the same time, where the thickness of the diluted water reaches 20 m. Under the combined action of the easterly wind and westward current, the westward expansion trend was stronger than the eastward expansion trend. The surface distribution of suspended solids, chlorophyll a, dissolved oxygen, and active silicon is similar to the dispersion range of the diluted water, and the high-value areas all appear near the estuary, which is basically consistent with the salinity distribution in the core region of the diluted water. Under the mixing caused by the wind and tide in the estuary area, the difference in dissolved oxygen between the surface and bottom layer is small, while in the nearshore area, the stratification of seawater hinders the dissolved oxygen’s downward transmission, resulting in a large difference in dissolved oxygen between the bottom and the surface.
Key Contribution: The research results reveal the dispersion path, morphology, and influencing factors of the spring diluted water in Guangxi and its influence on the ecological environment, including on near suspended matter, chlorophyll a, dissolved oxygen etc.

1. Introduction

The Guangxi Beibu Gulf is located at the top of Beibu Gulf, bordering Guangxi Zhuang Autonomous Region to the north, the Leizhou Peninsula in Guangdong Province to the east, and Vietnam to the west. The maximum water depth is about 50 m. It is located between 107°28′–109°51′ E and 20°54′–22°28′ N. The rivers that flow into Beibu Gulf from Guangxi are arranged in a line from east to west, Nanliu River, Dafeng River, Qinjiang River, Maoling River, Fangcheng River, and Beilun River.
When runoff from Guangxi enters the sea, it forms diluted water. Because runoff density is lower than seawater, it floats on the seawater and forms a plume, plume circulation, and a plume front. Its structure leads to the stratification of the water body, which strengthens the vertical shear, leads to the instability of the water body, and accelerates the vertical mixing process of the water body. The plume front is the area with the largest salinity horizontal gradient [1]. As a dynamic barrier, the front zone prevents the transport of momentum, dissolved substances, and sediments to the open sea; thus, the concentration of dissolved substances and other substances in the front zone of the sea is significantly higher than that in the sea on both sides of the front zone [2]. The runoff from Guangxi into the sea and the sediment, nutrients, pollutants, etc., carried by it have a huge impact on the circulation structure [3], water mass structure [4,5,6], upwelling [7,8], river plume [5], sediment deposition [9,10], ocean productivity [11,12,13,14,15], etc. The large number of nutrients and organic matter brought about by the diluted water from Guangxi can change the community structure of planktonic algae [16] and zooplankton [17] in estuarine waters, resulting in higher primary productivity, which is beneficial for the biogeochemical elements of the estuary and can have an important impact [18,19]. The high-value zone of chlorophyll a in summer is mainly distributed in the estuary area and carries the high-nutrient diluted water to the offshore area [20]. The increase in nutrients induces the growth of phytoplankton at a concentration that is significantly higher than in the winter. The nutrient concentration characteristics and sea-flow fluxes of the main rivers flowing into the sea in February (dry season) and August (wet season) [21] vary. The difference in salt concentration was more obvious, and the nutrient concentration of the Dafeng River and Nanliu River was higher in the wet season than in the dry season. After analyzing the nutrient data from the Beibu Gulf waters of Guangxi from the past 25 years, it was determined that the diluted water from the land-source runoff in Guangxi was the main carrier of pollution in this sea area, and the pollutant mass concentration in the coastal waters varied with the annual runoff into the sea [22]. The dispersion of pollutants is closely related to the hydrological characteristics of the coastal waters [23] and is also affected by the mixing process of the open ocean currents [24,25]. In the area shallower than the 10 m isobath near the coast, the concentration of NO3-N is mainly affected by the terrestrial pollution caused by surface runoff [16]. There is a high eutrophication state in the Lianzhou Bay, Qinzhou Bay, the Lianzhou Bay Estuary, and the Dafeng River Estuary, and the accelerated industrialization of coastal areas has changed the marine food chain and increased the risk of red tides [26,27].
During the spring monsoon transition period, the northeast monsoon that prevails in winter gradually transform into the southwest monsoon that prevails in summer with the continuous increase in the runoff into the sea from Guangxi. Under the combined effect of runoff and the monsoon, the dispersion path and shape of the diluted water in Guangxi are constantly changing. To understand the response of different environmental factors to the change in the diluted water path during the monsoon transition period, as well as the interaction between various environmental variables and their temporal and spatial changes, the on-site observation data from the voyage in May 2021 are sorted in this study, and the characteristics of the expansion model of diluted water in Guangxi during this period were analyzed, as was the transport of suspended solids, chlorophyll a, dissolved oxygen, and active silicon.

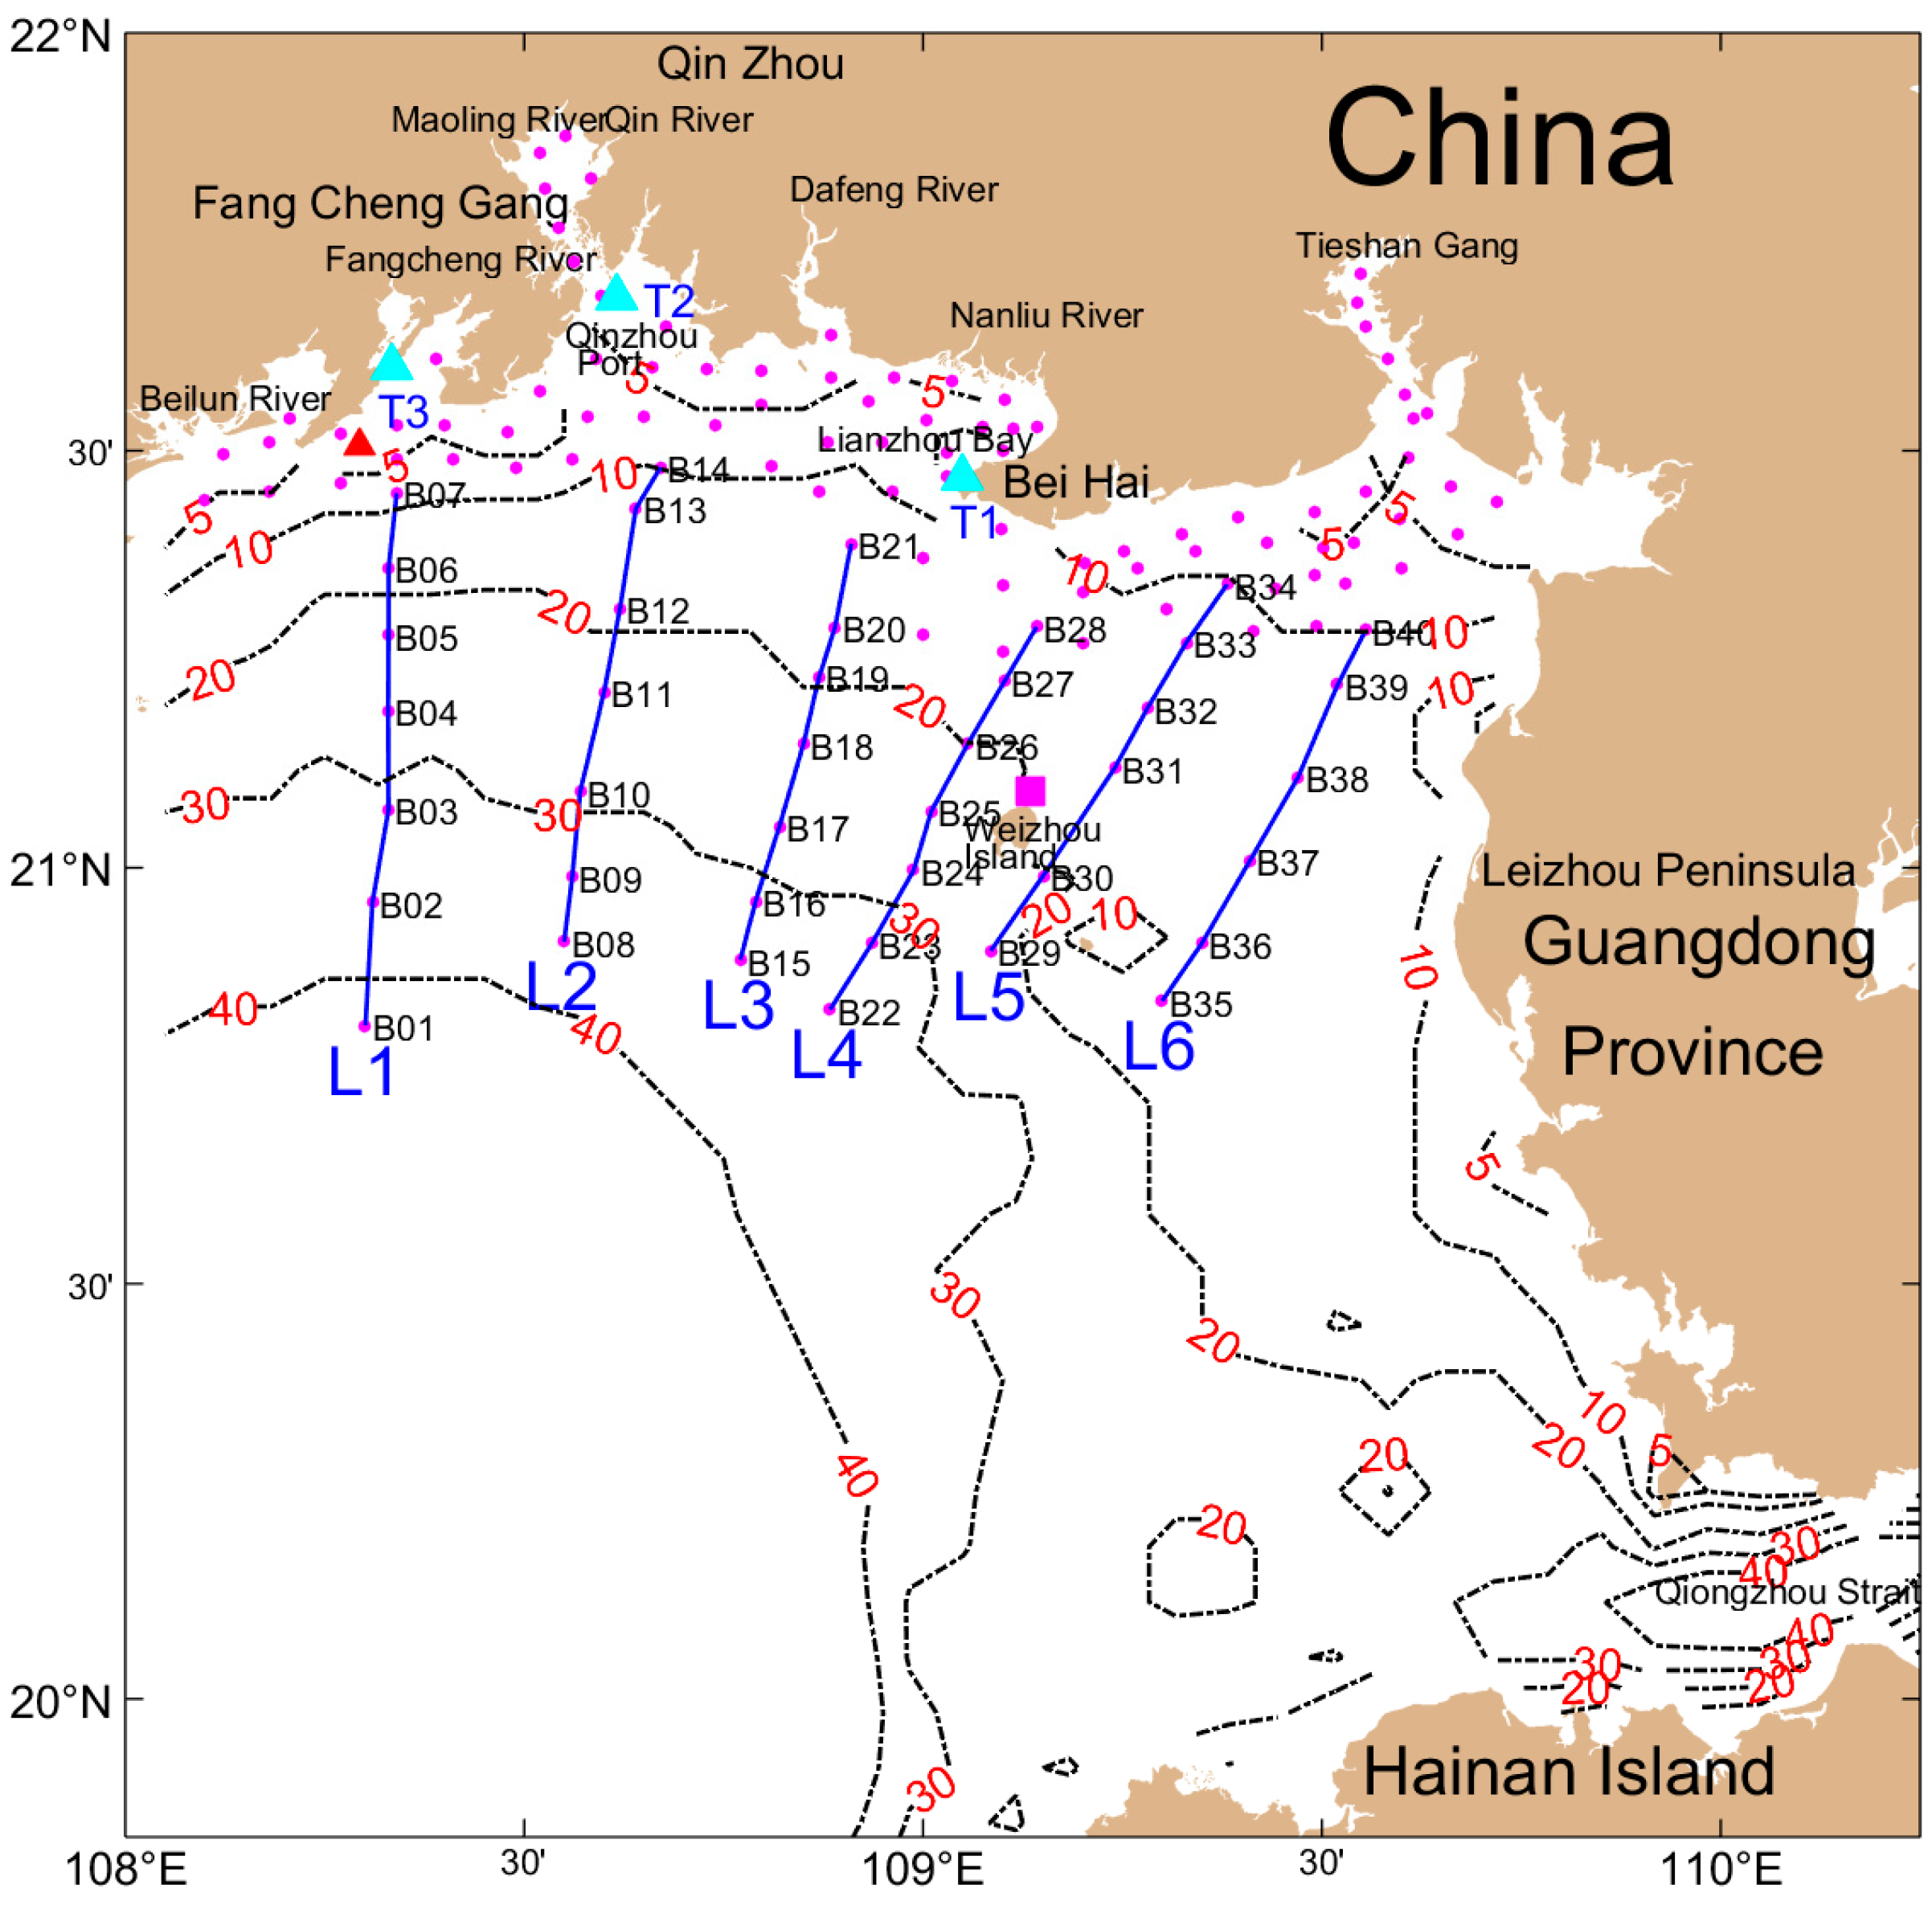
2. Materials and Methods

The data of nearshore and coastal areas were obtained from the special spring voyage of the “Beibu Gulf Natural Resources Survey and Assessment” in May 2021, in which 87 stations along the coast (L01–L87 stations) were investigated from 26 April to 15 May, and 40 stations (B01–B40 stations) were investigated from 22 May to 26 May. The water depth of each station ranged from 1 m to 39 m, and the average water depth was 12 m. Data included temperature, salinity, chlorophyll a, dissolved oxygen, and suspended solids, as well as other hydrological, ecological, and environmental factors. This special survey covered the sea area from coastal to nearshore areas (Figure 1), conducting multidisciplinary comprehensive observations of ocean currents, salinity, temperature, suspended matter, dissolved oxygen, chlorophyll a, and active silica. The observation level of the ocean current, salinity, and temperature were from the sea surface to the sea bottom, and the sampling interval was 1 m. Navigational wind field data were collected on board during the survey. The tidal level data of Beihai, Qinzhou, and Fangchenggang during the survey were collected. During the period from 26 April to 26 May, the profile current observation was carried out through the seabed base deployed on the north side of Weizhou Island, where the sampling interval was 1 m. These high-resolution data are helpful for revealing the response of suspended matter, dissolved oxygen, chlorophyll a, and other substances.

3. Results

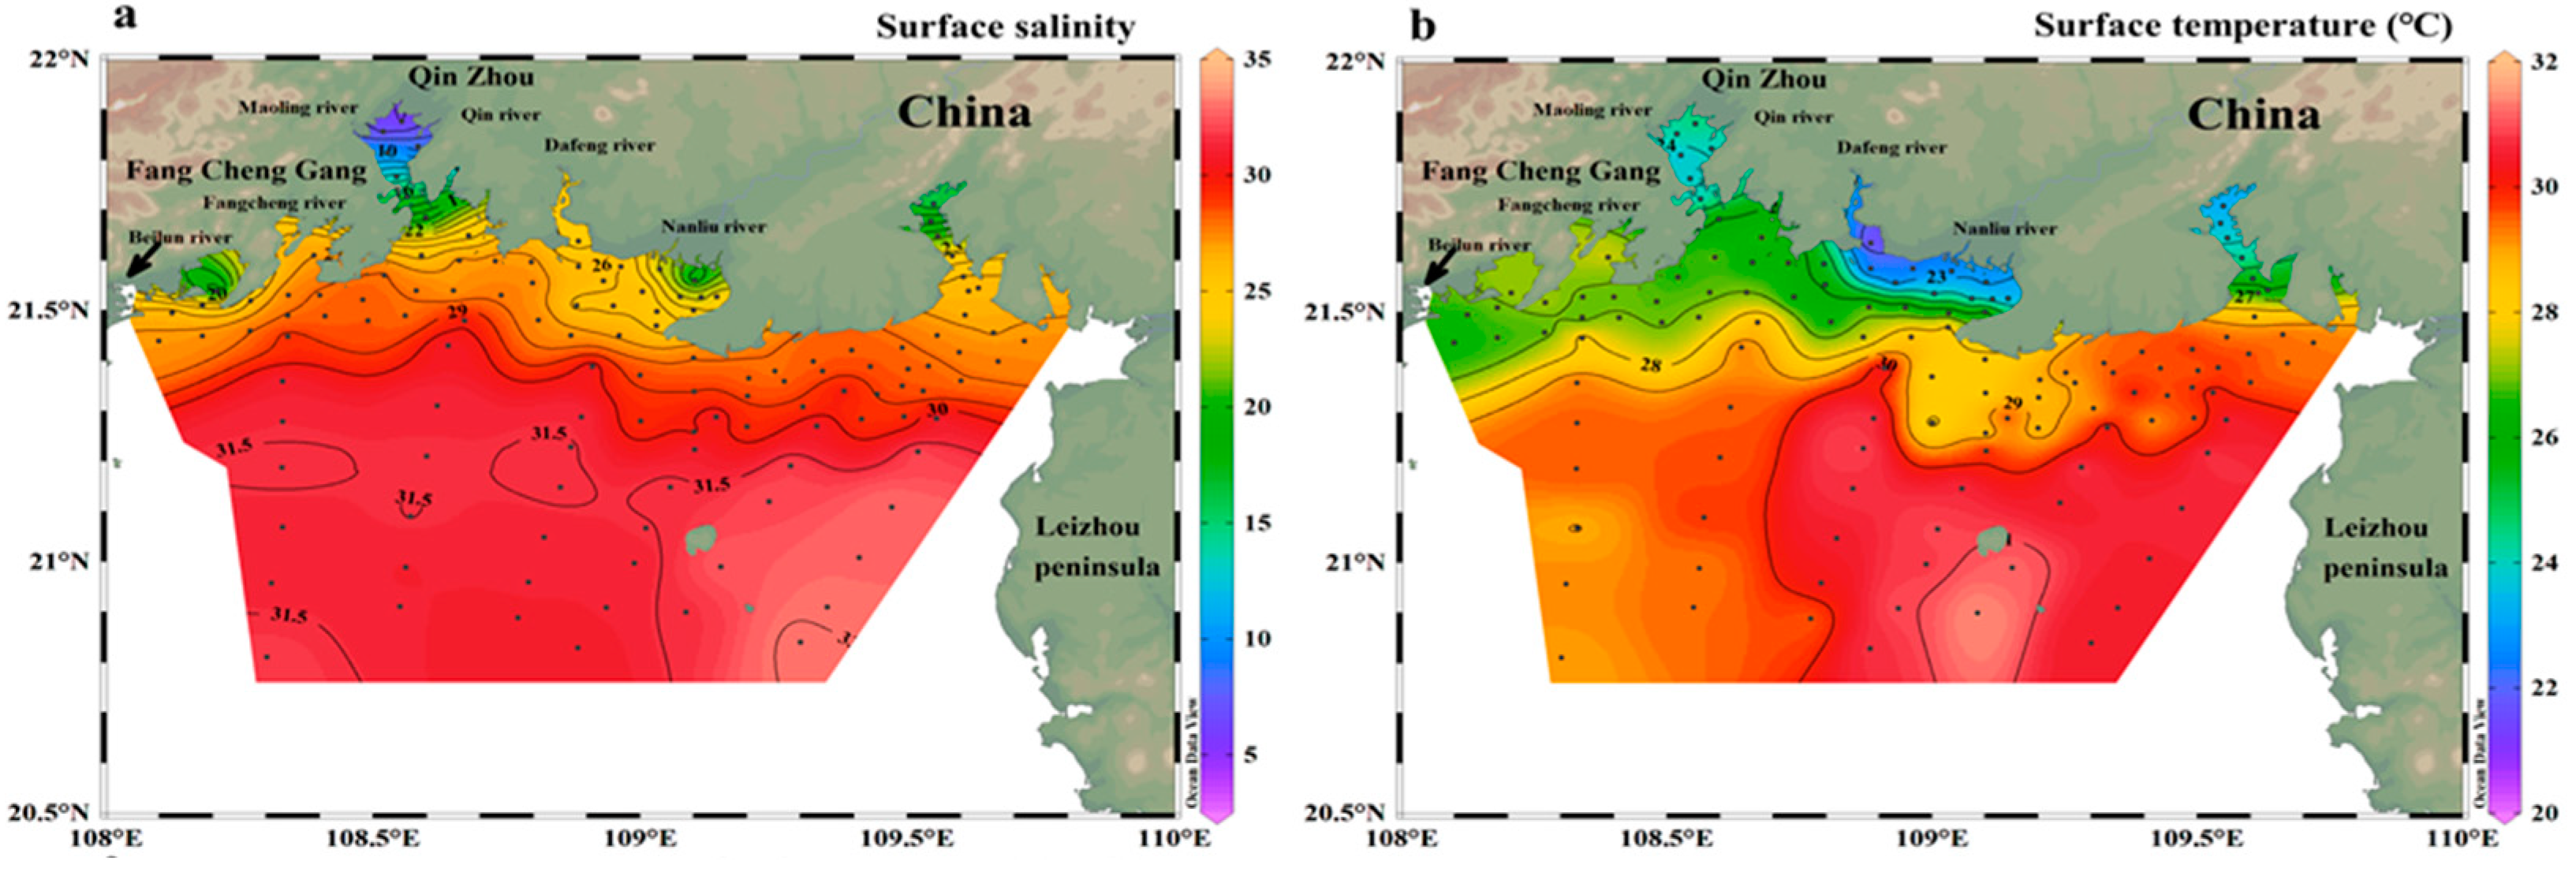
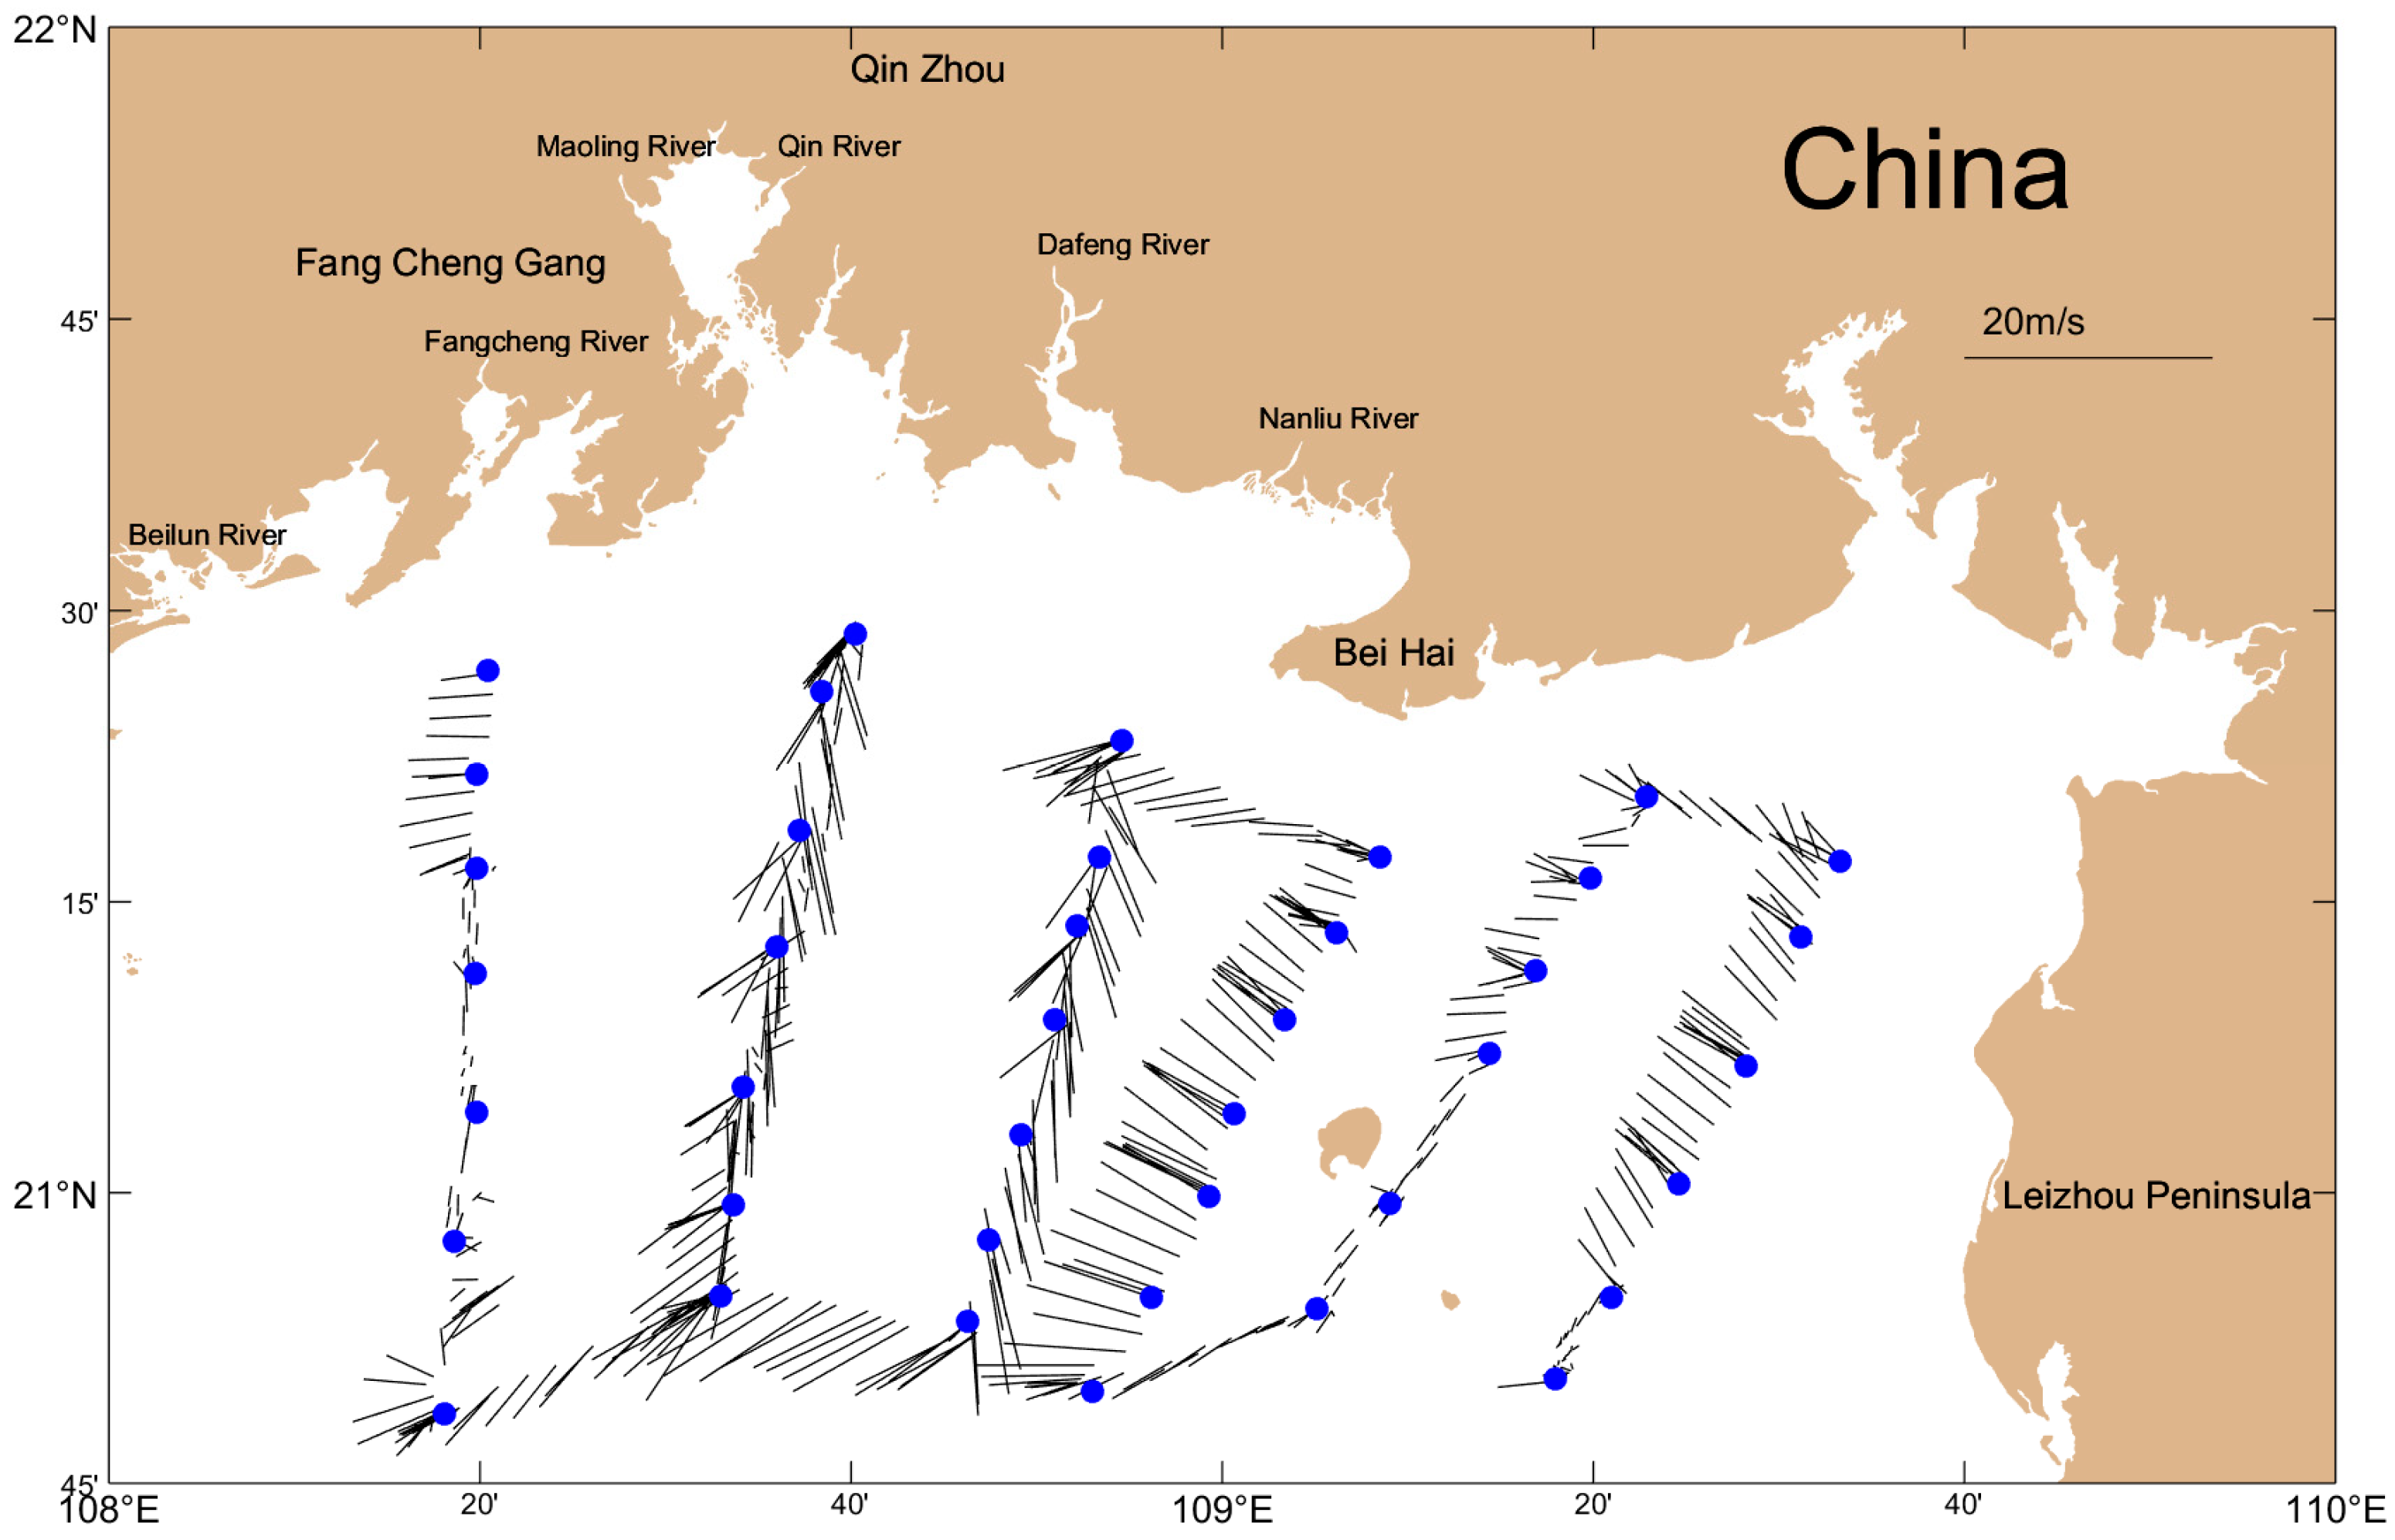
3.1. The Characteristics of Diluted Water

Previous studies defined the salinity range of diluted water as 4 psu–32 psu, of which 4 psu–27 psu was the salinity of the core region of the diluted water [1]. Following this principle, this paper also uses a salinity of less than 32 psu for diluted water. From the surface layer salinity distribution (Figure 2a) in the survey area, it can be seen that the diluted water in Guangxi expands to the west and east simultaneously, where the expansion toward the west is stronger than that toward the east. The core region of diluted water in Guangxi, with a salinity of 4 psu–27 psu during the spring monsoon transition, was concentrated in the coastal area, and a salinity front was formed. After entering the sea area from the estuary, through geostrophic adjustment, the baroclinic gradient and Coriolis force [28] were balanced, driving the diluted water to expand westward. After the runoff from Guangxi flowed into the Beibu Gulf, a very strong surface density gradient (across the isobath direction, roughly perpendicular to the shoreline) was formed along the coast of Guangxi, creating almost equal water levels on the west and east sides of the Guangxi coast; however, it is not enough to reverse the westward expansion trend (Table 1), and under the combined action of the easterly wind and the westward coastal current, a westward-expanding pinnate front was formed on the lines of Fangcheng Bay, Qinzhou Bay, and Lianzhou Bay. In Lianzhou Bay, the density gradient of the freshwater after mixing with the tide was small, but under the action of the southward flow driven by the northerly wind, the freshwater interacted with the outer seawater to form a 28 psu–30 psu plume front, whose southernmost end could reach the sea area near 21° N. This salinity front corresponds to a temperature front ranging from 27 °C to 29 °C (Figure 2b). There were no rivers flowing into the area from Beihai to the coast of Tieshangang, and the area was affected by the easterly wind and the northwest current. However, in the area of Tieshangang and Weizhou Island, the eastward expansion of diluted water in Guangxi was still present, and its southeast side was occupied by high-salt water with a salinity greater than 32 psu. The high-salt water mass might come from the coastal flow across the Qiongzhou Strait in western Guangdong (Figure 3) [29].
From the vertical sections (Figure 4), we selected the westernmost section (L1) of the survey area and the North Sea section (L4) to observe the distribution characteristics of diluted water. The two sections are similar to that seen with the vertical coastline trend, but because the northernmost ends of the two sections are located in coastal waters, they do not include the edge of the maximum salinity front near the estuary. According to the vertical distribution of salinity in the L1 section, the depth of the diluted water can reach 20 m. Under the joint effect of northerly wind Ekman transport and Coriolis forcing, the diluted water in Guangxi extends westward, becoming salty and thinning out due to mixing with continental shelf water. At its south edge, due to very weak mixing, the thickness of the diluted water is just 8 m, and the stratification is strongest. Therefore, the thermocline uplifts southward (Figure 4a), and the temperature difference in the surface layer increases continuously, ranging from 0.5 °C in the northern section to 4 °C in the southern part. Under the joint action of temperature and salinity, the surface seawater density decreases continuously, and seawater stratification also increases continuously.
According to the cross-section distribution of L4 salinity (Figure 4d), it can be seen that the thermocline layer of the diluted water was 8 m in the northern sea area, and its thickness rapidly increased to 14 m after it spread southward for about 40 km. The dispersion range of the diluted water still overflows the section, where the salinity is about 30.9 psu. The Ekman effect of the easterly wind on this section drove the accumulation of diluted water to the shore, which, coupled with the rotation of the current from south to north and its northward flow direction, caused its surface isohaline to bend shoreward at the northern station of the section. In the vertical direction, the subsurface isohaline changes from being horizontal in the open sea to being vertical near the shore, resulting in vertical mixing being intensified in the nearshore area and the disappearance of the thermocline. The surface and subsurface of the entire section were covered with warm water with a temperature greater than 30 °C, and significant seawater stratification occurred.

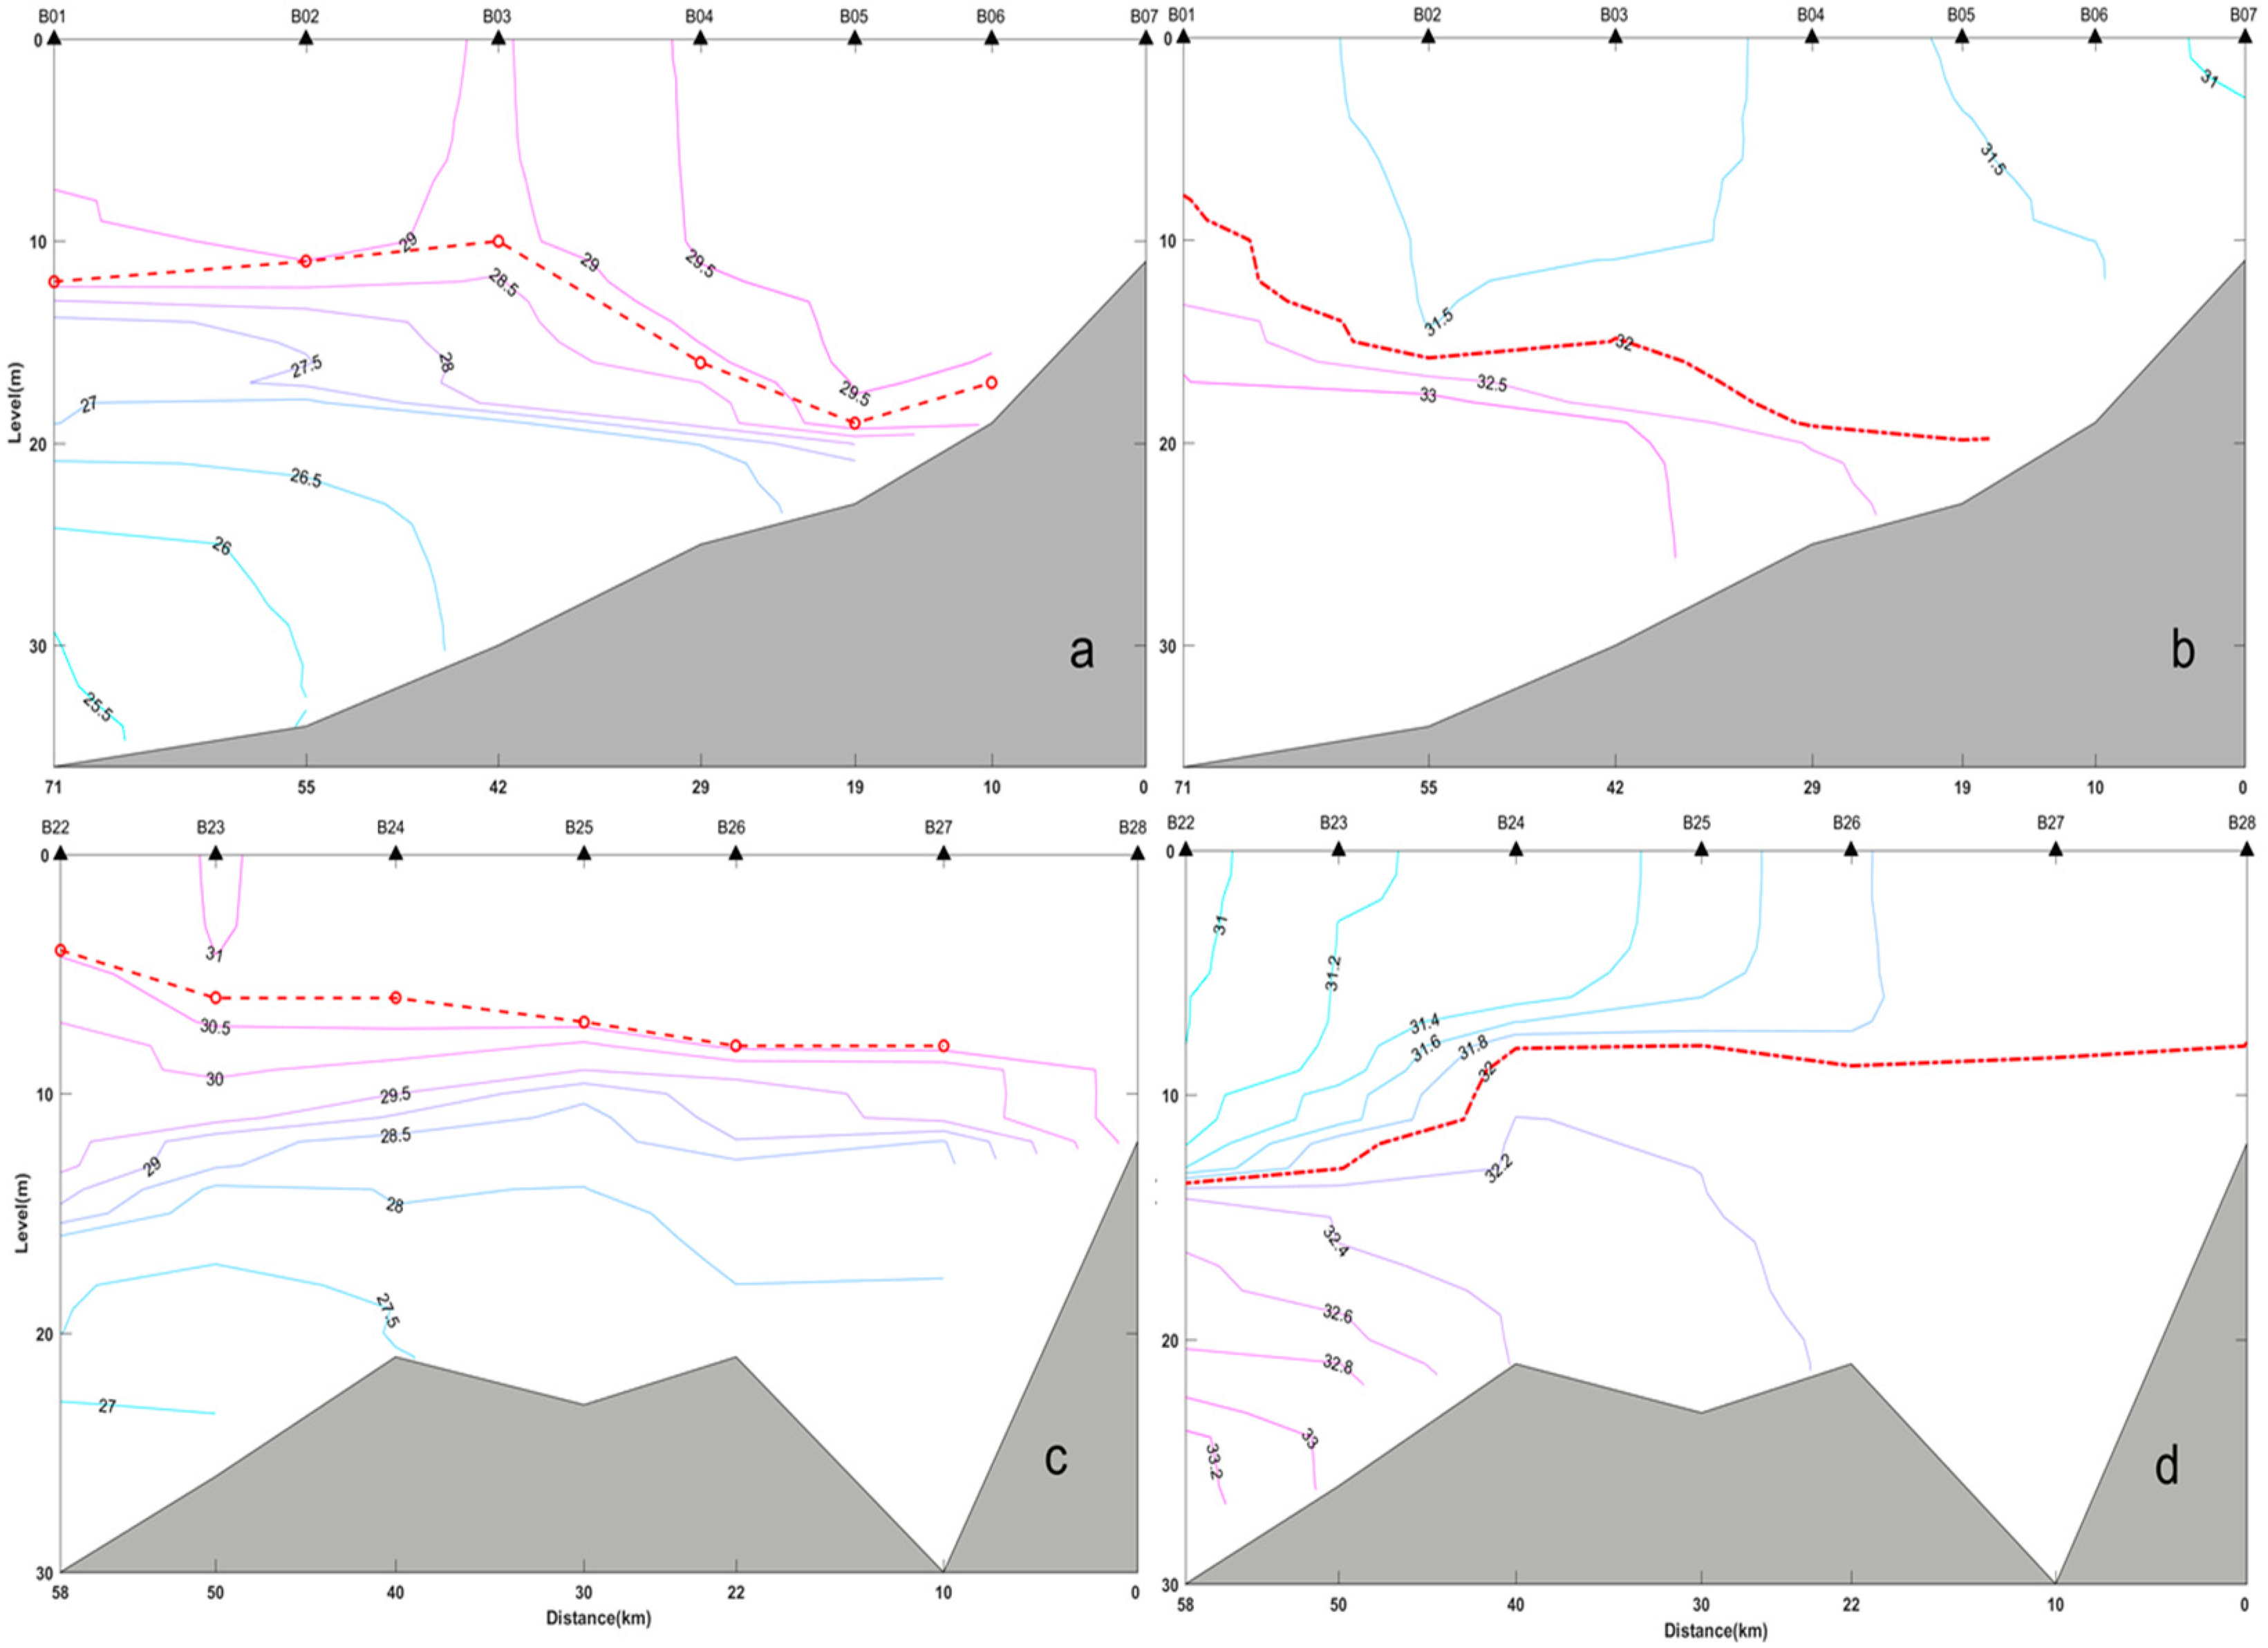
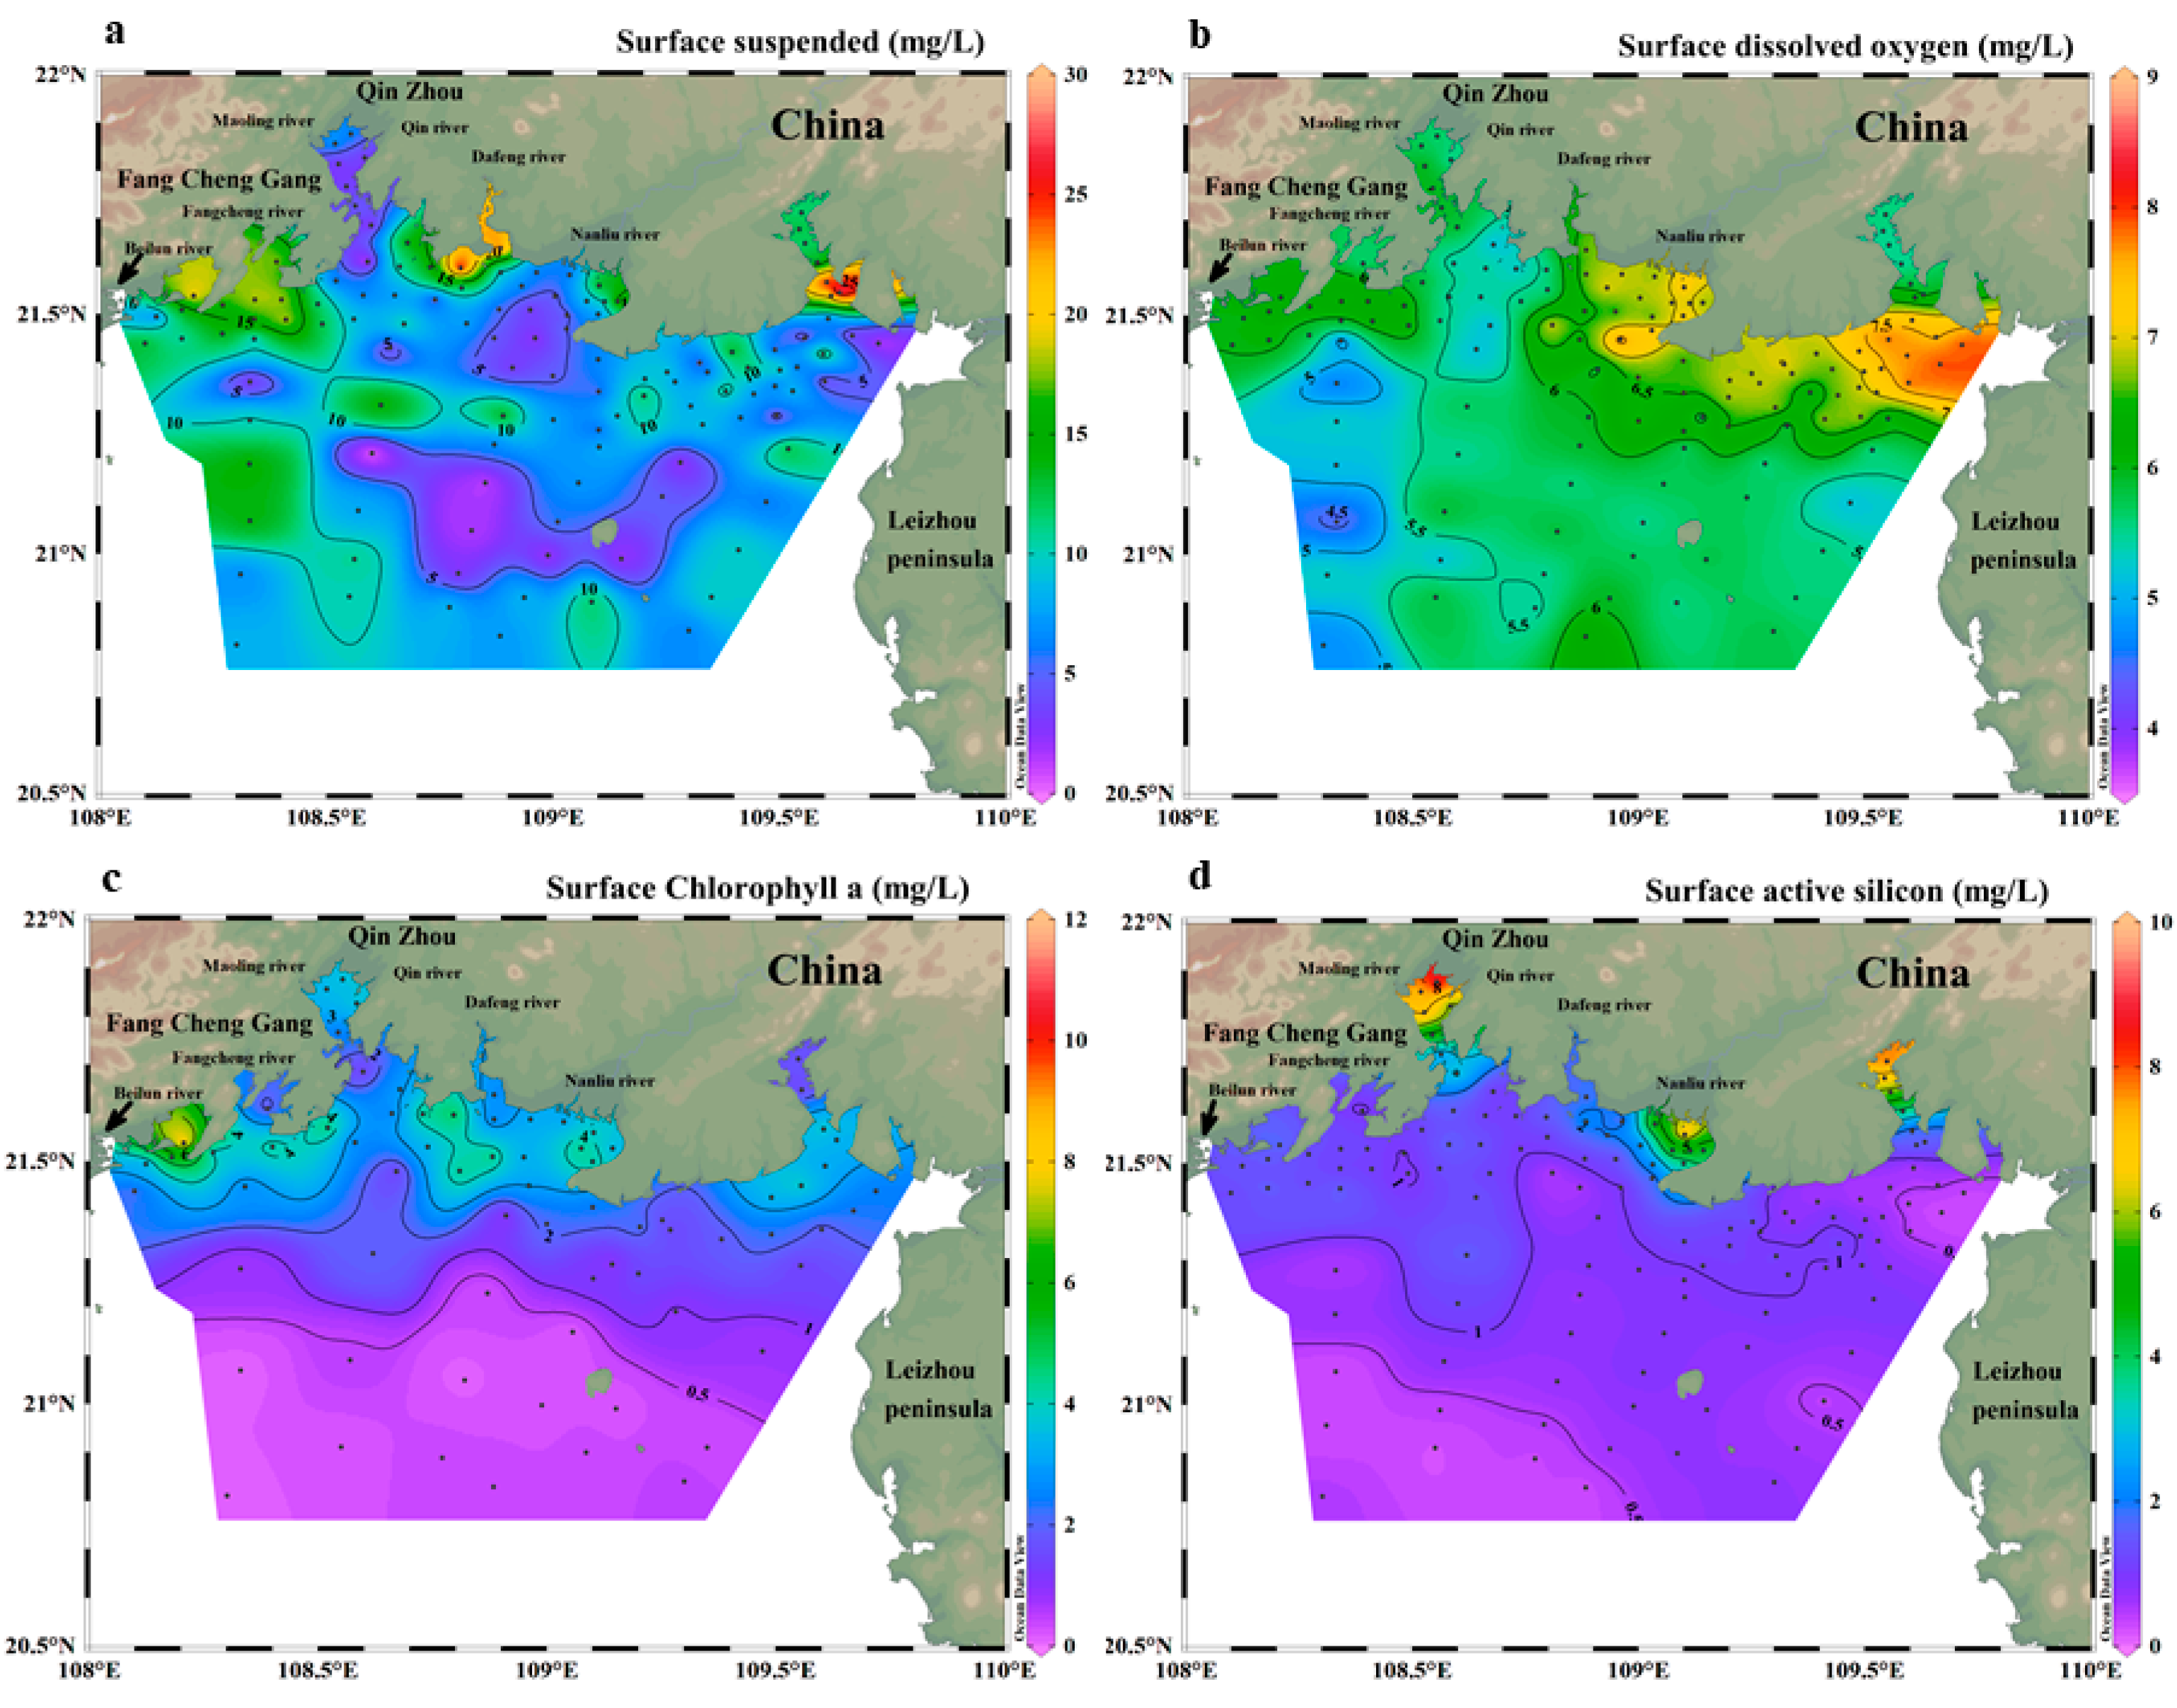
3.2. The Characteristics of Environmental Factors

During the survey, the surface distributions of suspended solids, chlorophyll a, dissolved oxygen, and active silicon (Figure 5) were all similar to the dispersion range of the diluted water. The maximum concentration area of suspended matter was located in the waters of Lianzhou Bay and Dafengjiang Estuary, and its maximum horizontal gradient corresponds to the salinity front with a salinity of 5 psu–28 psu, which indicates that there was a maximum turbidity zone, and the concentration of the suspended matter decreased obviously after sedimentation and dilution of the maximum turbidity zone. The high-concentration locations correspond to the low-salinity locations. The inner sea study area shows high salinity values (31.5 psu) and a low suspended matter concentration of 5 mg/L. The maximum values of chlorophyll a, dissolved oxygen, and active silicon appear near the estuary, which is basically consistent with the salinity distribution in the core region of diluted water and the spatial distribution of suspended matter at the surface. However, the concentrations of chlorophyll a, dissolved oxygen, and active silicon in areas outside the core region of the diluted water were relatively low. Chlorophyll releases oxygen through photosynthesis. Since the organic matter carried by the diluted water needs to consume oxygen, the distribution of chlorophyll a and dissolved oxygen did not completely correspond. The dissolved oxygen in the surface layer in the study area showed a trend of increasing from the southwest to the northeast. The concentration of dissolved oxygen in the nearshore surface layer of Lianzhou Bay and Tieshangang area was relatively high, and its distribution pattern was similar to that of the 29 isohalines of diluted water in the study area. The maximum value of active silicon was concentrated near the estuary, indicating that the terrestrial nutrients carried by the runoff from Guangxi to the sea were the main sources of nutrients in the estuary and its adjacent waters.

4. Discussion

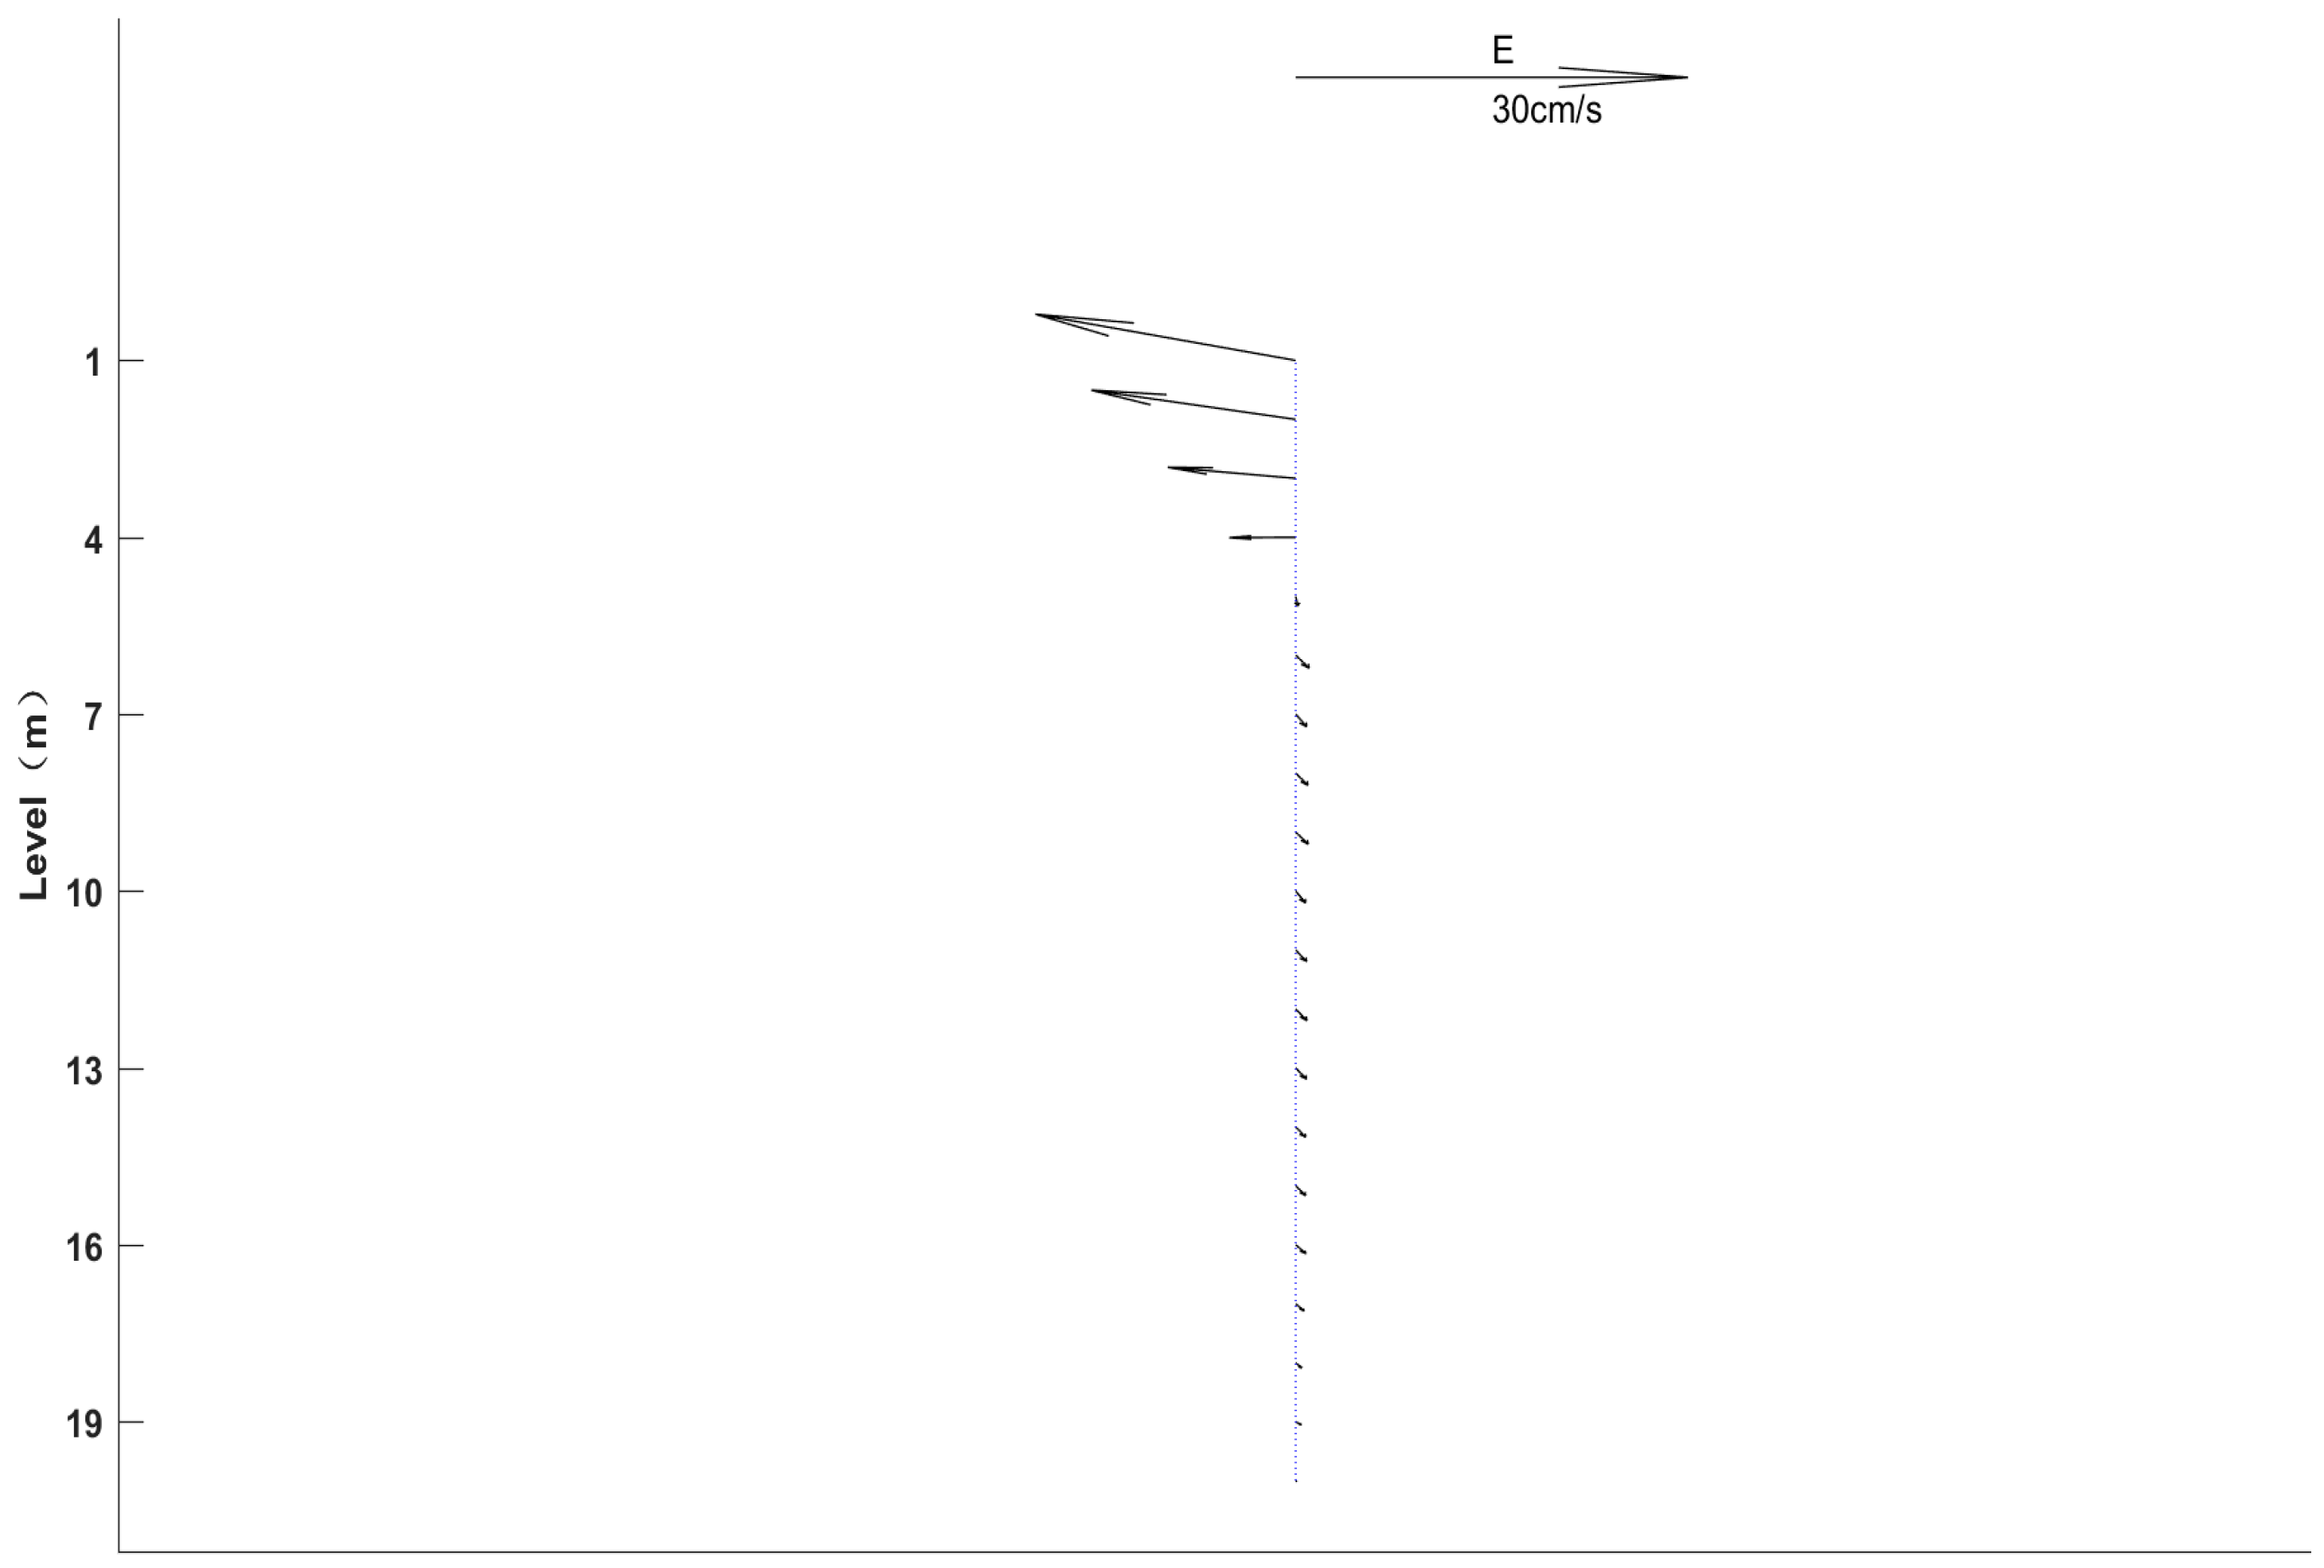
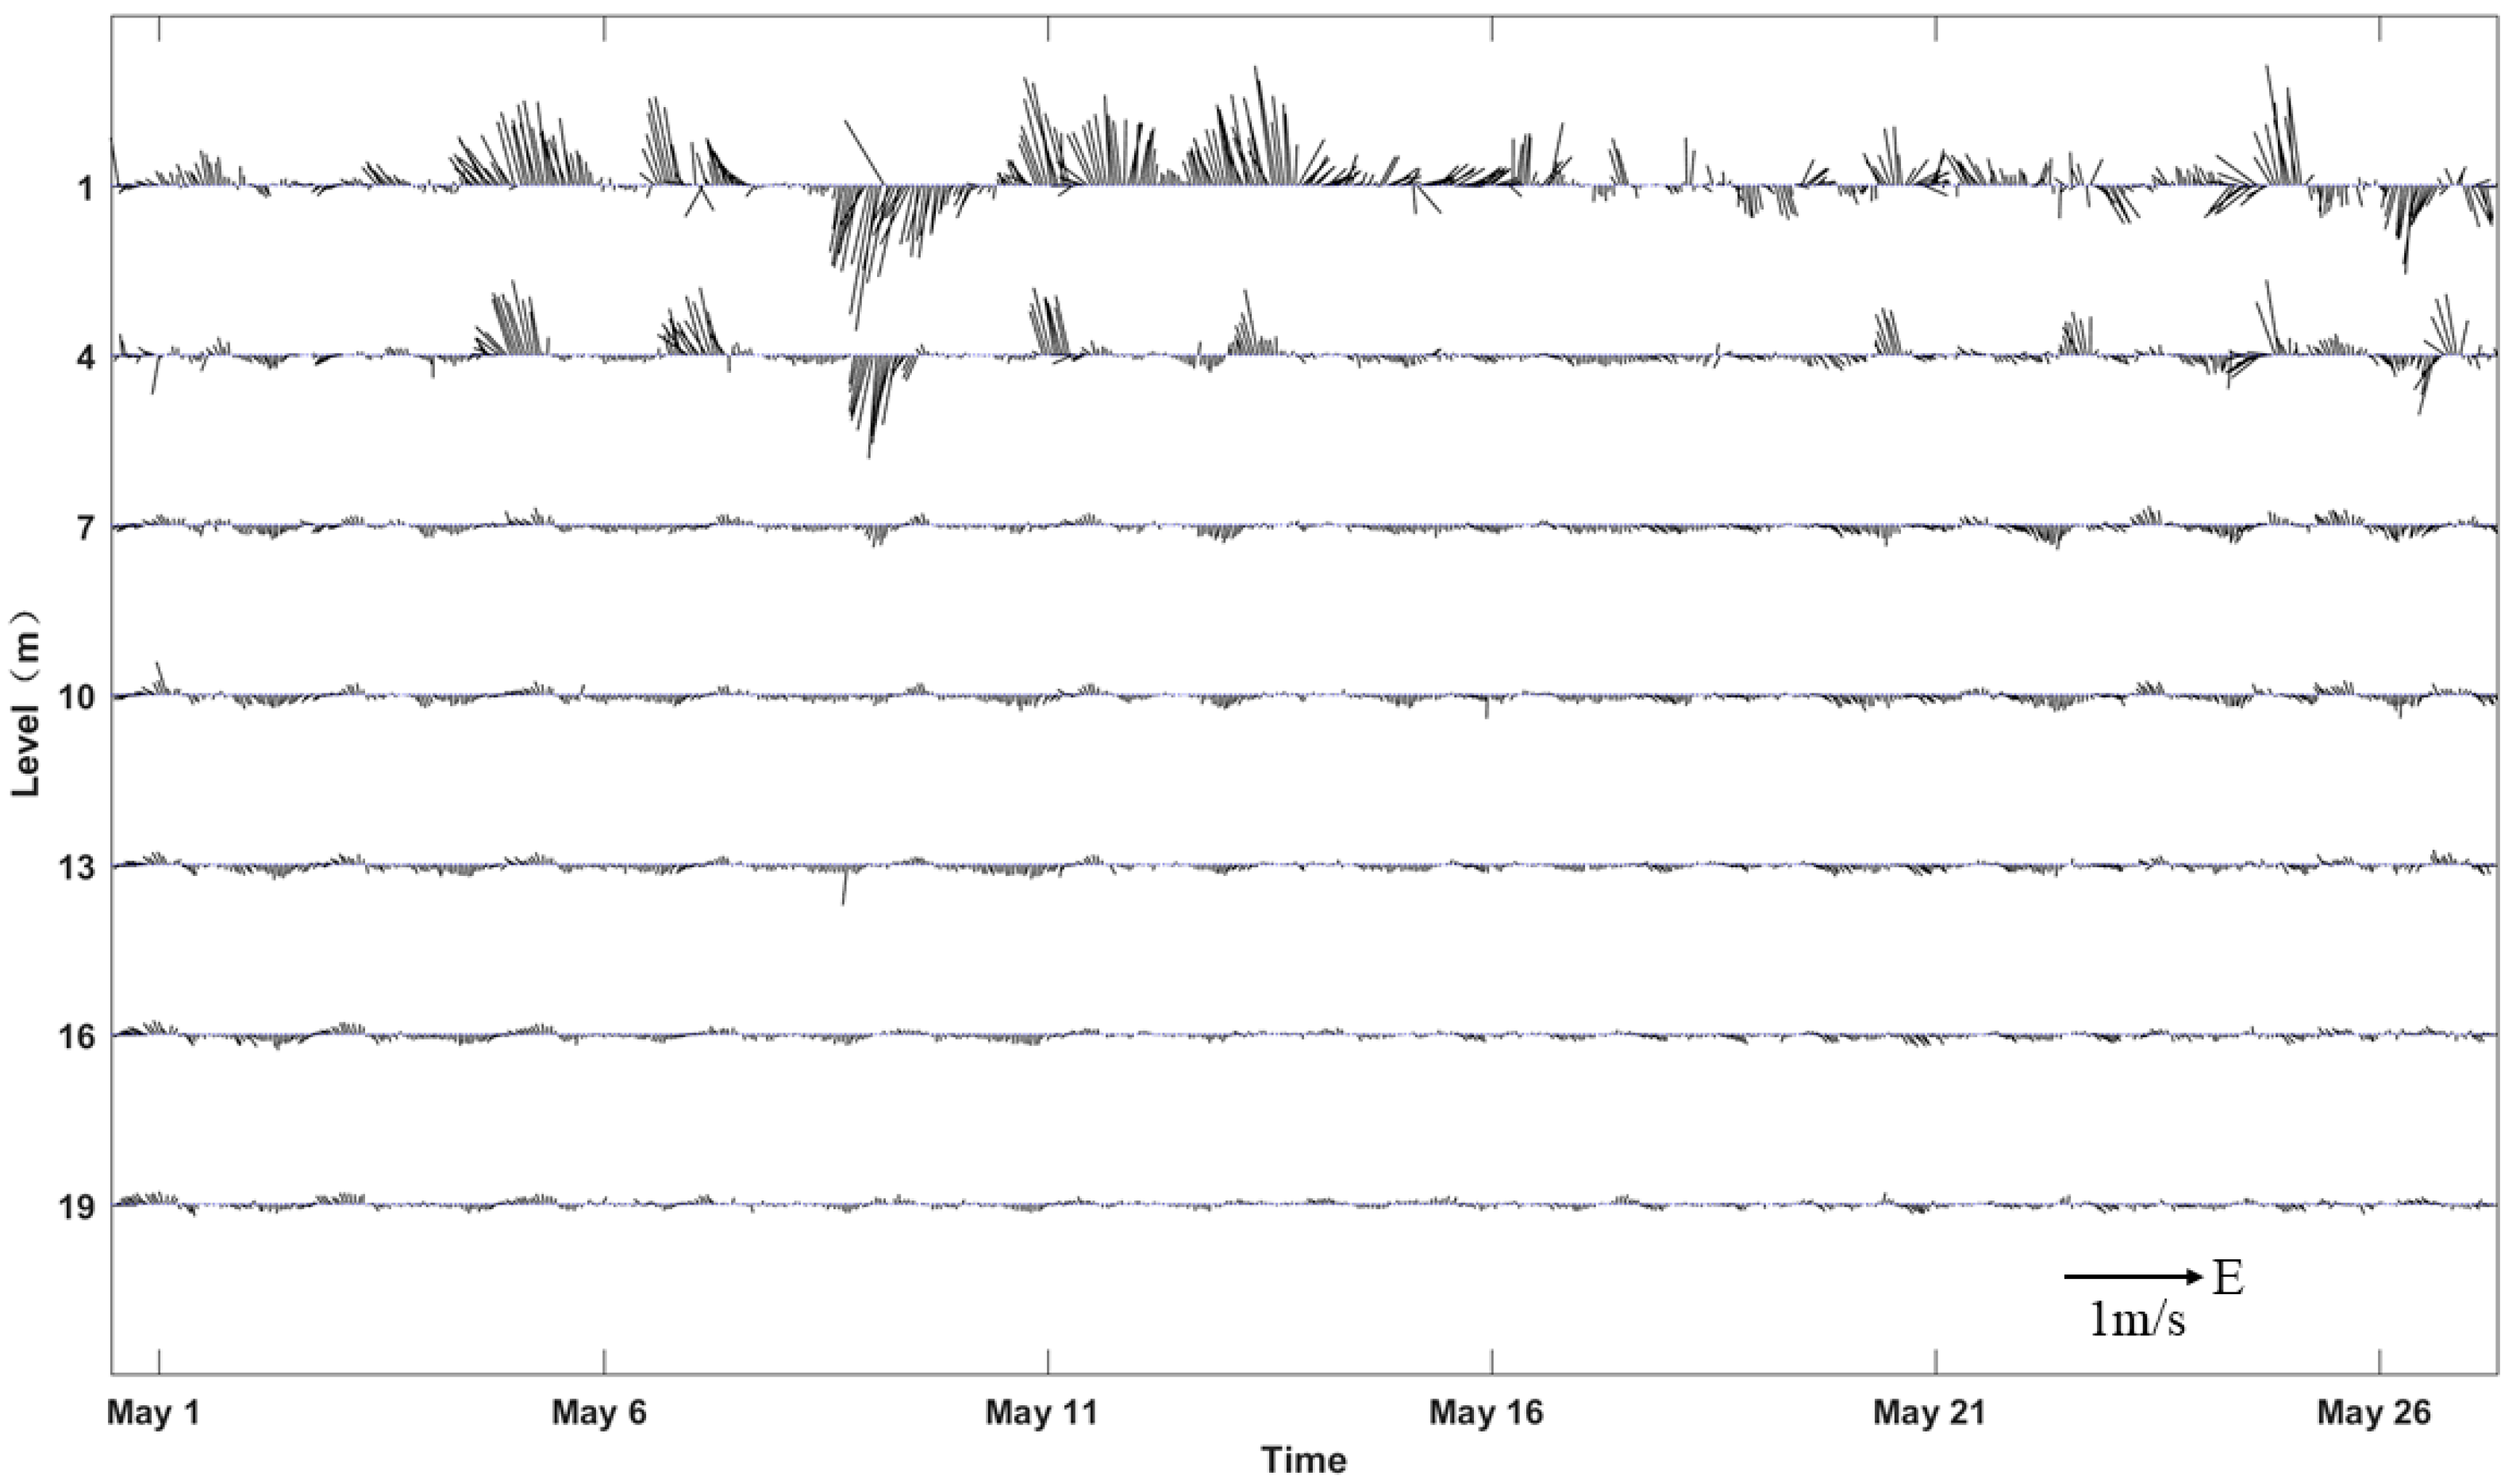
4.1. Dynamic Factors Affecting Dispersion of Diluted Water

Studies on the characteristics and mechanism of diluted water in the Pearl River Estuary [27,30,31,32,33,34] and the Yangtze River Estuary [35,36,37,38,39,40,41] show that wind fields and runoff can significantly affect the form and scope of diluted water. The amount of runoff can significantly affect the dispersion area of diluted water [42,43,44,45,46], whereas the rivers flowing into the Beibu Gulf from the coast of Guangxi are all small and medium-sized rivers with a small runoff [47]; thus, the contribution of runoff and the expansion scope, path, and intensity of freshwater is not as obvious as that in the Pearl River Estuary and the Yangtze River Estuary.

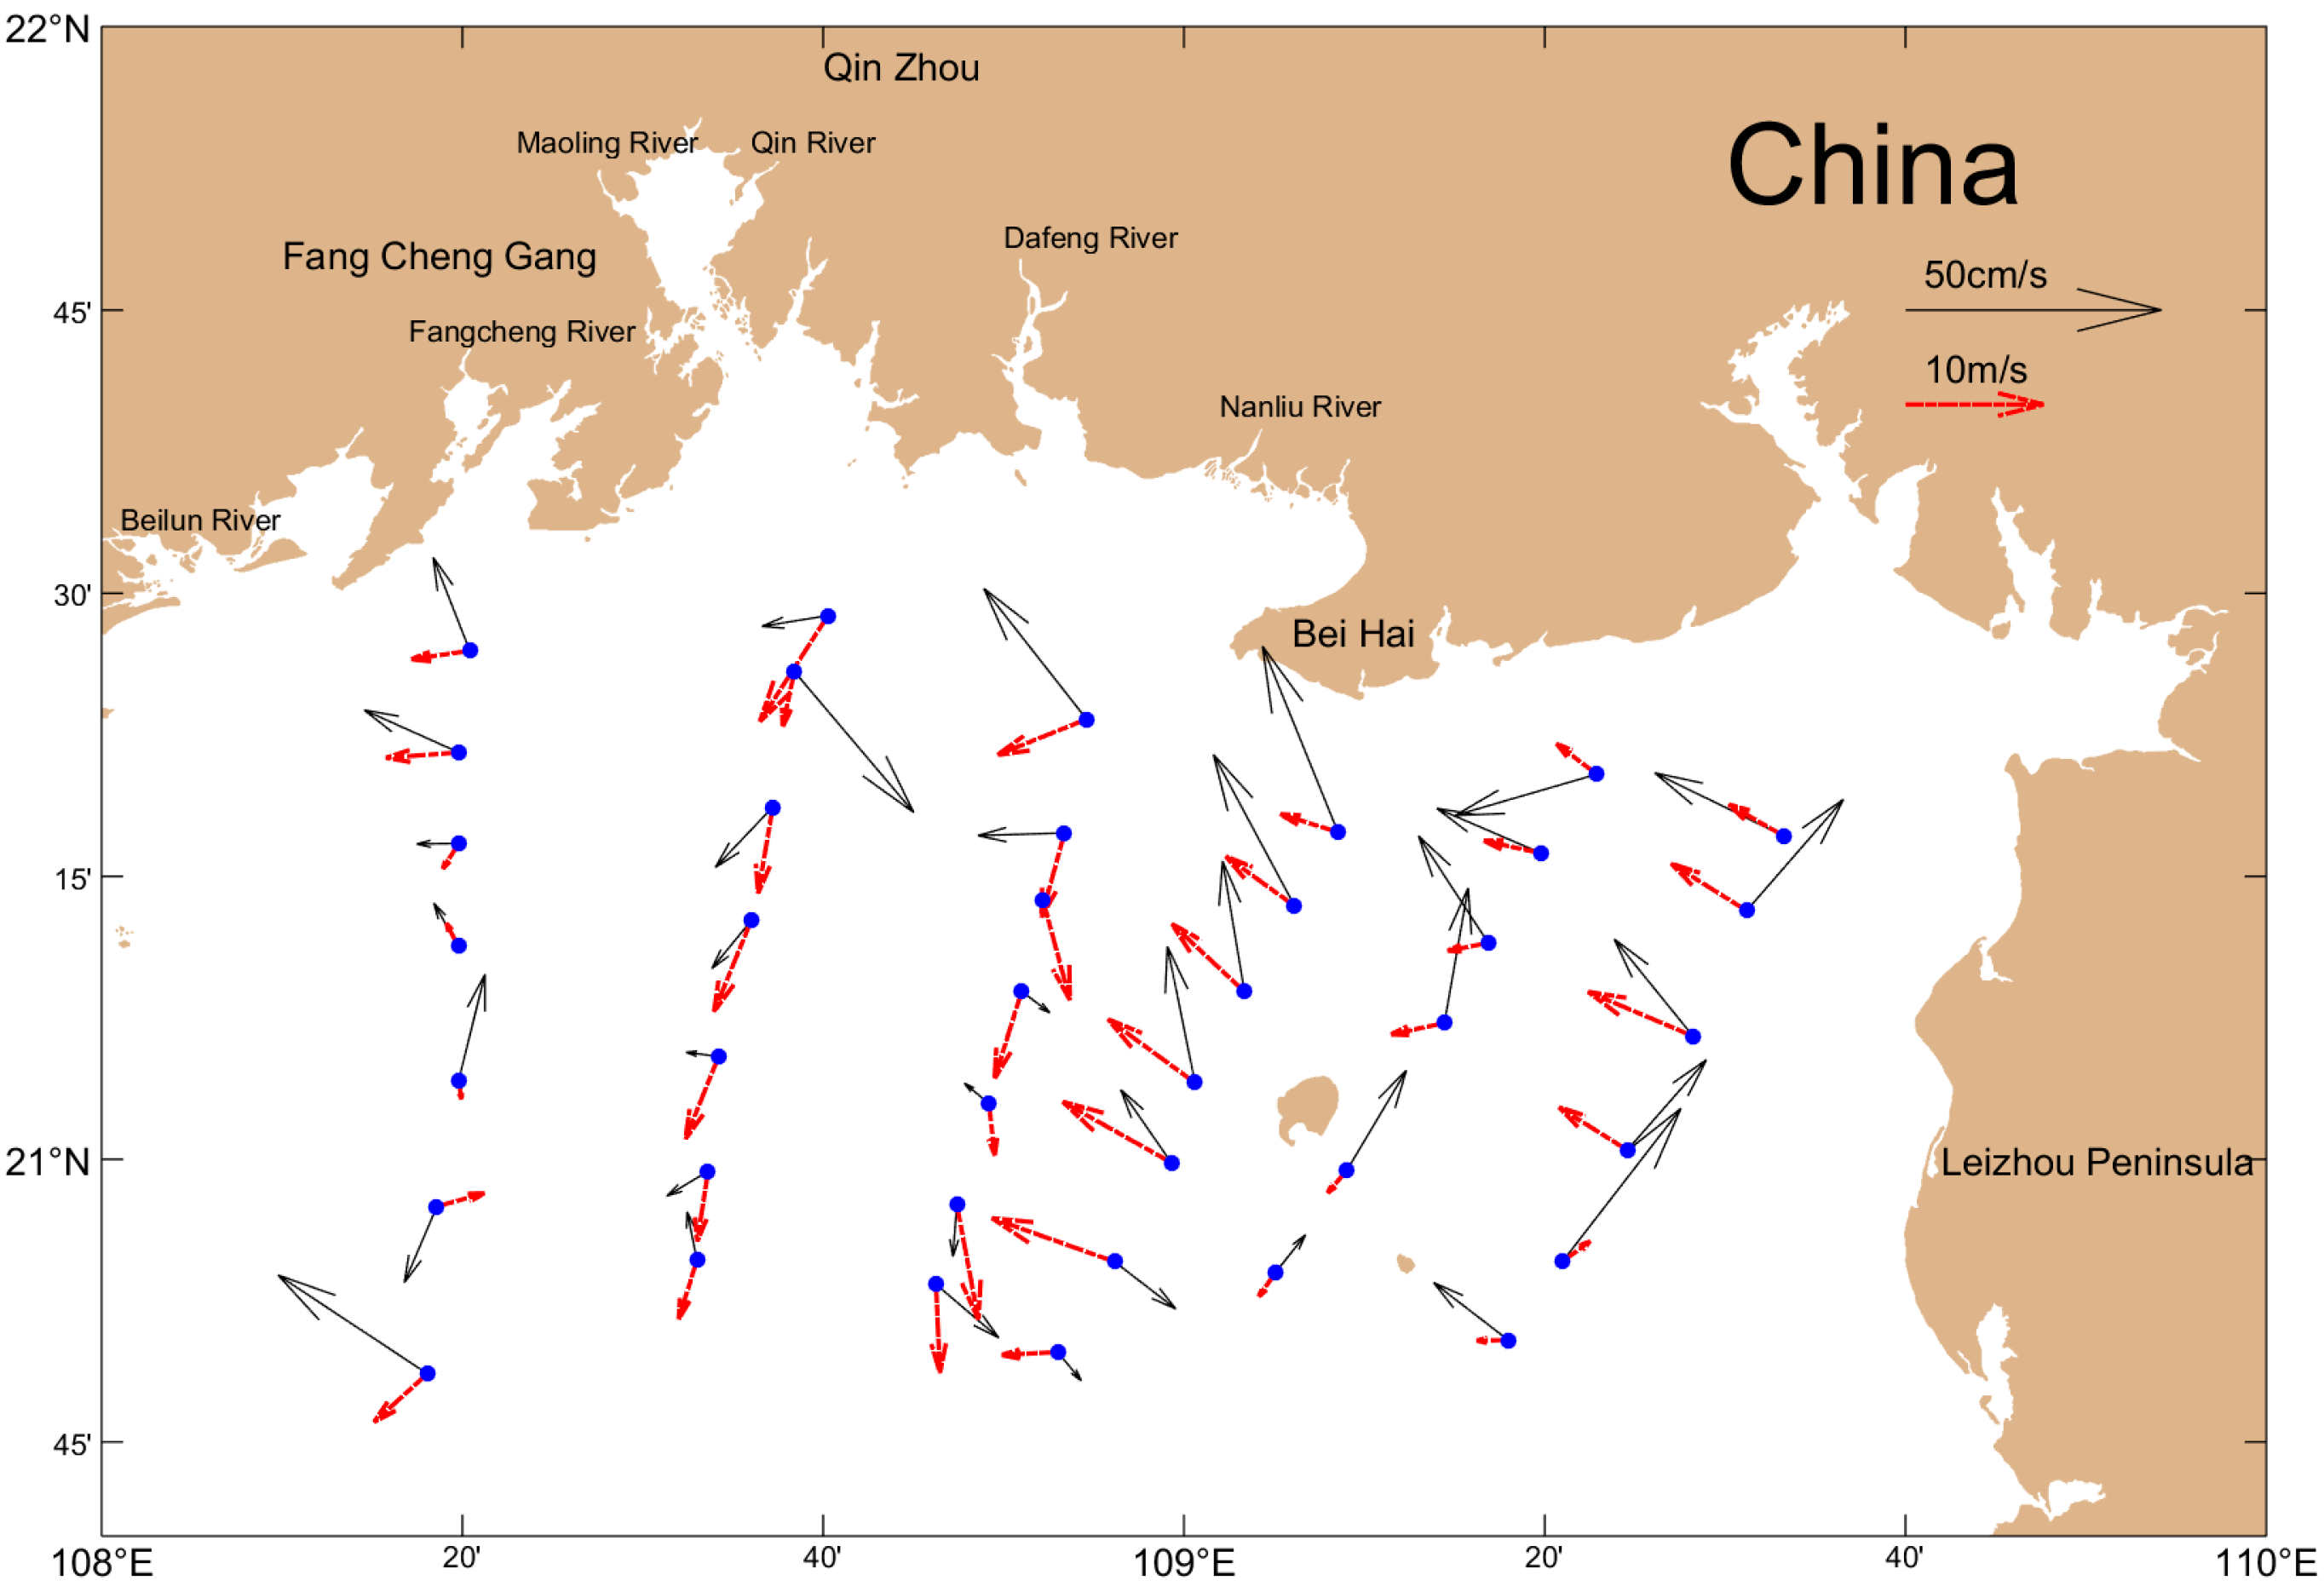
4.1.1. Influence of the Wind on the Diluted Water in Guangxi

The easterly and southeasterly winds drive the diluted water in Guangxi to the west coast. Under the blowing of the strong southwest wind, a strong northward coastal current is generated on the west coast of the Beibu Gulf, reaching the west of Qinzhou Bay in Guangxi. Under weak southwesterly winds, the surface layer of low-salinity water mainly flows southward along the west coast of the Beibu Gulf [47], and when the southerly wind affects the sea surface, it causes the diluted water to expand in the east and west directions. During summer, under the action of the southwesterly wind, the estuarine plume that forms in July spreads offshore to the central sea area in the northern part of the Beibu Gulf, and the low-salt water affects the western coast of Hainan Island, forming a tongue shape [3]. During the survey, the east coast (L4–L6 section) was mainly dominated by easterly and southeasterly winds, which hindered the eastward dispersion of diluted water. In Lianzhou Bay (L2–L3 section), the diluted water expanded to the sea due to the northerly wind. On the west coast (L1 section), under the action of the northerly wind, the diluted water expanded to the sea and to the west coast, thereby increasing the dispersion area of the diluted water. Therefore, the wind direction changed synchronously with the dispersion path of the diluted water. It can be concluded that the wind field is one of the decisive factors that control the dispersion path of the diluted water. During the survey, the average wind speed was 4.7 m/s, and the wind mixing effect was not enough to destroy the strong thermocline formed between the upper low-salt diluted water and the bottom high-salt water (Figure 6), resulting in the upper mixed layer gradually thinning out from the shore to the outer sea.

4.1.2. Influence of the Ocean Current on the Diluted Water in Guangxi

The Gulf of Tonkin is within the East Asian monsoon regime, with northeasterly (blowing from the northeast) wind from September to April and southwesterly wind during summer. The formation of the circulation in the Beibu Gulf is largely dominated by the south sea water, wind [48], diluted water [3], and tidal current [49] of the northern coastal rivers, which presents a complex situation and has changeable characteristics. The circulation in the northeast of the Beibu Gulf is affected by the local wind field and the Qiongzhou Strait current [3,50], and the coastal current moves mainly westward all year round [51]. According to the current vertical profile of May 2021, the monthly average residual current moves westward above a depth of 4 m and moves eastward below this depth. At 1 m, it travels at about 23 cm/s, and the flow direction is 301°. The average vertical monthly residual current is about 2.1 cm/s, and the flow direction is 247°, which implies that the residual flow moves westward (Figure 7). Therefore, the tidal current could restrict the diluted water from spreading eastward. The study area is dominated by the regular semidiurnal tide (Figure 8), and the ocean current decreases with depth.
The current distribution in the study area is relatively complex (Figure 3). The western Guangdong current flows through the Qiongzhou Strait into the Beibu Gulf [50], forming a cyclonic circulation in the south of the studied sea area. In addition, part of the current enters outside Tieshangang (L6–L5) and forms a westward flow in the coastal area under the influence of the easterly wind, which hinders the eastward expansion of the diluted water. Similarly, under the influence of easterly winds, the westward flow formed in the North Sea (L4) is not conducive to the eastward dispersion of the diluted water. The two sections (L3–L2) of Lianzhou Bay form southward and southwestward flow trends under the influence of northerly winds, and the freshwater diffuses westward and southward. On the west side of the survey area, the westward flow along the coast expanded westward due to the action of the easterly wind and Coriolis force. It can be seen that ocean current is also one of the decisive factors that control the dispersion path of freshwater.

4.2. Response of Environmental Factors to Diluted Water

The Beibu Gulf is a semi-closed bay and is greatly influenced by land sources. Guangxi runoff carries a large amount of sediment, particulate organic matter, and rich nutrients into the estuary [52], forming estuarine water with the estuary. Salt is extremely abundant, the concentration of suspended solids is high, phytoplankton growth is limited by light, and the concentration of chlorophyll a is low. The runoff of rivers flowing into the Beibu Gulf from Guangxi affects the salinity of the water body through diluted water, affects the photosynthesis of phytoplankton through the change in the stratification of the water body, the gravity circulation, and the position of the maximum turbidity zone, and also leads to changes in the flux of nutrients into the sea. Specifically speaking, runoff intensity controls the distribution of salinity outside the estuary, which, in turn, controls the distribution range and biomass of phytoplankton. On the one hand, runoff drives the transfer of phytoplankton biomass to the sea outside the estuary. On the other hand, the runoff brings an overload of suspended matter to the estuary sea area, which significantly reduces the thickness and depth of the euphotic layer, severely limiting the photosynthesis of phytoplankton. Outside the estuary, salinity and suspended matter change drastically, forming a front characterized by salinity and suspended matter. At the edge of the front, the light is suitable, and the abundant terrigenous nutrients carried by the runoff promote the rapid growth and reproduction of phytoplankton, forming phytoplankton blooms; thus, the concentration of chlorophyll a and dissolved oxygen is very high. This phenomenon also occurs in the Pearl River Estuary [53]. Therefore, the diluted water produced by runoff not only affects the distribution of physical fields such as salinity and the flow field in the sea area near the estuary but also brings about a number of rich nutrients, which leads to a generally high level of primary productivity in the sea area near the estuary. Additionally, it may have important impacts on the entire food web and ecosystem.
When the Guangxi coast entered the spring monsoon, it had just experienced a winter with strong water mixing. As the net heat flux into the seawater gradually increased, the upper seawater was continuously heated, but the temperature of the lower seawater remained at a low level, and the temperature difference between the surface and bottom of the seawater body reached more than 4 °C, which is conducive to enhancing the stratification of seawater. In addition, in the sea area affected by diluted water, the change in seawater density was controlled by the change in salinity. With the increase in runoff, the salinity of the diluted water decreased, and the density of the surface seawater was significantly lower than that of the middle and lower layers of seawater, forming strong water stratification and hindering the upper layer. An abundance weakens the seawater stratification. Therefore, the dissolved oxygen difference between the surface and bottom layers of the Guangxi Inlet Estuary and its adjacent waters is small. However, in the nearshore region where the thermocline appears, the difference in the dissolved oxygen between the surface and bottom layer is larger (Figure 9), which indicates that the vertical mixing intensity determines the vertical dispersion flux of the dissolved oxygen [54].

5. Conclusions

During the spring monsoon transition period, a 4 psu–27 psu core region of diluted water was formed in the coastal area of Guangxi and expanded southward to 21° N, where the depth of the diluted water could reach 20 m. The distribution of suspended solids, chlorophyll a, dissolved oxygen, and active silicon was similar to the dispersion range of the diluted water. The wind field and the ocean current are the primary factors that influence the dispersion pattern of the diluted water. Under the mixing caused by the wind and tide in the estuary area, the difference in the dissolved oxygen between the surface and bottom layer is small, whereas, in the nearshore area, the stratification of seawater hinders the downward transfer of dissolved oxygen, resulting in a large difference in dissolved oxygen between the surface and the bottom layer. Studies on the mechanism of diluted water in Guangxi, which is associated with river discharge, winds, shelf circulations, and tidal mixing, need to be carried out in the future.

Author Contributions

Author contributions: conceptualization, Y.Y. and T.Y.; methodology, Y.Y., T.Y., L.Z. and Z.Z. (Zhen Zhang); software, Y.Y., T.Y. and D.C.; validation, Z.Z. (Zhen Zhang) and T.Y.; formal analysis, Y.Y., Z.Z. (Zhen Zhang), T.Y., Z.Z. (Zuhao Zhu) and L.Z.; investigation, T.Y.; resources, Y.Y., Z.Z. (Zhen Zhang), L.Z., D.C. and T.Y.; data curation, Y.Y., T.Y. and Z.Z. (Zuhao Zhu); writing—original draft preparation, Y.Y.; writing—review and editing, T.Y., Z.Z. (Zuhao Zhu) and L.Z.; visualization, T.Y., Z.Z. (Zhen Zhang) and L.Z.; supervision, Z.Z. (Zuhao Zhu) and L.Z.; project administration, Y.Y.; funding acquisition, Y.Y. All authors have read and agreed to the published version of the manuscript.

Funding

This work is supported by the Science and Technology Planning Projects of Beihai, Guang Xi, China (No. 202082042, 201995076, 202082032).

Institutional Review Board Statement

Not applicable.

Informed Consent Statement

Not applicable.

Data Availability Statement

New data were created and analyzed in this study. Data sharing is not applicable to this article.

Conflicts of Interest

The authors declare that they have no known competing financial interest or personal relationship that could have appeared to influence the work reported in this paper.

References

  1. Beardsley, R.C.; Limeburner, R.; Yu, H.; Cannon, G. Discharge of the Changjiang (Yangtze River) into the East China Sea. Cont. Shelf Res. 1985, 4, 57–76. [Google Scholar] [CrossRef]
  2. Jiang, S.; Jin, J.; Zhang, G.Y. Nitrate in the Changjiang Diluted Water: An isotopic evaluation on sources and reaction pathways. J. Oceanol. Limnol. 2021, 39, 830–845. [Google Scholar] [CrossRef]
  3. Gao, J.S.; Xue, H.J.; Chai, F. Modeling the circulation in the Gulf of Tonkin, South China Sea. Ocean Dyn. 2013, 63, 979–993. [Google Scholar] [CrossRef]
  4. Gao, J.S.; Shi, M.C.; Chen, B. Responses of the circulation and water mass in the Beibu Gulf to the seasonal forcing regimes. Acta Oceanol. Sin. 2014, 33, 1–11. [Google Scholar] [CrossRef]
  5. Gao, J.S.; Chen, B.; Shi, M.C. Summer circulation structure and formation mechanism in the Beibu Gulf. Sci. China Earth Sci. 2015, 58, 286–299. [Google Scholar] [CrossRef]
  6. Chen, Z.H.; Qiao, F.L.; Xia, C.S. The numerical investigation of seasonal variation of the cold water mass in the Beibu Gulf and its mechanisms. Acta Oceanol. Sin. 2015, 34, 44–54. [Google Scholar] [CrossRef]
  7. Hu, J.Y.; Kawamura, H.; Tang, D.L. Tidal front around the Hainan Island, northwest of the South China Sea. J. Geophys. Res. Ocean. 2003, 108, 3342. [Google Scholar] [CrossRef]
  8. Lü, X.G.; Qiao, F.L.; Wang, G.S. Upwelling off the west coast of Hainan Island in summer: Its detection and mechanisms. Geophys. Res. Lett. 2008, 35, L02604. [Google Scholar] [CrossRef]
  9. Hyung, R.J.; Hee, J.I. Bedform dynamics and sand transport pathways in the Garolim Bay tidal flat, west coast of Korea. Geosci. J. 2008, 12, 299–308. [Google Scholar]
  10. Xiao, S.B.; Li, A.C.; Liu, J.P.; Chen, M.; Xie, Q.; Jiang, F.; Li, T.; Xiang, R.; Chen, Z. Coherence between solar activity and the East Asian winter monsoon variability in the past 8000 years from Yangtze River-derived mud in the East China Sea. Palaeogeogr. Palaeoclimatol. Palaeoecol. 2006, 237, 293–304. [Google Scholar] [CrossRef]
  11. John, W.; Day, J.; Charles, A.S.; Hall, W. Estuarine Ecology; Wiley Interscience: New York, NY, USA, 1989. [Google Scholar]
  12. Meng, F.; Wang, Z.; Cheng, F. The assessment of environmental pollution along the coast of Beibu Gulf, northern South China Sea: An integrated biomarker approach in the clam Meretrix meretrix. Mar. Environ. Res. 2013, 85, 64–75. [Google Scholar] [CrossRef]
  13. Song, S.Q.; Li, Z.; Li, C.W. The response of spring phytoplankton assemblage to diluted water and upwelling in the eutrophic Changjiang (Yangtze River) Estuary. Acta Oceanol. Sin. 2017, 36, 101–110. [Google Scholar] [CrossRef]
  14. Liu, Z.; Yu, J.; Zhang, D. Study on low-carbon building ecological city construction in harmonious Beibu Gulf culture. Procedia Environ. Sci. 2011, 10, 1881–1886. [Google Scholar]
  15. Chen, C.; Lai, Z.; Beardsley, R.C.; Xu, Q.; Lin, H.; Viet, N.T. Current separation and upwelling over the southeast shelf of Vietnam in the South China Sea. J. Geophys. Res. Ocean. 2012, 117, C03033. [Google Scholar] [CrossRef]
  16. Peperzak, L.; Colijn, F.; Koeman, R.; Gieskes, W.W.C.; Joordens, J.C.A. Phytoplankton sinking rates in the Rhine region of freshwater influence. J. Plankton Res. 2003, 25, 365–383. [Google Scholar] [CrossRef]
  17. Justic, D.; Rabalais, N.N.; Turner, R.E. Changes in nutrient structure of river-dominated coastal waters: Stoichiometric nutrient balance and its consequences. Estuarine. Coast. Shelf Sci. 1995, 40, 339–356. [Google Scholar] [CrossRef]
  18. Dai, M.H.; Zhai, W.D.; Cai, W. Effects of an estuarine plume-associated bloom on the carbonate system in the lower reaches of the Pearl River Estuary and the coastal zone of the northern South China Sea. Cont. Shelf Res. 2008, 28, 1416–1423. [Google Scholar] [CrossRef]
  19. Zhou, M.J.; Shen, Z.L.; Yu, R.C. Responses of a coastal phytoplankton community to increased nutrient input from the Changjiang (Yangtze) River. Cont. Shelf Res. 2008, 28, 1483–1489. [Google Scholar] [CrossRef]
  20. Bauer, A.; Waniek, J.J. Factors affecting chlorophyll a concentration in the central Beibu Gulf, South China Sea. Mar. Ecol. Prog. Ser. 2013, 474, 67–88. [Google Scholar] [CrossRef]
  21. David, K.; Daniela, U.; Qiu, G.L. Particulate organic matter dynamics in coastal systems of the northern Beibu Gulf. Cont. Shelf Res. 2014, 82, 99–118. [Google Scholar]
  22. Orozco, D.A.; Daessle, L.W.; Camacho-Ibar, V.F. Turnover and release of P-, N-, Si-nutrients in the Mexicali Valley (Mexico): Interactions between the lower Colorado River and adjacent ground and surface water systems. Sci. Total Environ. 2015, 512, 185–193. [Google Scholar] [CrossRef] [PubMed]
  23. Placenti, F.; Schroeder, K.; Bonanno, A. Water masses and nutrient distribution in the Gulf of Syrte and between Sicily and Libya. J. Mar. Syst. 2013, 121, 36–46. [Google Scholar] [CrossRef]
  24. Pelland, N.A.; Sterling, J.T.; Lea, M.A. Fortuitous Encounters between Sea gliders and Adult Female Northern Fur Seals (Callorhinus ursinus) off the Washington (USA) Coast: Upper Ocean Variability and Links to Top Predator Behavior. PLoS ONE 2014, 9, e101268. [Google Scholar] [CrossRef]
  25. Zhu, Z.Y.; Wu, Y.; Zhang, J.; Du, J.-Z.; Zhang, G.-S. Reconstruction of anthropogenic eutrophication in the region off the Changjiang Estuary and central Yellow Sea: From decades to centuries. Cont. Shelf Res. 2014, 72, 152–162. [Google Scholar] [CrossRef]
  26. He, H.; Kang, Y.H.; Liu, Z.W. Nitrogen inputs enhance phytoplankton growth during sediment resuspension events: A mesocosm study. Hydrobiologia 2015, 744, 297–305. [Google Scholar] [CrossRef]
  27. Dong, L.X.; Su, J.L.; Wong, L.A. Seasonal variation and dynamics of the Pearl River plume. Cont. Shelf Res. 2004, 24, 1761–1777. [Google Scholar] [CrossRef]
  28. Garvine, R.W. The impact of model configuration in studies of buoyant coastal discharges. J. Mar. Res. 2001, 59, 193–225. [Google Scholar] [CrossRef]
  29. Cao, Z.Y.; Bao, M.; Guan, W.B.; Chen, Q. Water-mass evolution and the seasonal change in northeast of the beibu gulf. Oceanol. Limnol. Sin. 2019, 50, 533–541. [Google Scholar]
  30. Wong, L.A.; Chen, J.C.; Dong, L.X. A model of the plume front of the Pearl River Estuary, China and adjacent coastal waters in the winter dry season. Cont. Shelf Res. 2004, 24, 1779–1795. [Google Scholar] [CrossRef]
  31. Ou, S.Y.; Zhang, H.; Wang, D.X. Horizontal characteristics of buoyant plume off the Pearl River Estuary during summer. J. Coast. Res. 2007, 50, 652–657. [Google Scholar]
  32. Ou, S.Y.; Zhang, H.; Wang, D.X. Dynamics of the buoyan plume off the Pearl River Estuary in summer. Environ. Fluid Mech. 2009, 9, 471–492. [Google Scholar] [CrossRef]
  33. Wong, L.A.; Chen, J.C.; Xue, H.L.; Dong, X.; Su, J.L.; Heinke, G. A model study of the circulation for the Pearl River Estuary (PRE) and its adjacent coastal waters. 2, Sensitivity Analysis. J. Geophys. Res. Ocean. 2003, 108, 3157. [Google Scholar] [CrossRef]
  34. Luo, L.; Zhou, W.D.; Wang, D.X. Responses of the river plume to the external forcing in Pearl River Estuary. Aquat. Ecosyst. Health Manag. 2012, 15, 62–69. [Google Scholar] [CrossRef]
  35. Liu, Z.Y.; Zhang, W.J.; Xiong, X.J. Observational characteristics and dynamic mechanism of low-salinity water lens for the offshore detachment of the Changjiang River diluted water in August 2006. Acta Oceanol. Sin. 2021, 40, 34–45. [Google Scholar] [CrossRef]
  36. Xuan, J.L.; Huang, D.J.; Zhou, F. The role of wind on the detachment of low salinity water in the Changjiang Estuary in summer. J. Geophys. Res. Ocean. 2012, 117, C10004. [Google Scholar] [CrossRef]
  37. Moon, J.H.; Hirose, N.; Yoon, J.H. Offshore detachment process of the low-salinity water around Changjiang bank in the east China sea. J. Phys. Oceanogr. 2010, 40, 1035–1053. [Google Scholar] [CrossRef]
  38. Zhu, J.R.; Wang, J.H.; Shen, H.T. Observation and analysis of the diluted water and red tide in the sea off the Changjiang River mouth in middle and late June 2003. Chin. Sci. Bull. 2005, 50, 240–247. [Google Scholar] [CrossRef]
  39. Wu, H.; Zhu, J.R.; Shen, J.; Wang, H. Tidal modulation on the Changjiang River plume in summer. J. Geophys. Res. 2011, 116, C08017. [Google Scholar] [CrossRef]
  40. Hou, W.; Ba, M.; Bai, J.; Yu, J. Numerical Study on the Expansion and Variation of Changjiang Diluted Water in Summer and Autumn. J. Mar. Sci. Eng. 2021, 9, 317. [Google Scholar] [CrossRef]
  41. Chen, C.; Xue, P.; Ding, P.; Beardsley, R.C.; Xu, Q.; Mao, X.; Gao, G.; Qi, J.; Li, C.; Lin, H. Physical mechanisms for the offshore detachment of the Changjiang Diluted Water in the East China Sea. J. Geophys. Res. 2008, 113, 1–17. [Google Scholar] [CrossRef]
  42. Zhao, Y.X.; Wang, Z.Y. The monthly changes and its influencing factors of the Changjiang Diluted Water off the estuary in spring. Mar. Sci. 2021, 45, 81–92. [Google Scholar]
  43. Ding, Y.; Chen, C.S.; Beardsley, R.C. Observational and model studies of the circulation in the Gulf of Tonkin, South China Sea. J. Geophys. Res. Ocean. 2013, 118, 6495–6510. [Google Scholar] [CrossRef]
  44. Yang, J.; Jiang, S.; Wu, J.; Xie, L.; Zhang, S.; Bai, P. Effects of wave-current interaction on the waves, cold-water mass and transport of diluted water in the Beibu Gulf. Acta Oceanol. Sin. 2020, 39, 25–40. [Google Scholar] [CrossRef]
  45. Zhang, W.J.; Zhu, S.X.; Li, X.Q. Numerical simulation and dynamical analysis for low salinity water lens in the expansion area of the Changjiang diluted water. China Ocean Eng. 2014, 28, 777–790. [Google Scholar] [CrossRef]
  46. Chen, C.; Zheng, L.Y.; Blanton, J.O. Physical processes controlling the formation, evolution, and perturbation of the low-salinity front in the inner shelf off the southeastern United States: A modeling study. J. Geophys. Res. Ocean. 1999, 104, 1259–1288. [Google Scholar] [CrossRef]
  47. Shi, M.C.; Chen, B.; Ding, Y.; Wu, L.Y.; Zheng, B.X. Wind Effects on Spread of Runoffs in Beibu Bay. Guangxi Sci. 2016, 23, 485–491. [Google Scholar]
  48. Xia, H.Y.; Li, S.H.; Shi, M.C. Three-D numerical simulation of wind-driven current and density current in the Beibu Gulf. Acta Oceanol. Sin. 2001, 20, 455–472. [Google Scholar]
  49. Sun, H.L.; Huang, W.M. Three-dimensional numerical simulation for tide and tidal current in the Beibu Gulf. Acta Oceanol. Sin. 2001, 20, 29–38. [Google Scholar]
  50. Shi, M.C.; Chen, C.S.; Xu, Q.C.; Lin, H.; Liu, G.; Wang, H.; Wang, H.; Yan, J. The role of the Qiongzhou Strait in the seasonal variation of the South China sea circulation. J. Phys. Oceanogr. 2002, 32, 103–121. [Google Scholar] [CrossRef]
  51. Chen, B.; Shi, M.C.; Qiu, S.F. Characteristics of residual currents and their influence on the material transportation in five main bays of guangxi coast. Trans. Oceanol. Limnol. 2003, 15, 13–21. [Google Scholar]
  52. Gan, J.P.; Lu, Z.M.; Dai, M.H.; Cheung, A.Y.; Liu, H.; Harrison, P. Biological Response to intensified upwelling and to a river plume in the northeastern South China Sea: A modeling study. J. Geophys. Res. 2010, 115, 1–19. [Google Scholar] [CrossRef]
  53. Kim, H.C.; Yamaguchi, H.; Yoo, S.; Zhu, J.; Okamura, K.; Kiyomoto, Y.; Ishizaka, J. Distribution of Changjiang diluted water detected by satellite chlorophyll-a and its interannual variation during 1998–2007. J. Oceanogr. 2009, 65, 129–135. [Google Scholar] [CrossRef]
  54. Simpson, J.H.; Sharples, J.; Rippeth, T.P. A prescriptive model of stratification induced by freshwater runoff. Estuar. Coast. Shelf Sci. 1991, 33, 23–35. [Google Scholar] [CrossRef]
Figure 1. Distribution map of survey stations. The black dotted line is the water depth, the cyan triangle is tide level station, and T1, T2, and T3 is the Beihai Station, Qinzhou Station, and Fangchenggang Station, respectively; The magenta square is the seabed base station; The purple circle is survey station.
Jmse 11 00387 g001
Figure 2. Surface distributions of salinity (a) and temperature (b) during our investigation period in May 2021.
Jmse 11 00387 g002
Figure 3. Distribution of currents (black arrows) and wind fields (red dashed arrows) during the sampling period in May 2021.
Jmse 11 00387 g003
Figure 4. Vertical distributions of temperature and salinity in section L1 (a,b) and section L4 (c,d), respectively, during investigation period in May 2021. The red dashed line is the thermocline depth (a,c); the red dotted line is the salinity 32 isoline (b,d).
Jmse 11 00387 g004
Figure 5. Surface distributions of suspended matter (a), dissolved oxygen (b), chlorophyll a (c), and active silicon (d) during our investigation period in May 2021.
Jmse 11 00387 g005
Figure 6. Distribution characteristics and changes in surface wind field during the sampling period in May 2021.
Jmse 11 00387 g006
Figure 7. The monthly average tidal residual current of the profile in May 2021.
Jmse 11 00387 g007
Figure 8. Time series of vertical currents.
Jmse 11 00387 g008
Figure 9. Dissolved oxygen difference between surface and bottom layer.
Jmse 11 00387 g009
Table 1. Mean sea level at Beihai, Qinzhou, and Fangchenggang stations (unit: cm, reference datum: 85).
StationLongitude (E)Latitude (N)Mean Tide Level (cm)
Beihai109°03′21°28′69
Qinzhou108°37′21°41′70
Fangchenggang108°20′21°36′71
Disclaimer/Publisher’s Note: The statements, opinions and data contained in all publications are solely those of the individual author(s) and contributor(s) and not of MDPI and/or the editor(s). MDPI and/or the editor(s) disclaim responsibility for any injury to people or property resulting from any ideas, methods, instructions or products referred to in the content.

