Article

Architectural Framework for Underwater IoT: Forecasting System for Analyzing Oceanographic Data and Observing the Environment

by
Abdul Razzaq
1,*,
Syed Agha Hassnain Mohsan
2,*,
Yanlong Li
2,3 and
Mohammed H. Alsharif
4
1
Ocean Technology and Engineering, Ocean College, Zhejiang University, Zheda Road 1, Zhoushan 316021, China
2
Optical Communications Laboratory, Ocean College, Zhejiang University, Zheda Road 1, Zhoushan 316021, China
3
Ministry of Education Key Laboratory of Cognitive Radio and Information Processing, Guilin University of Electronic Technology, Guilin 541004, China
4
Department of Electrical Engineering, College of Electronics and Information Engineering, Sejong University, Seoul 05006, Republic of Korea
*
Authors to whom correspondence should be addressed.
J. Mar. Sci. Eng. 2023, 11(2), 368; https://doi.org/10.3390/jmse11020368
Submission received: 11 December 2022 / Revised: 2 February 2023 / Accepted: 3 February 2023 / Published: 7 February 2023
(This article belongs to the Special Issue Underwater Wireless Communications and Sensor Networks Technology)

Abstract

:
With the passage of time, the exploitation of Internet of Things (IoT) sensors and devices has become more complicated. The Internet of Underwater Things (IoUT) is a subset of the IoT in which underwater sensors are used to continually collect data about ocean ecosystems. Predictive analytics can offer useful insights to the stakeholders associated with environmentalists, marine explorers, and oceanographers for decision-making and intelligence about the ocean, when applied to context-sensitive information, gathered from marine data. This study presents an architectural framework along with algorithms as a realistic solution to design and develop an IoUT system to excel in the data state of the practice. It also includes recommendations and forecasting for potential partners in the smart ocean, which assist in monitoring and environmental protection. A case study is implemented which addresses the solution’s usability and agility to efficiently exploit sensor data, executes the algorithms, and queries the output to assess performance. The number of trails is performed for data insights for the 60-day collection of sensor data. In the context of the smart ocean, the architectural design innovative ideas and viable approaches can be taken into consideration to develop and validate present and next-generation IoUTs and are simplified in this solution.

1. Introduction

Generally, water is divided into small seas and vast oceans, and the idea of the network is described as a set of devices exchanging useful information using different technologies such as Ethernet, wireless fidelity (WiFi), and Bluetooth. Likewise, the Internet is also defined as a network comprising networks. Such a kind of distributed network is closely associated with regulatory bodies and standardizations, along with providing a widely attainable ecosystem supporting services for multiple users. As a sub-ecosystem of the Internet, IoT has emerged to connect different devices to the World Wide Web. IoT is a challenging combination of heterogeneity and distribution. It is a platform with a combination of sensors that empowers the basic structure that composes heterogeneous things including services, systems, devices, and individuals in smart systems and settings. With the ongoing advanced developments, the IoT has been transferred into a newfangled network of objects including home appliances, smartphones, smart watches, or any objects incorporated with software, sensing devices, or actuators. Additionally, IoT has been lurching forward at a rate of 21% since 2016 [1]. IoT is composed of an increasing number of sensors, interconnected tools, and smart objects that are untraceable, fast, and non-intrusive [2]. IoT connects machines that permit users to communicate with each other and access data that can be processed online [3]. The main purpose of IoT objects is to generate real-time data that can be analyzed to obtain intended business outcomes [4,5].
IoT has also revolutionized underwater wireless sensor networks (UWSN) as IoUT. IoUT is referred to as an interconnected network of underwater devices with the capability to sense, process, and transmit data to distant base stations (BS). IoUT systems are generally used to measure specific chemical [6], biological or physical ocean parameters in order to provide both real-time and historical data. This gathered oceanic data can support researchers for future forecasting and phenomena and help policymakers to ratify strategic planning [7]. With IoUT, underwater observation, monitoring, and exploration have become more promising and efficient.
By operationalizing situations such as monitoring marine life, assessing underwater pollution, and studying the association between numerous parameters, such as the effects of temperature, pressure, salinity, total dissolved solids, pH, conductivity, turbidity, and acidity on water, IoUTs give significant insights [8]. Sensor resource scarcity, wireless network reliability, networked object performance, dynamic topology, energy consumption, mobility, lack of standardization, and harsh transmission medium, along with data privacy and security, are just a few of the concerns that might hamper the IoUT’s dependability and widespread adoption. A comprehensive study is provided by DR KM et al. [9] to assist industrial experts and academic researchers in further exploring the benefits, critical issues, and potential solutions for IoUT. IoUT needs to combine and apply technical knowledge and techniques from other IoT fields, such as smart homes, smart consumer electronics, communication technologies, intelligent transportation, healthcare, and so on [10]. Several research studies [11,12] have reported the potential of IoUT. IoUT has a wide range of applications including environmental protection, ocean observation, underwater communication, submarine tracking, oil spill detection, search and rescue, marine transportation, and tactical surveillance.
Smart IoT devices are shown in Figure 1. Utilizing IoT devices to distribute information will increase audience engagement and knowledge. Figure 1 aids in explaining the connection of the currently available IoT devices. The number of devices now linked to the Internet exceeds 50 billion, according to Cisco [13]. IoT devices are furnished with actuators and sensors that enable them to intelligently perceive and respond to their environment [10]. IoT device examples are shown in various ways in Figure 1. These devices have a finite amount of memory, a weak processing engine, and minimal computational capability due to their intrinsic resource limitations.
UWSN is regarded as the key enabler network for IoUT. Figure 2 presents the network architecture of UWSN, which is composed of main elements as sensors placed in shallow or deep water. It also contains sinks such as buoys, ships, ASVs, or AUVs [14]. UWSN supports various applications such as ecological monitoring, seismic prediction, marine species tracking, disaster prevention, and water quality monitoring [15,16,17]. The uncertainty and complexity of IoT systems are increasing day by day. IoT has several quality attributes associated with architecture, availability, scalability, security, functionality, and interoperability of IoT applications with software applications as IoT is based on a smart configuration of devices [18,19]. It is becoming more challenging to reuse IoT systems because of their complexity. Moreover, interoperability has also become difficult due to the development of new technologies, which is not the only factor. Interoperability also becomes more difficult and severely degrades performance if most of the services are linked without considering any appropriate architecture design-based requirements [20,21,22]. The Internet of Things requires a proper framework to enhance interoperability among various resources and systems [23].
For defining an appropriate framework to assist the system engineering of IoT services and constraints of sensor-driven devices, several studies have focused on scalable application designs, IoT-intensive digital software, IoT ecosystem, and model-driven engineering perspectives. Methods for underwater data mining and analytics have been introduced in recent research initiatives such as [24]. In both oceanic data predictive analytics, however, there is no existing solution that allows human decision-based customization and tool-based automation. The need for architecture in business has become of paramount importance, with the rapidly growing number of action plans, strategies, and activities directed towards institutionalized structures. The growing IoT software applications have driven both researchers’ and practitioners’ interest in the business. However, designing a new business intelligence (BI) framework for IoT is a complex task. It ensures satisfying the requirements of decision-makers by taking various constraints into account. These operations plan to empower the interoperability of ubiquitous network technologies, streamline advancement, and simplify execution to achieve scalability, ultra-reliability, and low latency in IoT networks [25]. Software architecture design is the basic artifact, enabling predictive, straightforward, scalable development of advanced software systems [26]. On the Internet of Things, features and applications must be put together from a set of independent and small services. In recent years, software architecture styles have received a lot of attention as mitigative solutions with the development and operationalization of software IoT systems [27].
As shown in Figure 3, the solution overview of the architectural framework for IoUTs and the use of architecting style for IoUT system development as a distinct genre of IoT can be presented [28,29]. The architectural framework is one of the main objectives of this study: to provide a solution and a set of guidelines to support IoUT practitioners and researchers in developing promising next-generation (software-intensive) IoT features from the perspective of smart ocean systems.

1.1. Research Contribution

As a result of the fact that the proposed solution employs ocean IoT, an emerging class of IoT systems that connects intelligent infrastructures and systems to ocean predictive analytics, the proposed solution is considered innovative. The state of the art in ocean IoT is being advanced, with a focus on fusing the idea of ocean IoT with methodologies and procedures for data analysis for smart ocean technology. The experimental work in this thesis sheds additional light on environmental science’s technological requirements, particularly the enabling framework required to support scientific discovery.
  • The proposed framework, which combines a multi-tier architectural style with features that highlight the system’s role in developing the ocean forecasting system with the concept of sensor correlation, is intended for researchers and other stakeholders in various communities who may be interested in understanding solutions in terms of ocean forecasting.
  • We used case studies to verify the solution’s effectiveness in a variety of aspects, including sensor throughput, algorithmic execution, and query response.

1.2. Organization

The remainder of this article is structured as follows: Section 2 presents background information and previous work. Section 3 illustrates the research methodology and materials. Section 4 presents the results and analysis. Finally, we conclude the paper in Section 5.

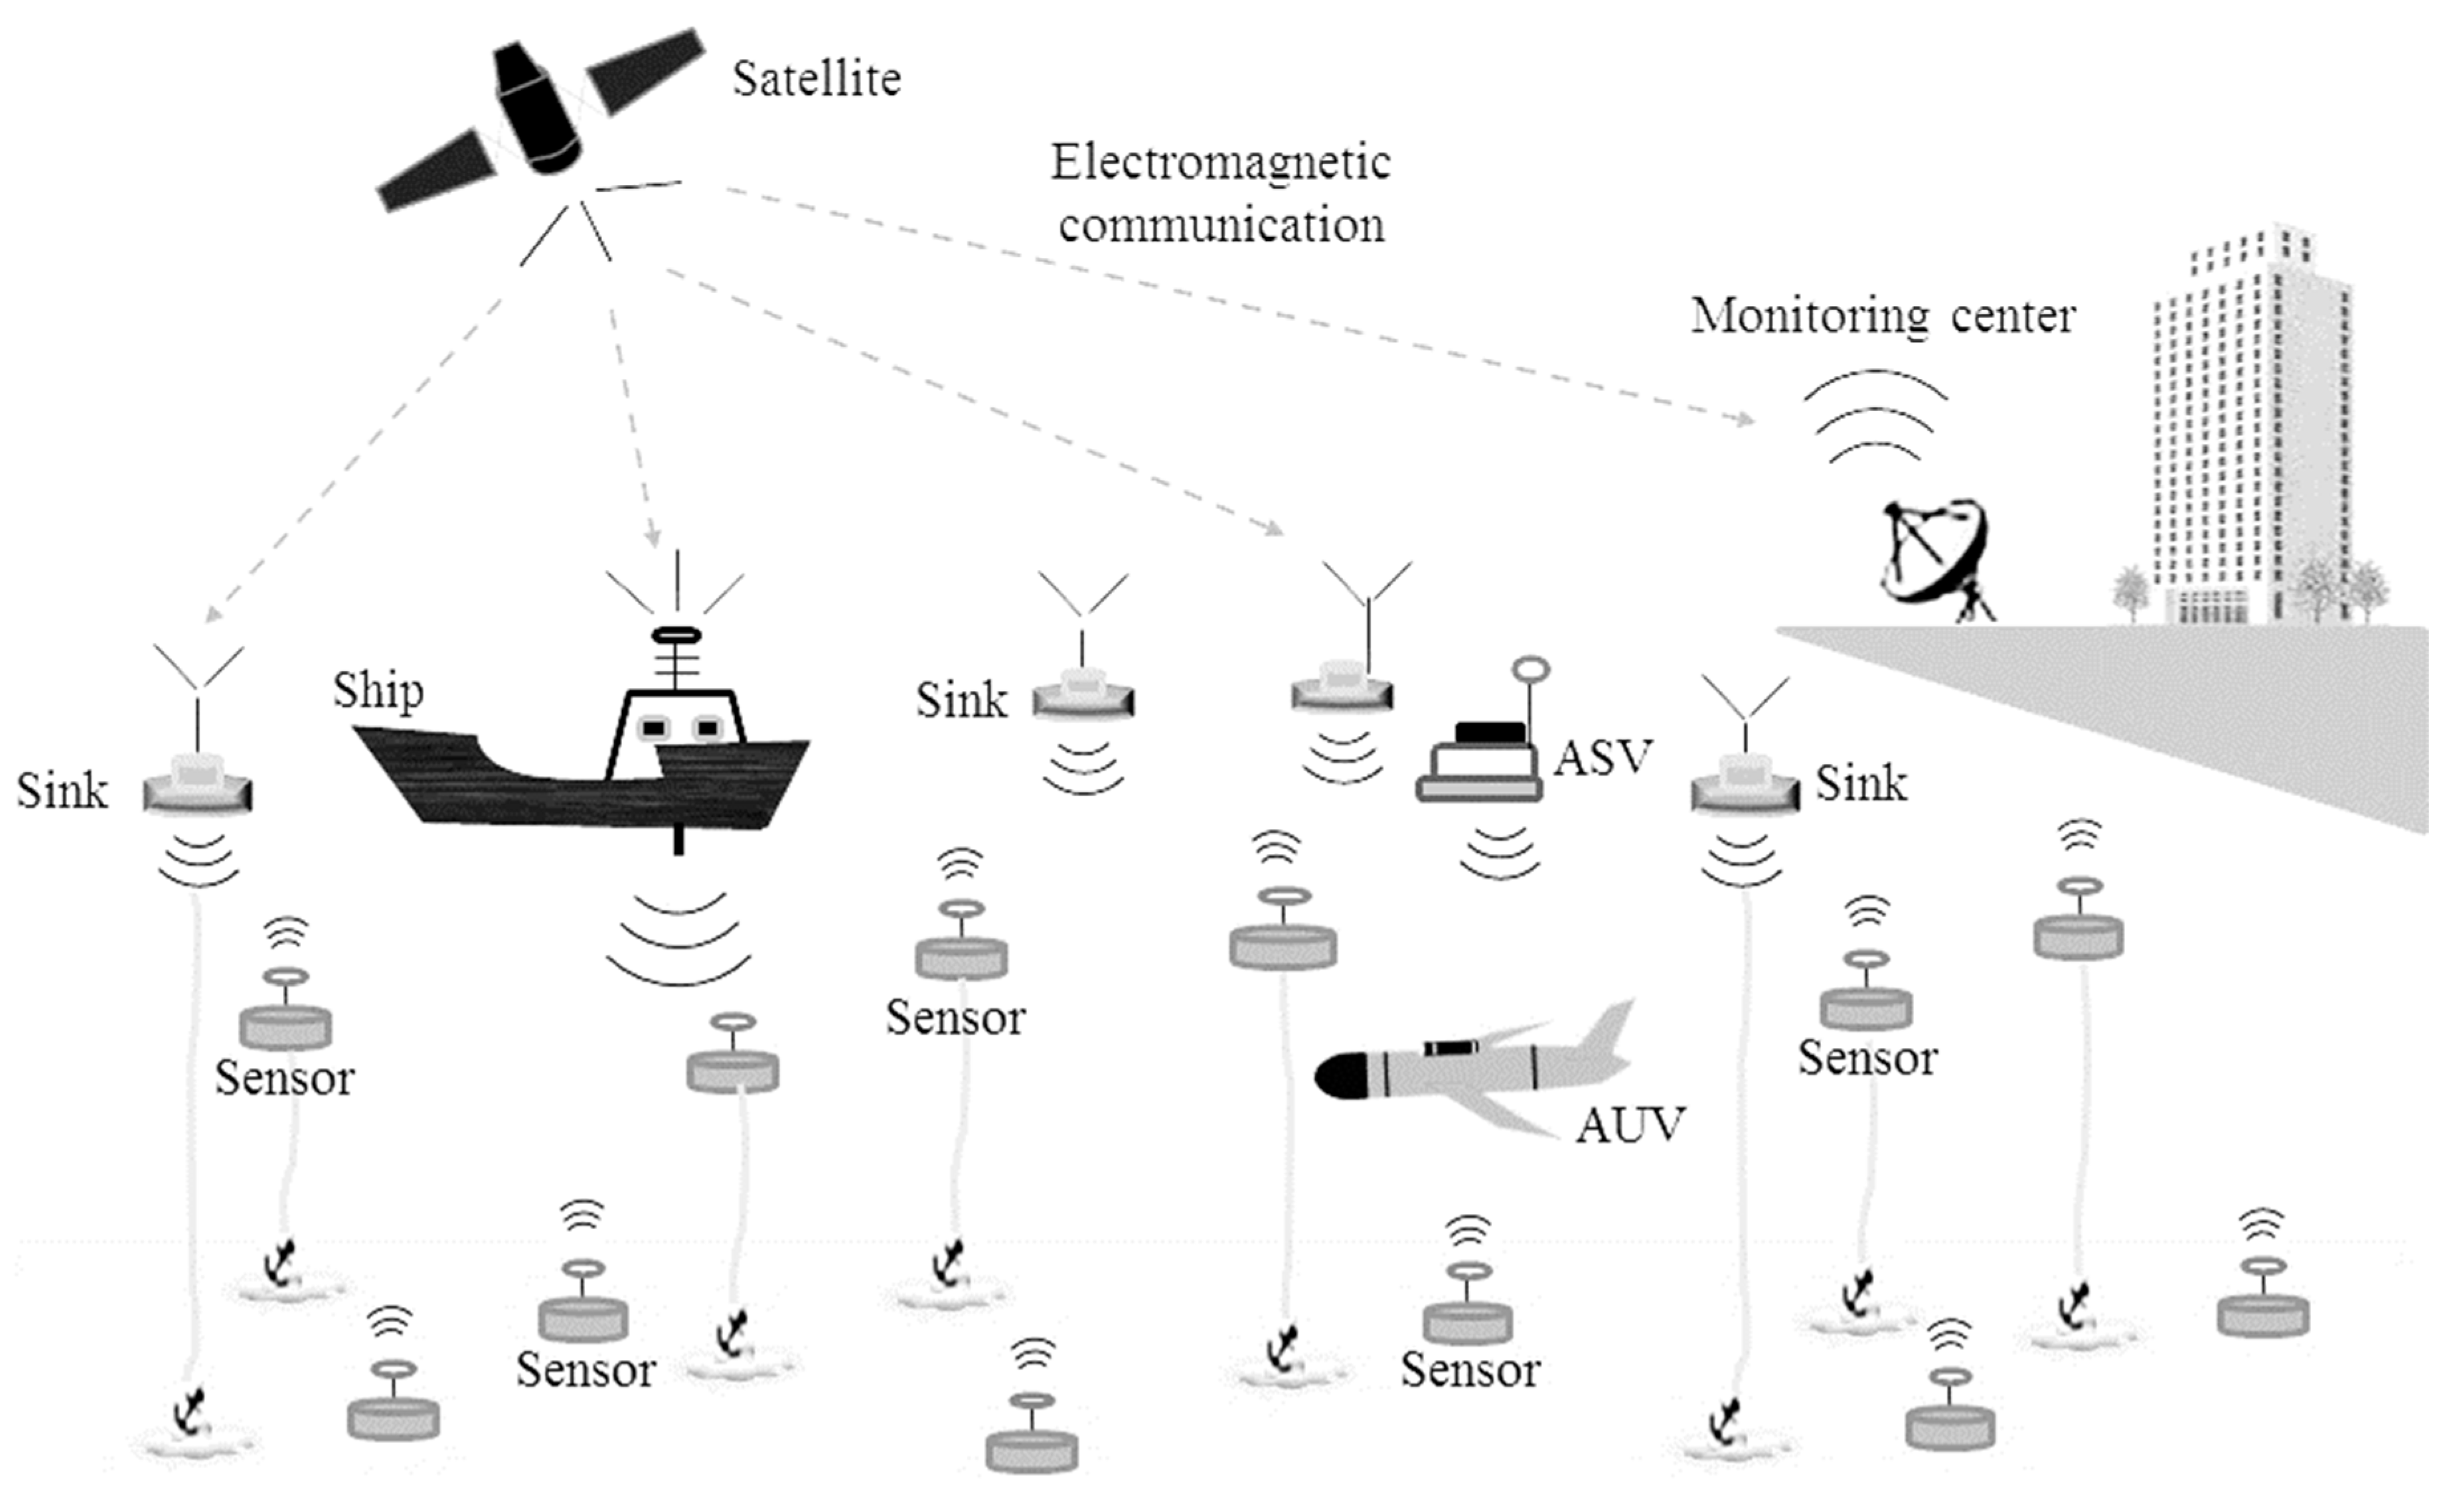
2. Background and Previous Work

This section provides background information to contextualize the components of IoUT systems and sheds some light on software architectural styles for IoUT development. First, we comprehensively discuss the background of different types of data mining methods in the oceanic environment and other scenarios. Later, we discuss the available research contributions related to oceanic data mining methods in the terms of IoT. Brief detail about different types of data mining methods and their research state of the art empowers us to validate the scope and feasibility of the proposed framework. The terminologies and concepts that are utilized are used in this section.

2.1. Background

IoT is an advanced network of entities such as devices, software, sensors, actuators, and networking embedded with physical objects (e.g., cars, home appliances, and other products) that enable them to communicate and share data. It provides the potential for more extensive incorporation of the real world into computer-aided systems, resulting in significant improvements in productivity, economic gains, and reduced human activities [30]. The IoT computer functions as an entity involved in a data collection process; these data are also used to maintain smooth operations, proactive monitoring, and data-driven choices aimed at improving and optimizing a business strategic plan.
IoT technologies are now installed. Intelligent use of IoT devices can enable the processing and review of near real-time data that will contribute to effective and more efficient decision-making capabilities powered by evidence [31]. The intelligent transportation we use, the communities we live in, the way we shop, the eHealth system we are developing, how we take care of ourselves, etc., are finding their way into every facet of our daily lives. High-speed data streams that are challenging to tackle, interpret, store, and protect, produce an extensive amount of data. IoT sensors and software gather plenty of useful insights. IoT data are often extremely perishable, and corporations lack potential without the appropriate resources to operate with the most efficient time-sensitive insights. Big data of IoT is an integral dimension of time; thus, it should be handled in real-time or, in fact, in a limited period of time, because there will be no use resulting from processing beyond a specific date [32].
The design components of IoUTs are depicted in Figure 4. The first layer of ‘Data Collection’ performs operations for data collection from deployed sensors. A Scientific Instrument Interface Module (SIIM), which can be a wired or wireless medium, connects the backend server to the computer. Each sensor collects a specific type of oceanographic data, adds the sensor’s name and exact location, and delivers it to the bridge. The bridge receives data from all these sensors and operates as a link between the sensors that collect data and the server that keeps a record of it. Oceanic data can comprise a wide range of information, such as pollution types and levels, sunshine, temperature, pressure, dissolved oxygen, pH value, conductivity, salinity, turbidity, and water acidity. The data are delivered to the IoT server, which then delivers them to the ‘Data Processing’ layer, which is the fundamental layer for carrying out analytic operations and storing data in a database. These methods might be performed earlier and posted for data storage management. Offshore processing is also integrated to execute the necessary analytics in terms of computing the connections between various forms of oceanic data, such as the impacts of water temperature and the impact of dissolved biological and chemical pollution and acidity on the underwater web of life. The ‘User Interface Layer’, the final third layer, presents data to the end-user, who might be any stakeholder. The potential findings of analytics are communicated to the end-users to carry out immediate actions and human decision support in the context of smart oceans.

2.2. Related Work

Through processing IoT data using current business software and third-party data sets, major IoT data analytics offer companies and other operating bodies the opportunity to derive value from IoT sensors and applications to put more contextual knowledge into this domain. It is then necessary to implement the data to develop gadgets with smart features and services with high speed, low latency, high accuracy, and interactions with efficient planning. Organizations must, however, ensure that they have the technology in place to facilitate real-time data analysis on a scale to achieve maximum benefit from their investments [33,34,35]. For instance, the Consumer Electronics Show (CES) is held on a yearly basis for investors who are highly inclined toward consumer electronics. In a previous session of the CES, various smart marine devices, e.g., autonomous cameras, sub blue scooters, and remotely controlled drones that significantly assist in real-time ocean observation [36] were presented as shown in Figure 5. These smart devices offer different underwater applications: for instance, the Navatics Mito is a 4K camera empowering 1080p streaming capability to effectively store and stream in marine services [37]. Furthermore, Robosea’s Biki is an underwater drone offering marine surveillance, discovery, and the photographer-shark is another promising technology that can dive up to 300 m. Similarly, divers are using Sub blue scooters for underwater exploration [38].
To effectively enhance sound recognition efficiency, marine organizations are increasingly looking for innovative solutions using machine learning systems. Nowadays, most uses of deep learning are described in [39], which makes it possible to model dynamic data interactions by leveraging several layers of information processing. It focuses on mitigating problems in extraction, transformation, classification, and pattern analysis of functionality [40].
These rapid advancements and deployments of marine technologies to monitor and explore the underwater environment generate an extensive amount of data or big marine data (BMD). Big marine data (BMD) is considered as heterogeneous information collected from underwater platforms. It can be chemical, biological, or environmental data gathered from different sources such as sensors, tags, drones, or cameras. The processing stages of BMD are as follows [41,42]:
(1)
Acquisition: This refers to raw data collection.
(2)
Secure Transmission: This ensures secure and reliable data transmission using various communication media.
(3)
Storage and privacy: This contains archival demands, legal concerns, and user privacy.
(4)
Special purpose processing: To handle big datasets, this requires bespoke software subscriptions to search, process, label, visualization, and update.
(5)
Exploit and leverage: This ensures users’ enhanced revenue, safe travel, and secure transportation. It also makes sure the protection of marine species and the environment.
With the distinctive features of marine big data, including incompleteness, complexity, and multi-source, these overcome traditional systems’ storage and recovery capabilities. The existing literature on big data focuses primarily on how these huge data quantities can be detected and utilized more efficiently and reliably [43]. The main problems reported in different studies are associated with infrastructure [44], storage [45], security [46], analysis [47], etc.
Traditional oceanographers were provided with a new means to collect synoptic observations of surface global ocean conditions at unprecedented time and space scales [48]. Over the years, oceanographers have also gained capacity to collect data on crucial variables such as sea surface temperature, near real-time information, global information, high spatial and temporal resolution, chlorophyll, coral reef, sea surface height (SSH), sea surface salinity, winds, and ocean circulation with rapid developments in the advancement of innovative sensor technology, advancements in data collection, communications and knowledge sharing methods, etc., almost continuously from space. According to Osen et al. [49], a technique to coordinate IoT data to enable Web-platform-based data collection, retrieval, interpretation, and visualization is introduced. The web-based framework has been proposed, distributed, and interactively provided with real-time data originating from oil detectors, addressing various consumers’ requirements.
On the ground level, the IoT integrates an ever-increasing number of smart devices to control and track several everyday activities up to the minute. However, it has not been fully explored in most areas of the open ocean. This constraint hampers the development of political, industrial, and research societies, many of which require an in-depth understanding of the dynamic and harsh ocean conditions. The Ocean of Things initiative is a research and development project aimed at solving this maritime knowledge gap by deploying a large number of low-cost, intelligent floats that act as a distributed sensor network spanning vast ocean areas. In refs. [50,51,52,53,54] have discussed maritime awareness and cost-effective ways to efficiently predict ocean circulation and marine mammal tracking. In another research study [55], the concept of an innovative IoT-assisted mechanism for cost-efficient ocean sensing was introduced. The technology is composed of consumer electronics off the shelf and involves a central controller and different sensing devices connected with it. In Table 1, we provide a comparative summary of the existing solutions. Aiming to provide a comparative analysis and interpretation of our findings, we have compared the current solutions considering five distinct criteria as presented in Table 1. Our architectural framework is essential for creating the ocean systems and aiding research to understand the ocean. Real-time data collection utilizing algorithms provides the data needed to analyze the ocean’s environment. Data mining and analytics help in data intelligence [56], which is necessary for accurate forecasting. This fifth criterion of data intelligence is a vital component that allows us to make better decisions regarding the ocean.

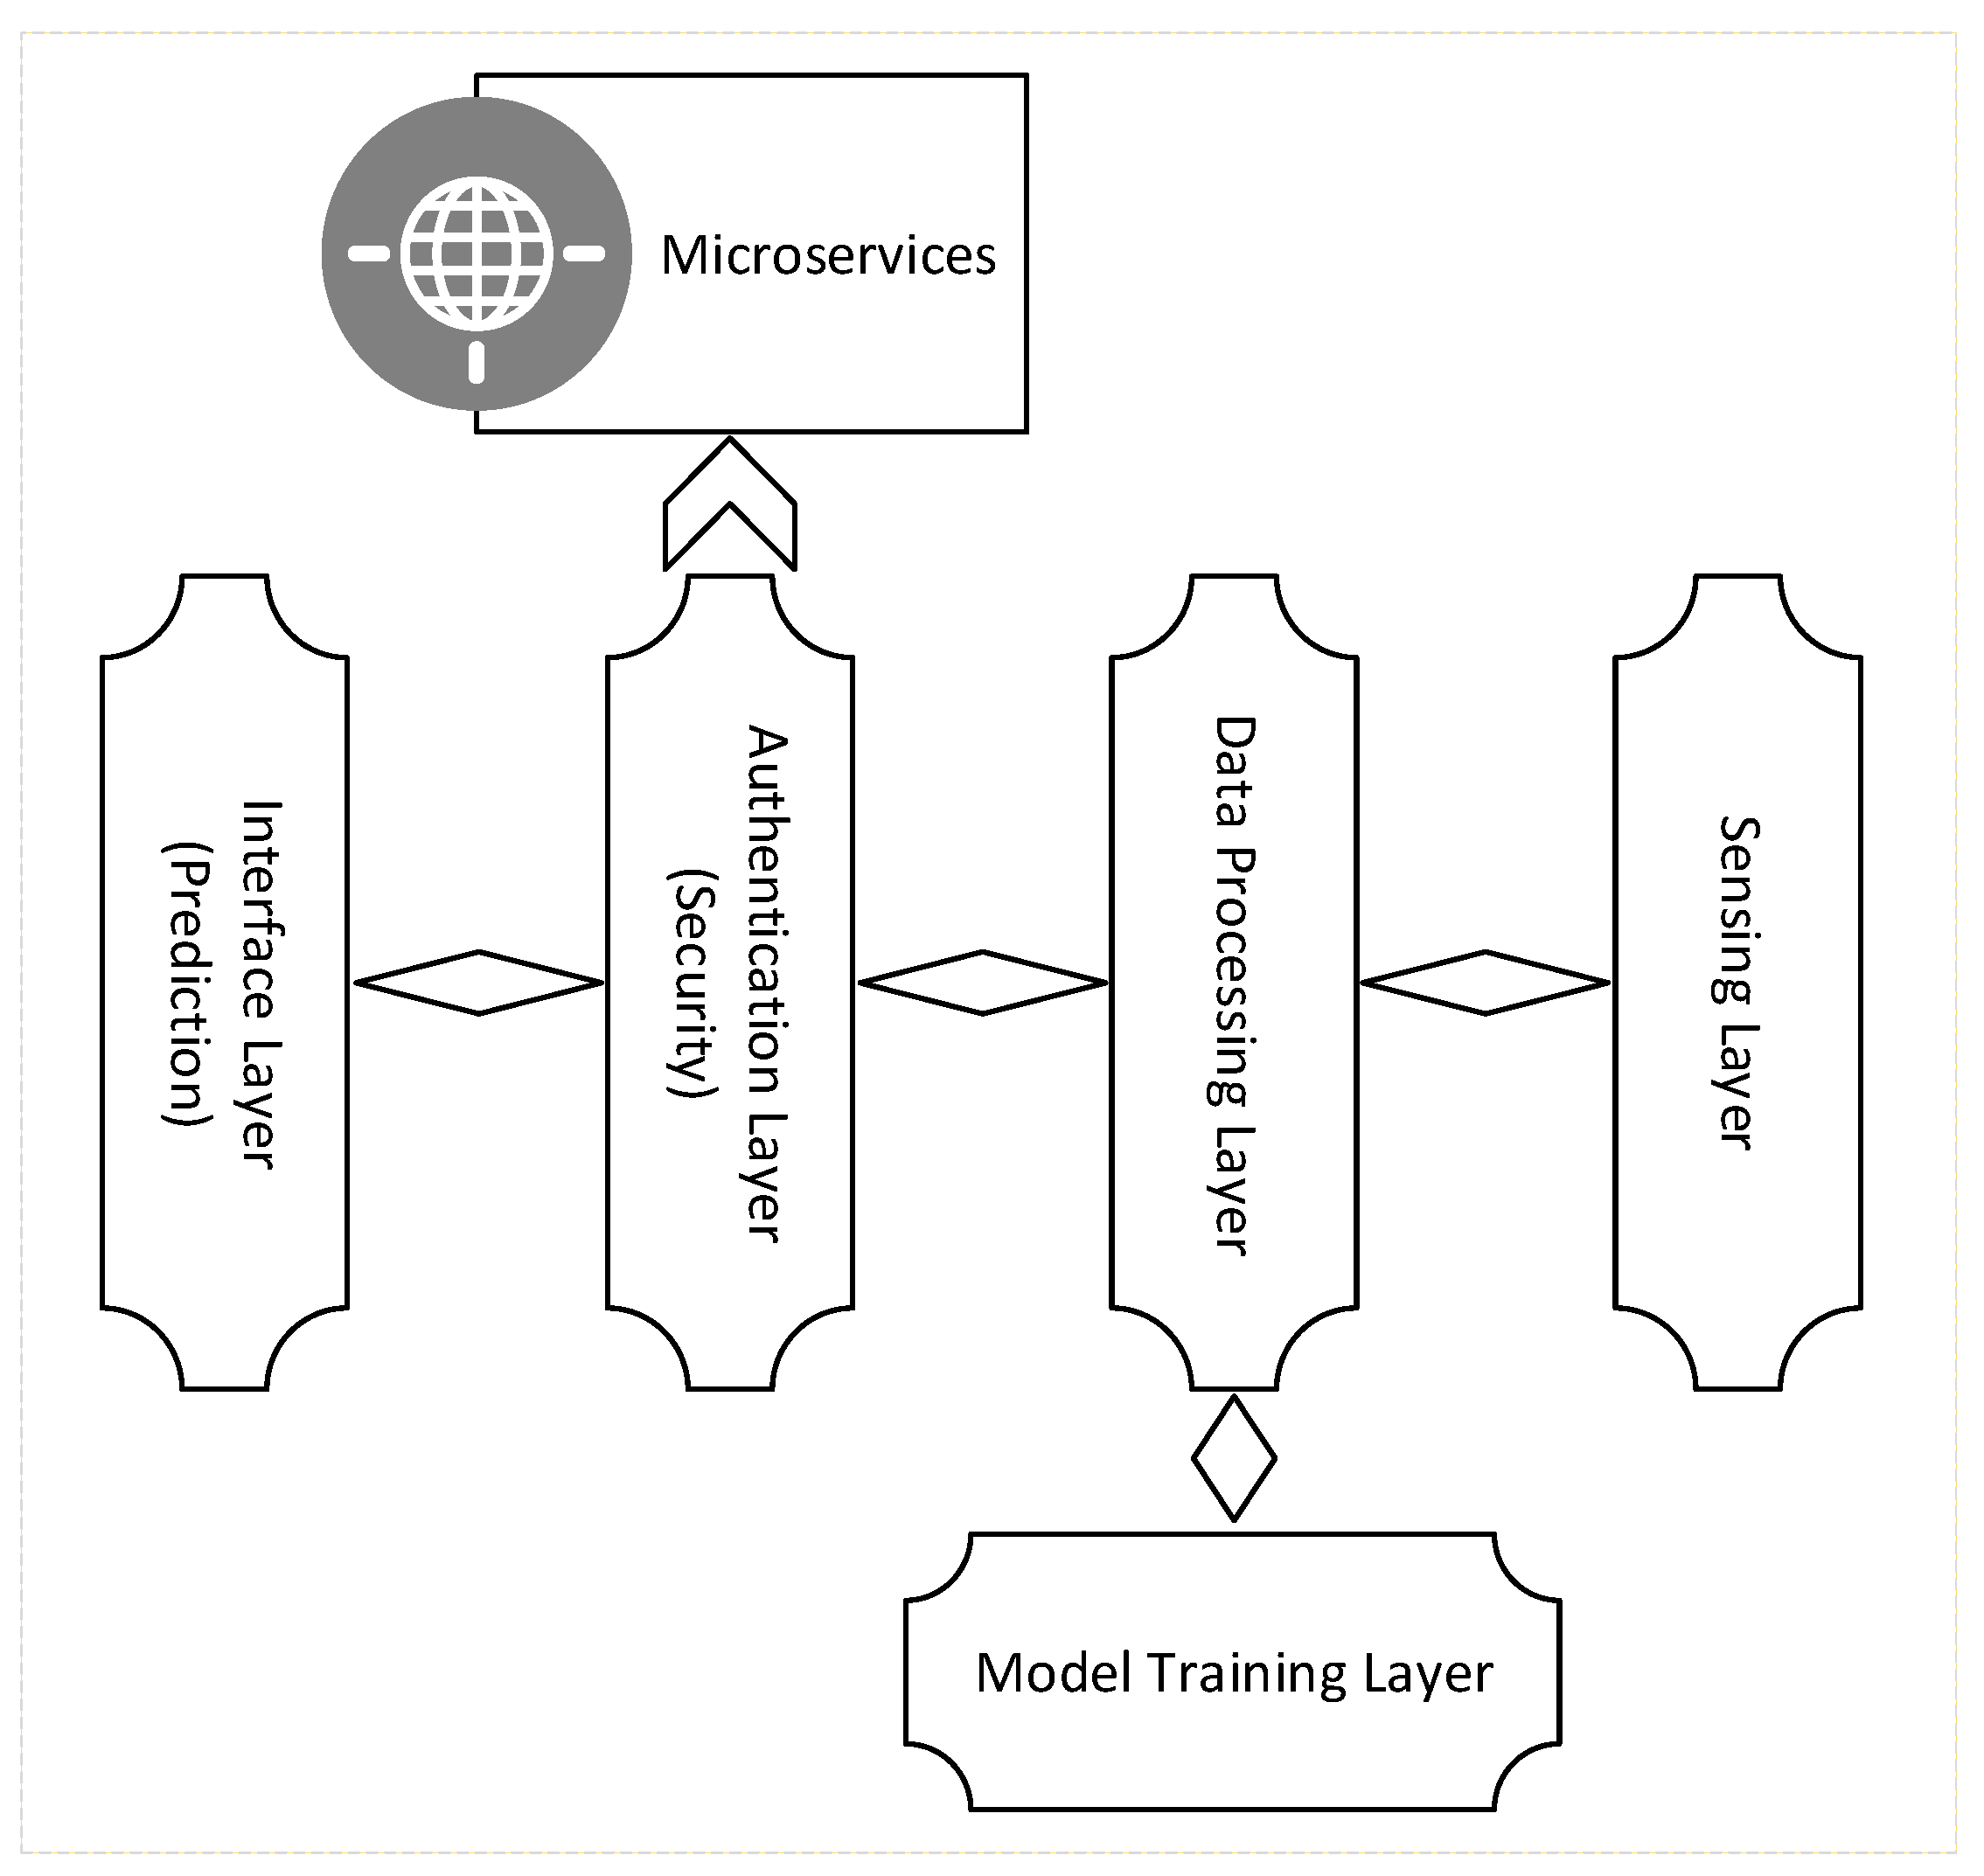
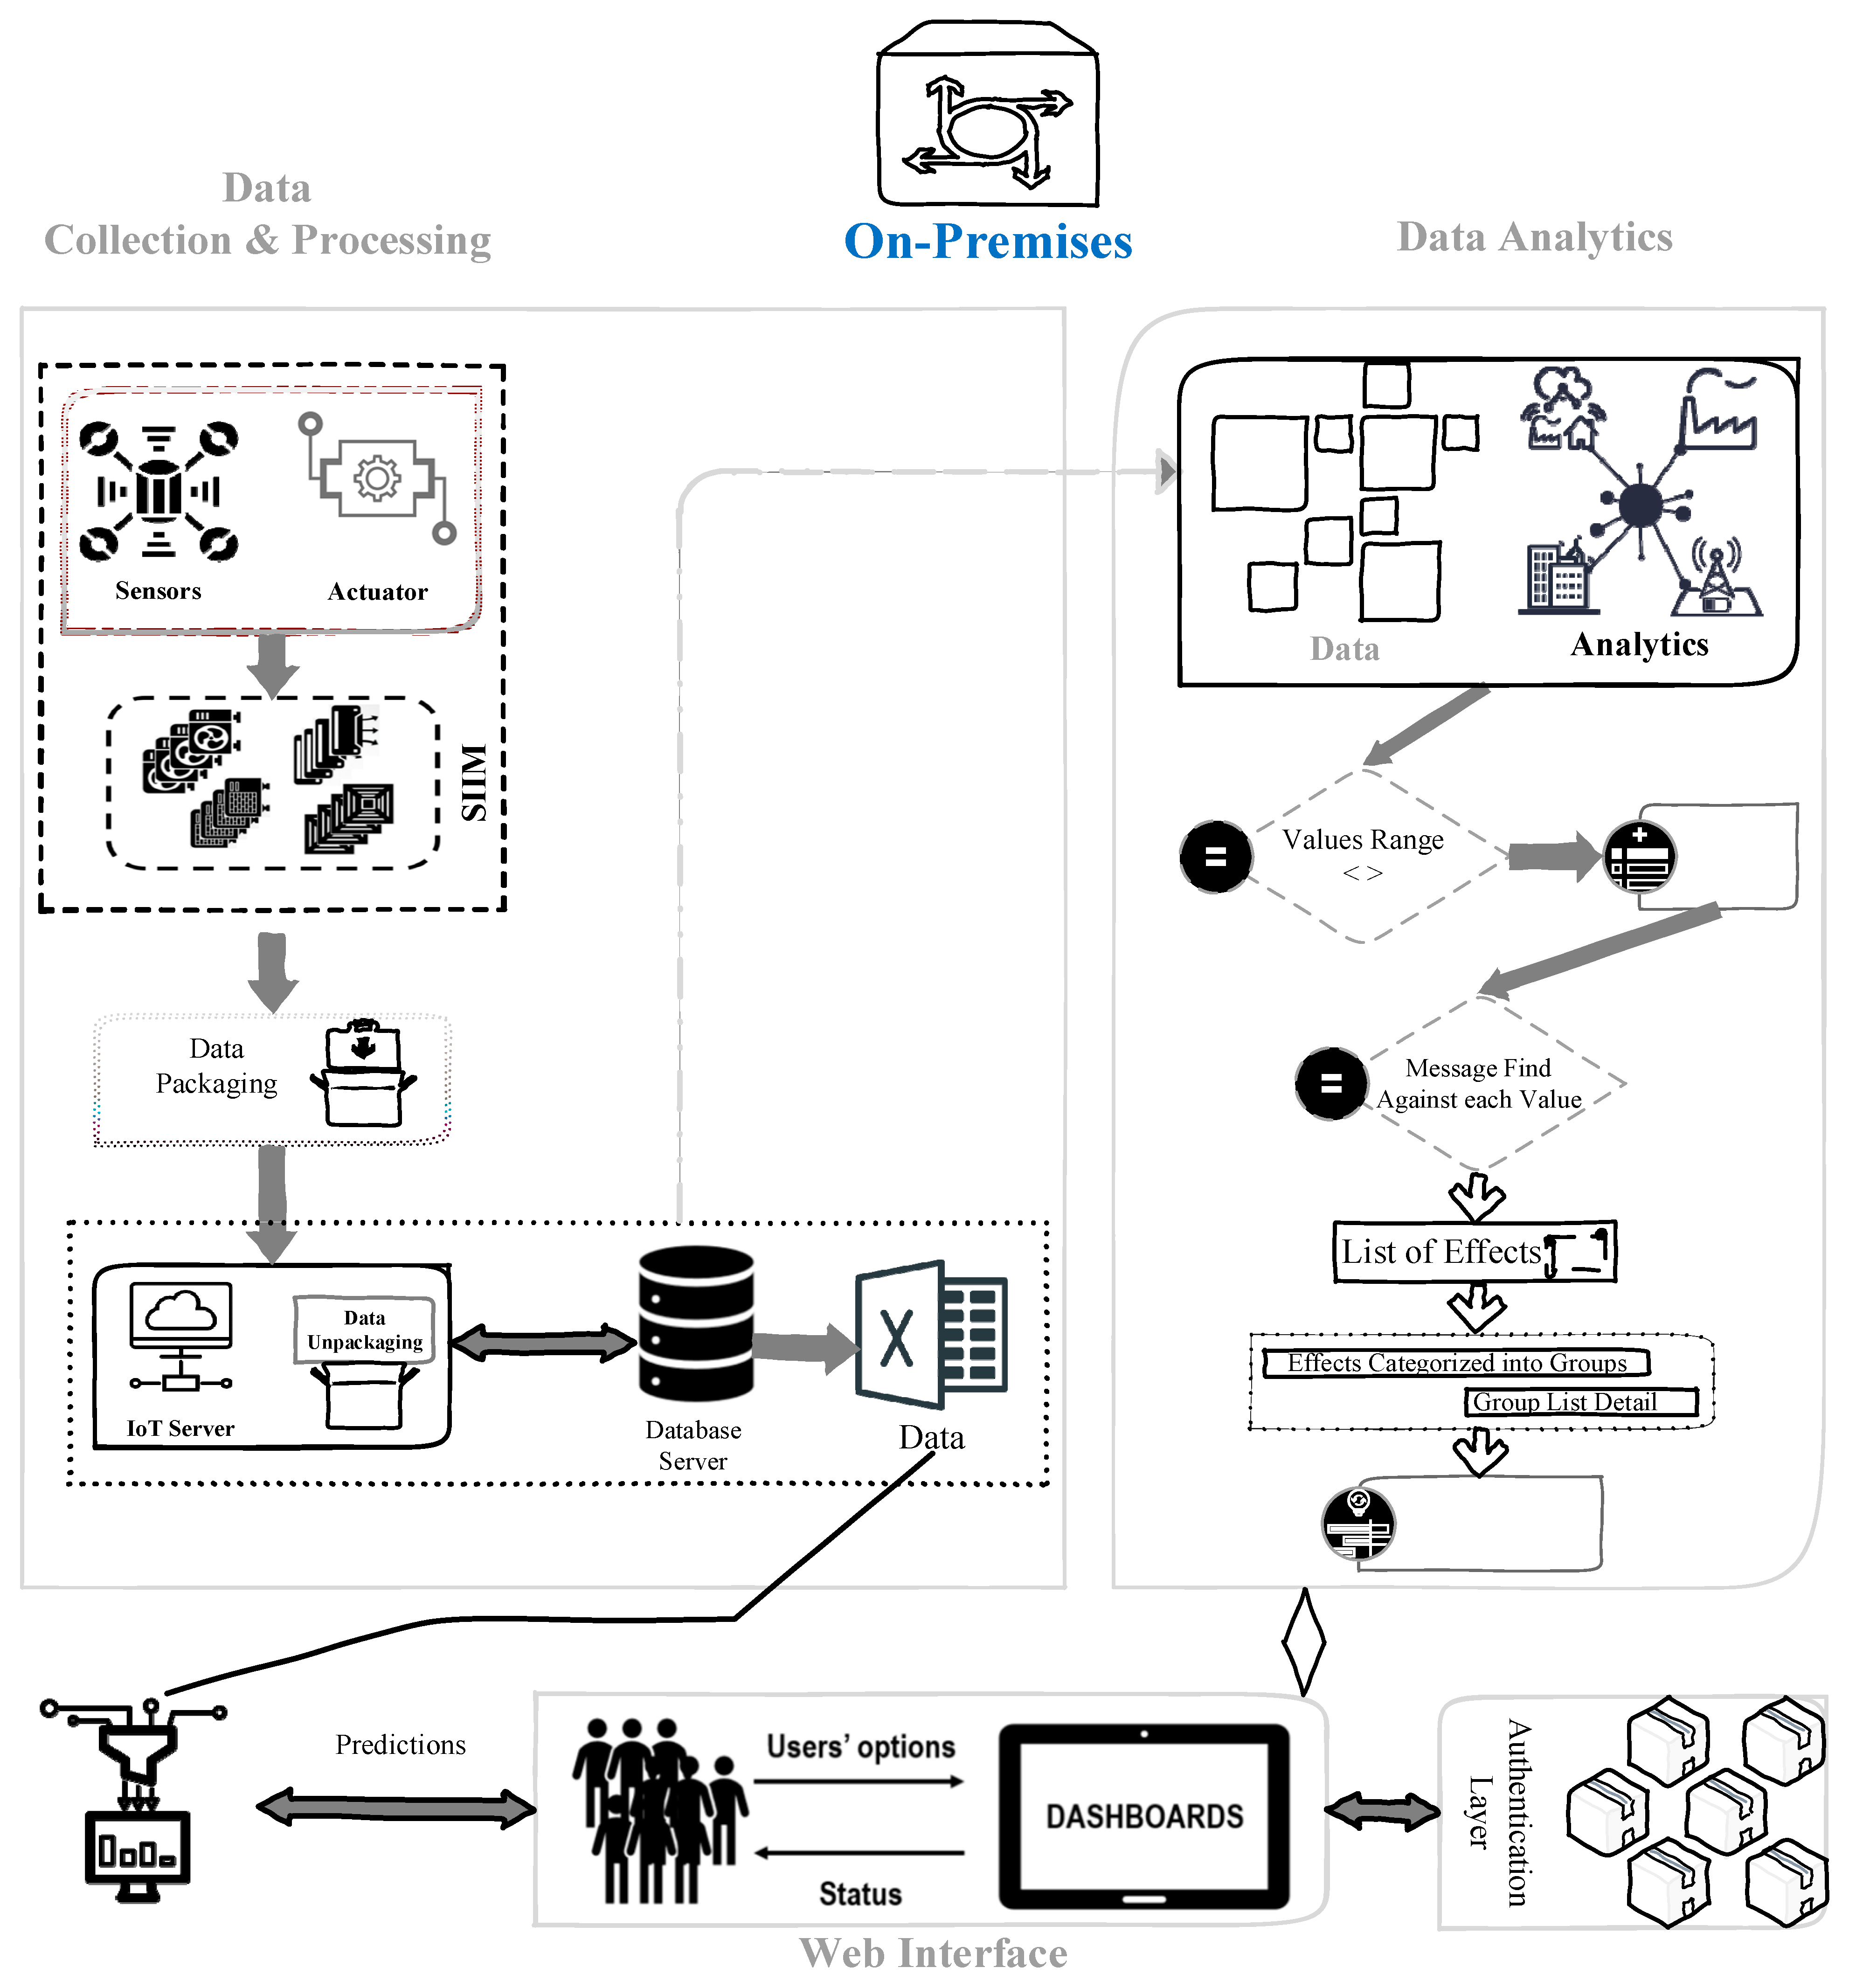
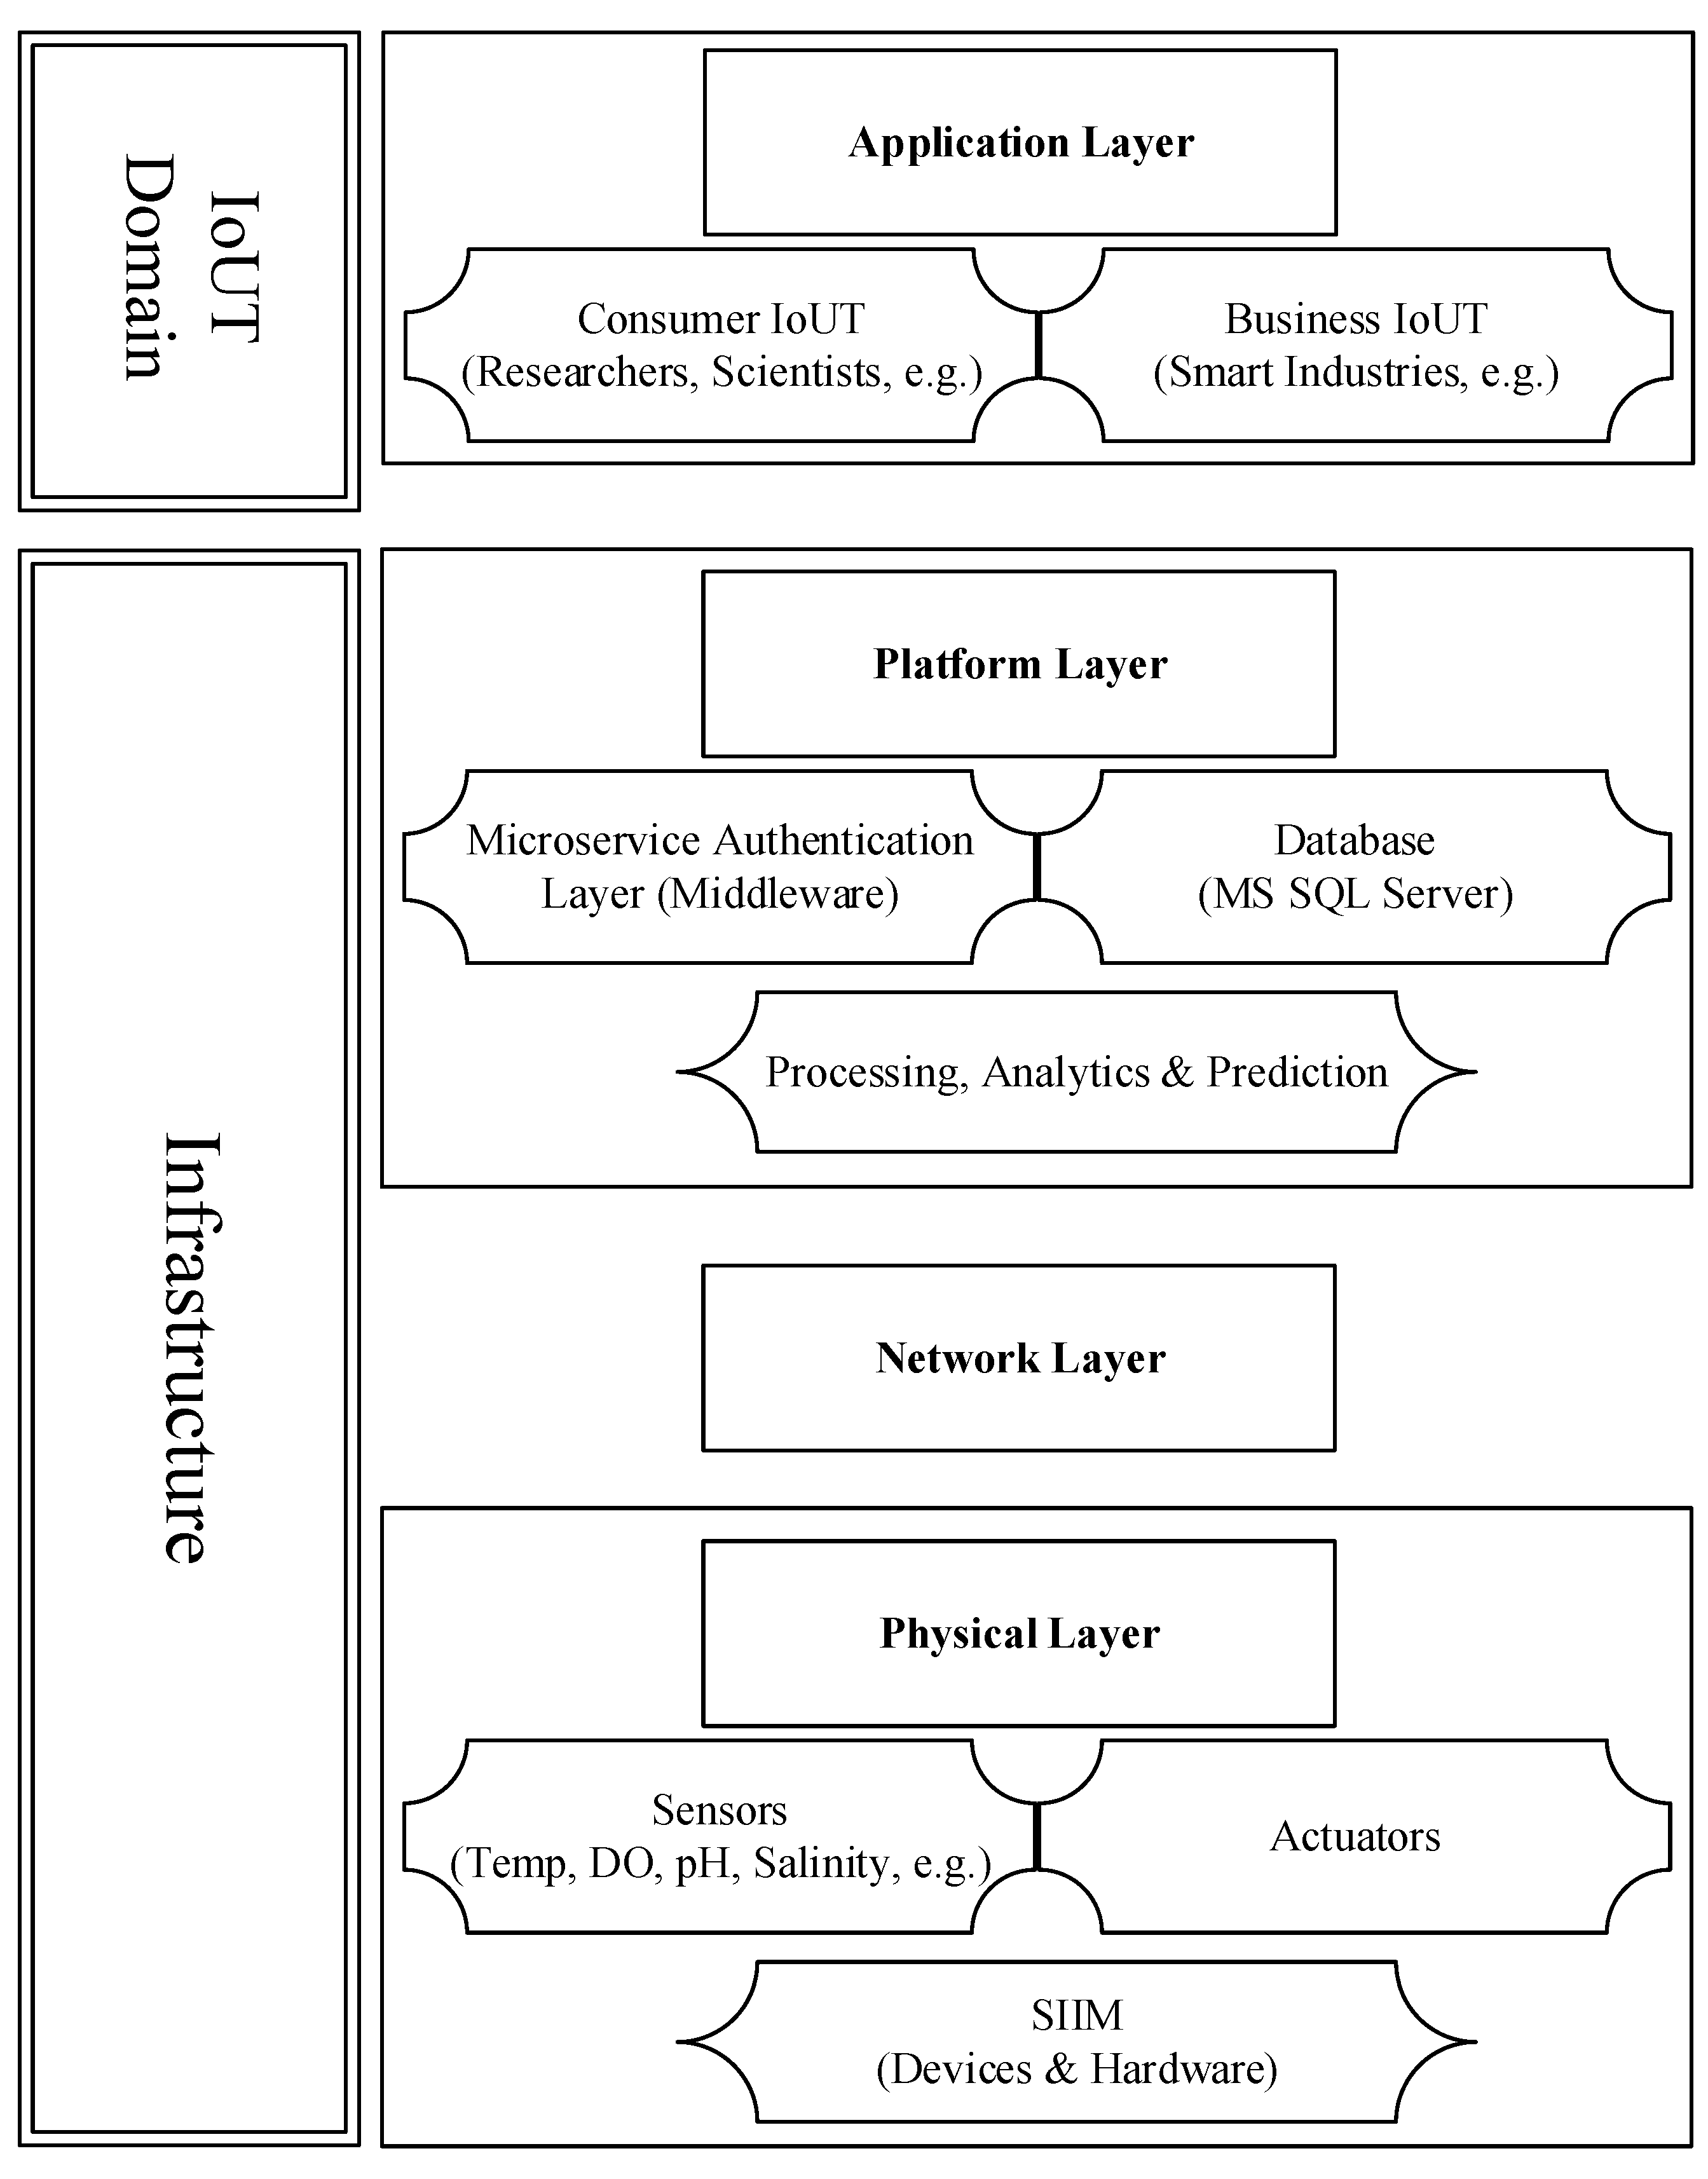
3. Method and Materials Involving Implementation

The research methods, core algorithms, and employed technologies to attain the intended goals are discussed in this section. The implemented technologies discussion is included to supplement the algorithmic requirements by simplifying the tools and frameworks that software and system engineers may use for the successful implementation of the proposed solution.

3.1. Research Methodology

Figure 6 depicts a summary of the research methodology, which consists of four phases that follow an iterative approach to assess, develop, execute, and verify the approach, as described below.
The first stage of the methodology is literature analysis, which entails a critical evaluation of a large body of existing research such as peer-reviewed published research, technological road maps, technical reports, etc. By analyzing current research and development solutions, system designing is the phase of a methodology’s design that seeks a modeling approach before its implementation. In the system design section, we developed design models for the proposed architectural framework to serve as a blueprint for the implementation of the solution. Algorithm execution displays the implementation of a solution in the form of computation and storage-intensive stages and gives a breakdown for configurability based on specified inputs by users. This section includes algorithmic parameters and underlying source code. The final process, validation of the solution, evaluates the functionality and quality of the offered solution. We are primarily interested in assessing various elements of system usability and efficiency.

3.2. Implementation

This section goes through the basic procedures and technologies that were adopted to achieve the desired result. The implementation technologies section supplements the algorithmic requirements by simplifying the tools and frameworks that software and system engineers can use to execute the recommended solution.
In Figure 7, a deployed set of sensors perceives the environmental conditions and sends measurements. An actuator is used to control the SIIM modules in terms of voltage, current, frequency, etc. Similarly, the sensors are deployed with the Scientific Instrument Interface Module (SIIM). SIIM is the controller, and it has the role of operating the sensors’ data by packaging and transmitting it wirelessly. It transmits the data of sensors to the operational IoT server. The data processing phase is the most crucial layer of this system to process the data. The data from sensing devices arrive at the IoT server in a specific package format, which needs to be unpackaged. After unpackaging the data, they are transmitted to the database server directly for storage purposes. All sensors will be selected by default, but the user can specify any sensors to obtain the data. After the sensor step, the query executes all the lists’ data within the specific range of defined parameter values. The next query executes the whole list to identify the messages against each query in the list. Each message presents the effects of sensors’ records, which could be positive or negative on the basis of the criteria. The list of effects is categorized into a group where all details are presented about the effects. The forecasting (create/use datasets and obtain forecasting based on sensors values that could be already defined) phase is in progress and based on these effects.
The architectural framework is shown as a proposed framework in Figure 8 that is divided into many layers. A case study was conducted in order to provide the basis for this proposed framework. Its primary purpose is to provide a set of guidelines for the use of algorithms in order to better understand and enhance ocean forecasting systems. Such improved functionality would be invaluable for decision-making and planning in marine operations, as well as providing useful insights in forecasting potential oceanic events. This framework, with its comprehensive set of algorithms, could prove essential for the future of ocean forecasting. There are four basic levels, the first of which is the physical layer, which contains the hardware, sensors, and actuators. Under the physical layer, data from the ocean and observations of the surroundings are gathered, packaged for a given time cycle into an Excel or CSV file, and sent to the IoUT database server. The second network layer is utilized to send the data package from the sensors to the database server. The third layer is the platform, which has three lower layers: the authentication layer, the database layer, and the data processing layer. Using an API design for microservices, the authentication sublayer is utilized to verify the user’s identity as an independent layer. Due to the need to provide more authentication and functionality, we adopted a microservices API style for only authentication. All of the data from the sensors are kept on the IoUT database server’s database sub-tier. All the data are utilized to train the forecasting model, which is a sublayer of data processing that is also known as a model training layer. The system’s stakeholder users used the application layer, the fourth and final layer, to view the forecasting and recommendations.
The database architecture is presented in Figure A1 in the Appendix A. The data from IoUT’s sensors were stored on an MS-SQL database server. The design of the database shows the parameters that are considered to store essential sensor information. The data from the sensor are gathered by the IoT server and stored in a database. We created a database with a dynamic architecture that allows the addition of new sensors to the system. We also tracked the details for each activity, as well as any exceptions that may arise for any certain reason.
The computational phases, data storage operations, and algorithm output are depicted in Figure 9. By aligning design layers to computational steps across four layouts, the recommended design (as provided in Figure 7) and algorithmic requirements (as provided in Figure 8) remain constant. The first layer of the “Sensing Layer,” for example, shows the method for packing data from the sensors. The technique for storing data from the package and subsequently training the model with available data is presented in the second layer of the “Analytics and Training Layer.” The last layer of the “Interface Layer” displays the forecasting results to the user via a web interface. The findings from the forecasting are presented through the interface layer.
Algorithm 1 Sensor Data Reading and Packaging
1: Input: S                 Sensor data
2:  Output:                 Pkg              Data Packaging
3: procedure DataPacking
4:                 while true do
5:                     Si  ←  Read()              Reading Sensor’s Data
6:                     Pkg  ←    AddBulkData(φid, Si, t)              Writing Data
7:                     if t < tp then
8:                         t ← Reset()                                  Reset timer for next interval
9:              Send(T, Pkg)      Sending Package to IoUT Data Server
10:   end if
11:                 end while
12: end procedure
We have provided an overview of the Algorithm 1 in pseudo-code. The algorithm of data collection from the sensors is explained with the mechanism. The data are collected in the form of a specific format, which is packaged in a file. The data-packaged file is sent to the IoT server where all data packages are retrieved and processed to store in a database. In the data collection process, there are lists of a set of sensors deployed to obtain information about the specific environmental conditions and to send measurements.
(1)
Input(s): The input in this algorithm is used to collect the data of a specific sensor.
(2)
Processing: Data are collected from the sensors, and this process is frequently repeated. There are different variables that are being collected as a piece of information from the sensors, and then data are packaged and further sent to the server for further processing.
(3)
Result: The result is to be packaged with data and sent to the server.
Algorithm 2 Data Processing and Prediction
1:  Input: σ, ψ, e, ≈, L, ∇, ρ           sensor, data type, date, time, location, id, password
2:    Output: P, S                  forecasting Outcome
3:  procedure Prediction(ψ, σ, e=Null, ≈=Null)
4:              if    ID == ∇ || Password == ρ    then                Authentication Service Layer
5:      if   ψ == C || ψ == H      then         Current Data  OR  Historical    Data
6:              if    σl > 0 then
7:      if Q.σl > 0 then              Correlation is not null
8:              if    L ! = NULL then   location is not null
9:                    while j < σl do
10:       while i < Q.σl do
11:                P ← TrainedModel(σl[j], → [i],L, ψ, e,)
12:    if  P ! = null then
13:    S ← GetImpact(P)
14:    end if
15:    i++
16:    end while
17:    j++
18:    end while
19:    else
20:    while j < σl do
21:    while i <Q.σl do
22:    P ← TrainedModel(σ[j],Q[i],ψ,e,)
23:    if P ! = null then
24:    S ← GetImpact(P)
25:    end if
26:    i++
27:    end while
28:    j++
29:    end while
30:    end if
31:    else
32:    while j < σl do
33:     P ← TrainedModel(σ[j],L,ψ, e)
34:    if P ! = null then
35:    S ← GetImpact(P)
36:    end if
37:    j++
38:      end while
39:      end if
40:      end if
41:      end if
42:      return      P,S
The model training strategies used to train models for forecasting are presented in the data analytics Algorithm 2. This is the most significant phase of data analytics, which contains two sub-phases (current data and historical data) for data processing and prediction. Historical data are prior data that assess the results of available previous data for featuring the data forecast. Current data are closer to live data, which are utilized to make the forecasting on the basis of the current date and time. The forecasting is based on a variety of factors, where correlation-based sensor forecasting is the most significant prediction.
(1)
Input(s): We are passing various parameters with varying sensor relationships as input. Data type, sensor type, correlation sensor type, date, location, and other characteristics are used as inputs.
(2)
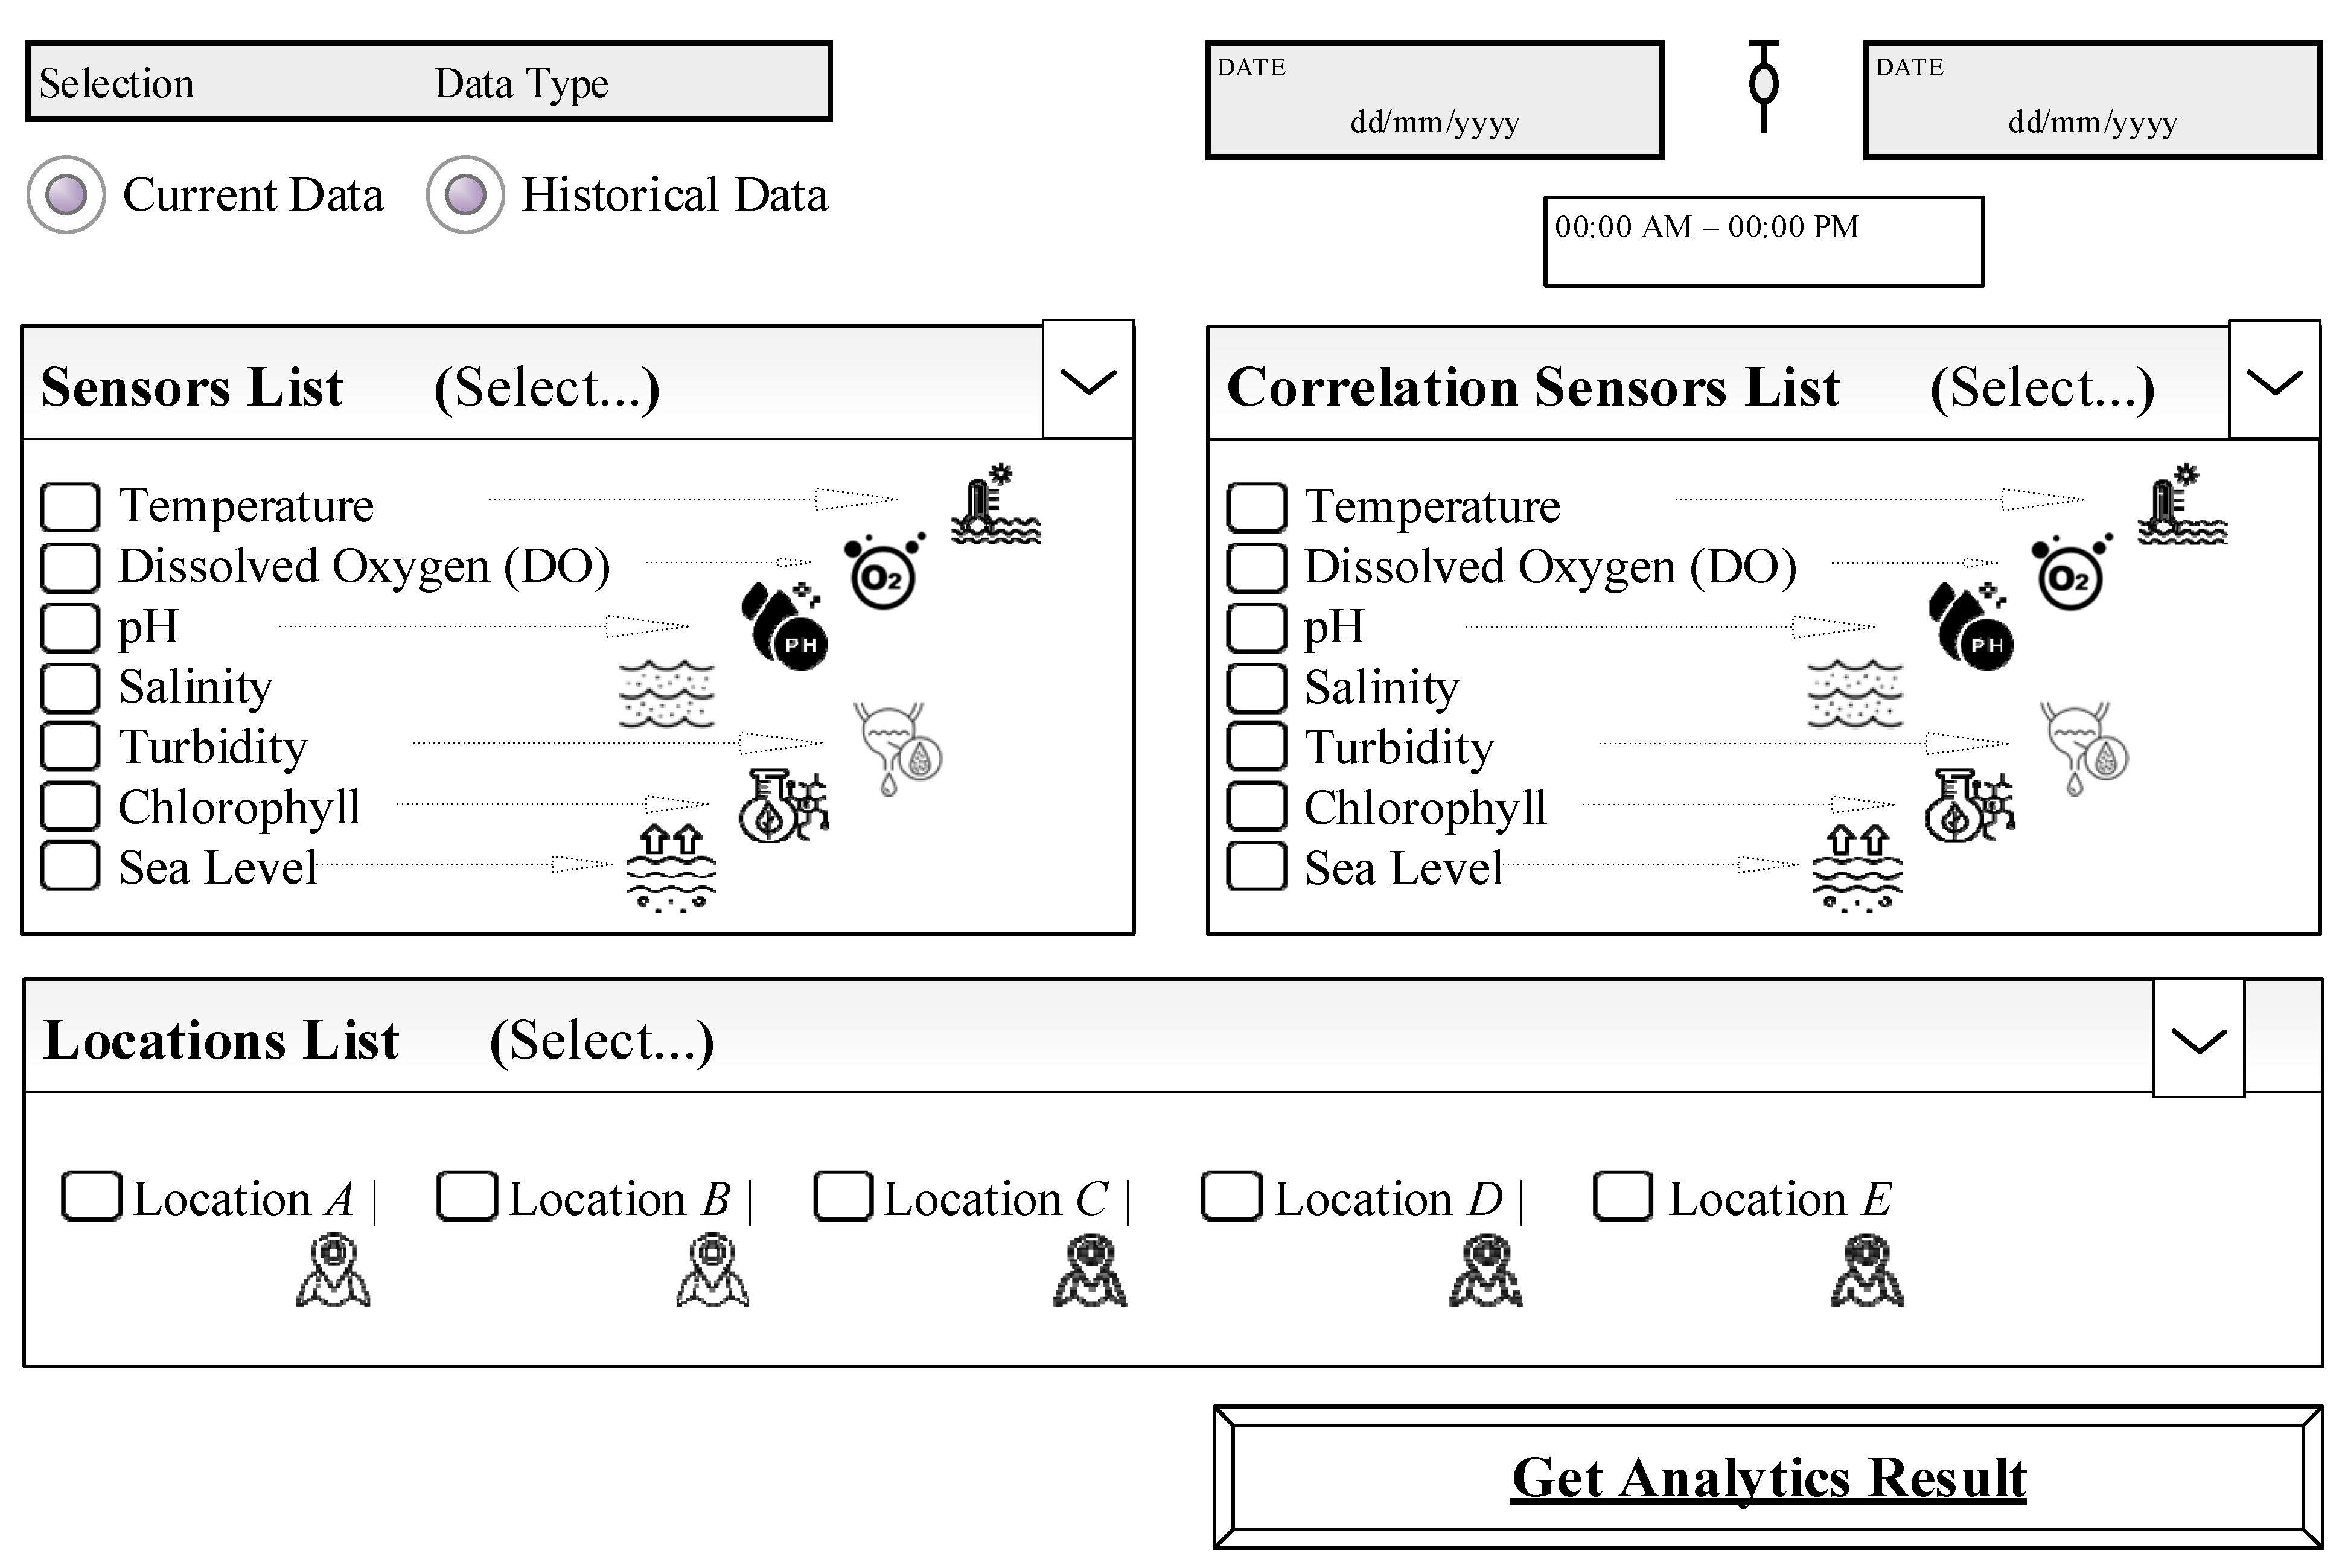
Processing: This algorithm analyses the data in order to deliver relevant insights and perform forecasting according to the inputs of the users. The input for custom data only goes to a database server, which provides data analytics, but the input for forecasting goes to a specific trained model, which produces a forecasting result that is displayed to stakeholders via a web interface (as shown in Figure 10).
(3)
Result: To deliver helpful insights from the database server’s accessible data and forecasting from the trained models.
F o r e c a s t i n g i n p u t = f D a t e r a n g e ,   S e n s o r s i d s , C o r r e a l t i o n S e n s o r s i d s , L o c a t i o n s i d s )
P r e d i c t i o n O u t p u t = i = 1 n S n l i s t + i = 1 n C r S n l i s t S n l i s t + i = 1 n L o c l i s t
I n t e l l i g e n c e R e o m = f i = 1 n E f f e c t s D b l i s t i = 1 n S n l i s t + i = 1 n C r S n l i s t S n l i s t + i = 1 n L o c l i s t
where i = 1 n Effects Db list is the list of recommendations for predicting output and scenarios, i = 1 n Sn list is the list of sensors that select the number of sensors from the first list, i = 1 n CrSn list Sn list is the number of correlation sensors, and i = 1 n Loc list is the number of locations where sensors are deployed.
Figure 10. Ocean Data Analytics Case Study: forecasting from the developed system, Sensor 1; Correlation Sensor/s; Single Location; Multiple Location Selection).
Jmse 11 00368 g010
Deployed Sensor Information
  • Temperature: To measure the current temperature.
  • DO: To measure the dissolved oxygen level in the water.
  • PH: To measure the acidity or alkalinity of the water.
  • Salinity: To measure the “saltiness” of seawater.
  • Turbidity: To find the amount of light that is scattered by suspended or scattering particles in water.
  • Chlorophyll: To measure the resultant light fluorescence by chlorophyll in the red wavelength. The fluorometer gives measurements of levels of chlorophyll in water.
  • Sea Level: To measure the depth.

4. Results and Discussion

In this part, the findings of the recommended solution are reported. The evaluation environment and dataset are contextualized. Then, we execute a criteria-based evaluation, which includes monitoring and analyzing sensor data for stability, query response for performance, and algorithmic execution for efficiency.
With the exponential rise of information technology and improvements in ocean observatories, ocean science is approaching the big data age. Smart disaster prediction, smart underwater tourism, smart underwater exploration, smart underwater navigation, smart deep range monitoring, smart ocean pollution monitoring, and smart underwater incursion detection are different examples of smart ocean applications. Our suggested approach can help in a more thorough analysis and understanding of the ocean, as well as a more complete use of the ocean’s potential and more convenient control of the ocean to better serve humanity. The sensors utilized for the evaluation of the ocean include temperature, dissolved oxygen (DO), pH, salinity, turbidity, chlorophyll, and sea level. These sensors are integral components of the framework used to forecast the ocean environment by providing input data to the algorithms. The temperature sensor measures the temperature of the ocean; the DO sensor measures the amount of oxygen in the water; the pH sensor assesses the acidity of the water; the salinity sensor assesses the salinity of the water; the turbidity sensor assesses the amount of light in the water; and the sea level sensor assesses the depth of the ocean. By leveraging these sensors, this framework is able to accurately forecast changes in oceanic conditions.
The ocean has an impact on our lives. Human actions, in turn, have an impact on the water. The ocean must be observed, measured, assessed, protected, and managed. Marine big data research provides new decision-making tools and projections to enhance security, boost the economy, and safeguard the environment. Big data from the oceans provide the path for more sustainable development and better living. In a rapidly changing world, maintaining coastal and marine biodiversity is crucial for human health, marine species, and ecosystem resilience. Our suggested technique can be used to assess the state of marine biodiversity as a medium for the health of coastal and ocean ecosystems and their capability to deliver ecosystem services including oxygen, food, economic advantages, and a stable climate. As a result, controlling these marine resources through an approach that protects current marine biodiversity will assist in the achievement of other ocean management goals.

4.1. Implementation of Technologies

The complementary function of pertinent tools and technologies for the suggested solution is summarized in this section. The longer discussion here aims to provide the reader with a better understanding from a technological standpoint.
The data analytics process, which is written in Python and runs on Windows 10, is the key element of the framework. The purpose of the data analytics algorithm is to gather data from sensors and run the algorithm to save the data in SQL Server. In the framework’s second major component, data prediction, the Time-Series model and Random Forest are employed for model training. Models for data analytics and forecasting are trained using Jupiter Notebook. The framework was developed to train models for a collection of correlation sensors, and the training process involves multiple phases with different sets of algorithms. For example, Sensor A from the first list of sensors and Sensor B from the second list of correlation sensors were used to train the model. This cycle was used to train all of the models for all of the sensors, which is crucial in ocean forecasting. Therefore, this framework and cycle are extremely important and can be used as a basis for further research.
Figure 10 shows the default settings of the web intelligence. On the left side, the historical data are selected by default. We have six different parameters that we are passing to receive intelligence. For historical data, we set the date range that goes to the database server for obtaining intelligence. The sensor list shows all available sensors that are used to achieve the forecasting and the second list of sensors is a set of correlation sensors that are connected with the sensors list to obtain the intelligence. There is also a locations list where sensors are deployed.
We trained several models, but only certain models were linked to the stakeholders’ web interface. With numerous options, we present the result for “Current Data.” The forecasting for the selected city is presented in the left part of Figure 10 based on a single location. The forecasting result for multiple locations is presented in the right part of Figure 10. The anticipated output is based on sensor correlation. We choose a temperature sensor and calculate the pH value, which will be envisaged.
We trained several models, but only certain models were linked to the stakeholders’ web interface. With numerous options, we present the result for “Current Data.” The forecasting for the selected city is presented in the left part of Figure 11 based on a single location. The forecasting result for multiple locations is presented in the right part of Figure 11. The anticipated output is based on sensor correlation. We choose a temperature sensor and calculate the pH value, which will be envisaged. The source code is available on GitHub along with uploaded videos for project presentation. In the video, we are briefing about the training model and showing forecasting on the web interface for stakeholders.
The installation of sensors in the IoT domain and the data sent to a server has enabled us to assess the sensor layer with the purpose of determining data stability and interruption. Figure 12 shows uniformity of sensor data throughput, represented by the y-axis, which represents the data size in kb, and the x-axis, which refers to the number of days. The data gathered from this framework can be used to improve existing algorithms for ocean forecasting. By utilizing these algorithms, we can gain better insight into the ocean environment, which would be beneficial in predicting future changes in ocean conditions. The framework and algorithms developed in this research can be applied to other ocean forecasting purposes. As shown in Figure 12, there is very little data disturbance, and thus the consistency of the data supplied by the pH sensor is maintained. We calculated the average data size in kb and determined that packets are produced at a pace of one every ten minutes. The gateway sends them to the network server in response to specified time-based trigger circumstances, which demonstrates the effectiveness of our framework and algorithms for ocean forecasting.
Two criteria are used to check the performance of the data analytics phase: query time and processing time. The query processing time is determined using current and historical data. The present data refers to the data being processed directly from sensors, whereas historical data have been captured and may have been analyzed before. However, in order to make a forecast, previous data may be needed. Data analytics can also be conducted on a specific set of fields or ranges of data. As a consequence, depending on the system requirements, the query may vary. In order to assess and for the evaluation of the efficiency of this proposed approach, we monitored the memory and usage of the CPU. The processing and power efficiency monitoring overview of this proposed framework is illustrated in Figure 13.

4.2. Threats to Validity

We will briefly discuss various potential threats to the study’s validity.
(1)
Internal Validity: Internal system aspects such as design and implementation may be impacted. In our instance, we performed a series of trials to assess the correlation between the sensors. To reduce internal validity, it must execute on a variety of platforms in the future and employ massive datasets.
(2)
External Validity: This has to do with the verification of solutions using various relevant mechanisms and case studies. For the validation of the solution and the single case study that may justify the generalization for the implemented system, we employed the case study approach. To lessen the effects, more case studies are required in future work.

5. Conclusions and Future Work

We exploit the IoUT as the state of the art in this paper with the aim of creating an architectural framework for ocean intelligence data exploration.
The research explores the marine life for monitoring and protecting the environment by predicting analytics. To operationalize a wide range of situations, from investigating marine life to assessing water pollution and mining oceanic data, IoUTs serve as the fundamental technology beneath the sea. Marine data also provide a variety of important knowledge and exploration artifacts. Predictive analytics can offer useful insights to the stakeholders associated with environmentalists, marine explorers, and oceanographers for decision-making and intelligence about the ocean, when applied to context-sensitive information, gathered from marine data. We proposed an architectural framework along with processes as a realistic solution to design and develop an IoUT system to excel in the data state of the practice.
Advancements have been made in IoT technologies, particularly integrating IoUT concepts with data processing methods and techniques in smart ocean environments, as follows:
  • Following the multi-tier architecture style to design an architectural framework and evaluate an IoT system subset known as IoUTs, which combines IoTs and data analytics.
  • Enabling the customization of collected data as per the requirements of stakeholders.
Key intelligence: We collected data on oxygen level, water temperature, solar lights, etc., and then investigated the impacts of anything that could affect sea species based on requirements. We can predict which type of effect can most probably occur that in specific weather conditions or at a specific time.
Stakeholders: These could be any scientists, practitioners, researchers, government entities, regulatory bodies, etc., who observe ocean data-based effects on life or other things. After reading the situation, they may make a model based on it. Models can be used to investigate sea life that will impact ocean wildlife or other related factors.

5.1. Limitations

The results of our experiments, involving a limited set of trials in an ocean case study and using Relation Database Systems (RDBMS), were promising. Our models had been trained on specific datasets, and the outcome of this system was encouraging. We look forward to further studies which will allow us to refine our method for more accurate insights.

5.2. Future Work

We aim to broaden the application of case studies and real-world scenarios in future research in order to validate the solution even more. As part of the evaluation process, we intend to provide more case studies to illustrate the solution’s performance in various data and deployment scenarios. As a long-term goal, we intend to enhance this framework and develop a platform to securely exchange IoUT data.

Author Contributions

Conceptualization, A.R., S.A.H.M. and M.H.A.; methodology, A.R. and Y.L.; writing—original draft preparation, A.R.; writing—review and editing, A.R., S.A.H.M. and Y.L.; funding acquisition, S.A.H.M., Y.L. and M.H.A. All authors have read and agreed to the published version of the manuscript.

Funding

This research received no external funding.

Institutional Review Board Statement

Not applicable.

Informed Consent Statement

Not applicable.

Data Availability Statement

Datasets and source code have been uploaded on GitHub and can be downloaded Download [57].

Conflicts of Interest

The authors declare no conflict of interest.

Appendix A

Figure A1. The architecture design of the system’s database.
Jmse 11 00368 g0a1

References

  1. Nayyar, A.; Ba, C.H.; Duc, N.P.C.; Binh, H.D. Smart-IoUT 1.0: A Smart Aquatic Monitoring Network Based on Internet of Underwater Things (IoUT). In Industrial Networks and Intelligent Systems; INISCOM 2018. Lecture Notes of the Institute for Computer Sciences, Social Informatics and Telecommunications Engineering; Duong, T., Vo, N.S., Eds.; Springer: Cham, Switzerland, 2018; Volume 257, pp. 191–207. [Google Scholar]
  2. Statista. IOT and Non-IOT Connections Worldwide. Available online: https://www.statista.com/statistics/1101442/iot-number-of-connected-devices-worldwide/2010–2025 (accessed on 1 December 2022).
  3. Chen, S.; Xu, H.; Liu, D.; Hu, B.; Wang, H. A Vision of IoT: Applications, Challenges, and Opportunities with China Perspective. IEEE Internet Things J. 2014, 1, 349–359. [Google Scholar] [CrossRef]
  4. Razzaq, A. A Systematic Review on Software Architectures for IoT Systems and Future Direction to the Adoption of Microservices Architecture. SN Comput. Sci. 2020, 1, 350. [Google Scholar] [CrossRef]
  5. Al-Fuqaha, A.; Guizani, M.; Mohammadi, M.; Aledhari, M.; Ayyash, M. Internet of Things: A Survey on Enabling Technologies, Protocols, and Applications. IEEE Commun. Surv. Tutor. 2015, 17, 2347–2376. [Google Scholar] [CrossRef]
  6. Domingo, M.C. An overview of the internet of underwater things. J. Netw. Comput. Appl. 2012, 35, 1879–1890. [Google Scholar] [CrossRef]
  7. Hughes, T.P.; Kerry, J.T.; Álvarez-Noriega, M.; Álvarez-Romero, J.G.; Anderson, K.D.; Baird, A.H.; Babcock, R.C.; Beger, M.; Bellwood, D.R.; Berkelmans, R.; et al. Global warming and recurrent mass bleaching of corals. Nature 2017, 543, 373–377. [Google Scholar] [CrossRef] [PubMed]
  8. Mary, K.; Raj, D.; Ko, E.; Yoon, D.J.; Shin, S.-Y.; Park, S.-H. Energy Optimization Techniques in Underwater Internet of Things: Issues, State-of-the-Art, and Future Directions. Water 2022, 14, 3240. [Google Scholar] [CrossRef]
  9. Razzaq, A. Blockchain-based secure data transmission for internet of underwater things. Clust. Comput. 2022, 25, 4495–4514. [Google Scholar] [CrossRef]
  10. García-García, L.; Jiménez, J.M.; Abdullah, M.T.A.; Lloret, J. Wireless technologies for IoT in smart cities. Netw. Protoc. Algorithms 2018, 10, 23–64. [Google Scholar] [CrossRef]
  11. Yan, J.; Gong, Y.; Chen, C.; Luo, X.; Guan, X. AUV-aided localization for Internet of underwater things: A reinforcement-learning-based method. IEEE Internet Things J. 2020, 7, 9728–9746. [Google Scholar] [CrossRef]
  12. Khan, M.T.R.; Ahmed, S.H.; Kim, D. AUV-aided energy-efficient clustering in the Internet of underwater things. IEEE Trans. Green Commun. Netw. 2019, 3, 1132–1141. [Google Scholar] [CrossRef]
  13. Evans, D. The Internet of Things: How the Next Evolution of the Internet Is Changing Everything; White Paper; CISCO: San Jose, CA, USA, 2011; p. 1. [Google Scholar]
  14. Al-Bzoor, M.; Al-assem, E.; Alawneh, L.; Jararweh, Y. Autonomous underwater vehicles support for enhanced performance in the Internet of underwater things. Trans. Emerg. Telecommun. Technol. 2021, 32, e4225. [Google Scholar] [CrossRef]
  15. Mohsan, S.A.H.; Mazinani, A.; Othman, N.Q.H.; Amjad, H. Towards the internet of underwater things: A comprehensive survey. Earth Sci. Inform. 2022, 15, 735–764. [Google Scholar] [CrossRef]
  16. Gopinath, M.P.; Tamizharasi, G.S.; Kavisankar, L.; Sathyaraj, R.; Karthi, S.; Aarthy, S.L.; Balamurugan, B. A secure cloud-based solution for real-time monitoring and management of Internet of underwater things (IOUT). Neural Comput. Appl. 2019, 31, 293–308. [Google Scholar] [CrossRef]
  17. De Souza, F.A.; Chang, B.S.; Brante, G.; Souza, R.D.; Pellenz, M.E.; Rosas, F. Optimizing the number of hops and retransmissions for energy efficient multi-hop underwater acoustic communications. IEEE Sens. J. 2016, 16, 3927–3938. [Google Scholar] [CrossRef]
  18. Gjanci, P.; Petrioli, C.; Basagni, S.; Phillips, C.A.; Bölöni, L.; Turgut, D. Path finding for maximum value of information in multi-modal underwater wireless sensor networks. IEEE Trans. Mob. Comput. 2017, 17, 404–418. [Google Scholar] [CrossRef]
  19. Yan, J.; Yang, X.; Luo, X.; Chen, C. Energy-efficient data collection over AUV-assisted underwater acoustic sensor network. IEEE Syst. J. 2018, 12, 3519–3530. [Google Scholar] [CrossRef]
  20. Fang, Z.; Wang, J.; Jiang, C.; Zhang, Q.; Ren, Y. AoI inspired collaborative information collection for AUV assisted internet of underwater things. IEEE Internet Things J. 2021, 8, 14559–14571. [Google Scholar] [CrossRef]
  21. Abdillah, A.F.; Berlian, M.H.; Panduman, Y.Y.F.; Akbar, M.A.W.; Afifah, M.A.; Tjahjono, A.; Sukaridhoto, S.; Sasaki, S. Design and development of low cost coral monitoring system for shallow water based on internet of underwater things. J. Telecommun. Electron. Comput. Eng. 2017, 9, 97–101. [Google Scholar]
  22. Sicari, S.; Rizzardi, A.; Grieco, L.A.; Coen-Porisini, A. Security, privacy and trust in Internet of Things: The road ahead. Comput. Netw. 2015, 76, 146–164. [Google Scholar] [CrossRef]
  23. Shahid, N.; Aneja, S. Internet of Things: Vision, application areas and research challenges. In Proceedings of the International Conference on I-SMAC (IoT in Social, Mobile, Analytics and Cloud) (I-SMAC), Paladam, India, 10–11 February 2017; pp. 583–587. [Google Scholar]
  24. Wang, S.; Yuan, H. Spatial data mining: A perspective of big data. Int. J. Data Warehous. Min. 2014, 10, 50–70. [Google Scholar] [CrossRef]
  25. Arellanes, D.; Lau, K.-K. Evaluating IoT service composition mechanisms for the scalability of IoT systems. Future Gener. Comput. Syst. 2020, 108, 827–848. [Google Scholar] [CrossRef]
  26. Tsai, C.-W.; Lai, C.-F.; Chiang, M.-C.; Yang, L.T. Data mining for internet of things: A survey. IEEE Commun. Surv. Tutor. 2013, 16, 77–97. [Google Scholar] [CrossRef]
  27. Manev, D.; Dimov, A. Facilitation of IoT software maintenance via code analysis and generation. In Proceedings of the 2nd International Multidisciplinary Conference on Computer and Energy Science (SpliTech), Split, Croatia, 12–14 July 2017; pp. 1–6. [Google Scholar]
  28. Larrucea, X.; Combelles, A.; Favaro, J.; Taneja, K. Software engineering for the internet of things. IEEE Softw. 2017, 34, 24–28. [Google Scholar] [CrossRef]
  29. Weyrich, M.; Ebert, C. Reference architectures for the internet of things. IEEE Softw. 2015, 33, 112–116. [Google Scholar] [CrossRef]
  30. Chen, F.; Deng, P.; Wan, J.; Zhang, D.; Vasilakos, A.V.; Rong, X. Data mining for the Internet of Things: Literature review and challenges. Int. J. Distrib. Sen. Netw. 2015, 11, 431047. [Google Scholar] [CrossRef]
  31. Wlodarczak, P.; Ally, M.; Soar, J. Data Mining in IoT: Data Analysis for a New Paradigm on the Internet. In Proceedings of the International Conference on Web Intelligence (WI ‘17), Leipzig, Germany, 23–26 August 2017; Association for Computing Machinery: New York, NY, USA, 2017; pp. 1100–1103. [Google Scholar] [CrossRef]
  32. Che, D.; Safran, M.; Peng, Z. From Big Data to Big Data Mining: Challenges, Issues, and Opportunities. In Database Systems for Advanced Applications, DASFAA; Lecture Notes in Computer Science; Hong, B., Meng, X., Chen, L., Winiwarter, W., Song, W., Eds.; Springer: Berlin/Heidelberg, Germany, 2013; Volume 7827, pp. 1–15. [Google Scholar] [CrossRef]
  33. Reggio, G.; Leotta, M.; Cerioli, M.; Spalazzese, R.; Alkhabbas, F. What are IoT systems for real? An experts’ survey on software engineering aspects. Internet Things 2020, 12, 100313. [Google Scholar] [CrossRef]
  34. Hu, C.; Pu, Y.; Yang, F.; Zhao, R.; Alrawais, A.; Xiang, T. Secure and Efficient Data Collection and Storage of IoT in Smart Ocean. IEEE Internet Things J. 2020, 7, 9980–9994. [Google Scholar] [CrossRef]
  35. Tziortzioti, C.; Amaxilatis, D.; Mavrommati, I.; Chatzigiannakis, I. IoT sensors in sea water environment: Ahoy! Experiences from a short summer trial. Electron. Notes Theor. Comput. Sci. 2019, 343, 117–130. [Google Scholar] [CrossRef]
  36. Subblue. Autonomous Camera, Subblue Scooter, and Remote-Controlled Drones. Available online: https://store.sublue.com (accessed on 10 November 2022).
  37. Navatics Global. Navatics Mito Underwater Drone. Available online: https://www.navatics.com/store-navatics (accessed on 1 January 2019).
  38. Khalil, R.A.; Saeed, N.; Babar, M.I.; Jan, T. Toward the internet of underwater things: Recent developments and future challenges. IEEE Consum. Electron. Mag. 2020, 10, 32–37. [Google Scholar] [CrossRef]
  39. Schmidhuber, J. Deep learning in neural networks: An overview. Neural Netw. 2015, 61, 85–117. [Google Scholar] [CrossRef]
  40. LeCun, Y.; Bengio, Y.; Hinton, G. Deep learning. Nature 2015, 521, 436–444. [Google Scholar] [CrossRef] [PubMed]
  41. Ahmed, E.; Yaqoob, I.; Hashem, I.A.T.; Khan, I.; Ahmed, A.I.A.; Imran, M.; Vasilakos, A.V. The role of big data analytics in Internet of Things. Comput. Netw. 2017, 129, 459–471. [Google Scholar] [CrossRef]
  42. Huang, D.; Zhao, D.; Wei, L.; Wang, Z.; Du, Y. Modeling and analysis in marine big data: Advances and challenges. Math. Probl. Eng. 2015, 2015, 384742. [Google Scholar] [CrossRef]
  43. Bellatreche, L.; Furtado, P.; Mohania, M.K. Guest editorial: A special issue in physical design for big data warehousing and mining. Distrib. Parallel Databases 2016, 34, 289–292. [Google Scholar] [CrossRef]
  44. Demchenko, Y.; de Laat, C.; Membrey, P. Defining architecture components of the Big Data Ecosystem. In Proceedings of the IEEE International Conference on Collaboration Technologies and Systems (CTS), Minneapolis, MN, USA, 19–23 May 2014; pp. 104–112. [Google Scholar] [CrossRef]
  45. Du, Y.; Wang, Z.; Huang, D.; Yu, J. Study of migration model based on the massive marine data hybrid cloud storage. In Proceedings of the IEEE First International Conference on Agro-Geoinformatics, Shanghai, China, 2–4 August 2012; pp. 1–4. [Google Scholar] [CrossRef]
  46. Yang, K.; Jia, X.; Ren, K.; Xie, R.; Huang, L. Enabling efficient access control with dynamic policy updating for big data in the cloud. In Proceedings of the IEEE INFOCOM, Toronto, ON, Canada, 27 April–2 May 2014; pp. 2013–2021. [Google Scholar] [CrossRef]
  47. Qiu, T.; Zhao, Z.; Zhang, T.; Chen, C. Underwater Internet of Things in Smart Ocean: System Architecture and Open Issues. IEEE Trans. Ind. Inform. 2020, 16, 4297–4307. [Google Scholar] [CrossRef]
  48. Halpern, D. Satellites, Oceanography and Society; Elsevier: Amsterdam, The Netherlands, 2000. [Google Scholar]
  49. Osen, O.L.; Wang, H.; Hjelmervik, K.B.; Schoyen, H. Organizing Data from Industrial Internet of Things for Maritime Operations. In Proceedings of the OCEANS 2017, Aberdeen, UK, 19–22 June 2017; pp. 1–5. [Google Scholar] [CrossRef] [Green Version]
  50. Waterston, J.; Rhea, J.; Peterson, S.; Bolick, L.; Ayers, J.; Ellen, J. Ocean of Things: Affordable Maritime Sensors with Scalable Analysis. In Proceedings of the OCEANS 2019, Marseille, France, 17–20 June 2019; pp. 1–6. [Google Scholar] [CrossRef]
  51. Yang, J.; Wang, C.; Zhao, Q.; Jiang, B.; Lv, Z.; Sangaiah, A.K. Marine surveying and mapping system based on Cloud Computing and Internet of Things. Future Gener. Comput. Syst. 2018, 85, 39–50. [Google Scholar] [CrossRef]
  52. Jitkajornwanich, K.; Vateekul, P.; Gupta, U.; Kormongkolkul, T.; Jirakittayakorn, A.; Lawawirojwong, S.; Srisonphan, S. Ocean surface current prediction based on HF radar observations using trajectory-oriented association rule mining. In Proceedings of the 2017 IEEE International Conference on Big Data (Big Data), Boston, MA, USA, 11–14 December 2017; pp. 4293–4300. [Google Scholar] [CrossRef]
  53. Ferreira, J.; Agostinho, C.; Lopes, R.; Chatzikokolakis, K.; Zissis, D.; Vidal, M.-E.; Mouzakitis, S. Maritime data technology landscape and value chain exploiting oceans of data for maritime applications. In Proceedings of the 2017 International Conference on Engineering, Technology and Innovation (ICE/ITMC), Funchal, Portugal, 27–29 June 2017; pp. 1113–1122. [Google Scholar] [CrossRef]
  54. Berlian, M.H.; Sahputra, T.E.R.; Ardi, B.J.W.; Dzatmika, L.W.; Besari, A.R.A.; Sudibyo, R.W.; Sukaridhoto, S. Design and implementation of smart environment monitoring and analytics in real-time system framework based on internet of underwater things and big data. In Proceedings of the 2016 International Electronics Symposium (IES), Denpasar, Indonesia, 29–30 September 2016; pp. 403–408. [Google Scholar] [CrossRef]
  55. Wright, N.G.; Chan, H.K. Low-cost Internet of Things ocean observation. In Proceedings of the OCEANS 2016 MTS/IEEE Monterey, Monterey, CA, USA, 19–23 September 2016; pp. 1–5. [Google Scholar] [CrossRef]
  56. Nain, M.; Goyal, N.; Kumar, M. Machine Learning Effects on Underwater Applications and IoUT. In Machine Learning Paradigm for Internet of Things Applications; Wiley: Hoboken, NJ, USA, 2022; pp. 229–245. [Google Scholar]
  57. Razzaq, A. Source Code on Github. Available online: https://github.com/razzaq786/IoTOcean (accessed on 24 October 2021).
Figure 1. An illustration of IoUT network.
Jmse 11 00368 g001
Figure 2. An overview of UWSN architecture [15].
Jmse 11 00368 g002
Figure 3. Overview of the proposed architectural framework for ocean forecasting system.
Jmse 11 00368 g003
Figure 4. Developing design model flow for IoUT.
Jmse 11 00368 g004
Figure 5. Consumer Electronics Show smart undersea devices.
Jmse 11 00368 g005
Figure 6. In the context of research methodology, an overview.
Jmse 11 00368 g006
Figure 7. A visualized overview of the implementation processes of a proposed architectural framework.
Jmse 11 00368 g007
Figure 8. IoUT proposed architectural framework.
Jmse 11 00368 g008
Figure 9. The algorithms are represented graphically.
Jmse 11 00368 g009
Figure 11. Ocean Data Analytics Case Study: forecasting for multiple locations.
Jmse 11 00368 g011
Figure 12. An overview to determine if the data from the sensors are consistent.
Jmse 11 00368 g012
Figure 13. The time it takes for a query to be processed is based on current and historical data.
Jmse 11 00368 g013
Table 1. Comparison of the proposed framework with existing solutions.
SchemeArchitectural FrameworkReal-Time Data CollectionData AnalysisData Mining and AnalyticsForecasting
Chunqiang Hu [34] **
Chrysanthi Tziortzioti [35] **
Tie Qiu [47]*
Ottar L. Osen [49] **
John Waterston [50] **
Jiachen Yang [51] *
Our Scheme*****
Asterisk ‘*’ presents that This scheme is available in the paper and discussed.
Disclaimer/Publisher’s Note: The statements, opinions and data contained in all publications are solely those of the individual author(s) and contributor(s) and not of MDPI and/or the editor(s). MDPI and/or the editor(s) disclaim responsibility for any injury to people or property resulting from any ideas, methods, instructions or products referred to in the content.

