Article

Simulating How Freshwater Diversions Impact Salinity Regimes in an Estuarine System

1
Department of Biosystems Engineering, Auburn University, Auburn, AL 36849, USA
2
Stennis Space Center, Northern Gulf Institute, Stennis, MS 39529, USA
*
Author to whom correspondence should be addressed.
J. Mar. Sci. Eng. 2023, 11(12), 2349; https://doi.org/10.3390/jmse11122349
Submission received: 3 November 2023 / Revised: 5 December 2023 / Accepted: 7 December 2023 / Published: 13 December 2023
(This article belongs to the Special Issue Advances in the Simulation of Coastal and Ocean Engineering Problems)

Abstract

:
The Bonnet Carré Spillway is a large flood control structure that diverts Mississippi River floodwaters into Lake Pontchartrain and the Mississippi Sound to prevent flooding in southern Louisiana and New Orleans. When operating at full capacity, the Spillway releases water at a rate of 7080 m3/s. Spillway openings regularly last a month or more. The enormous amount of freshwater that is diverted through the Spillway impacts salinity and nutrients in the Mississippi Sound. The objective of this research is to use a hydrodynamic model to simulate the impact of Bonnet Carré Spillway openings on the salinity of the Mississippi Sound over multiple years. Specifically, four hypothetical simulations of Spillway openings are compared to simulations during the same time when the Spillway is closed. The results show by how much, for how long, and where salinity is impacted in the estuarine system. The maximum difference in salinity at any given location over the mapped dates between the non-opening and hypothetical opening scenarios varies between 22 and 30 in each year. Differences in salinity between the opening and non-opening scenarios begin to decline in the study area approximately 18 days after Spillway closure. Decreases in salinity in Lake Borgne persist over a year. The Bonnet Carré Spillway affects salinity mostly in Lake Borgne and along an east/west ribbon that embraces the Mississippi coastline. Decreases in salinity caused by Spillway openings are seen up to 200 km east of the Spillway. These results are important for planning management strategies for estuarine resources during Spillway openings.

1. Introduction

Flooding in large rivers can impact urban, commercial, and agricultural lands and cause dramatic economic impacts. Flood diversion structures move floodwaters from one body of water to another to avoid adverse impacts from flooding. In estuarine systems, freshwater flood diversion structures impact not only flow but also salinity and other water quality parameters critical for estuarine species.
The Bonnet Carré Spillway is a large flood control structure that diverts Mississippi River floodwaters into Lake Pontchartrain and the Mississippi Sound to prevent flooding in southern Louisiana and New Orleans. The Spillway was constructed in the 1930s in response to the Great Mississippi Flood of 1927. The Spillway is located 50 km upstream from New Orleans, on the east bank of the Mississippi River. It is a concrete dike that is 2.3 km long and contains 350 gates. During Spillway openings, Mississippi River water flows into Lake Pontchartrain, which then empties into the Mississippi Sound and the Gulf of Mexico [1]. When operating at full capacity, the Spillway releases water at a rate of 7080 m3/s. Spillway openings regularly last a month or more.
Since 1937, the Spillway has opened 15 times for a total of 609 days [1]. Overall, the Spillway has been open 2% of the time during its 85 years of operation. Recently, the frequency of Spillway openings has increased. Between 2009 and 2020 (and throughout the period of model simulation), the Spillway opened six times for a total of 236 days and was open 6% of the time (Table 1).
To better understand the amount of freshwater that flows through the Spillway during an opening, consider that the volume of Lake Pontchartrain is approximately 6.0 km3. The Bonnet Carré Spillway’s average flow during openings between 2011 and 2020 was 3750 m3/s or 0.37 km3 of water per day. Therefore, on average, the Spillway fills the entire volume of Lake Pontchartrain every 16 days that it is open.
Various studies have shown that Bonnet Carré Spillway openings cause environmental and economic impacts in Lake Pontchartrain and the Mississippi Sound. Armstrong et al. [2] simulated how the two openings in 2019 affected salinity throughout out the Mississippi Sound and Bight. Mize and Demcheck [3] documented increases in nutrients and phytoplankton during a Spillway opening in 2008. Similarly, Bargu et al. [4] showed that an opening in 2008 caused a freshwater plume which increased nitrogen and phosphorous in the system. Sanial et al. [5] used isotopic signatures and salinity in a river mixing model to determine the extent of impact from Spillway openings. Parra et al. [6] demonstrated that the Spillway opening in 2016 resulted in increased biological production in downstream estuarine systems. Parra et al. [6] also showed that environmental conditions such as wind, rainfall, and temperature determine how estuarine salinity and nutrients could be impacted by a Spillway opening. Posadas and Posadas [7] estimated that the Spillway opening in 2011 resulted in USD 46 million lost due to reduced oyster harvests. Gledhill et al. [8] showed that 100% of oysters at native reef sites died following the 2019 Spillway openings. These studies provide important insight into how the Spillway impacts water quality in the downstream estuarine system. However, Spillway openings are massive, variable, and frequent; therefore, more research is needed to better understand the processes and impacts in estuarine systems and plan for improved management strategies. Additionally, Spillway openings have increased in frequency significantly from historical levels, potentially compounding impacts.
In large-scale estuarine systems such as that assessed in the current study, numerical models are useful because they can simulate scenarios such as hypothetical Spillway openings of various times, magnitudes, and lengths. Numerical hydrodynamic models are especially useful because they simulate physical processes to better understand the dynamics and behavior of various systems. Vinogradova et al. [9] utilized the Estuarine and Coastal Ocean Model in the Mississippi Bight to simulate water masses, describe water properties, and simulate areas with freshwater plumes. Model results were compared with measurements, showing overestimations in mixing rates due to delayed meteorological forcing and significant bias in the simulations due to uncertainties in the computation of river discharges. Camacho et al. [10] used a hydrodynamic and water quality model to assess estuarine responses to nutrient load modifications and evaluated the factors affecting phytoplankton productivity in a tributary estuary of the northern Gulf of Mexico. Their results found that nitrogen availability is the main factor affecting phytoplankton productivity. Bazgirkhobb et al. [11] simulated dissolved oxygen dynamics in the Western Mississippi Sound using the Environmental Fluid Dynamics Code (EFDC) and a water quality model (CE-QUAL-ICM). Overall, the model captured seasonal trends and vertical stratification, simulating moderately higher dissolved oxygen compared to the measurements.
The objective of this research is to simulate the impact of Bonnet Carré Spillway openings on the salinity of the Mississippi Sound over multiple years using a hydrodynamic model. Specifically, four hypothetical simulations of Spillway openings are compared to Spillway closing simulations during the same time. The results indicate (1) how much Spillway openings impact salinity, (2) where and how far away salinity is impacted, (3) how long salinity impacts last, and (4) the spatial and temporal variability in those salinity impacts. To our knowledge, this is the first study evaluating the impact of Spillway openings over consecutive years. The findings of this study are critical for understanding how flood operations impact estuarine systems and working toward management strategies to mitigate Spillway opening impact.

2. Materials and Methods
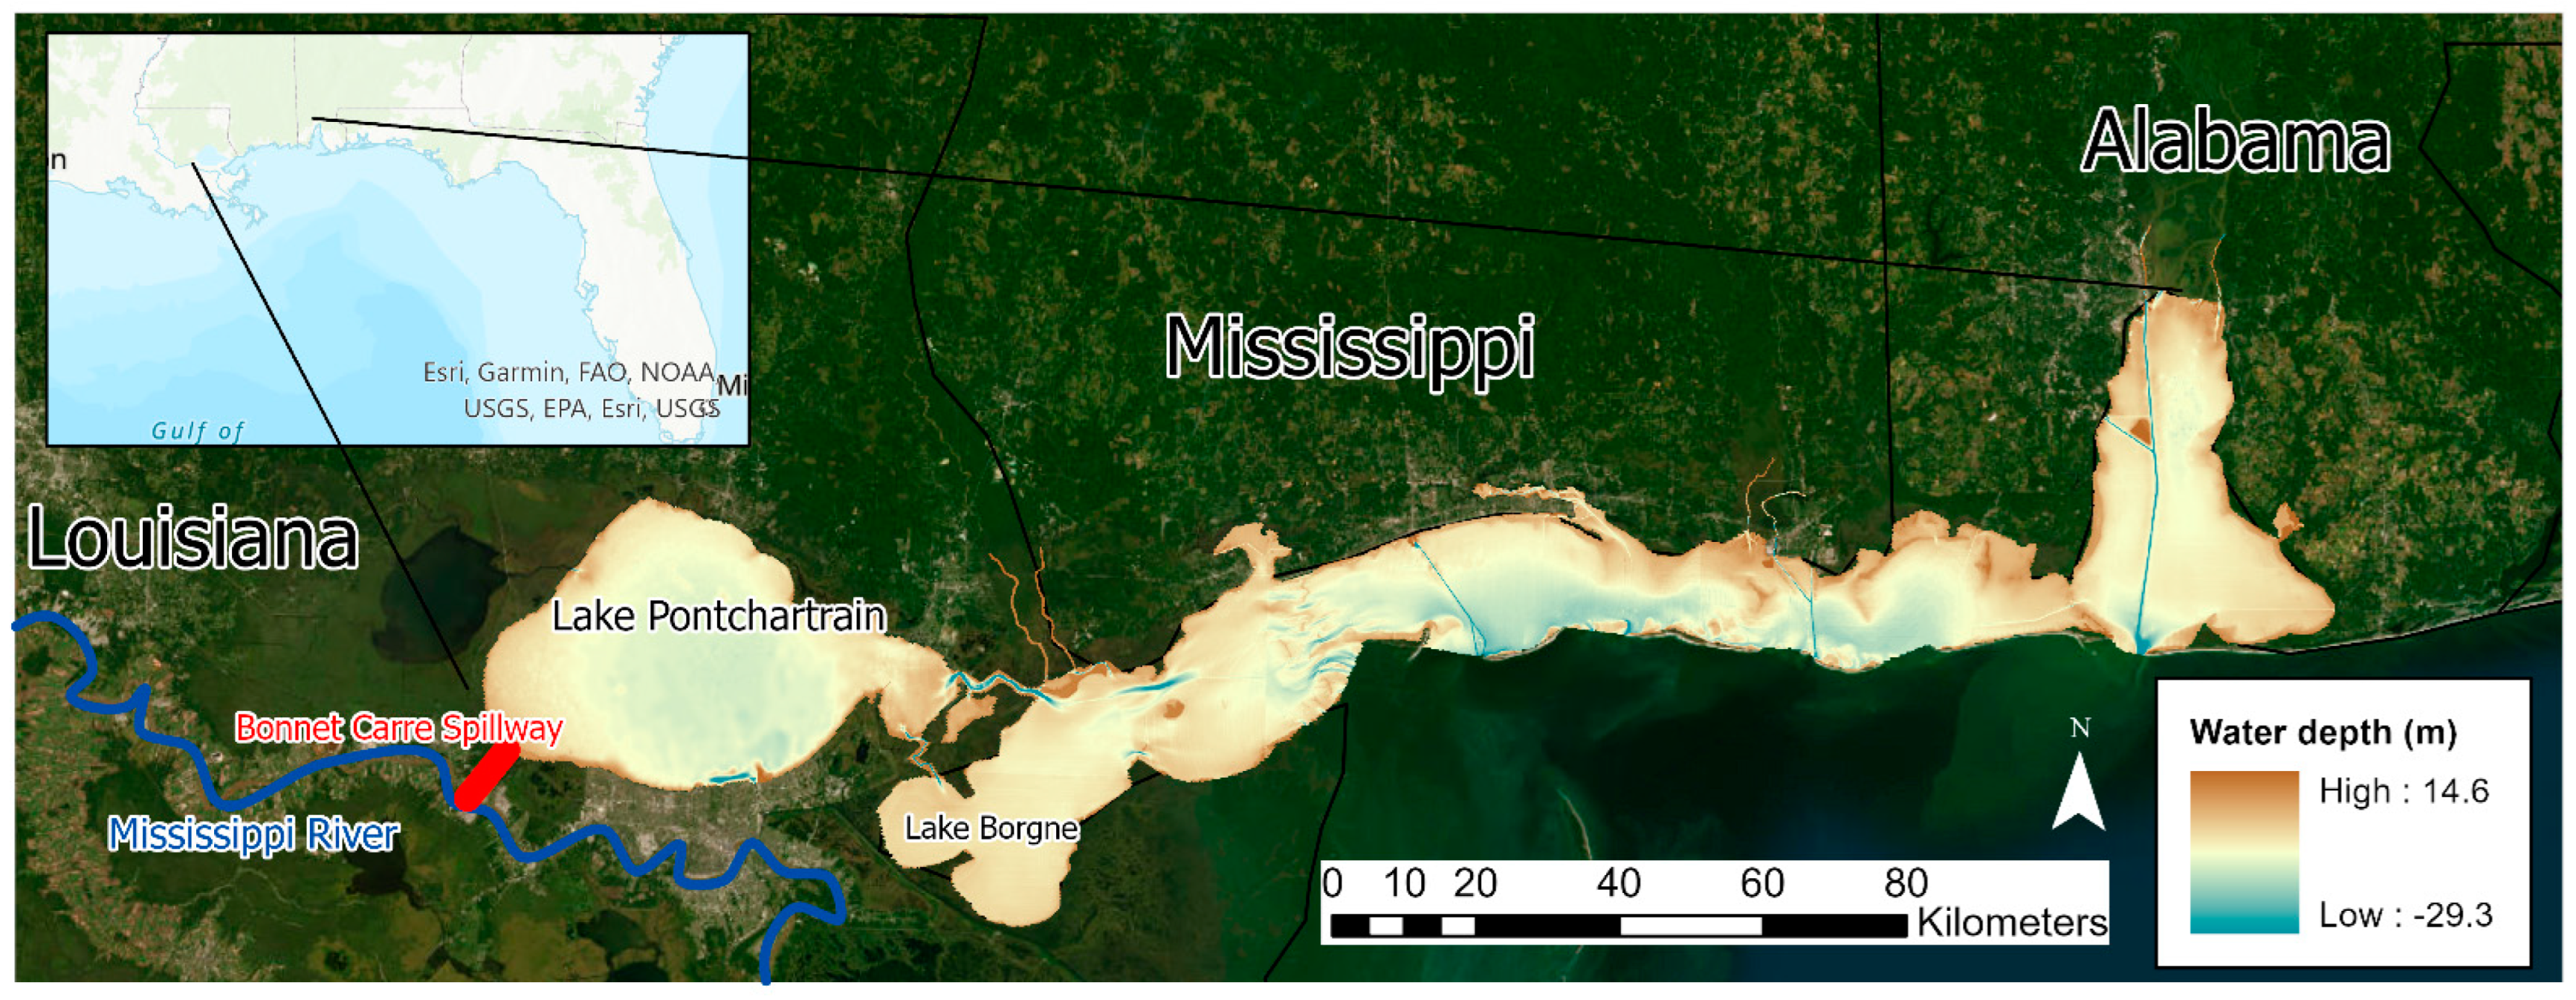
2.1. Study Site

The study area is 5678 km2, located in the northern Gulf of Mexico including Lake Pontchartrain, the Mississippi Sound, and Mobile Bay (Figure 1). The spatial model domain utilized in the current study is an expansion of a previous model domain of the western Mississippi Sound described by Armandei et al. [12]. The model simulated tides, currents, freshwater inflows, salinity, and temperature from 1 January 2009 through 31 December 2020.
Bathymetry was obtained from the Continuously Updated Digital Elevation Model (CUDEM)—Ninth Arc-Second Resolution Bathymetric-Topographic Tiles [13]. The average water depth is 2.7 m, and the maximum depth is 29.3 m (Figure 1).
Figure 1. Study site spatial model domain and bathymetry. The blue line represents the Mississippi River, and the red star shows the location of the Bonnet Carré Spillway.
Jmse 11 02349 g001

2.2. Model Setup

The model is two-dimensional and was built using The Environmental Fluid Dynamics Code (EFDC+) [14,15]. The EFDC+ is a hydrodynamic model used to simulate flow in lakes, rivers, estuarine, and coastal shelf areas. Temperature and salinity modules simulate the impacts of water density on flow. In this study, the mesh is curvilinear, with a total of 70,964 cells including 245 rows and 962 columns (Figure 2). The grid has varying cell sizes. The minimum cell size is 44,623 m2, the average cell size is 79,959 m2, and the maximum cell size is 400,296 m2.
In the study area, tidal exchange with the Gulf of Mexico occurs along the southern boundary and is disrupted by several barrier islands which block flow between the Gulf of Mexico and the Mississippi Sound. Data describing the open boundary conditions for tidal exchange come from 2 USGS gauging stations: Mississippi Sound Near Grand Pass (USGS 300722089150100) and Mississippi Sound at East Ship Island Light (USGS 301527088521500) (Figure 2; ref. [16]). These gauging stations measure water surface elevation, salinity, and temperature every five minutes. For this paper, salinity is reported as g/kg, which is a dimensionless measure. The average salinity at Near Grand Pass is 17, and the average salinity at East Ship Island is 23. Daily fluctuation in water surface elevation due to tides is approximately 0.5 m per day.
Freshwater was input into the study area via 18 discharge points, including (from west to east) the Bonnet Carré Spillway, Amite, Tangipahoa, Tchefuncte, West Pearl River, East Pearl River, Jourdan River, Wolf River, Biloxi River (includes Tuxachanie and Tchoutacabouffa), Bernard Bayou, Old Fort Bayou, West Pascagoula, East Pascagoula, Fowl River, Mobile River 1, Mobile River 2, Fish River, and Magnolia River (Figure 2). Some of these rivers are not gauged and lack measured flow data. Gauged rivers in the study area with discharge data include [16] the following:
  • USGS 02489500 Pearl River near Bogalusa;
  • USGS 02492000 Bogue Chitto River near Bush;
  • USGS 02481510 Wolf River near Landon;
  • USGS 02481000 Biloxi River at Wortham;
  • USGS 02479310 Pascagoula River at Graham Ferry;
  • USGS 02471019 Tensaw River near Mount Vernon;
  • USGS 02471078 Fowl River at Half-Mile Rd near Laurendine;
  • USGS 02378500 Fish River near Silver Hill;
  • Bonnet Carré Spillway [1].
For rivers that lacked discharge data, the nearest river with measured discharge was adjusted using an area weighted approach [17]. The area weighted approach calculates flow from an ungauged watershed using the measured flow from a gauged watershed multiplied by the area of the ungauged watershed divided by the area of the gauged watershed. The area weighted approach was also used to adjust the measured flow where gauge data was measured upstream from the outlet to the model’s spatial domain.
Atmospheric forcings including rainfall, air temperature, and pressure were obtained from the Bay Waveland Yacht Club, MS station, located near Bay St Louis at 30.326 N 89.326 W [18]. Wind forcings, including speed and direction, were obtained from four stations, Gulfport, Slidell, Pascagoula, and Keesler.

2.3. Model Validation

Model calibration and validation is described in detail in Armandei et al. [12]. No parameters were adjusted in this model update beyond the extended spatial and temporal domains. Since the spatial and temporal domains of the model were expanded, a brief validation is presented in this study. The model was validated (Figure 3; ref. [16]) for water surface elevation and salinity at five locations (Figure 2; ref. [16]):
  • USGS 301001089442600 Rigolets at Hwy 90 near Slidell;
  • USGS 301104089253400 Mississippi Sound St Joseph Island Light;
  • USGS 301429089145600 Mississippi Sound Merrill Shell Bank Light;
  • USGS 301912088583300 Mississippi Sound Gulfport Light;
  • USGS 301849088350000 Mississippi Sound Round Island Light.
USGS vertical elevation data are occasionally updated to better reflect the exact sea level. As such, some measured water surface data sets were adjusted as the measured data appeared to be slightly above or below expectations. Validation shows that the model does well simulating water surface elevation but underestimates salinity at most of the gauging stations. Similar results have been found in studies in the same area [2,12].
Figure 3. Model validation comparing measured and modeled water surface elevation (left column) and salinity (right column) at five USGS stations: Rigolets at Hwy 90 near Slidell, St Joseph Island Light, Merrill Shell Bank Light, Gulfport Light, and Round Island Light.
Jmse 11 02349 g003

2.4. Hypothetical Spillway Opening Scenarios

In order to understand the impact of Bonnet Carré Spillway openings on the salinity in the Mississippi Sound, hypothetical Spillway openings were simulated over multiple years. Virtual openings were simulated in 2012, 2013, 2014, and 2015: four consecutive years when there were no actual Spillway openings. The hypothetical scenarios involve a typical Spillway opening (considering all the openings since the first in 1937) that lasts 44 days and is open at a rate of 3750 m3/s. A hypothetical opening begins on 15 March and ends on 27 April each year. The model was run twice, once with no Spillway opening and once with a typical Spillway opening in each year (2012–2015). Simulation results of non-Bonnet Carré Spillway openings versus typical Bonnet Carré Spillway openings are compared in the results section.

3. Results

3.1. Environmental Conditions

Variations in environmental forcing conditions between 2012, 2013, 2014, and 2015 are shown in Figure 4 and Figure 5. Figure 4 shows that the wind conditions during the hypothetical Spillway openings for every year were fairly similar. The most frequent wind speed ranged from 0–10 m/s, and the most frequent wind directions were NW and E. The main freshwater input to the western portion of the Mississippi Sound (when the Spillway is closed) is the Pearl River. Figure 5 shows the flow conditions measured in the USGS 02489500 Pearl River station starting one month before the hypothetical Spillway opened. Overall, Figure 5 shows that flows varied between years. Pearl River flows were high in 2012 and 2013 before (15 February–15 March) and during (15 March–27 April) the hypothetical Spillway opening. In 2014, freshwater flows increased toward the end of the hypothetical opening (26 March–27 April). And in 2015, flows were generally low throughout the entire hypothetical Spillway opening.
As mentioned in the objectives of the current study, the following paragraphs will describe how much the Spillway openings impacts salinity, how long this impact lasts, and where the impacts occur.

3.2. How Much Does the Spillway Impact Salinity?

All of the difference maps (Figure 6, Figure 7, Figure 8 and Figure 9) show that salinity generally decreased during the Spillway openings (Figure 6, Figure 7, Figure 8 and Figure 9, red colors). However, in each simulation, there were some areas where salinity increased (Figure 6, Figure 7, Figure 8 and Figure 9, blue colors). Areas of salinity increasing were generally small, and overall, salinity increases were less than salinity decreases.
The maximum difference in salinity at any given cell over the mapped dates between the non-opening and hypothetical opening scenarios was 22 in 2012, 24 in 2013, 24 in 2014, and 30 in 2015). These results, along with the difference maps, show that the greatest change in salinity occurred in 2015. During 2015, flow from the Pearl River was also the lowest measured proceeding a Spillway opening. However, Pearl River flows increased during the last two weeks of the Spillway opening.

3.3. How Long Do the Salinity Impacts Last?

Differences in salinity between the opening and non-opening scenarios were consistently declining by 15 May in all the years evaluated; 15 May occurs 18 days after the hypothetical Spillway closing (Figure 6, Figure 7, Figure 8 and Figure 9). Differences in salinity were consistently greater between 25 March and 25 April, starting two weeks after the Spillway opening and lasting almost through to the Spillway closing.
In 2012, the difference map for March 15 (time zero on the first day of the Spillway opening; Figure 6) showed that there was no difference in salinity between the non-opening scenario and the hypothetical opening scenario. This is logical because there needs to be some time for the freshwater plume to impact the surrounding waters. However, difference maps for the years 2013, 2014, and 2015 on the first day of the Spillway opening showed differences in salinity (Figure 7, Figure 8 and Figure 9). These salinity differences on the first day of the Spillway opening are residual effects left over from previous years. This phenomenon is especially noticeable in the Lake Borgne area of the western Mississippi Sound. The model showed that decreases in salinity in Lake Borgne lasted more than a year.

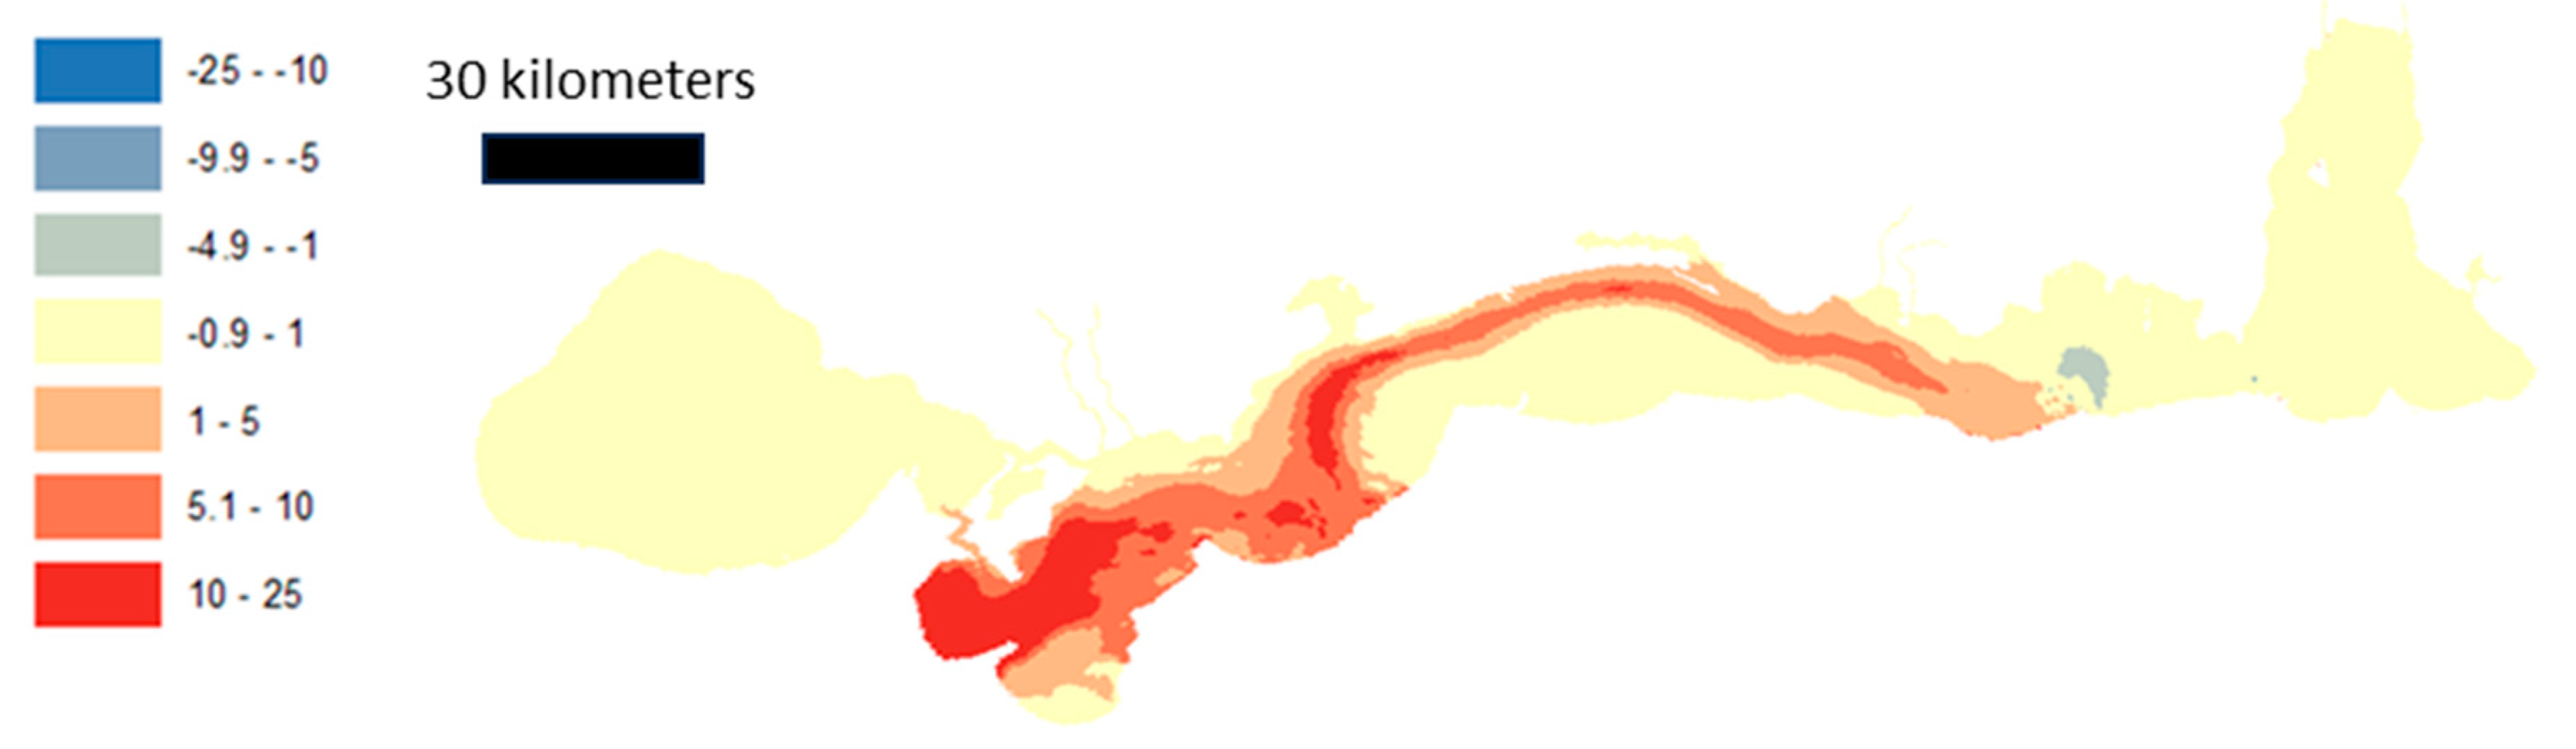
3.4. Where Do the Salinity Impacts Occur?

Figure 10 shows the average difference in salinity between non-opening and opening scenarios over the four years evaluated for the five mapped dates that occurred during the Spillway openings (15 March, 25 March, 5 April, 15 April, and 25 April). Overall, Figure 10 shows that salinity is different between the non-openings and hypothetical openings in two main locations (1) Lake Borgne and (2) a ribbon along the coastline of Mississippi. Decreases in salinity caused by Spillway openings were seen up to 200 km east of the Spillway. Decreases in salinity were fairly negligible east of the Mississippi/Alabama state border.
Average decreases in salinity greater than one between the non-opening and hypothetical opening scenarios covered an area of 1600 km2. In the United States, this is approximately equivalent to the size of the state of Rhode Island. Average decreases in salinity of greater than five covered 830 km2. Average decreases in salinity of greater than 10 covered 300 km2. In the United States, this is approximately equivalent to twice the size of Washington, DC.
Figure 6. Salinity difference maps showing no Spillway opening minus hypothetical Spillway opening for 2012. Negative values (blue) indicate that salinity is higher in the hypothetical Spillway opening scenario. Positive values (red) indicate that salinity is lower in the hypothetical Spillway opening scenario.
Jmse 11 02349 g006
Figure 7. Salinity difference maps showing no Spillway opening minus hypothetical Spillway opening for 2013. Negative values (blue) indicate that salinity is higher in the hypothetical Spillway opening scenario. Positive values (red) indicate that salinity is lower in the hypothetical Spillway opening scenario.
Jmse 11 02349 g007
Figure 8. Salinity difference maps showing no Spillway opening minus hypothetical Spillway opening for 2014. Negative values (blue) indicate that salinity is higher in the hypothetical Spillway opening scenario. Positive values (red) indicate that salinity is lower in the hypothetical Spillway opening scenario.
Jmse 11 02349 g008
Figure 9. Salinity difference maps showing no Spillway opening minus hypothetical Spillway opening for 2015. Negative values (blue) indicate that salinity is higher in the hypothetical Spillway opening scenario. Positive values (red) indicate that salinity is lower in the hypothetical Spillway opening scenario.
Jmse 11 02349 g009
Figure 10. Average difference in salinity (no Spillway opening minus hypothetical Spillway opening) for mapped days (Figure 6, Figure 7, Figure 8 and Figure 9) during the hypothetical Spillway opening (15 March, 25 March, 5 April, 15 April, and 25 April during 2012, 2013, 2014, and 2015).
Jmse 11 02349 g010
Figure 11 shows the location and substrate type of the main Mississippi commercial oyster reefs [19] in relation to the average change in salinity due to openings (from Figure 10). This figure shows that during a typical spillway opening, the oyster reefs are located within the area of moderate-to-high salinity change and experience a decrease in salinity between 0 and 25.
Figure 11. Maps of oyster reef substrate [19] overlaid on average difference in salinity during hypothetical Spillway opening (15 March, 25 March, 5 April, 15 April, and 25 April during 2012, 2013, 2014, and 2015).
Jmse 11 02349 g011
Furthermore, changes in salinity can be overlaid by Linhoss et al.’s [20] oyster habitat suitability model results [20]. Figure 12 shows locations where average oyster habitat suitability is higher than 0.3 overlaid on top of the average difference in salinity due to Spillway openings according to Figure 10. Areas where the change in salinity is low and oyster habitat suitability is high should be targeted for restoration efforts.

4. Discussion

Recent studies have investigated the impact of Bonnet Carré Spillway openings on salinity. In the Mississippi Bight, in a similar but larger study area, Armstrong et al. [2] used a hydrodynamic model to compare the two Spillway openings in 2019 to a hypothetical scenario of no Spillway opening in 2019 in the Mississippi Bight. They found that the greatest impact, on consecutive days when salinity was less than two, occurred in Lake Borgne. The model used in our study provided similar results, showing persistently decreased salinity in Lake Borgne for each of the four years that were simulated. Lake Borgne is a remote area, surrounded by saltmarsh, and has almost no human settlements. As such, observed environmental impacts to Lake Borgne may be underrepresented. However, Lake Borgne supports important recreational and commercial finfish, oyster, and shrimp fisheries [21]. Therefore, more research should be conducted to better understand the long-term impacts on water quality and the ecological aspects of Bonnet Carré Spillway openings on Lake Borgne given that salinity impacts seem to be residual over the years.
Parra et al. [6] used field sampling, remote sensing, and a hydrodynamic model to study the impacts of Bonnet Carré Spillway openings on water quality and plankton populations in the Mississippi Bight. In their study, it was found that Spillway openings resulted in as much as a drop in salinity of 23 in the Mississippi Bight. Parra et at. [6] also showed that Spillway waters flowed out of Lake Pontchartrain after four to five weeks of Spillway opening. These results are also similar to the results obtained in our study, showing that Spillway openings resulted in a maximum salinity drop of 30 and that salinity impacts begin to dissipate two to three weeks after the Spillway closing.
In this study, very little change was observed in Lake Pontchartrain’s salinity. This agrees with the results of Bargu et al. [4], who also observed little changes in Lake Pontchartrain’s salinity measured after a Spillway closing in 2008. Salinity in Lake Pontchartrain generally ranges from two to nine [3,22,23]. Because of these inherently low levels, the Lake’s salinity should not sink much lower without having potential biological and ecological impacts. Regardless, the model underestimated salinity in the Rigolets (Figure 3) and needs to be refined to better understand changes in salinity in Lake Pontchartrain. Armstrong et al.’s [2] model also underrepresented salinity, which points to a systematic error in the existing hydrodynamic models of the study domain.
In addition to impacting salinity, Bonnet Carré Spillway openings also impact water quality in the Mississippi Sound. Water from the Mississippi River is responsible for the Gulf of Mexico’s “dead zone”, which is the second largest area of coastal hypoxia in the world [24]. Diverting this water into Lake Pontchartrain and the Mississippi Sound has caused measurable changes to water quality and biological production [3,4,6]. Future research should apply similar methods to understand how Spillway openings impact nutrients, dissolved oxygen, and algae populations in the Sound.
Mississippi oyster reefs have been highly impacted by the Bonnet Carré Spillway [7,8]. Overlaying the locations of simulated salinity change with oyster reefs shows that existing reefs are located within an area of high-to-moderate salinity change. Furthermore, overlaying the location of simulated salinity change with simulated oyster habitat suitability shows prime locations for restoration. Combined, these results provide useful information for planning oyster reef restoration.

5. Conclusions

This study involved paired modeling simulations in which a validated hydrodynamic model of the Mississippi Sound was used to explore the impact of Bonnet Carré Spillway openings on the salinity of the Mississippi Sound. Simulations of four hypothetical average openings in 2012, 2013, 2014, and 2015 were compared to no-opening simulations during the same years. Each hypothetical Spillway opening began on 15 March of each year, lasted 44 days, and involved a flow rate of 3775 m3/s. Results showed by how much, for how long, and where salinity was impacted. The maximum difference in salinity, at any given cell over the mapped dates between the non-opening and hypothetical opening scenarios, was 30 and occurred in 2015. Differences in salinity between the opening and non-opening scenarios were consistently greater about two weeks after the hypothetical Spillway opening and were constantly declining about 18 days after the hypothetical Spillway closing (Figure 6, Figure 7, Figure 8 and Figure 9). The model also showed that the decreases in salinity in Lake Borgne lasted more than a year. Decreases in salinity are seen up to 200 km east of the Spillway. Average decreases in salinity during the hypothetical openings greater than 10 covered 300 km2. These results agree with recent studies investigating the impact of Spillway openings on the Mississippi Bight. The results from this study are important for planning management strategies for estuarine resources and ecological services during and after Spillway openings.

Author Contributions

Conceptualization, A.L. and P.M.; Methodology, A.L. and R.J.O.; Formal analysis, A.L.; Writing—original draft, A.L.; Writing—review & editing, P.M. and R.J.O.; Funding acquisition, P.M. All authors have read and agreed to the published version of the manuscript.

Funding

This project was funded by the Gulf of Mexico Energy Security Act: GOMESA (Mississippi).

Data Availability Statement

The data presented in this study are available on request from the corresponding author.

Conflicts of Interest

The authors declare no conflict of interest.

References

  1. Adriance, J.; Marx, J.; Bourque, C.; Britt, C. An overview of Louisiana Department of Wildlife and Fisheries data collected in the vicinity of Lake Pontchartrain and Lake Borgne from 2004 to 2017, as related to the MRGO Rock Dam closure in 2009. Mar. Fish. Sect. Tech. Rept. Bat. Rouge LA USA 2018, 31. [Google Scholar]
  2. Armandei, M.; Linhoss, A.C.; Camacho, R.A. Hydrodynamic modeling of the Western Mississippi Sound using a linked model system. Reg. Stud. Mar. Sci. 2021, 44, 101685. [Google Scholar] [CrossRef]
  3. Armstrong, B.N.; Cambazoglu, M.K.; Wiggert, J.D. Modeling the impact of the 2019 Bonnet Carré Spillway opening and local river flooding on the Mississippi Sound. In Proceedings of the OCEANS 2021: San Diego–Porto (IEEE), San Diego, CA, USA, 20–23 September 2021; pp. 1–7. [Google Scholar]
  4. Bargu, S.; White, J.R.; Li, C.; Czubakowski, J.; Fulweiler, R.W. Effects of freshwater input on nutrient loading, phytoplankton biomass, and cyanotoxin production in an oligohaline estuarine lake. Hydrobiologia 2011, 661, 377–389. [Google Scholar] [CrossRef]
  5. Bazgirkhoob, H.; Linhoss, A.; Armandei, M. A Numerical Tool for Dissolved Oxygen Simulation in the Western Mississippi Sound. J. Coast. Res. 2022, 38, 699–711. [Google Scholar] [CrossRef]
  6. Camacho, R.A.; Martin, J.L.; Watson, B.; Paul, M.J.; Zheng, L.; Stribling, J.B. Modeling the Factors Controlling Phytoplankton in the St. Louis Bay Estuary, Mississippi and Evaluating Estuarine Responses to Nutrient Load Modifications. J. Environ. Eng. 2015, 141, 4014067. [Google Scholar] [CrossRef]
  7. Dynamic Solutions Ltd. EFDC+ Theory and Documentation. 2022. Available online: https://www.eemodelingsystem.com/wp-content/Download/Documentation/EFDC_Theory_Document_Ver_10.2_2020.05.21.pdf (accessed on 1 November 2023).
  8. Dynamic Solutions Ltd. EFDC Open-Source Code. 2022. Available online: https://github.com/dsi-llc/EFDCPlus (accessed on 1 November 2023).
  9. Gledhill, J.H.; Barnett, A.F.; Slattery, M.; Willett, K.L.; Easson, G.L.; Otts, S.S.; Gochfeld, D.J. Mass Mortality of the Eastern Oyster Crassostrea virginica in the Western Mississippi Sound Following Unprecedented Mississippi River Flooding in 2019. J. Shellfish Res. 2020, 39, 235–244. [Google Scholar] [CrossRef]
  10. Li, C.; Walker, N.; Hou, A.; Georgiou, I.; Roberts, H.; Laws, E.; McCorquodale, J.A.; Weeks, E.; Li, X.; Crochet, J. Circular plumes in Lake Pontchartrain estuary under wind straining. Estuar. Coast. Shelf Sci. 2008, 80, 161–172. [Google Scholar] [CrossRef]
  11. Linhoss, A.; Mickle, P. A Field Validated Model of Temporal Variability in Oyster Habitat Suitability. Front. Mar. Sci. 2022, 9, 778936. [Google Scholar] [CrossRef]
  12. McCorquodale, J.A.; Roblin, R.J.; Georgiou, I.Y.; Haralampides, K.A. Salinity, nutrient, and sediment dynamics in the Pontchartrain Estuary. J. Coast. Res. 2009, 10054, 71–87. [Google Scholar] [CrossRef]
  13. Mize, S.V.; Demcheck, D.K. Water quality and phytoplankton communities in Lake Pontchartrain during and after the Bonnet Carré Spillway opening, April to October 2008, in Louisiana, USA. Geo-Marine Lett. 2009, 29, 431–440. [Google Scholar] [CrossRef]
  14. MS Department of Marine Resources. Baseline mapping data produced in support of the benthic habitat mapping component of the Oyster Restoration and Management Project in the Mississippi Sound, USA. 2017. [Google Scholar]
  15. NOAA. Bay Waveland Yacht Club, MS. 2022. Available online: https://tidesandcurrents.noaa.gov/stationhome.html?id=8747437 (accessed on 5 May 2022).
  16. NOAA. Continuously Updated Digital Elevation Model (CUDEM)—Ninth Arc-Second Resolution Bathymetric-Topographic Tiles. 2022. Available online: https://coast.noaa.gov/htdata/raster2/elevation/NCEI_ninth_Topobathy_2014_8483/ (accessed on 5 May 2022).
  17. Parra, S.M.; Sanial, V.; Boyette, A.D.; Cambazoglu, M.K.; Soto, I.M.; Greer, A.T.; Chiaverano, L.M.; Hoover, A.; Dinniman, M.S. Bonnet Carré Spillway freshwater transport and corresponding biochemical properties in the Mississippi Bight. Cont. Shelf Res. 2020, 199, 104114. [Google Scholar] [CrossRef]
  18. Posadas, B.C.; Posadas, B.K.A. Economic impacts of the opening of the Bonnet Carre Spillway to the Mississippi oyster fishery. J. Food Distrib. Res. 2017, 48, 42–45. [Google Scholar]
  19. Rabalais, N.N.; Turner, R.E.; Wiseman, W.J., Jr. Gulf of Mexico hypoxia, aka “The dead zone”. Annu. Rev. Ecol. Syst. 2002, 33, 235–263. [Google Scholar] [CrossRef]
  20. Reed, S.; Johnson, D.; Sweeney, T. Application and national geographic information system database to support two-year flood and threshold runoff estimates. J. Hydro. Eng. 2002, 7, 209–219. [Google Scholar] [CrossRef]
  21. Sanial, V.; Shiller, A.M.; Joung, D.; Ho, P. Extent of Mississippi River water in the Mississippi Bight and Louisiana Shelf based on water isotopes. Estuar. Coast. Shelf Sci. 2019, 226, 106196. [Google Scholar] [CrossRef]
  22. US Army Corps of Engineers. Spillway Operation Information. 2022. Available online: https://www.mvn.usace.army.mil/Missions/Mississippi-River-Flood-Control/Bonnet-Carre-Spillway-Overview/Spillway-Operation-Information/ (accessed on 11 November 2022).
  23. USGS. USGS Current Water Data for the Nation. 2022. Available online: https://waterdata.usgs.gov/nwis/rt (accessed on 5 May 2022).
  24. Vinogradova, N.; Vinogradov, S.; Nechaev, D.; Kamenkovich, V.; Blumberg, A.F.; Ahsan, Q.; Li, H. Evaluation of the Northern Gulf of Mexico Littoral Initiative Model Based on the Observed Temperature and Salinity in the Mississippi Bight. Mar. Technol. Soc. J. 2005, 39, 25–38. [Google Scholar] [CrossRef]
Figure 2. Study site mesh, location of freshwater inflows, tidal gauges, and calibration locations.
Jmse 11 02349 g002
Figure 4. Wind roses from Gulfport measurements showing winds during hypothetical Spillway openings (15 March through 27 April for the years 2012, 2013, 2014, and 2015).
Jmse 11 02349 g004
Figure 5. Flow measured from the USGS 02489500 Pearl River station near Bogalusa for 15 February (one month before the hypothetical Spillway opening) through 27 April (hypothetical Spillway closing) for the years 2012, 2013, 2014, and 2015.
Jmse 11 02349 g005
Figure 12. Maps of simulated oyster habitat suitability in blue [20] overlaid on average difference in salinity during hypothetical Spillway opening (15 March, 25 March, 5 April, 15 April, and 25 April during 2012, 2013, 2014, and 2015).
Jmse 11 02349 g012
Table 1. Bonnet Carré Spillway openings between 2009 and 2020 [1].
Date OpenDays OpenAverage Discharge (m3/s)
9 May 2011435891
10 January 2016223646
8 March 2018223035
27 February 2019424017
10 May 2019793418
3 April 2020281645
Disclaimer/Publisher’s Note: The statements, opinions and data contained in all publications are solely those of the individual author(s) and contributor(s) and not of MDPI and/or the editor(s). MDPI and/or the editor(s) disclaim responsibility for any injury to people or property resulting from any ideas, methods, instructions or products referred to in the content.

