Article

Ship Behavior Pattern Analysis Based on Graph Theory: A Case Study in Tianjin Port

1
School of Navigation, Wuhan University of Technology, Wuhan 430063, China
2
Hainan Institute, Wuhan University of Technology, Sanya 572025, China
3
Hubei Key Laboratory of Inland Shipping Technology, Wuhan 430063, China
*
Author to whom correspondence should be addressed.
J. Mar. Sci. Eng. 2023, 11(12), 2227; https://doi.org/10.3390/jmse11122227
Submission received: 28 October 2023 / Revised: 19 November 2023 / Accepted: 22 November 2023 / Published: 24 November 2023

Abstract

:
With the rapid development of the global economy and trade, the number of ships serving ports in China is increasing continuously. Port traffic is becoming busier, and ship behavior is more complex and changeable. The analysis of ship behavior patterns in port waters has become an urgent problem to improve the efficiency and safety of port areas. In this paper, through the full integration of ship trajectory and port geographic information, the behavior chain of a single ship across the whole process of entering and exiting the port is identified. The traffic complexities and dynamics can be further analyzed by grouping the movement patterns of large ships. Based on graph theory, the port areas can be described as a transportation network in which functional areas are nodes and fairways between different areas are edges. The traffic can be analyzed through the network structure characteristics, such as node degree, node weight, and edge weight, and by their similarities and differences. This methodology provides a quantitative analysis for exploring the behavior patterns of large ships as well as the various traffic complexities. A case study in Tianjin Port has been conducted to verify the proposed model. The results show that it can accurately analyze a ship behavior’s regularity, occasion, and correlation. It provides a theoretical reference for the port to schedule and formulate emergency plans.

1. Introduction

The port is designed for ships to sail, moor, load, and unload shipping cargo. Ship behavior and patterns are critical for formulating traffic scheduling strategies and for reducing hidden risks in port areas. How to accurately model ship behavior has become an urgent problem that needs to be solved. AIS data includes static information (MMSI, Draft, etc.) and dynamic information (such as latitude and longitude, speed, etc.), which is an important data source for ship behavior research [1,2,3,4]. However, it cannot accurately answer questions such as entry location, time of channel entry, anchorage and waiting time, and berthing time, although AIS can measure wait and stop time [5].
Nautical charts contain geographical information such as Vessel Traffic Services (VTS) report line position, anchorage position, channel position, coastline position, berth position, etc. The integration of ship trajectories with port geographic information can well support ship behavior mining, including the location and time of ships arriving at and departing from ports, entering and exiting channels and anchorages, and berthing and unberthing, etc.
Single-ship behavior pattern mining analysis is employed for all the ship movements in port areas. Then, port-oriented patterns driven by grouping the patterns of large ships are obtained through behavior similarity measurement and comprehensive analysis. This is significant for port safety management, efficiency evaluation, and intelligent dispatching.
Research on ship behavior can be categorized into two principal domains.
The first category involves research on ship behavior recognition. Contemporary methodology for ship behavior recognition can be categorized into four subdomains: recognition grounded in semantic models, video data-driven method, AIS data-driven approach, and based on the fusion of multisource data. The semantic model can well support modeling part of the ship behavior chain inside ports, such as one or more of berthing, sailing into functional zones, and navigating inside crossing areas [6,7,8]. Using AIS data for ship behavior recognition is probably the most popular approach because AIS data are easier to obtain and contain rich information [9]. The ongoing refinement of video surveillance infrastructure in maritime navigation areas enables its utilization in ship behavior recognition [10]. In contrast to the preceding three methods, ship behavior recognition based on multi-source data fusion exhibits superior accuracy. However, its implementation necessitates more extensive data support and advanced technological capabilities [11], especially for the fine-grained modeling of spatial–temporal ship behavior.
The second category is the study of ship behavior patterns. Currently, research on ship behavior law primarily falls within the domains of clustering, prediction, and traffic flow analyses. Conducting clustering analysis on ship behavior within a specific region enables the delineation of ship behavior patterns. Based on the identified ship behavior patterns, further recognition of abnormal behaviors can be achieved [12,13]. The commonly employed approaches for predicting ship behavior include trajectory analysis [14] and machine learning [15]. Traffic flow serves as a reflection of the collective behavioral patterns and characteristics exhibited by ships within a specific region. Research on traffic flow primarily entails the analysis of the inherent patterns in a given area [16] and subsequent predictions based on these observed patterns [17]. Current studies mostly focus on detecting the statistical correlations between ship navigation characteristics. It is worth studying the comprehensive modeling changes, similarities, and differences in ship behavior, along with ship–environment interaction under complex traffic networks. Moreover, these studies have challenges in realizing the identification and analysis of occasional ship behavior, as well as the entire voyage for an individual ship. These can be fulfilled through a combination of graph theory and spatial–temporal ship behavior modeling.
A port is mainly composed of functional zones such as VTS, fairways, and anchorage. It can be an abstracted port-scale network and has strong flow characteristics derived from the navigation, loading, and unloading of ships. Complex networks serve as abstract methods for comprehending complex systems in the real world. They can be used to analyze the complexity [18] and robustness [19] of the shipping network. Graph theory forms the foundation for the study of complex networks, as nearly all real-world complex networks can be represented using graphs [20]. Graph theory can be applied to layout [21] and scheduling problems [22,23]. Moreover, the utilization of graphs is possible in route planning [24,25] and analysis of transportation networks [26,27,28]. However, the application of graph theory for the analysis of regularities and correlations of ship behavior in port areas has been underexplored in the existing literature.
Through the analysis of the current status of related research, it can be seen that current research on ship behavior analysis within specific regions often neglects the mutual influence among ship behaviors in different zones. It often gives priority to the analysis of network structural characteristics [29,30] while ignoring the actual scenarios of each node and edge in the network. Considering these research gaps, this paper proposes a ship behavior analysis model in port waters based on graph theory to realize full modeling and analysis of port traffic. This model not only enables an analysis of the structural characteristics of port-scale traffic networks but also accurately identifies incidental ship behaviors. Furthermore, it can analyze the behavior of the entire journey for ships serving in the port, thereby assessing the interrelationships among ship behaviors. It provides valuable insights into intelligent scheduling and safety management.

2. Methodology

The whole process for the analysis of ship behavior patterns is shown in Figure 1. The main steps are as follows.(1) AIS data preprocessing: Decoding the AIS original data and eliminating abnormal data. (2) Digitization of geographical information: The geographical information of a port, including spatial location information such as port areas, anchorages, channels, berths, etc., has been formulated. (3) Distinguishing ship status: The status of the ship entering and leaving the port is analyzed based on matching ship positions and geographic information of the port. This status includes the position and time for the ship entering and leaving the port area, channel, anchorage, berth, etc. (4) Analyzing ship behavior pattern: The port can be represented as a complex network based on its functional areas, and the ship moves across the port areas. The similarity and spatiotemporal differences in ship behavior chains for various groups of ships are calculated to realize region-oriented ship behavior pattern modeling.

2.1. AIS Data Preprocessing

AIS data always has errors and omissions during transmission due to unavoidable external interference. AIS data preprocessing is needed and mainly consists of abnormal data deletion and missing data repair. The abnormal AIS data can be exceptional at speed and locations. It will be deleted if the speed (taken from the AIS data field) is greater than 50 kn, the longitude is not within the interval [−180°, 180°], or the latitude is not within the interval [−90°, 90°]. the missing trajectory between consecutive points of the same ship will be repaired by cubic spline interpolation [27].

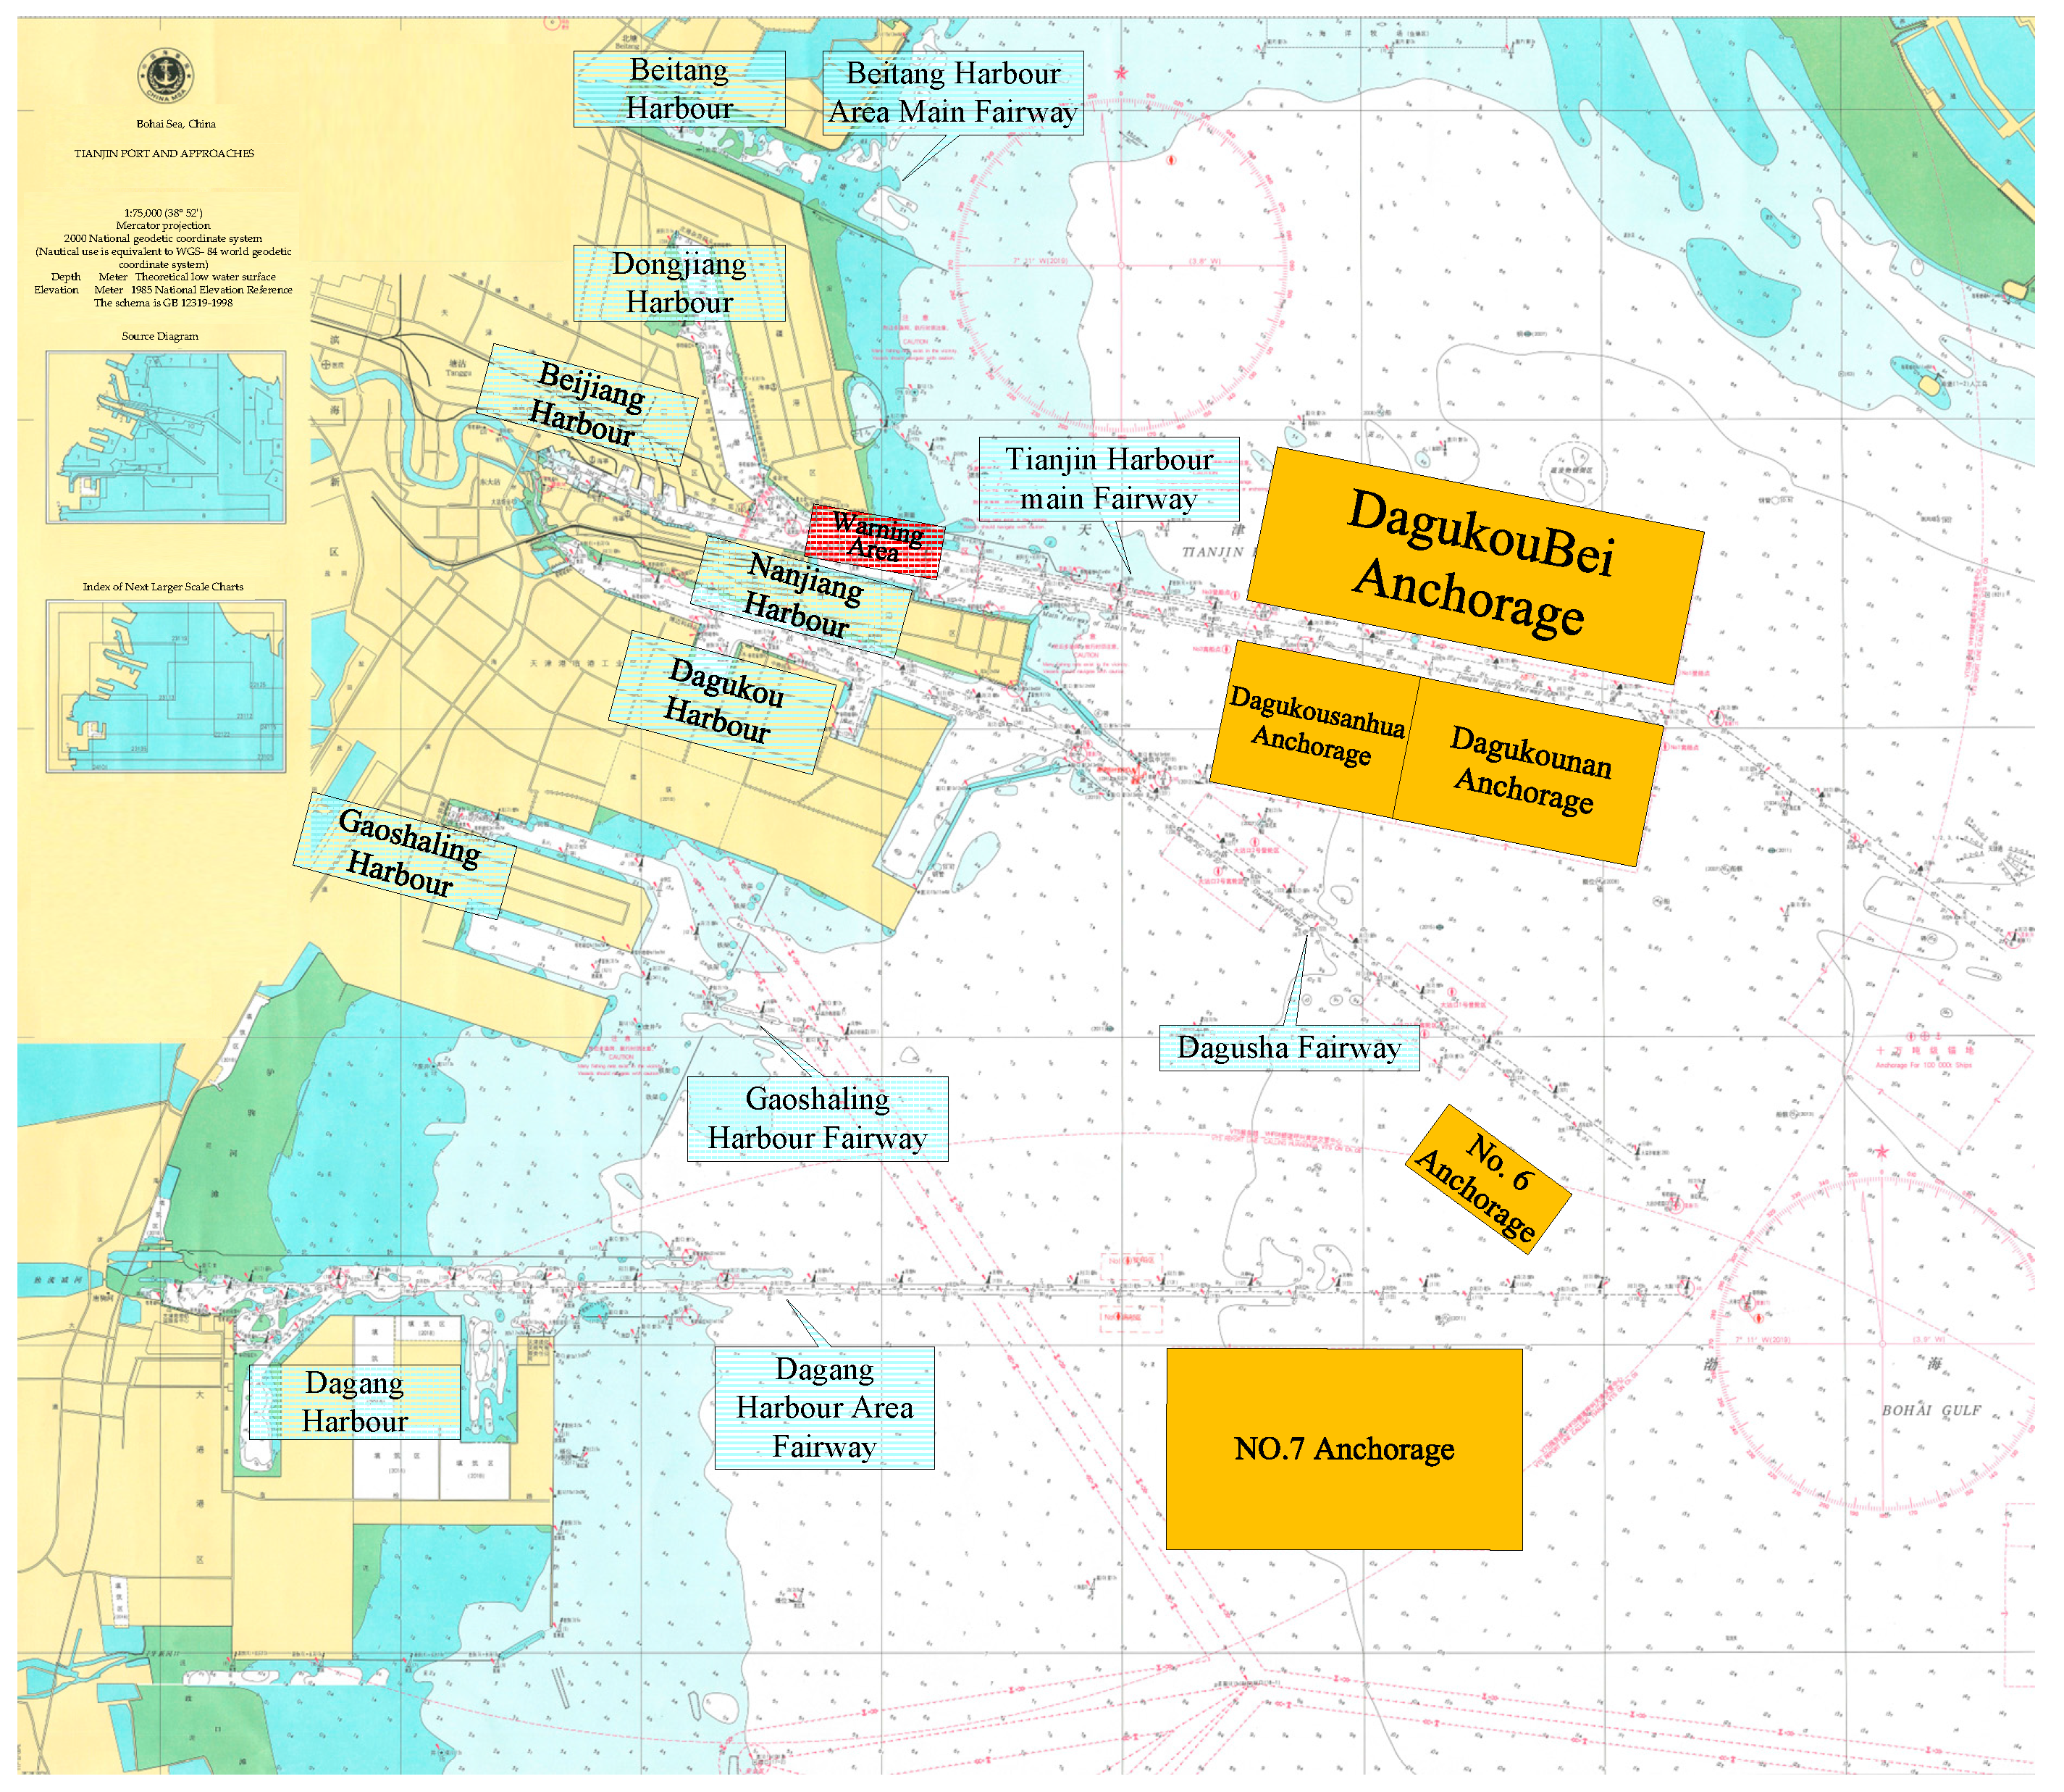
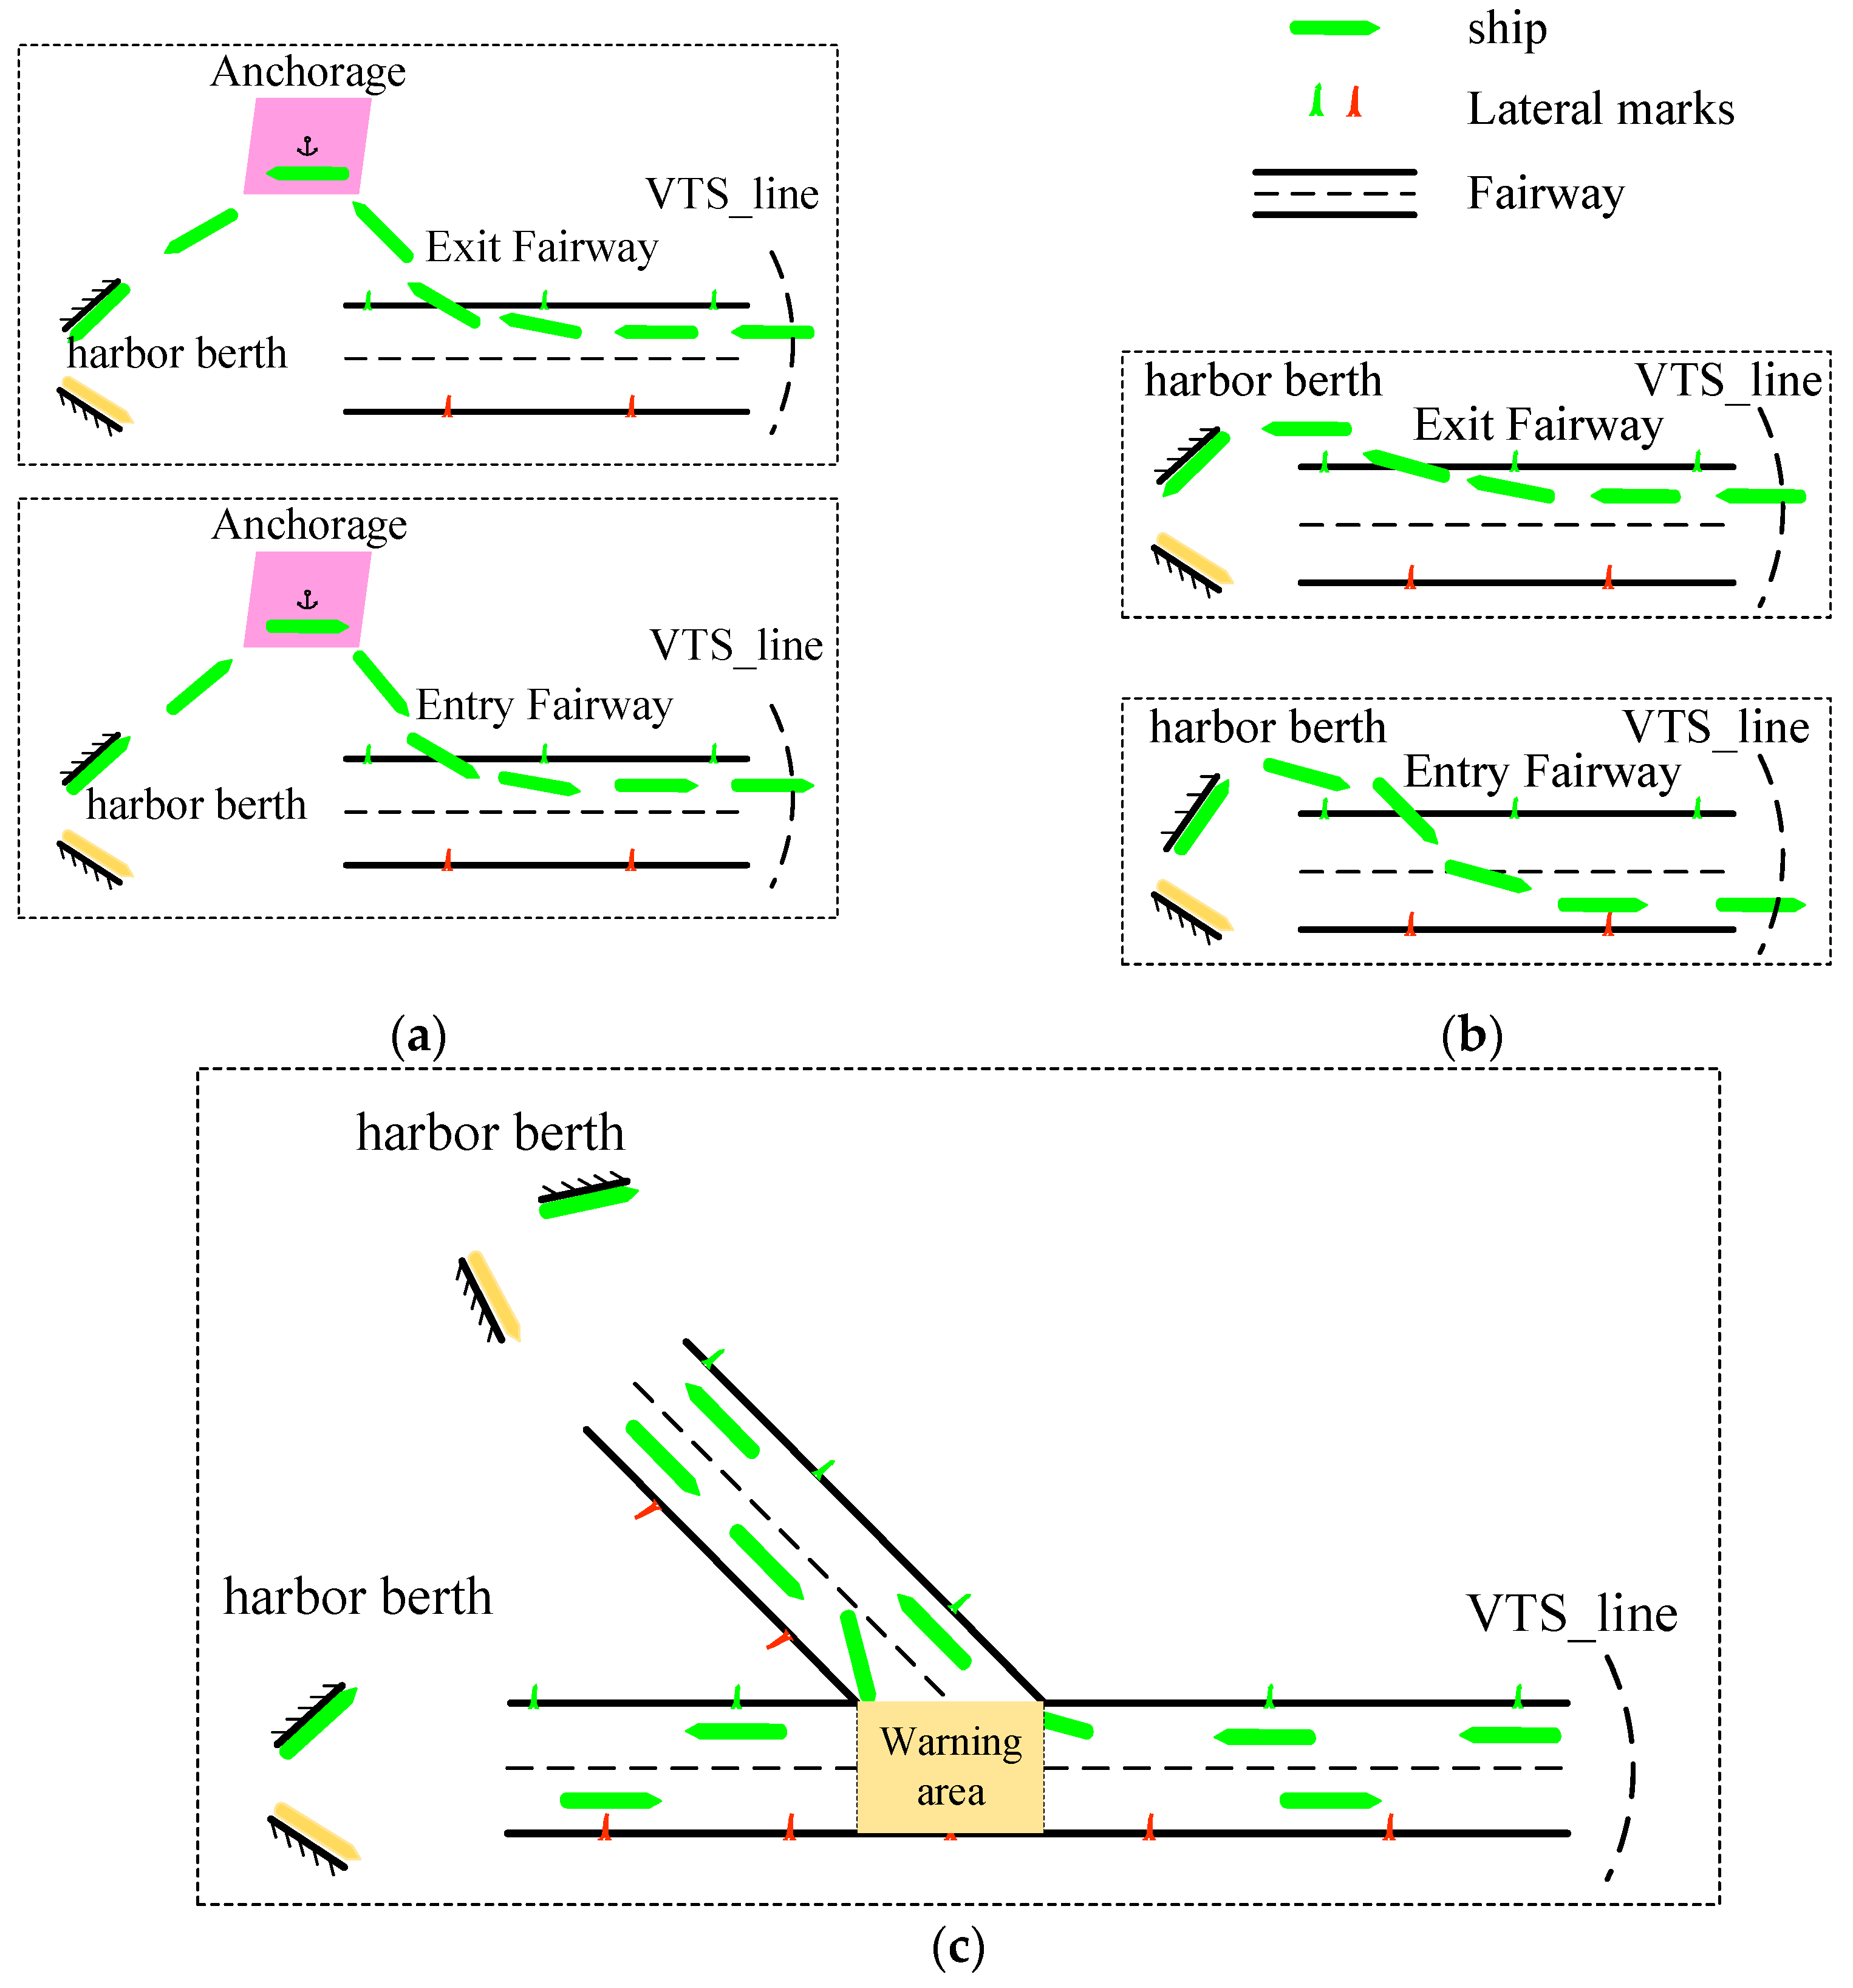
2.2. Port Geographical Information Representation

Port geographic information includes VTS lines, anchorages, fairways, berths, shorelines, etc. Anchorages and fairways can be represented as polygons by connecting shape feature points. The shoreline can be described by the geometric line segments connecting shape feature points due to its irregular curve characteristics. The berth can be identified through topological analysis guided by its general location on the shoreline. The water areas of the port can be determined according to the port coastlines and VTS lines.
The detailed geographical information of port areas can be defined as Equation (1).
A n c h o r a g e : A n c h o r a g e { A n c h o r a g e _ n a m e , P o i n t _ L i s t } F a i r w a y : F a i r w a y { F a i r w a y _ n a m e , P o i n t _ L i s t } H a r b o u r : H a r b o u r { H a r b o u r _ n a m e , P o i n t _ L i s t } C o s t l i n e : C o s t l i n e { C o s t l i n e _ n a m e , P o i n t _ L i s t } V T S _ l i n e ( C i r c l e ) : V T S { r C i r c l e , ( x c e n , y c e n ) } V T S _ l i n e ( R e c t a n g l e ) : V T S { P o i n t _ L i s t }
where A n c h o r a g e _ n a m e is the name of the anchorage; F a i r w a y _ n a m e represents the name of the Fairway; H a r b o u r _ n a m e is the name of the harbor; r C i r c l e is the radius of VTS reporting line; ( x c e n , y c e n ) illustrates the center point of VTS line; and P o i n t _ L i s t includes the point ID, longitude, and latitude matrixes of shape feature control points.

2.3. Identification of Ship Behavior

Ship behavior in port areas specifically includes anchorage anchoring, channel navigation, navigation in other waters, anchoring in other waters, and berthing and departing. This paper makes full use of geographical information and AIS data to identify and judge ship behavior in port areas.
To judge where the ship is, the latitude and longitude of the ship and the geographic information of the port areas should be combined for analysis. The vector cross-product method is used to judge whether the ship is in the geographical regions defined by polygons, as shown in Equation (2), where ( x , y ) represents the latitude and longitude of the trajectory point for a ship and P o i n t _ L i s t = { ( x 1 , y 1 ) , ( x 2 , y 2 ) , , ( x n , y n ) } represents the longitude and latitude matrix for the control points of defined polygons. The ship is inside the polygonal area when d 1 d 2 d n > 0 .
d 1 d 2   d i   d n ,   d i = ( y i y ) ( x i + 1 x ) ( y i + 1 y ) ( x i x )
For a circular area, when the distance between the ship location ( x , y ) and the center point ( x c e n , y c e n ) of the circle is smaller than the radius, r C i r c l e , as shown in (3), the ship is inside the circular area.
( x x c e n ) 2 + ( y y c e n ) 2 < r 2 C i r c l e
The location can only be used to judge where the ship is. The speed of the ship should be further employed to identify the ship navigation status. The speed threshold to identify whether the ship is moving is 0.5 kn [31] in the anchorage and 0 kn in the harbor, channel, and other areas. The ship behavior can be described as shown in Table 1.

2.4. Ship Behavior Graph Construction

Ship behavior graph construction contains single and group pattern analysis. Based on the definition of a single-ship behavior, the trajectories for each ship and their connection with geographical information are analyzed to reveal the single-ship behavior pattern. After that, the similarities and differences analysis in the behavior patterns for various ships can be applied to groups to map the regional behavior of multiple ships. According to the structure and attributes of the behavior graph, a comprehensive model for analyzing multi-ship behavior in port areas can be built.
According to the graph of multi-ship behavior, the node set can be represented as V = { v 1 , v 2 , , v n } and the edge set can be described as E = { e v i , v j | v i , v j V } . The node set, V , is the collection of functional areas in port areas, such as channels, ports, anchorages, etc. The edge set, E, consists of the fairways between different functional areas, which can be determined based on the actual trajectories of ships and geographical information. G = ( V , E ) can be employed to illustrate the network structure of port traffic based on the multi-ship behavior graphs at different time scales.

2.5. Network Structure Characteristics

This paper constructs monthly G = ( V , E ) and then analyzes the network structure characteristics based on the number of nodes, number of edges, node degree, weights of edges, and network connectivity.
Number of nodes. The nodes are composed of functional areas in port areas. The greater the number of nodes, the richer the functional structure of the port.
Number of edges. The edges reflect the accessibility and connectivity between port functional areas. The continual existence of the edge in the monthly G = ( V , E ) indicates that the connected functional areas frequently provide services for ships. The greater the number of edges, the better the connectivity between the functional areas in the port areas.
Node degree and weight. Node degree refers to the number of edges connected to a node, reflecting the importance of the node. The larger the degree of the node, the more important it is in the entire port transportation network. The average stay time of ships (denoted as t s , unit: hours/ship) and the cumulative number of stays (denoted as n s , Unit: ships/month) can be the weight ( W e i g h t ( v ) ) of each node ( v ). The staying time of ships can be obtained by computing the time interval between the timestamp at the beginning of the stay state and the timestamp at the end of the stay state.
W e i g h t ( v ) = n s t s ,   t s = 1 n s t i n s
where 1 n s t i represents the cumulative sum of the time of ships staying in the functional areas (hours/month) and n s represents the number of ships staying in the functional areas (ships/month).
Edge weight. Taking the average sailing time of ships (recorded as t m , unit: hours/ship) and the cumulative number of ships (recorded as n m , unit: ships/month) as the weight ( W e i g h t ( e ) ) of edge. The sailing time of ships can be obtained by computing the time interval between the timestamp at the beginning of the sailing state and the timestamp at the end of the sailing state.
W e i g h t ( e ) = n m t m ,   t m = 1 n m t i n m
where 1 n m t i is the cumulative value of the time required for the voyage (hours/month) and n m represents the number of ships sailing along the edge (ships/month).
Network connectivity. The connectivity of the network refers to the connection density between the various nodes, which is mainly calculated as follows [32]:
σ = 2 E N 2
where σ represents the network connectivity, E represents the number of edges, and N represents the number of nodes.

3. Results

3.1. Research Area and Experimental Data

This research focuses on Tianjin Port as the selected water area for the case study and utilizes the 2021 AIS data of Tianjin Port as the experimental data.
According to geographical information, Tianjin Port includes Beijiang Harbor, Nanjiang Harbor, Dongjiang Harbor, Dagukou Harbor, Dagang Harbor, Gaoshaling Harbor, and Beitang Harbor. The anchorages consist of Dagukoubei Anchorage, Dagukousanhua Anchorage, Dagukounan Anchorage, No. 6 Anchorage, and No. 7 Anchorage. The fairways include Beitang Harbor Fairway, Dagusha Fairway, Gaoshaling Harbor Fairway, Dagang Harbor Fairway, and Tianjin Port Main Fairway. The warning area is located at the intersection areas for ships entering and leaving the Dongjiang Harbor and Beijiang Harbor. The Tianjin Port VTS line is a circle with a radius of 20 nautical miles with a centered point (38°58′31.47″ N, 117°47’12.46″ E). The mathematical and geometric expression equations s of Tianjin Port’s geographical information are provided in Equations (7) to (11), while the geographical distribution is illustrated in Figure 2.
Equation (9) displays the mathematical expression for the Dagukoubei Anchorage.
A n c h o r a g e d a g u k o u b e i , 117.97 E 38.99 N 118 . 12 E 38.97 N 118 . 11 E 38.92 N 117 . 96 E 38.95 N
Equation (10) illustrates the mathematical expression for the warning area:
F a i r w a y guard   zone , ( 117 . 79 E , 38 . 96 N )
Equation (11) illustrates the mathematical expression for the Dong-Jiang Port Area:
B erth d o n g j i a n g , 117.73 E 39.05 N 117 . 78 E 38.98 N 117 . 81 E 38 . 97 N 117 . 82 E 38.98 N 117 . 77 E 39.07 N
Equation (12) presents the mathematical equation for the coastline:
C o s t l i n e 117.63 E 38.66 N 117.65 E 38.67 N 118.16 E 39.17 N 118.14 E 39.16 N
Equation (13) displays the mathematical representation of the VTS line:
V T S { 20 n m i l e , ( 117.787 E , 38.975 N ) }
The visualization of ship trajectories in Tianjin Port in 2021 is presented in Figure 3. It illustrates the density and complexity of ship trajectories within port areas and can also reflect the busy traffic at Tianjin Port to a certain extent. However, a single trajectory cannot provide enough information to model ship behavior or analyze the differential impacts of factors such as busy traffic, environmental conditions, and crossing fairways on ship behavior.

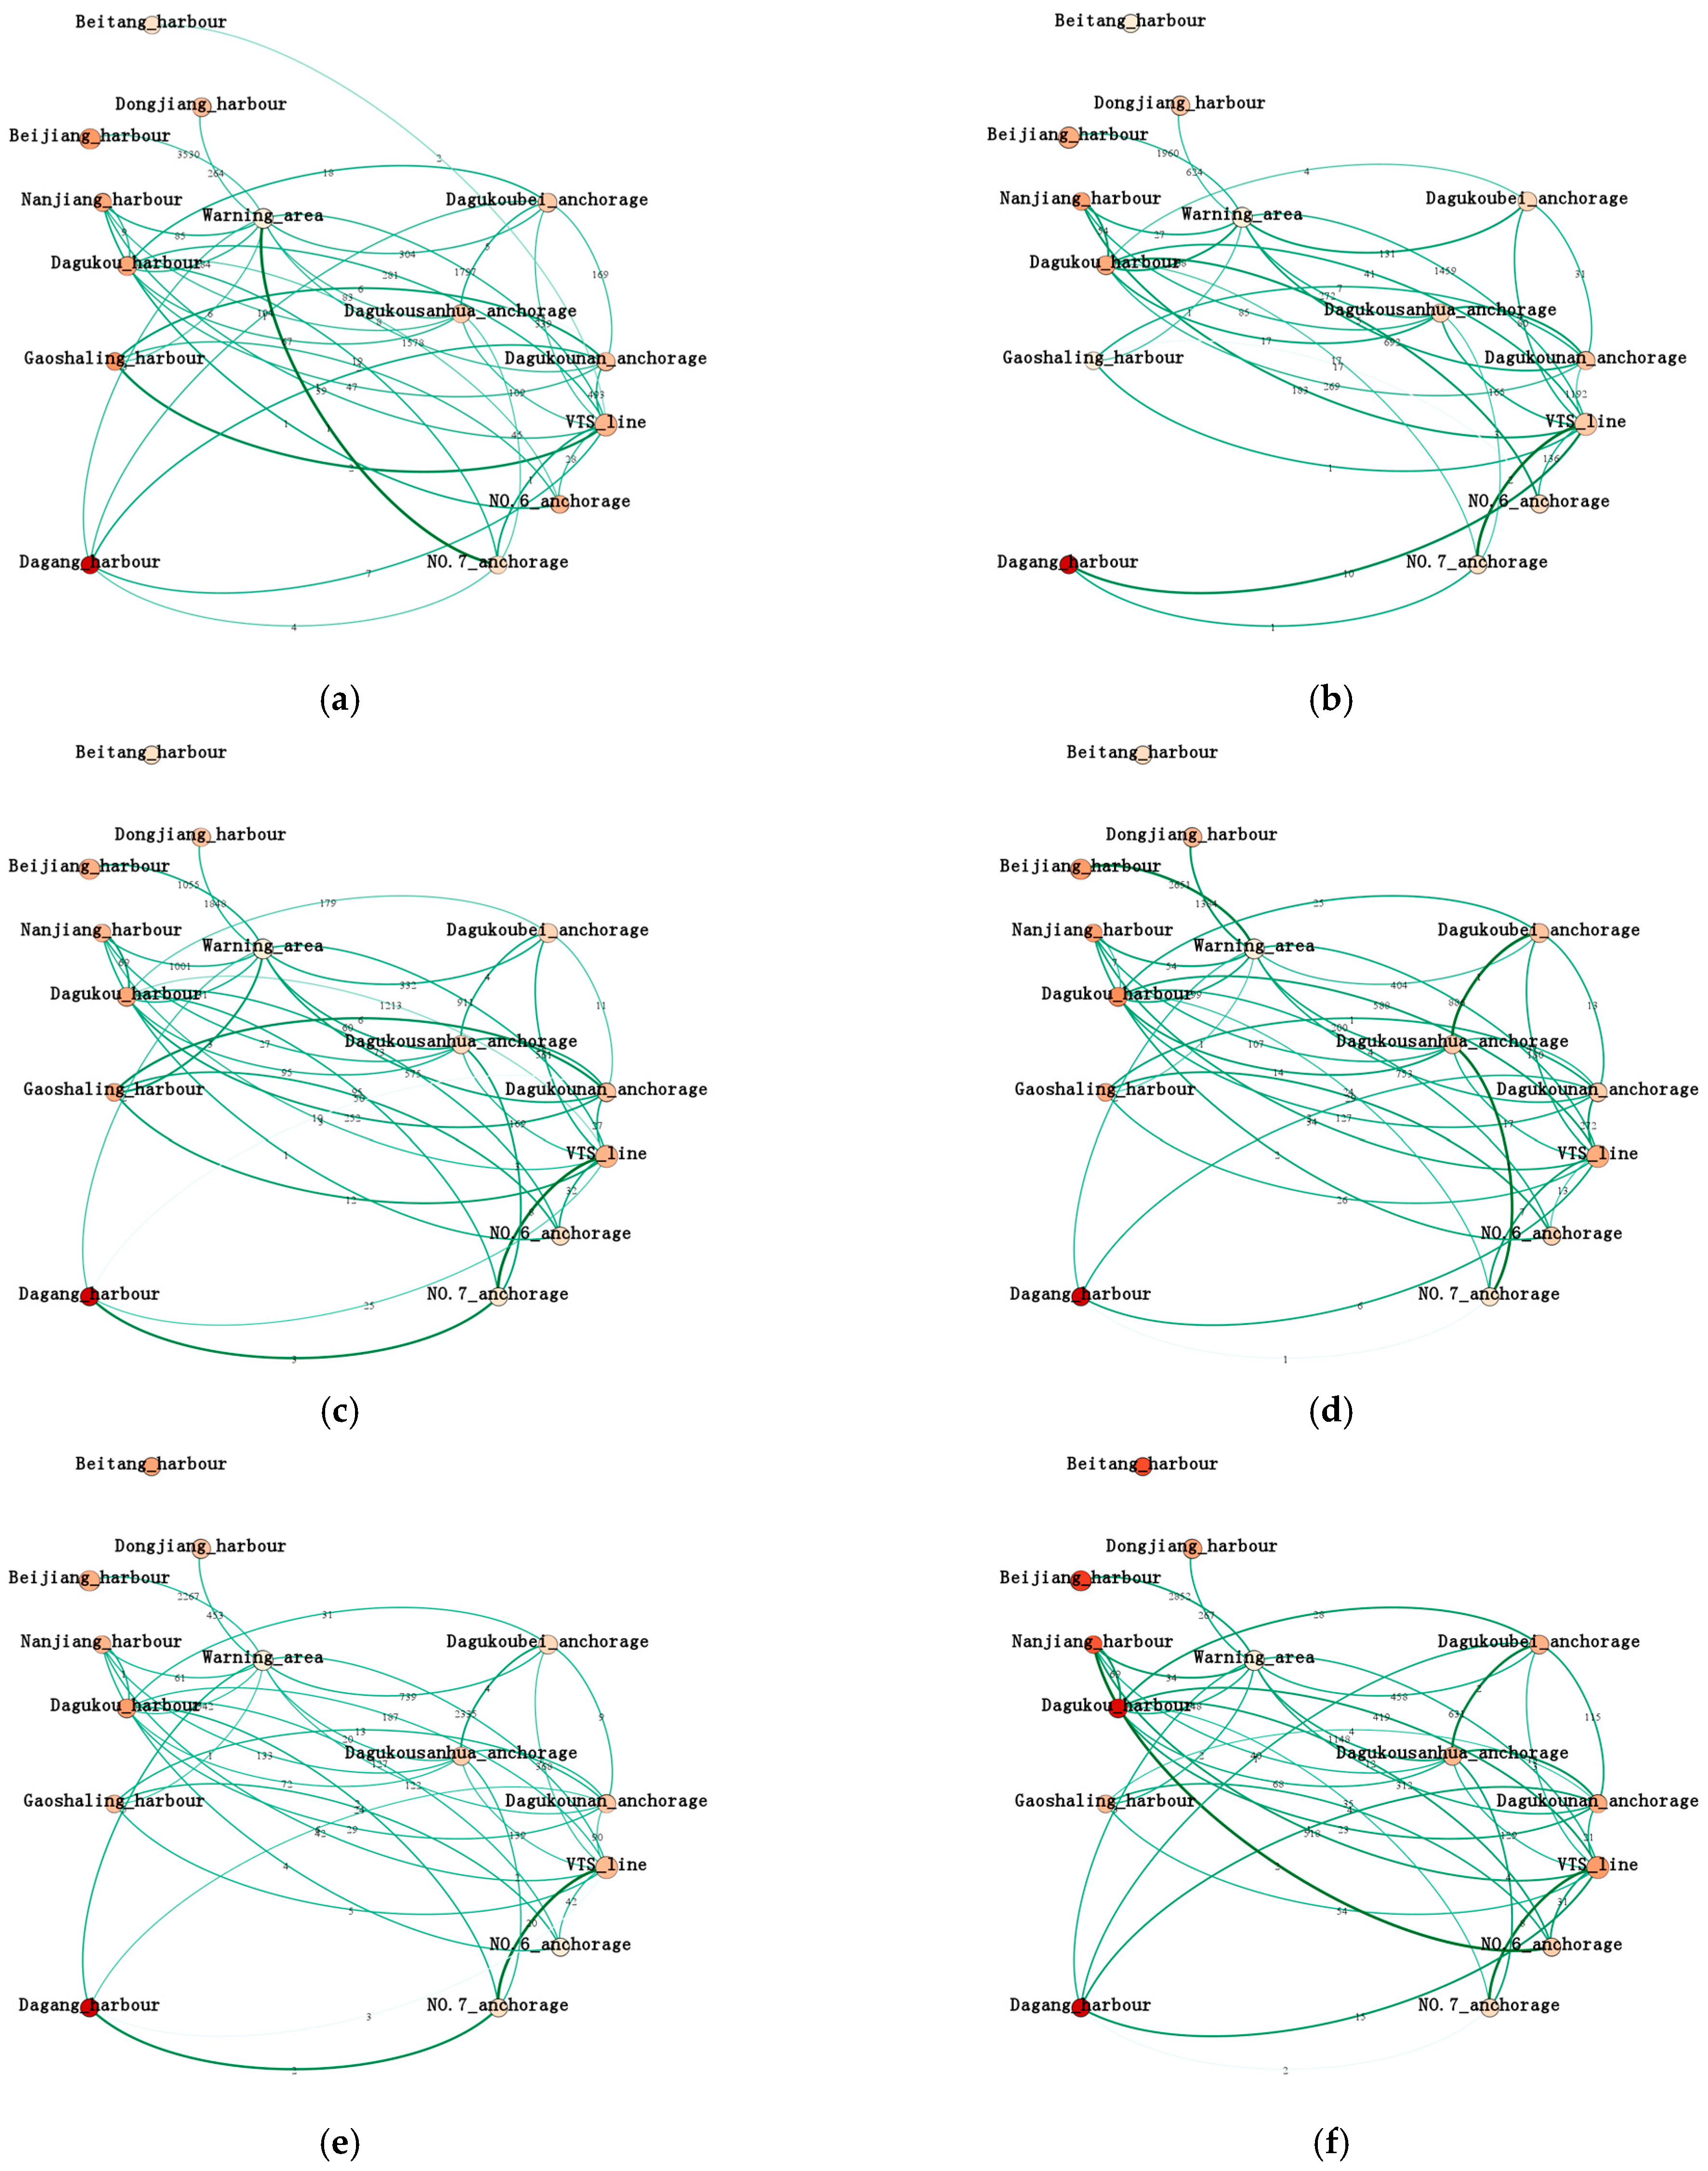
3.2. Behavior Patterns in Tianjin Port

After analyzing the ship trajectories in Tianjin Port, the behavior model of a single ship is illustrated in Figure 4. It can provide details for where and when a ship moves, crosses a VTS line, enters or leaves the fairway, arrives and departs the anchorage area, and berths and unberths, along with the navigation characteristics. The behavior patterns in Tianjin Port are analyzed by grouping the single-ship behavior.
The behavior patterns for multiple ships in Tianjin Port are based on the analysis of each ship behavior and then grouping them. There are three modes after grouping analysis, including direct entry and exit, pattern with waiting at anchorage, and entry and exit via an intersecting fairway, as illustrated in Figure 5.

3.3. Network Structure Analysis

The monthly transport network structures are analyzed based on the changing weight of nodes and edges, as shown in Figure 6. The average staying time of ships in each node is differentiated by the color of the nodes, and the total number of staying ships that each node is determined by the size of the node. The weights of the edge include the cumulative number of ships and average sailing time, which are illustrated by the number close to the edge and its color, respectively. Figure 6 illustrates the traffic network diagram of Tianjin Port from January to December, respectively, and the edges with zero weight are not shown. Through the month-on-month analysis, the frequent edges and the changes in their weights are investigated. The majority of the edges are maintained across the 12 months, which indicates that a busy operation status in Tianjin port is usual. Some occasional edges can also be observed; for example, a fairway close to Beitang that is not used by ships during February and June.
According to edge weights, the average sailing time and the total number of ships vary month-on-month. For instance, the edge connected with VTS and No. 7 Anchorage has a darker color in March than in April, suggesting that ships generally spent more sailing time between VTS and No. 7 Anchorage in March. The weights of the same node vary at different months. For instance, the color of the node representing Gaoshaling Harbor in May is lighter than in July, suggesting that ships spend a longer average staying time in July. The navigational behavior of ships in the Tian-jin Port is varied and complicated, as revealed by the characteristics of nodes and edges. For instance, the No. 7 Anchorage typically provides services for the ships with an arrival destination of the Dagang Harbor, but it is observed that only 17 ships anchored in February. The fairway Dagukou Bulk and No. 7 anchorages were used only by fifteen ships in October. It is obvious that there are occasional ship behaviors in addition to the typical frequent patterns.

3.3.1. Node Weight Characteristics

This section primarily analyzes the node characteristics in the Tianjin Port from the average ship staying time and the total number of staying ships, as shown in Figure 7 (In the figure, the color of the cylinders closer to red indicates a higher value, and the color closer to green indicates a lower value.). For a given time interval, the operating efficiency of a node is negatively correlated with the average time that ships spend there. The total number of staying ships to some extent is positively related to the busy level of the node. In the first and third quarters, more ships were staying at different nodes than in the second and fourth quarters. Compared with other harbors, the Beijiang, Dongjiang, and Dagukou harbors are busier. Ships are staying, on average, a longer time in the third and fourth quarters than in the first and second in Tianjin Port. The longest average ship berthing times are found in the Dagang and Dagukou harbors, and the shortest average ship berthing times are found in Dongjiang and Beitang harbors compared with the others.
From the month-on-month analysis, there are also some variations in the ship behavior patterns at each node across different quarters. For instance, compared to Dagukoubei and Dagukousanhua anchorages, the average anchoring time of ships in each month of the first quarter was noticeably longer in Dagukounan Anchorage. The average anchoring time of ships in Dagukounan Anchorage during the second quarter was the longest in May and the shortest in April. There was a subtle difference between Dagukounan Anchorage and Dagukoubei Anchorage regarding the average anchoring time of ships in June. The third quarter showed that the average anchoring time in July was close among these three anchorages; in August and September the Dagukounan Anchorage had a much longer anchoring time duration than the other two anchorages. The average anchoring time in Dagukounan Anchorage was somewhat longer in October and November of the fourth quarter than it was in the other two anchorages, and it was closer to the anchoring time in Dagukousanhua Anchorage in December.

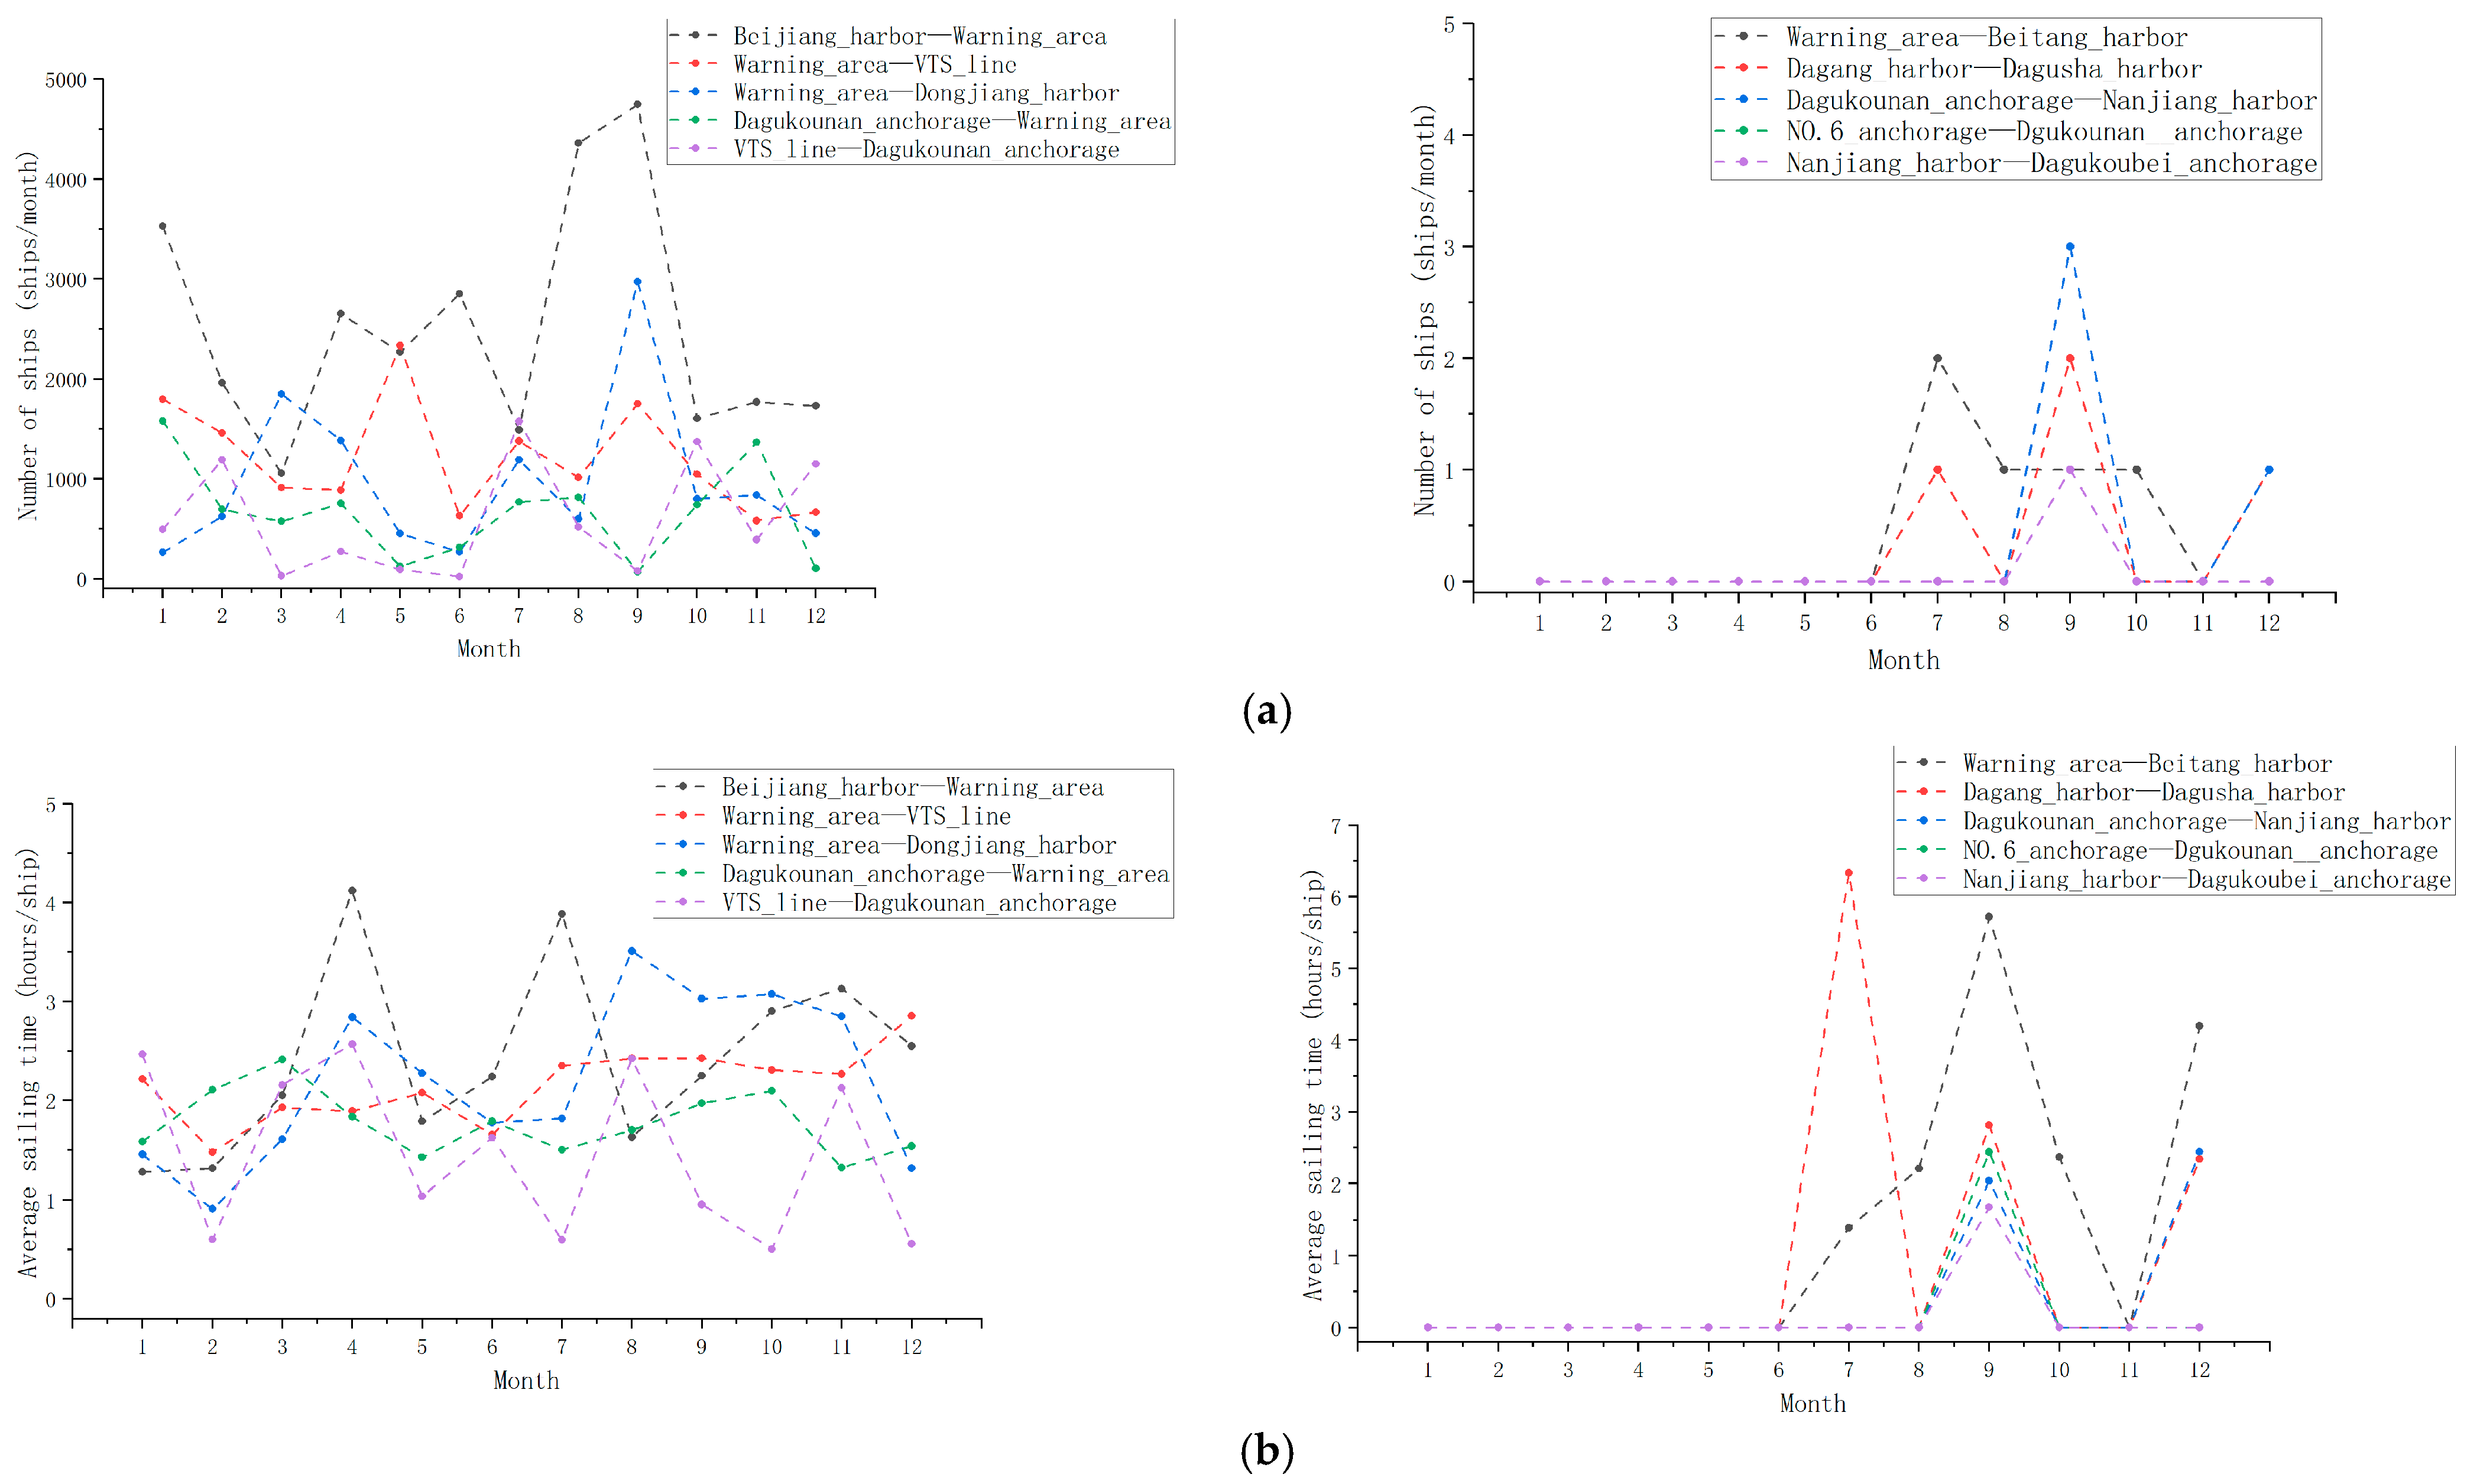
3.3.2. Edge Weights Analysis

The traffic flow on the edge is denser at a given time interval if the cumulative number of ships sailing on an edge is higher, and the traffic is more congested if the average sailing time is longer. This study performs visualization processing and analysis. Due to the large number of edges in the traffic network, only the five edges with the largest number of ships and the five edges with the smallest number of ships are shown here, as illustrated in Figure 8. It can be observed that, for a given edge, the number of navigating ships generally exhibits an inverse relationship with the average sailing time. This phenomenon suggests that an elongation in the sailing time along a particular edge leads to congestion, resulting in a decline in navigational efficiency. The most discernible manifestation of this trend is the reduction in the monthly number of navigating ships with the extension of the average sailing time. In addition, it is not difficult to find in Figure 8 that there are edges in the port traffic network that are not often selected by ships.
On the whole, for most edges, the number of ships in the first and third quarters was higher than in the second and fourth quarters, and the number of ships on the edge “Beijiang Harbor–Warning Area” is the largest, followed by the edge “Warning Area–VTS”. This implies that the sailing behavior of ships along these edges is regular and frequent. However, some edges have only a small number of ships sailing, such as “Nanjiang Harbor–Dagukoubei Anchorage” and “No. 6 Anchorage–Dagukounan Anchorage”. This indicates that the sailing behavior on these edges is sporadic, maybe with annually less than ten times the amount of ships. Ships can always sail from node to node within 3 h, but there are occasional cases where that ship has longer sailing time. For instance, there is only one ship that sailed on the edge "Dagukousanhua Anchorage–Dagukoubei Anchorage" in April, but it took 4.5 h to finish the journey. This case demonstrates that there is some contingent behavior in port areas.
There are variations between ship behaviors on each edge under the month-on-month analysis for each quarter. For example, for the edge “VTS–Nanjiang Harbor”, the number of ships on this edge in February is more than in January and March in the first quarter; during the second quarter, the number of ships in June is over five hundred, but it is not more than forty in April and May; in the third quarter, the number of ships in July and August is closed, and less than the number in September; and in the third quarter, the number of ships was approximately equal.

3.3.3. Frequent Patterns Analysis

There are always similarities, differences, and correlations between the behavior patterns of ships in port areas that may to some extent be related to the fixed traffic resources, including anchorages, berths, channels, and harbors. The shared traffic resources and various traffic situations lead to similarities and differences in ship behavior. It should be noted that the similarities and differences are relative rather than absolute because they are analyzed from different perspectives.
Similarity analysis. The ships that enter and leave the port through the same nodes and edges have the same behavior graph, and this implies a high similarity of ship behavior patterns. Some ships have shared nodes and edges in their behavior graphs, which illustrates the similarity that exists in their behavior patterns. Clustering and summarizing methods can be applied to extract the regional behavior patterns in Tianjin port based on the similarity analysis of the behavior patterns. For instance, it can be found that there are two frequent behavior patterns in entering Dagang Harbor: one is via VTS directly and the other is via VTS and No. 7 Anchorage successively. Specifically, if the behavior of two ships satisfies the following equation, the behavior patterns are similar (assume that the behavior graph of the two ships is G = (V, E) and G’ = (V’, E’)).
V = V , E = E
where G and G’ represent the behavior graph of two individual ships, respectively, and E and E’ represent the set of edges; the set of nodes and the set of edges has been defined in Section 2.4.
Difference analysis. The differences can be derived from the behavior patterns connected with different nodes and edges and the various weights along the same pattern. Comparative analysis can be used to analyze the difference between the structures and weights of behavior graphs. For instance, the behavior patterns entering the port include directly through VTS and Dgukounan Anchorage in turn. The edge “VTS–Dagang Harbor” has different weights where the average sailing times are 2.58 h per ship in January and 3.17 h per ship in February. Specifically, if the behavior of two ships cannot satisfy Equation (12) or satisfies Equation (12) but does not satisfy the following equation, there are differences between the behavior patterns of them.
w e i g h t ( v ) = w e i g h t ( v ) , w e i g h t ( e ) = w e i g h t ( e )
where v and v’ represent the nodes and e and e’ represent the edges.
Correlation analysis. In general, the correlation between two nodes that are connected by an edge is stronger than the others. As shown in Figure 9, the connected Dagukou Harbor and Dagukounan Harbor have similar trends for the monthly cumulative number of staying ships, which implies that there is a certain correlation between the two nodes. The number of ships staying at these two nodes is similar to the trend of the number of ships at this adjacent edge. It should be noted that one node always connects multiple edges, which leads to subtle differences in the weights of two nodes and their connected edges. Specifically, if node v and node v’ satisfy the following equation, there is a correlation between them.
e v , v , w e i g h t ( e v , v ) 0
where ev,v represents the edge between node v and node v’.

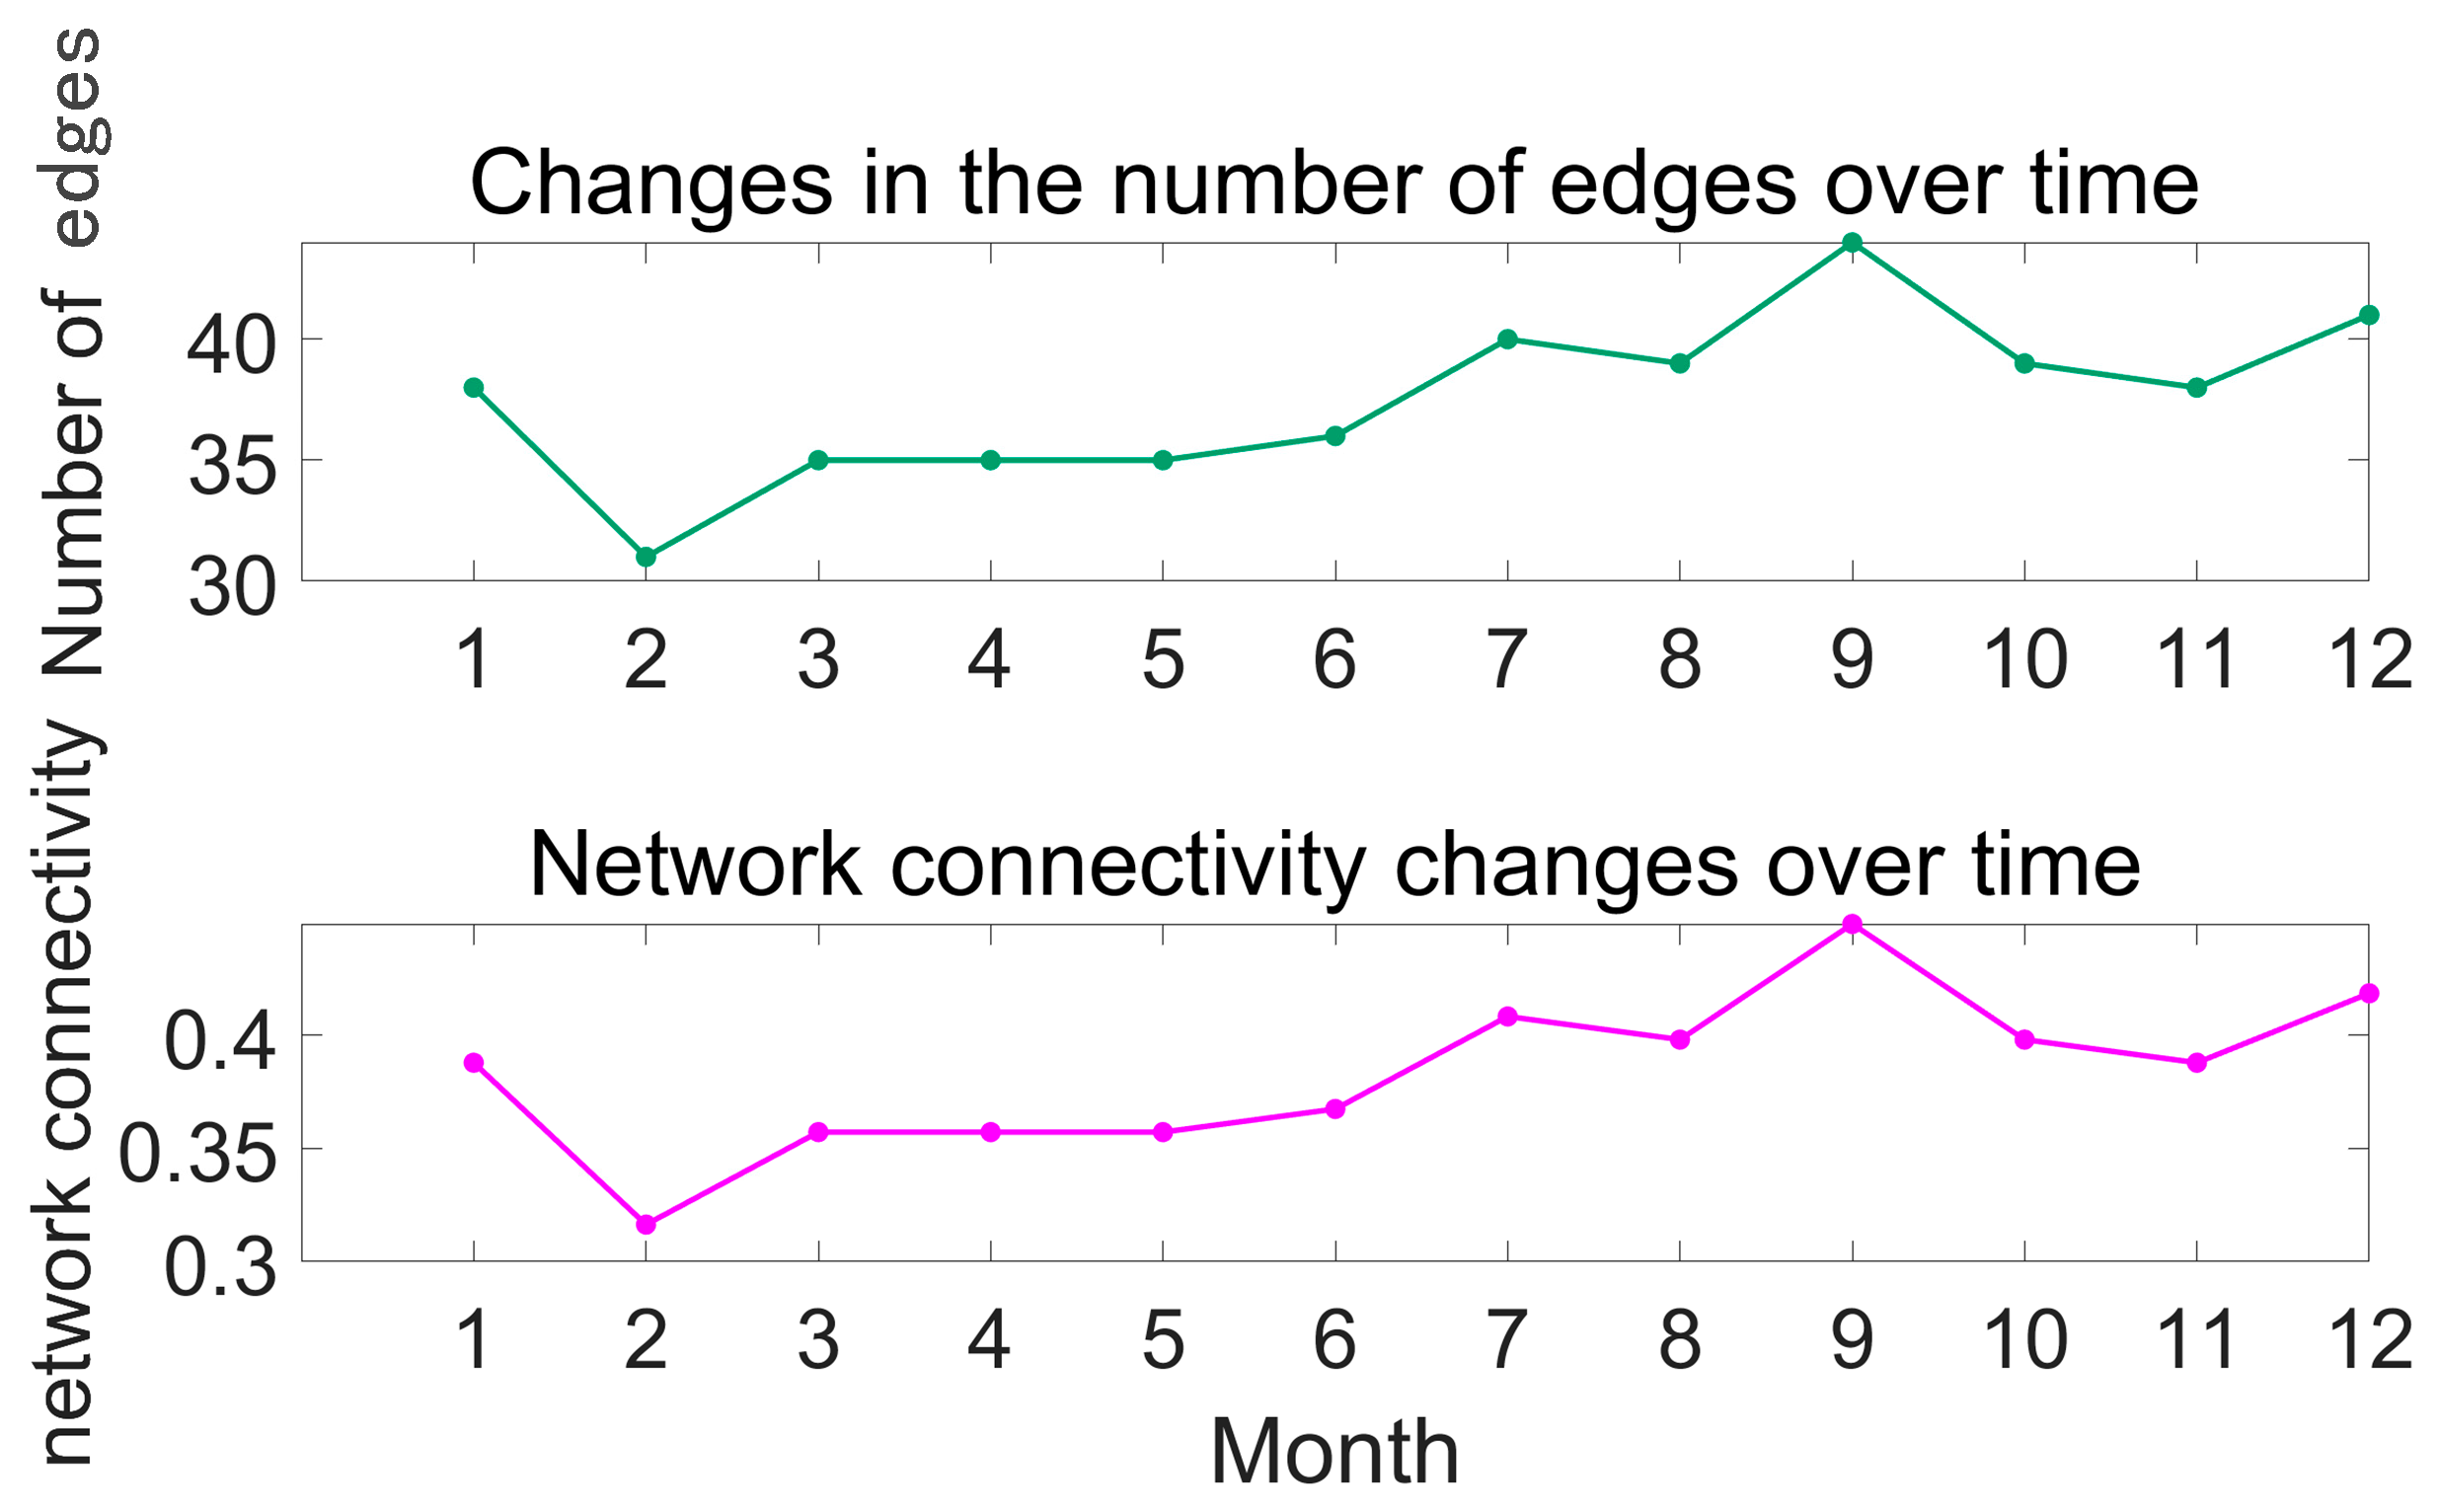
3.3.4. Network Connectivity Analysis

The traffic network of Tianjin Port constructed in this paper has 14 nodes and various numbers of edges across different months, as illustrated in Table 2. By comparing the number of edges and network connectivity, it can be seen that the network connectivity is the best and the number of edges of the network is the largest in September 2021. On the contrary, the network connectivity is the smallest and the number of edges of the network is the least in February 2021. The average node degrees fluctuate in certain intervals between 4.429 and 6.286. The number of edges has a positive correlation with network connectivity since the number of nodes is constant, as illustrated in Figure 10.

4. Discussion

Through a comprehensive analysis of the network diagram pertaining to Tianjin Port, it was found that the traffic network of Tianjin Port is generally intricate and dynamic, serving a huge number of ships each year; 26,997 ships arrived at Tianjin Port in 2021. The number of staying ships for each harbor varies in different months, and the Beijiang Harbor and Dongjiang Harbor usually serve more ships than other harbors in the same month.
This complexity in the traffic of Tianjin Port is primarily evident in two aspects. Firstly, there is a coexistence of routine and sporadic ship behaviors. Secondly, there is a correlation among ship behaviors in different water areas, indicating that the behaviors of ships in distinct water areas can mutually influence each other.
Based on the experimental results presented in this study, in addition to traditional control measures solely targeted at ship activities in a specific area of the port, this study creatively proposes the following recommendations:
  • Unified management policy: Considering the correlation between the ship behavior patterns, it can be seen that the simple dispatching strategy targeting a certain port area or a certain channel is often ineffective. A unified management policy considering the similarities, differences, and correlations between the traffic in different port areas is needed. For instance, a sudden increase in the number of ships in an anchorage is not only related to the sudden increase in arriving ships but also connected to the lack of berths providing services for the increasing number of ships in this harbor.
  • Flexible scheduling strategy: Flexible scheduling corresponding to changeable behavior patterns could improve the efficiency and safety of the port. The abnormal behavior of ships usually changes the network structure and weights of nodes and edges. The correlations between the nodes and edges imply that it will affect the ship behavior pattern in other functional areas. The flexible scheduling strategy aids in taking suitable measures in time to deal with emergencies.
Additionally, it is important to note distinctions in ship behavior during nighttime (from dusk to dawn) compared to daytime. These differences are evident in the reduced visibility during nighttime, leading to a corresponding decrease in the ship’s speed to ensure safe navigation. This speed reduction contributes to a decline in the operational efficiency of the port. Furthermore, in some ports, ship entry and exit are prohibited during nighttime. This means that ships berthed at the docks must maintain their berthed status throughout the night, regardless of whether cargo handling has been completed. This results in a significant increase in the number of ships anchored in the port’s anchorages and an extended duration of stay. Tianjin Port, however, operates as a 24-h port without nighttime restrictions on ship entry and exit. Additionally, a speed analysis of ships navigating Tianjin Port in 2021 during different periods was conducted, and the results showed that there is little difference in the average speeds between nighttime and daytime navigation, as illustrated in Table 3 (assuming sunrise occurs at 6 a.m. and sunset at 6 p.m. daily). Consequently, this paper does not take into account the effects of nighttime navigation. However, if the model proposed in this paper is applied to ports with nighttime restrictions on ship entry and exit or to ports where statistical analysis reveals significant differences in ship speeds between day and night, it is crucial to emphasize and enhance the analysis of nighttime ship navigation.

5. Conclusions

This study develops a graph theory-based analytical model for extracting ship behavior patterns in port areas. This model takes full advantage of AIS trajectory data and geographical information. It can mine the behavior chains for a single ship, group the behavior patterns for multiple ships based on their similarities, and reveal the occasional ship behaviors through differentiation analysis. The sample in Tianjin Port verifies that the model is applicable for the region-oriented traffic structure and dynamics identification and analysis. The model presented in this study is applicable to nearly all ports characterized by multiple harbors and anchorages. Uncovering the correlations and regularities of ship behavior in port areas provides insights for port management authorities to formulate integrated scheduling plans that comprehensively consider the mutual impact of travel behavior in harbors and anchorages. This advancement promotes the development of intelligent ports, ensuring both the safety of ship navigation and the efficient operation of port areas.
In the future, factors such as ship size, ship type, port regulations, and characteristics of nighttime navigation in port areas can be further supplemented to develop a fine-grained ship behavior identification model that can improve the efficiency assessment for different ports. Given the elevated precision requirements for ship behavior recognition in this model, it will be fulfilled in future work through the integration of multi-source data, including AIS data, GPS data, and video data. In addition, a directed graph can be proposed to discriminate the entering and exiting behaviors in port areas. It can provide more details and guidelines for the navigation strategy in the channels with a traffic separation scheme.

Author Contributions

Conceptualization, H.Y. and X.B.; methodology, H.Y.; software, X.B.; validation, H.Y. and J.L.; formal analysis, H.Y. and X.B.; investigation, H.Y. and J.L.; resources, H.Y. and J.L.; data curation, H.Y. and X.B.; writing—original draft preparation, H.Y.; writing—review and editing, H.Y. and X.B.; visualization, H.Y. and X.B.; project administration, X.B. and J.L.; funding acquisition, J.L. All authors have read and agreed to the published version of the manuscript.

Funding

This research was funded by the National Natural Science Foundation of China (42101429 and 42371415), the Open Fund Project of the State Key Laboratory of Surveying, Mapping and Remote Sensing Information Engineering (21S04), the Young Elite Scientists Sponsorship Program by China Association for Science and Technology (CAST) (No. YESS20220491), the National Key Research and Development Program (2022YFC3302703), and the Institute Local Cooperation Project of The Chinese Academy of Engineering (HB2022B22).

Institutional Review Board Statement

Not applicable.

Informed Consent Statement

Not applicable.

Data Availability Statement

The data used during the study are available from the first author by request.

Conflicts of Interest

The authors declare no conflict of interest.

References

  1. Oumimoun, B.; Nahiri, L.; Idmouida, H.; Addaim, A.; Guennoun, Z.; Minaoui, K. Software Defined AIS Receiver Implementation Based on RTL-SDR and GNU Radio. In Proceedings of the 2022 IEEE Asia Pacific Conference on Wireless and Mobile (APWiMob), Bandung, Indonesia, 9–10 December 2022; pp. 1–5. [Google Scholar] [CrossRef]
  2. Billah, M.M.; Zhang, J.; Zhang, T. A Method for Vessel’s Trajectory Prediction Based on Encoder Decoder Architecture. J. Mar. Sci. Eng. 2022, 10, 1529. [Google Scholar] [CrossRef]
  3. Tritsarolis, A.; Kontoulis, Y.; Theodoridis, Y. The Piraeus AIS dataset for large-scale maritime data analytics. Data Brief 2022, 40, 107782. [Google Scholar] [CrossRef] [PubMed]
  4. Evmides, N.; Odysseos, L.; Michaelides, M.P.; Herodotou, H. An Intelligent Framework for Vessel Traffic Monitoring using AIS Data. In Proceedings of the 2022 23rd IEEE International Conference on Mobile Data Management (MDM), Paphos, Cyprus, 6–9 June 2022; pp. 413–418. [Google Scholar] [CrossRef]
  5. Iphar, C.; Le Berre, I.; Napoli, A.; Foulquier, É. Port call extraction and characterisation from maritime navigational data: An application to the Lesser Antilles. In Proceedings of the AGILE 2023 Conference, Orlando, FL, USA, 24–28 June 2023. [Google Scholar]
  6. Song, R.; Wen, Y.; Tao, W.; Zhang, Q.; Papadimitriou, E.; van Gelder, P. Semantic Modeling of Ship Behavior in Cognitive Space. J. Mar. Sci. Eng. 2022, 10, 1347. [Google Scholar] [CrossRef]
  7. Wen, Y.; Zhang, Y.; Huang, L.; Zhou, C.; Xiao, C.; Zhang, F.; Sui, Z. Semantic modelling of ship behavior in harbor based on ontology and dynamic bayesian network. ISPRS Int. J. Geo-Inf. 2019, 8, 107. [Google Scholar] [CrossRef]
  8. Zhou, Y.; Daamen, W.; Vellinga, T.; Hoogendoorn, S. Review of maritime traffic models from vessel behavior modeling perspective. Transp. Res. Part C Emerg. Technol. 2019, 105, 323–345. [Google Scholar] [CrossRef]
  9. Rong, H.; Teixeira, A.P.; Soares, C.G. Ship collision avoidance behaviour recognition and analysis based on AIS data. Ocean Eng. 2022, 245, 110479. [Google Scholar] [CrossRef]
  10. Chen, X.; Qi, L.; Yang, Y.; Luo, Q.; Postolache, O.; Tang, J.; Wu, H. Video-based detection infrastructure enhancement for automated ship recognition and behavior analysis. J. Adv. Transp. 2020, 2020, 7194342. [Google Scholar] [CrossRef]
  11. Wu, Y.; Chu, X.; Deng, L.; Lei, J.; He, W.; Królczyk, G.; Li, Z. A new multi-sensor fusion approach for integrated ship motion perception in inland waterways. Measurement 2022, 200, 111630. [Google Scholar] [CrossRef]
  12. Zhou, Y.; Daamen, W.; Vellinga, T.; Hoogendoorn, S.P. Ship classification based on ship behavior clustering from AIS data. Ocean Eng. 2019, 175, 176–187. [Google Scholar] [CrossRef]
  13. Wang, Y.; Liu, J.; Liu, R.W.; Liu, Y.; Yuan, Z. Data-driven methods for detection of abnormal ship behavior: Progress and trends. Ocean Eng. 2023, 271, 113673. [Google Scholar] [CrossRef]
  14. Murray, B.; Perera, L.P. Ship behavior prediction via trajectory extraction-based clustering for maritime situation awareness. J. Ocean Eng. Sci. 2022, 7, 1–13. [Google Scholar] [CrossRef]
  15. Murray, B.; Perera, L.P. An AIS-based deep learning framework for regional ship behavior prediction. Reliab. Eng. Syst. Saf. 2021, 215, 107819. [Google Scholar] [CrossRef]
  16. Roy, U.; Wu, X. Ais-data based vessel traffic’s characteristics and travel behaviour analysis: A case study at houston ship channel. J. Ocean Technol. 2019, 14, 59–74. [Google Scholar]
  17. Mandalis, P.; Chondrodima, E.; Kontoulis, Y.; Pelekis, N.; Theodoridis, Y. Machine learning models for vessel traffic flow forecasting: An experimental comparison. In Proceedings of the 2022 23rd IEEE International Conference on Mobile Data Management (MDM), Paphos, Cyprus, 6–9 June 2022; pp. 431–436. [Google Scholar] [CrossRef]
  18. Li, H.; Gan, L.; Zheng, Y.; Wen, Y. Complexity of Waterway Networks in Port Waters. Navig. China 2015, 38, 94–98+130. [Google Scholar] [CrossRef]
  19. Guan, X.; Li, Z.; Ding, C.; Duan, W.; Li, X. Robustness analysis of complex network of container ports in the world under cascading failure. Navig. China 2021, 44, 84–89. [Google Scholar] [CrossRef]
  20. West, D.B. Introduction to Graph Theory; Prentice Hall: Upper Saddle River, NJ, USA, 2001; Volume 2. [Google Scholar]
  21. Sheriff, F. ELMOPP: An application of graph theory and machine learning to traffic light coordination. Appl. Comput. Inform. 2021. [Google Scholar] [CrossRef]
  22. Lu, H.; Wang, S. A study on multi-ASC scheduling method of automated container terminals based on graph theory. Comput. Ind. Eng. 2019, 129, 404–416. [Google Scholar] [CrossRef]
  23. Yu, W.; Wang, T. Ship channel route optimization based on graph theory. Chin. J. Ship Res. 2008, 01, 18–22. [Google Scholar]
  24. Tang, H.; Wei, L.; Yin, Y.; Qi, Y. Ship route planning based on probabilistic digraph model. J. Huazhong Univ. Sci. Technol. (Nat. Sci. Ed.) 2020, 48, 105–109. [Google Scholar] [CrossRef]
  25. Yu, H.; Meng, Q.; Fang, Z.; Liu, J.; Xu, L. A review of ship collision risk assessment, hotspot detection and path planning for maritime traffic control in restricted waters. J. Navig. 2023, 75, 1–27. [Google Scholar] [CrossRef]
  26. Dirzka, C.; Acciaro, M. Global shipping network dynamics during the COVID-19 pandemic’s initial phases. J. Transp. Geogr. 2022, 99, 103265. [Google Scholar] [CrossRef] [PubMed]
  27. Kanrak, M.; Nguyen, H.O. Structure, characteristics and connectivity analysis of the Asian-Australasian cruise shipping network. Marit. Policy Manag. 2022, 49, 882–896. [Google Scholar] [CrossRef]
  28. Fritsch, F.N.; Carlson, R.E. Monotone piecewise cubic interpolation. SIAM J. Numer. Anal. 1980, 17, 238–246. [Google Scholar] [CrossRef]
  29. Sui, Z.; Wen, Y.; Huang, Y.; Zhou, C.; Du, L.; Piera, M.A. Node importance evaluation in marine traffic situation complex network for intelligent maritime supervision. Ocean Eng. 2022, 247, 110742. [Google Scholar] [CrossRef]
  30. He, S.; Zhu, J.; Zeng, Q.; Guo, X.; Yin, J.; Wei, T. Topology searching algorithm for multi-port hybrid circuit breakers based on graph theory. Front. Energy Res. 2023, 11, 1171815. [Google Scholar] [CrossRef]
  31. Yan, Z.; Cheng, L.; He, R.; Yang, H. Extracting ship stopping information from AIS data. Ocean Eng. 2022, 250, 111004. [Google Scholar] [CrossRef]
  32. Woolley-Meza, O.; Thiemann, C.; Grady, D.; Lee, J.J.; Seebens, H.; Blasius, B.; Brockmann, D. Complexity in human transportation networks: A comparative analysis of worldwide air transportation and global cargo-ship movements. Eur. Phys. J. B 2011, 84, 589–600. [Google Scholar] [CrossRef]
Figure 1. Flow chart of the proposed model.
Jmse 11 02227 g001
Figure 2. Distribution of functional areas of Tianjin Port.
Jmse 11 02227 g002
Figure 3. Ship trajectories at Tianjin Port.
Jmse 11 02227 g003
Figure 4. The behavior pattern of a single ship in Tianjin Port.
Jmse 11 02227 g004
Figure 5. The behavior pattern of multiple ships in Tianjin Port; (a) Ships entering and leaving the port include anchoring at anchorage; (b) Ships enter and leave the port directly; (c) Ships passing through intersecting waters.
Jmse 11 02227 g005
Figure 6. Network structures of Tianjin Port; Network structures in (a) January; (b) February; (c) March; (d) April; (e) May; (f) June; (g) July; (h) August; (i) September; (j) October; (k) November; (l) December.
Jmse 11 02227 g006aJmse 11 02227 g006b
Figure 7. Node characteristics of the shipping network in Tianjin Port in 2021; (a) Number of ships at each node; (b) Average staying time of ships at each node.
Jmse 11 02227 g007
Figure 8. Edges characteristics of the shipping network in Tianjin Port in 2021; (a) Number of ships; (b) Average sailing time.
Jmse 11 02227 g008
Figure 9. Correlation analysis example.
Jmse 11 02227 g009
Figure 10. Relationship between the number of edges and network connectivity.
Jmse 11 02227 g010
Table 1. Definition of single-ship behavior.
AreaShip Behavior
AnchorageMoving in anchorage
Anchorage
Fairway/ChannelNavigation
Anchoring
BerthMoving in berth
Berthing
Other areasSailing in other areas
Anchoring in other areas
Table 2. Number of nodes and number of edges in the ship behavior graph of Tianjin Port.
TimeNumber of NodesNumber of EdgesAverage Node DegreeNetwork Connectivity
January 202114385.4290.387755
February 202114314.4290.316327
March 2021143550.357143
April 2021143550.357143
May 2021143550.357143
June 202114365.1430.367347
July 202114405.7140.408163
August 202114395.5710.397959
September 202114446.2860.44898
October 202114395.5710.397959
November 202114385.4290.387755
December 202114415.8570.418367
Table 3. Average sailing speed of ships in Tianjin Port at different periods.
Period of DaytimeSpeed (kn)Period of NighttimeSpeed (kn)
06:00–07:0010.0518:00–19:006.47
07:00–08:006.38519:00–20:007.34
08:00–09:009.6420:00–21:007.45
09:00–10:0010.3721:00–22:007.92
10:00–11:006.6322:00–23:007.08
11:00–12:003.0323:00–00:003.79
12:00–13:004.8400:00–01:007.35
13:00–14:003.8501:00–02:009.86
14:00–15:009.6202:00–03:005.33
15:00–16:005.6903:00–04:004.72
16:00–17:006.3204:00–05:009.88
17:00–18:0011.2205:00–06:0011.57
Average sailing speed7.303Average sailing speed7.396
Disclaimer/Publisher’s Note: The statements, opinions and data contained in all publications are solely those of the individual author(s) and contributor(s) and not of MDPI and/or the editor(s). MDPI and/or the editor(s) disclaim responsibility for any injury to people or property resulting from any ideas, methods, instructions or products referred to in the content.

