1. Introduction
With the goal of reducing carbon emissions to mitigate climate change and pursue an independent and diversified energy portfolio amidst a convoluted geopolitical situation, many countries are looking for renewable energy sources.
As a part of economic and social reforms, Morocco is undergoing an ambitious energy transition that will concentrate efforts on renewable energy sources. Since 90% of Moroccan energy supply is imported [
1], and the demand of energy in the country is increasing about 5% each year [
2], the potential upsides of new energy sources being installed in the country are considerable and encouraging. Morocco has a large Atlantic coast with plenty of resources, including wave energy, which could contribute to its goal of becoming a net energy exporter of renewable energy.
The global potential offshore wave energy is estimated to be of the same order of magnitude as the world’s electrical consumption [
3]. Wave models can be used to estimate the relevant parameters needed for an evaluation of the sea state and potential power production, using wind data and boundary conditions. These models have become more reliable with the development of third-generation wave models [
4]. In order to obtain enhanced results in coastal regions, the SWAN model was developed by Ref. [
5]. However, with further developments, its offshore results have been improved and it is now widely applicable.
Using these models, efforts have been made to assess wave energy for large areas. Ref. [
6] assesses the wave energy for the European coast and Ref. [
7] performs a global analysis. However, with the development of these models, it has been possible to perform more detailed analyses of smaller domains.
The case of the Moroccan Atlantic coast was analyzed by Ref. [
8] using the WAM model, obtaining an average wave power of 30 kW/m and identifying the most energetic area between latitudes 29°30′ N and 34° N. Furthermore, Ref. [
9] also studied the same domain using the WAVEWATCH III model (WWIII), and similarly assessed an average wave energy of 30 kW/m.
This study aims to contribute to the state of the art regarding marine environmental conditions and energy potential in this area of the globe, a region that has not been the focus of extensive research, using a different model, different and more recent forcing data, and higher resolution model implementation, than previous studies.
Various studies that focus on other North Atlantic regions have used WWIII to obtain boundary conditions for further simulations using SWAN in coastal regions. This method is used by Ref. [
10] for various locations along the European Atlantic coast as well as by Ref. [
11] focusing on the Canary Islands. Ref. [
12] evaluated the wave power at the Cape Verde archipelago, located south of Morocco, and Refs. [
13,
14] at the Azores and Madeira archipelagos.
The ERA-5 reanalysis is a comprehensive dataset of wind hindcasts provided by the European Center for Medium-Range Weather Forecasts (ECMRWF) [
13]. This dataset is the replacement for the ERA-Interim reanalysis, and it has been operational since 2016. The dataset has been validated with empirical data from buoys by several studies focusing on different areas such as the North Atlantic [
14] and the North Pacific region [
15].
The goal of this study is to perform a 30-year hindcast of the sea state at the Moroccan coast using the SWAN model forced with wind data from the ERA-5 database. The results will be compared with the relevant studies in this region. Additionally, the performance of six different wave energy converters is assessed for five different sites along the coast.
2. Models and Physics
2.1. Models
Modern wave models describe the sea surface as a spectrum. The physical processes are described through the spectral representation of the conservation of wave action. This includes phenomena such as propagation, refraction, shoaling, and whitecapping, among others.
SWAN and WAVEWATCH III have the same approach to the problem, and both rely on the spectral energy balance [
16], defined by Equation (1).
More specifically, the SWAN model algorithm is based on the wave action density
, which is the relation of the spectral energy density
to the representative wave frequency
[
17]. The model relies on the spectral action balance [
18,
19] to describe the evolution of the sea state, which can be expressed by Equation (2):
where
and
are the horizontal coordinates,
is the propagation direction,
is the propagation velocity in the respective space, and
is the source of energy.
The left side of this equation describes the kinematic processes; the first term of it is the variation of wave action in time, the second and third term correspond to the propagation of action through the horizontal plane, the fourth term is the variation of the representative frequency due to the depth and current, and finally, the fifth term represents the refraction due to depth and currents. The right-hand side describes the energy source including wind generation, bottom friction, wave–wave interactions, whitecapping, and depth-induced wave breaking [
17].
can be defined by Equation (3).
2.2. Wave Energy
The movement of the sea surface is essentially a form of kinetic and potential energy that is induced by the wind. The energy of a wave is presented per linear meter of crest and can be calculated through the Equation (4) [
20]:
where
is the energy density of the wave,
is the density of salt water,
is the gravitational acceleration and,
is the wave height.
Most of the analyzed regions are in the North Atlantic area, which allows the assumption of deep waters,
, which will lead to the following equation:
where
is the energy flux per unit length of crest,
is the significant wave height, and
is the wave energy period.
2.3. Wave Energy Converters
In recent decades there have been numerous developments, and according to Ref. [
21], over 1000 prototypes of wave energy conversion systems have been idealized, with the most intensive progress being made in Europe, North America, and Japan. Wave energy converters (WECs) can be classified according to their location in relation to the shore, their type (regarding size and shape), and their working principle [
22].
Their location can vary between onshore, nearshore, and offshore. Furthermore, their type can be defined as attenuators, point absorbers, and terminators. Finally, their operation principle can either be pressure differential, floating structures, overtopping, or impact devices.
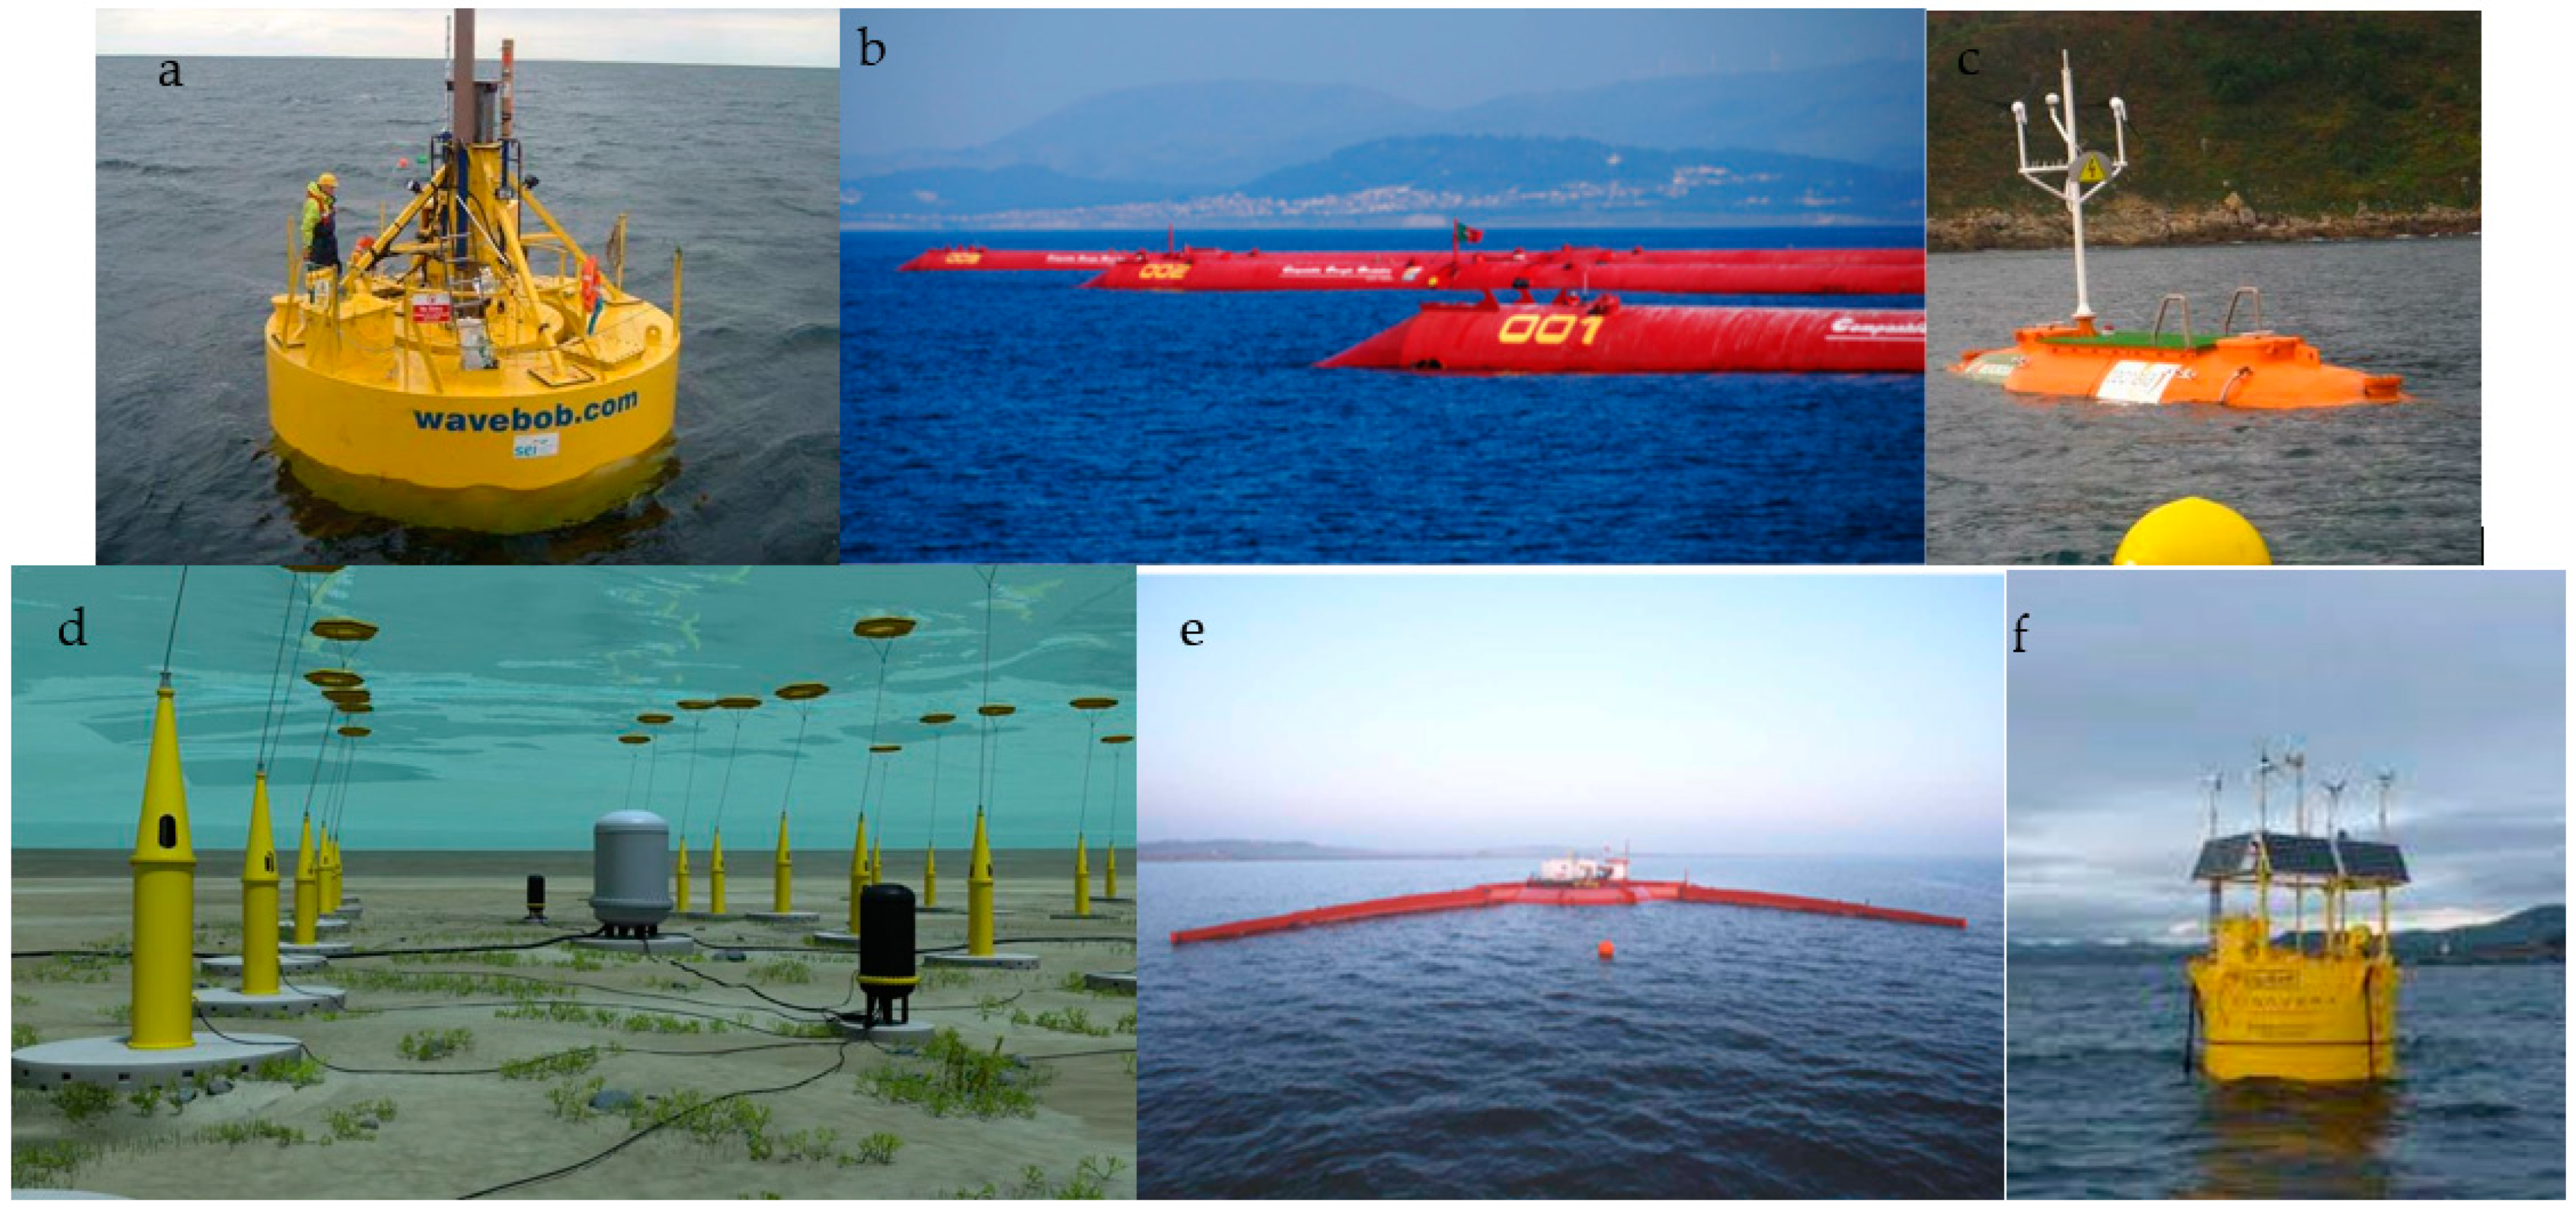
This study will assess the performance of six WECs listed in
Table 1, whose power matrixes are publicly available at five different sites. Several of these devices do not correspond to the ones that are under commercial exploitation or even under continued development; however, they have been studied extensively by the scientific community, and thus can be valuable as reference benchmarks for comparative purposes. Images and sketches of the devices are presented in
Figure 1.
2.4. Geographical Location
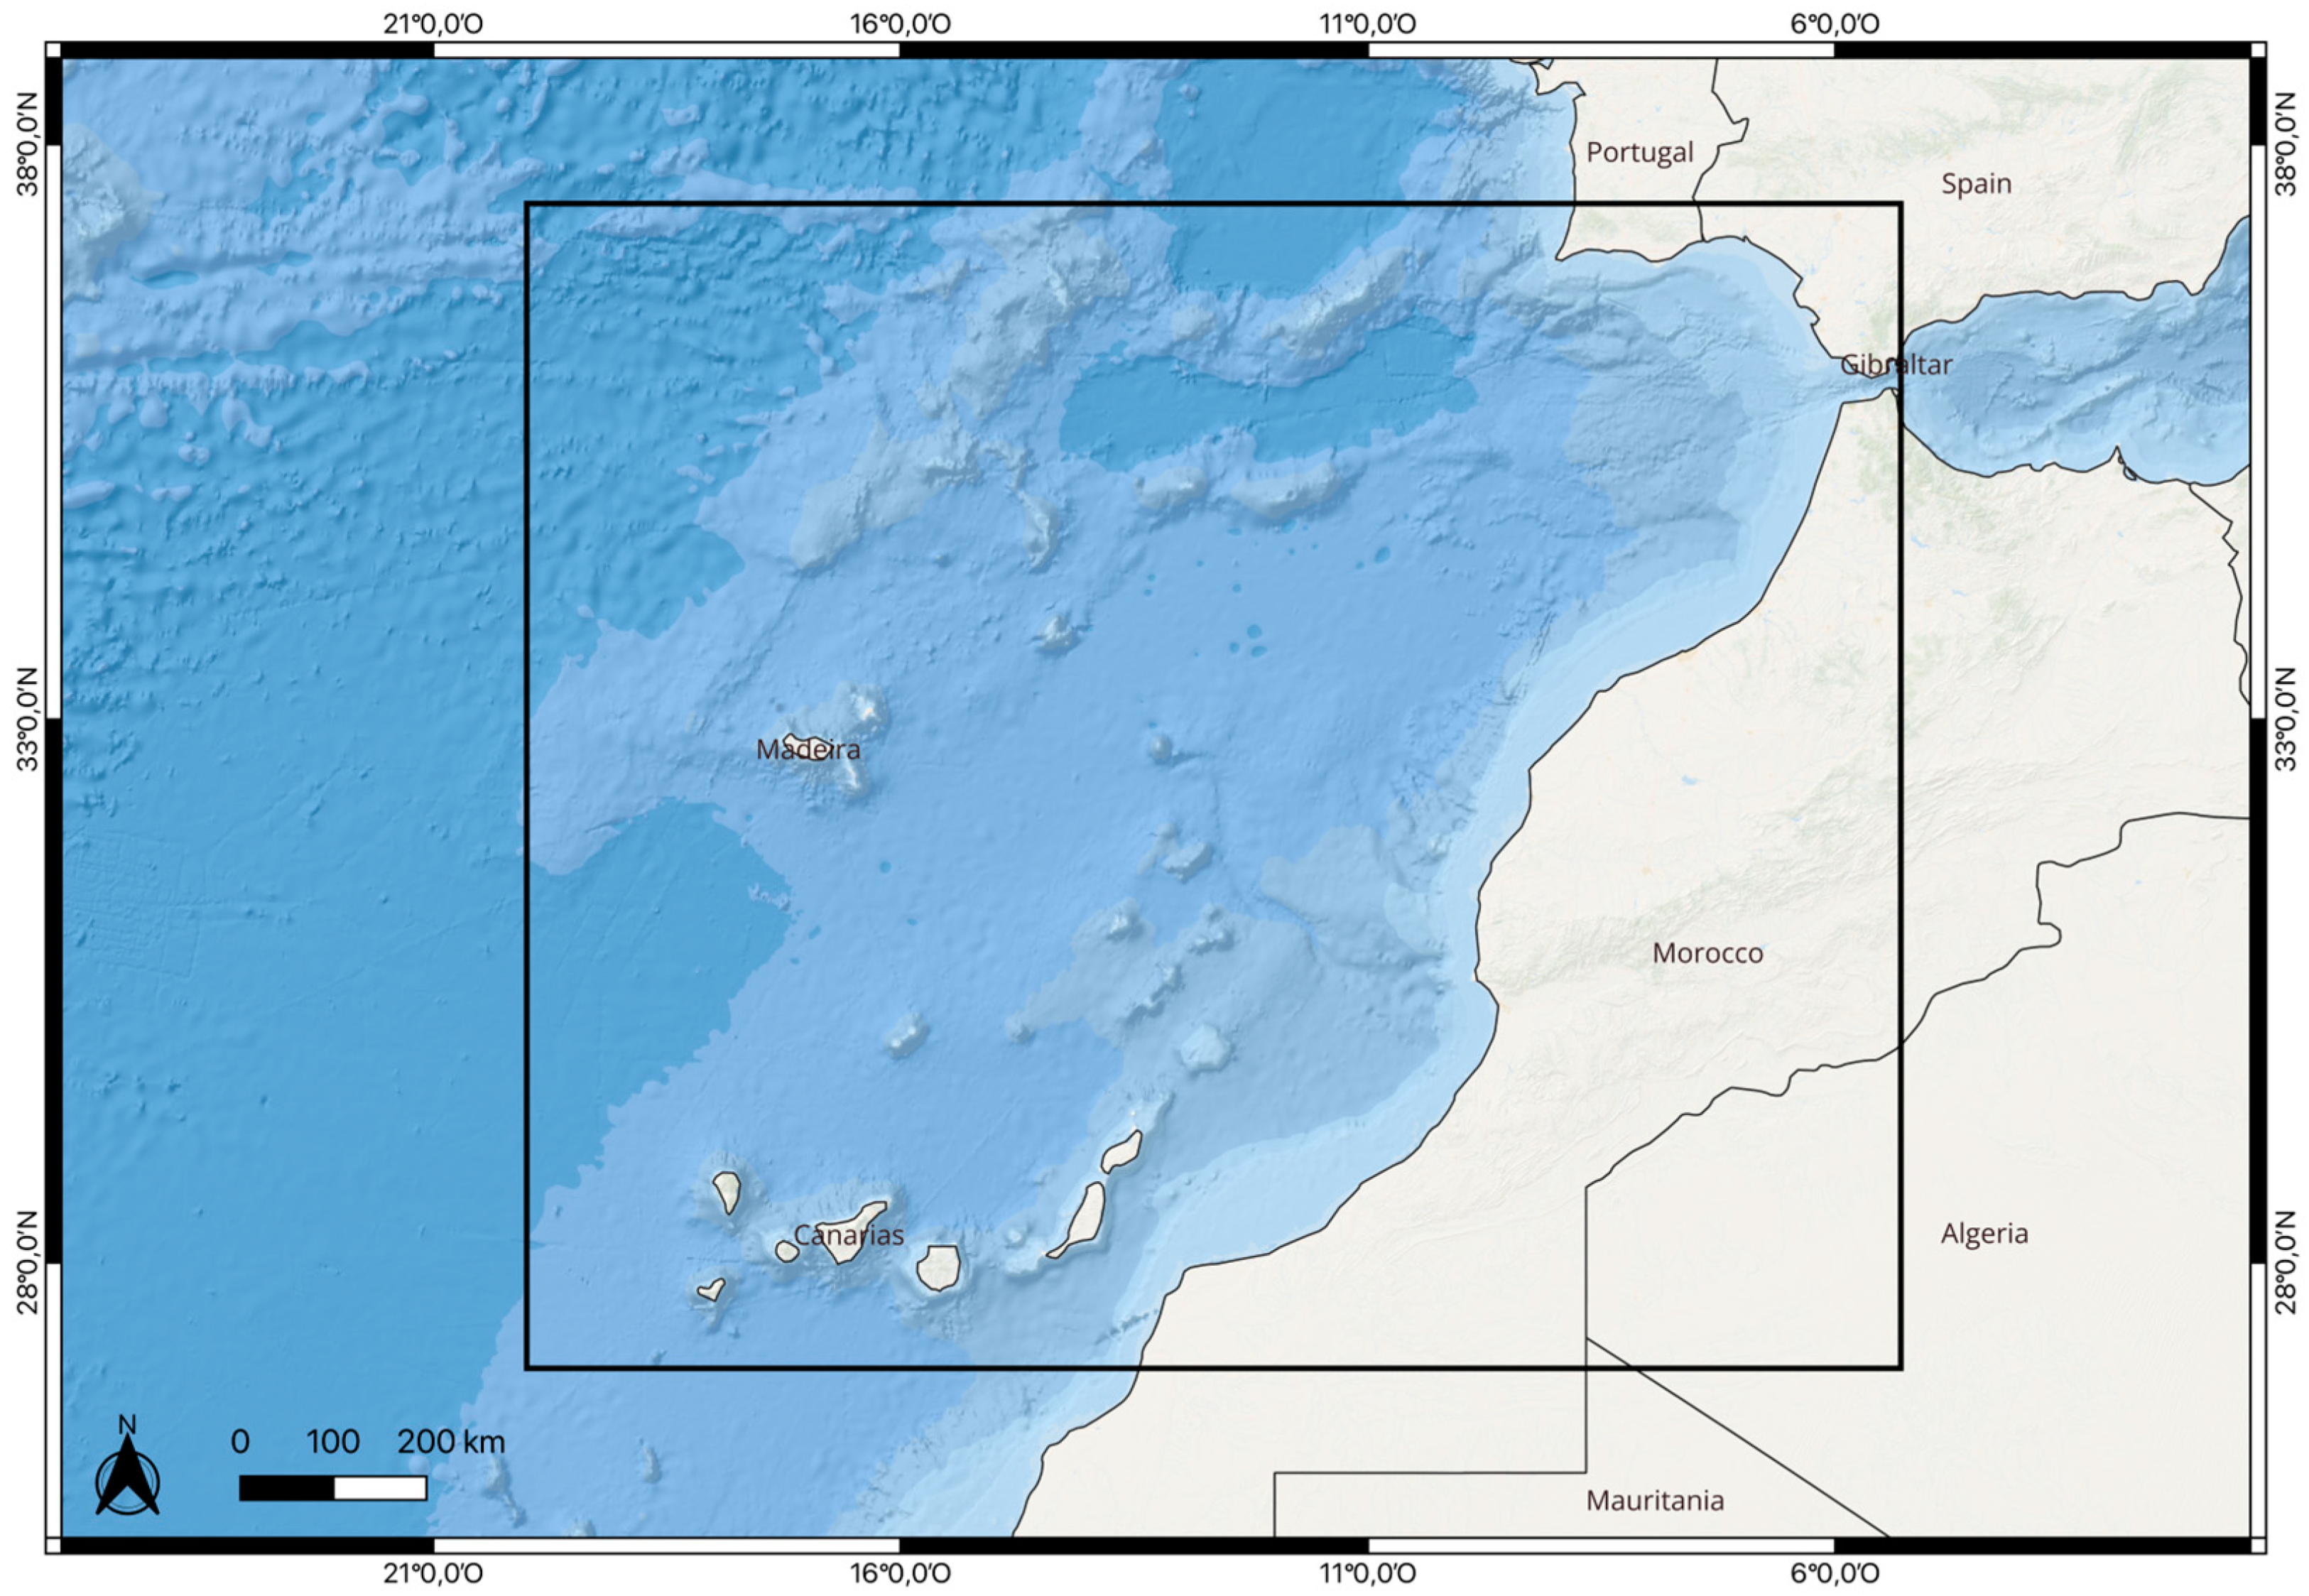
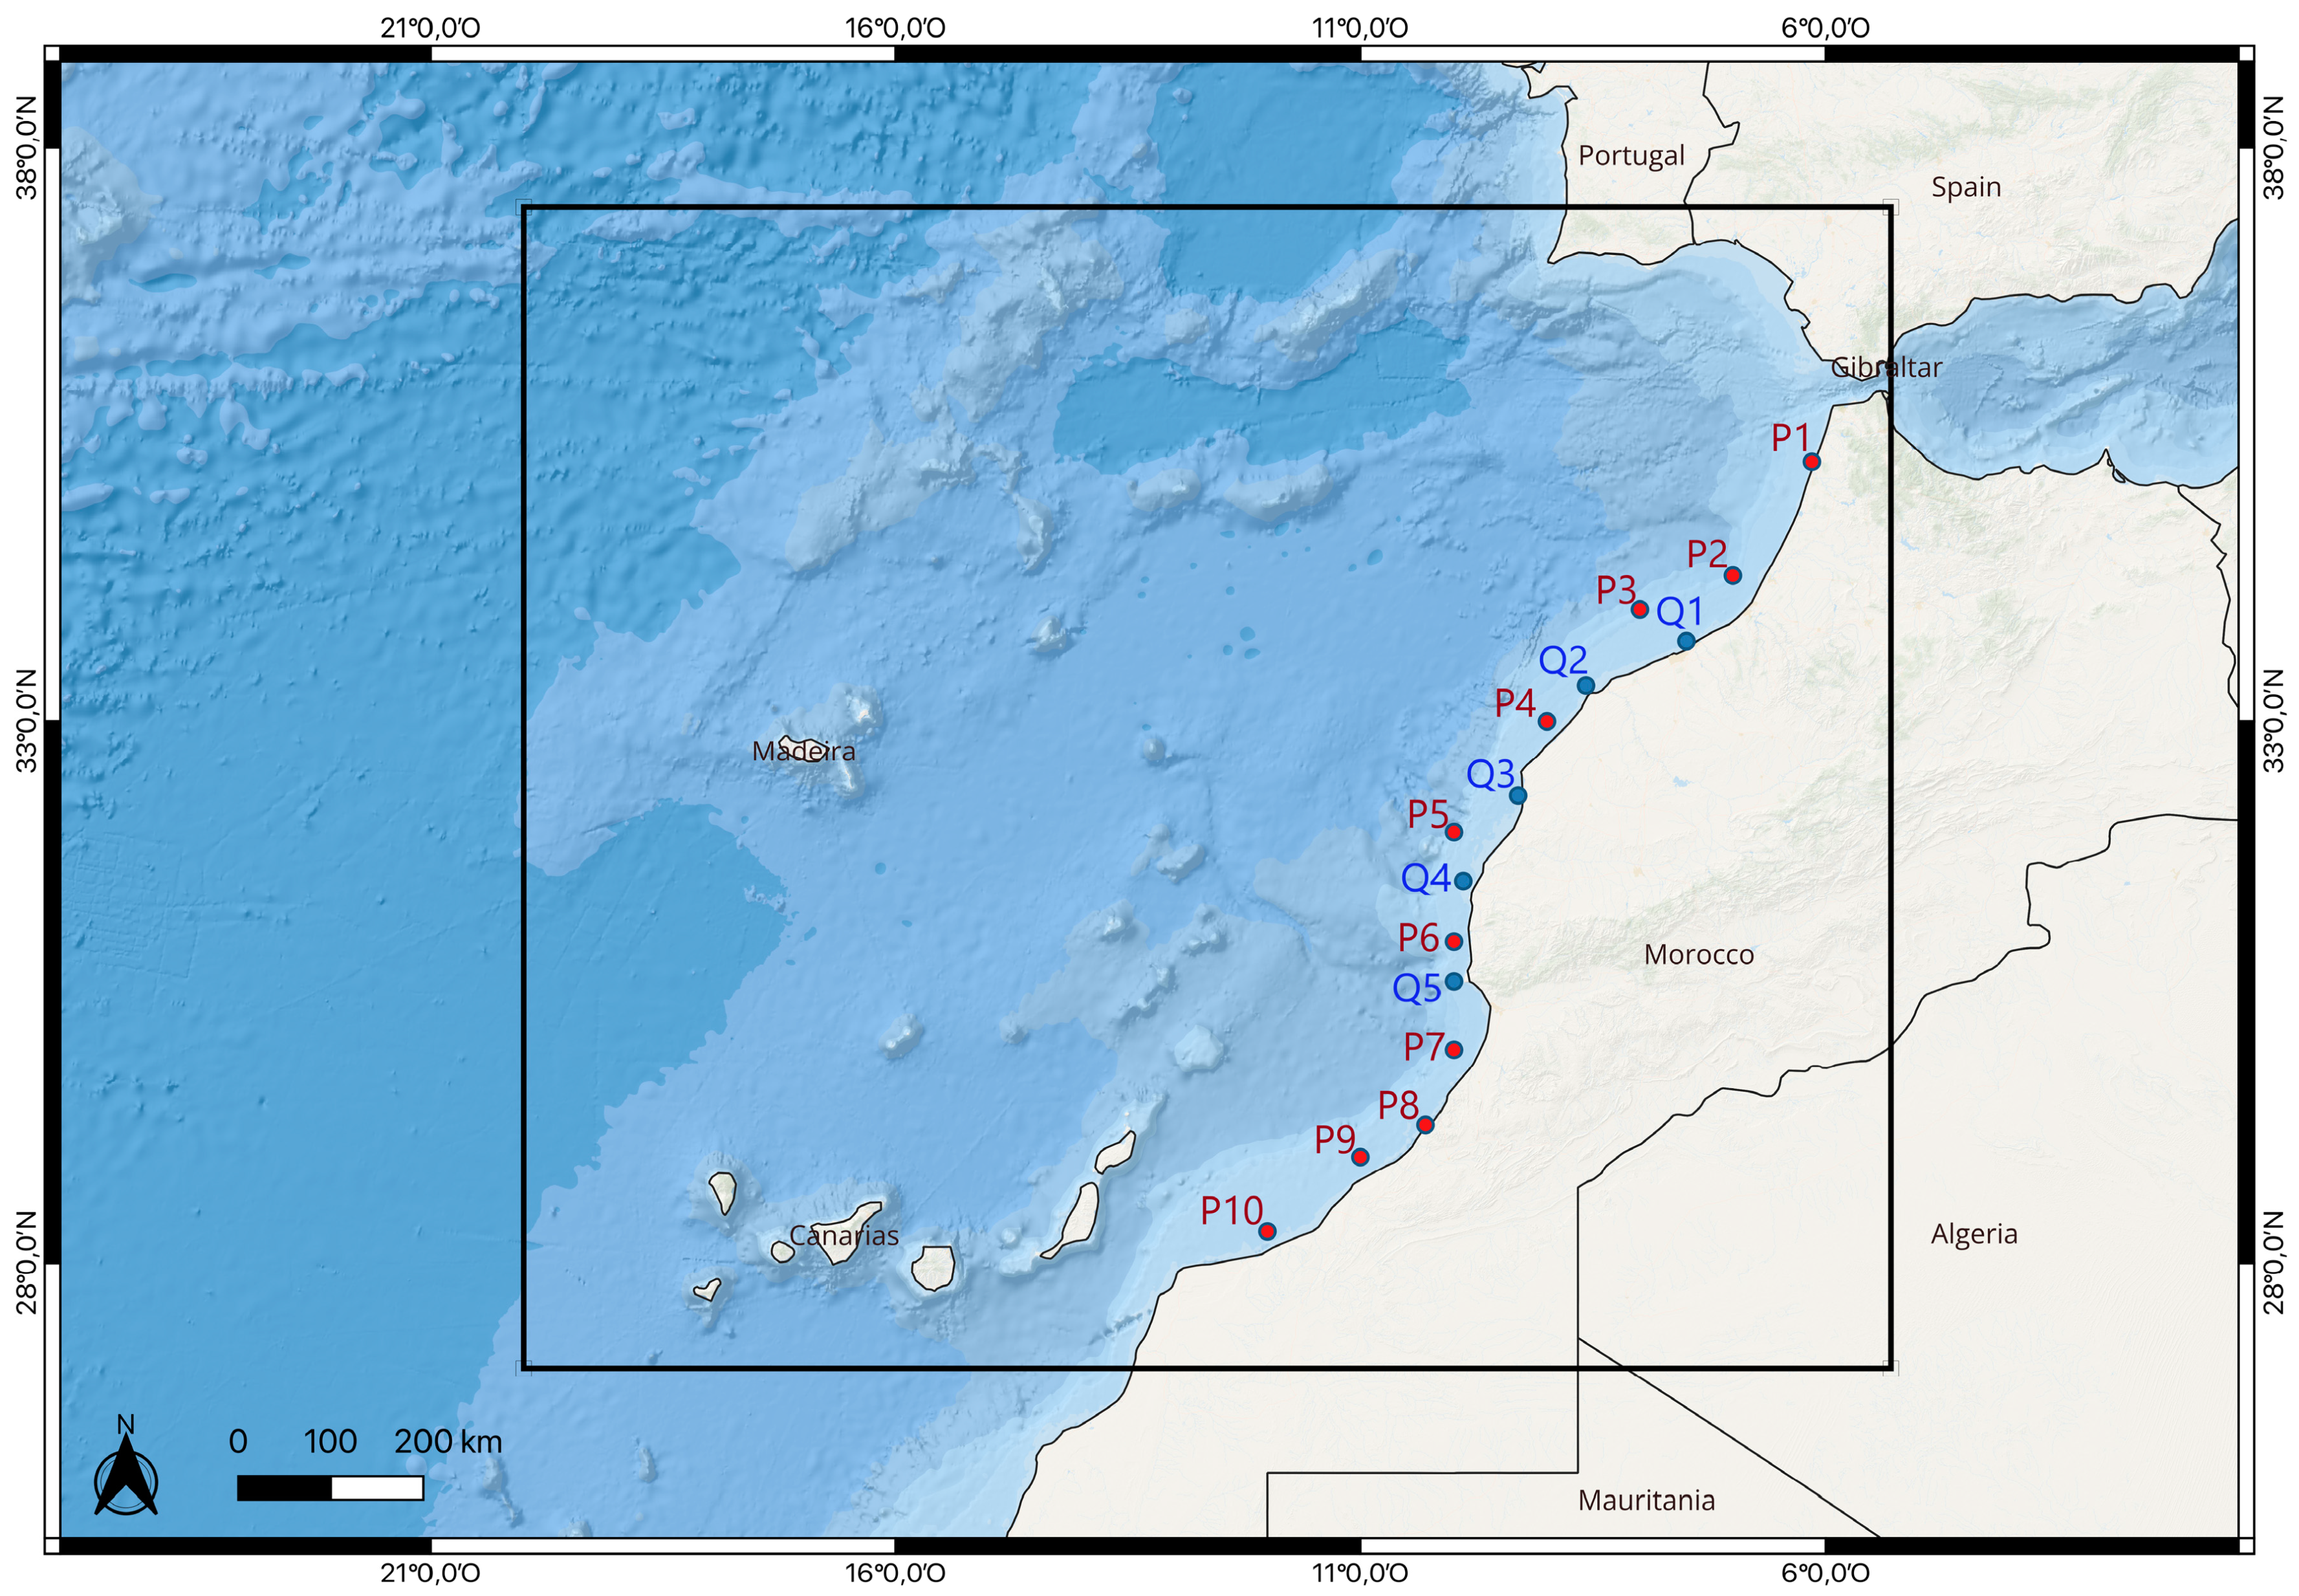
The area of interest in this work, illustrated in
Figure 2, is the region between the longitudes 5.3° W and 20° W, and between the latitudes 27° N and 37° N. This area includes the Moroccan Atlantic coast as well as the Canary Islands and Madeira.
The coast in this area is oriented mostly towards the northwest and west direction, which is an advantage regarding wave energy since the swell arrives from the low-pressure regions in the North Atlantic Ocean, close to the Azores islands [
29], and reaches the coast perpendicularly with high intensity and long periods [
30]. The largest urban centers along the coast include Rabat, Casablanca, El Jadida, Safi (Safim), Essaouira (Mogador), and Agadir. It is, however, affected by shadow effects from the Canary Islands in the south and from the Iberian Peninsula in the north. It has a wide continental shelf and a long latitudinal extension. Furthermore, it is under the direct forcing of the subtropical anticyclones [
31].
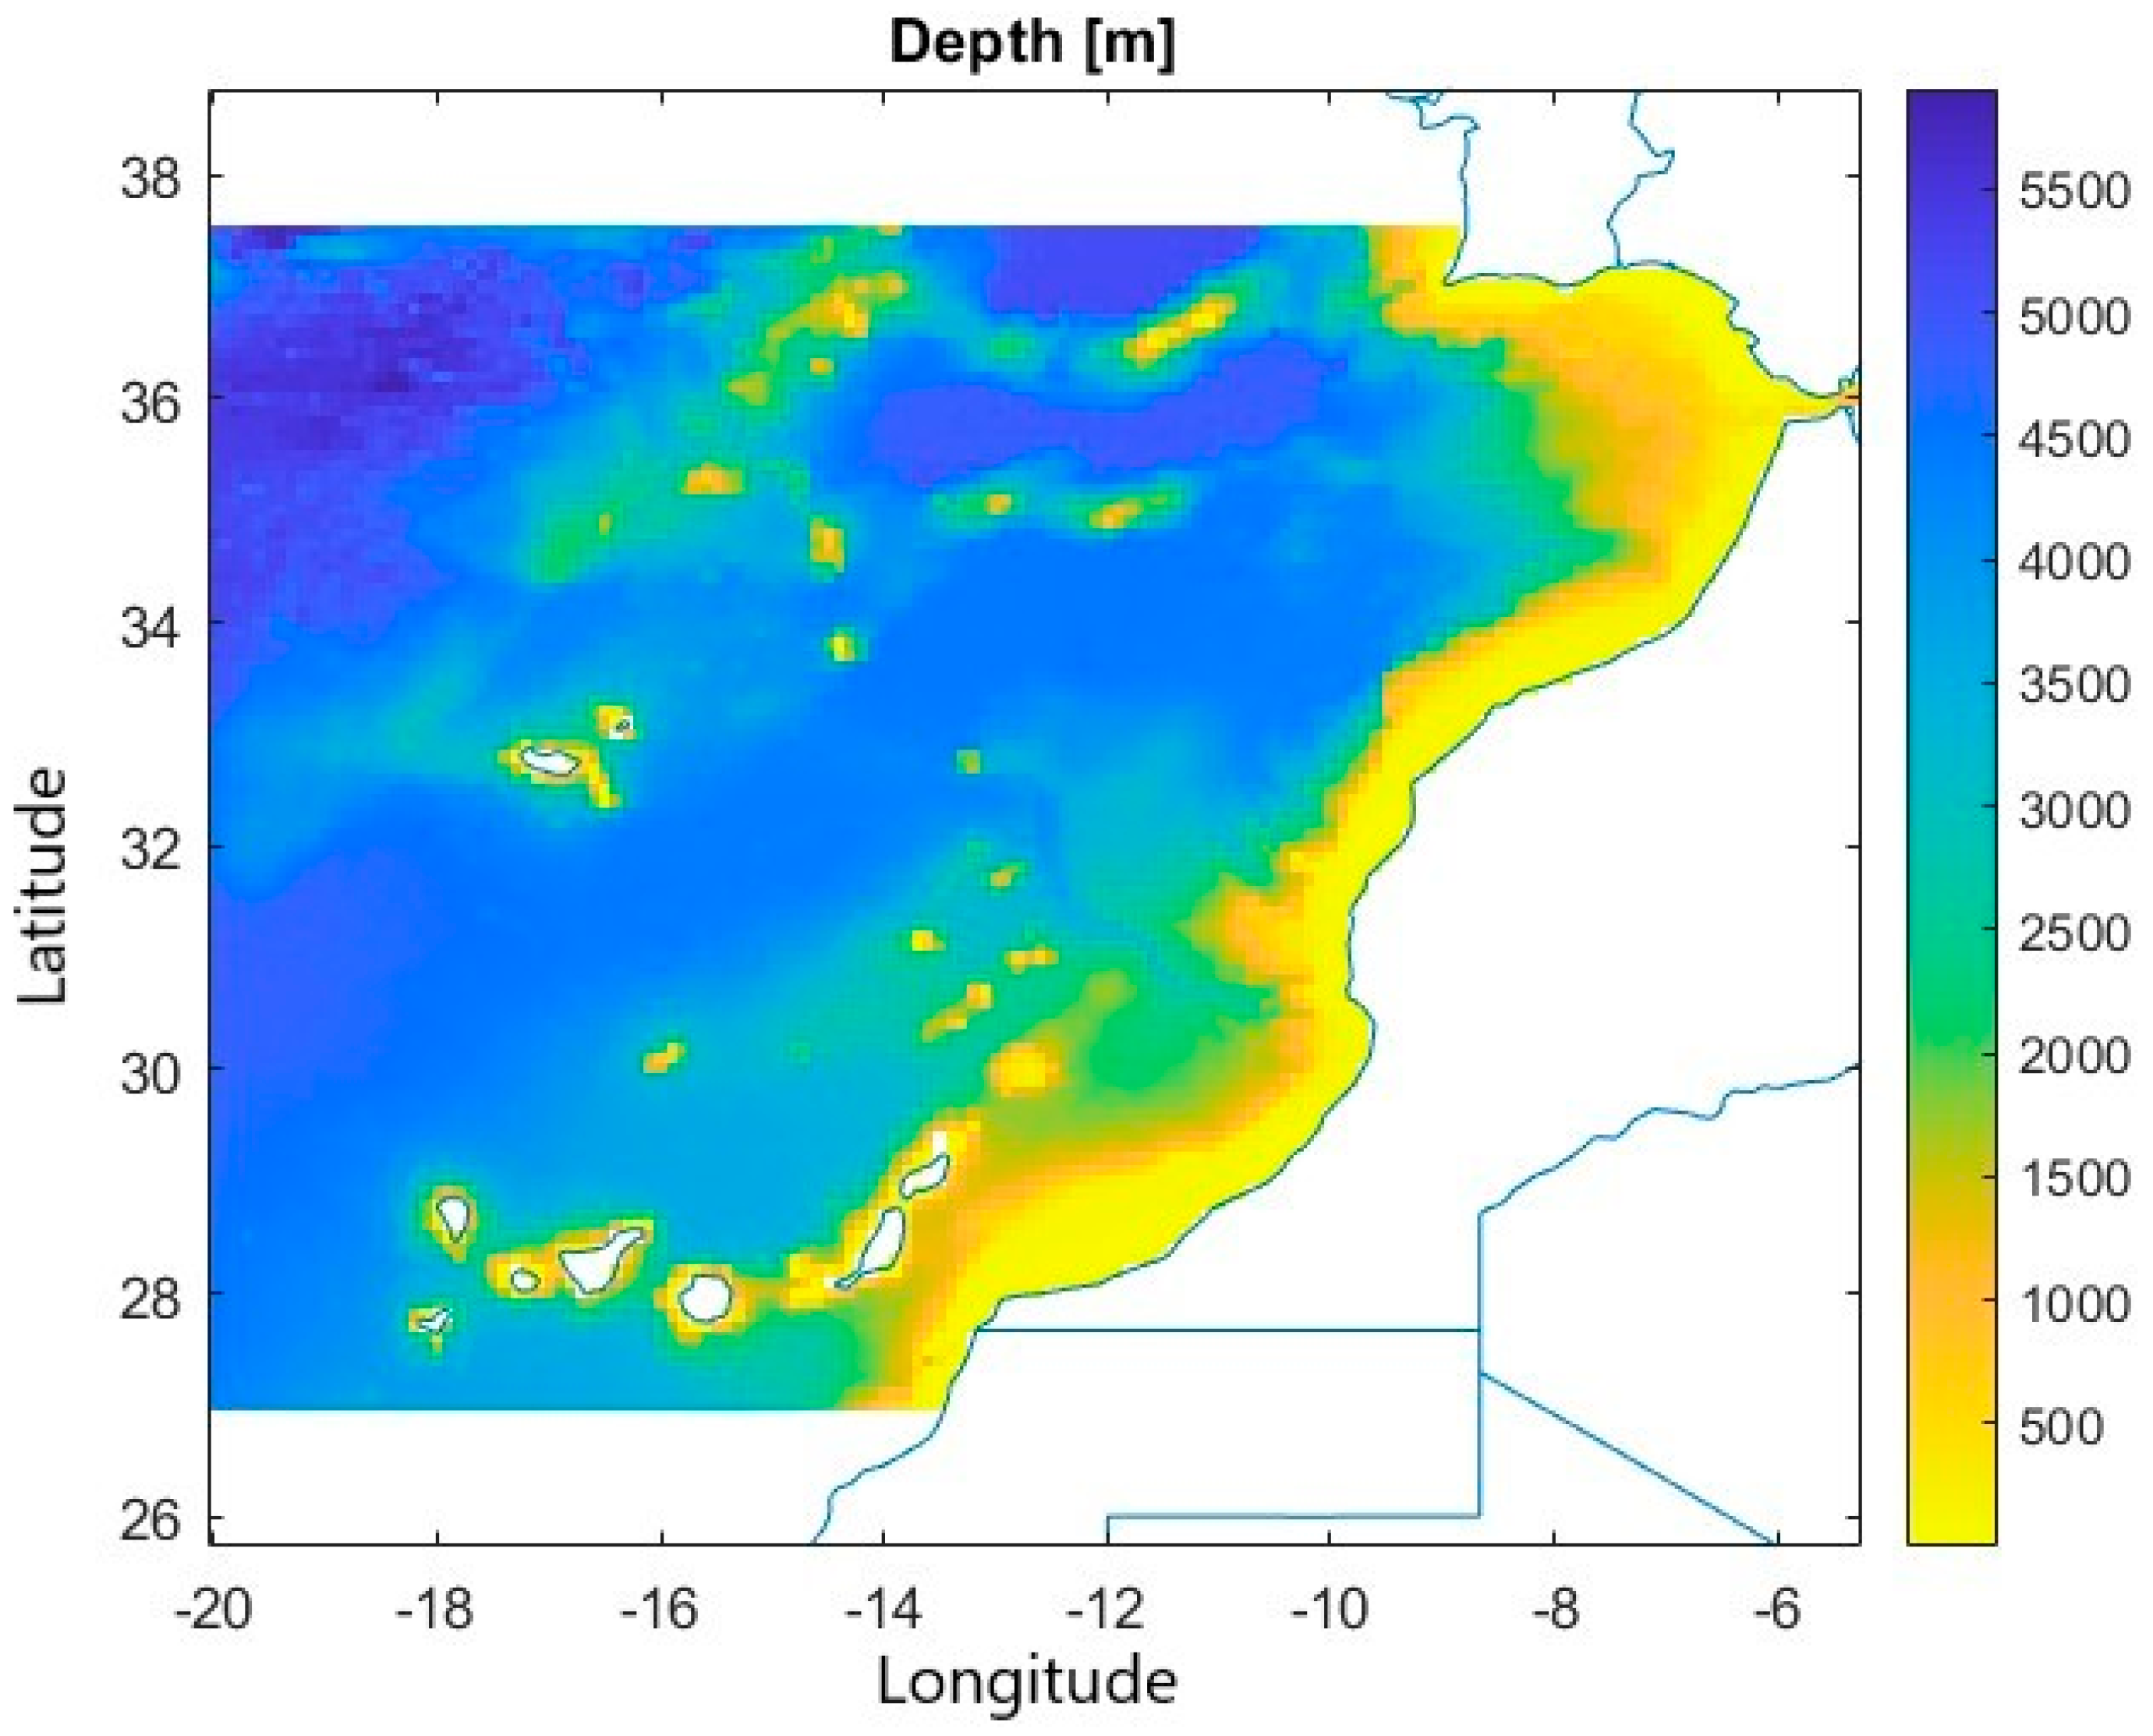
The isobath lines are almost parallel to the coastline and can vary between 5 m and 295 m. This regular coastline is only disturbed in the south of the country by a submarine ridge extending about 11 km from coastline [
32].
3. Methodology
3.1. SWAN Model Implementation
The modeling of wave conditions was carried out with SWAN version is 41.32AB. The computational grid uses spherical coordinates and is built with a spatial resolution of 0.1°; it spans between the coordinates 20° W and 5.3° W and between 27° N and 37.5° N. The bathymetry of the region is shown in
Figure 3, provided by the General Bathymetric Chart of the Oceans (GEBCO), and was adapted to a resolution of 0.05° latitudinally and longitudinally. The time step of the nonstationary run was set to three hours. Wind data were extracted from the ERA-5 database, which was provided by the European Center for Medium-Range Weather Forecasts (ECMRWF). The wind field data were provided as a grid with a spatial resolution of 0.25° × 0.25° (about 30 km) and six hours temporal resolution. To obtain boundary conditions the WWIII wave model, version 5.16 [
33], was implemented with a resolution of 0.5 by 0.5 deg. The wave model was forced with surface wind and sea-ice cover from the ERA-5 [
34] database, with a 0.25 deg by 0.25 deg and a time resolution of six hours.
The physical parameters and the numerical methods were defined during the calibration process in order to optimize the results. The most suited wave generation model was the Janssen model with linear wind growth. Bottom friction was accounted for with the JONSWAP formulation, and quadrupled wave–wave interactions were considered. Finally, refraction was also considered, but diffraction was disregarded due to the large dimension of the domain.
The numerical method applied is the first order upwind BSBT (backwards space backwards time) scheme.
3.2. Calibration
The SWAN model uses different mathematical methods to model the wave behavior. Although the default parametrization is very reliable and the results that it produces are good, it allows some room for adjustments regarding the optimal solutions for a particular domain. Therefore, the model is calibrated using the available observational data.
There are three different available sources of observational data within the domain. Two buoys belonging to the “Puertos del Estado” located off the coast of Gran Canaria and off the coast of Cadiz. The third buoy belongs to the Hydrographic Institute of Portugal and is located off the coast of Faro.
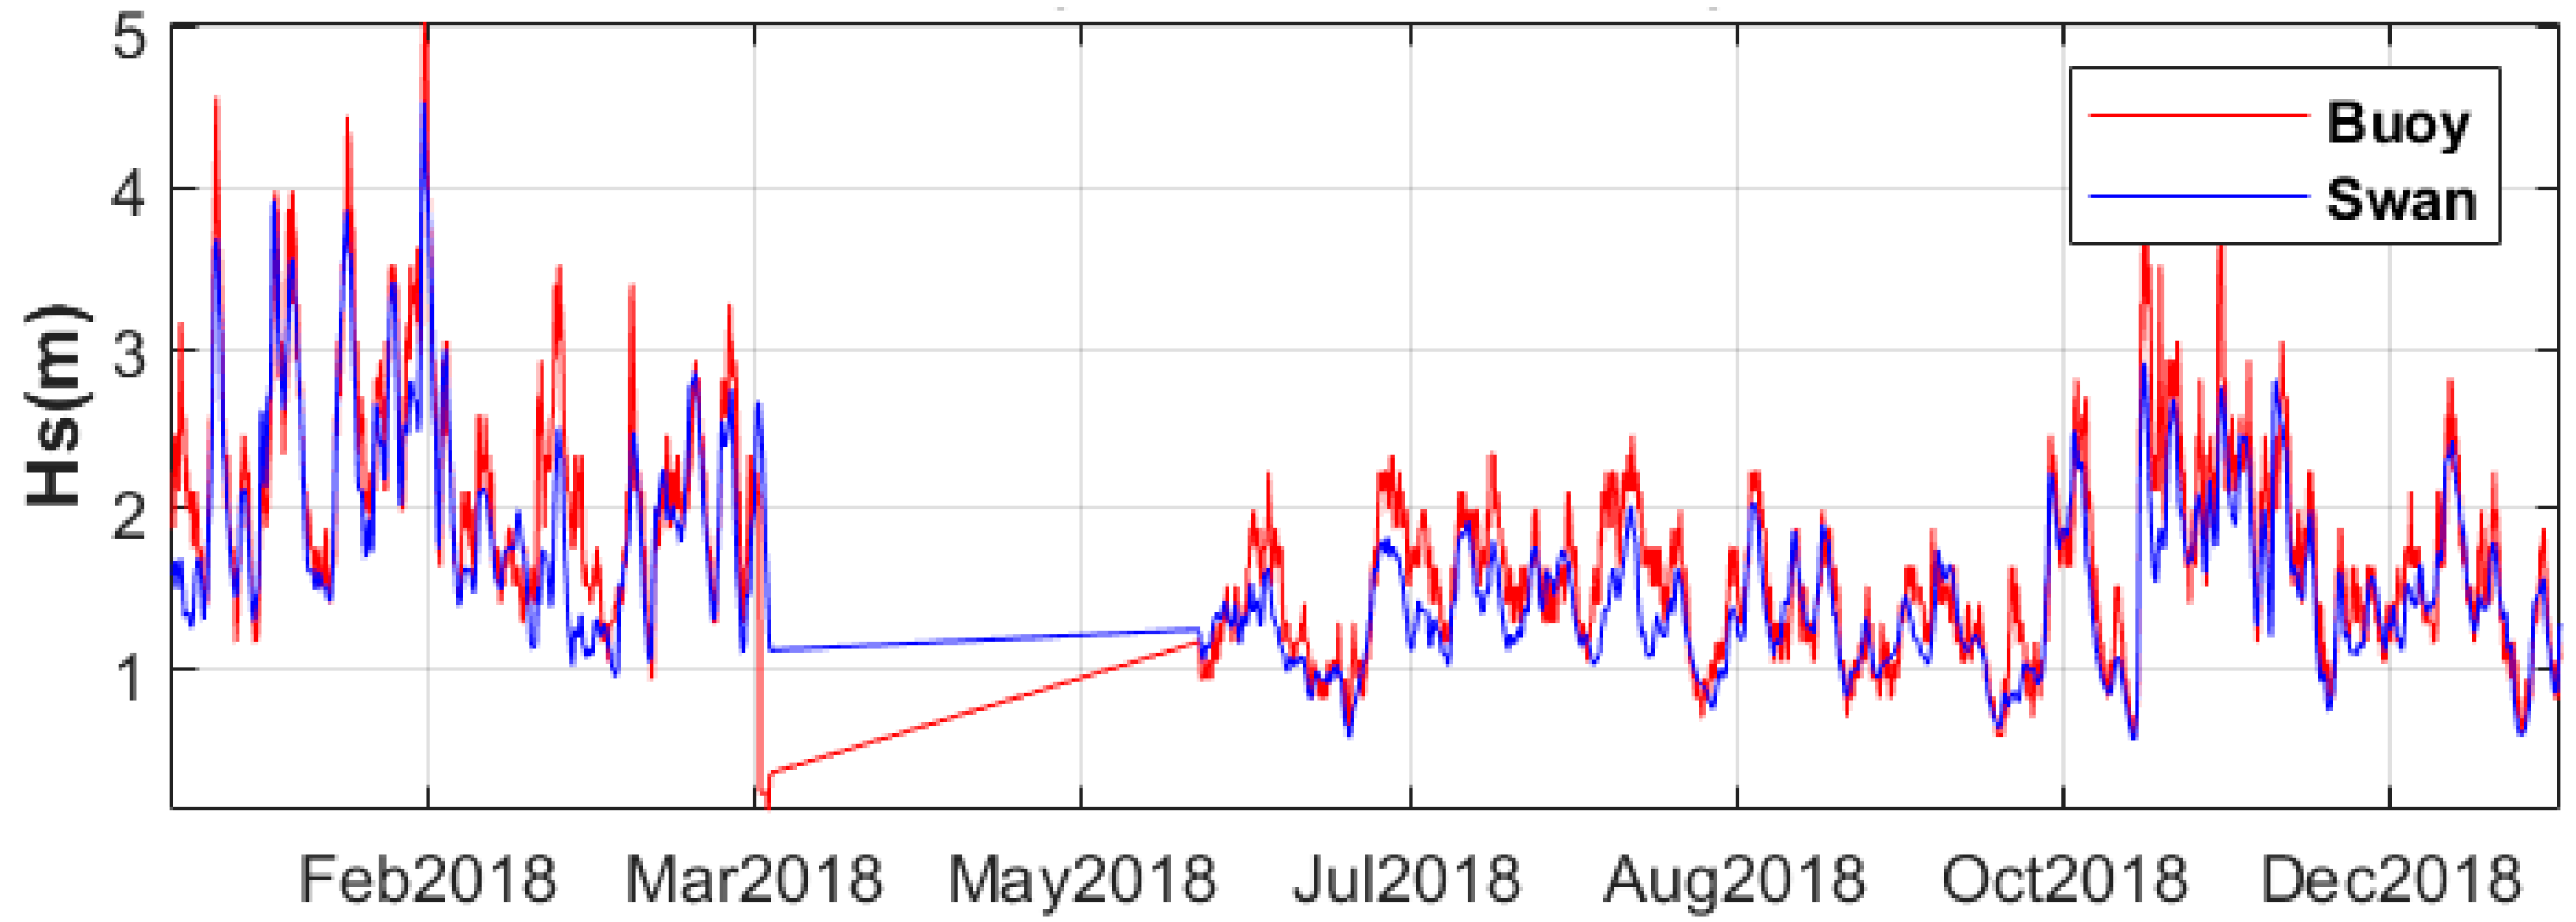
Since the data are not always continuous, the calibration was performed with the data from the year 2018, as shown in
Figure 4.
During the calibration, a bigger emphasis was put on the data coming from the Canary Islands due to its proximity to the area of interest.
For the scope of this study, nine different parametrizations were tested in order to determine which one would better adapt to the specific situation addressed in the study. The performance of all parametrizations was tested through four different indicators relative to the significant wave height, the bias, the root mean square (RMSE), the scatter index (SI), the Pearson correlation coefficient (r), and the mean absolute error (MAE). After these tests it was determined that the best results were the ones obtained during experiment 4 (EXP 4), using the Janssen’s physical model and the BSBT numerical model. The different experiments that were run are presented in
Table 2.
The results of significant wave height and wave power regarding the locations of the oceanographic buoys are listed in
Table 3. These results were obtained with the final parametrization (EXP 4).
The results of the significant wave height have been validated further for a longer period with the available data from the three buoys and are presented in
Table 4, achieving a bias below 0.2 in Faro and the Canary Islands and a correlation coefficient around 90%.
4. Results
4.1. Significant Wave Height
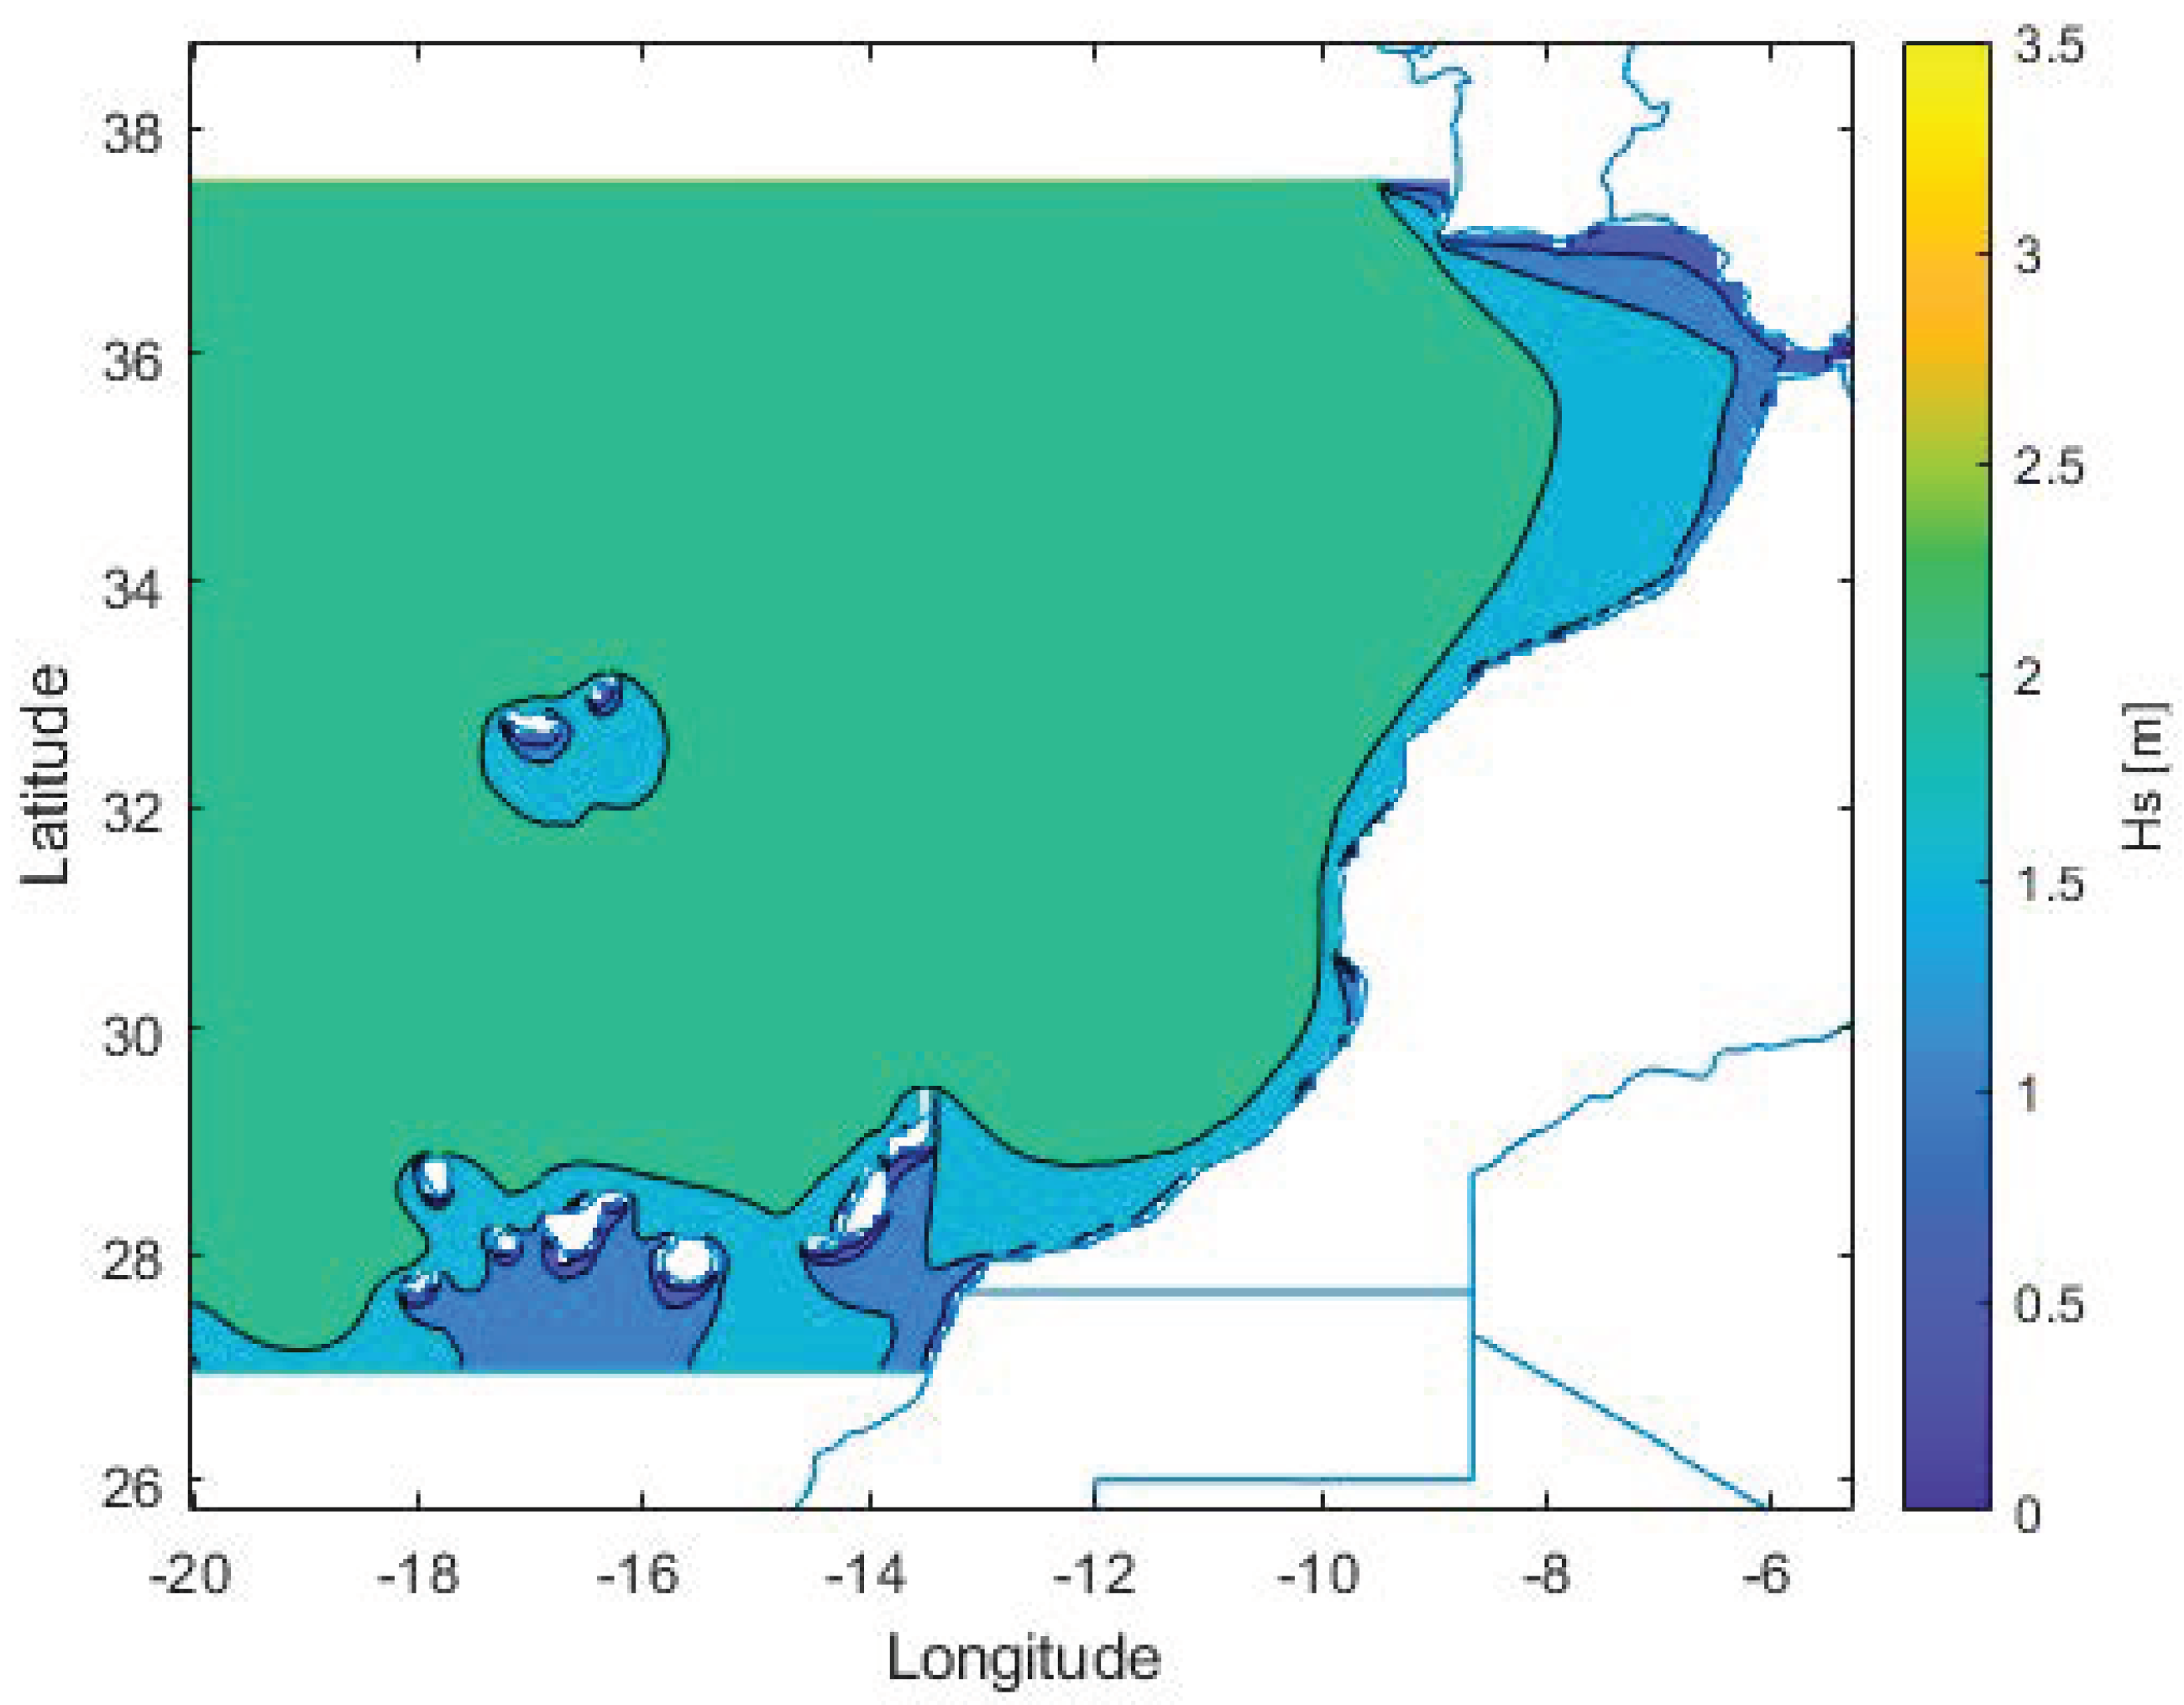
In the first approach, the average significant wave height over 30 years was mapped across the domain, as illustrated in
Figure 5. The maximum of the significant wave heights is 2.57 m, and the average of all values is 2.16 m. A southeast to northwest gradient can be observed.
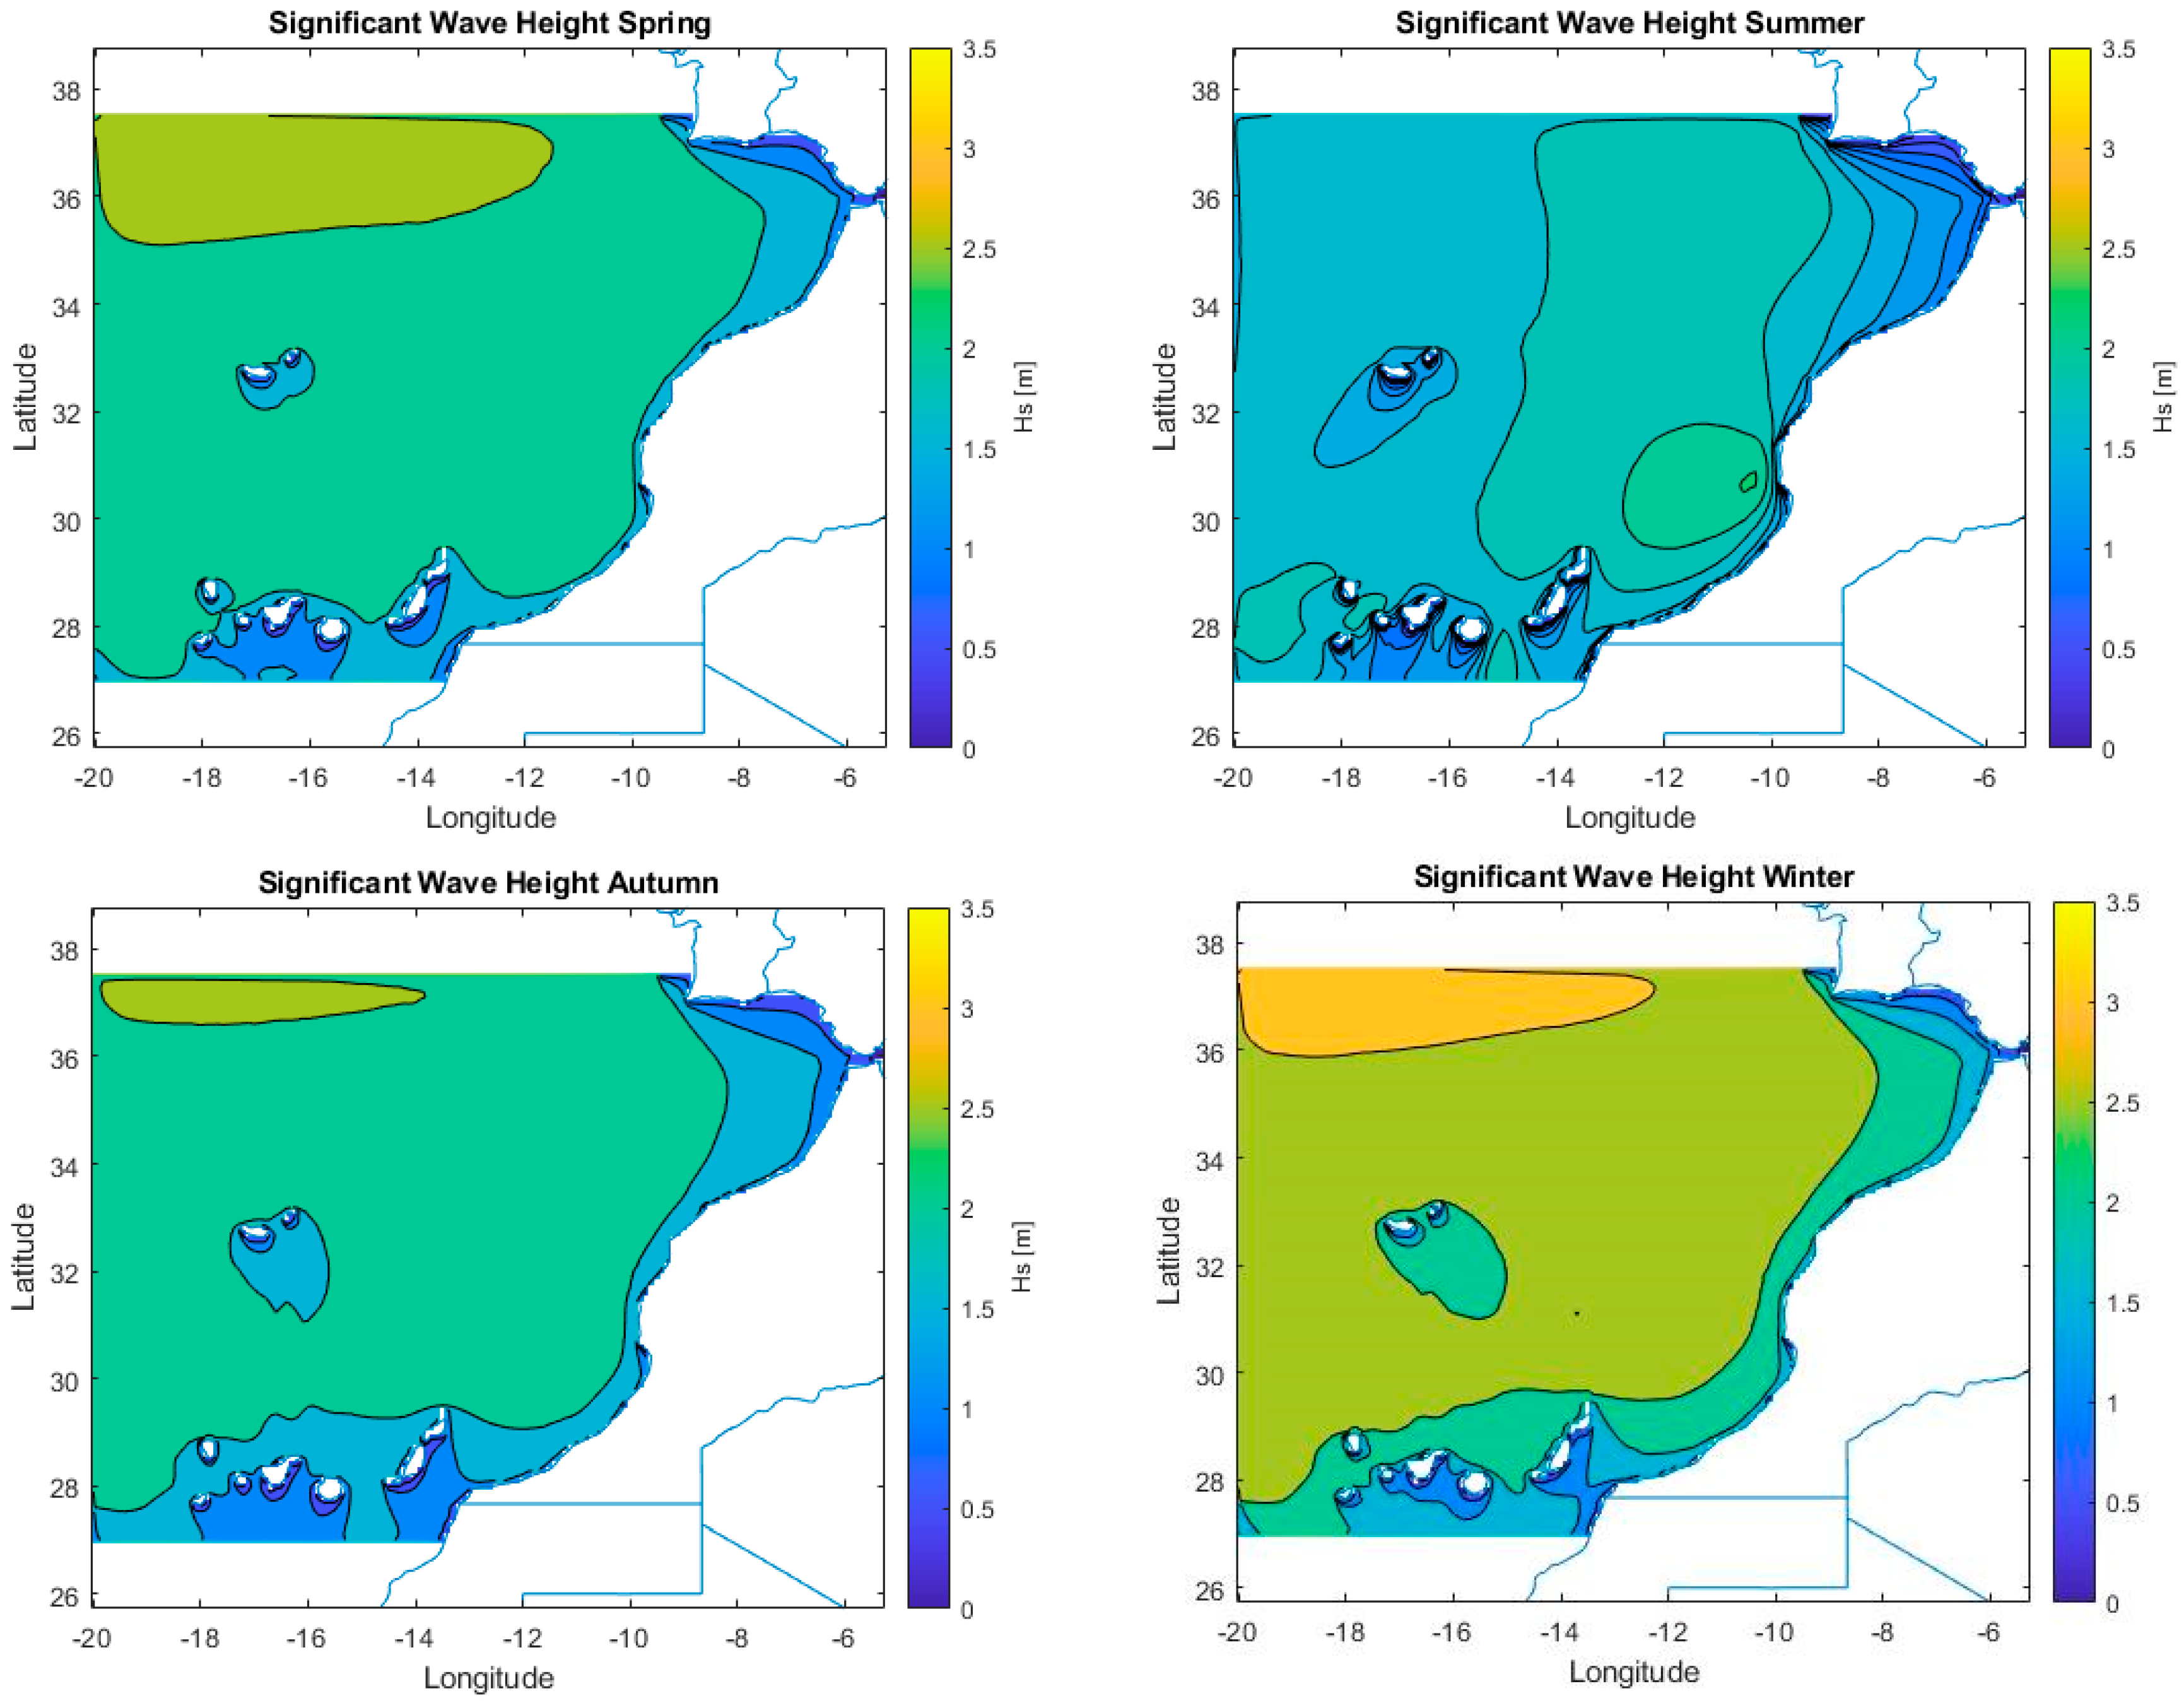
To understand the behavior of the significant wave height throughout the year, seasonal mean values were obtained and are represented in
Figure 6. Considering all points inside of the domain, the maximum mean wave height in winter and in summer within the domain is 3.10 m and 2.21 m, respectively. The average mean significant wave height over 30 years within the whole domain in winter and in summer is 2.57 m and 1.71 m, respectively. The reason for this is that most waves that approach the Moroccan Atlantic coast have their origin in the Azores islands, where the winds have large intensity and duration and generate high waves that propagate for long distances. It can be seen that the seasonal distribution of mean significant wave height reaches values up to 3 m (in the winter) in the northeast boundary of the domain, a direct consequence of the wave climate along the European Atlantic Coast [
35,
36]. In summer, the gradient is directed from east to north; however, the domain is more homogeneous with individual areas, with higher waves in the center of the country. During the other seasons, the gradient is directed from southeast to northwest.
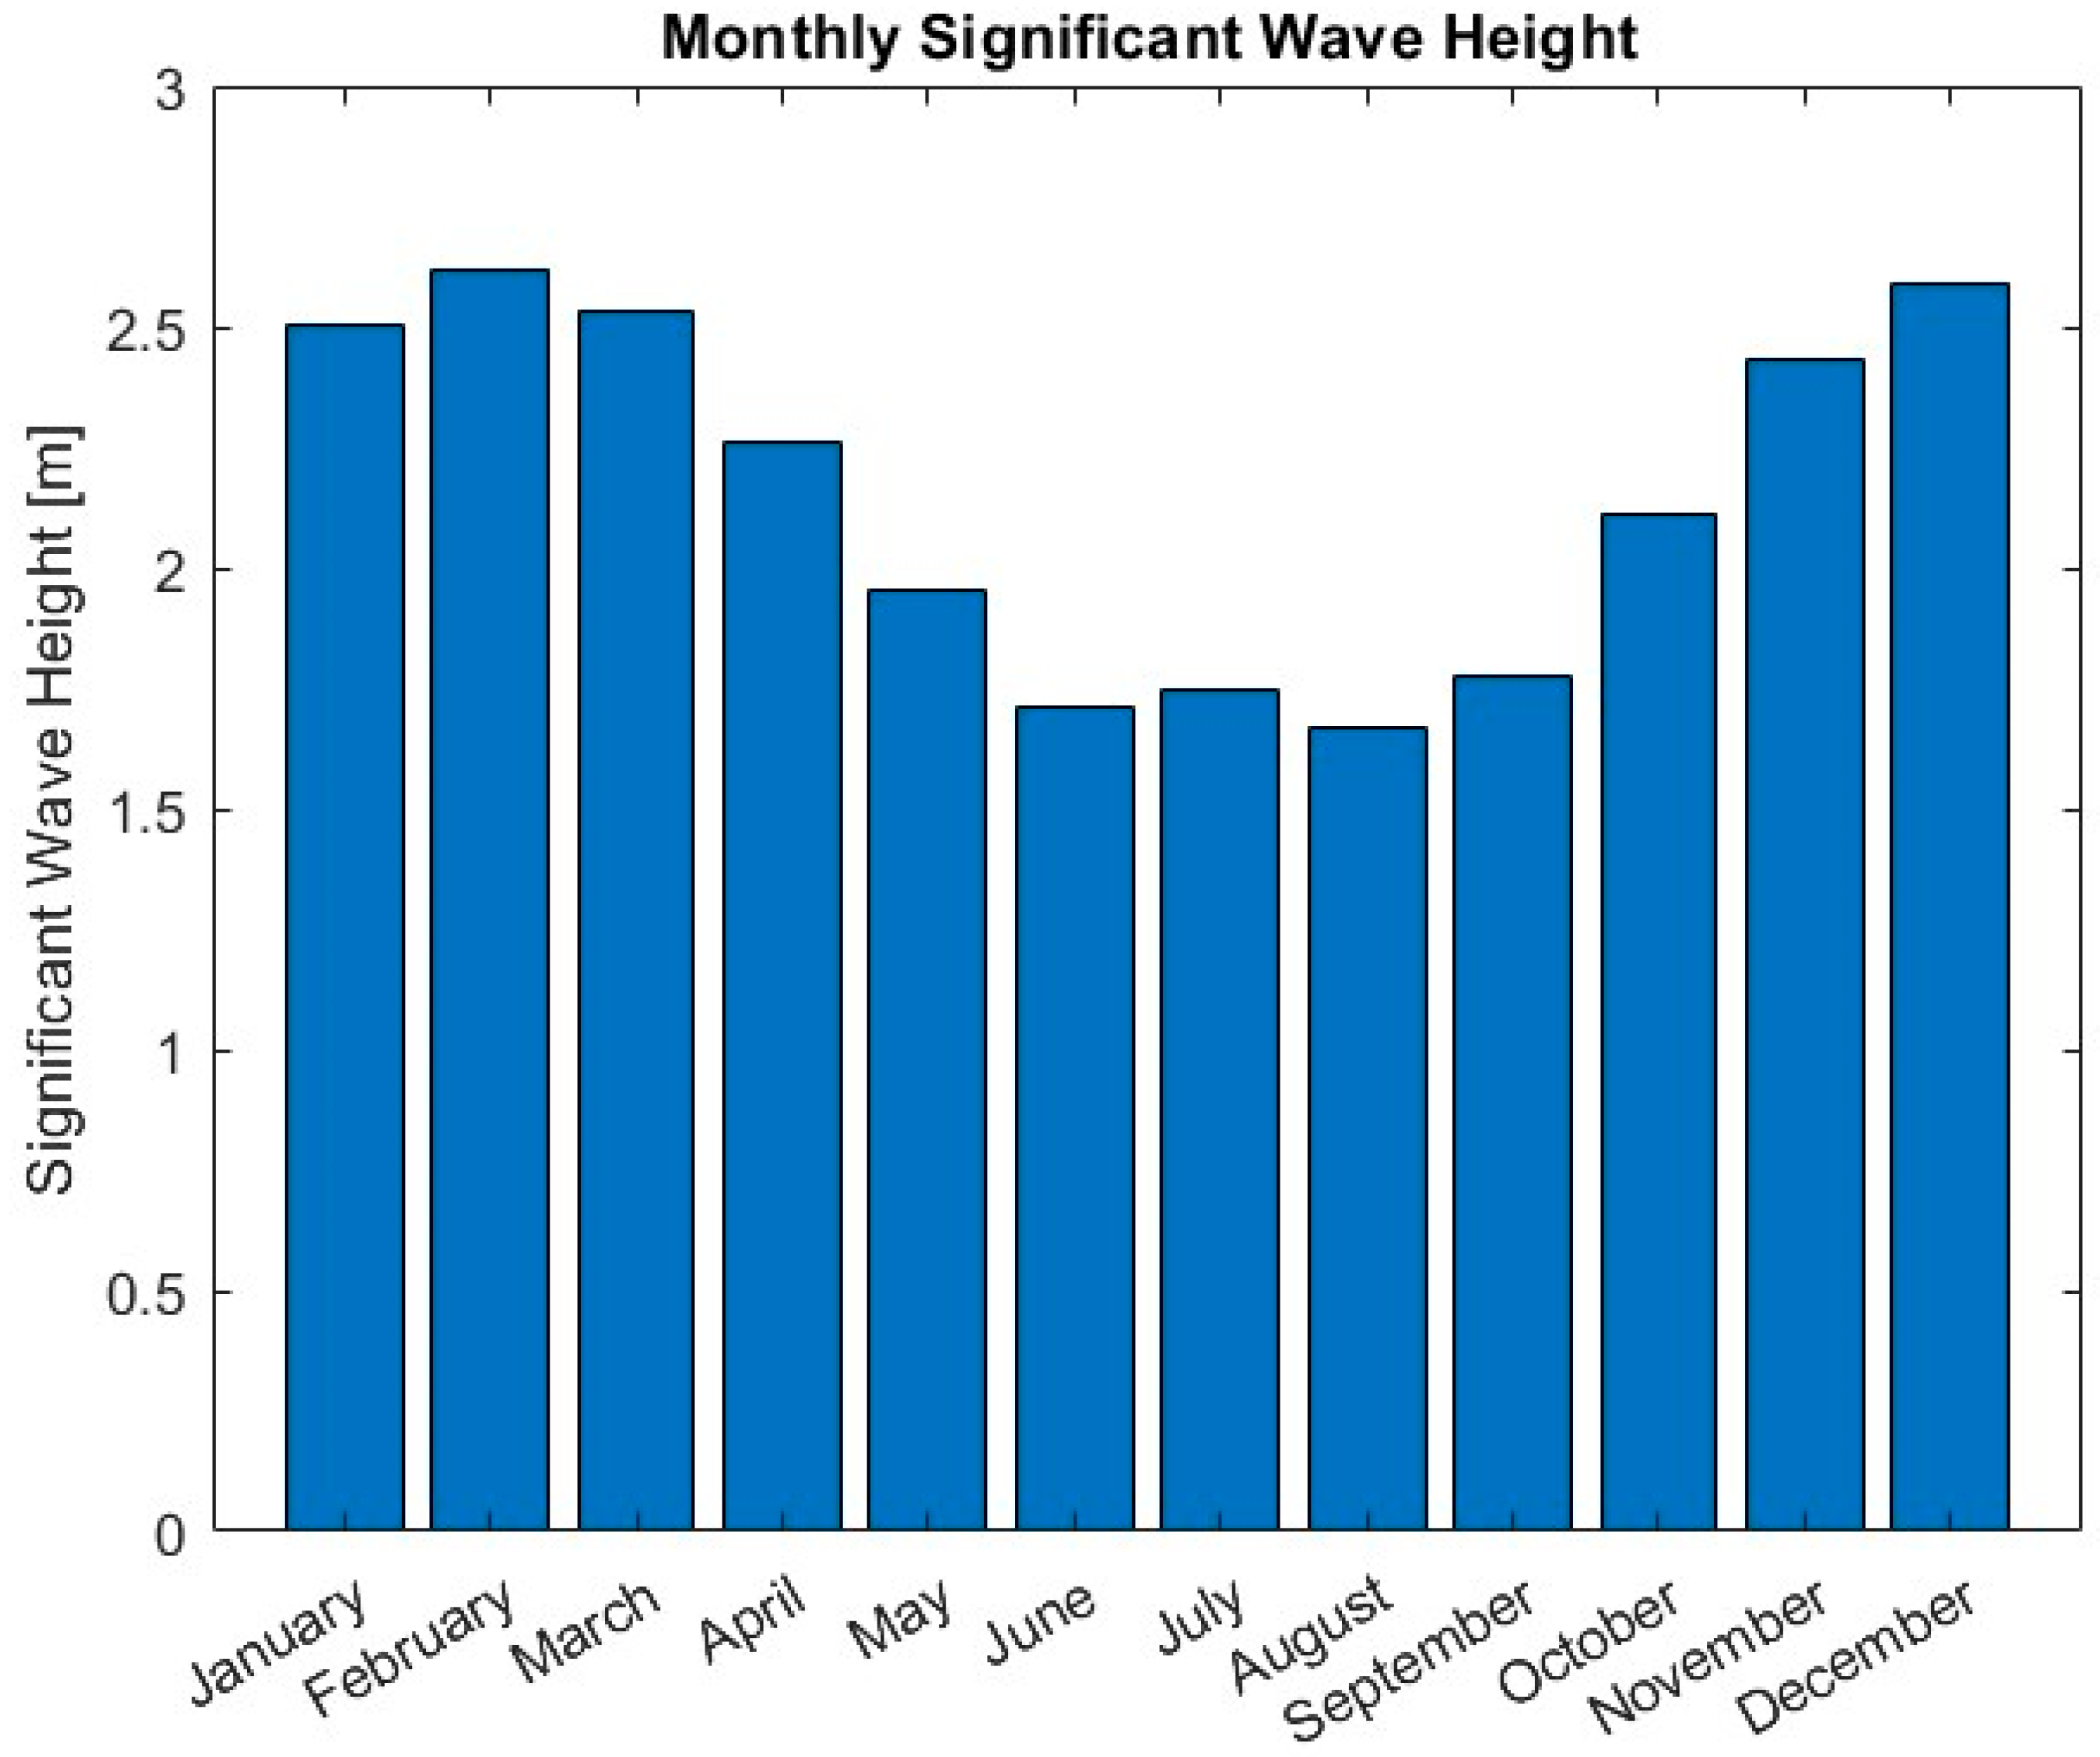
The average variation of significant wave height throughout the months is represented in
Figure 7. Taking into account all points inside of the domain, the highest average waves are registered in February at 2.6 m, and the lowest ones are in August, at a height of 1.7 m.
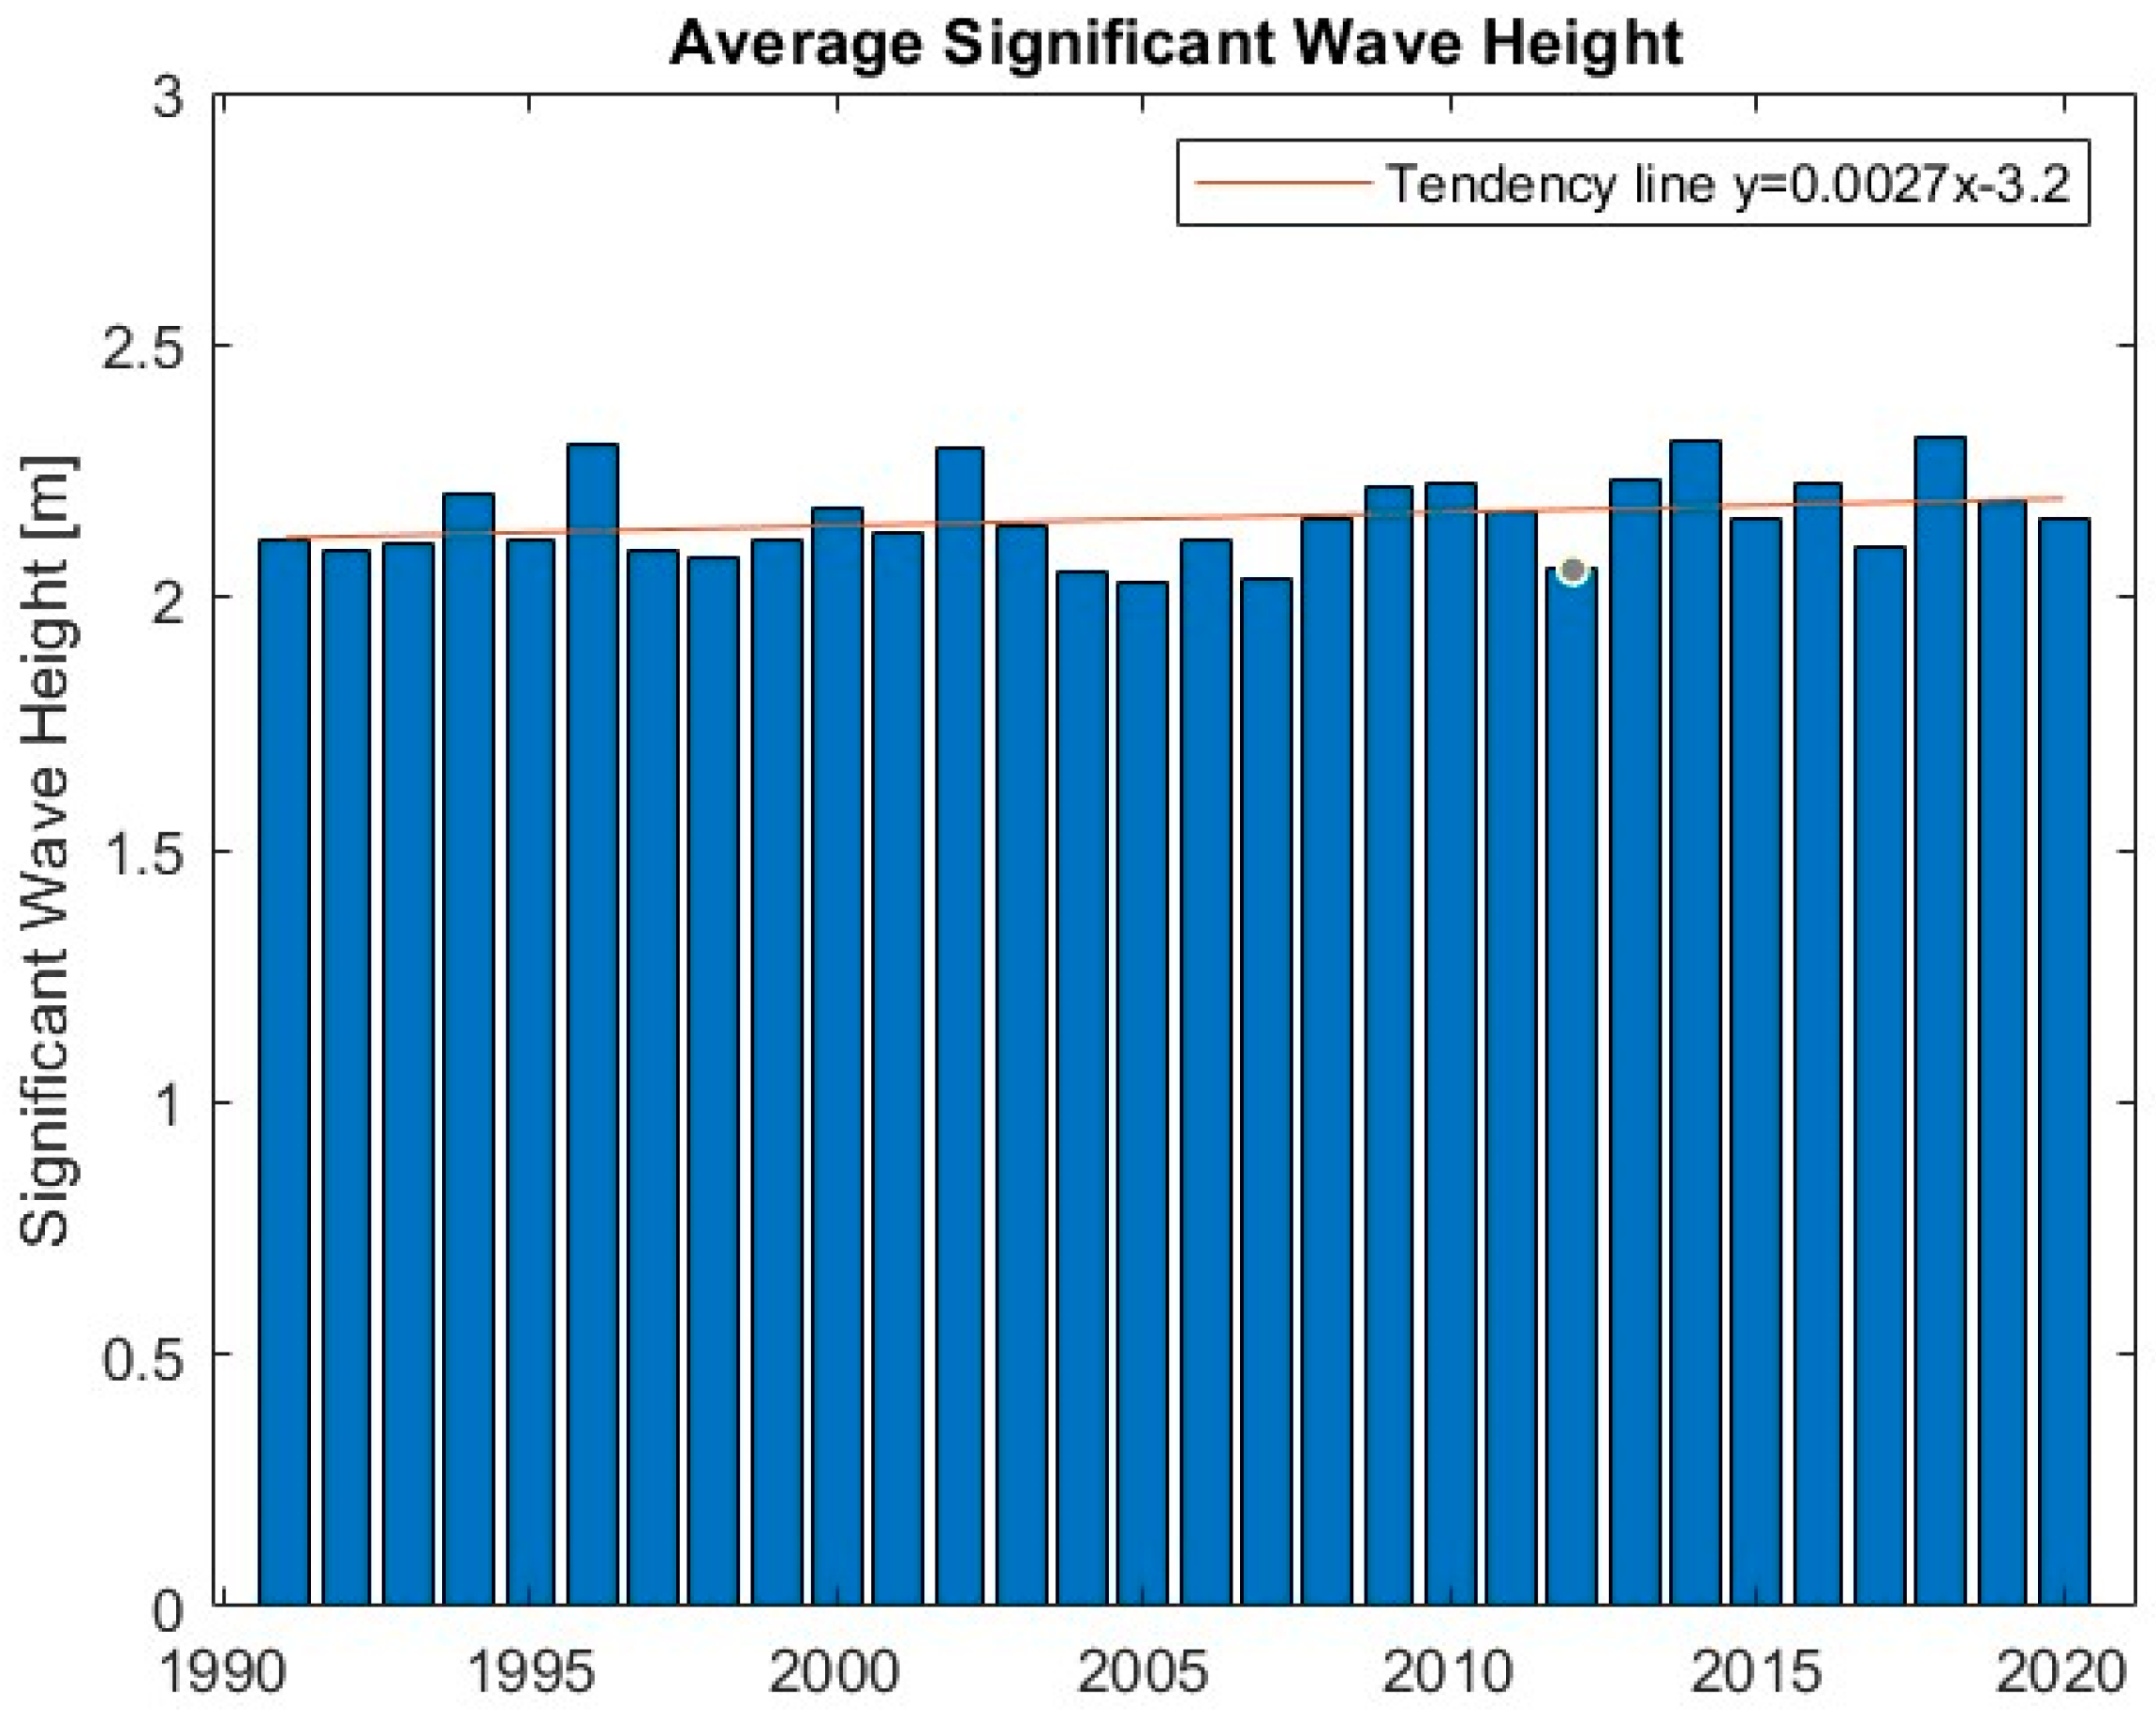
Figure 8 shows the evolution of the average significant wave height over the 30 years. The significant wave height has a slight positive tendency throughout the 30-year timespan, increasing on average by about 2.7 mm each year.
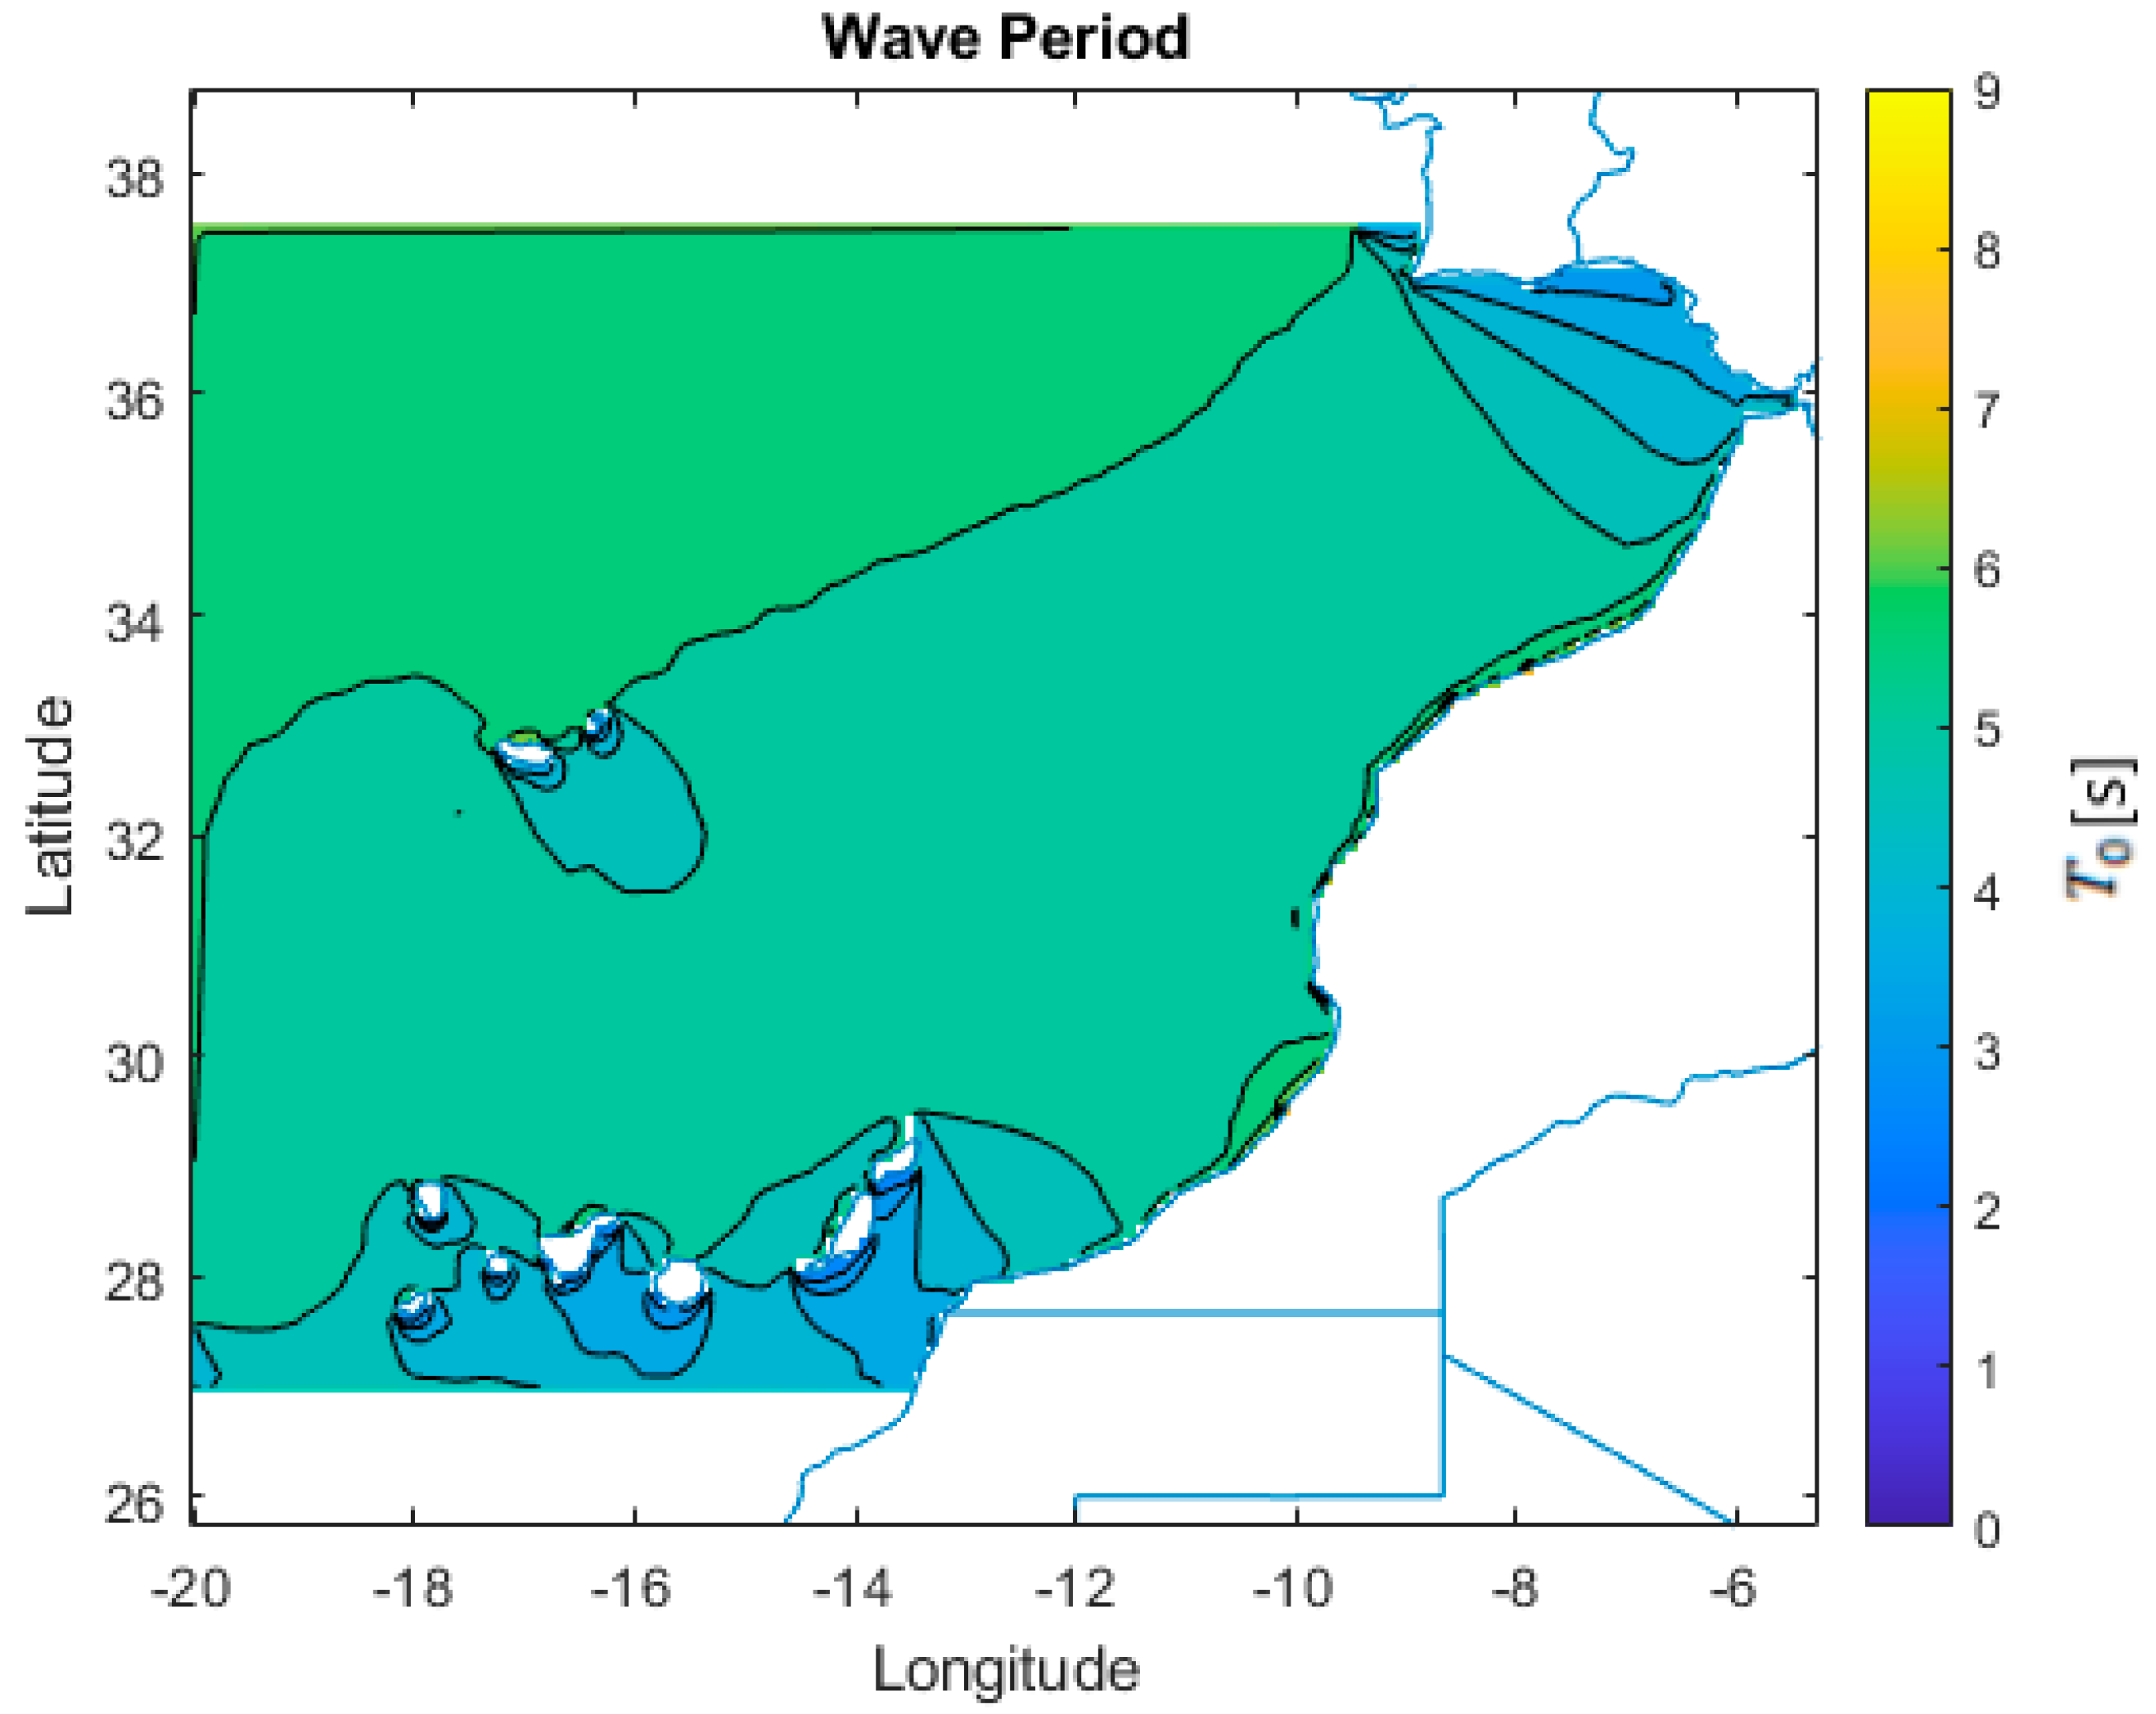
4.2. Period
The period within the domain is presented in
Figure 9. The maximum mean wave period is 7.43 s, and the mean is 5.24 s. For both measures, the gradient is noticeably directed from southeast to northwest.
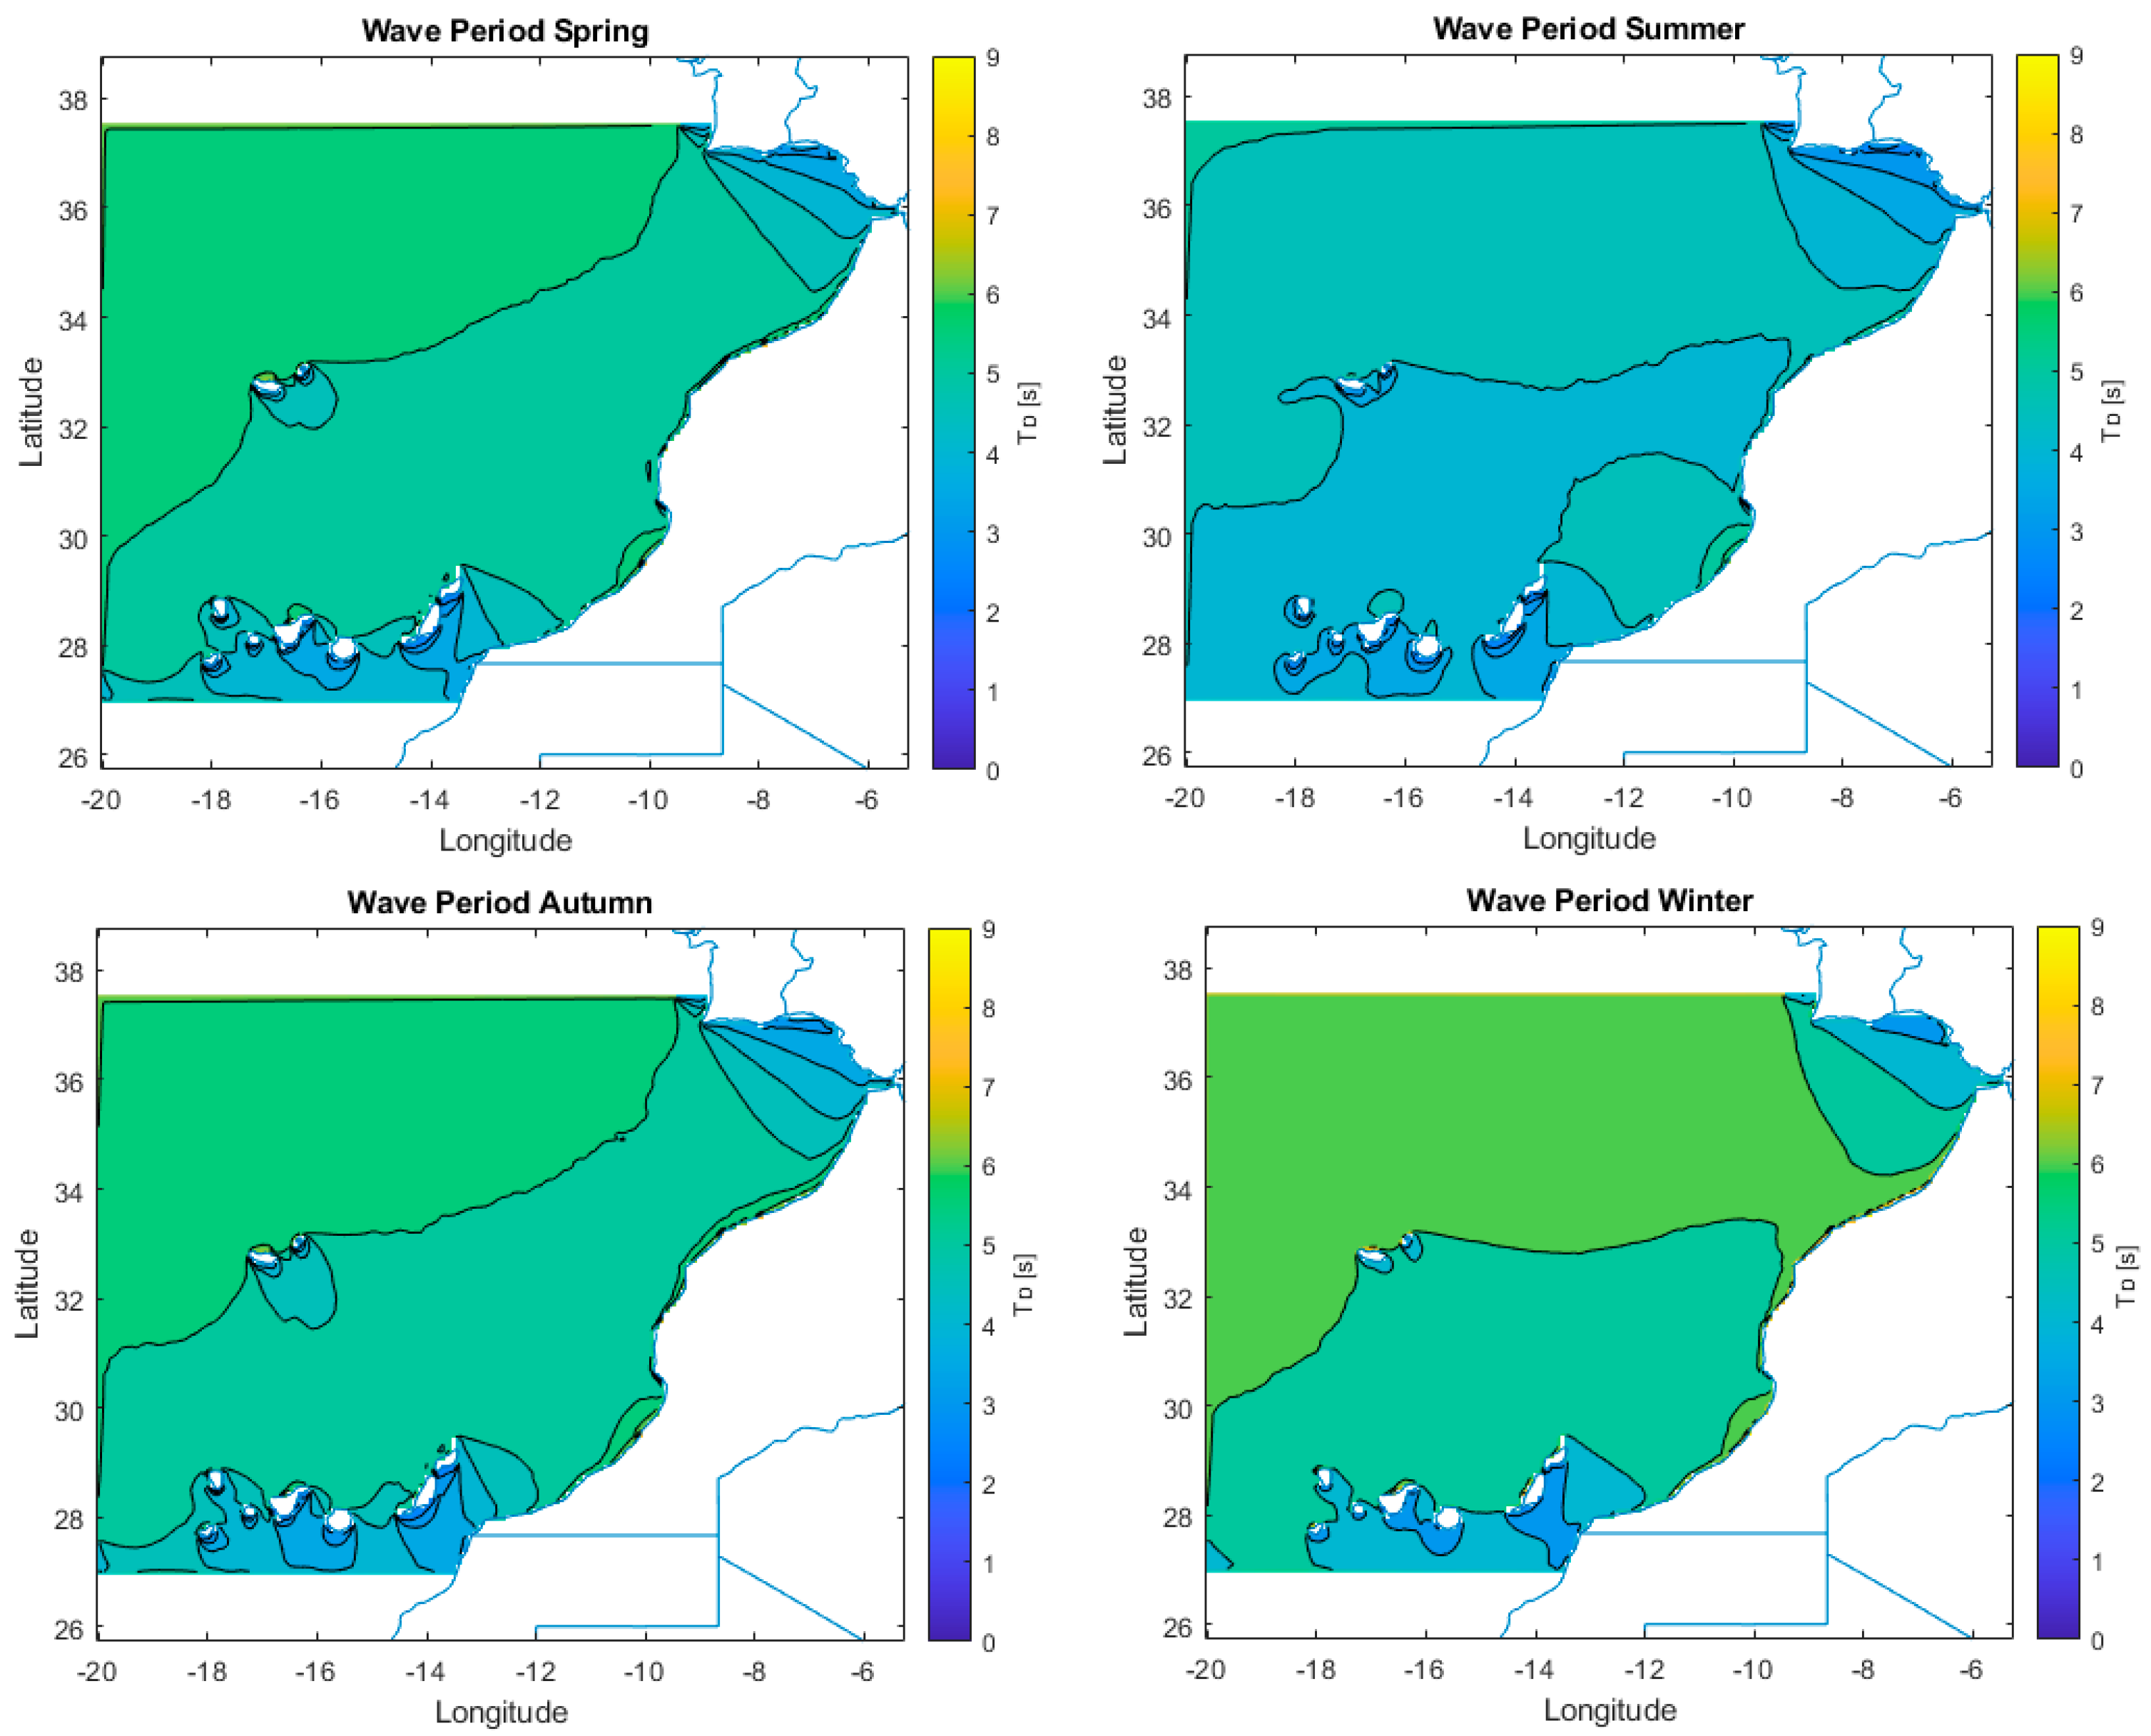
Taking into account all points from the domain over 30 years, the maximum mean wave period in winter and in summer within the domain is 8.91 s and 6.26 s, respectively. The average mean wave period over 30 years within the whole domain in winter and in summer is 5.84 s and 4.51 s, respectively. In summer, the wave period distribution is almost homogeneous, and during the other three seasons, the isometric lines are more parallel to the coast. The gradient is directed from southeast to northwest, as illustrated in
Figure 10.
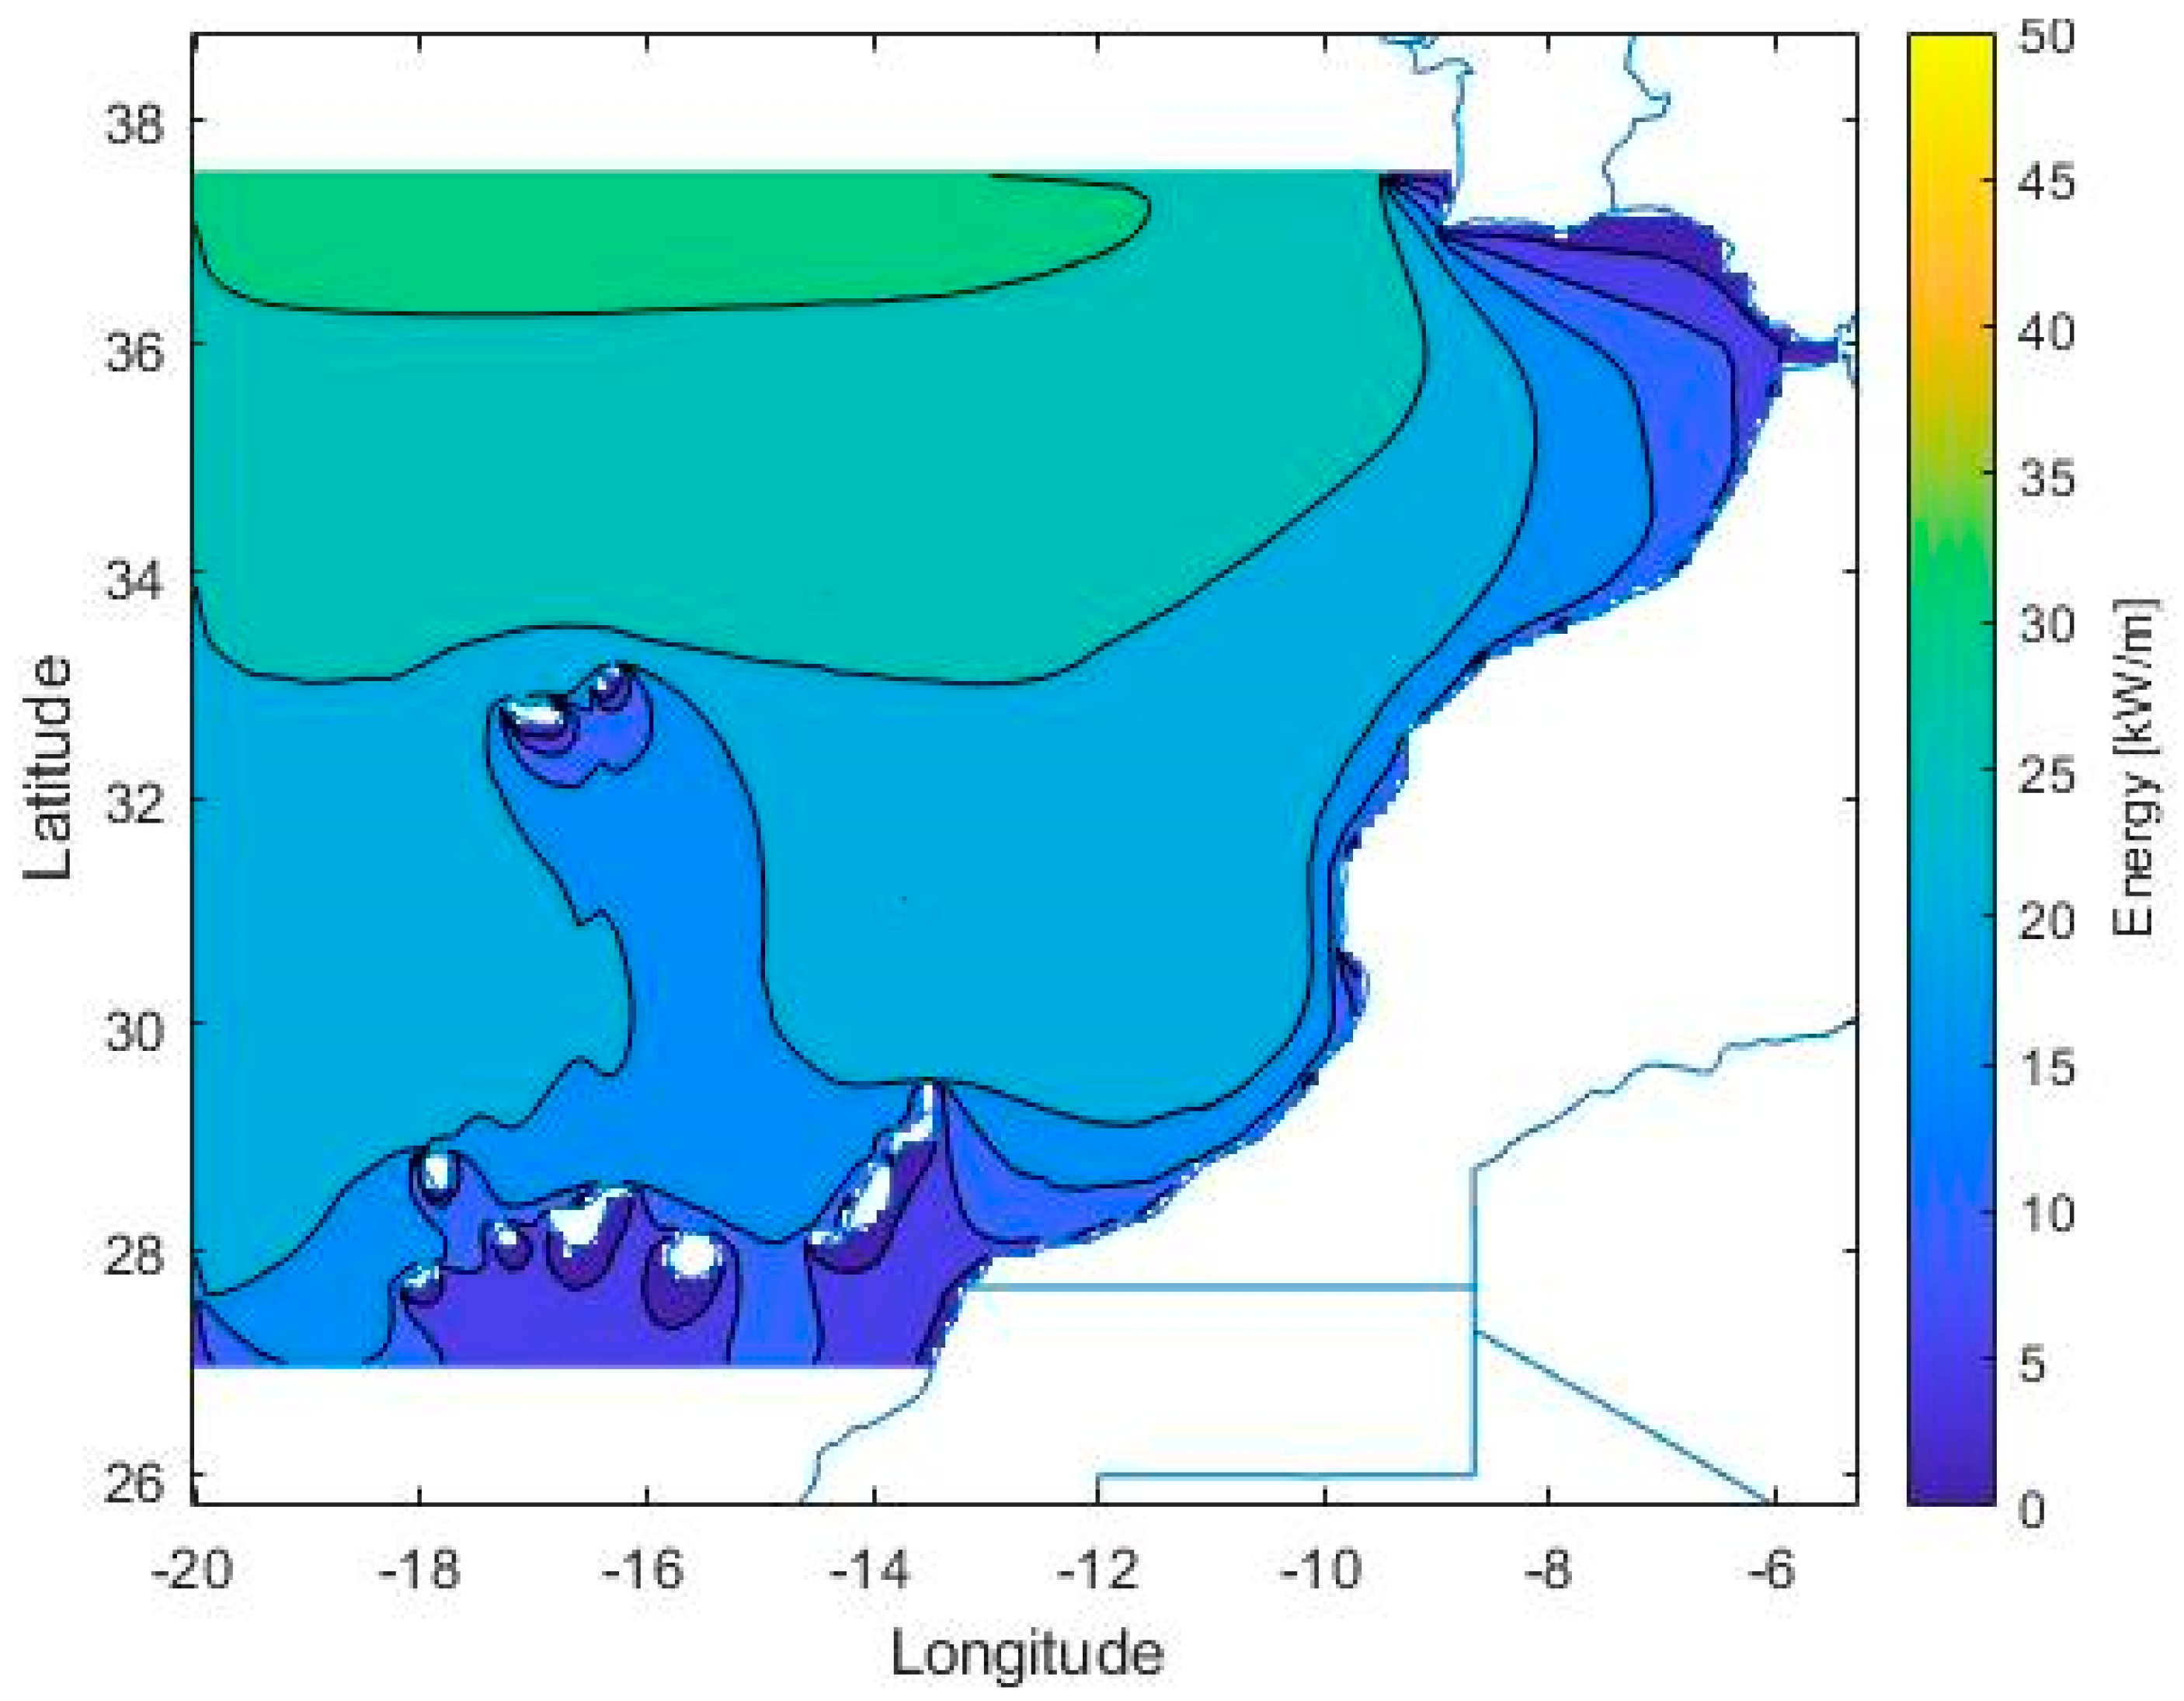
4.3. Energy
The average energy is calculated for the whole domain according to Equation (4) and is presented in
Figure 11. It can be observed that the most energetic areas on the Moroccan coastline are located at the center of the country between latitudes 29° and 33°. In the north, the waves are less energetic due to the orientation of the coastline, the bathymetry, and the shadow effects of the Iberian Peninsula. In the south, the waves have less power due to the shadow effect of the Canary Islands. Considering all points within the domain, the mean energy is 22.3 kW/m. Gradients within the domain head from south to north in the open Atlantic region but from southeast to northwest in the coastal region, being perpendicular to the coastline.
It is of interest to mention the shadow effects produced by the islands, which are felt long distances away and affect the conditions on the coast. These shadow effects are only detected with fine grid models, and thus in ocean models, they are not normally represented. However, in the case of the Azores islands, [
32] detected this effect and its repercussions. This was then confirmed in other studies, such as [
33], and this study also confirms this effect.
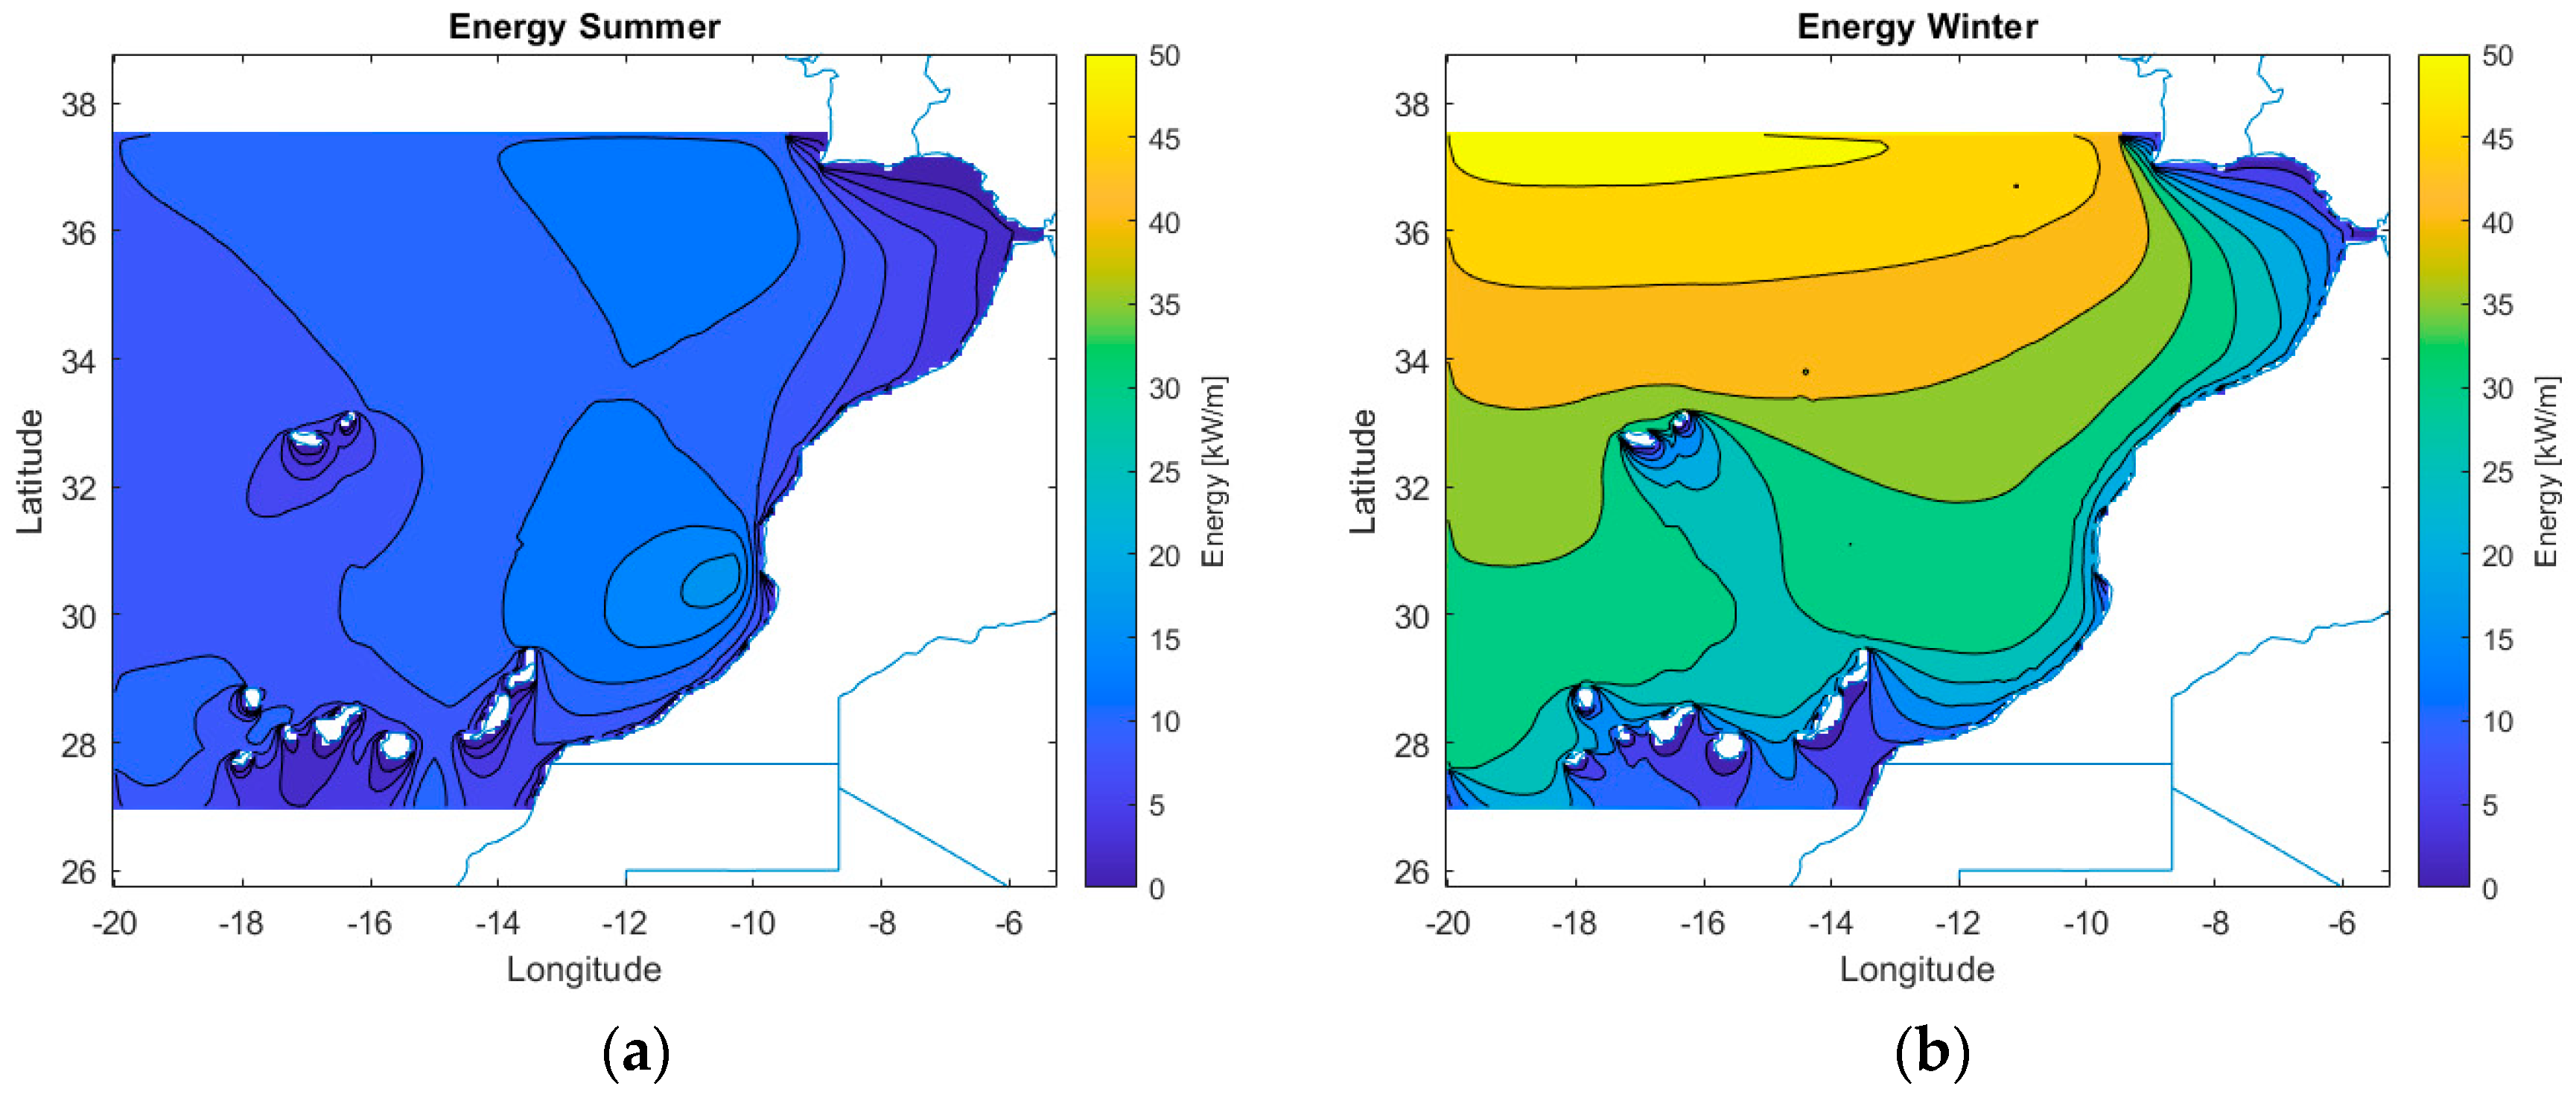
Figure 12 shows the mean energy in winter and in summer. Taking into account all points inside of the domain, the mean energy in this area is 34.8 kW/m and 10.1 kW/m, respectively. In winter, the gradients are well defined, going from south to north in deeper waters and from southeast to northwest close to the coast, being only disturbed by the Canary and Madeira Archipelagos. In summer, gradients are not that clearly defined, and the energy field is more homogeneous; however, in general, gradients head from east to west. In summer, a high energy area close to Agadir and Essaouira can be observed.
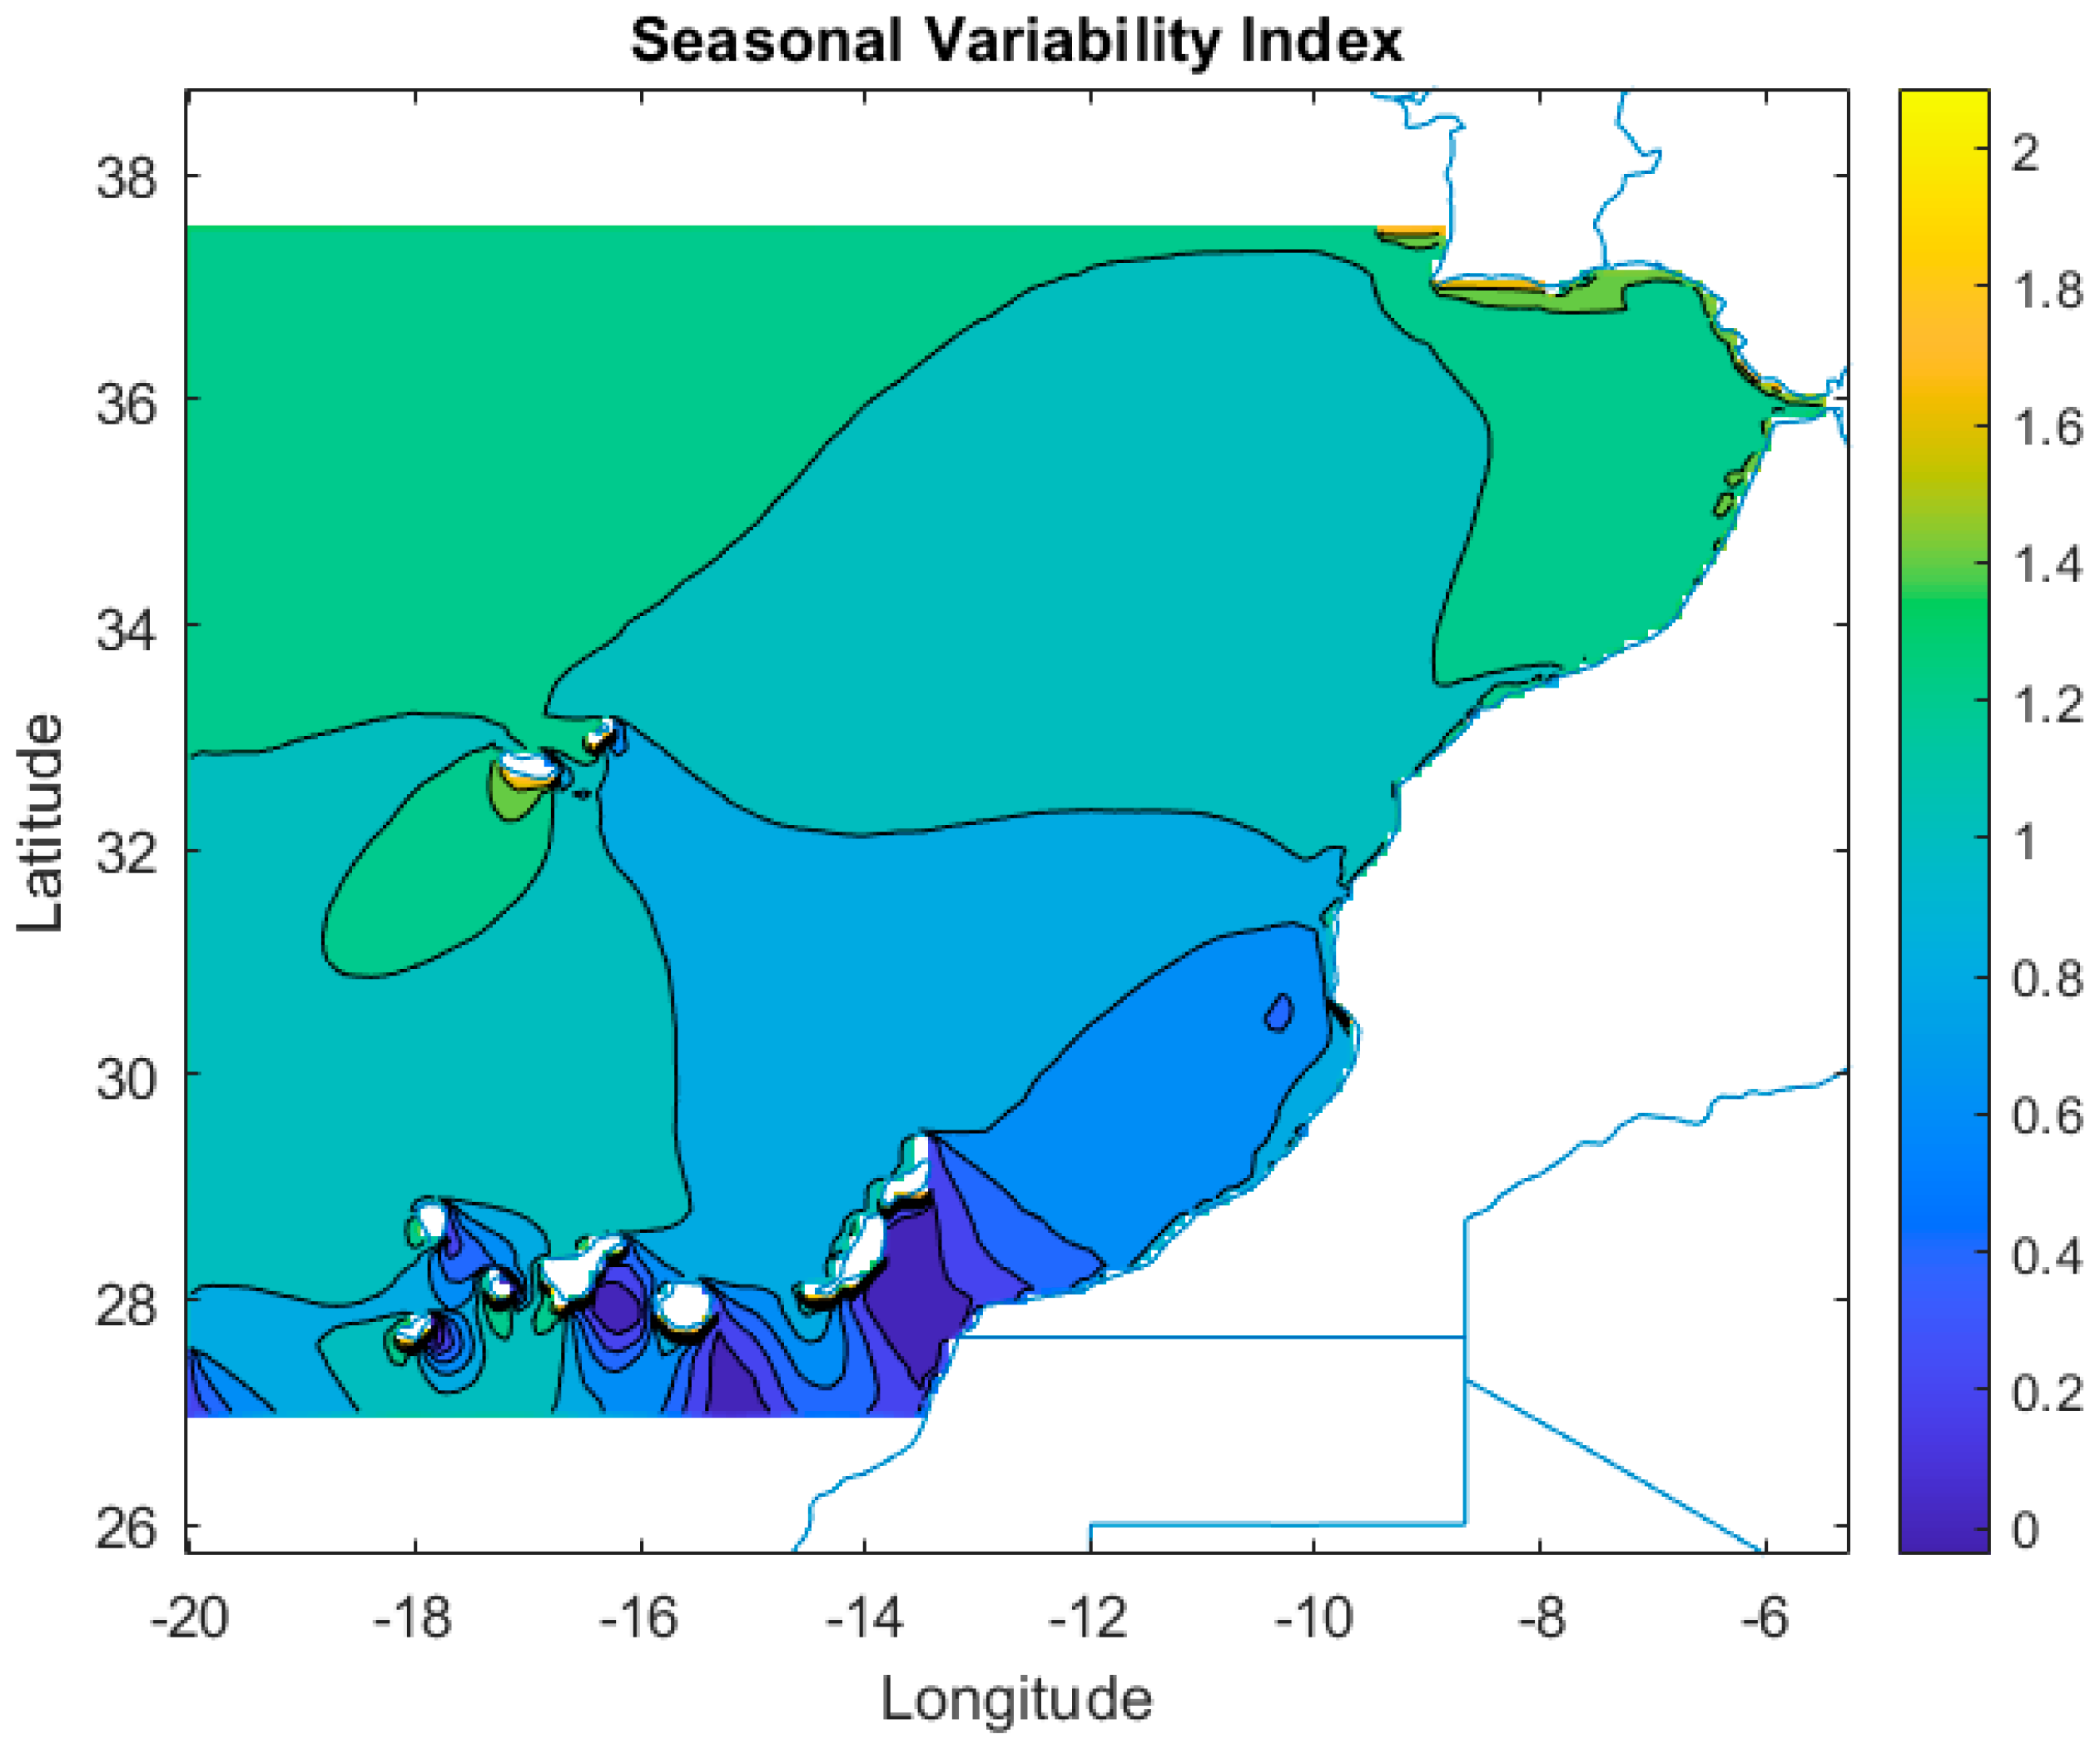
The seasonal variability index (
SVI) indicates the variability of wave energy between summer and winter and is calculated as follows:
where
and
are the average wave energy in summer and in winter, respectively, and
is the average wave energy each year. The result is presented in
Figure 13. The average
SVI is 1.1. In the sheltered area close to the Canary Islands, the
SVI is close to zero. The largest
SVI is located at the north coast. The gradient of seasonal
SVI has a south to north direction.
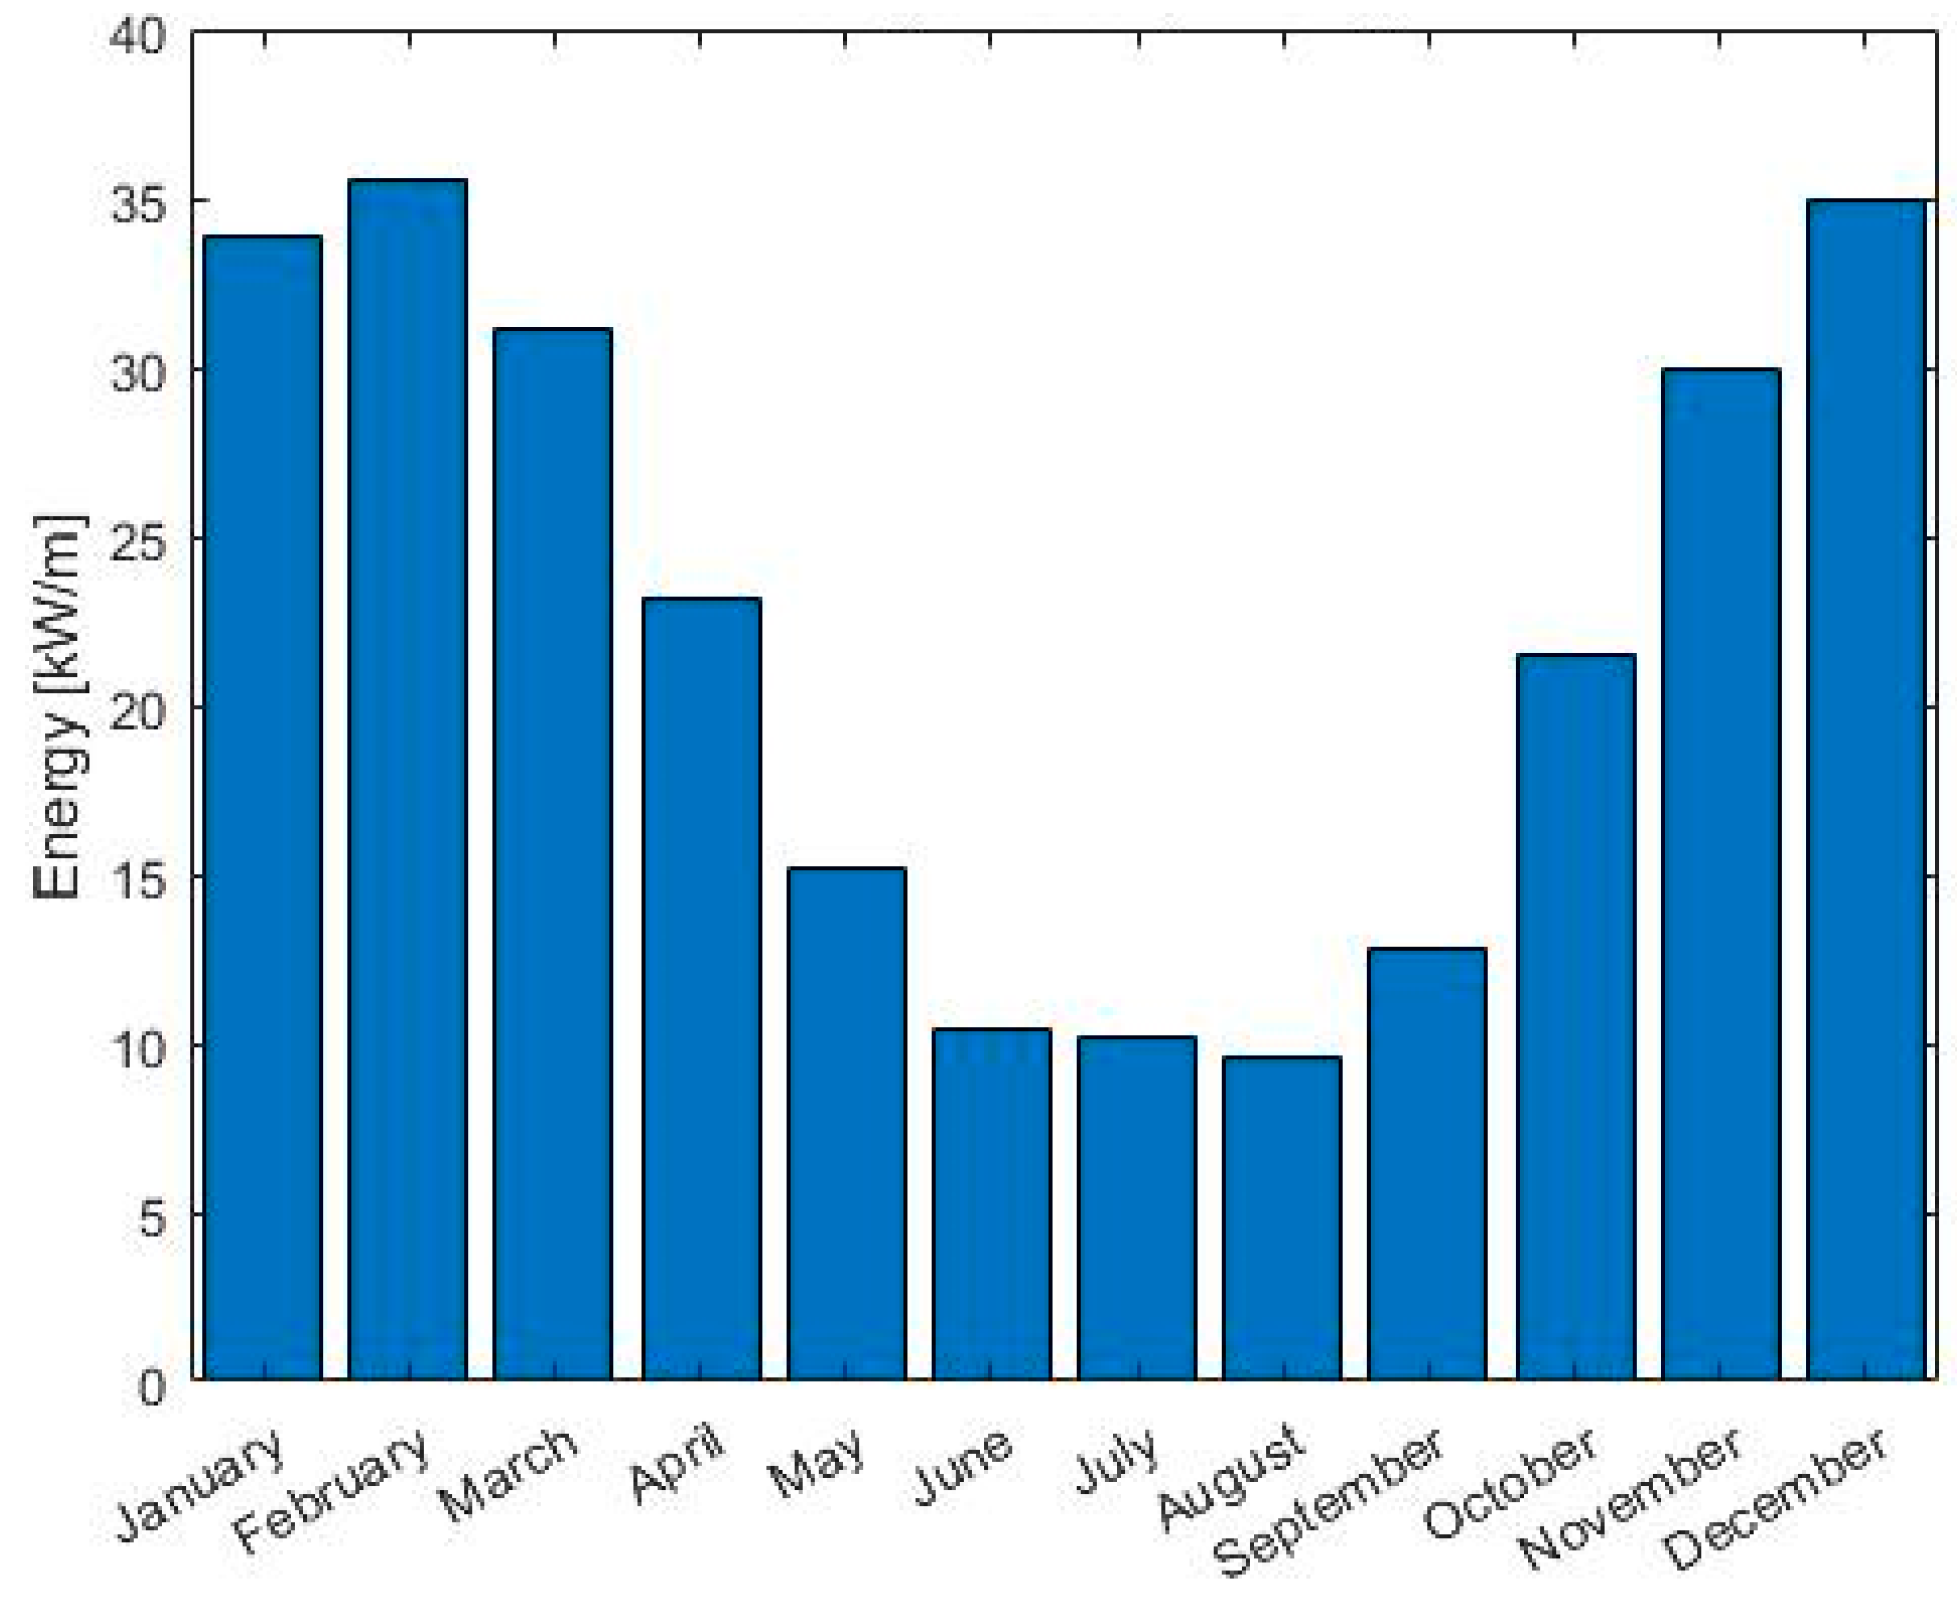
The seasonal cycle of the wave energy is presented in
Figure 14, which shows the average monthly energy within the domain for each month. The most energetic month is February, with an energy above 35 kW/m, and the lowest month is August, with an average energy of about 10 kW/m.
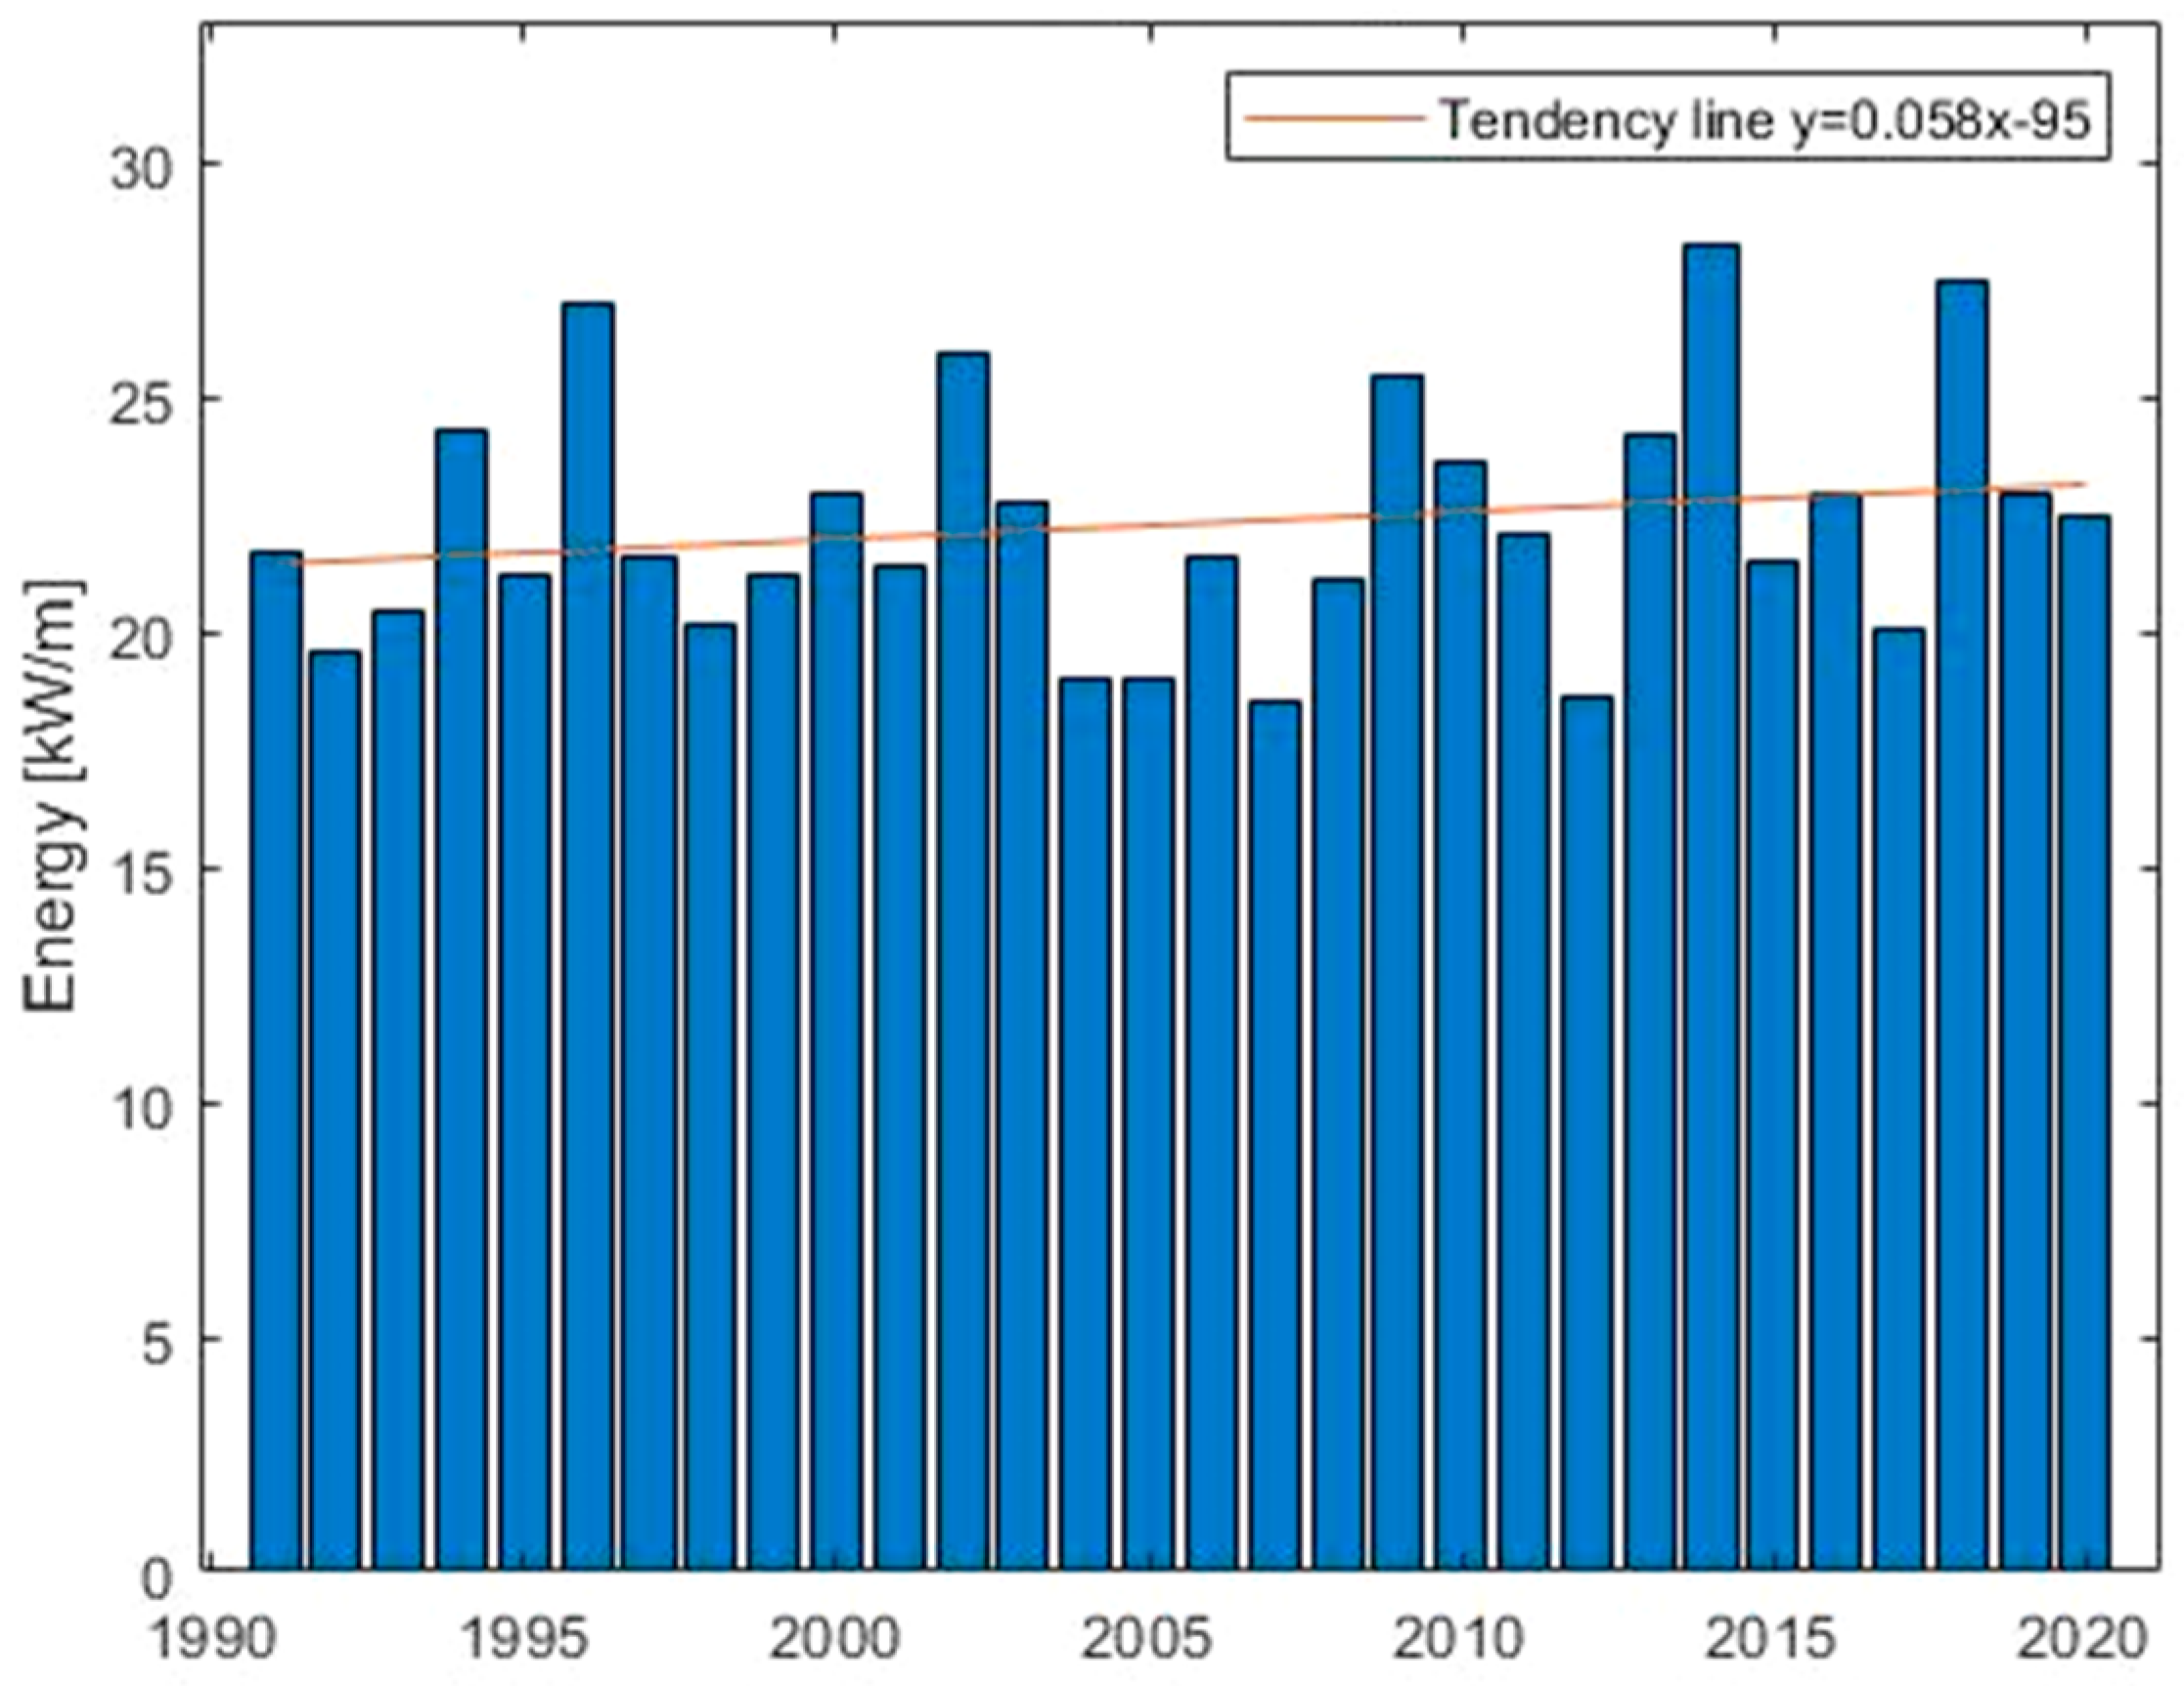
The average annual energy over the 30-year timespan within the domain is presented in
Figure 15. The two most energetic years are 2014 and 2018, with an average of 28.2 kW/m and 27.5 kw/m, respectively. The least energetic years are 2007 and 2012, with an average energy of 18.5 Kw/m and 18.6 kW/m. The overall average energy throughout the years is 22.3 kW/m. The tendency line shows that throughout the 30-years timespan, the average yearly energy increases at a rate of more than 0.058 kW/m per year, which is a slight positive trend.
4.4. Local Analysis
An assessment of local conditions was conducted for 15 individual locations listed in
Table 5 and
Table 6 and shown in
Figure 16. Ten of those locations were chosen in accordance with the sites analyzed by the study from [
8]. The other five were chosen strategically in proximity to urban areas.
The average significant wave height and relevant statistics at each location are presented in
Table 7 and
Table 8. The data show that the mean significant wave height tends to be higher in the center and south of the coast. While the 99% quantile follows the same trend, the variability does not vary significantly between the locations. The skewness of the significant wave height is positive for all locations. In order to measure the long-term trend over the 30 years at each point, the Mann–Kendall test was applied [
37] at a 95% significance level. It shows that the hypothesis of a long-term trend can be valid for 13 out of the 15 locations, all of whom presented a slight increasing trend over the years; the only locations where the test’s hypothesis is rejected are located close to Casablanca and to El Jadida.
The statistical data regarding wave energy, as calculated by Equation (4), at each site are presented in
Table 9 and
Table 10. As a result of the distribution of the significant wave height throughout the domain, the mean wave power tends to be more intense in the center and south of the coast. Similarly, the 99% quantile has the same behavior. The most energetic locations are located around Agadir and Essaouira. The variance is highest in the most energetic areas. Skewness is always positive. The Mann–Kendall, which was applied in all of the 15 locations, shows a subtle positive tendency over the years.
The predominant direction of incoming waves at all sites is northwest since the swell arrives from the North Atlantic.
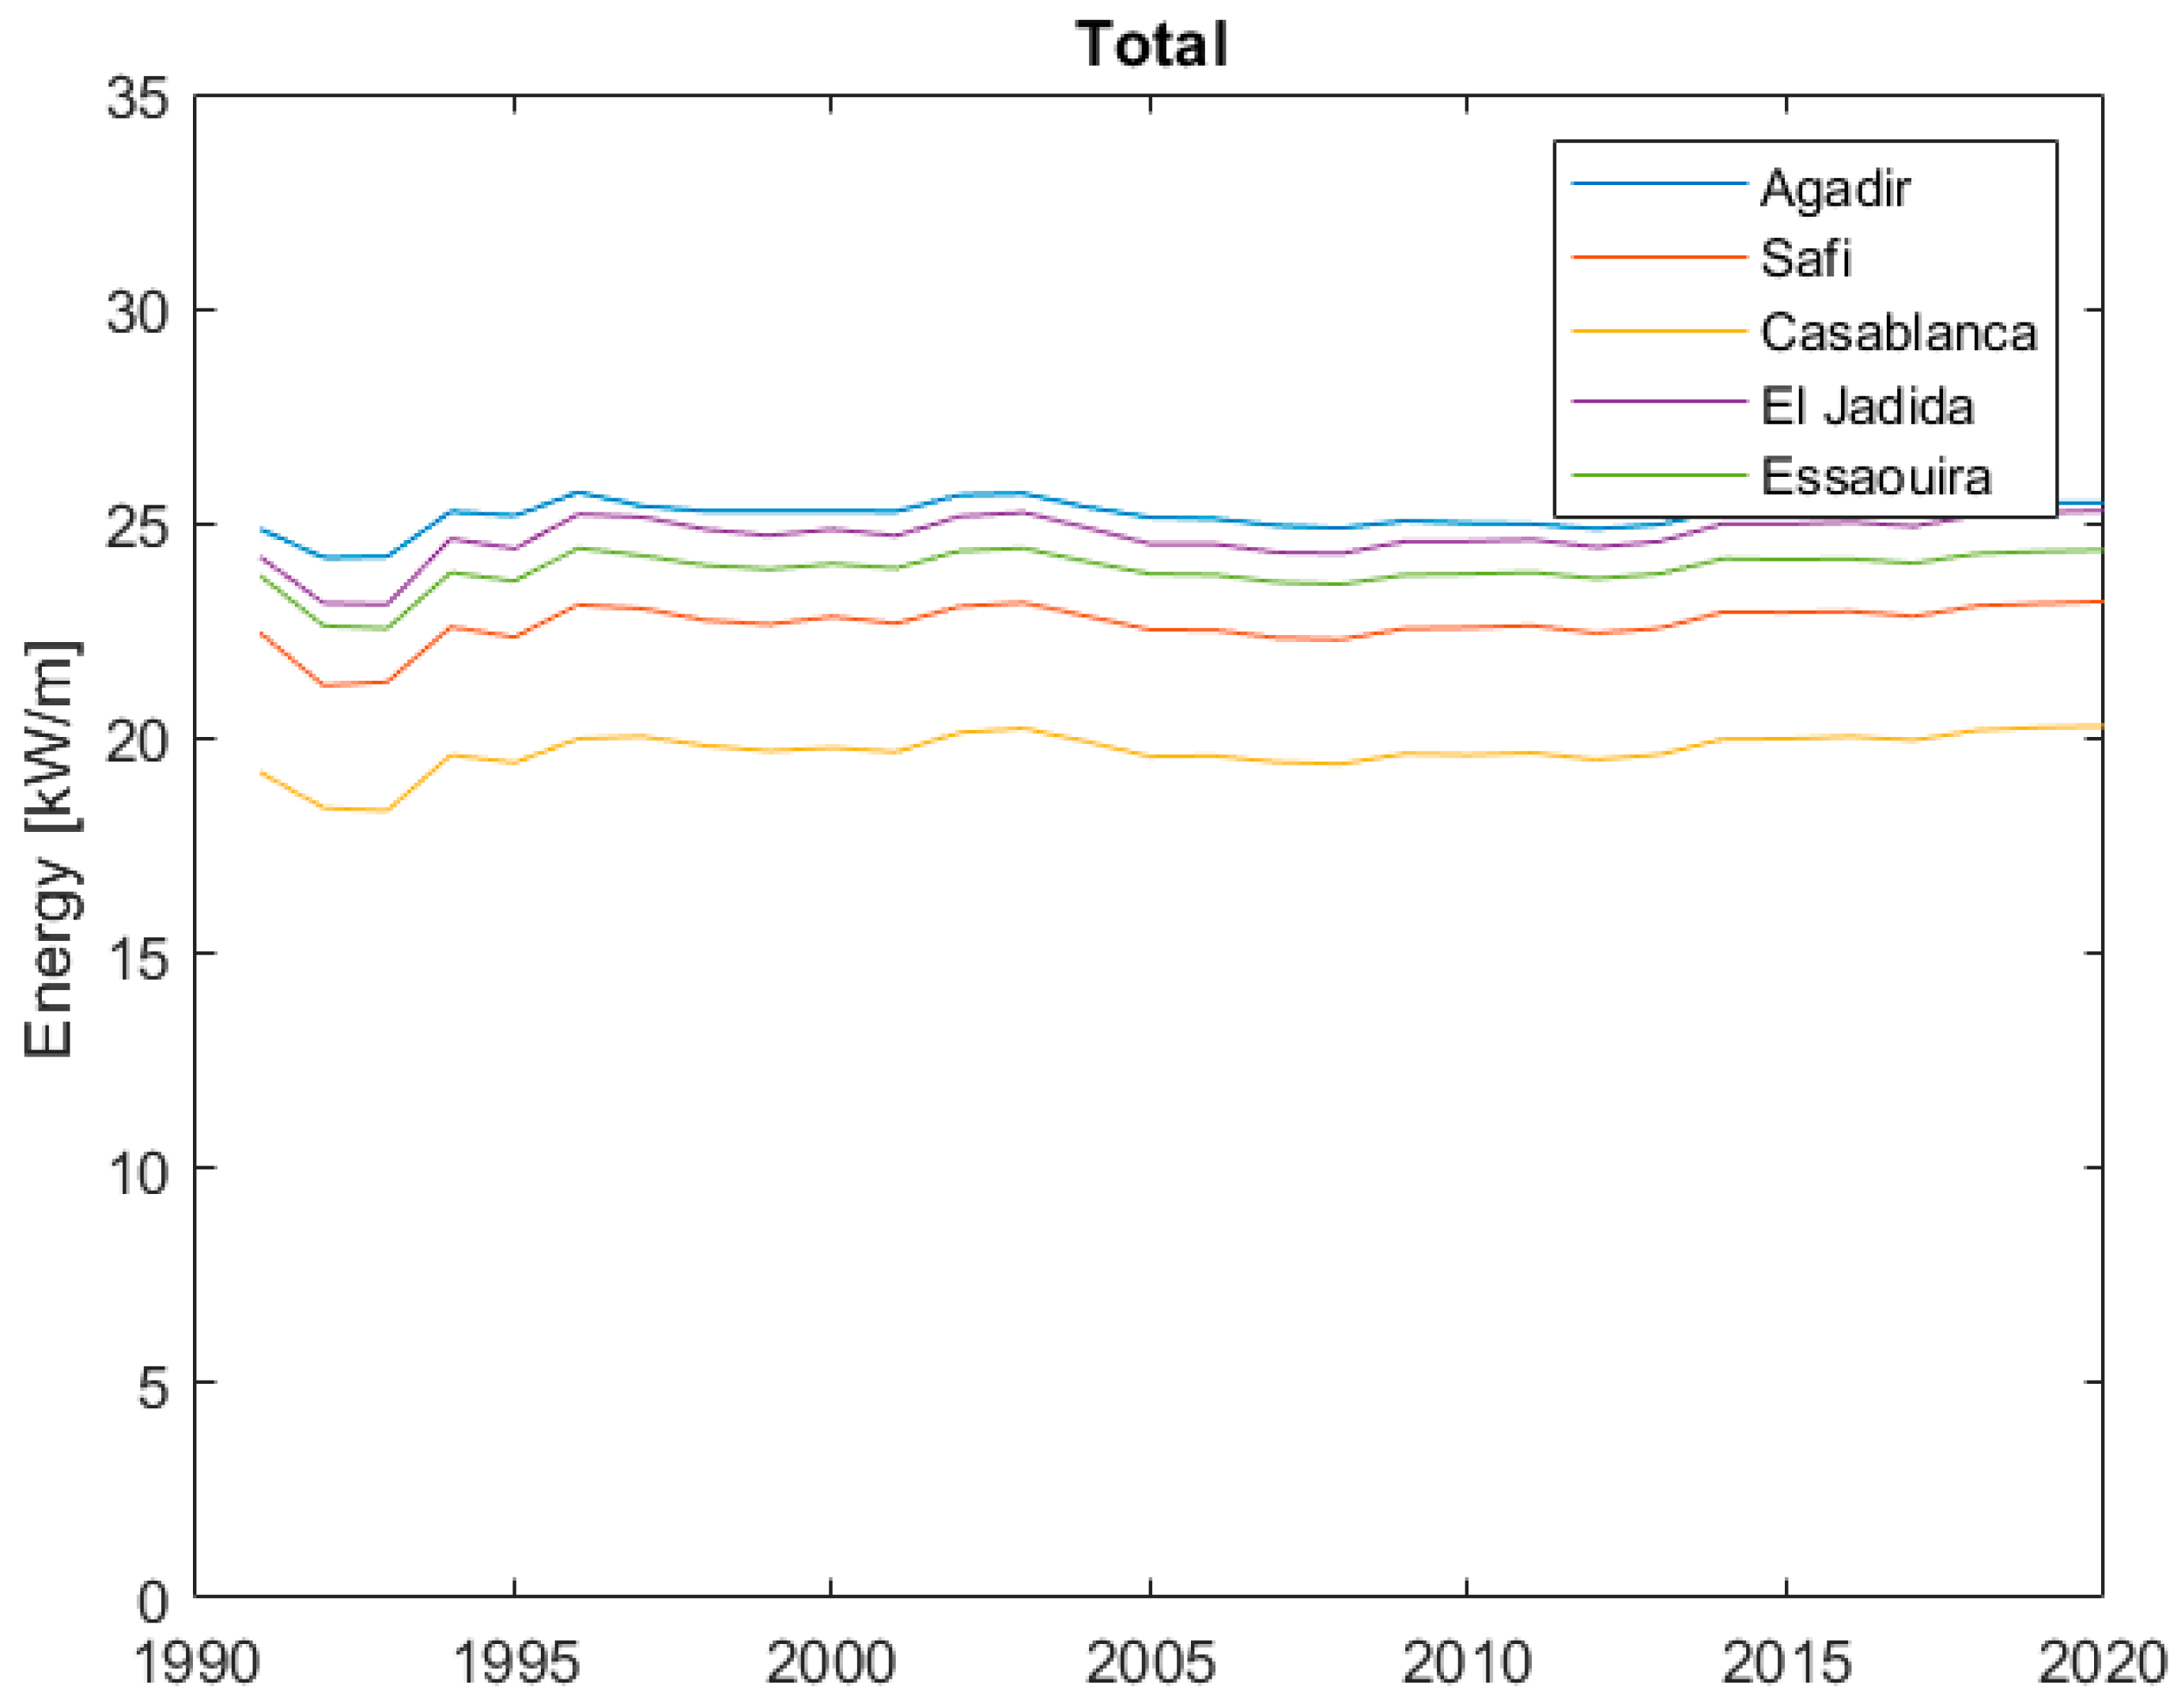
At each site, the wave energy is assessed yearly from 1991 to 2020, as shown in
Figure 17. It is clear that the site close to Agadir has the most energetic location, followed by El Jadida, then Essaouira. Casablanca has the least energetic waves. It is interesting to note that the amount of energy of all of the locations is closely correlated.
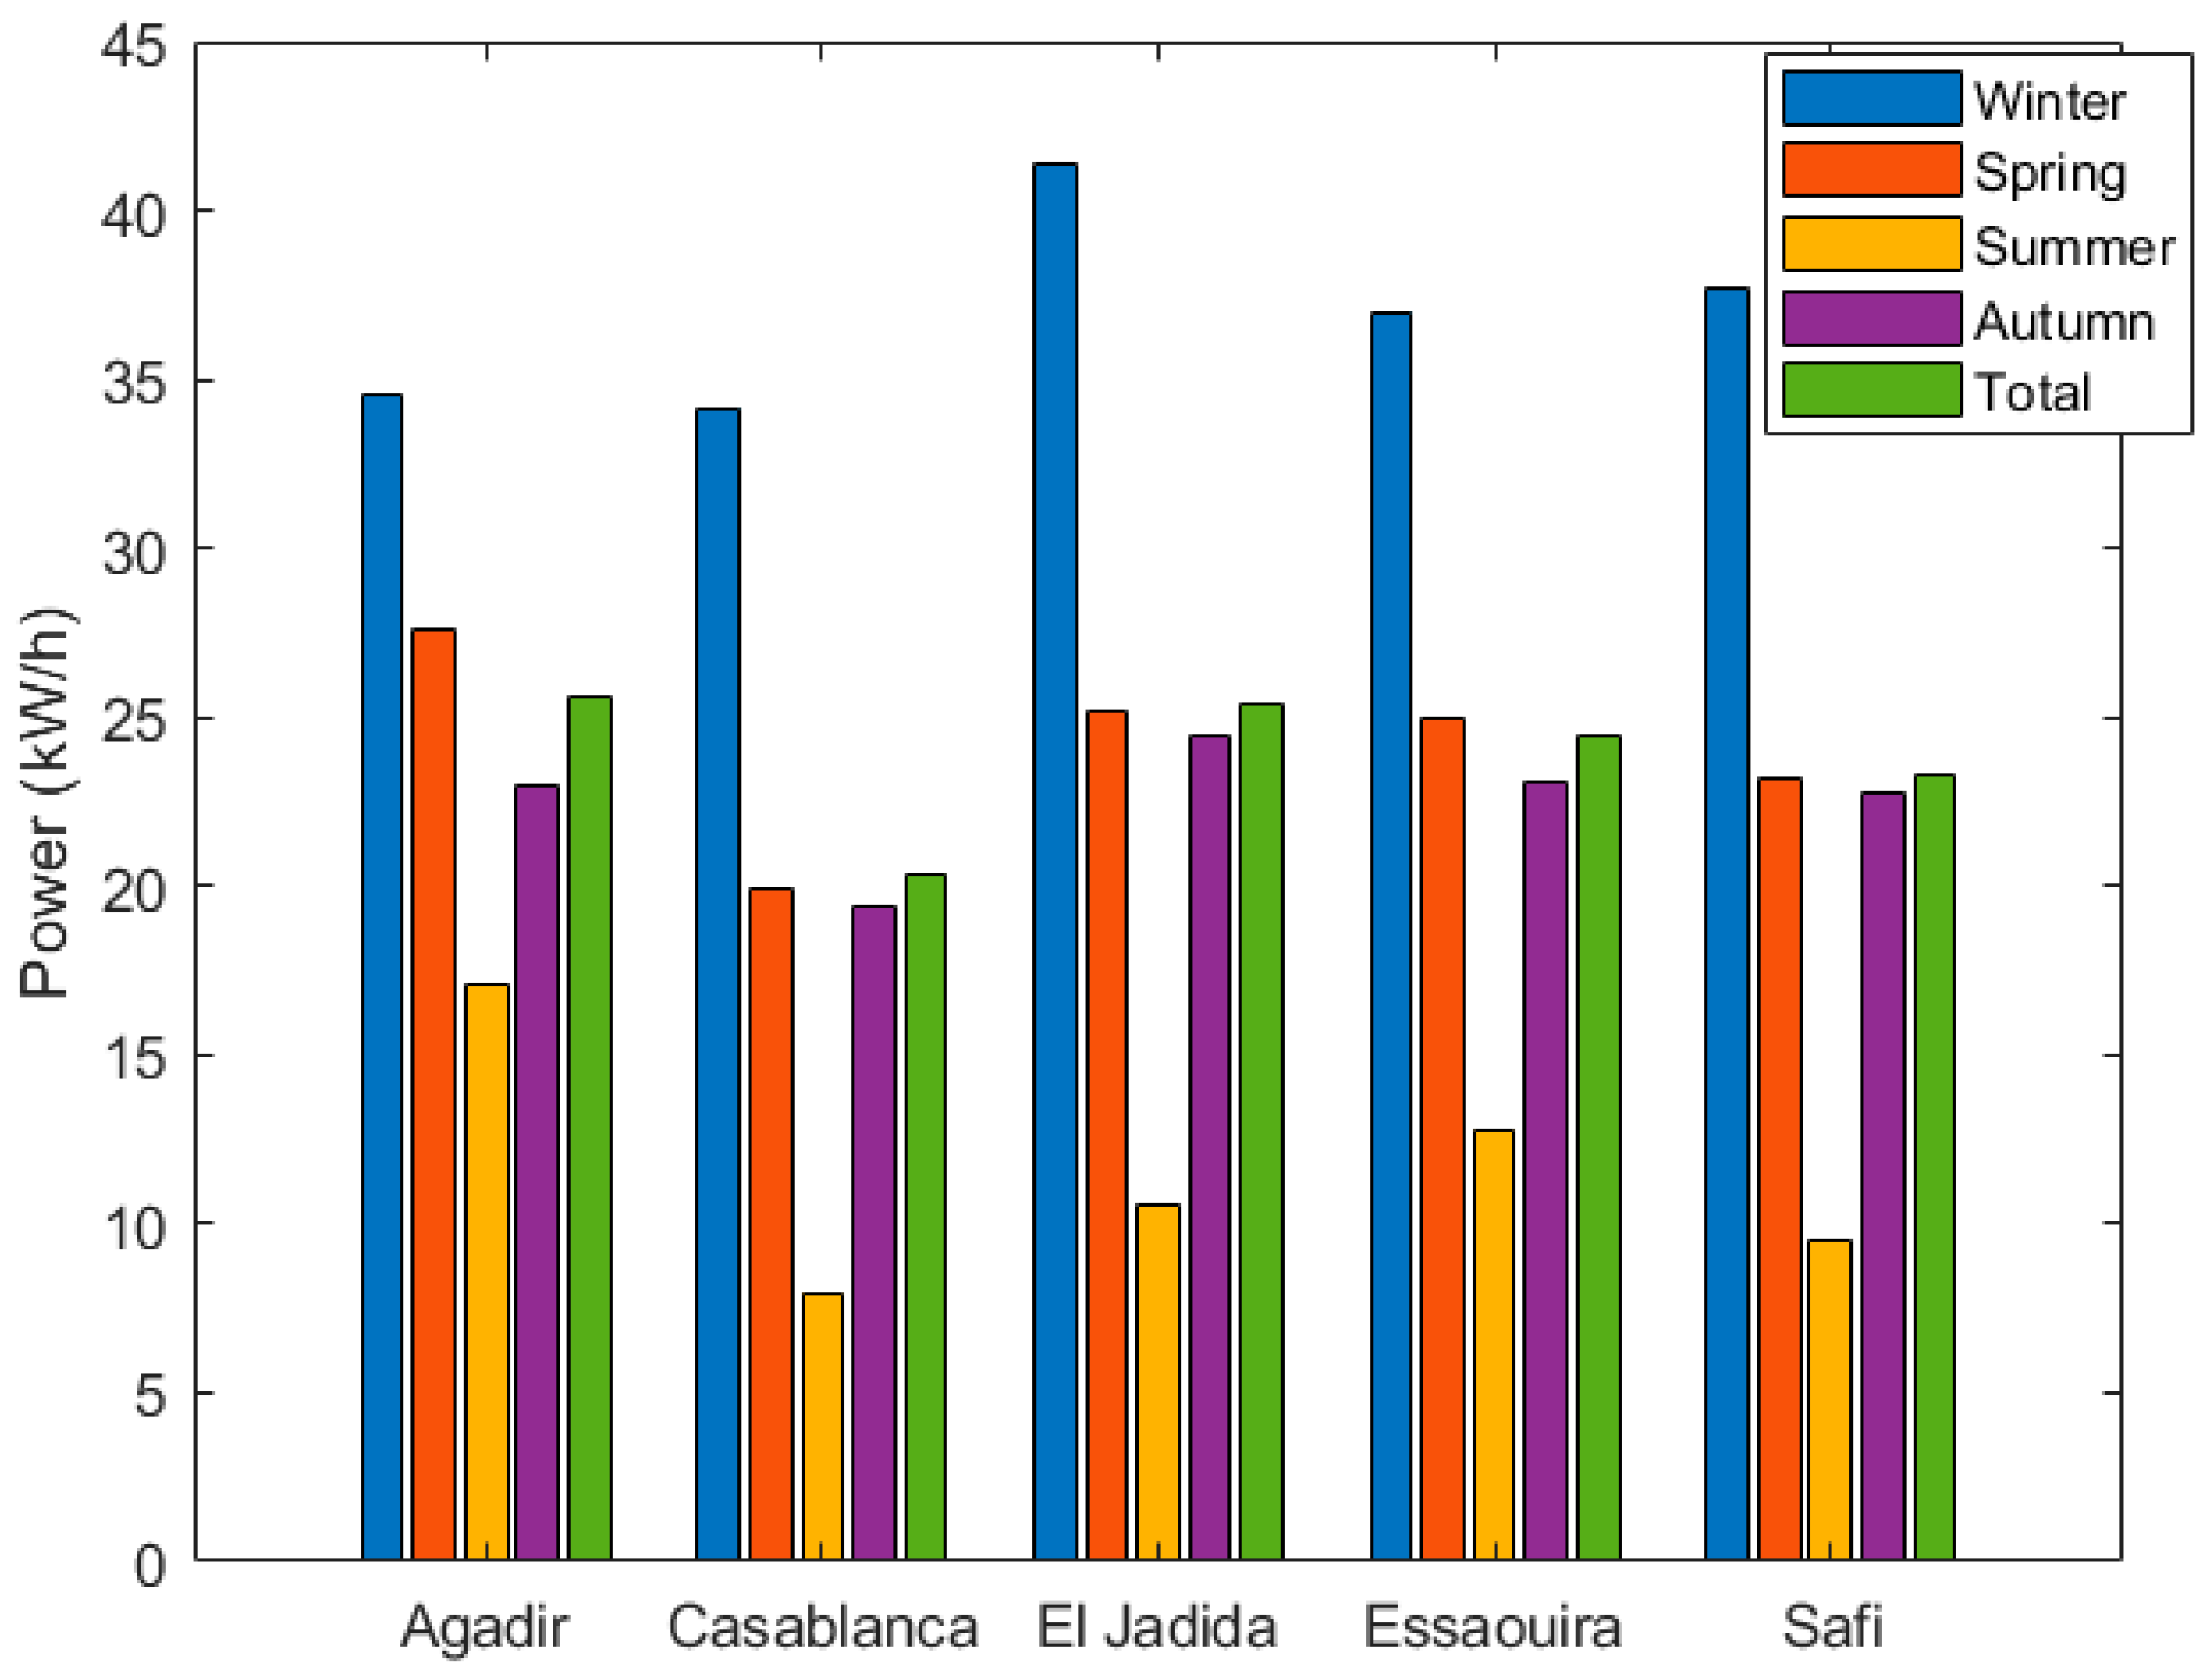
Figure 18 shows an overall comparison between the wave energy at each site. It confirms that the maximum average wave energy is located around Agadir, with high average wave energy around Essaouira as well as El Jadida. It further confirms that in winter, apart from El Jadida, all of the locations have similar wave energy, and that the difference in the total energy comes from the summer season.
The mean power production of the six WECs that were considered was calculated using the power matrixes of each device. These matrixes categorize the specific power production for certain sea states into bins of
and
, which allows us to calculate the total power production:
where
is the total electric energy produced by the WEC (in kW) per year;
is the time (in hours) per year when the wave behavior corresponds to the intervals of the power matrix (bin);
is the electric power corresponding to the same bin provided by the power matrix.
It should be noted that these results could be improved by scaling the power matrix to this specific location.
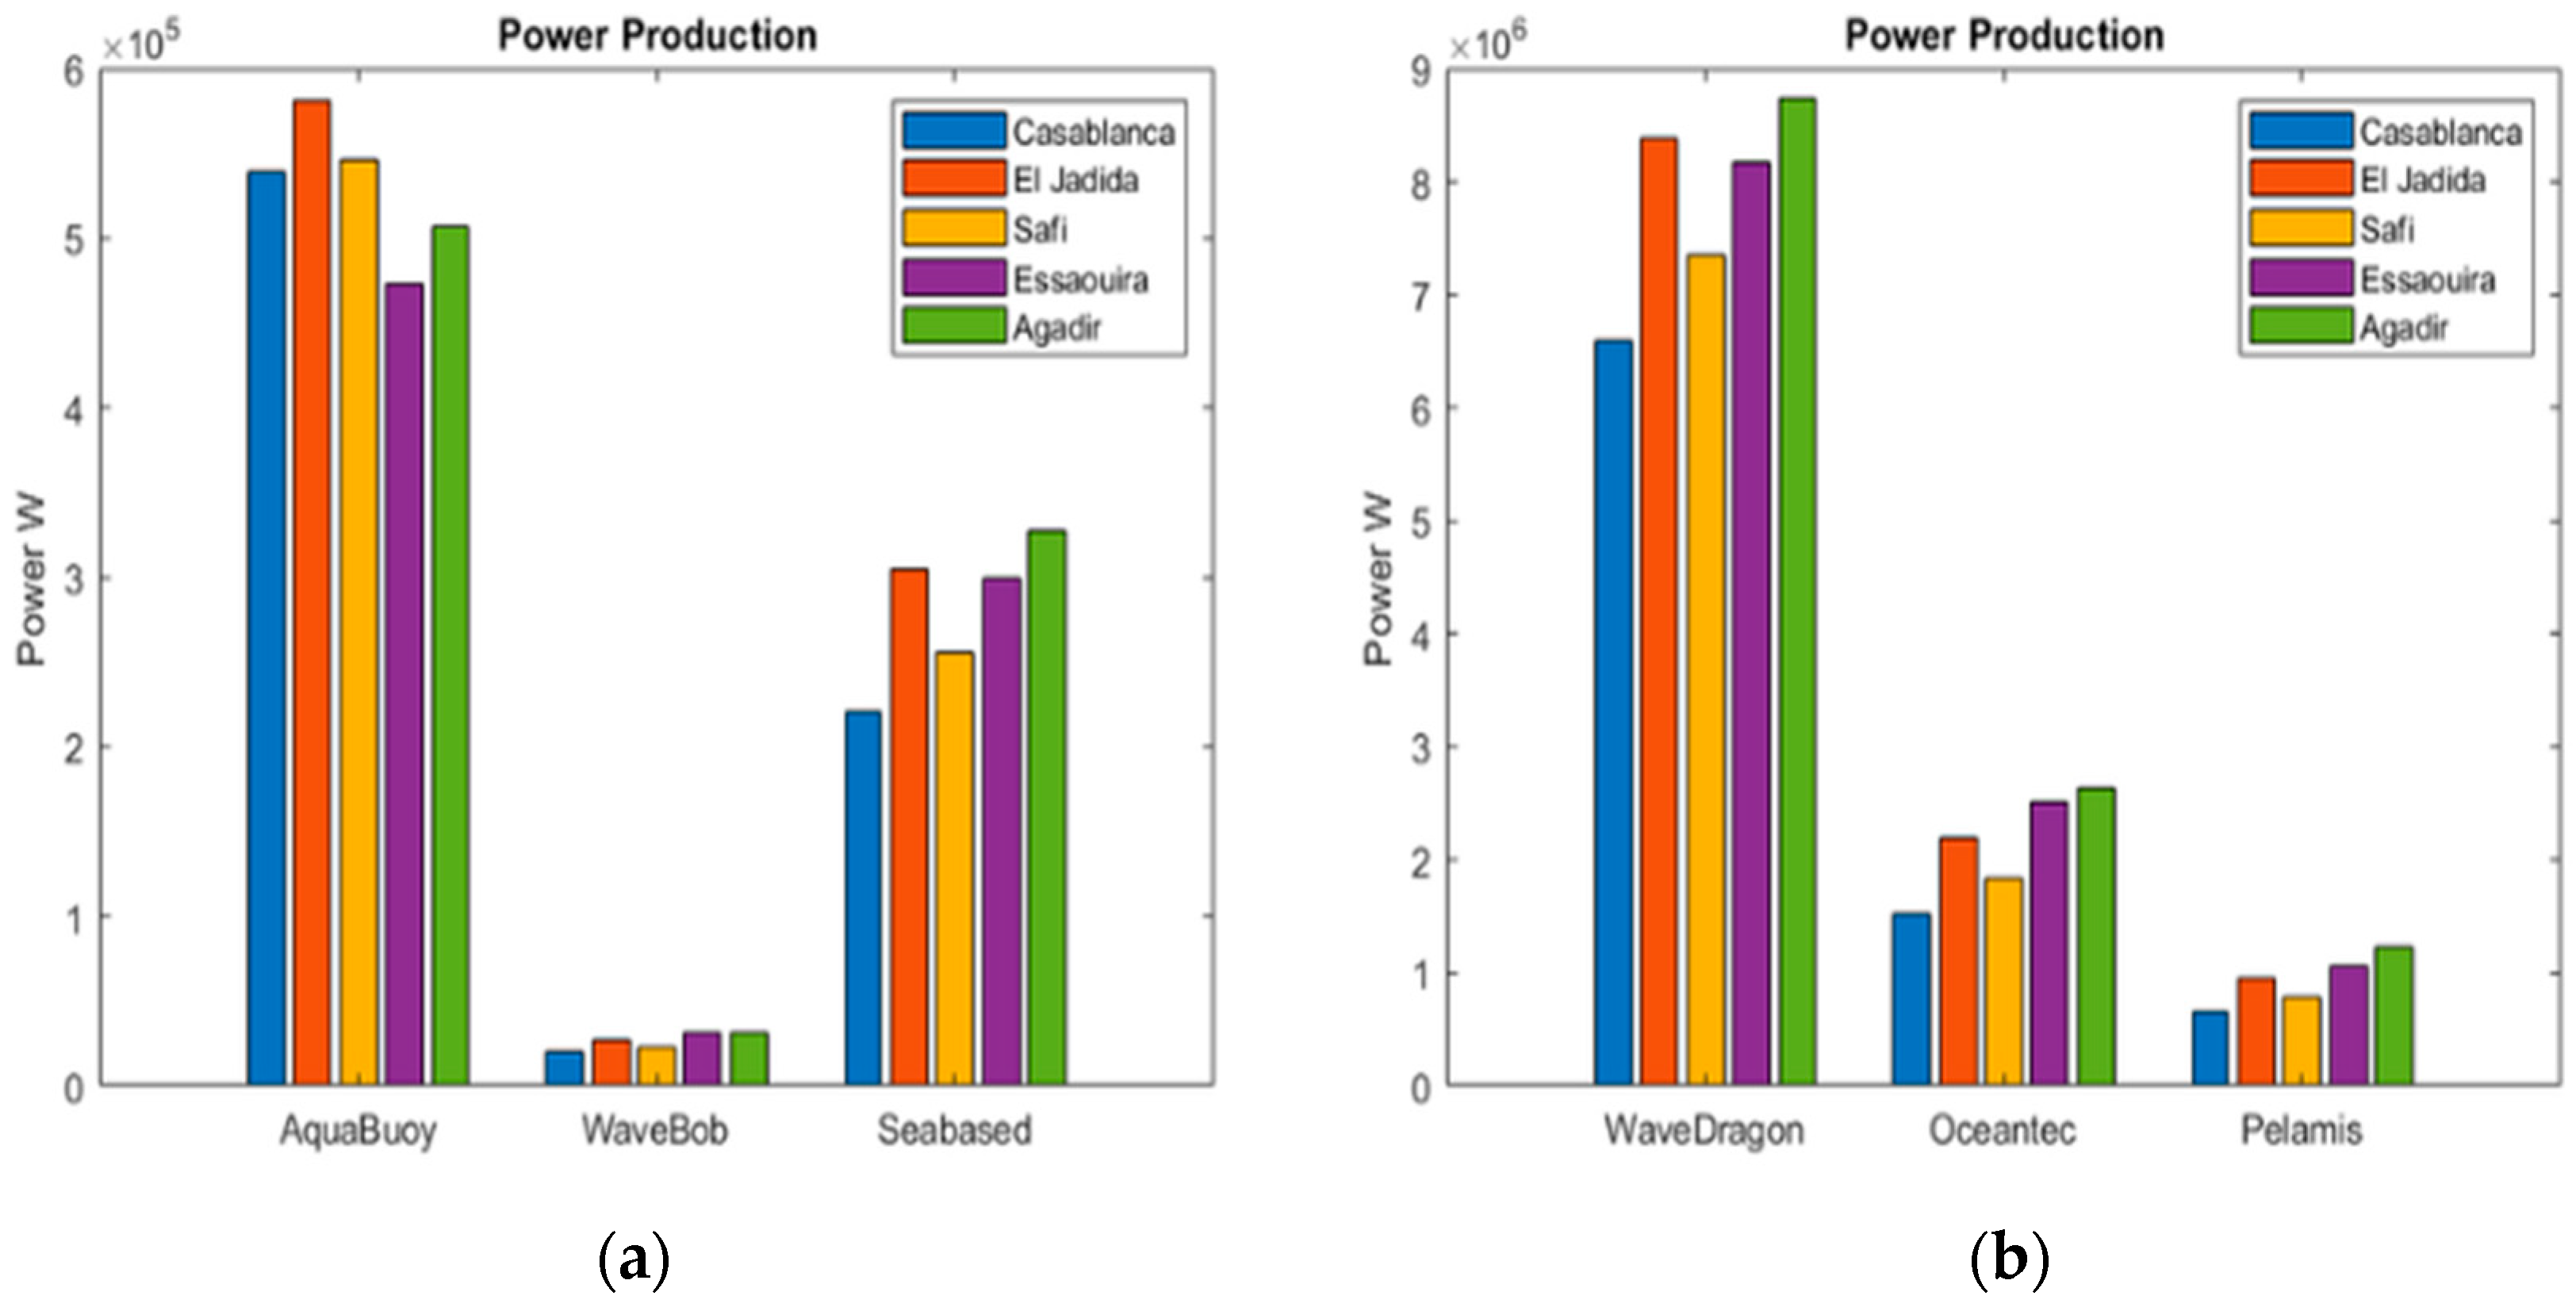
Figure 19 shows that the mean power production is considerably different between devices. Given the environmental conditions, Wave Dragon has the biggest power output, while Wavebob has the lowest. Furthermore, it is interesting to note that the devices adapt better to certain locations than to others. Although Agadir has the most energetic waves, it is not the optimal site for every WEC. AquaBuOY, for example, will have the biggest power output in El Jadida, which has the second least energetic waves.
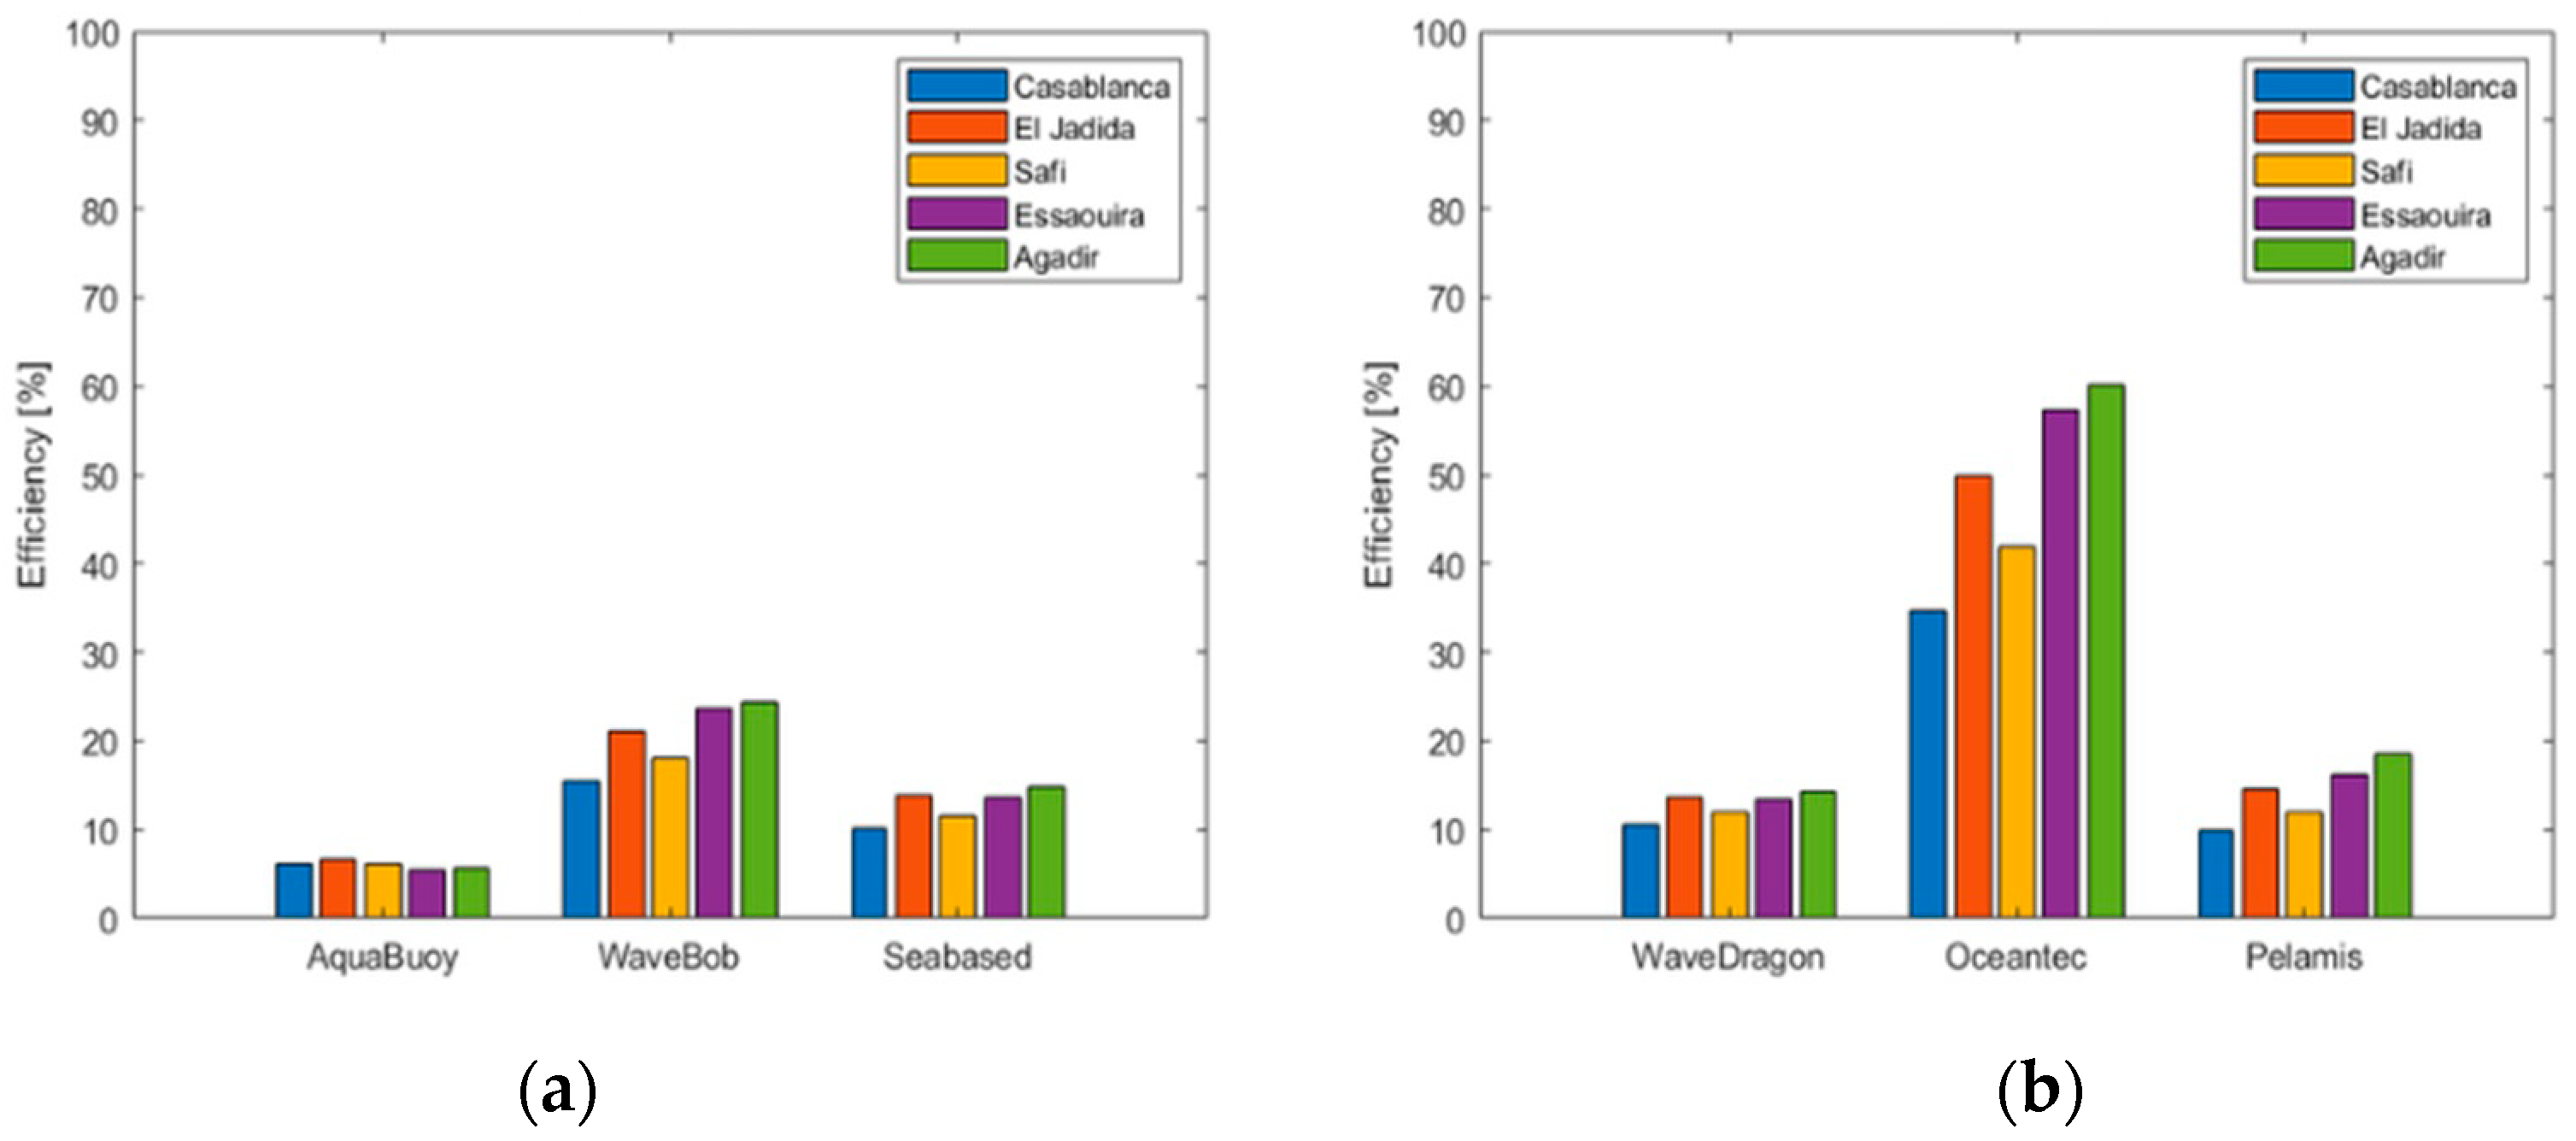
Figure 20 shows the efficiency of each WEC using the capacity factor, a value that is often used for WECs which relates the maximum output in optimal conditions against the output in the studied conditions.
where
is the electric power at the given location and
is the maximum rated power by the WEC.
Here, the Oceantec device can clearly show the best values, meaning it would be very well suited for the Moroccan coast. Although Wave Dragon would by far produce the most energy, it only has mediocre efficiency ratings. Wavebob, on the other hand, has the lowest power production but shows the second best efficiency.
5. Discussion of Results
In order to contextualize the results, it is important to compare them with results from similar studies for the same region. A direct comparison, presented in
Table 11, was made with the study from [
8], which used the WAM model, by evaluating the results of the significant wave height and the wave energy of the same points. The table compares the significant wave height, as well as the wave power, which, in the present study, was calculated using both the formula as well as the direct results from SWAN. [
9] also analyzed the same location using the WWIII model, and the results obtained were very similar to those obtained by [
8]. Both studies show that the values regarding significant wave height are close to those in the present study, with a relative error of approximately 2.7%. However, there is a noticeable difference regarding wave period, which could not be directly compared and tends to present higher values in the other studies. However, wave energy is estimated to be about 3.5% lower than the compared studies, which is a relatively low error, and could be related to the difference regarding wave periods. All three studies use different wave models with different parametrization, which can lead to discrepancies in the results. Furthermore, the time interval considered by the three studies is different; therefore, the comparison is merely indicative.
A more detailed comparison can be made with [
32], which focused on the Casablanca Mohammedia coast and assessed a mean wave energy of 22 kW/m. These results are also slightly higher than the ones obtained by the present study for this specific region.
It is also relevant to compare the potential wave energy with other regions and areas in the North Atlantic and the Mediterranean in order to determine the competitiveness of this coast. The Moroccan Mediterranean coast, which was not included in the domain of this study, is a very urbanized area in the north of the country and would provide relevant infrastructure. However, another study Ref. [
38] indicated values of wave energy between 1 and kW/m, which is significantly less than the Atlantic coast.
South of Morocco, the archipelago of the Cape Verde Islands is an interesting region to evaluate regarding wave power, and according to a study from [
12], which evaluated the sea state for the time between 2004 and 2013, the mean energy is between 7 and 12 kW/m, which is lower compared to the values obtained for the Moroccan Atlantic coast.
The Canary Islands archipelago, located west of the Moroccan coast, were analyzed by [
11] using the same methodology as this study but with different datasets, and they obtained values of wave energy between 8 and 15 kW/m, which is also less than the values at the center of the Moroccan coast.
6. Conclusions
The mean significant wave height and the mean wave period recorded for the Moroccan Atlantic domain and over the 30-year period is 2.16 m and 5.2 s, respectively. In general, wave height and wave period are higher around the center of the Moroccan coastline, since the north is affected by shadow effects of the Iberian Peninsula and the south is affected by the Canary Islands.
The average energy over the 30 years within the domain is 22.3 kW/m. The energy gradient is directed from southeast to northwest, where most of the swell comes from the low pressure regions in the North Atlantic, close to the Azores Islands. Energy distribution is also affected by the shadow effect, which decreases energy density in the north and in the south of Morocco. The seasonal variation is lower in the south, likely due to the shadow effect of the Canary Islands, but in the north, it does not seem to have the same impact, as it has the largest seasonal variation. In winter, the average energy is 34.8 kW/m, and the gradients are clearly headed toward northwest; however, the isolines are mostly parallel to the coastlines, which means that the energy is similar along the coast. In summer, the mean energy is 10.1 kW/m. Although the energy distribution is more homogeneous than in winter, there is a high energy density area in the center of the country between the areas of Essaouira and Agadir. Long-term trends in wave energy show a slight average increment of 0.058 kW/m per year, mainly due to a modest positive trend of wave energy during winter.
The performance assessment of the six WECs showed that Wave Dragon is clearly more powerful than the others, with a production of yearly 8 MW, while Wavebob is the least powerful, with a yearly production of under 0.5 MW. The most efficient device is the Oceantec, with a capacity factor over 60%, and the least efficient is AquaBuOY, with less than 10% efficiency.
The most energetic locations are around Agadir, which is in the center of Morocco’s coastline; locations in the north and south waves are less energetic. The most energetic site is affected by waves with an average energy of 28.4 kW/m and the least energetic site is in the north and shows values of around 212.8 kW/m. The Mann–Kendall test confirmed that there is a slight positive trend regarding wave energy at the analyzed point.
Compared with other studies, the Moroccan Atlantic coast provides more potential wave energy than its Mediterranean coast, the Cape Verde Islands, and the Canary Islands. However, it appears to have less wave energy than the Azores and Madeira Archipelagoes and the Portuguese continental coasts, which are located in higher latitudes; however, future studies using higher resolution domains where the modeling of the processes of wind wave generation and dissipation would include physical processes that were not considered in this work will, without doubt, lead to a more accurate environment assessment. Nevertheless, this area holds a large potential for wave energy production. New prototypes for wave energy converters are being produced and these new technologies could impact the feasibility of wave energy production in Morocco.
Author Contributions
Writing, M.S.; methodology, M.B. and M.G.; formal analysis, M.S. and M.G.; validation M.S.; resources M.B. and M.G.; supervision and project administration, C.G.S.; writing—review and editing, C.G.S. and M.B. All authors have read and agreed to the published version of the manuscript.
Funding
This research was funded by the Strategic Research Plan of the Center for Marine Technology and Ocean Engineering (CENTEC), which is financed by the Portuguese Foundation for Science and Technology (Fundação para a Ciência e Tecnologia—FCT) under contract UIDB/UIDP/00134/2020. The third author has been financed by FCT under the grant SFRH/BD/149858/2019.
Data Availability Statement
Data are contained within the article.
Conflicts of Interest
The authors declare no conflict of interest.
References
- Moreno, L.; Ferreiro, A. Marruecos: La Energía se Renueva. 2018. Available online: http://www.fenelec.com (accessed on 29 November 2022).
- Rubio, C. Energías Renovables en Marruecos; Madrid. 2019. Available online: https://www.icex.es/content/dam/es/icex/oficinas/031/documentos/2022/12/otros-documentos/OD_Energ%C3%ADas%20renovables%20en%20Marruecos%202022_REV.pdf (accessed on 28 December 2022).
- Angelis-Dimakis, A.; Biberacher, M.; Dominguez, J.; Fiorese, G.; Gadocha, S.; Gnansounou, E.; Guariso, G.; Kartalidis, A.; Panichelli, L.; Pinedo, I.; et al. Methods and tools to evaluate the availability of renewable energy sources. Renew. Sustain. Energy Rev. 2011, 15, 1182–1200. [Google Scholar] [CrossRef]
- The Wamdi Group. The WAM model—A third generation ocean wave prediction model. J. Phys. Oceanogr. 1988, 18, 1775–1880. [Google Scholar] [CrossRef]
- Booij, N.; Ris, R.C.; Holthuijsen, L.H. A third-generation wave model for coastal regions: 1. Model description and validation. J. Geophys. Res. Ocean. 1999, 104, 7649–7666. [Google Scholar] [CrossRef]
- Mollison, D.; Pontes, M.T.; Athanassoulis, G.A.; Barstow, S.; Bertotti, S.; Cavaeri, L.; Holmes, B.; Oliveira-Pires, H.; Christopoulos, S. Atlas of the wave energy resource in Europe. In Proceedings of the International Conference on Offshore Mechanics and Arctic Engineering—OMAE, Copenhagen, Denmark, 8–12 June 1995. [Google Scholar]
- Mørk, G.; Barstow, S.; Kabuth, A.; Pontes, M.T. Assessing the global wave energy potential. In Proceedings of the International Conference on Offshore Mechanics and Arctic Engineering—OMAE, Shanghai, China, 6–11 June 2010. [Google Scholar] [CrossRef]
- Sierra, J.; Martín, C.; Mösso, C.; Mestres, M.; Jebbad, R. Wave energy potential along the Atlantic coast of Morocco. Renew. Energy 2016, 96, 20–32. [Google Scholar] [CrossRef]
- Bouhrim, H.; El Marjani, A. Wave Energy Assessment Along the Moroccan Atlantic Coast. J. Mar. Sci. Appl. 2018, 18, 142–152. [Google Scholar] [CrossRef]
- Soares, C.G.; Bento, A.R.; Gonçalves, M.; Silva, D.; Martinho, P. Numerical evaluation of the wave energy resource along the Atlantic European coast. Comput. Geosci. 2014, 71, 37–49. [Google Scholar] [CrossRef]
- Gonçalves, M.; Martinho, P.; Guedes Soares, C. Assessment of wave energy in the Canary Islands. Renew. Energy 2014, 68, 774–784. [Google Scholar] [CrossRef]
- Bernardino, M.; Rusu, L.; Soares, C.G. Evaluation of the wave energy resources in the Cape Verde Islands. Renew. Energy 2017, 101, 316–326. [Google Scholar] [CrossRef]
- Hersbach, H.; Bell, B.; Berrisford, P.; Hirahara, S.; Horányi, A.; Muñoz-Sabater, J.; Nicolas, J.; Peubey, C.; Radu, R.; Schepers, D.; et al. The ERA5 global reanalysis. Q. J. R. Meteorol. Soc. 2020, 146, 1999–2049. [Google Scholar] [CrossRef]
- Bruno, M.F.; Molfetta, M.G.; Totaro, V.; Mossa, M. Performance Assessment of ERA5 Wave Data in a Swell Dominated Region. J. Mar. Sci. Eng. 2020, 8, 214. [Google Scholar] [CrossRef]
- Wang, J.; Wang, Y. Evaluation of the ERA5 Significant Wave Height against NDBC Buoy Data from 1979 to 2019. Mar. Geod. 2021, 45, 151–165. [Google Scholar] [CrossRef]
- SWAN Team. SWAN User Manual, SWAN Cycle III Version 41.20AB. 2018. Delft University of Technology. 133p. Available online: http://www.swan.tudelft.nl (accessed on 1 November 2023).
- SWAN Team. SWAN—Scientific and Technical documentation. Delft University of Technology, Environmental Fluid Mechanics Section, (Version 41.20AB, November 2018). Available online: http://www.swan.tudelft.nl (accessed on 1 November 2023).
- Mei, C.C. The applied dynamics of ocean surface waves. Ocean Eng. 1984, 11, 321. [Google Scholar] [CrossRef]
- Komen, G.J.; Cavaleri, L.; Donelan, M.; Hasselmann, K.; Hasselmann, S.; Janssen, P.A.E.M. Dynamics and Modelling of Ocean Waves; Cambridge University Press: Cambridge, UK, 1994. [Google Scholar] [CrossRef]
- Holthuijsen, L.H. Waves in Oceanic and Coastal Waters; Cambridge University Press (CUP): Cambridge, UK, 2007; ISBN 9780521860284. [Google Scholar] [CrossRef]
- Clément, A.; McCullen, P.; Falcão, A.; Fiorentino, A.; Gardner, F.; Hammarlund, K.; Lemonis, G.; Lewis, T.; Nielsen, K.; Petroncini, S.; et al. Wave energy in Europe: Current status and perspectives. Renew. Sustain. Energy Rev. 2002, 6, 405–431. [Google Scholar] [CrossRef]
- López, I.; Andreu, J.; Ceballos, S.; de Alegría, I.M.; Kortabarria, I. Review of wave energy technologies and the necessary power-equipment. Renew. Sustain. Energy Rev. 2013, 27, 413–434. [Google Scholar] [CrossRef]
- Tarrant, K.; Meskell, C. Investigation on parametrically excited motions of point absorbers in regular waves. Ocean Eng. 2016, 111, 67–81. [Google Scholar] [CrossRef]
- Falcão, A.F.D.O. Wave energy utilization: A review of the technologies. Renew. Sustain. Energy Rev. 2010, 14, 899–918. [Google Scholar] [CrossRef]
- Salcedo, F.; Rodriguez, R.; Ricci, P.; Santos, M. OCEANTEC: Sea Trials of a Quarter Scale Prototype. In Proceedings of the 8th European Wave and Tidal Energy Conference (EWTEC), Uppsala, Sweden, 7–10 September 2009. [Google Scholar]
- SEABASED. Seabased Technology. Available online: https://seabased.com/the-technology (accessed on 26 October 2023).
- Blackledge, J.; Coyle, E.; Kearney, D.; McGuirk, R.; Norton, B. Estimation of wave energy from wind velocity. Eng. Lett. 2013, 21, 158–170. [Google Scholar]
- Basar, M.F.; Rahman, A.A.; Din, A.; Mahmod, Z. Design and development of green electricity generation system using ocean surface wave. In Proceedings of the International Conference on Energy and Sustainable Development: Issues and Strategies, ESD 2010, Chiang Mai, Thailand, 2–4 June 2010. [Google Scholar] [CrossRef]
- Pinet, P.R. Invitation to Oceanography, 5th ed.; Jones and Bartlett Publishers: Sudbury, MA, USA, 2009. [Google Scholar]
- Gunn, K.; Stock-Williams, C. Quantifying the global wave power resource. Renew. Energy 2012, 44, 296–304. [Google Scholar] [CrossRef]
- Benazzouz, A.; Mabchour, H.; El Had, K.; Zourarah, B.; Mordane, S. Offshore Wind Energy Resource in the Kingdom of Morocco: Assessment of the Seasonal Potential Variability Based on Satellite Data. J. Mar. Sci. Eng. 2020, 9, 31. [Google Scholar] [CrossRef]
- Mouakkir, L.; El Hou, M.; Mordane, S.; Chagdali, M. Wave Energy Potential Analysis in the Casablanca-Mohammedia Coastal Area (Morocco). J. Mar. Sci. Appl. 2022, 21, 92–101. [Google Scholar] [CrossRef]
- WAVEWATCH III® Development Group (WW3DG). User Manual and System Documentation of WAVEWATCH III®; Version 5.16. Tech. Note 329, NOAA/NWS/NCEP/MMAB; WAVEWATCH III® Development Group (WW3DG): College Park, MD, USA, 2016; p. 326. [Google Scholar]
- Hersbach, H.; Dee, D. ERA5 Reanalysis Is in Production. ECMWF Newsletter. 2016, Volume 47, p. 7. Available online: https://www.ecmwf.int/en/newsletter/147/news/ERA5-reanalysis-production (accessed on 13 October 2022).
- Bernardino, M.; Goncalves, M.; Soares, C.G. Marine Climate Projections Toward the End of the Twenty-First Century in the North Atlantic. J. Offshore Mech. Arct. Eng. 2021, 143, 061201. [Google Scholar] [CrossRef]
- Gleizon, P.; Campuzano, F.; Carracedo, P.; Martinez, A.; Goggins, J.; Atan, R.; Nash, S. Wave energy resources along the European Atlantic Coast. In Marine Renewable Energy: Resource Characterization and Physical Effects; Springer: Berlin/Heidelberg, Germany, 2017. [Google Scholar] [CrossRef]
- Wilks, D.S. Statistical Methods in the Atmospheric Sciences, 2nd ed.; Academic Press: London, UK, 2006. [Google Scholar]
- Sierra, J.P.; Castrillo, R.; Mestres, M.; Mösso, C.; Lionello, P.; Marzo, L. Impact of Climate Change on Wave Energy Resource in the Mediterranean Coast of Morocco. Energies 2020, 13, 2993. [Google Scholar] [CrossRef]
Figure 1.
Wave energy converters: (
a) Wavebob, reprinted from [
23], Copyright (2016), with permission from Elsevier; (
b) Pelamis [
24]; (
c) Oceantec [
25]; (
d) Seabased [
26]; (
e) Wave Dragon [
27]; (
f) Aquabuoy [
28].
Figure 1.
Wave energy converters: (
a) Wavebob, reprinted from [
23], Copyright (2016), with permission from Elsevier; (
b) Pelamis [
24]; (
c) Oceantec [
25]; (
d) Seabased [
26]; (
e) Wave Dragon [
27]; (
f) Aquabuoy [
28].
Figure 2.
Studied domain.
Figure 2.
Studied domain.
Figure 3.
Bathymetry of the domain.
Figure 3.
Bathymetry of the domain.
Figure 4.
Timeline of significant wave height as given by the model with final parametrization and the Gran Canaria buoy for the year 2018.
Figure 4.
Timeline of significant wave height as given by the model with final parametrization and the Gran Canaria buoy for the year 2018.
Figure 5.
Mean significant wave height over 30 years.
Figure 5.
Mean significant wave height over 30 years.
Figure 6.
Mean significant wave height in different seasons.
Figure 6.
Mean significant wave height in different seasons.
Figure 7.
Monthly behavior of significant wave height.
Figure 7.
Monthly behavior of significant wave height.
Figure 8.
Annual significant wave height.
Figure 8.
Annual significant wave height.
Figure 9.
Wave mean period over 30 years.
Figure 9.
Wave mean period over 30 years.
Figure 10.
Mean wave period in different seasons.
Figure 10.
Mean wave period in different seasons.
Figure 11.
Mean wave energy over 30 years.
Figure 11.
Mean wave energy over 30 years.
Figure 12.
(a) Mean wave energy in summer; (b) mean wave energy in winter.
Figure 12.
(a) Mean wave energy in summer; (b) mean wave energy in winter.
Figure 13.
Seasonal variability index of wave energy.
Figure 13.
Seasonal variability index of wave energy.
Figure 14.
Average monthly energy.
Figure 14.
Average monthly energy.
Figure 15.
Yearly wave energy evolution over 30 years.
Figure 15.
Yearly wave energy evolution over 30 years.
Figure 16.
Individual sites. Strategically placed points (blue). Points for comparison (red).
Figure 16.
Individual sites. Strategically placed points (blue). Points for comparison (red).
Figure 17.
Wave energy statistics for chosen locations.
Figure 17.
Wave energy statistics for chosen locations.
Figure 18.
Average wave energy at five sites in total and in each season.
Figure 18.
Average wave energy at five sites in total and in each season.
Figure 19.
(a) Power production of smaller sized WECs (105 W); (b) power production of larger sized WECs (106 W).
Figure 19.
(a) Power production of smaller sized WECs (105 W); (b) power production of larger sized WECs (106 W).
Figure 20.
(a) Efficiency of smaller sized WECs; (b) efficiency of larger sized WECs.
Figure 20.
(a) Efficiency of smaller sized WECs; (b) efficiency of larger sized WECs.
Table 1.
WEC Classification.
Table 1.
WEC Classification.
| WEC Model | Type | Operation Principle | Location |
|---|
| AquaBuoy | Point Absorber | Floating Structure | Nearshore |
| Pelamis | Attenuator | Floating Structure | Nearshore |
| Oceantec | Attenuator | Floating Structure | Nearshore |
| Wavebob | Point Absorber | Floating Structure | Nearshore |
| Wave Dragon | Terminator | Overtopping | Offshore |
| Seabased | Point Absorber | Floating Structure | Nearshore |
Table 2.
Parametrizations tested during the calibration.
Table 2.
Parametrizations tested during the calibration.
| | Physical | Numerical | Phenomena |
|---|
| EXP 1 | Janssen | S&L | |
| EXP 2 | Westhuijsen | S&L | |
| EXP 3 | Komen | S&L | |
| EXP 4 | Janssen | BSBT | |
| EXP 5 | Westhuijsen | BSBT | |
| EXP 6 | Komen | BSBT | |
| EXP 7 | Janssen | S&L | Beaking + Triad |
| EXP 8 | Westhuijsen | S&L | Beaking + Triad |
| EXP 9 | Komen | S&L | Beaking + Triad |
Table 3.
Mean significant wave height and mean wave power obtained from model simulation at the locations of the oceanographic buoys used for calibration for 2018.
Table 3.
Mean significant wave height and mean wave power obtained from model simulation at the locations of the oceanographic buoys used for calibration for 2018.
| Location | Latitude
[° N] | Longitude
[° W] | Hs
[m] | Power
[kW/m] |
|---|
| Gran Canaria | 28.154 | 15.732 | 1.51 | 13.87 |
| Cadiz | 36.308 | 6.935 | 1.50 | 11.55 |
| Faro | 36.468 | 8.174 | 1.75 | 16.88 |
Table 4.
Validation results relative to the three oceanographic buoys within the domain.
Table 4.
Validation results relative to the three oceanographic buoys within the domain.
| HS |
|---|
| Location | Bias | RMSE | SI | MAE | R |
|---|
| Gran Canaria | 0.136 | 0.328 | 0.198 | 0.239 | 0.869 |
| Cádiz | −0.364 | 0.427 | 0.353 | 0.349 | 0.911 |
| Faro | −0.187 | 0.396 | 0.245 | 0.307 | 0.900 |
Table 5.
Characteristics of manually selected locations.
Table 5.
Characteristics of manually selected locations.
| Point | Area | Lon [° W] | Lat [° N] | Depth [m] |
|---|
| P1 | Casablanca | 7.50 | 33.72 | 51.30 |
| P2 | El Jadida | 8.58 | 33.32 | 89.80 |
| P3 | Essaouira | 9.90 | 31.55 | 56.50 |
| P4 | Safi | 9.31 | 32.33 | 89.80 |
| P5 | Agadir | 10.00 | 30.63 | 89.80 |
Table 6.
Characteristics of locations for comparison.
Table 6.
Characteristics of locations for comparison.
| Point | Area | Comparison | Lon [° W] | Lat [° N] | Depth [m] |
|---|
| Q1 | Tangier | P2 | 6.15 | 35.30 | 56.00 |
| Q2 | Rabat | P4 | 7.00 | 34.30 | 378.00 |
| Q3 | Casablanca Offs. | P6 | 8.00 | 34.00 | 364.00 |
| Q4 | El Jadida | P8 | 9.00 | 33.00 | 93.00 |
| Q5 | Essaouira | P10 | 10.00 | 32.00 | 872.00 |
| Q6 | Agadir North | P12 | 10.00 | 31.00 | 61.00 |
| Q7 | Tiznit | P14 | 10.00 | 30.00 | 132.00 |
| Q8 | Souss-Massa | P15 | 10.30 | 29.30 | 26.00 |
| Q9 | Guelmin | P16 | 11.00 | 29.00 | 92.00 |
| Q10 | Guelmin | P18 | 12.00 | 28.30 | 92.00 |
Table 7.
Significant wave height statistics of manually chosen locations.
Table 7.
Significant wave height statistics of manually chosen locations.
| Point | Hs Mean [m] | Hs q99 [m] | Hs Var
[m] | Hs Std Dev [m] | Hs Skew | Mann–Kendall | Test |
|---|
| P1 | 1.48 | 3.53 | 0.39 | 0.62 | 1.35 | 0.04 | Invalid |
| P2 | 1.79 | 4.08 | 0.47 | 0.69 | 1.36 | 0.09 | Invalid |
| P3 | 1.90 | 3.93 | 0.43 | 0.66 | 1.01 | 0.15 | Valid |
| P4 | 1.63 | 3.79 | 0.411 | 0.64 | 1.41 | 0.21 | Valid |
| P5 | 1.98 | 4.13 | 0.53 | 0.73 | 0.89 | 0.89 | Valid |
Table 8.
Significant wave height statistics of locations for comparison.
Table 8.
Significant wave height statistics of locations for comparison.
| Point | Hs Mean [m] | Hs q99
[m] | Hs Var [m] | Hs Std Dev [m] | Hs Skew | Mann–Kendall | Test |
|---|
| Q1 | 1.40 | 4.07 | 0.49 | 0.70 | 2.02 | 0.27 | Valid |
| Q2 | 1.66 | 4.35 | 0.56 | 0.75 | 1.74 | 0.12 | Valid |
| Q3 | 1.91 | 4.71 | 0.64 | 0.80 | 1.61 | 0.12 | Valid |
| Q4 | 1.92 | 4.39 | 0.54 | 0.73 | 1.43 | 0.18 | Valid |
| Q5 | 2.13 | 4.66 | 0.61 | 0.78 | 1.20 | 0.12 | Valid |
| Q6 | 1.98 | 4.03 | 0.50 | 0.71 | 0.85 | 0.48 | Valid |
| Q7 | 1.88 | 4.29 | 0.55 | 0.74 | 1.28 | 0.83 | Valid |
| Q8 | 1.85 | 4.17 | 0.51 | 0.71 | 1.32 | 0.59 | Valid |
| Q9 | 1.97 | 4.37 | 0.54 | 0.74 | 1.32 | 0.52 | Valid |
| Q10 | 1.72 | 3.77 | 0.40 | 0.63 | 1.33 | 0.43 | Valid |
Table 9.
Wave energy statistics of manually chosen locations.
Table 9.
Wave energy statistics of manually chosen locations.
| Point | P Mean [kW/m] | P q99 [kW/m] | P Var [kW/m] | P Skew | Test |
|---|
| P1 | 20.3 | 122.6 | 383.9 | 4.5 | Valid |
| P2 | 25.3 | 151.3 | 903.1 | 3.4 | Valid |
| P3 | 23.2 | 138.9 | 760.4 | 3.4 | Valid |
| P4 | 24.4 | 132.0 | 649.5 | 3.5 | Valid |
| P5 | 25.5 | 122.6 | 596.4 | 2.7 | Valid |
Table 10.
Wave energy statistics of locations for comparison.
Table 10.
Wave energy statistics of locations for comparison.
| Point | P Mean [kW/m] | P q99 [kW/m] | P Var [kW/m] | P Skew | Mann–Kendall Test |
|---|
| Q1 | 12.8 | 99.3 | 383.9 | 4.5 | Valid |
| Q2 | 20.8 | 138.8 | 762.8 | 3.9 | Valid |
| Q3 | 25.8 | 162.8 | 1049.0 | 3.6 | Valid |
| Q4 | 26.9 | 159.4 | 1003.1 | 3.4 | Valid |
| Q5 | 28.4 | 157.2 | 954.7 | 3.4 | Valid |
| Q6 | 25.6 | 126.7 | 624.2 | 3.0 | Valid |
| Q7 | 25.0 | 131.3 | 672.2 | 2.9 | Valid |
| Q8 | 26.0 | 141.3 | 764.8 | 3.1 | Valid |
| Q9 | 25.9 | 137.7 | 723.0 | 3.1 | Valid |
| Q10 | 19.4 | 102.2 | 413.0 | 3.4 | Valid |
Table 11.
Comparison of significant wave height and wave power with [
8]. Adapted with permission from Elsevier, 2016.
Table 11.
Comparison of significant wave height and wave power with [
8]. Adapted with permission from Elsevier, 2016.
| Point | Hs [m] | Power [kW/m] |
|---|
| WAM [8] | SWAN | WAM [8] | SWAN | WAM [8] | SWAN |
|---|
| P2 | Q1 | 1.38 | 1.40 | 12.66 | 12.77 |
| P4 | Q2 | 1.73 | 1.66 | 21.49 | 20.80 |
| P6 | Q3 | 1.91 | 1.91 | 26.08 | 25.84 |
| P8 | Q4 | 1.98 | 1.92 | 27.33 | 26.91 |
| P10 | Q5 | 2.13 | 2.13 | 29.94 | 28.36 |
| P12 | Q6 | 2.02 | 1.98 | 27.40 | 25.56 |
| P14 | Q7 | 1.91 | 1.88 | 24.97 | 25.03 |
| P15 | Q8 | 1.99 | 1.85 | 25.95 | 26.00 |
| P16 | Q9 | 1.91 | 1.97 | 23.08 | 25.89 |
| P18 | Q10 | 1.81 | 1.72 | 20.11 | 19.35 |
| Relative Error [%] | 2.72 | 3.49 |
| Disclaimer/Publisher’s Note: The statements, opinions and data contained in all publications are solely those of the individual author(s) and contributor(s) and not of MDPI and/or the editor(s). MDPI and/or the editor(s) disclaim responsibility for any injury to people or property resulting from any ideas, methods, instructions or products referred to in the content. |
© 2023 by the authors. Licensee MDPI, Basel, Switzerland. This article is an open access article distributed under the terms and conditions of the Creative Commons Attribution (CC BY) license (https://creativecommons.org/licenses/by/4.0/).


