Review

The Expected Dynamics of the European Offshore Wind Sector in the Climate Change Context

Department of Mechanical Engineering, Faculty of Engineering, “Dunarea de Jos” University of Galati, 800008 Galati, Romania
*
Author to whom correspondence should be addressed.
J. Mar. Sci. Eng. 2023, 11(10), 1967; https://doi.org/10.3390/jmse11101967
Submission received: 6 September 2023 / Revised: 8 October 2023 / Accepted: 9 October 2023 / Published: 11 October 2023
(This article belongs to the Special Issue Marine Renewable Energy and the Transition to a Low Carbon Future)

Abstract

:
The objective of this present work is to provide a more comprehensive picture of the wind conditions corresponding to some important European marine energy sites by considering both historical (1979–2020) and climatological data (2021–2100). As a first step, the wind energy profile of each site is assessed using some statistical methods (e.g., Weibull parameters) and some relevant indicators for the wind sector, such as the downtime period (<3 m/s). Since the offshore industry evolves very quickly, another objective of this work was to assess the performances of some large-scale wind turbines defined via capacity productions in the range of 15–25 MW. In terms of the capacity factor, the estimated values frequently exceed 60%, reaching a maximum of 76% in some cases, in line with the expected outputs of the new wind generators. In the final part of this work, several aspects are discussed, among them being the accuracy of the RCPs datasets or the current trends involving the wind sector. The offshore wind sector represents an important pillar of the European green market, which means that the future generation of wind turbines will play an important role in the consolidation of this sector and, eventually, in the expansion to new coastal areas.

1. Introduction

When discussing the energy sector, we note that the production of electricity is responsible for most greenhouse gas emissions. Nevertheless, a green energy future can be obtained from renewable sources [1], the philosophy promoted on the European level through the European Green Deal. This programmatic document aims to efficiently use all the available sources to obtain a 55% attenuation of greenhouse emissions by 2030 (compared to 1990) and finally to cut all the emissions by 2050 [2]. Various programs are developed under the Green Deal umbrella, this being the case of REPowerEU aiming to contribute to a smooth transition to a green future [3].
Taking into account that Europe has a large sea space, special attention is given to the use of marine renewable energy that can be provided from various sources, such as waves, wind, tides, or marine biofuels [4]. Offshore wind is a mature sector; it is expected that this will become the number one source of electricity in Europe by 2042. According to the Green Deal targets, the offshore wind market can grow to a capacity of 380 GW by 2050, most of the projects (85%) being located in the Northern European Seas, where more significant wind resources are available. These plans can be achieved by taking into account that, at this moment, the electricity provided via offshore wind is cheaper than the one from gas-fired or nuclear power plants. The capacity factor of the new projects goes up to 50%, while the next-generation wind turbines will reach capacities of 20–25 MW and hub heights up to 200 m [5,6,7]. By looking at the global offshore market (for the first half of 2021), we can notice that Europe is still a leader, with more important projects being located in the UK (10.4 GW) and Germany (7.7 GW). For the first time, China is in second place with an installed capacity of 7.9 GW, with offshore projects of 5.4 GW under construction. In total, the projects implemented in the marine areas vary from 0.2 to 1.4 GW, being based on wind turbines that reach a rated capacity of 9.5 MW [8].
A suitable way to identify future changes in offshore wind conditions can be made using the datasets based on the Representative Concentration Pathway (RCP) scenarios [9]. The most common ones are RCP2.6, RCP4.5, RCP6, and RCP8.5, being related to the expected increase in the radiative forcing by the end of 2100, with values in the range of 2.6–8.5 W/m2. Moreover, in the case of RCP4.5 (weak warming), it is supposed that the peak in the CO2 emissions will be reached near 2040, while according to RCP8.5 (strong warming), the emissions will continue to grow the entire 21st century and afterward [10]. The occurrence of the RCP wind data attracted the attention of many scientists, especially those focused on European regions. For example, in the work of Davy et al. [11], special attention was given to the Black Sea, with the wind conditions being evaluated for the interval of 2021–2090. According to these results, the north-western part of this region presents the best wind resources, a good fit noticed between the seasonal fluctuations and the energy demand. Also, it was indicated that the wind resources from this basin will be less affected by future climate changes compared to other areas in Europe. These results are confirmed also by the work of Islek and Yuksel [12], which indicates more energetic resources for RCP4.5 (compared to RCP 8.5), i.e., expected wind power in the range of (9–319) W/m2 (south-east and north-west of the basin).
The North Sea wind dynamics were assessed in Rusu [10] for the near and distant future (2021–2060 and 2061–2100). The RCP data indicate more significant wind resources near the north-western part of this region (UK coasts), with an expected increase in the higher wind speeds that exceed 30 m/s. In Susini et al. [13], the North and Irish Seas were considered for assessment, along with the wind climate evaluation included in the performances of several offshore wind turbines. For example, by the end of the 21st century, all the wind projects taken into account will reduce their electricity performances by 2%. It is expected that in the case of a large wind turbine (8 MW Vestas), this decrease will be close to 3%. For example, the performance of the Humber Gateway project will be reduced by 2%, followed by Burbo Bank at 1.7%, while smaller values (<1%) are associated with the Nordsee One and Dan Tysk projects. In Martinez and Iglesias [14], the entire European region was considered for analysis, where, regardless of the climate scenario considered, higher wind resources are expected near Finland (+30% in the west). In contrast, the wind energy potential will decrease (down to 35%) in areas like the Central Mediterranean, northern Europe, or the upper European Atlantic Ocean (Ireland, Iceland, and Britain). These changes are expected to become more visible in the time frame of 2056–2065, reaching peak values by the end of the 21st century (2091–2100).
In this context, the objective of this present work is to analyze the past and future wind dynamics in the vicinity of some representative European marine renewable sites using historical and regional climate wind data. In addition, the performances of some large offshore wind turbines rated between 15 and 25 MW are considered for assessment since future projects will be built based on these types of generators.
Compared to some previous works, this present work covers the following gaps:
(a)
Identify the future wind energy changes from different European offshore marine sites where different projects are currently operating or planned to be developed;
(b)
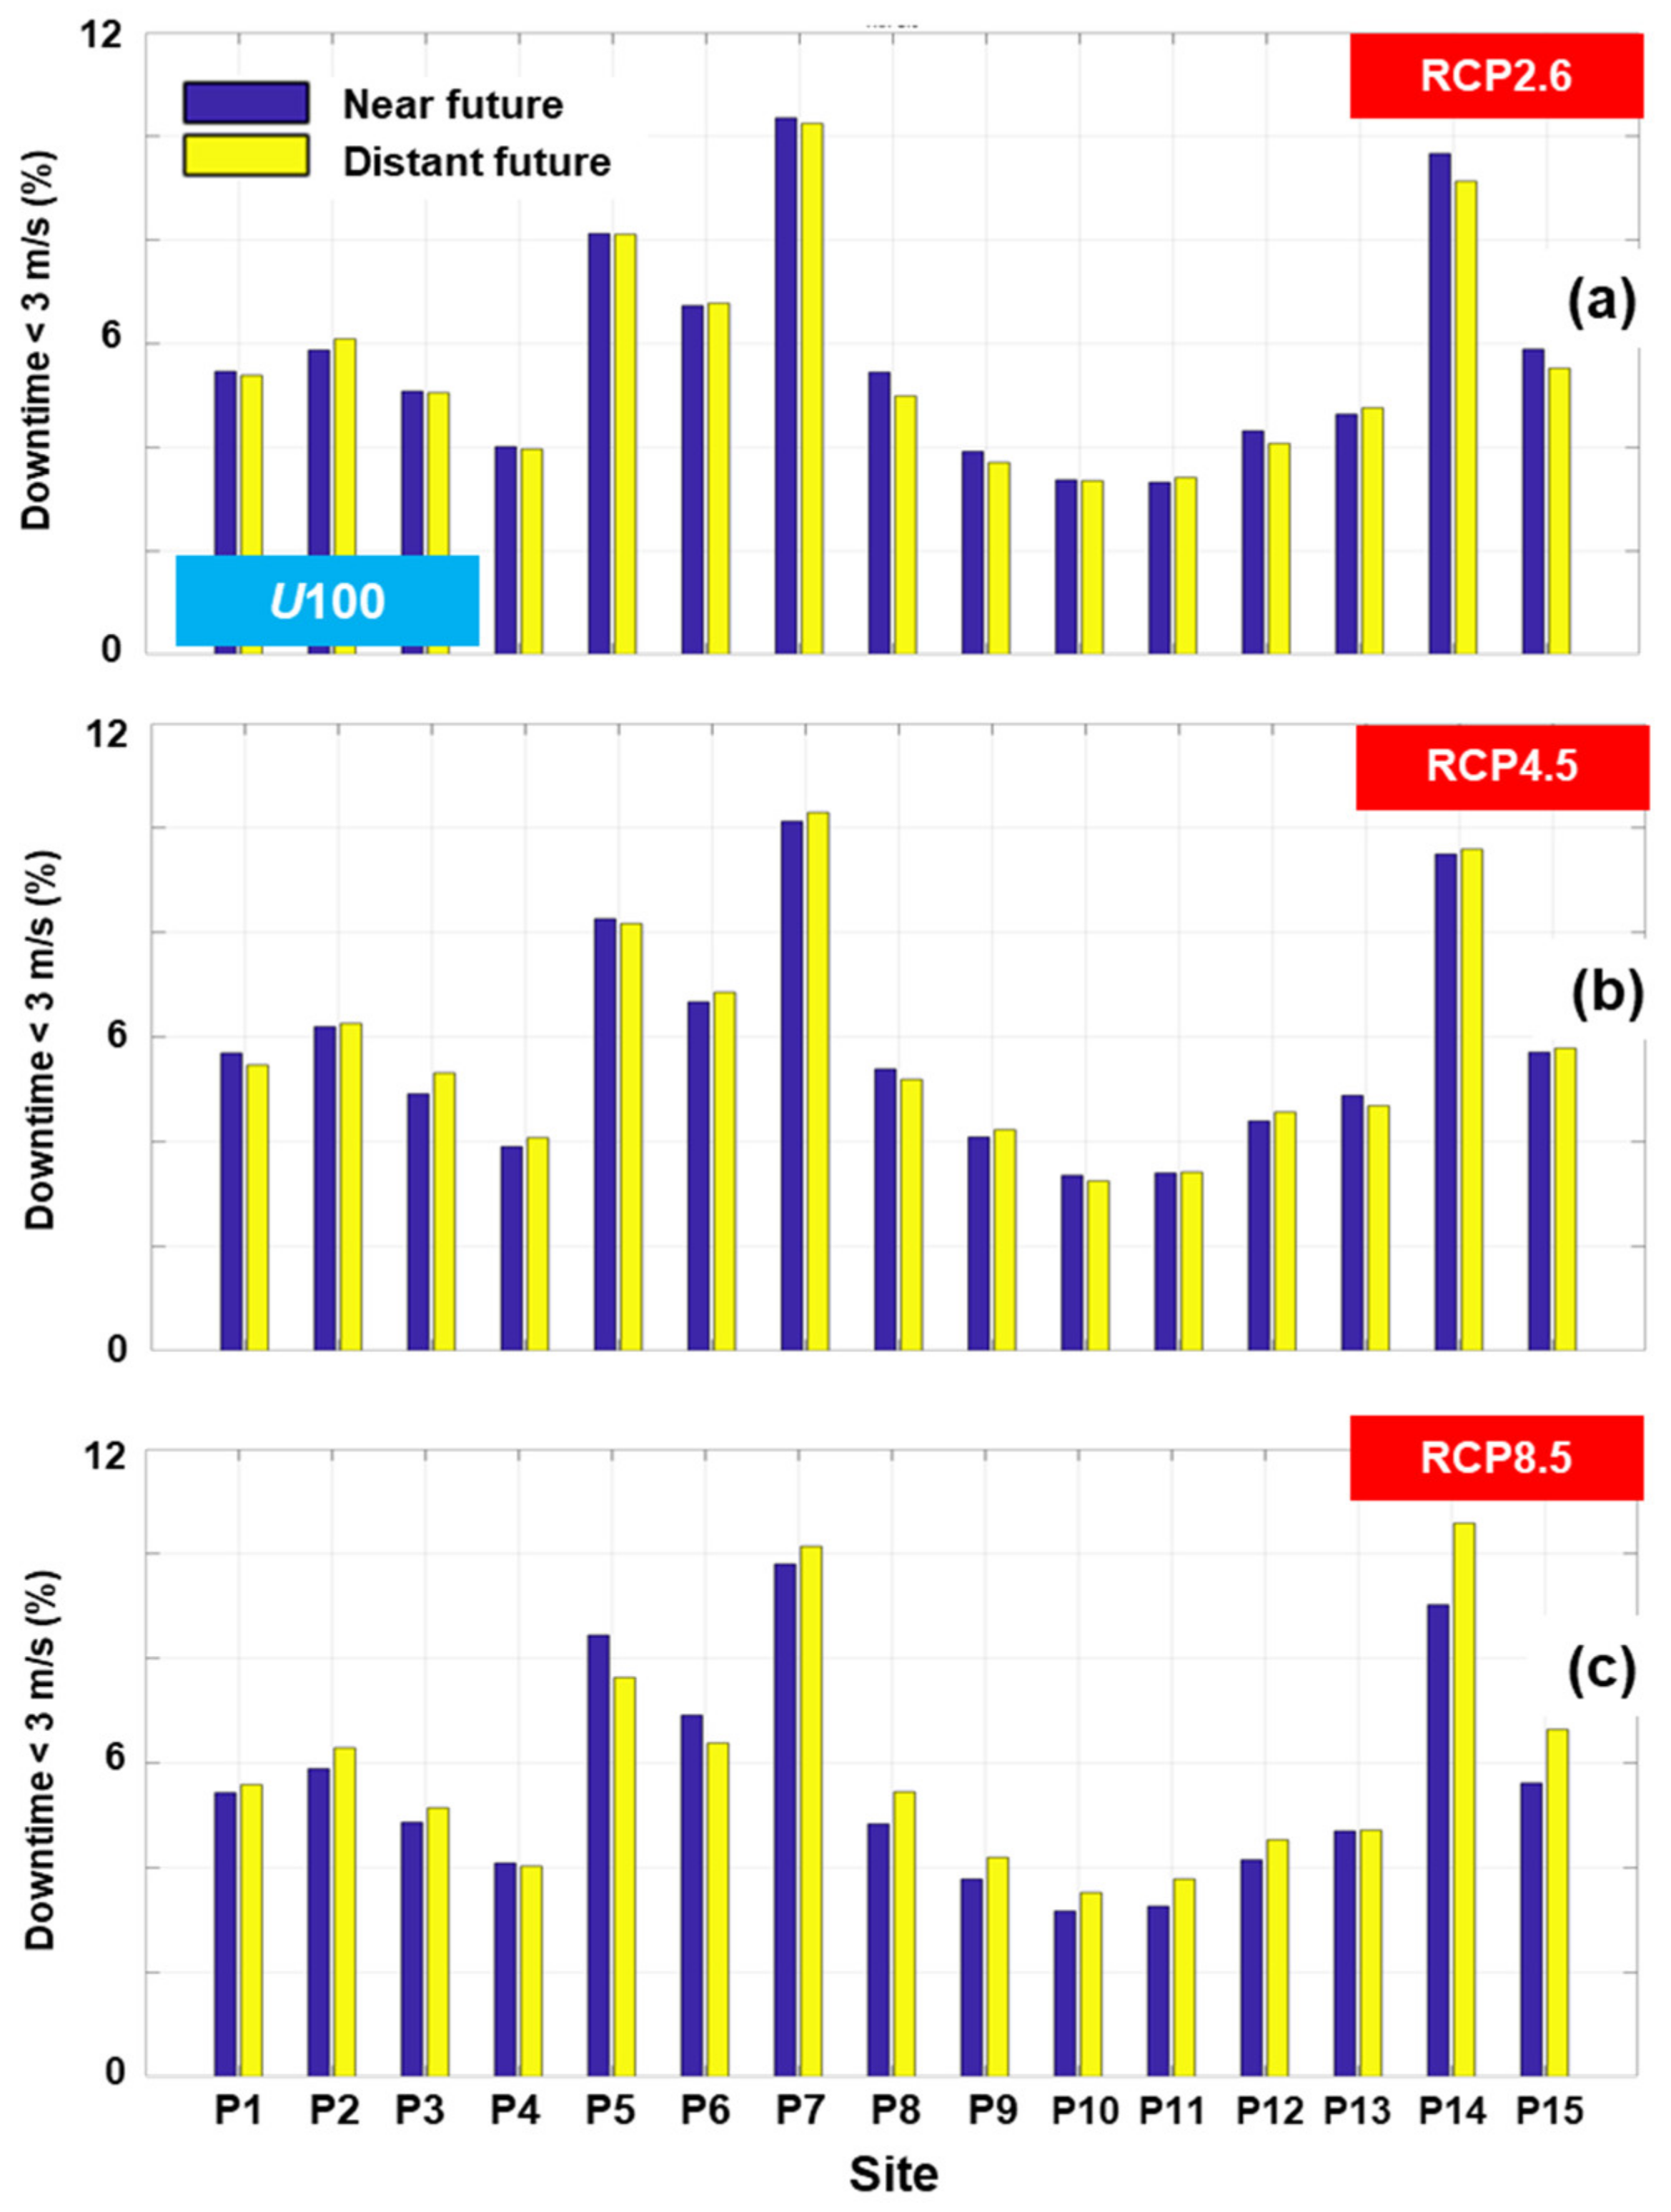
Describe the future wind changes using some relevant indexes for the wind sector (for example, downtime period);
(c)
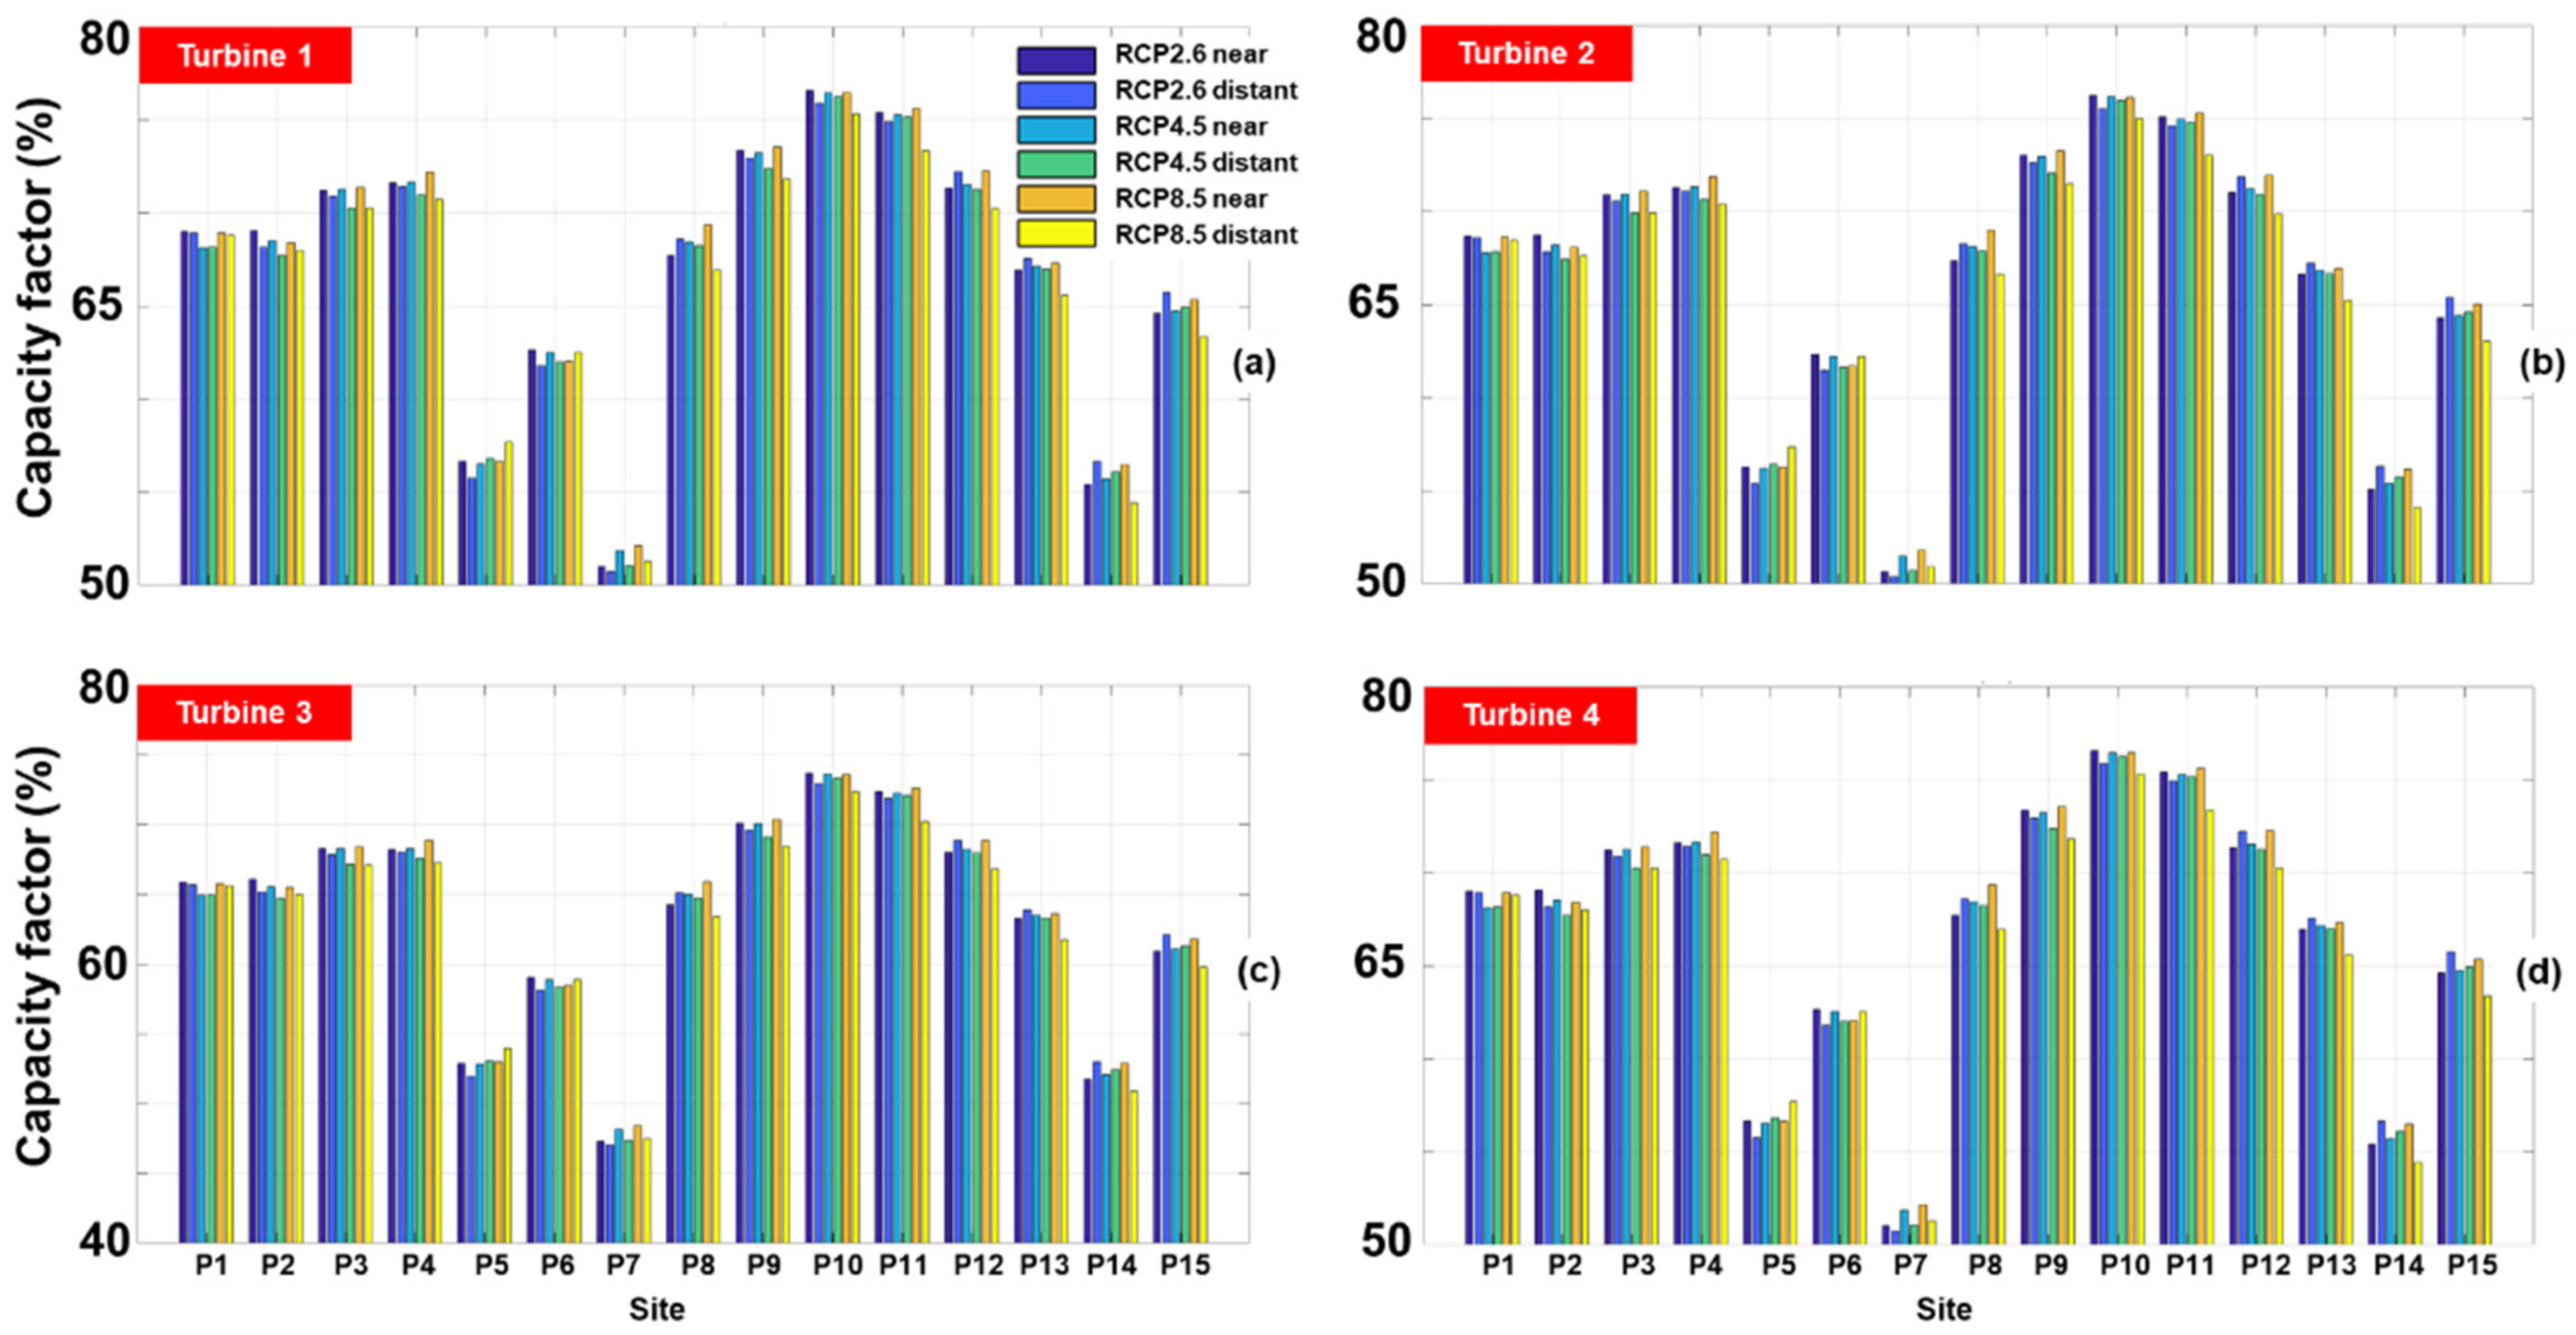
Identify the expected performances of some large-capacity wind turbines that are expected to be implemented/developed in the near future.

2. Materials and Methods
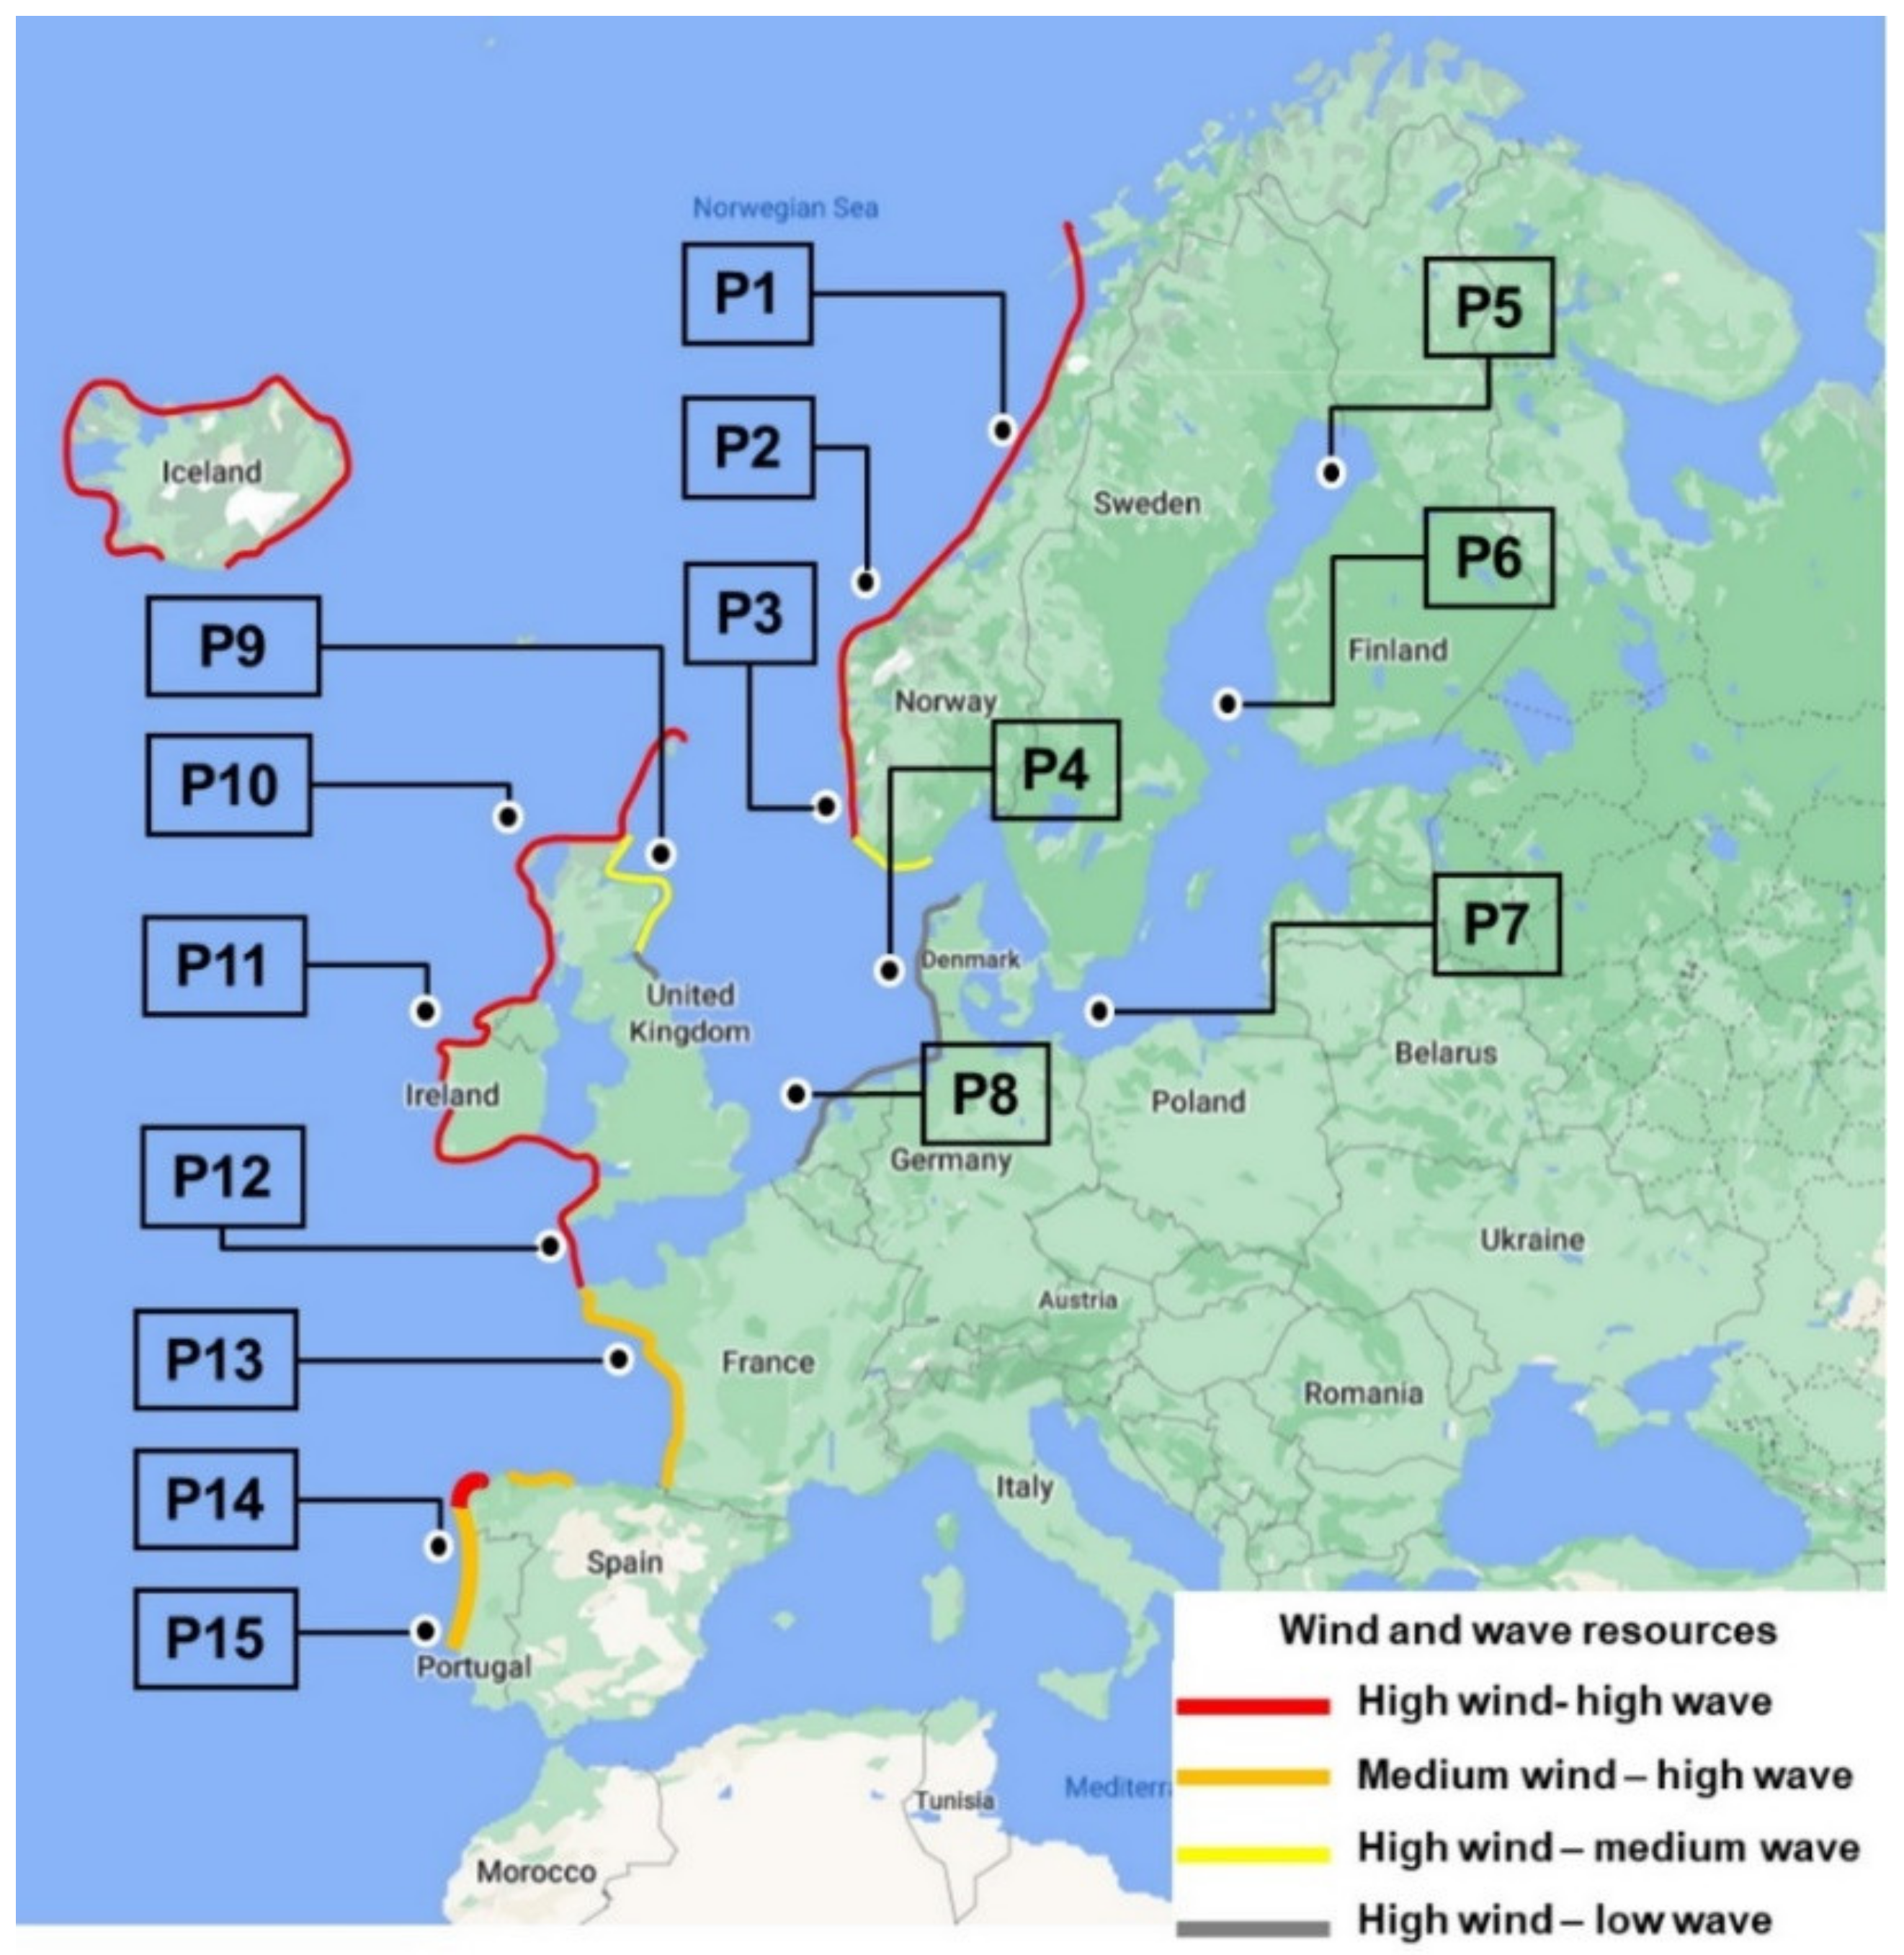
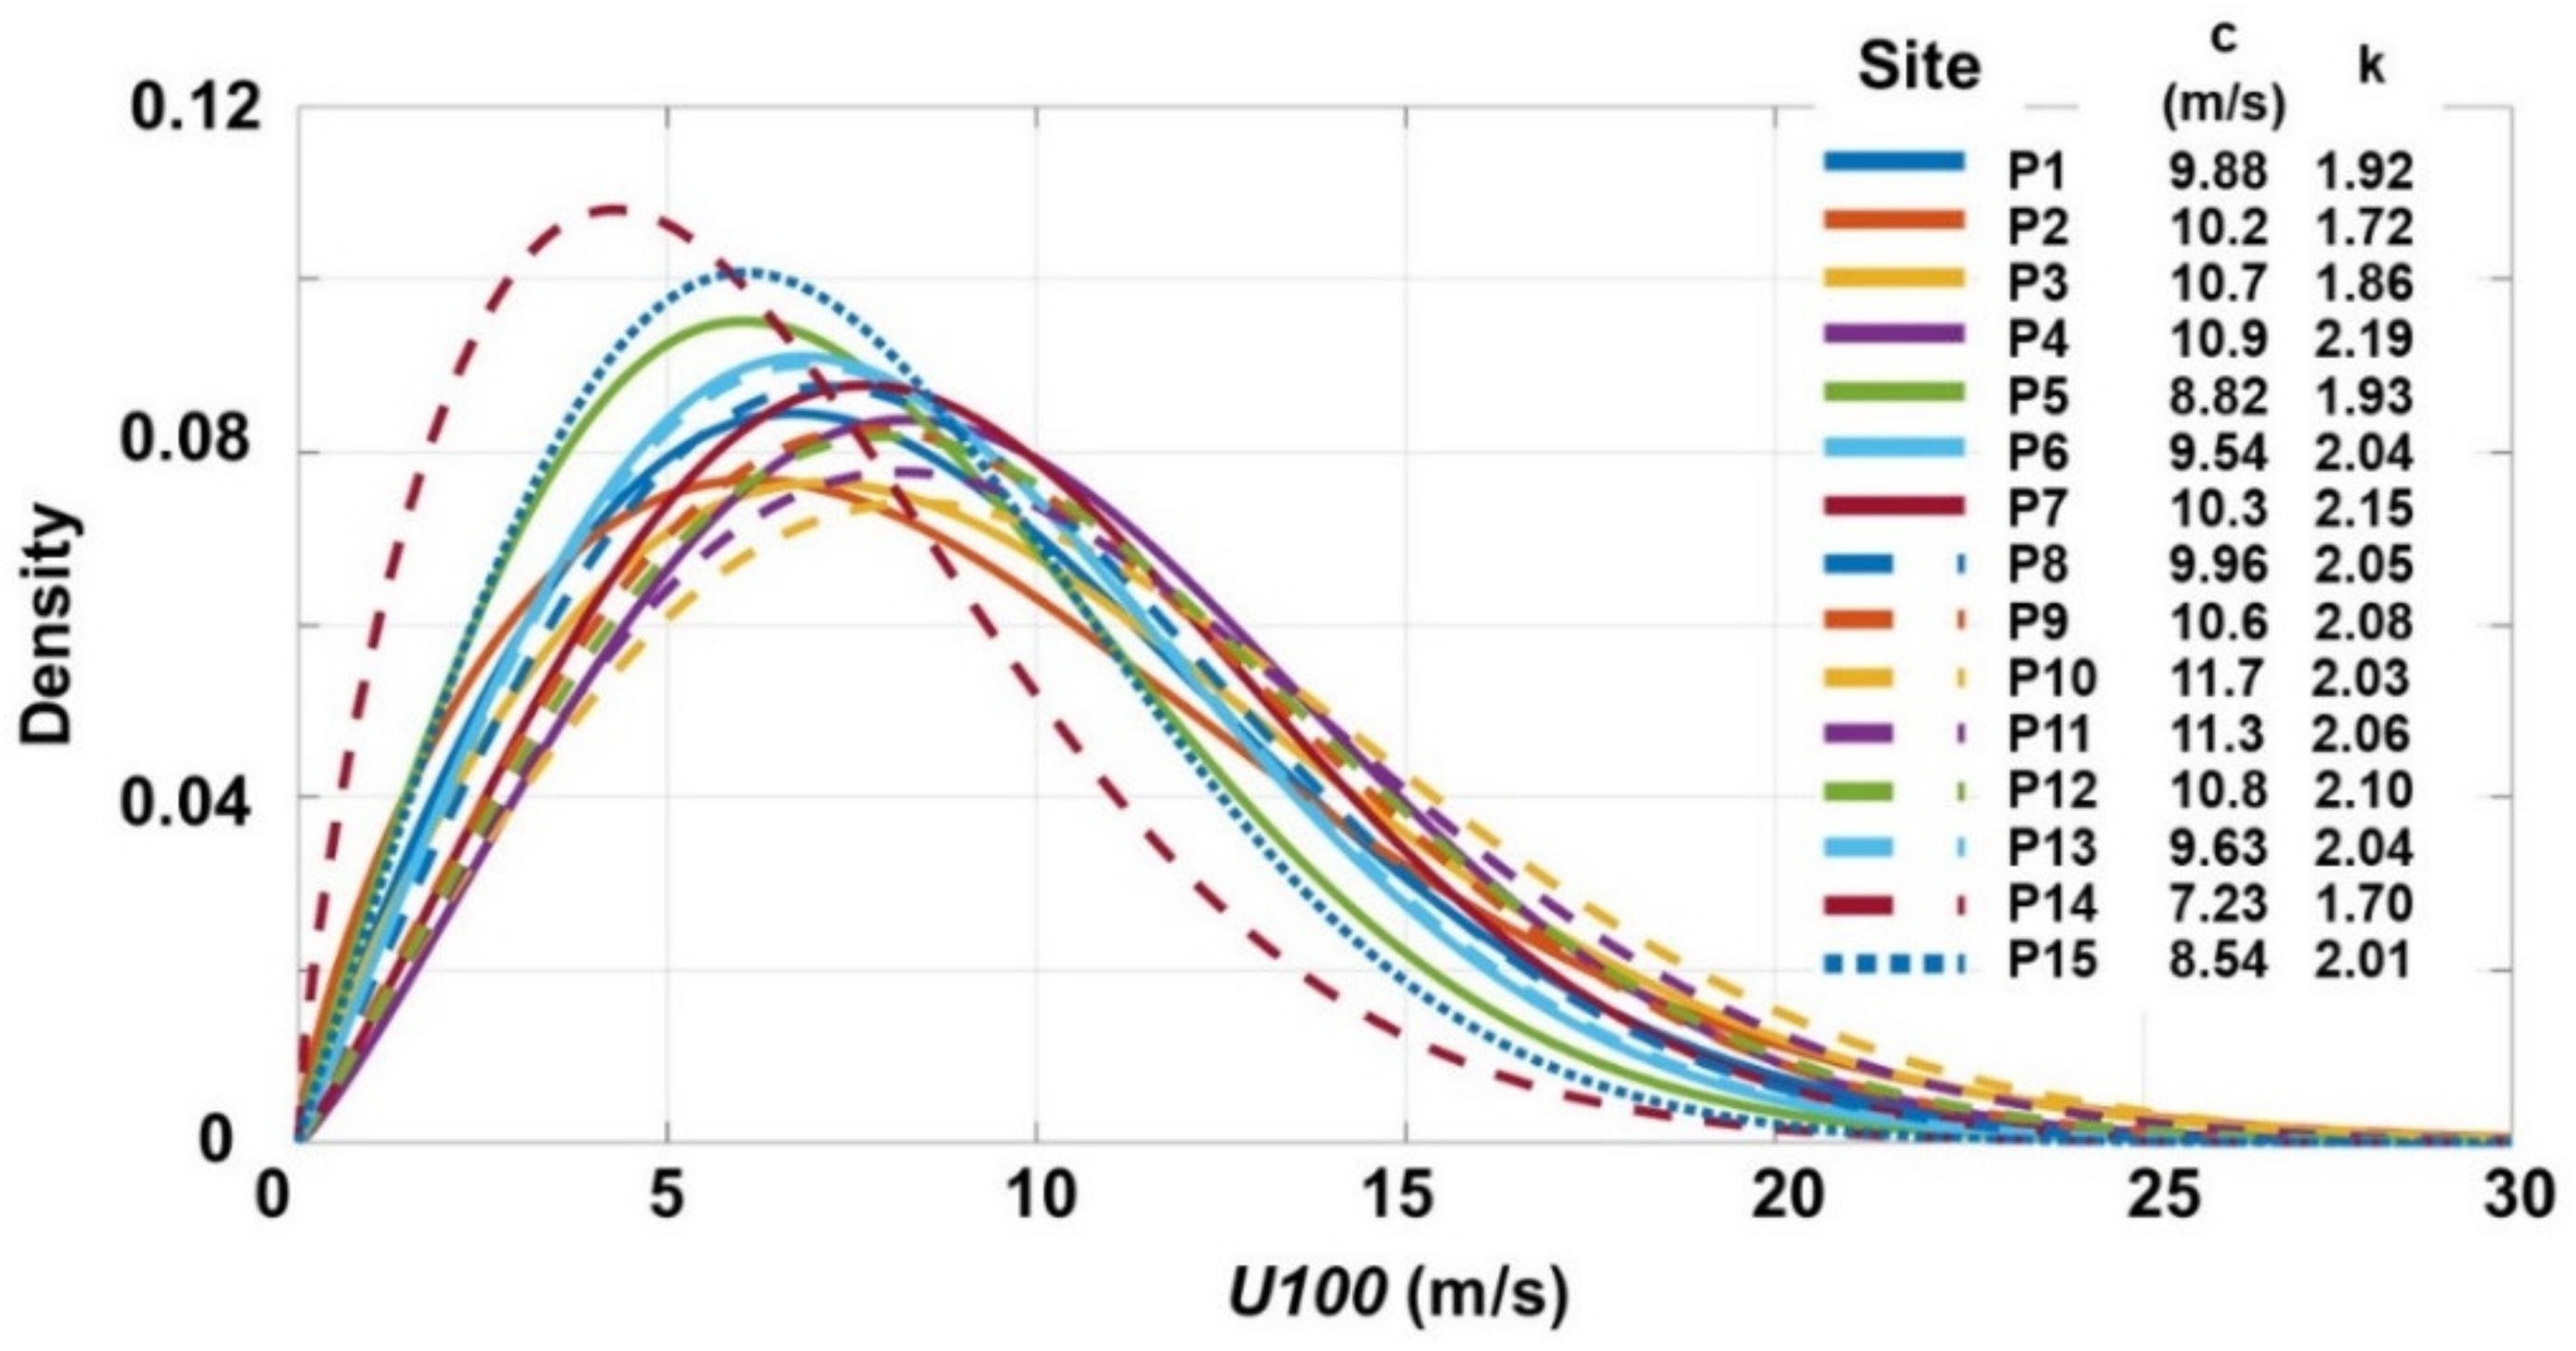
As shown in Figure 1, a total of 15 reference sites (denoted from P1 to P15) are considered in this present work. Table 1 summarizes the main geographical features of these sites, from which we can notice that all of them are currently used (or taken into account) for the implementation of some offshore wind projects, except sites P1 and P15. According to some previous studies, the sites located in the northern part of Europe facing the North Atlantic Ocean or the Norwegian Sea (e.g., P2 or P11) are defined by important wind and wave resources, which make them suitable for the development of combined wind–wave projects [15]. It can be also noticed that sites P4 and P8 are located in coastal areas with more energetic wind conditions (according to Figure 1), compared to sites P13, P14, and P15, which demonstrated average values. Group sites P5, P6, and P7 are used to assess the local resources from the Baltic Sea, taking into account that this is considered an important area for the development of offshore wind farms. For example, two major wind projects will be built near the Aland archipelago (close to the reference site P6), defined by a joint capacity of 8 GW. Furthermore, when completed, the Noatun project (Syd and Nord) will become the largest offshore project in the world (5 GW) [16]. Another representative project is related to the site P14 (WindFloat1 project), where the first semi-submersible wind turbine was installed [17]. This project is no longer operational, but some key aspects were highlighted, such as the fact that such a platform can withstand wave heights of up to 17 m.
In terms of geographical features, site P3 (Utsira Nord) is associated with the highest distance to the shore (95 km) and a water depth of 237 m, followed by P13 (Saint-Nazaire) with 80 km distance to the shore and 111 m depth. Sites P7 and P14 are the closest ones to the shore, associated with a minimum distance of 5 km and a water depth of 13 m.

2.1. Wind Datasets

The ERA5 wind data [21] are considered to assess the historical evolution of the wind conditions, processed for a 42-year time interval (January 1979–December 2020). For this present work, it was considered useful to process wind fields at 100 m heights (denoted as U100) available in the ERA5 project, this being the hub height at which most offshore wind farms currently operate [22]. Taking into account the time interval covered, only four values per day were extracted from the existing grid (0.25° × 0.25°), these being related to a time resolution of 6 h (00:00, 06:00, 12:00, 18:00 UTC, respectively). In the case of the climate scenarios, two distinct intervals were considered for evaluation, which were associated with the following: (a) near future (2021–2060) and (b) distant future (2061–2100). The climatological data (denoted with RCPs) are those produced by the Rossby Centre of the Swedish Meteorological and Hydrological Institute (SMHI), computed using a regional model (version RCA4) with a spatial resolution of 0.11° and a time resolution similar to the ERA5 data processed for this work [23]. Based on the RCP pathways [24] proposed by the Intergovernmental Panel on Climate Change (IPCC), the following set of data were considered for analysis: (a) RCP 2.6; (b) RCP 4.5; (c) RCP 8.5. These cover the main radiative forcing expected by the end of the 21st century, from which RCP 8.5 can be considered the worst scenario. At this point, it is important to mention that the RCP wind data are associated with a reference height of 10 m (U10). In order to adjust the wind speed to a hub height of 100 m, the following relation can be used [4]:
U 100 = U 10 ln z 100 z 0 / ln z 10 z 0
where U10 and U100—wind speed at 10 m and 100 m height, z10 and z100—initial and adjusted height (100 m), and Z0—sea surface roughness (≈0.0002 m).

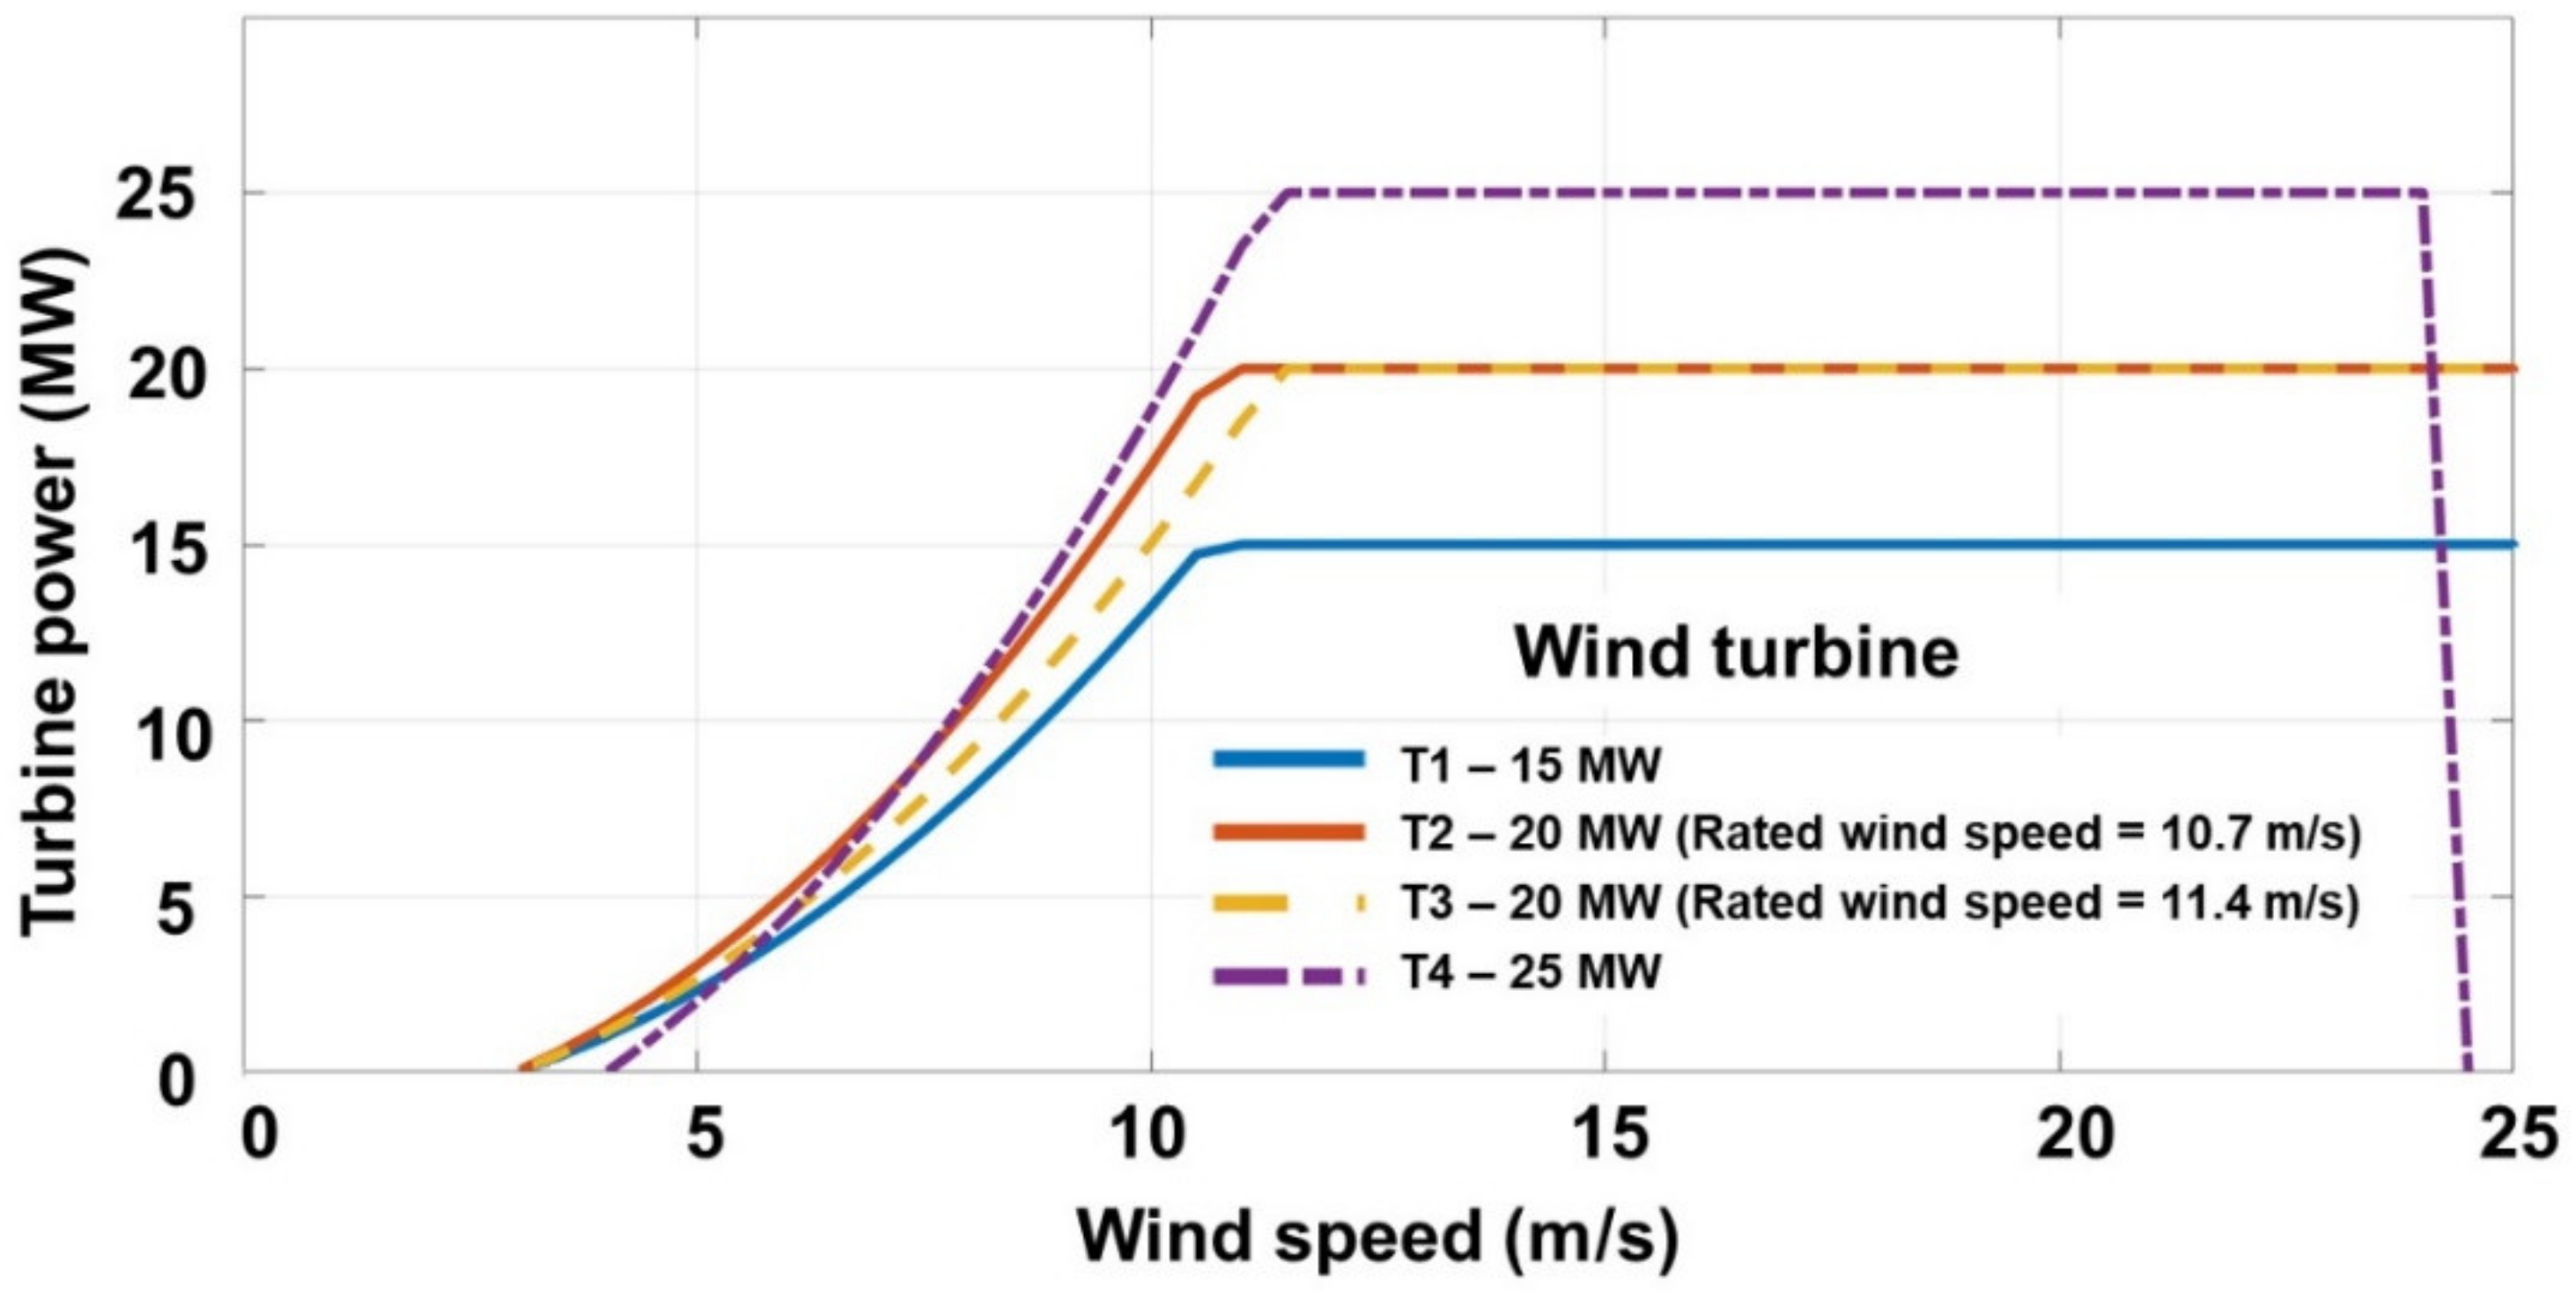
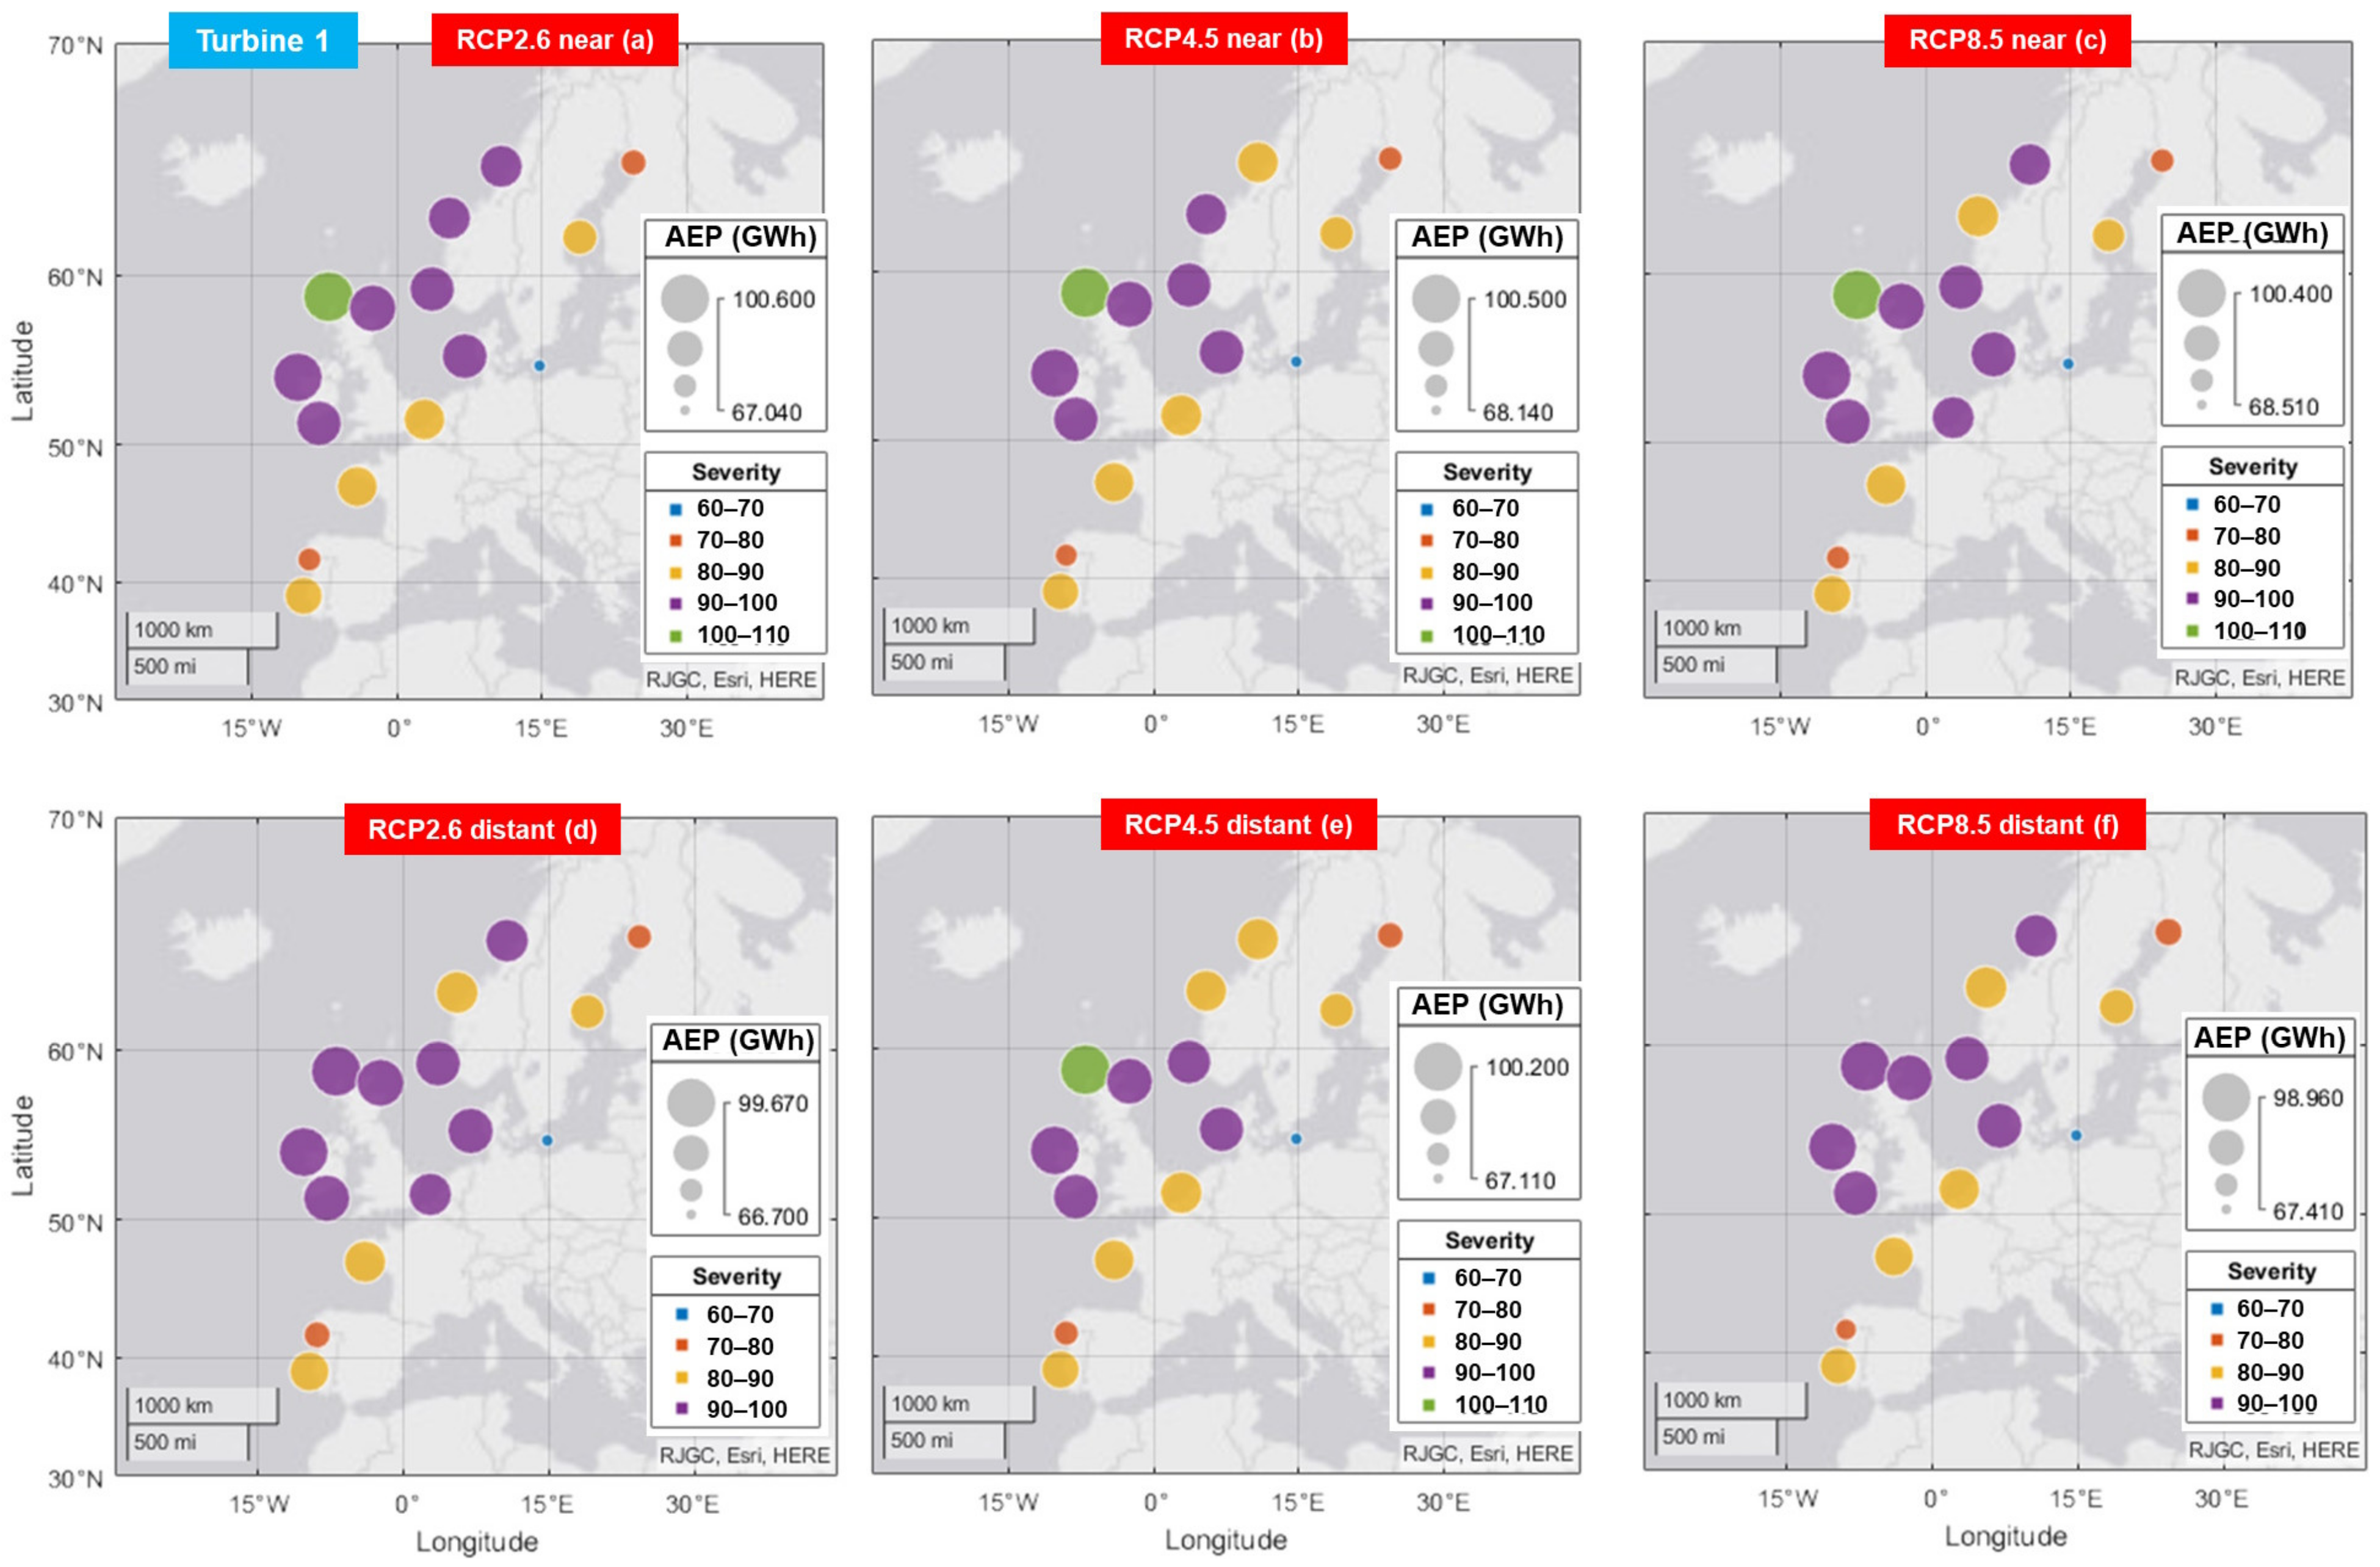
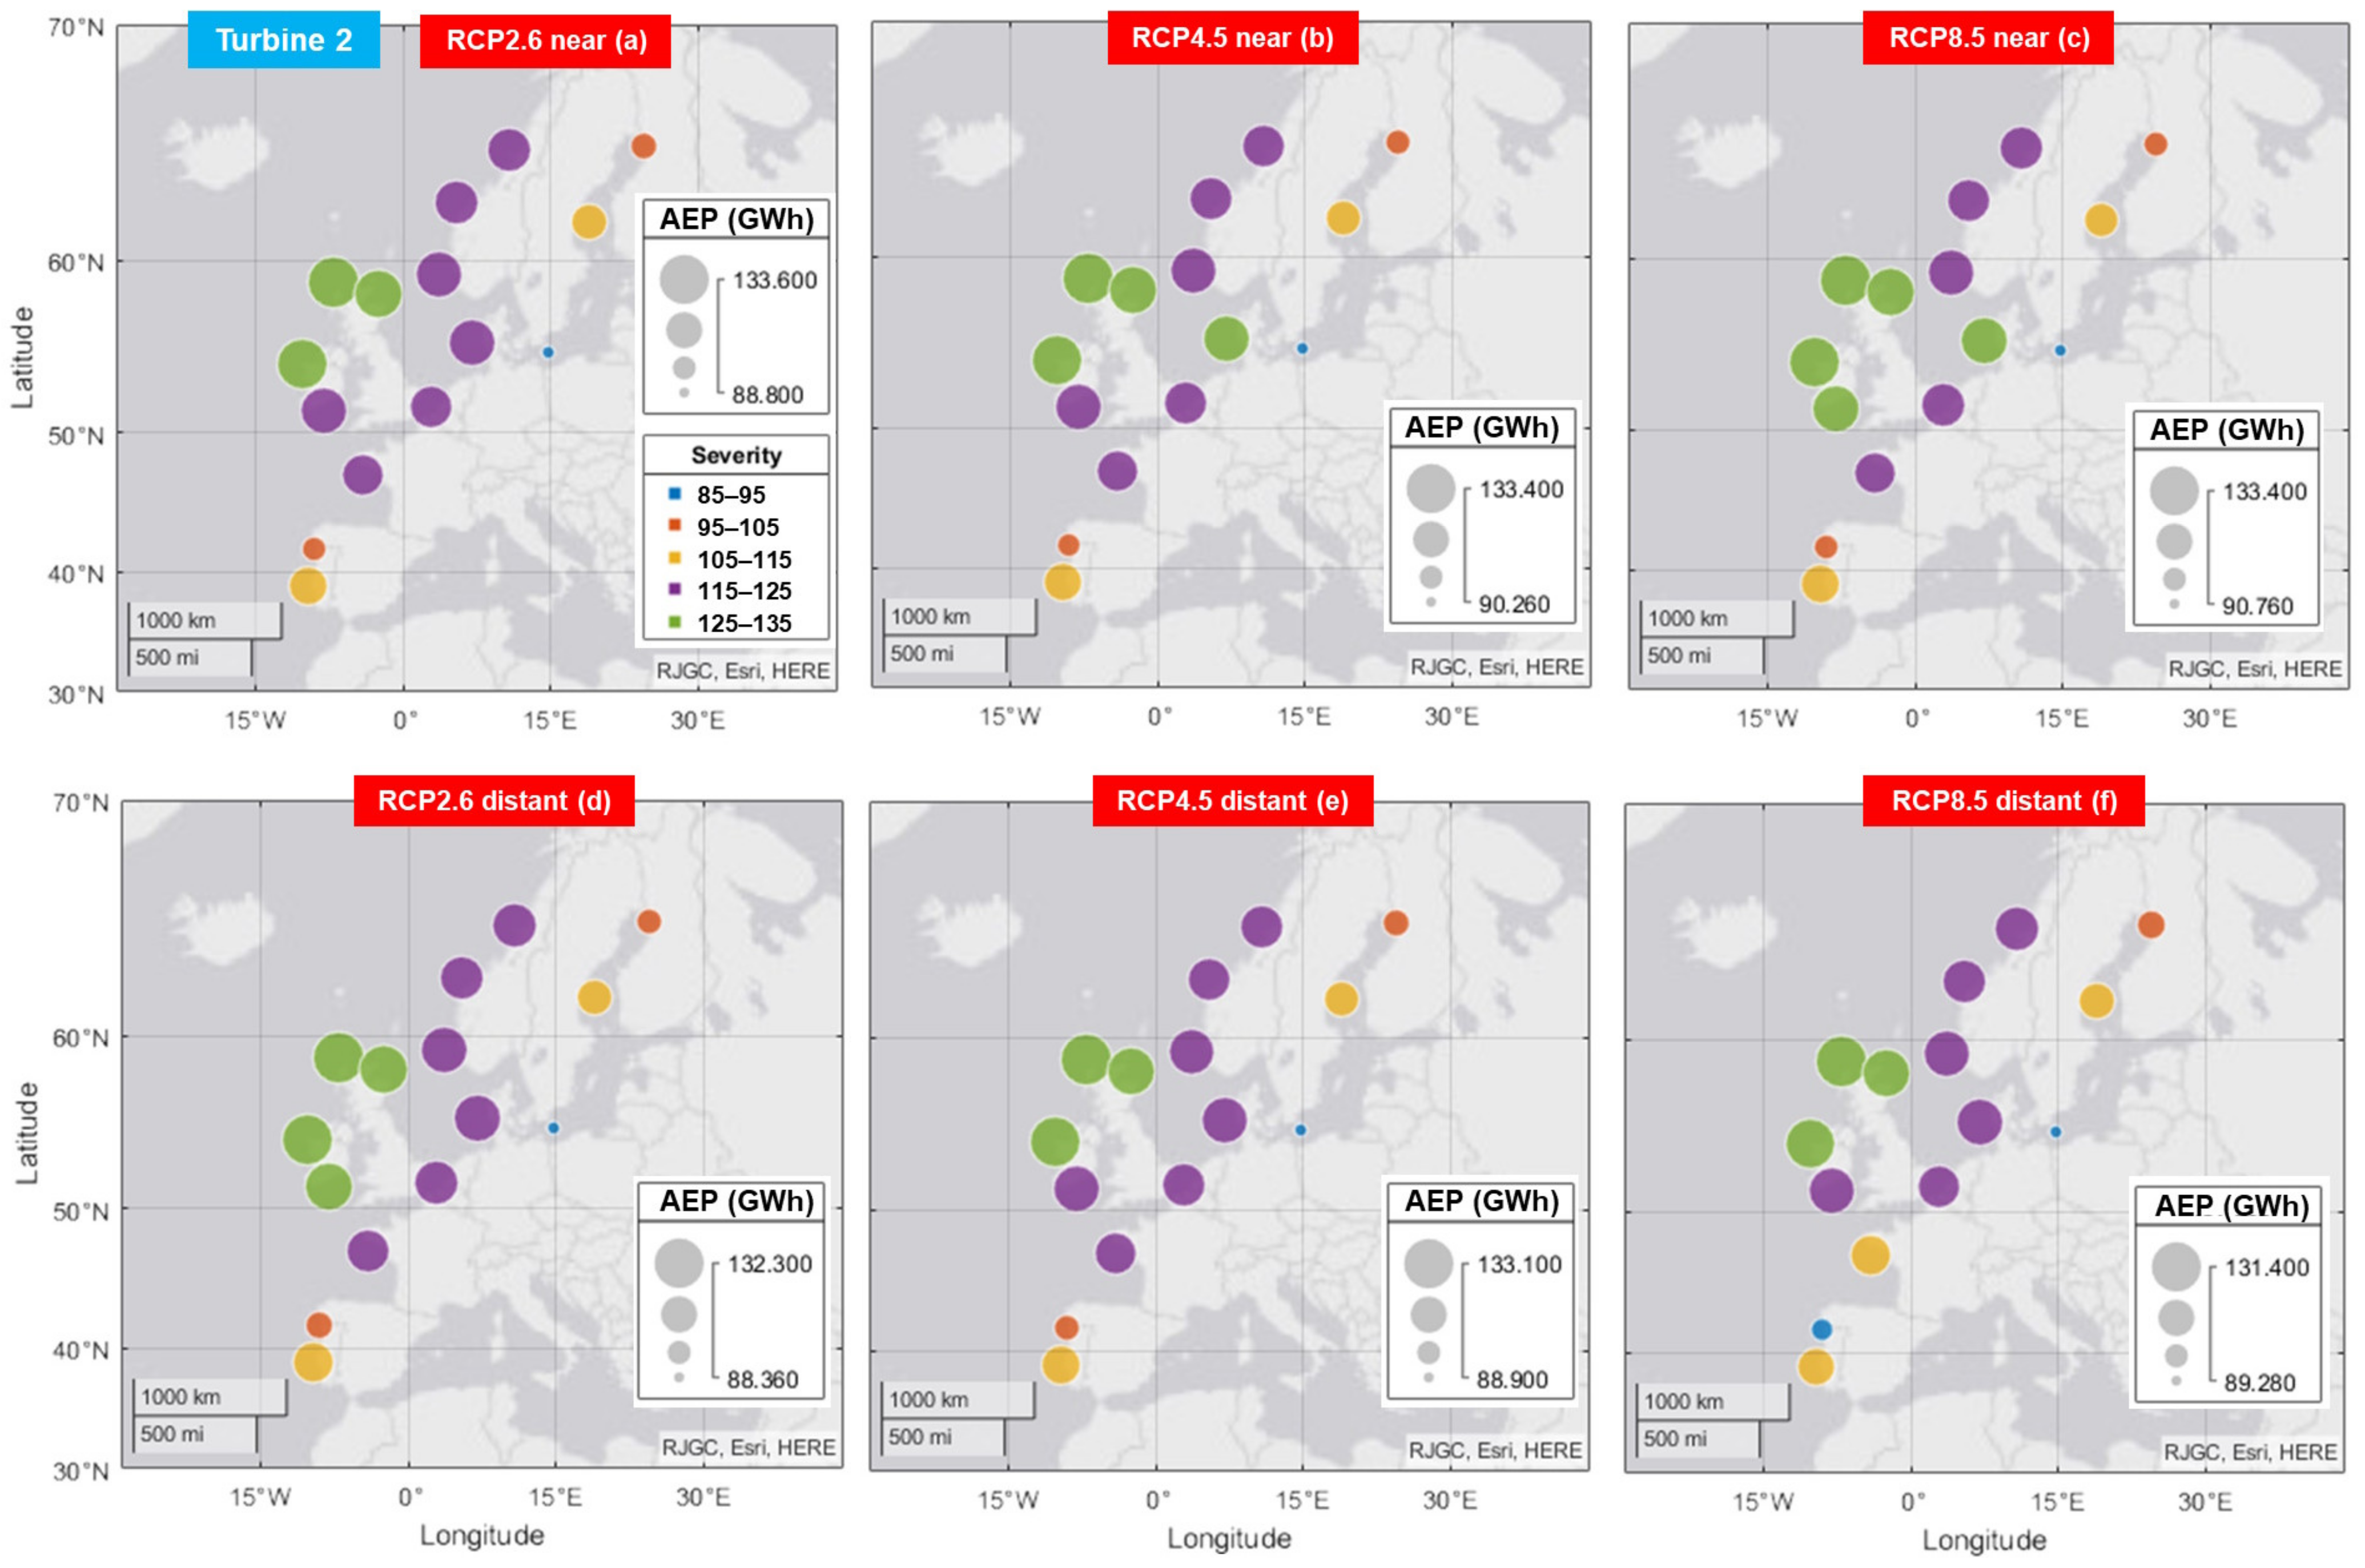
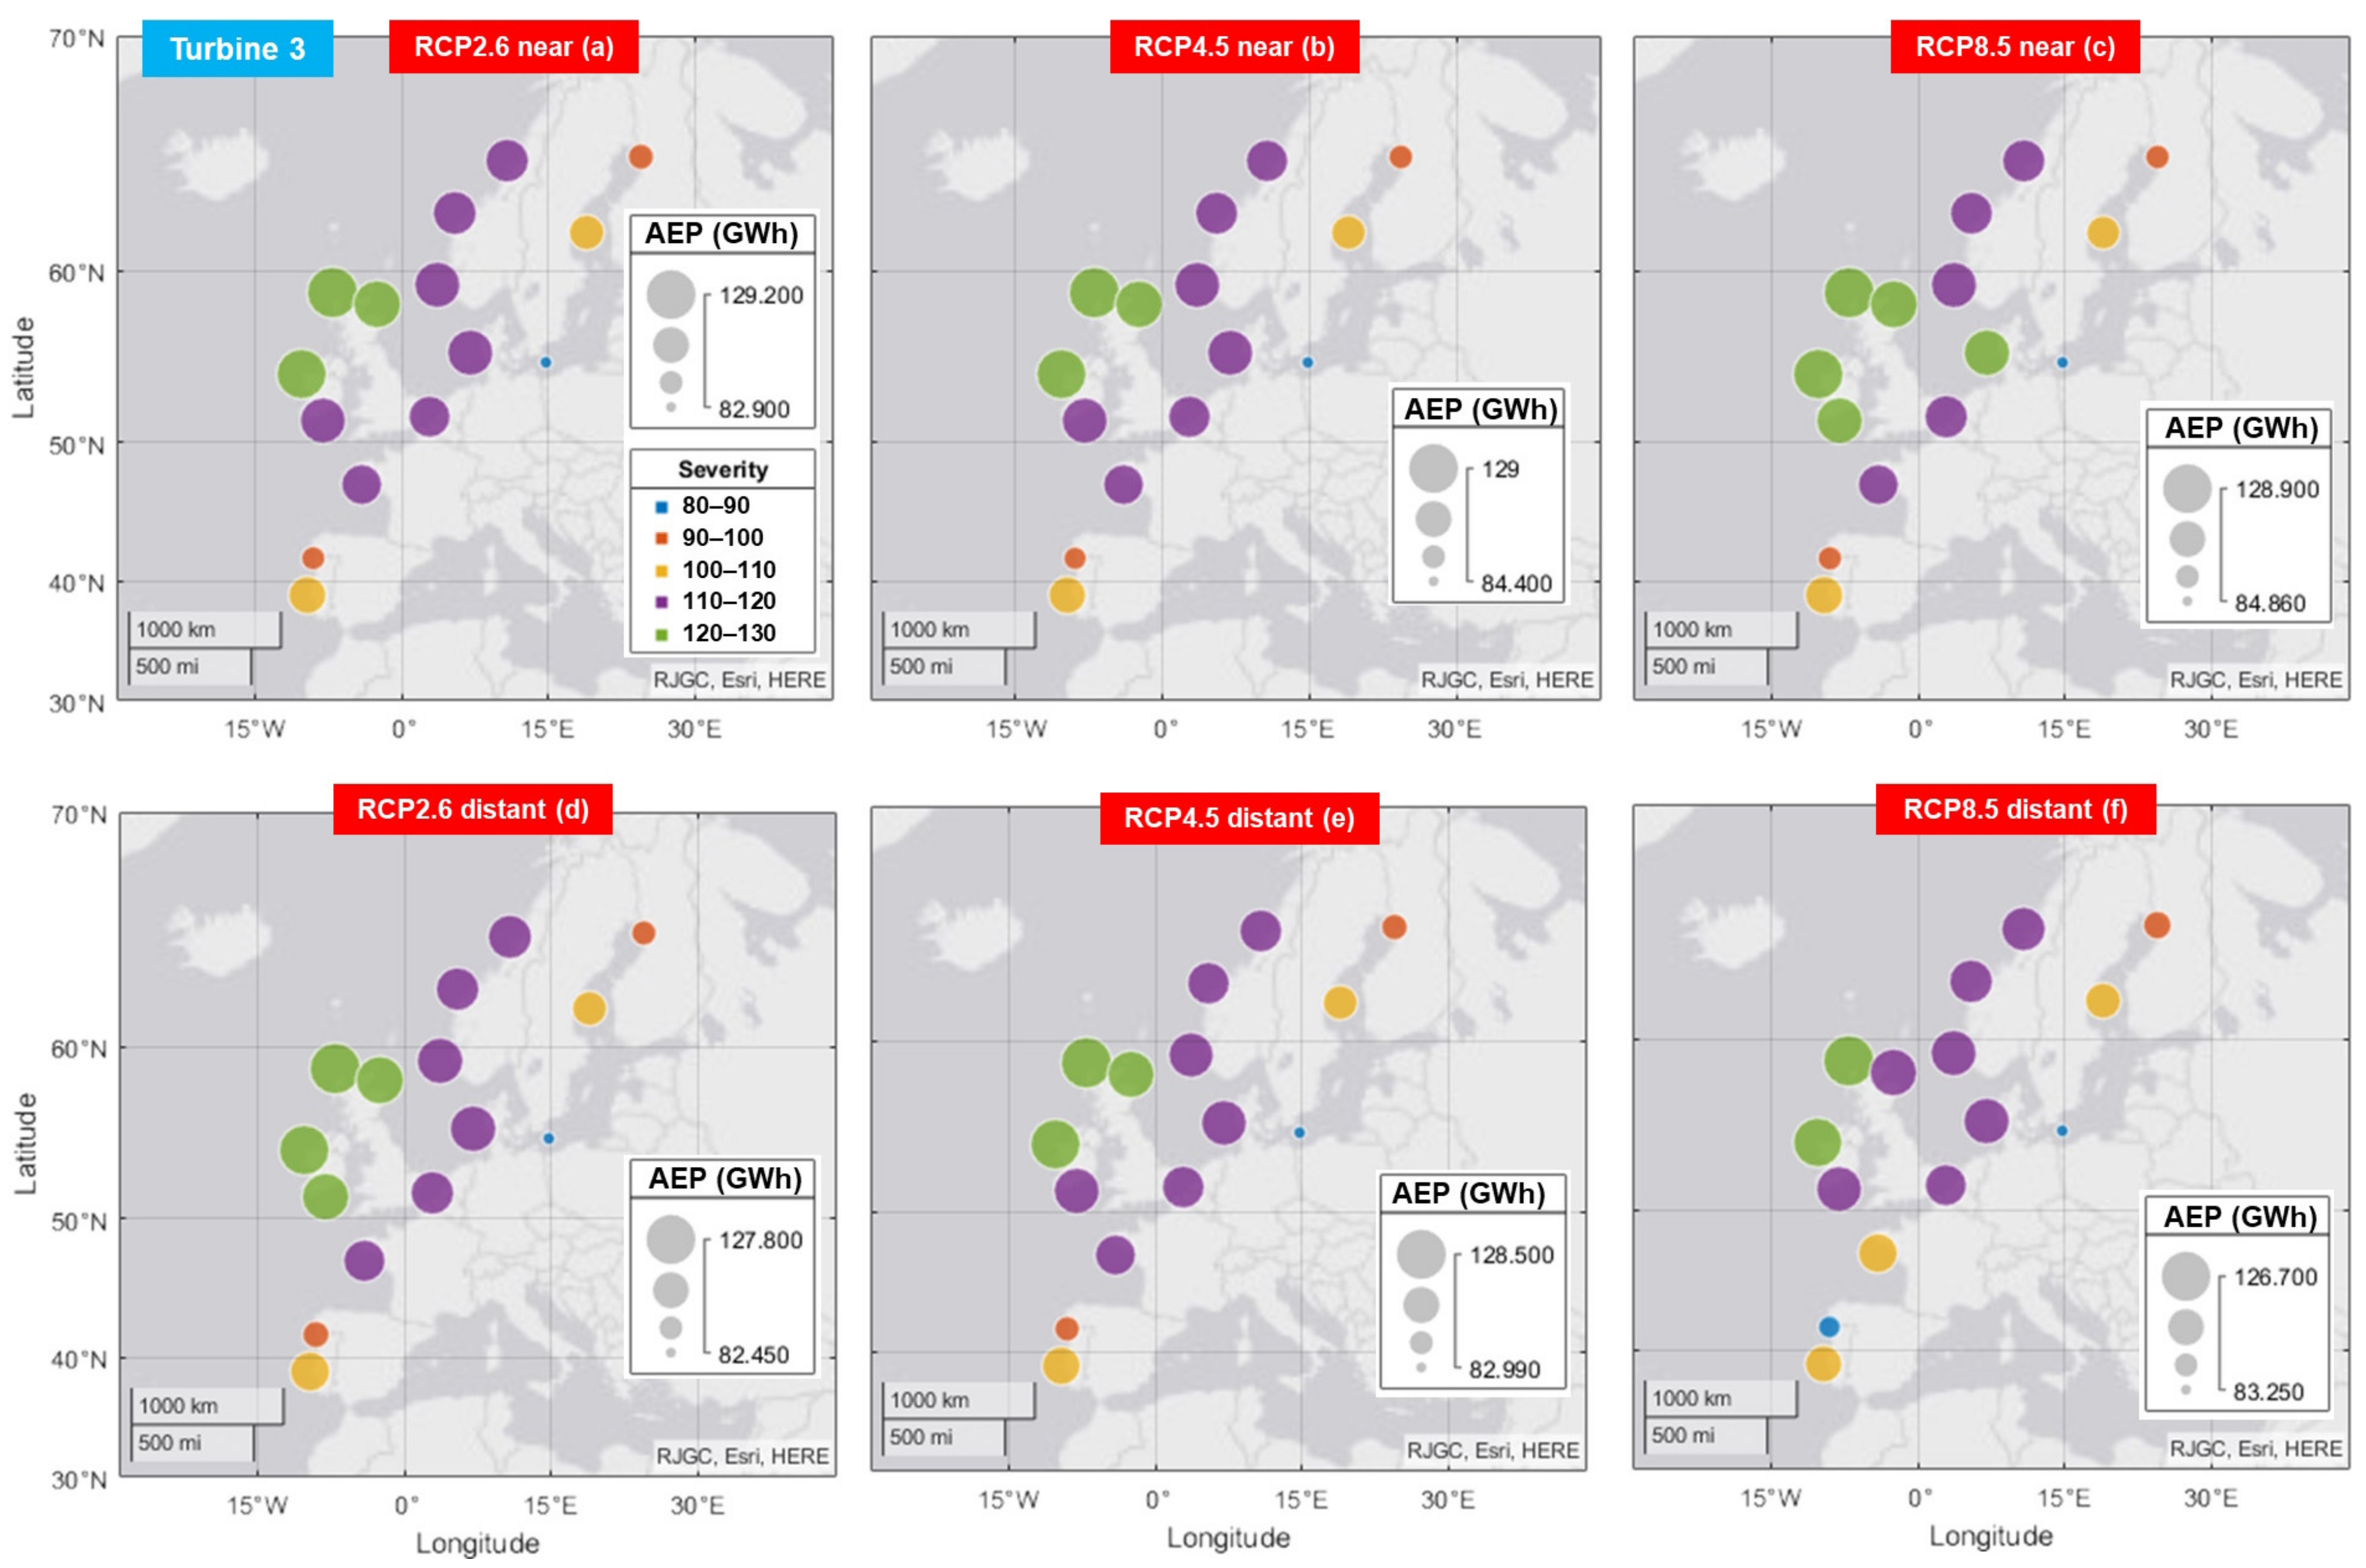
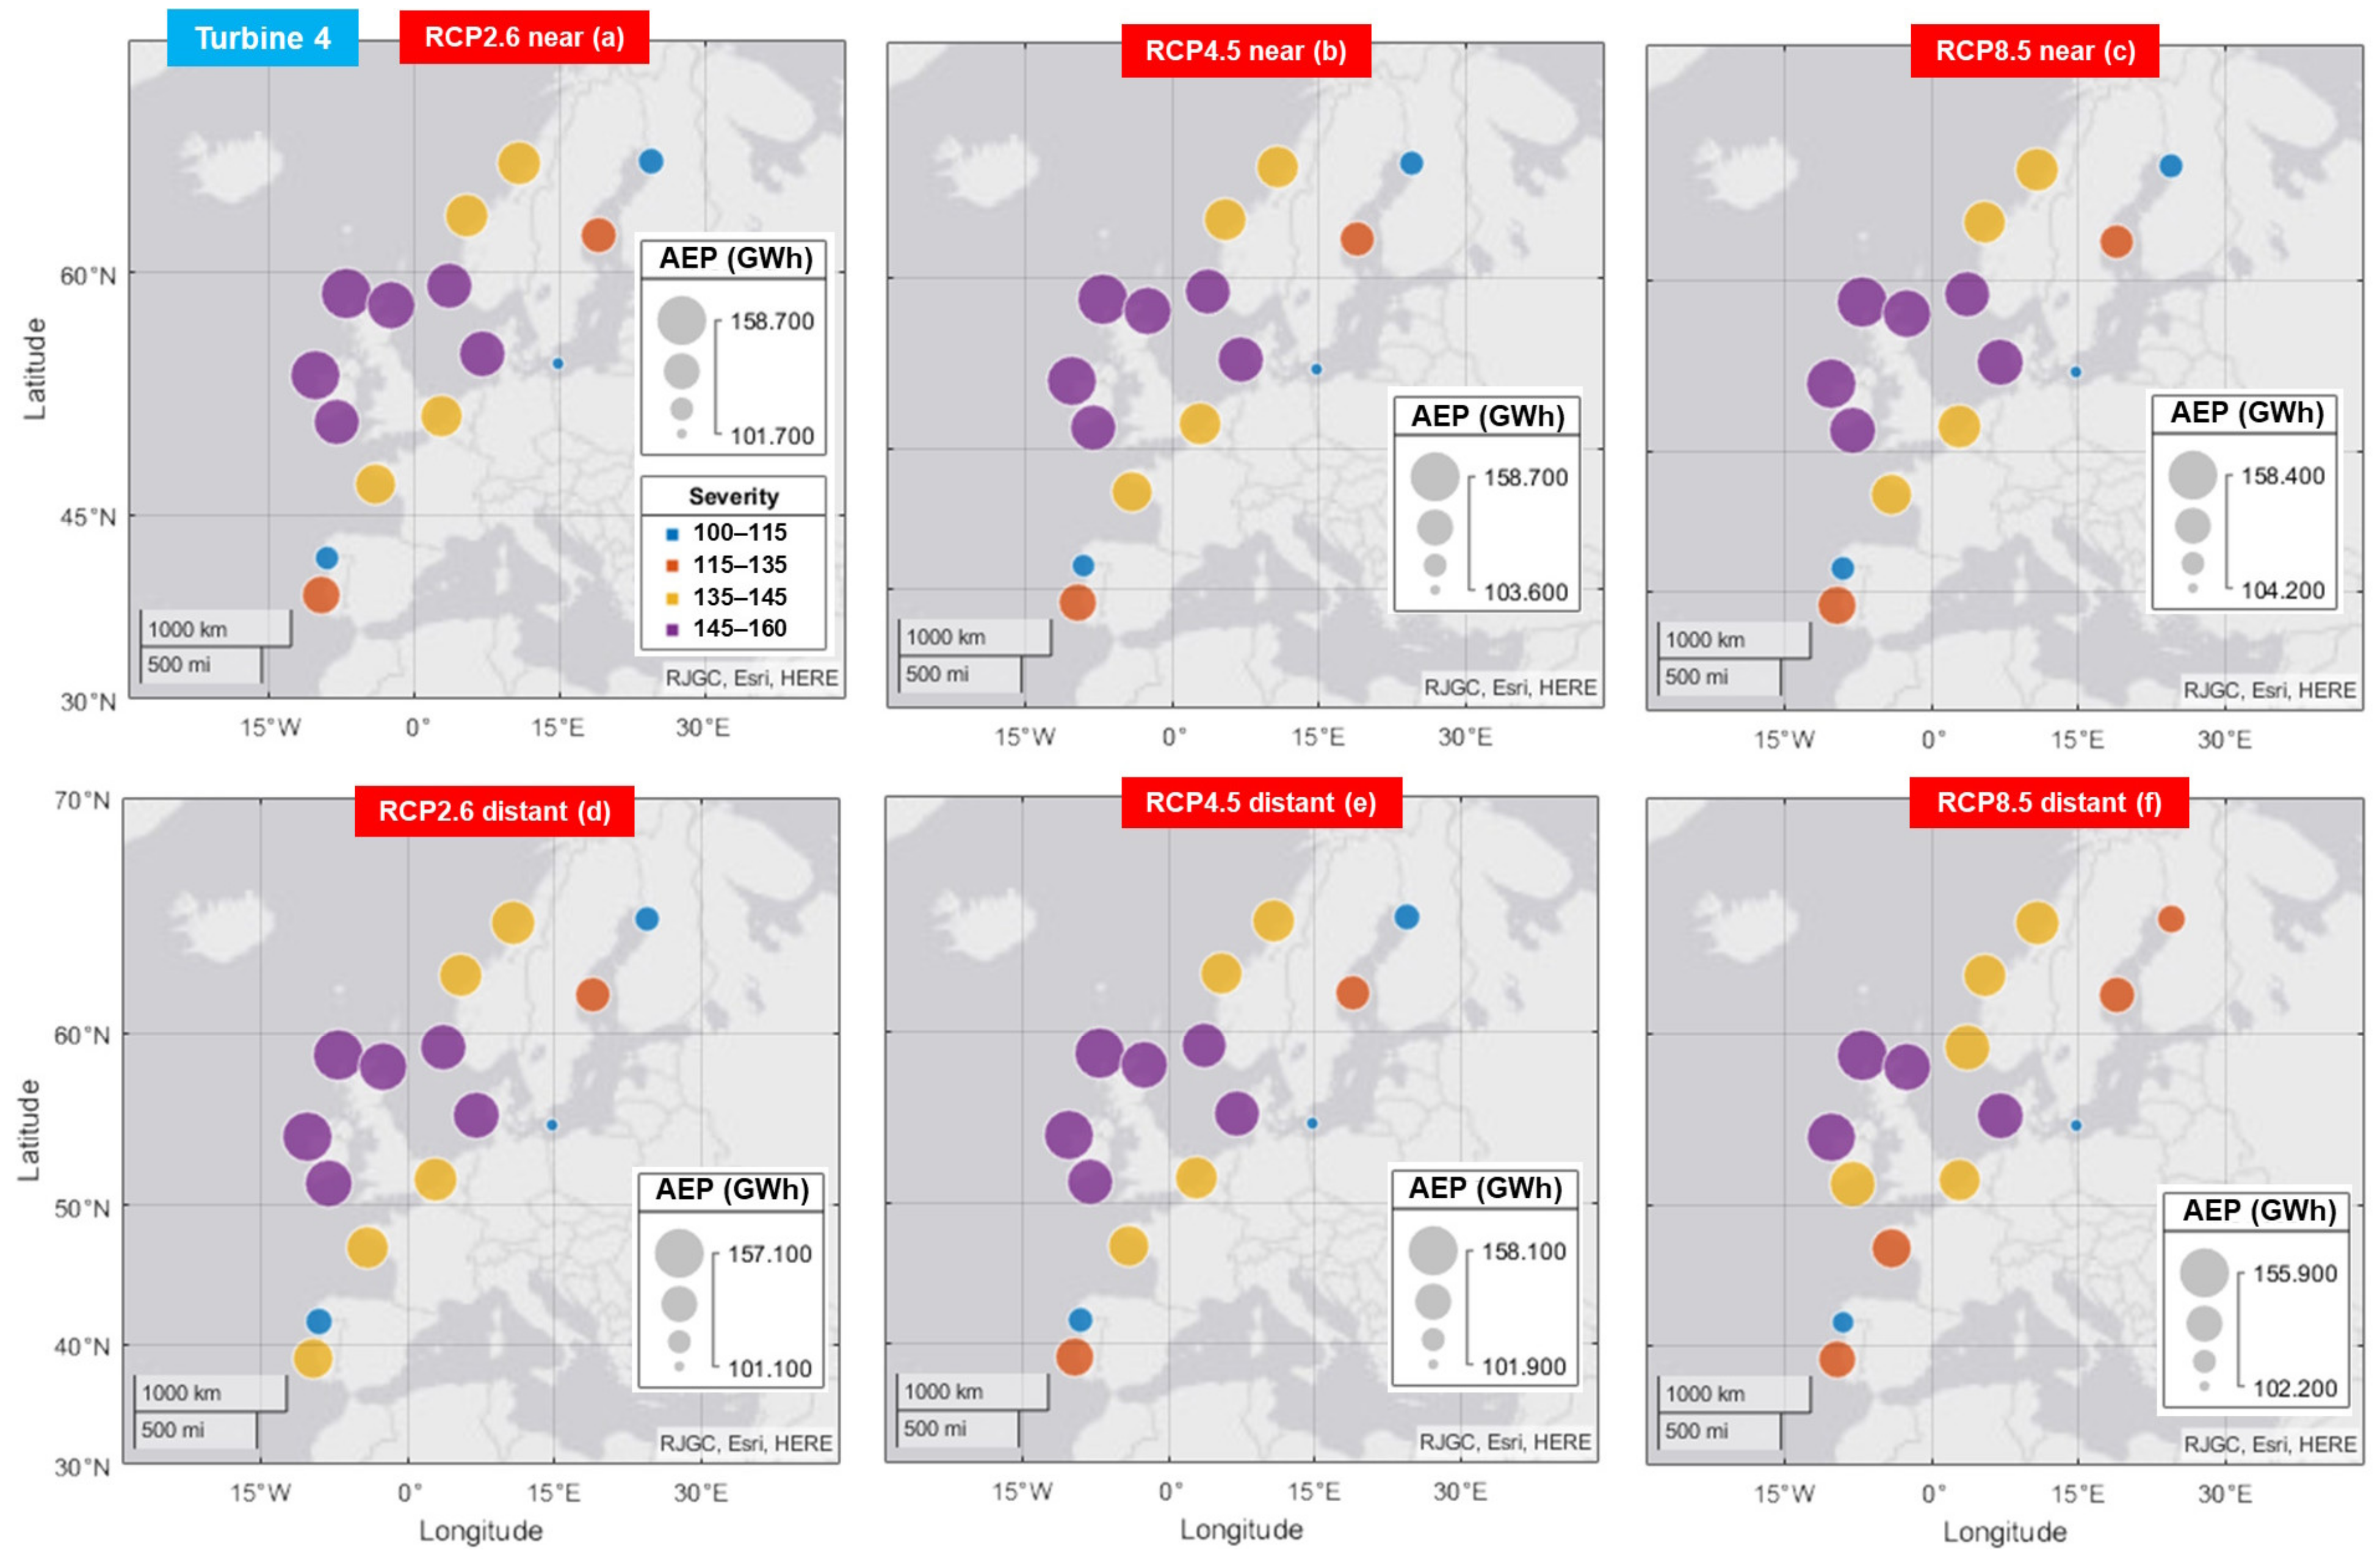
2.2. Wind Turbines Performances

Besides the assessment of the wind conditions, another objective of this present work is to estimate the performances of some offshore wind turbines that are expected to be implemented in future projects. In this work, a total of four generators (denoted from T1 to T4) were taken into account; their technical features are presented in Table 2. At this point, it is important to mention that, at this moment, these systems were developed only on a theoretical level. Nevertheless, we consider that future offshore systems will be assembled around these features. The turbine capacities range from 15 to 25 MW, this being related to hub heights of 150 and 210 m, respectively. We emphasize that these values cannot be considered exaggerated, taking into account the fast evolution of the offshore sector. For example, in 2000, the first 4 MW system was installed, followed by an 8 MW turbine in 2012 and a 10 MW turbine in 2020. This evolution was translated into a reduction in the number of turbines per GW from 500 (in 2001) to 100 (in 2020) [25]. Turbines T2 and T3 present relatively similar features, the main differences being related to the rated wind speed and the hub height. As for turbine T4 (which is the largest one), this is a two-bladed wind concept that was upscaled from a 13.2 MW version [26].
The expected power output of a wind turbine can be estimated as follows [30]:
P t u r b i n e = c u t i n c u t o u t f ( u ) P ( u ) d u
where f(u)—Weibull density function, P(u)—wind turbine power curve, and cut-in/cut-out—operability limits (see Table 2). The power curve of each turbine is presented in Figure 2, while the Annual Electricity Production (or AEP) can be obtained by multiplying the power output by the average number of hours per year (8760 in this case).
The overall performance of a particular generator can be estimated using the capacity factor index (or Cf), defined as the ratio between the average power output and the rated power of a particular wind turbine, and can be expressed as [30]
C f = P a v e r a g e P n o min a l × 100
where Cf is provided in percentage; Paverage—power output produced over a particular time interval (in MW); Pnominal—rated power output of a particular turbine (indicated in Table 2 and Figure 2).
The Weibull function can be defined as [31]:
f ( u ) = k c u c k 1 exp u c k
where k and c—shape and scale parameters, and u—wind speed. As shown in Table 2, each turbine is defined by a particular hub height, and consequently, the AEP production will be individually adjusted for each wind generator. The initial wind speed (U100) will be translated to the different levels using an approach similar to the one provided in Equation (1), namely
U t u r b i n e = U 100 ln z t u r b i n e z 0 / ln z 100 z 0
where U100 and Uturbine—wind speed at 100 m and at particular hub height, z100 and zturbine—initial and adjusted height (150, 160.2, 168, and 210 m).
From the Weibull distribution, two relevant wind indicators can be derived, namely (a) Vmp—most probable wind speed and (b) VmaxEwind speed carrying maximum energy. The second one is more relevant for the performance of a particular turbine, preferably using a wind generator with a rated wind speed located close to the value indicated by this indicator. They can be defined as [32]
V m p = c 1 1 k 1 / k
V max E = c 1 + 2 k 1 / k
where c and k—Weibull parameters.

3. Results

The Weibull distributions of the ERA5 data are presented in Figure 3 for all the locations considered. As noticed, sites P15, P14, and P5 are defined by lower wind conditions that, in the case of the scale index, do not exceed 8.82 m/s. From this perspective, better performances of a wind turbine can be expected from sites P10 and P11 (Ireland and UK), where a maximum value of 11.7 m/s is associated with the U100 parameter. A significant percentage of the distribution is located above the 3 m/s (cut-in threshold), with values higher than 20 m/s also visible.
In Figure 4, the evolution of the Vmp and VmaxE indicators is highlighted, considering only the ERA5 data. In the case of the Vmp index (Figure 4a), the values start from 4.29 m/s and reach a maximum of 8.38 m/s, being expected in only three sites (P4, P10, and P11) in the category of 8–10 m/s.
VmaxE is a useful indicator in the selection of a particular wind turbine, being directly related to the rated wind speed of a particular generator. In Figure 4b, the spatial distribution of this indicator is presented, from which we can notice lower values for sites P5, P14, and P15. In the case of the ERA5 data, a minimum of 11.40 m/s is noticed. This value is relatively close to the rated wind speed of the wind turbines from Table 2, suggesting that, even for these sites, a wind turbine will perform better.
In Figure 5, the evolution of the Vmp index is presented, considering only the RCP datasets this time. Sites P10 and P11 are gaining attention, being the only ones that exceed 10 m/s; in the case of RCP8.5 distant future, this pattern is valid only for site P10. The wind conditions increase for most sites, a significant percentage associated with the interval of 8–10 m/s compared to sites P5, P6, P7, and P14, which do not exceed 8 m/s. The differences expected between the RCP2.6 (near and distant) values are very small, and more significant variations are expected in the case of RCP8.5, where a maximum difference of 0.3 m/s may be expected.
In Figure 6 and Table 3, a complete picture of the VmaxE indicator is provided. For the RCP data, the minimum oscillates in the range of (12.1–12.4) m/s, a higher value being associated with RCP4.5 near future. For this parameter, better performances are expected in the case of the sites P10 and P11, at which we can add site P2. This scenario is valid for the near future data. In the case of the distant future, some sites disappear from the interval of 17–19 m/s, as expected for the following: P2—RCP 2.6; P2 and P11—RCP4.5; P11—RCP 8.5. In the near future, sites P14 and P15 are expected to show higher classes (13–15 m/s). For the distant future, the same sites are indicated as becoming more energetic than P5, except the RCP8.5 scenario where P14 is the only one that does not exceed 13 m/s.
Most offshore wind turbines are defined by a cut-in value of around 3 m/s [33], this being the case for the generators considered in Table 2. The downtime period (in %) can be associated with the time interval during which a particular wind turbine will not produce electricity (U100 < cut-in value) since this will not be viable from an economical point of view. Such analysis is provided in Figure 7, considering only the RCPs datasets.
In terms of the RCP data, there are very small differences between the near and distant future; for RCP8.5, the distant future data tend to present higher values for most of the sites. Sites P5, P7, and P14 present, in general, higher values that, in the case of RCP2.6, can go from 8.13 to 10.35%. For the same RCP, sites P4, P9, P10, and P11 are associated with better performances, indicating downtime values below 4%. A similar spatial distribution is observed in the case of RCP4.5 and RCP8.5, expecting more visible changes in the case of Portuguese sites, which, for example, can go from 9.59% (RCP4.5) to 10.58% (RCP8.5) in the case of site P14 (distant future).
Another objective of this present work is related to the performance assessment of some offshore wind generators defined by a high capacity power (e.g., 20 MW) that are expected to be included in future marine wind farms. Figure 8 provides a first evaluation by taking into account the wind turbines included in Table 2 and considering only the RCP datasets. From this point of view, we may expect an increase in the turbine performance regardless of the RCP considered. For example, in the case of turbine 1 (Figure 8a), the values go from 51.86% (P7) to a maximum of 76.55% (P10—RCP2.6 near future), expecting significant values (>70%) for sites P3–P4, P9, and P11–P12, respectively. A similar pattern is noticed for the other turbines; turbine 3 will perform better in the case of site P7 (48.44%—RCP8.5 near future) and site P14 (53%—RCP2.6 distant future).
The expected AEP production of turbine 1 (15 MW) is provided in Figure 9 for all the RCP datasets. At this point, we can mention the upper area, where the RCPs indicate, in general, values in the range of (90–100) GWh. Moreover, in some cases, site P10 can be found in the class of 100–110 GWh (e.g., RCP2.6). Site P7 can be associated with the most important values close to the following: 67.04/68.14 GWh—RCP2.6 (near/distant); 68.51/66.70 GWh—RCP4.5; 67.11/67.41 GWh—RCP8.5. In the case of P15 (Portugal south), we can expect a maximum of 86.38 GWh for RCP2.6 (distant future).
A similar analysis is performed in Figure 10 and Figure 11 for turbines T2 and T3 defined by a rated capacity of 20 MW. Although they share a similar nominal power, they are different in terms of the rated wind speed, with turbine T2 reaching better performances at a rated wind speed of 10.7 m/s compared to a value of 11.4 m/s indicated for turbine T3. Nevertheless, turbine T3 operates at a higher hub height (168 m), which means that it has an advantage from this point of view.
In the case of RCPs, more significant outputs are expected from group sites P9, P10, and P11 (up to 133.60 GWh). In some cases, sites P4 and P12 (RCP4.5 near, RCP8.5 near, RCP2.6 distant) are also visible. For turbine T3 (Figure 11), sites P10 and P11 present values in the range of (110–120) GWh for the ERA5 data. This class is dominant in the case of RCP datasets. In total, lower values are expected from T3 than T2, with a maximum value reaching 129.20 GWh in the case of RCP2.6 near future.
A similar analysis is provided in Figure 12 for turbine T4, which, with a rated capacity of 25 MW, can be considered one of the largest generators that can be physically implemented in the near future. As observed, the AEP performances are directly related to the capacity production that expected a maximum output of 158.7 GWh in the case of scenario RCP2.6. In the case of the RCP scenarios, site P14 is indicated as being more important, with maximum values of the following: 112.50 GWh (P14)/103.6 GWh (P7)—RCP2.6; 114.5 GWh/101.10 GWh—RCP 4.5; 113.30 GWh/101.90 GWh.

4. Discussion

The evolution of the European offshore wind sector is directly related to the available maritime area. By also taking into account the Economic Exclusive Zones, we notice that the United Kingdom (UK) and Norway are located in the first places with impressive areas of 114,000 and 88,000 km2 that are suitable for wind energy production. Other relevant areas are related to Denmark/the Netherlands (≈60,000 km2) and Finland (≈60,000 km2), while on the opposite side, we can find some island environments, such as Cyprus, which does not exceed 2000 km2. As for the unrestricted offshore wind potential, values can go up to 5000 TWh in the case of the United Kingdom and gradually decrease to 2500 TWh in the case of Denmark. Compared to other countries, including Finland, France, Germany, Norway, and Sweden, they present more consistent resources that range between 1500 and 3000 TWh [34].
At the end of 2022, the European wind sector was estimated to have an installed capacity of 255 GW, from which 30 GW were located offshore. In the case of EU-27 countries, the offshore wind capacity was estimated to be around 16 GW [35]. By the end of 2022, the UK was the leader for the most grid-connected wind turbines (13,918 MW), followed by Germany (8055 MW), the Netherlands (2829 MW), and Denmark (2308 MW). In addition, there is interest in developing projects in some other European countries, such as Italy (30 MW), Finland (71 MW), Ireland (25 MW), and Spain (5 MW), respectively [35]. The investments related to an offshore wind project are significantly higher than in the case of an onshore one. By looking at the current evolution of the offshore market, there is a tendency to develop projects in deep water areas that involve floating platforms. Significant progress is expected from the UK, Norway, Portugal, China, and Japan, all of which have important markets for floating offshore wind projects. Another possibility to reduce the cost is to consider remote islands (e.g., Bornholm Island, Denmark), where it will be possible to develop onshore projects that will benefit from offshore wind resources. In some other cases, it will be possible to develop power-to-X projects, where a part of the electricity obtained offshore can be used to produce hydrogen as an energy vector [36].
The offshore turbines are gradually increasing their capacity. It was estimated that between 2014 and 2020, the rated power increased more than double, while at this moment, an average capacity of 8 MW is demonstrated. In 2020, the most installed offshore wind turbine was SG 8.0–167 DD (8 to 8.4 MW), followed by the 164–9.5 MW model, which was included in projects, including Moray East, Kincardine, and Triton Knoll. In terms of the water depth, the average value was around 36 m. From the bottom-fixed projects, the Moray East (UK) farm is associated with a 45 m depth. For the floating projects, the water depth can go up to 100 m (or more), this being the case of the Windfloat Atlantic project (Portugal). As for the distance from the shore, the average value is located close to 44 km, with projects at 90 km (e.g., EnBW Albatros, Germany). The offshore European wind market is divided among several major wind turbine manufacturers, such as Siemens Gamesa (68% of the total), Vestas (23.9%), Senvion (4.4%), and Bard (1.5%), respectively [37].
When a wind farm reaches the end of its operational lifetime (15–25 years), it will be necessary to remove the wind turbines via a decommissioning process. If the old capacity is replaced by modern wind generators that increase the existing capacity, this means that the existing project was repowered. In the case of a dismantled wind turbine, a significant part of the materials (~90%) can be recovered, this being the case of towers, generators, cables, or gearboxes, respectively. In order to tackle this aspect, the International Electrotechnical Commission elaborated the TC88 guidance that is designed to be an industry standard [38]. Almost 85% of the mass of a turbine is metallic and, therefore, can be recycled. The main problem is represented by the wind blades made from composite fibers. It is estimated that a single megawatt can lead to 15 tons of waste. Nevertheless, some promising solutions are proposed at this moment, but, more importantly, a new generation of recyclable wind blades that is environmentally friendly will be developed [39].
From a techno-economical point of view, the sites from the north (Baltic Sea) are more interesting since they are defined by lower water depths and moderate wave conditions, being more suitable for the development of fixed wind farm projects. In the case of the Portuguese sites (from the south), due to the higher water depth and the harsh marine conditions, floating wind platforms are recommended, which, in total, will require a much higher initial investment than a fixed project [40].
In this present work, two wind datasets were considered to assess the historical (ERA5 data) and the future wind tendencies (RCPs data). In the first approach, the ERA5 data were used to provide a reference frame, regarding the expected wind dynamics corresponding to the sites considered. At this point, we have to mention that the aim of this present work is not to carry out an evaluation of the accuracy of these datasets, taking into account that we did not quantify the differences between the ERA5 and climate models in order to assess the expected uncertainty. This aspect was already tackled in some other works, so the novelty will not be very high. More information about such analyses can be found in the following: Davy et al. [11], Jung and Schindler [41], Moemken et al. [42], Rusu [10], and Soares et al. [43].
The Vmp and VmaxE indicators are frequently used to assess the wind energy profile from a particular area, this being the case of the coastal waters from China [44], onshore areas from India [45], and other complex areas [46]. Nevertheless, these indicators are obtained from a Weibull distribution, which is one of the simplest distribution functions, mostly not accurate enough to represent the characteristics of the wind regime [47,48].
The combination of the ERA5 and RCP scenarios is frequently used to identify the dynamic of the wind resources. According to Gualtieri [49], the ERA5 wind dataset is suitable for the evaluation of various offshore sites, defined by higher values of the hub heights (e.g., 100 m). In Rusu [10], the wind conditions from the North Sea were taken into account using ERA5 and RCP data, while a similar approach was considered in Srinivas et al. [50], with the Indian offshore region as a target this time. Alvarez and Lorenzo [51] focused on the Mediterranean Sea; by considering the RCP 4.5 and RCP 8.5 scenarios limited to the year 2060, the results obtained were compared with the data from ERA-Interim (the predecessor of ERA5). In Ruiz et al. [52], the same datasets (ERA5, RCP4.5, and 8.5) were used to assess the expected dynamics of the wind resources from the nearshore of the Iberian Peninsula, including the performance of a 9.5 MW wind turbine operating at a 100 m hub height.
The occurrence of the RCP datasets attracted the attention of many researchers, especially those focused on the renewable sector. For example, in the work of Cai and Breon [53], the expected future changes in the onshore and offshore wind energy profile were estimated using the ERA5 data and RCP data (RCP 4.5 and RCP 8.5), which go up to 2050. According to this analysis, the French sites will have smaller variations than those from Germany, which is in line with the present results (P8 compared to P13). In terms of the ERA5 wind resources, we need to mention that this dataset was locally validated against in situ measurements from the North and Irish Seas, concluding that they represent a reliable source of data [13]. This can be considered relevant for this present work, taking into account that some analyzed sites are located in this region (P3, P4, P8, and P9). In the work of Carvalho et al. [54], the future European wind profile was investigated by considering the CMIP (Coupled Model Intercomparison Project) projections. According to these results, we expect a decrease in wind energy near the end of this century for the northern part of Norway (down to 20%) in the case of 4.5 and 8.5 scenarios and an increase in the intra-annual variability near the Iberian Peninsula. This aspect becomes important for the performance of a wind turbine since wind power is associated with the cube of the wind speed, and any change will lead to an increase in the wind power [55].
At this point, we have to highlight that although the RCP dataset are frequently considered by scientists, a new climatological approach, called the Shared Socioeconomic Pathways (SSPs), has been recently developed [14,56]. Nevertheless, the spatial resolution of the current models can be considered to be quite low (e.g., 2.0° × 2.5°, model GISS-E2-1-G), and the release on public space of some high-resolution data will be expected in the near future [57,58]. From this perspective, this remains one of the most used methods to assess the wind energy potential and the expected electricity output of a particular wind generator, as observed in the works of Manwell et al. [59], Akhtar et al. [60], and Salvacao and Soares [61].
The offshore wind market is defined by numerous elements of innovations, including the development of some large wind turbines and the transition from fixed to floating structures. At this moment, almost 90% of the global offshore capacity can be found in the North Sea or in the coastal area of the Atlantic Ocean. This started from a total capacity of 0.1 GW (in 2000) and reached 23 GW in 2018, expecting milestones of 228 and 1000 GW for the years 2030 and 2050, respectively. The turbine output capacity increased from 1.6 MW (year 2000) to 10 MW (present), expecting turbines of 15–20 MW by the year 2030 [62]. In this present work, some large wind turbines were considered for evaluation (e.g., 25 MW), and their selection was considered realistic, taking into account that there are plans to develop such systems in the near future, and future wind data that go up to 2100 are considered.
Several key indexes were evaluated in this work, with the VmaxE indicator among them. As mentioned, a generator will perform much better if the nominal wind speed is close to this value. From the comparison with the ERA5 data, an increase in these values for the RCP scenarios can be expected, with more significant outputs for the reference locations P3, P10, and P11 (up to 17.5 m/s) noticed. For the RCP scenarios, the values start from 12.10 m/s, compared to the ERA5 data where the values are in the range of [11.40–16.4] m/s. By comparing these values with the rated wind speed of the selected wind turbines (from Table 2), we can notice that all of them may represent a suitable choice, regardless of the site taken into account. As the wind turbines increase their capacity, there is a tendency to lower the rated wind speed values, as observed from the comparison with some other turbines rated below 3 and 6.2 MW, defined by nominal wind speeds in the range of 12.5–16 m/s [30]. The combination of the RCP data and the large wind turbines is reflected in the evolution of the capacity factor, being frequently expected values above 60%, with maximum peaks of 77% in the case of the sites from the UK. In general, the capacity factor of the operating offshore wind farms is in the range of [40–50]%, with better performances expected from the UK projects. For example, in 2020, the Hywind Scotland (floating project) was indicated as the most performant one with a value of 57.1%. For the other UK farms, the performances from 2022 are close to the following: 30.80%—Barrow, 45.30%—Dudgeon; Thanet—31.70% or 25%—Triton Knoll [63,64].
At this point, we can mention that there are no wind turbines of 20 to 25 MW available for commercial use. Nevertheless, at this moment, offshore wind turbines in the range of 14–16 MW are being developed, the MySE 16.0–242 model being one of the largest, with a swept area of 46,000 m2 [65]. The V236–15.0 MW system [66] represents another important generator developed by the Vestas company for offshore areas; it is expected to obtain a capacity factor that will exceed 60%. Consequently, there is room for development in the case of the offshore wind sector, i.e., it is possible to design large systems that may involve floating platforms [67].

5. Conclusions

Based on past evidence, it is clear that human evolution is a driving factor for global warming, significantly accelerating this process since 1950. This started with the introduction of the steam engine (in 1712), while in the next decades, a direct correlation was made between the growth rate and the CO2 concentrations that are behind global warming. Without proper environmental solutions, the future does not look bright, taking into account only that the expected population growth rate is estimated at 37 million/year during 2019 and 2100 compared to only 28.4 million/year associated with the past interval from 1800 to 2011 (up to 30%) [68,69]. Several scenarios indicate that global warming between 1.5 and 5° C will lead to multiple climate hazards and chain reactions in the long run (up to 2100), which may result in the following: (a) an increase in the extreme events—in duration and intensity; (b) extinction of 3 to 14% of species; (c) risks on energy and food industry; and (d) violent intrastate conflicts [70].
The European offshore wind market is evolving very fast. This market is expected to expand to the Mediterranean and the Black Seas or to consolidate its position in the northern part of the continent. In general, the perspective regarding the near future is not very optimistic, considering the aspects related to climate change, energy poverty, and global population increase. Nevertheless, if we further discuss the offshore wind sector, we can see that there are areas that can benefit from future changes, such as Portugal or Ireland. In this present work, a more comprehensive picture of the European wind resources was provided for the interval of 1979–2100, with the results structured on historical (ERA5 data), near, and distant future intervals (corresponding to the climate scenarios RCPs 2.6, 4.5, and 8.5). According to these results, an increase in the future wind conditions for most sites was noticed, except those from the Baltic Sea, where a future wind decrease is expected. Better wind resources close to the sites from Ireland and the UK that are facing the North Atlantic coasts are noticed; this area also presents relevant wave conditions for the development of marine energy farms or hybrid wind–wave projects [71,72].
In terms of the wind turbines, the planned offshore wind projects include much larger generators compared to the operational ones. Consequently, this aspect was also discussed in this present work using the power curves of systems that can go up to 25 MW. The expected performance was indicated in terms of annual electricity production and capacity factor, respectively. Since there is a strong correlation between the turbine performance and the local wind resources, for the RCP scenarios, a significant increase in the values that can easily exceed 60% was noticed. As for the AEP production, the RCP projections indicate an increase of 11.8–12.6% depending on the turbine taken into account.
Finally, we must mention that the offshore wind market is continuously evolving, expecting significant changes by 2030 when many of the currently operating wind projects will be decommissioned or eventually repowered by new-generation generators that can easily exceed a nominal capacity of 20 MW.

Author Contributions

E.R.: Conceptualization and supervision, Writing—Review and editing; F.O.: Investigation, Methodology, Formal analysis, and writing original draft. All authors have read and agreed to the published version of the manuscript.

Funding

This work was carried out in the framework of the research project DREAM (dynamics of the resources and technological advance in harvesting marine renewable energy) and supported by the Romanian Executive Agency for Higher Education, Research, Development and Innovation Funding—UEFISCDI, grant number PN-III-P4-ID-PCE-2020-0008.

Institutional Review Board Statement

Not applicable.

Informed Consent Statement

Not applicable.

Acknowledgments

The ERA5 reanalysis is available from C3S Climate Data Store, while the RCP data used in this study were obtained from the EURO-CORDEX data server.

Conflicts of Interest

The authors declare no conflict of interest.

References

  1. Paving the Way for the Paris Agreement: Contributions of SDEWES Science (All Fields)—1—Web of Science Core Collection. Available online: https://0h10q8k9l-y-https-www-webofscience-com.z.e-nformation.ro/wos/woscc/summary/8e917b68-9a0d-47c6-9ba0-f6b553e8aa4a-a03eef31/relevance/1 (accessed on 29 August 2023).
  2. Aszódi, A.; Biró, B.; Adorján, L.; Dobos, Á.C.; Illés, G.; Tóth, N.K.; Zagyi, D.; Zsiborás, Z.T. Comparative Analysis of National Energy Strategies of 19 European Countries in Light of the Green Deal’s Objectives. Energy Convers. Manag. X 2021, 12, 100136. [Google Scholar] [CrossRef]
  3. Joint European Action for More Affordable, Secure Energy. Available online: https://ec.europa.eu/commission/presscorner/detail/en/ip_22_1511 (accessed on 9 March 2022).
  4. Onea, F.; Rusu, E. Sustainability of the Reanalysis Databases in Predicting the Wind and Wave Power along the European Coasts. Sustainability 2018, 10, 193. [Google Scholar] [CrossRef]
  5. Our Energy, Our Future. Available online: https://windeurope.org/about-wind/reports/our-energy-our-future/ (accessed on 8 March 2022).
  6. HJ EU Strategy on Offshore Renewable Energy. Available online: https://ec.europa.eu/energy/topics/renewable-energy/eu-strategy-offshore-renewable-energy_en (accessed on 5 April 2021).
  7. Schütt, M.; Anstock, F.; Schorbach, V. Progressive Structural Scaling of a 20 MW Two-Bladed Offshore Wind Turbine Rotor Blade Examined by Finite Element Analyses. J. Phys. Conf. Ser. 2020, 1618, 052017. [Google Scholar] [CrossRef]
  8. Global Wind Energy Council. Global Offshore Wind Report 2021. 2021. Available online: https://gwec.net/global-wind-report-2021/ (accessed on 10 August 2023).
  9. Moss, R.H.; Edmonds, J.A.; Hibbard, K.A.; Manning, M.R.; Rose, S.K.; van Vuuren, D.P.; Carter, T.R.; Emori, S.; Kainuma, M.; Kram, T.; et al. The next Generation of Scenarios for Climate Change Research and Assessment. Nature 2010, 463, 747–756. [Google Scholar] [CrossRef] [PubMed]
  10. Rusu, E. Assessment of the Wind Power Dynamics in the North Sea under Climate Change Conditions. Renew. Energy 2022, 195, 466–475. [Google Scholar] [CrossRef]
  11. Davy, R.; Gnatiuk, N.; Pettersson, L.; Bobylev, L. Climate Change Impacts on Wind Energy Potential in the European Domain with a Focus on the Black Sea. Renew. Sustain. Energy Rev. 2018, 81, 1652–1659. [Google Scholar] [CrossRef]
  12. Islek, F.; Yuksel, Y. Evaluation of Future Wind Power Potential and Their Projected Changes in the Black Sea and Possible Stable Locations for Wind Farms. Ocean Eng. 2022, 266, 112832. [Google Scholar] [CrossRef]
  13. Susini, S.; Menendez, M.; Eguia, P.; Blanco, J.M. Climate Change Impact on the Offshore Wind Energy Over the North Sea and the Irish Sea. Front. Energy Res. 2022, 10, 881146. [Google Scholar] [CrossRef]
  14. Martinez, A.; Iglesias, G. Wind Resource Evolution in Europe under Different Scenarios of Climate Change Characterised by the Novel Shared Socioeconomic Pathways. Energy Convers. Manag. 2021, 234, 113961. [Google Scholar] [CrossRef]
  15. EU-SCORES. Available online: https://euscores.eu/ (accessed on 29 August 2023).
  16. Datawrapper. Available online: https://datawrapper.dwcdn.net/YWQJR/1/ (accessed on 29 August 2023).
  17. Projects: WindFloat 1—Principle Power, Inc. Available online: https://www.principlepower.com/projects/windfloat1 (accessed on 29 August 2023).
  18. Kalogeri, C.; Galanis, G.; Spyrou, C.; Diamantis, D.; Baladima, F.; Koukoula, M.; Kallos, G. Assessing the European Offshore Wind and Wave Energy Resource for Combined Exploitation. Renew. Energy 2017, 101, 244–264. [Google Scholar] [CrossRef]
  19. Global Offshore Renewable Map. 4C Offshore. Available online: https://map.4coffshore.com/offshorewind/ (accessed on 1 March 2022).
  20. Google Earth. Available online: https://earth.google.com/web/ (accessed on 1 March 2022).
  21. Guillory, A. ERA5. Available online: https://www.ecmwf.int/en/forecasts/datasets/reanalysis-datasets/era5 (accessed on 31 May 2019).
  22. Hasager, C.; Stein, D.; Courtney, M.; Peña, A.; Mikkelsen, T.; Stickland, M.; Oldroyd, A. Hub Height Ocean Winds over the North Sea Observed by the NORSEWInD Lidar Array: Measuring Techniques, Quality Control and Data Management. Remote Sens. 2013, 5, 4280–4303. [Google Scholar] [CrossRef]
  23. Rossby Centre Regional Atmospheric Model, RCA4. SMHI. Available online: https://www.smhi.se/en/research/research-departments/climate-research-at-the-rossby-centre/rossby-centre-regional-atmospheric-model-rca4-1.16562 (accessed on 29 August 2023).
  24. Fifth Assessment Report—IPCC. Available online: https://www.ipcc.ch/assessment-report/ar5/ (accessed on 29 August 2023).
  25. Bilgili, M.; Alphan, H. Global Growth in Offshore Wind Turbine Technology. Clean Techn Env. Policy 2022, 24, 2215–2227. [Google Scholar] [CrossRef]
  26. Qin, C.; Loth, E.; Zalkind, D.S.; Pao, L.Y.; Yao, S.; Griffith, D.T.; Selig, M.S.; Damiani, R. Downwind Coning Concept Rotor for a 25 MW Offshore Wind Turbine. Renew. Energy 2020, 156, 314–327. [Google Scholar] [CrossRef]
  27. Gaertner, E.; Rinker, J.; Sethuraman, L.; Zahle, F.; Anderson, B.; Barter, G.; Abbas, N.; Meng, F.; Bortolotti, P.; Skrzypinski, W.; et al. IEA Wind TCP Task 37: Definition of the IEA 15-Megawatt Offshore Reference Wind Turbine; NREL/TP-5000-75698, 1603478; National Renewable Energy Lab (NREL): Golden, CO, USA, 2020. [Google Scholar]
  28. Ashuri, T.; Martins, J.R.R.A.; Zaaijer, M.B.; van Kuik, G.A.M.; van Bussel, G.J.W. Aeroservoelastic Design Definition of a 20 MW Common Research Wind Turbine Model: A 20 MW Common Research Wind Turbine Model. Wind Energ. 2016, 19, 2071–2087. [Google Scholar] [CrossRef]
  29. Sartori, L.; Bellini, F.; Croce, A.; Bottasso, C. Preliminary Design and Optimization of a 20MW Reference Wind Turbine. J. Phys. Conf. Ser. 2018, 1037, 042003. [Google Scholar] [CrossRef]
  30. Rusu, E.; Onea, F. A Parallel Evaluation of the Wind and Wave Energy Resources along the Latin American and European Coastal Environments. Renew. Energy 2019, 143, 1594–1607. [Google Scholar] [CrossRef]
  31. Al-Nassar, W.K.; Neelamani, S.; Al-Salem, K.A.; Al-Dashti, H.A. Feasibility of Offshore Wind Energy as an Alternative Source for the State of Kuwait. Energy 2019, 169, 783–796. [Google Scholar] [CrossRef]
  32. Shu, Z.R.; Jesson, M. Estimation of Weibull Parameters for Wind Energy Analysis across the UK. J. Renew. Sustain. Energy 2021, 13, 023303. [Google Scholar] [CrossRef]
  33. Wang, F.; Tong, S.; Sun, Y.; Xie, Y.; Zhen, Z.; Li, G.; Cao, C.; Duić, N.; Liu, D. Wind Process Pattern Forecasting Based Ultra-Short-Term Wind Speed Hybrid Prediction. Energy 2022, 255, 124509. [Google Scholar] [CrossRef]
  34. Europe’s Onshore and Offshore Wind Energy Potential—European Environment Agency. Available online: https://www.eea.europa.eu/publications/europes-onshore-and-offshore-wind-energy-potential (accessed on 8 October 2023).
  35. Wind Energy in Europe: 2022 Statistics and the Outlook for 2023–2027. WindEurope. Available online: https://windeurope.org/intelligence-platform/product/wind-energy-in-europe-2022-statistics-and-the-outlook-for-2023-2027/ (accessed on 8 October 2023).
  36. GWECs Global Offshore Wind Report 2023—Global Wind Energy Council. Available online: https://gwec.net/gwecs-global-offshore-wind-report-2023/ (accessed on 8 October 2023).
  37. Offshore Wind in Europe—Key Trends and Statistics 2020. Available online: https://windeurope.org/data-and-analysis/product/offshore-wind-in-europe-key-trends-and-statistics-2020 (accessed on 11 March 2021).
  38. What Happens When Wind Turbines Get Old? New Industry Guidance Document for Dismantling and Decommissioning. WindEurope. Available online: https://windeurope.org/newsroom/press-releases/what-happens-when-wind-turbines-get-old-new-industry-guidance-document-for-dismantling-and-decommissioning/ (accessed on 8 October 2023).
  39. Leon, M., Jr. Recycling of Wind Turbine Blades: Recent Developments. Curr. Opin. Green Sustain. Chem. 2023, 39, 100746. [Google Scholar] [CrossRef]
  40. Guo, Y.; Wang, H.; Lian, J. Review of Integrated Installation Technologies for Offshore Wind Turbines: Current Progress and Future Development Trends. Energy Convers. Manag. 2022, 255, 115319. [Google Scholar] [CrossRef]
  41. Jung, C.; Schindler, D. A Review of Recent Studies on Wind Resource Projections under Climate Change. Renew. Sustain. Energy Rev. 2022, 165, 112596. [Google Scholar] [CrossRef]
  42. Moemken, J.; Reyers, M.; Feldmann, H.; Pinto, J.G. Future Changes of Wind Speed and Wind Energy Potentials in EURO-CORDEX Ensemble Simulations. J. Geophys. Res. Atmos. 2018, 123, 6373–6389. [Google Scholar] [CrossRef]
  43. Soares, P.M.M.; Lima, D.C.A.; Cardoso, R.M.; Nascimento, M.L.; Semedo, A. Western Iberian Offshore Wind Resources: More or Less in a Global Warming Climate? Appl. Energy 2017, 203, 72–90. [Google Scholar] [CrossRef]
  44. Yu, J.; Fu, Y.; Yu, Y.; Wu, S.; Wu, Y.; You, M.; Guo, S.; Li, M. Assessment of Offshore Wind Characteristics and Wind Energy Potential in Bohai Bay, China. Energies 2019, 12, 2879. [Google Scholar] [CrossRef]
  45. Rehman, S.; Natarajan, N.; Vasudevan, M.; Alhems, L.M. Assessment of Wind Energy Potential across Varying Topographical Features of Tamil Nadu, India. Energy Explor. Exploit. 2020, 38, 175–200. [Google Scholar] [CrossRef]
  46. Gul, M.; Tai, N.; Huang, W.; Nadeem, M.; Yu, M. Assessment of Wind Power Potential and Economic Analysis at Hyderabad in Pakistan: Powering to Local Communities Using Wind Power. Sustainability 2019, 11, 1391. [Google Scholar] [CrossRef]
  47. Wais, P. Two and Three-Parameter Weibull Distribution in Available Wind Power Analysis. Renew. Energy 2017, 103, 15–29. [Google Scholar] [CrossRef]
  48. Bingöl, F. Comparison of Weibull Estimation Methods for Diverse Winds. Adv. Meteorol. 2020, 2020, 3638423. [Google Scholar] [CrossRef]
  49. Gualtieri, G. Reliability of ERA5 Reanalysis Data for Wind Resource Assessment: A Comparison against Tall Towers. Energies 2021, 14, 4169. [Google Scholar] [CrossRef]
  50. Srinivas, B.A.; Nagababu, G.; Kachhwaha, S.S. Future Wind Speed Trends in the Indian Offshore Region. Energy Rep. 2022, 8, 513–519. [Google Scholar] [CrossRef]
  51. Alvarez, I.; Lorenzo, M.N. Changes in Offshore Wind Power Potential over the Mediterranean Sea Using CORDEX Projections. Reg Env. Change 2019, 19, 79–88. [Google Scholar] [CrossRef]
  52. Ruiz, A.; Onea, F.; Rusu, E. Study Concerning the Expected Dynamics of the Wind Energy Resources in the Iberian Nearshore. Energies 2020, 13, 4832. [Google Scholar] [CrossRef]
  53. Cai, Y.; Bréon, F.-M. Wind Power Potential and Intermittency Issues in the Context of Climate Change. Energy Convers. Manag. 2021, 240, 114276. [Google Scholar] [CrossRef]
  54. Carvalho, D.; Rocha, A.; Costoya, X.; de Castro, M.; Gómez-Gesteira, M. Wind Energy Resource over Europe under CMIP6 Future Climate Projections: What Changes from CMIP5 to CMIP6. Renew. Sustain. Energy Rev. 2021, 151, 111594. [Google Scholar] [CrossRef]
  55. de Souza Nascimento, M.M.; Shadman, M.; Silva, C.; de Freitas Assad, L.P.; Estefen, S.F.; Landau, L. Offshore Wind and Solar Complementarity in Brazil: A Theoretical and Technical Potential Assessment. Energy Convers. Manag. 2022, 270, 116194. [Google Scholar] [CrossRef]
  56. Martinez, A.; Murphy, L.; Iglesias, G. Evolution of Offshore Wind Resources in Northern Europe under Climate Change. Energy 2023, 269, 126655. [Google Scholar] [CrossRef]
  57. Moradian, S.; Akbari, M.; Iglesias, G. Optimized Hybrid Ensemble Technique for CMIP6 Wind Data Projections under Different Climate-Change Scenarios. Case Study: United Kingdom. Sci. Total Environ. 2022, 826, 154124. [Google Scholar] [CrossRef]
  58. Zhang, Y.; Cheng, C.; Yang, T.; Jin, X.; Jia, Z.; Shen, J.; Wu, X. Assessment of Climate Change Impacts on the Hydro-Wind-Solar Energy Supply System. Renew. Sustain. Energy Rev. 2022, 162, 112480. [Google Scholar] [CrossRef]
  59. Manwell, J.F.; McGowan, J.G.; Rogers, A.L. Wind Energy Explained: Theory, Design and Application; John Wiley & Sons: Hoboken, NJ, USA, 2010. [Google Scholar]
  60. Akhtar, N.; Geyer, B.; Rockel, B.; Sommer, P.S.; Schrum, C. Accelerating Deployment of Offshore Wind Energy Alter Wind Climate and Reduce Future Power Generation Potentials. Sci Rep 2021, 11, 11826. [Google Scholar] [CrossRef] [PubMed]
  61. Salvacao, N.; Guedes Soares, C. Wind Resource Assessment Offshore the Atlantic Iberian Coast with the WRF Model. Energy 2018, 145, 276–287. [Google Scholar] [CrossRef]
  62. Timmer, E. (WORLD) IRENA—Future of Wind: Deployment, Investment, Technology, Grid Integration and Socio-Economic Aspects (2019–10); HHWE: Almelo, The Netherlands, 2023. [Google Scholar]
  63. Offshore Wind Outlook 2019—Analysis. Available online: https://www.iea.org/reports/offshore-wind-outlook-2019 (accessed on 2 February 2023).
  64. UK Offshore Wind Capacity Factors—Energy Numbers. Available online: https://energynumbers.info/uk-offshore-wind-capacity-factors (accessed on 2 February 2023).
  65. Mingyang Smart Energy. Available online: http://www.myse.com.cn/en/jtxw/info.aspx?itemid=825 (accessed on 4 September 2023).
  66. V236-15.0 MWTM. Available online: https://www.vestas.com/en/products/offshore/V236-15MW (accessed on 4 September 2023).
  67. Edwards, E.C.; Holcombe, A.; Brown, S.; Ransley, E.; Hann, M.; Greaves, D. Evolution of Floating Offshore Wind Platforms: A Review of at-Sea Devices. Renew. Sustain. Energy Rev. 2023, 183, 113416. [Google Scholar] [CrossRef]
  68. UNFCCC. Available online: https://unfccc.int/ (accessed on 7 March 2022).
  69. Ritchie, H.; Rodés-Guirao, L.; Mathieu, E.; Gerber, M.; Ortiz-Ospina, E.; Hasell, J.; Roser, M. Population Growth. Our World Data 2023. Available online: https://ourworldindata.org/population-growth (accessed on 10 August 2023).
  70. Climate Change 2022: Impacts, Adaptation and Vulnerability. Available online: https://www.ipcc.ch/report/ar6/wg2/ (accessed on 7 March 2022).
  71. Perez-Collazo, C.; Greaves, D.; Iglesias, G. A Review of Combined Wave and Offshore Wind Energy. Renew. Sust. Energ. Rev. 2015, 42, 141–153. [Google Scholar] [CrossRef]
  72. Hosseinzadeh, S.; Etemad-Shahidi, A.; Stewart, R.A. Site Selection of Combined Offshore Wind and Wave Energy Farms: A Systematic Review. Energies 2023, 16, 2074. [Google Scholar] [CrossRef]
Figure 1. Location of the reference sites, including the joint distribution of the wind and wave resources (figure adjusted by the authors according to the info provided in [18]).
Jmse 11 01967 g001
Figure 2. Power curves of the offshore wind generators rated between 15 and 25 MW (according to the information provided in Table 2).
Jmse 11 01967 g002
Figure 3. Weibull distribution of the ERA5 wind data (January 1979–December 2020). The wind resources are reported at 100 m height above the sea level, including the values of the key indicators (the scale and shape factors).
Jmse 11 01967 g003
Figure 4. Spatial distribution of the ERA5 wind data (U100) presented in terms of bubble maps: (a) Vmp index; (b) VmaxE index.
Jmse 11 01967 g004
Figure 5. RCPs—spatial distribution of the Vmp indicator (average values in m/s) presented in terms of bubble maps: (ac) near future wind; (df) distant future wind.
Jmse 11 01967 g005
Figure 6. RCPs—spatial distribution of the VmaxE indicator (average values in m/s) presented in terms of bubble maps: (ac) near future wind; (df) distant future wind.
Jmse 11 01967 g006
Figure 7. Distribution of the downtime periods (U100 < 3 m/s) specific to a wind turbine: (a) RCP2.6; (b) RCP4.5; (c) RCP8.5.
Jmse 11 01967 g007
Figure 8. The capacity factor values based on the RCP wind datasets: (a) turbine 1; (b) turbine 2; (c) turbine 3; (d) turbine 4.
Jmse 11 01967 g008
Figure 9. RCPs—theoretical AEP (in GWh) computed for turbine 1: (ac) near future wind; (df) distant future wind.
Jmse 11 01967 g009
Figure 10. RCPs—theoretical AEP (in GWh) computed for turbine 2: (ac) near future wind; (df) distant future wind.
Jmse 11 01967 g010
Figure 11. RCPs—theoretical AEP (in GWh) computed for turbine 3: (ac) near future wind; (df) distant future wind.
Jmse 11 01967 g011
Figure 12. RCPs—theoretical AEP (in GWh) computed for turbine 4: (ac) near future wind; (df) distant future wind.
Jmse 11 01967 g012
Table 1. The main features of the offshore wind farms and maritime sites located in the vicinity of the reference sites selected. Data processed from [19,20].
IDProjectStatusLatitude
(°)
Longitude
(°)
Distance to Shore (km)Water Depth (m)
P1Bindal (NOR)-65.1710.712083
P2Havsul 1 (NOR)**62.825.4940102
P3Utsira Nord (DEN)***59.273.6295237
P4Jutland (DEN)***55.566.927830
P5Suurhiekka (FIN)***65.2824.362617
P6Eystrasalt (SWE)***61.8518.977736
P7Bornholm (DEN)*54.9714.82713
P8Borselle 1 and 2 (NL)*51.682.7884918
P9Beatrice (UK)*58.25−2.503756
P10Sectoral marine plan—N3 (SCT)***58.89−7.0261175
P11AMETS (IRL)**54.30−10.3014111
P12Emerald (UK)***51.35−8.004691
P13Saint-Nazaire (FRA)**47.15−4.0080111
P14WindFloat1 (POR)*41.68−8.94545
P15Lisbon (POR)-38.81−9.653592
Status: * Operational; ** Under construction/authorized; *** Concept/Early planning.
Table 2. Key parameters of the offshore wind turbines considered.
ParameterWind Generator
T1T2T3T4
Power rating (MW)15202025
Cut-in wind speed (m/s)333 *4
Rated wind speed (m/s)10.5910.711.411.3
Cut-out wind speed (m/s)252525 *24
Hub height (m)150160.2168210
Rotor radius (m)120135126172.75
Rotor orientationUpwind-UpwindDownwind
Reference[27][28][29][26]
* assumed value.
Table 3. VmaxE parameter—descending sorting of the sites (from maximum to minimum).
DatasetSites
RCP2.6 nearP2P10P11P3P1P12P9P4P8P13P6P15P5P14P7
RCP2.6 distantP10P11P2P3P12P1P9P4P8P13P6P15P14P5P7
RCP4.5 nearP10P11P2P3P1P12P9P4P8P13P6P15P14P5P7
RCP4.5 distantP10P2P11P3P12P1P9P4P8P13P6P15P14P5P7
RCP8.5 nearP10P11P2P3P12P1P9P4P8P13P6P15P14P5P7
RCP8.5 nearP10P2P11P3P1P12P9P4P8P13P6P15P5P14P7
Disclaimer/Publisher’s Note: The statements, opinions and data contained in all publications are solely those of the individual author(s) and contributor(s) and not of MDPI and/or the editor(s). MDPI and/or the editor(s) disclaim responsibility for any injury to people or property resulting from any ideas, methods, instructions or products referred to in the content.

