Article

Modeling and Implementation of Probability-Based Underwater Docking Assessment Index

1
Department of Control and Instrumentation Engineering, Korea Maritime & Ocean University, Busan 49112, Republic of Korea
2
Department of Ocean Advanced Materials Convergence Engineering, Korea Maritime & Ocean University, Busan 49112, Republic of Korea
3
Department of Mechanical Engineering, Korea Maritime & Ocean University, Busan 49112, Republic of Korea
4
Division of Artificial Intelligence Engineering, Korea Maritime & Ocean University, Busan 49112, Republic of Korea
*
Author to whom correspondence should be addressed.
J. Mar. Sci. Eng. 2023, 11(11), 2127; https://doi.org/10.3390/jmse11112127
Submission received: 11 August 2023 / Revised: 22 September 2023 / Accepted: 4 November 2023 / Published: 8 November 2023
(This article belongs to the Special Issue Advances in Marine Vehicles, Automation and Robotics)

Abstract

:
The goal of underwater docking is to safely insert an autonomous underwater vehicle (AUV) into the docking sleeve of a docking station (DS). However, AUVs frequently experience disturbances in their operating environment under motional constraints owing to their shapes, which can significantly impede successful docking missions. Therefore, it is essential to develop an assessment method and corresponding index representing feasibility. In this study, we suggest a new assessment method and a probability-based assessment index to assess the underwater docking process, considering aforementioned motional constraints. The assessment is made for both the position and heading angle of the AUV, with the results presented in probabilistic figures. These figures are used to estimate the assessment index, which represents the probability of successful docking. The final decision on whether to dock or not can be made based on this index. When the index exceeds a predefined threshold, it indicates that the current docking process is reliable, and the docking will be successful. The suggested assessment method and the index were validated through tests conducted in various underwater environments. The results show that the probability-based index estimated through the proposed method can be grounds for successful docking.

1. Introduction

Autonomous underwater vehicles (AUVs) are used for various purposes in a wide range of fields, as they are able to carry out missions in environments that are challenging for humans to access. Furthermore, ongoing efforts are being made to enhance the efficiency and performance of AUVs. Meanwhile, the operational duration of AUVs is directly related to the capacity of the built-in battery. In the event that the remaining power level falls below a specific threshold, it becomes imperative for AUVs to be retrieved or returned. Subsequently, upon recharging the battery and transferring data, AUVs are redeployed to their mission sites. Recently, the incorporation of docking stations (DSs) into this sequence has facilitated prolonged AUV missions.
To achieve successful underwater docking of an AUV, it is essential to establish a clear and secure path from the mission area to the DS. Since state compensation through wireless communication or global positioning systems is limited during underwater navigation, correcting errors in the navigation system becomes necessary. In addition, environmental disturbances such as ocean currents may cause the AUV to deviate from its path, requiring a disturbance-adaptive controller. Therefore, the development of various sophisticated underwater docking technologies is crucial, and numerous studies have been conducted in this area [1,2].
To ensure that the AUV can reach the DS efficiently, several methods for generating optimal paths by solving mathematical problems have been proposed [3,4]. Furthermore, a geometrical approach that models obstacles as enclosed polygonal shapes with additional buffers and generates an optimal path has been proposed [5]. A path-planning method based on experimental analysis of an AUV’s turning radius according to rudder angle has also been proposed [6,7].
Navigation systems have been enhanced with docking guidance sensors to increase the accuracy during the docking process [8]. Acoustic sensors, including short baseline (SBL) and ultra-short baseline (USBL), and vision sensors, including cameras, are commonly used as docking guidance sensors. Acoustic sensors are employed to recognize the AUV’s states relative to the docking path or the DS and to compensate for discrepancies [9]. Meanwhile, vision sensors aid the AUV in aligning with respect to the DS by detecting markers around its entrance and extracting the center position [10]. In certain cases, multiple guidance sensors are simultaneously employed [11]. Furthermore, certain sensors that imitate the passive electro-location ability of underwater organisms have been developed and applied [12].
Several studies have also been conducted to overcome the influence of ocean cur-rents during docking processes. To mitigate the impact of ocean currents during the docking process, studies have developed methods that estimate AUVs’ direction and speed and adjust the heading angle accordingly [13,14,15,16]. Other techniques, such as leveraging hydrodynamic interactions [17], inducing the AUV to the center of the DS using a vector field [18,19], and reachability-based control [20,21], are also under investigation.
However, due to various uncertainties present while navigating underwater, it is difficult to completely prevent the AUV from failing to dock or even colliding with the DS [22]. Therefore, it is crucial to assess the docking process to ensure safe and successful docking [23,24]. Despite its significance, the number of studies specifically dedicated to assessing the docking process remains relatively small. This study proposes a method to assess the underwater docking process for an underactuated torpedo-type AUV into a funnel-shaped DS. Additionally, a probability-based index is proposed to quantify the results. The validity of the proposed method and index is confirmed by analyzing experimental results obtained in various environments.
The structure of this paper is as follows: In Section 2, an area for assessing the underwater docking process of an AUV, considering its operational limitations, is defined. Moreover, the assessment method for the underwater docking process and the derivation of the probability-based index, which indicates the feasibility of docking, are explained. In Section 3, results of tests performed in various environments are analyzed, and the validity and effectiveness of the proposed assessment method and index are verified. Finally, Section 4 presents the conclusions.

2. Underwater Docking Assessment Design

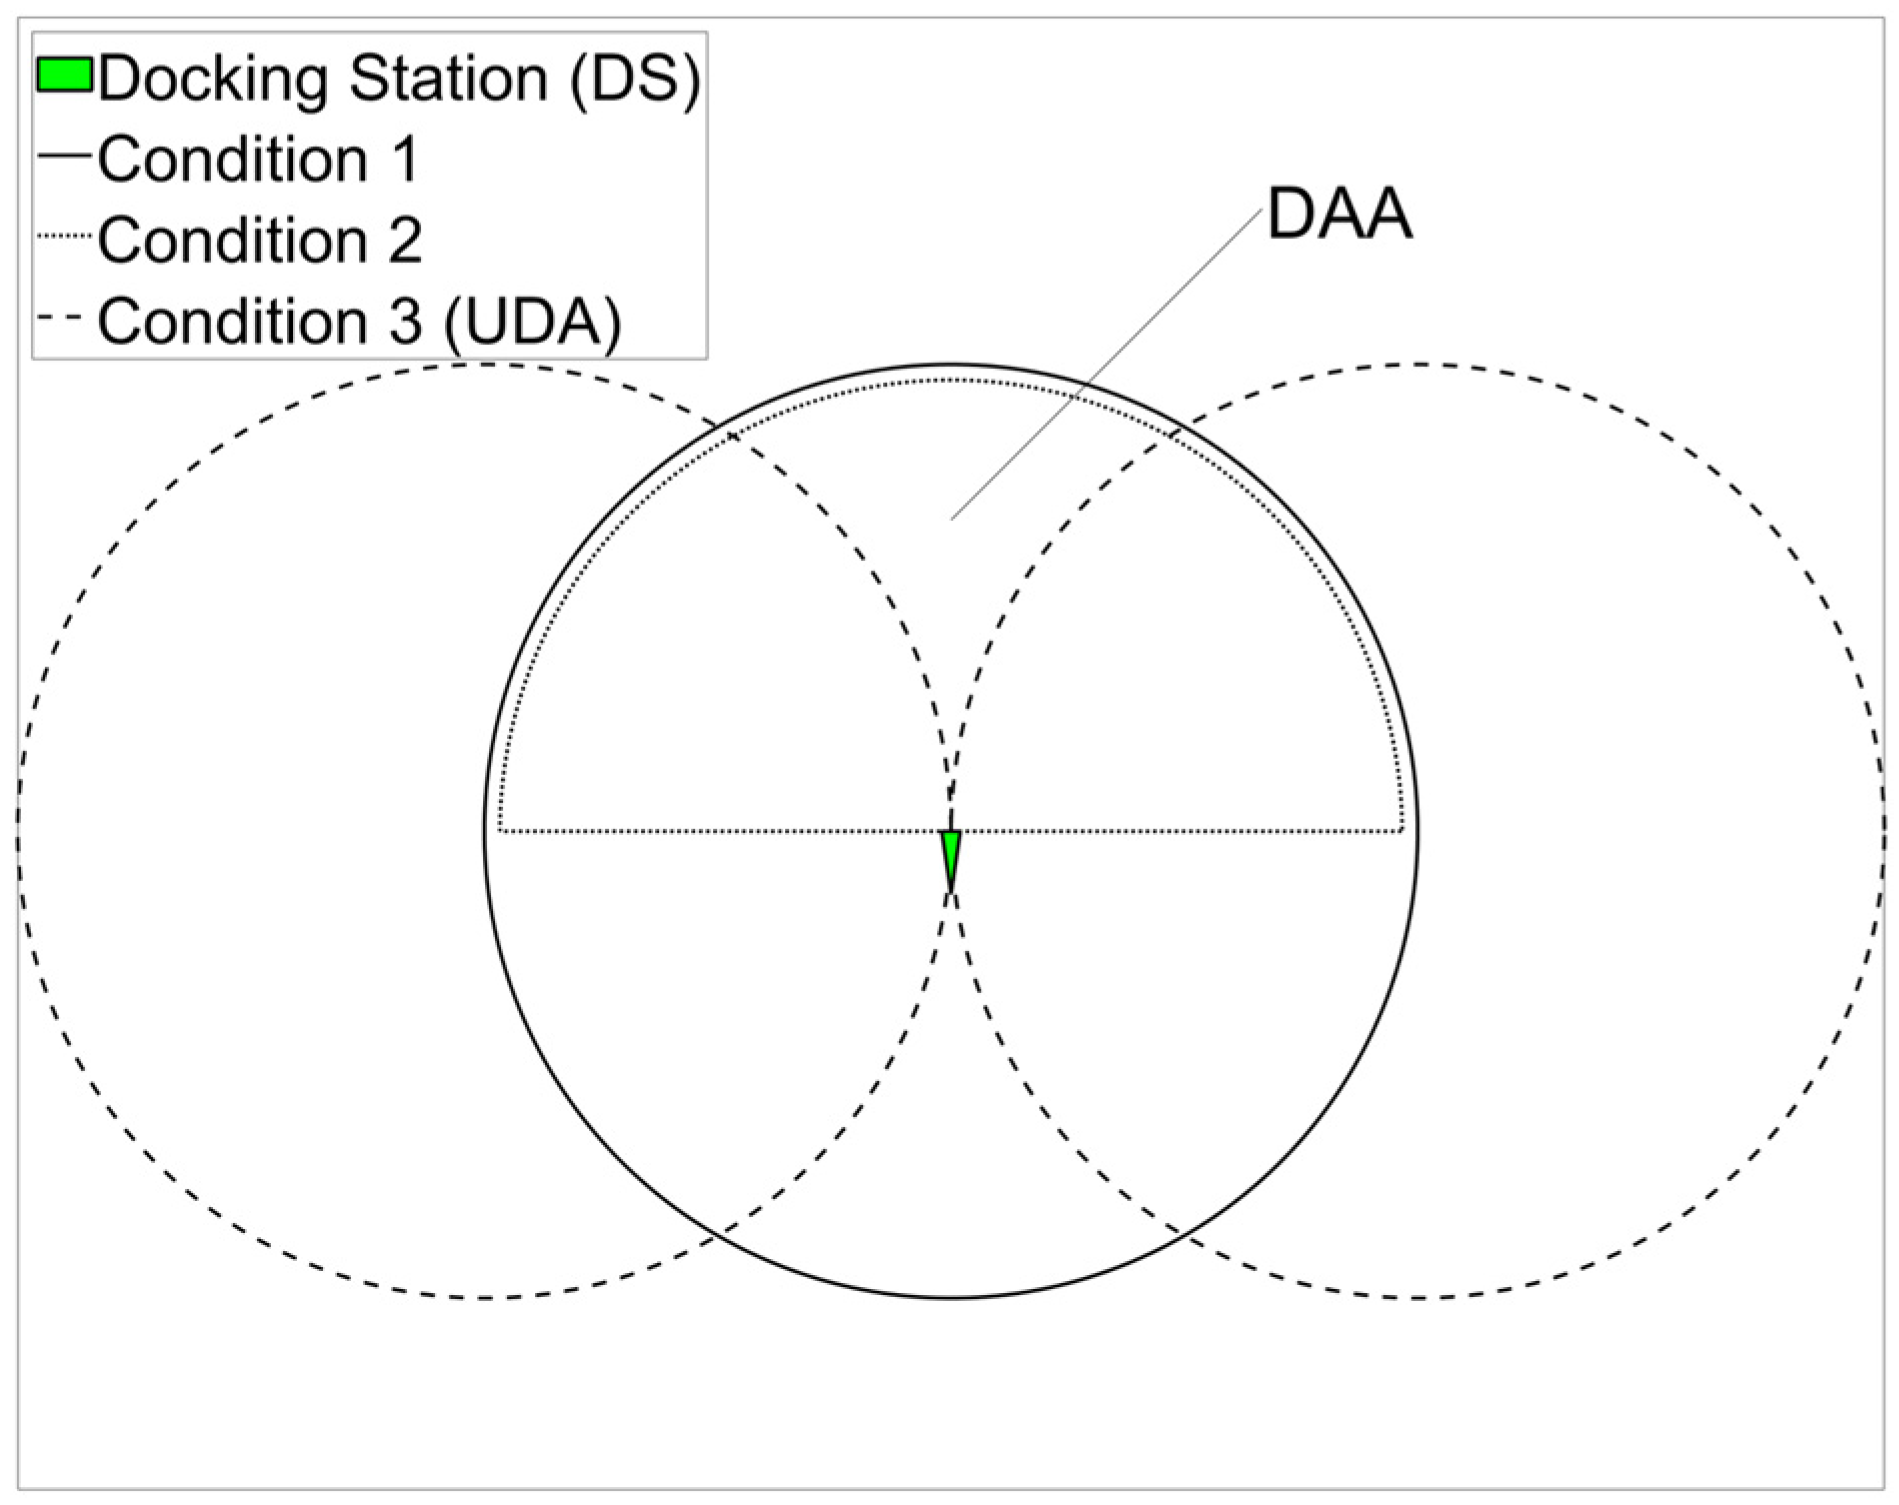
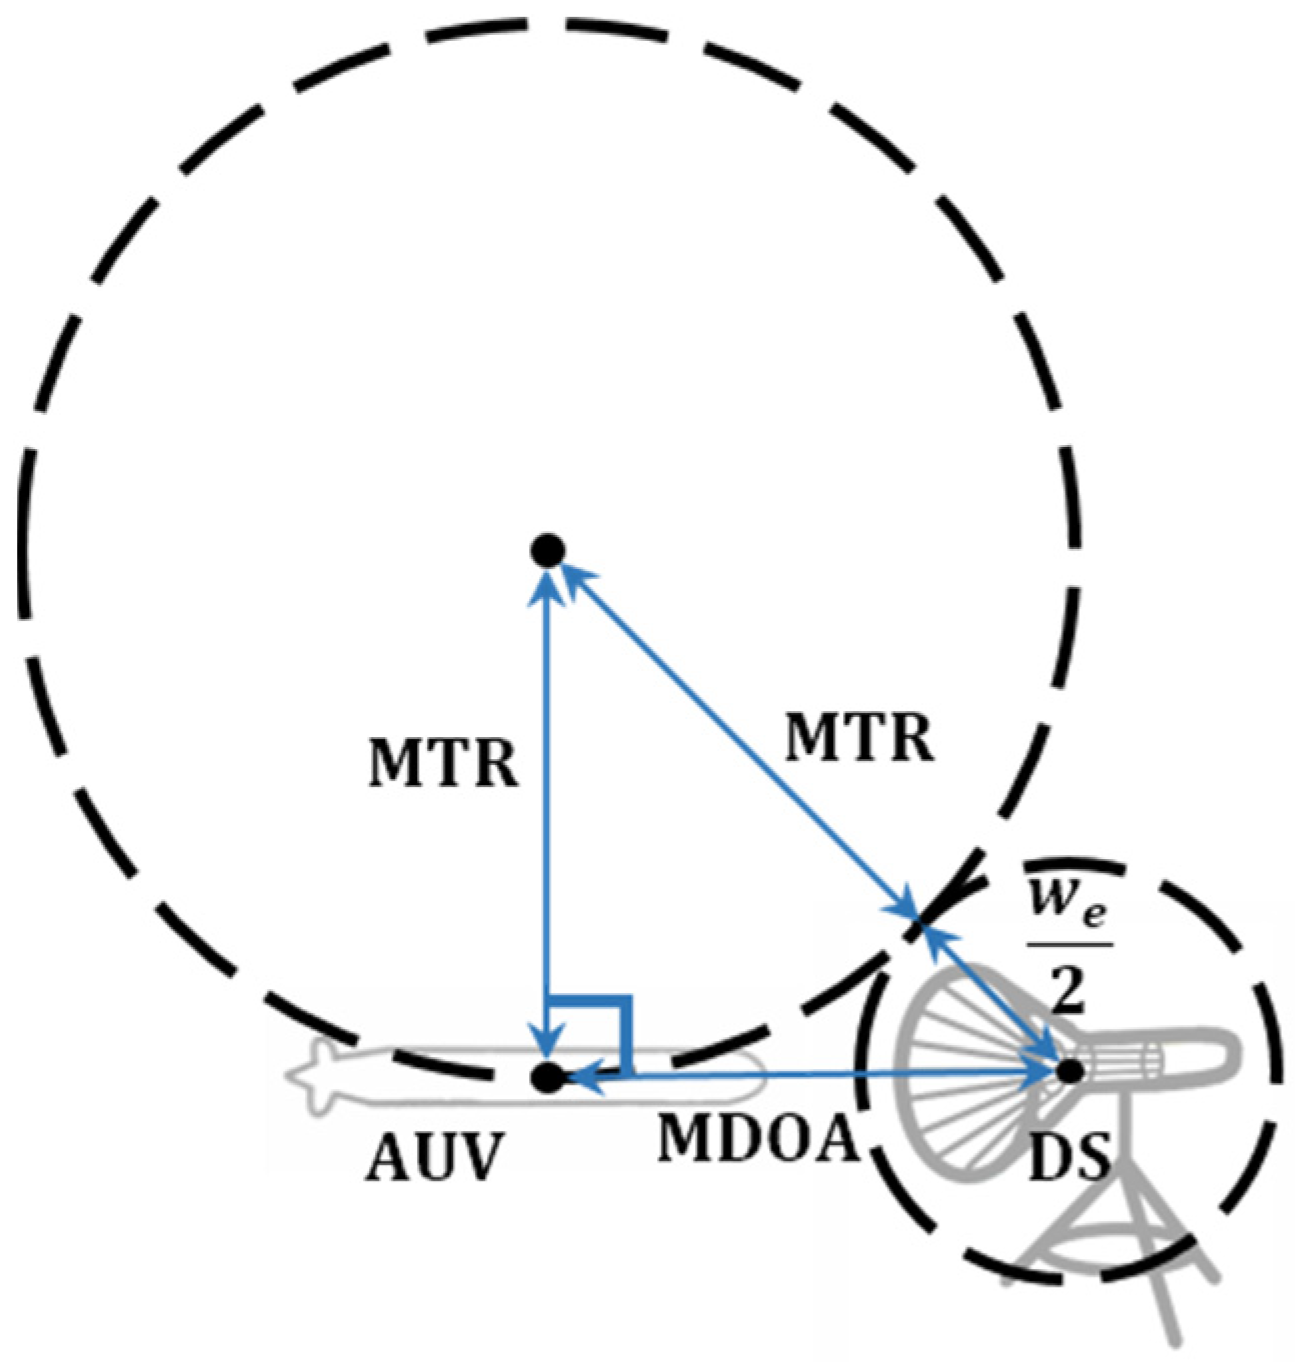
2.1. Docking Assessment Area

A simple but new method for assessing the underwater docking process is proposed. It is applicable when AUVs are within a specific docking assessment area (DAA) and approaching a DS based on a planned path. It is assumed that the AUV enters the DAA at the same depth as the DS and maintains a constant velocity. Here, a successful docking is defined as the AUV reaching the same state as the DS. To ensure successful docking, the DAA must meet several geometric conditions within the docking environment, which are outlined below.
Firstly, the DAA occupies the part of a circle centered on the position of the DS (Condition 1). This means that the assessment is started when the AUV reaches a predefined radial distance from the DS. If guidance sensors are utilized, the radius of the circle can be set to the operating range of a sensor. This allows an efficient process with minimal memory and workload, as the assessment can be conducted from a known point. In the absence of docking guidance sensors, the distance can be selected arbitrarily. Secondly, the DAA does not include the rear of the DS entrance (Condition 2). Even if the AUV has to approach from the rear of the DS due to geographical features, it will eventually need to align to the DS by moving to the front. Therefore, the rear of the DS entrance is not considered in the DAA. Finally, the DAA does not include an undockable area (UDA) (Condition 3). When the AUV attempts to dock from the side of the DS, it needs to make a horizontal turn. If the DS is positioned on the minimum-turning-radius path (MTRP) of the AUV and the distance between the AUV and the DS is equal to the diameter of the MTRP, the AUV will succeed in docking by turning only, as illustrated in Figure 1. Here, the MTRPs (MTRPDSL and MTRPDSR) are circular paths that appear when the AUV maintains its maximum rate of turning at a constant speed, and the radius of the MTRP is the minimum turning radius (MTR). They represent the boundaries of the area from which the AUV can reach the DS by turning left and right. However, if the AUV is positioned inside the MTRP, there are no feasible paths for docking. Therefore, their interiors are UDAs (UDAL and UDAR) and are not included in the DAA. Figure 2 displays a DAA that satisfies all three conditions, with a docking guidance sensor having the same operating range as the MTR of the AUV.

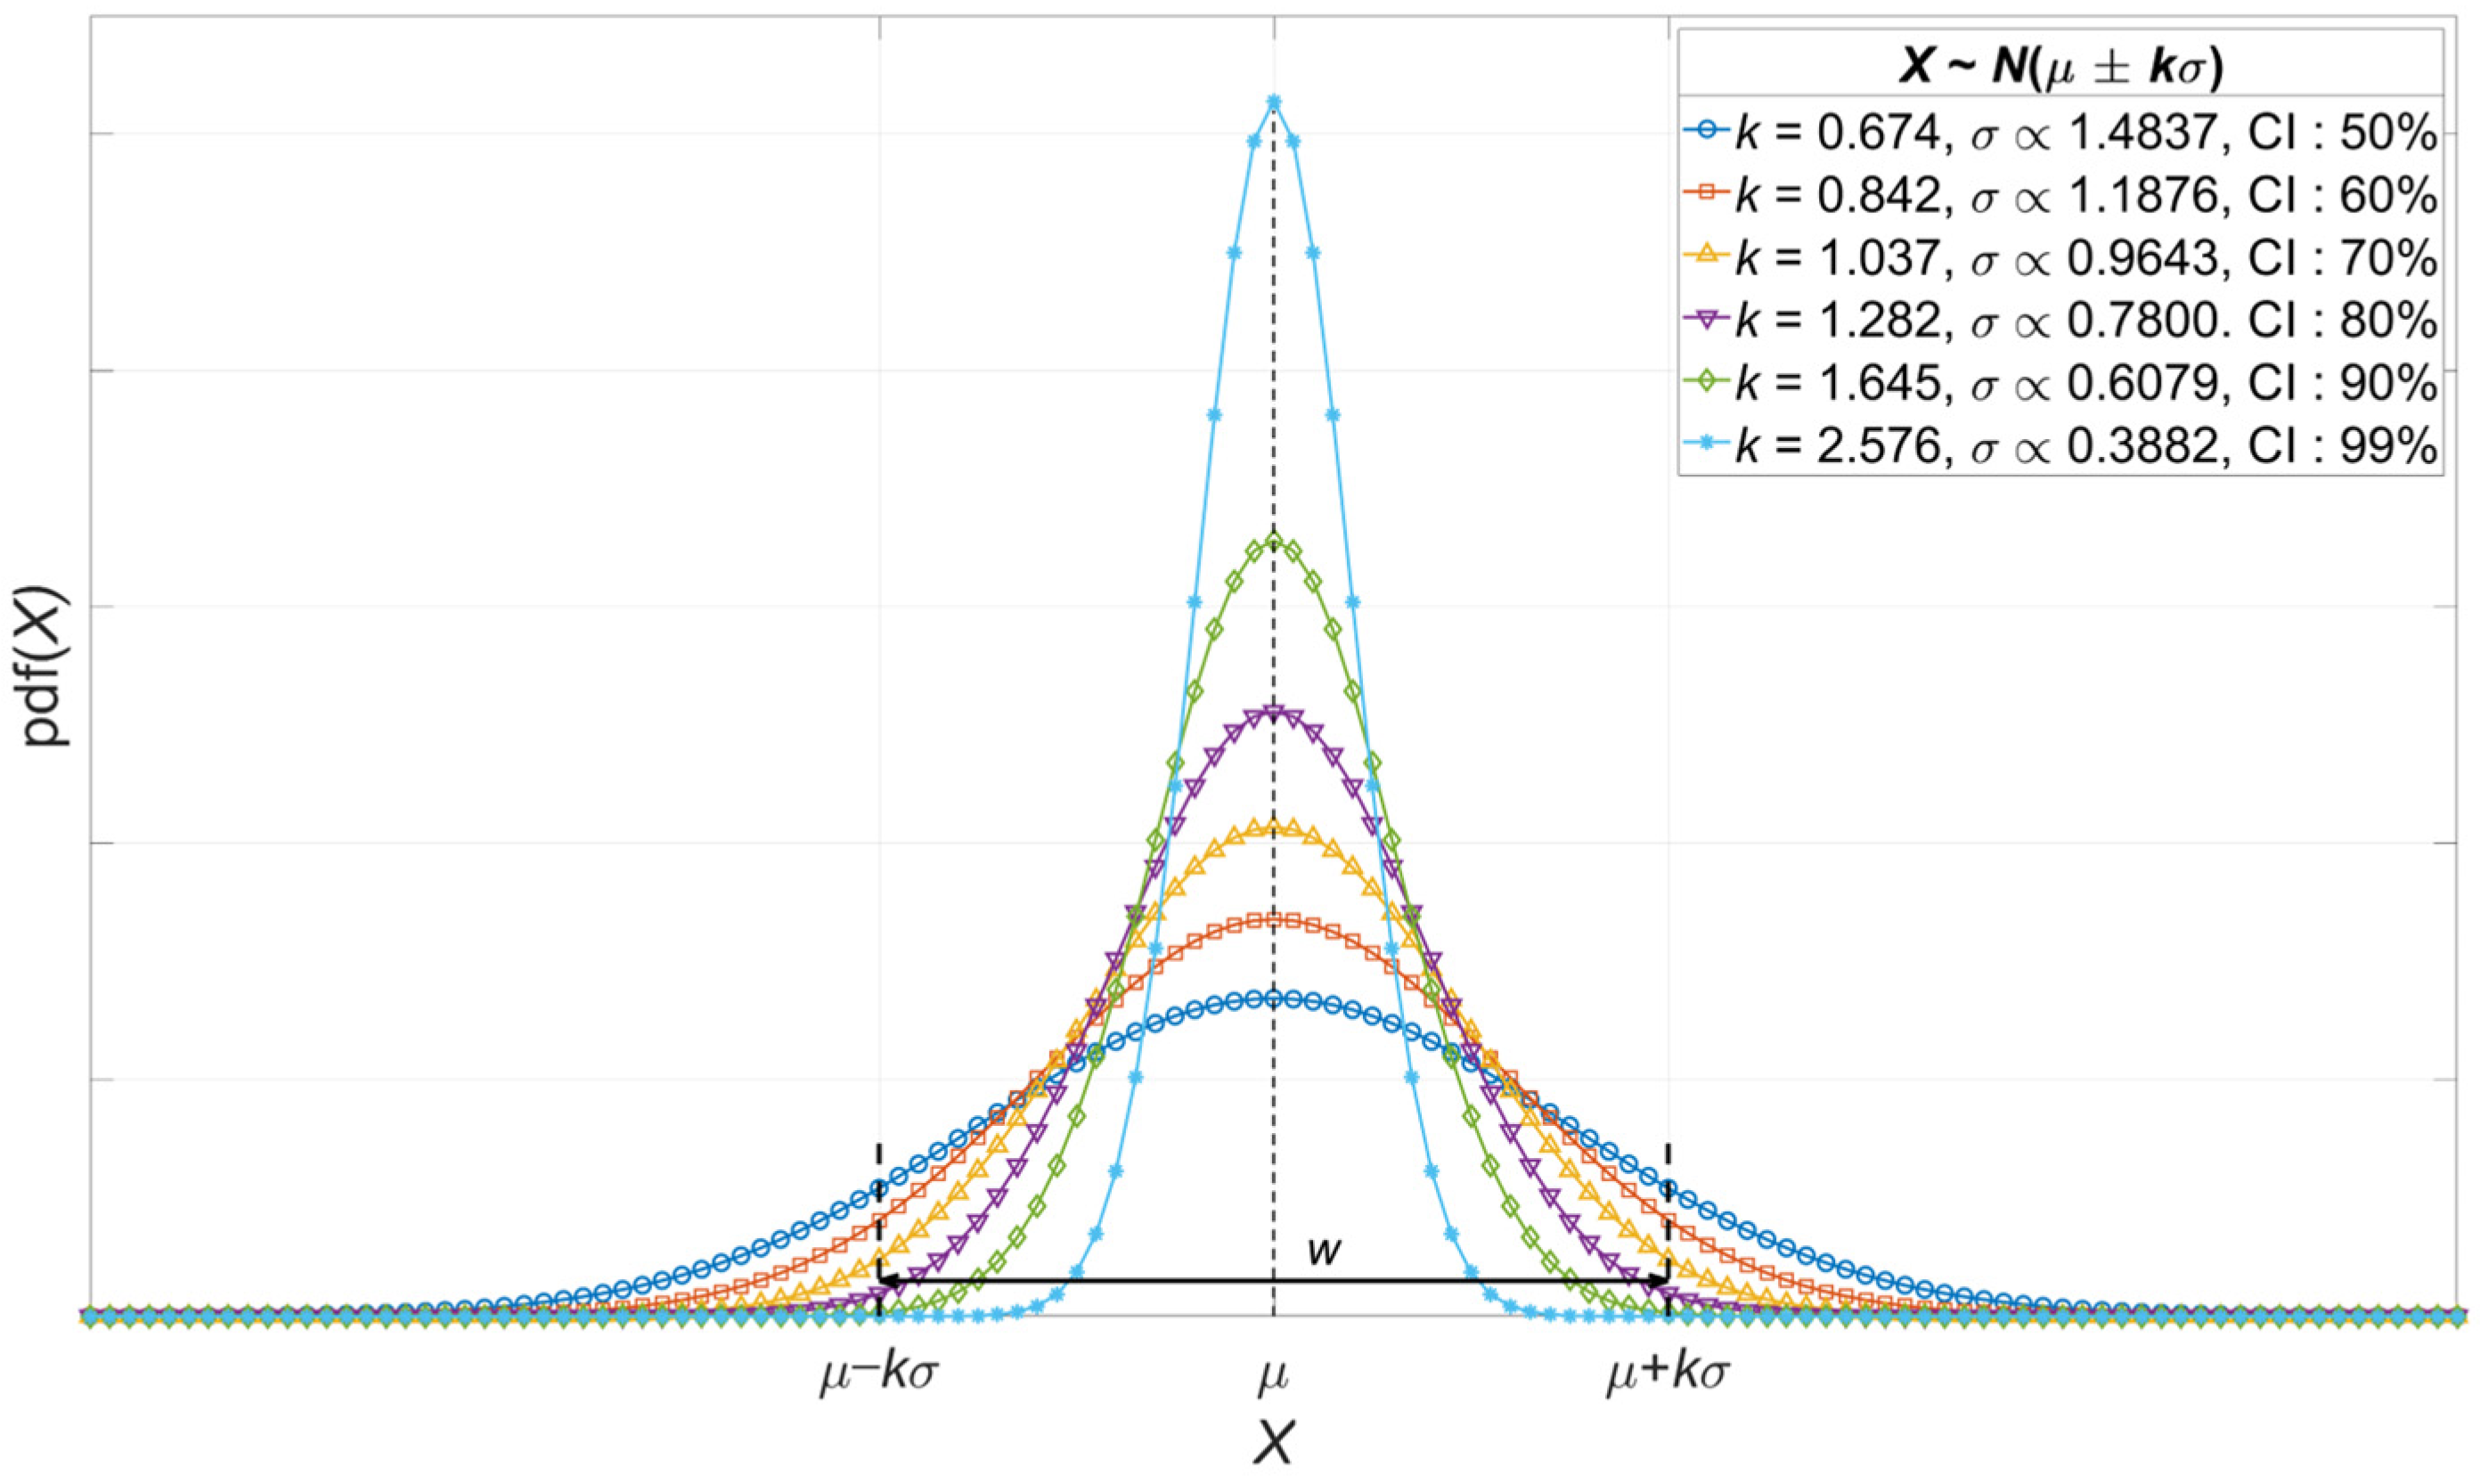
2.2. Docking Assessment Method

The success of underwater docking depends on matching of the states of the AUV and DS, including position and heading angle. Typically, these states are intended to align at the terminal stage of the docking process, and assessments are carried out based on the alignment of these states. However, in challenging circumstances such as when the DS is located on the hard-to-reach seabed or when the AUV is affected by ocean currents, rapid changes in the states of the AUV may be inevitable. In these circumstances, the state alignment of the AUV for the DS is bound to be disturbed. This can lead to premature judgement that docking is not possible even when the AUV can reach the DS sufficiently. To address this, this section proposes a method to assess whether the states (position, heading angle) are likely to allow the AUV to match its states with the DS within a short period. The assessment is performed with respect to the center of the DAA and the heading angle towards the DS as the assessment criteria, which vary with the separation between the AUV and the DS.
This separation is a crucial factor in compensating for errors and meeting the assessment criteria. If the error is significant, there is a low probability of successful docking because the error cannot be fully compensated for within the remaining distance. This means that the influence of error on the assessment results may vary depending on the separation. Therefore, the assessment range is designed to narrow as the distance decreases, ensuring inversely proportional influence of the error to the distance. The assessment range for the position is set as the width of the DAA. In the case of the heading angle, it is set as the range of direction angle, from the boundary of the DAA to the DS.
The ideal docking scenario for the AUV involves approaching the center of the DAA with the same heading angle as the DS. In this regard, the assessment results consistently indicate the highest value. When the AUV has an error of the same magnitude as the ideal state, both positively and negatively, the assessment results are identical. The use of the normal distribution function in the assessment process allows for a symmetrical representation of results on both sides of the center. Here, the standard deviation of the normal distribution function is determined by the confidence interval (CI) level projected onto the assessment range, as depicted in Figure 3. The relationship between the assessment range ( w ) and the standard deviation ( σ ) is expressed as Equations (1) and (2), where the hyperparameter k determines the CI level of the normal distribution function. Equation (3) demonstrates the calculation for the normal distribution value. Here, X represents the current state being assessed, and μ is an assessment criterion.
w = 2 k σ ,
σ = w 2 k
p d f ( X ) = 1 2 π σ 2 e X μ 2 2 σ 2
However, it is necessary to consider additional factors in the assessment process. Specifically, the entrance width of the DS ( w e ) and the maximum degree of turning through rudder control in minimum unit time ( ϵ ψ ) should be reflected in the position and heading angle assessments, respectively, as indicated by Equations (4) and (5). These factors are applied as tolerance ranges to the current states. In the case of w e , it is used to account for the potential of being guided to the center of the DS by the shape of the inlet. As for ϵ ψ , it is employed to consider the potential change in the heading angle through control as the AUV moves forward.
The assessment result for the state matching is calculated as Equation (6). The degree of matching with the assessment criterion is expressed by dividing the maximum function value within the tolerance range for the current state by the function value for the assessment criterion. The final result of the assessment, the index representing the probability of docking ( P D ), is calculated using the degrees of state matching for the position criterion ( P p ) and the heading angle criterion ( P ψ ), shown in Equation (7) [23]. Here, the degree of matching represents the probability that the state of the AUV matches the assessment criterion. Additionally, it is assumed that the position and heading angle of the AUV are independent of each other. In general, the probability of two events occurring simultaneously is expressed as the product of their individual probabilities. Therefore, the probability of docking refers to the probability that the position and heading angle each match the assessment criterion. Meanwhile, if the two degrees of matching hold the same value, the probability of docking should also reflect the same value. However, this cannot be expressed using the conventional form of a probability product. Therefore, the probability of docking is derived as the square root of the product of these probabilities.
p d f ( X ) = 1 2 π σ 2 e X + i μ 2 2 σ 2
i = w e 2 i w e 2 ,   i n   p o s i t i o n   a s s e s s m e n t        ϵ ψ i ϵ ψ ,   i n   h e a d i n g   a n g l e   a s s e s s m e n t
P p , ψ = max p d f X p d f μ × 100 %
P D = P p × P ψ
Based on the calculated index, the final decision for docking can be made. If the index is equal to or greater than a predefined threshold, it indicates that the current states of the AUV are reliable in performing docking. However, if the index falls below the threshold, it signifies unreliability, and the docking process must be halted to prevent a collision with the DS. To avoid such collisions, the AUV should initiate a turning maneuver while a safe distance is guaranteed, before reaching the minimum distance for optimal avoidance (MDOA). Figure 4 geometrically illustrates the decision of the MDOA considering the turning maneuver of the AUV.
The sequence of determining the MDOA is as follows: First, define a circle with a diameter equal to the entrance width of the DS, centered on its position. Then, position the AUV to face the DS, with its MTRP tangent to the previously defined circle. At this point, the common tangent line of the two circles and the line that connects the centers of the two circles form a right angle. As a result, connecting the center of each circle and the AUV forms a right triangle, leading to the establishment of Equation (8). The result obtained from this equation represents the distance between the AUV and DS in such a situation. Therefore, the AUV can avoid collision with the DS by making a decision to turn before the distance becomes closer than the MDOA.
M D O A = M T R + w e 2 2 M T R 2

3. Tests and Results Analysis

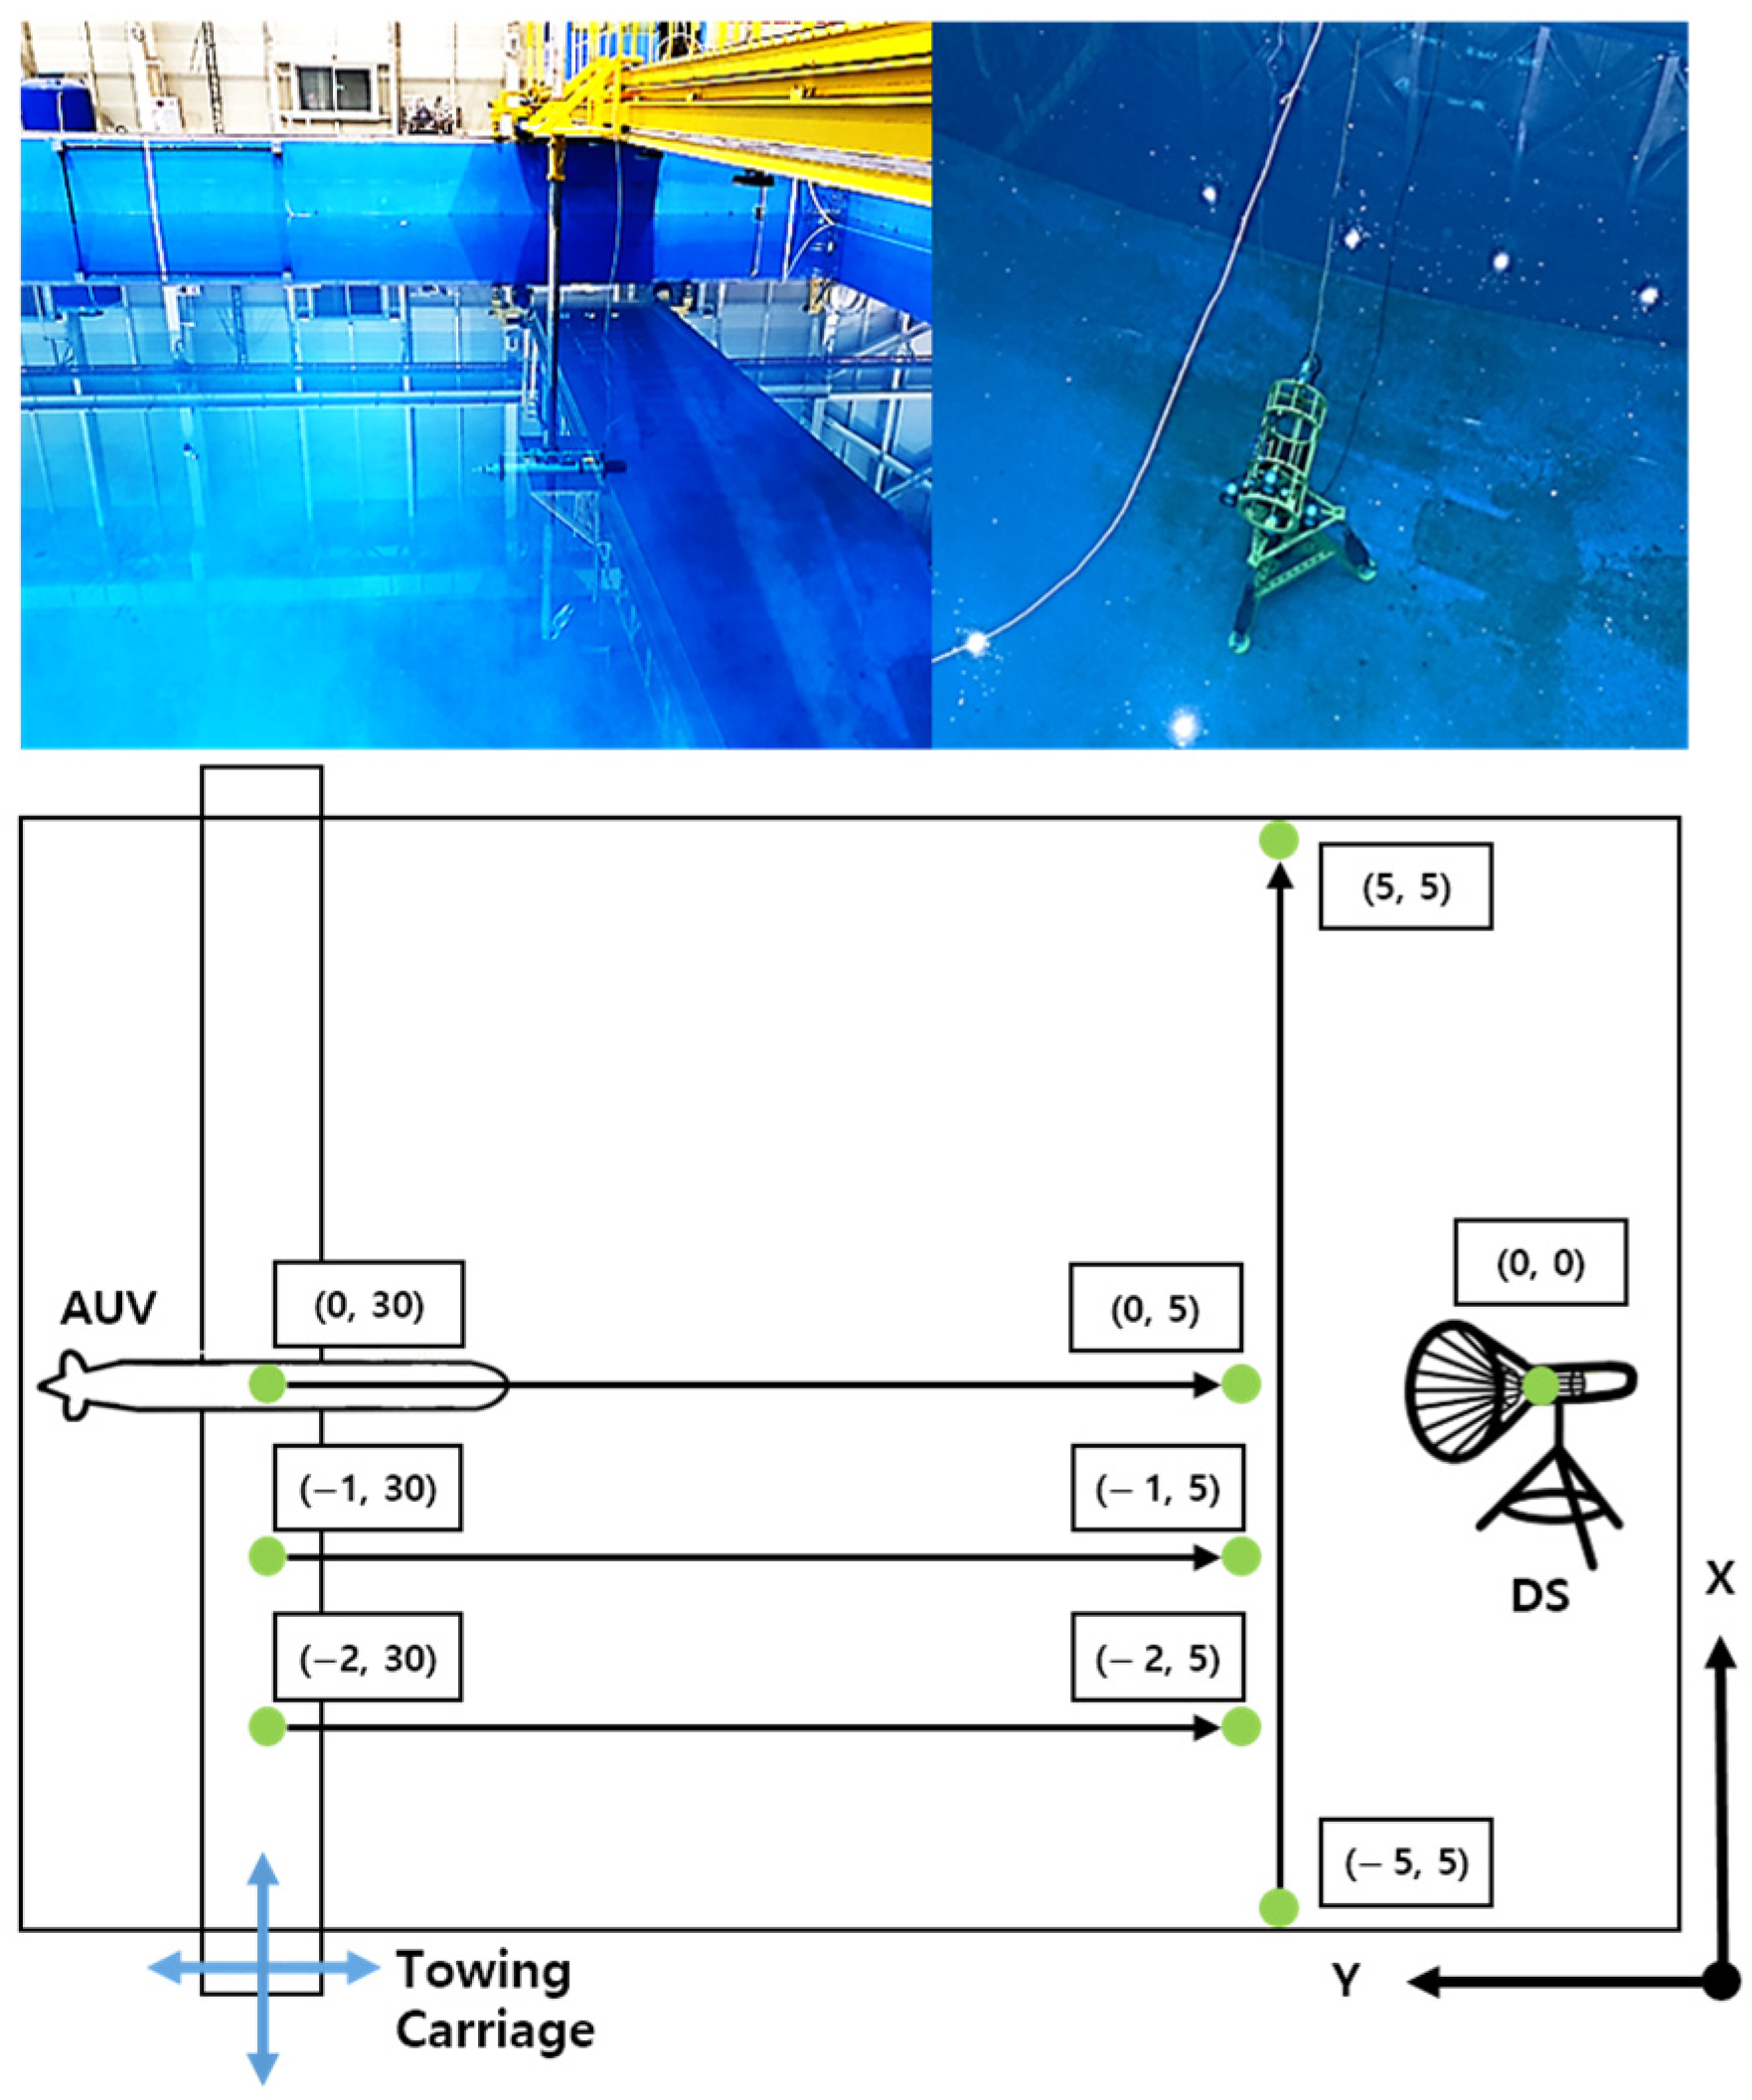
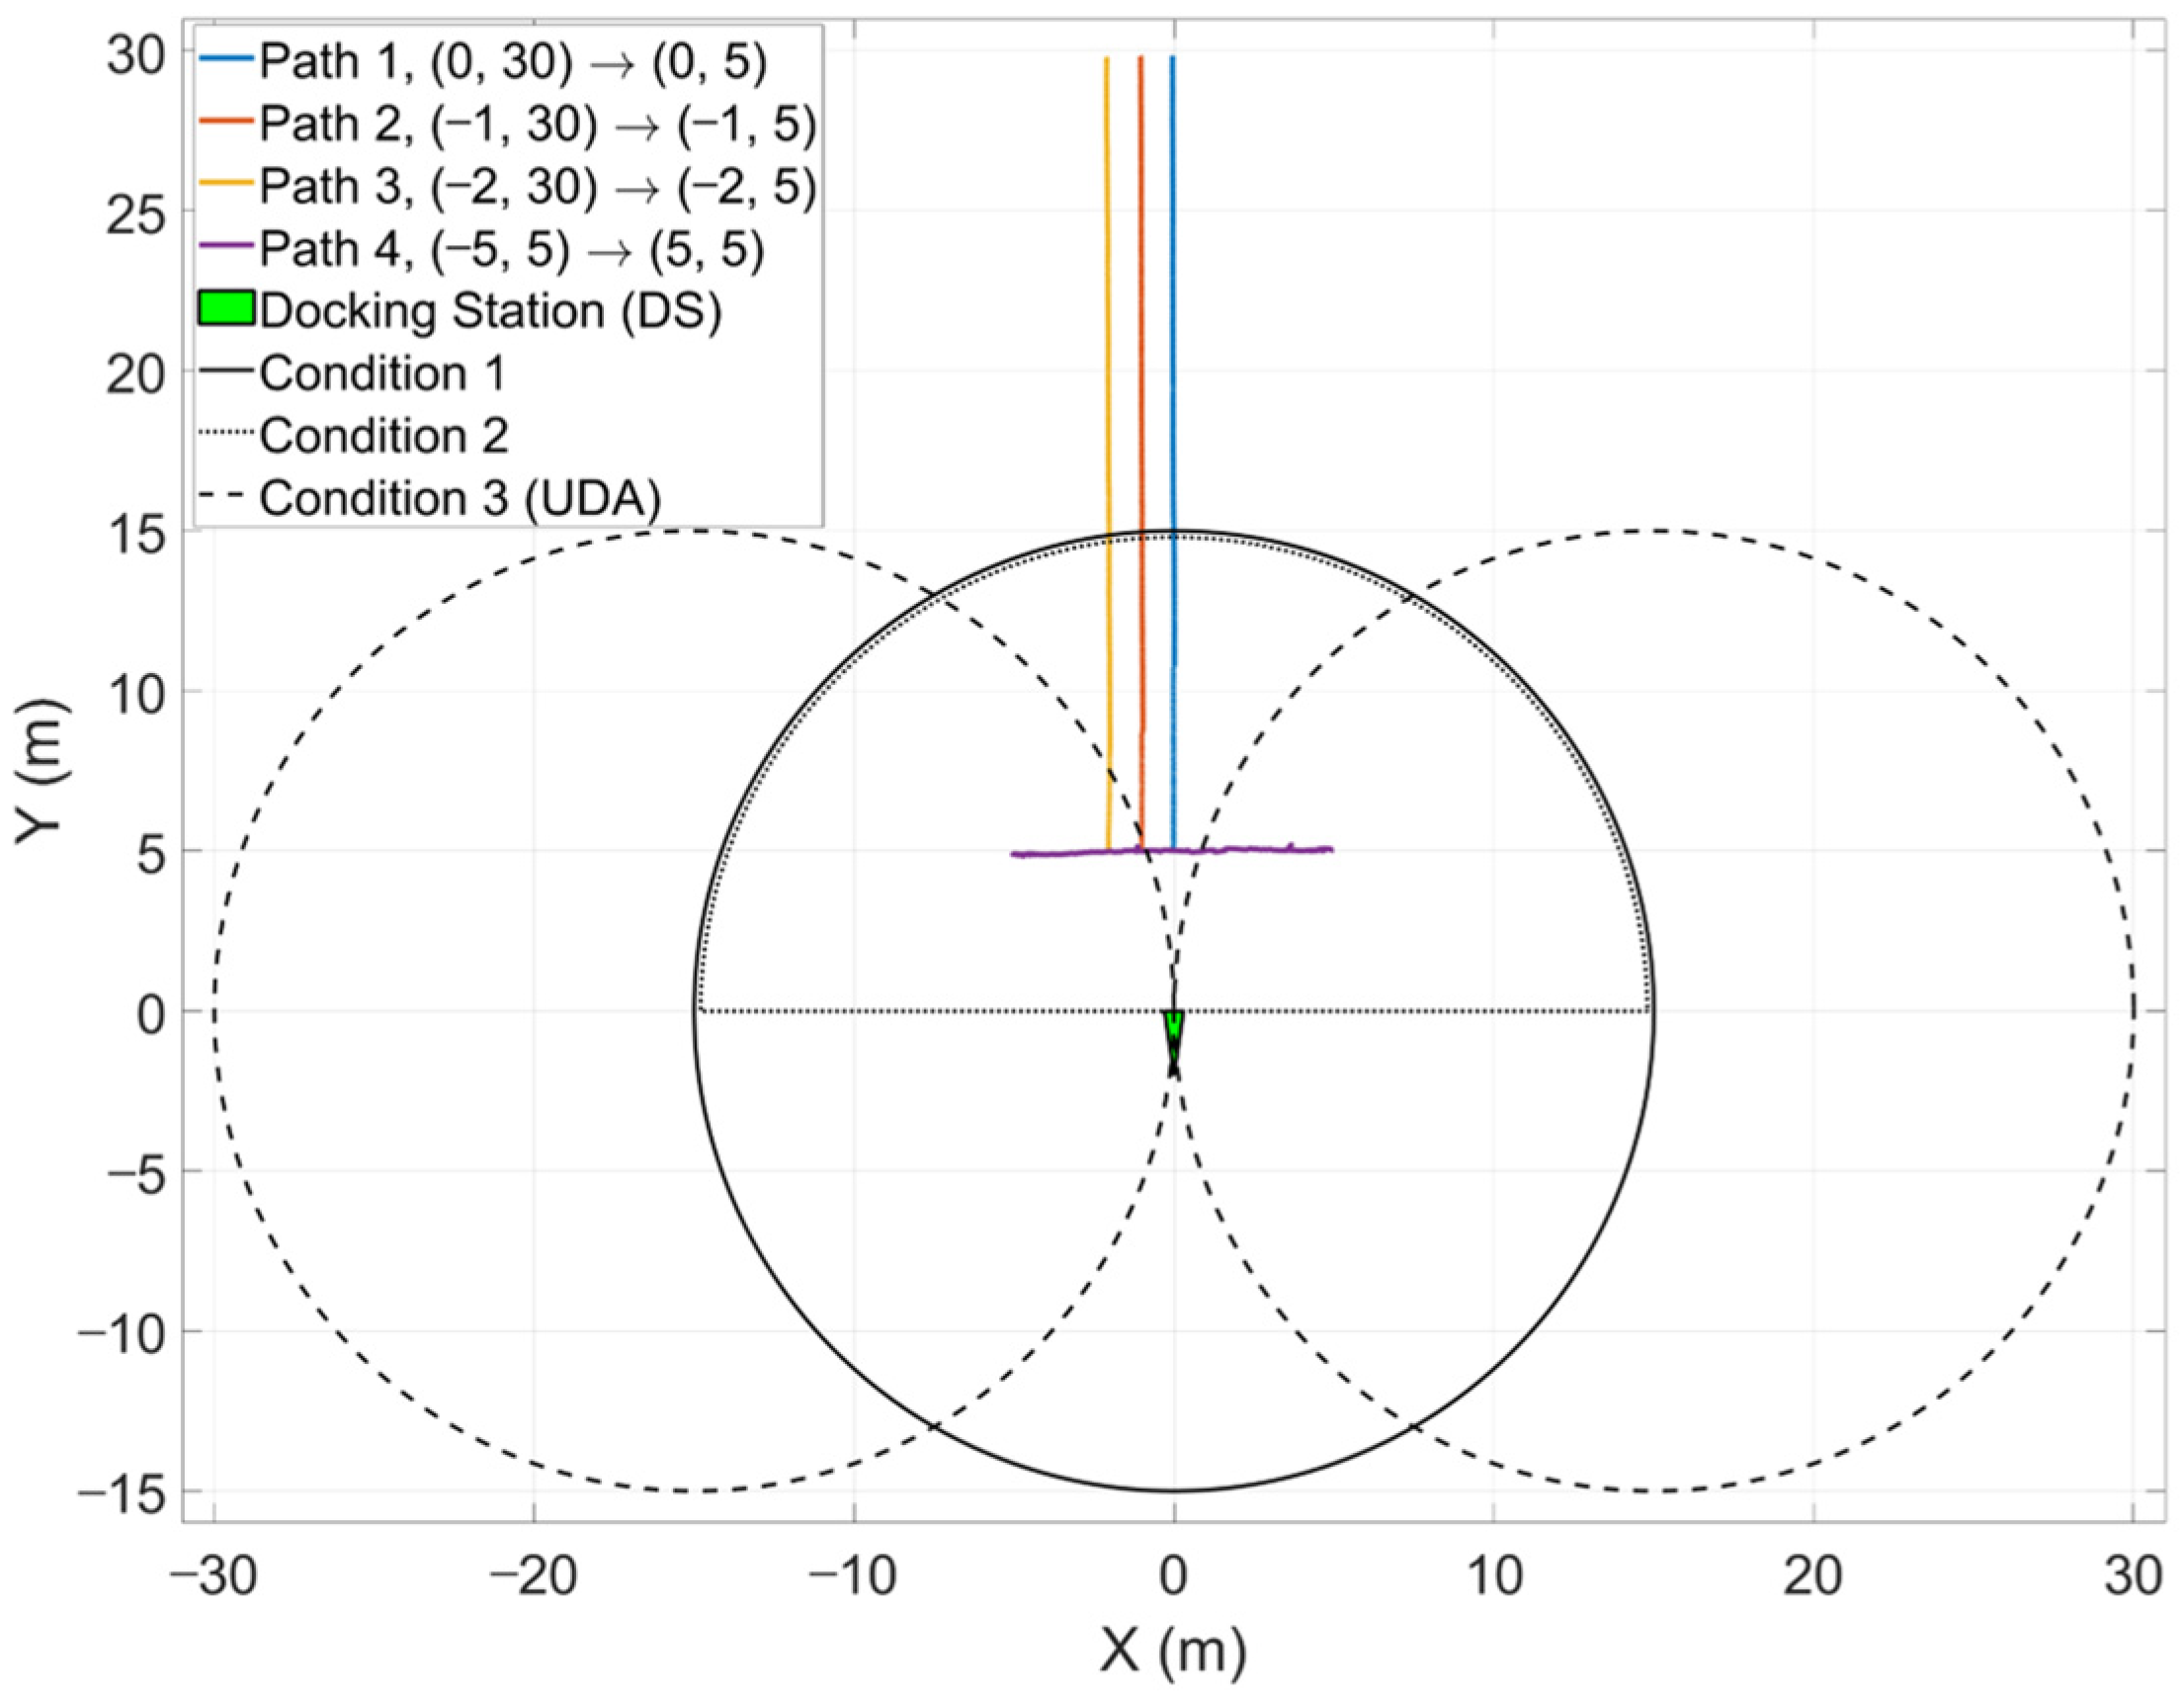
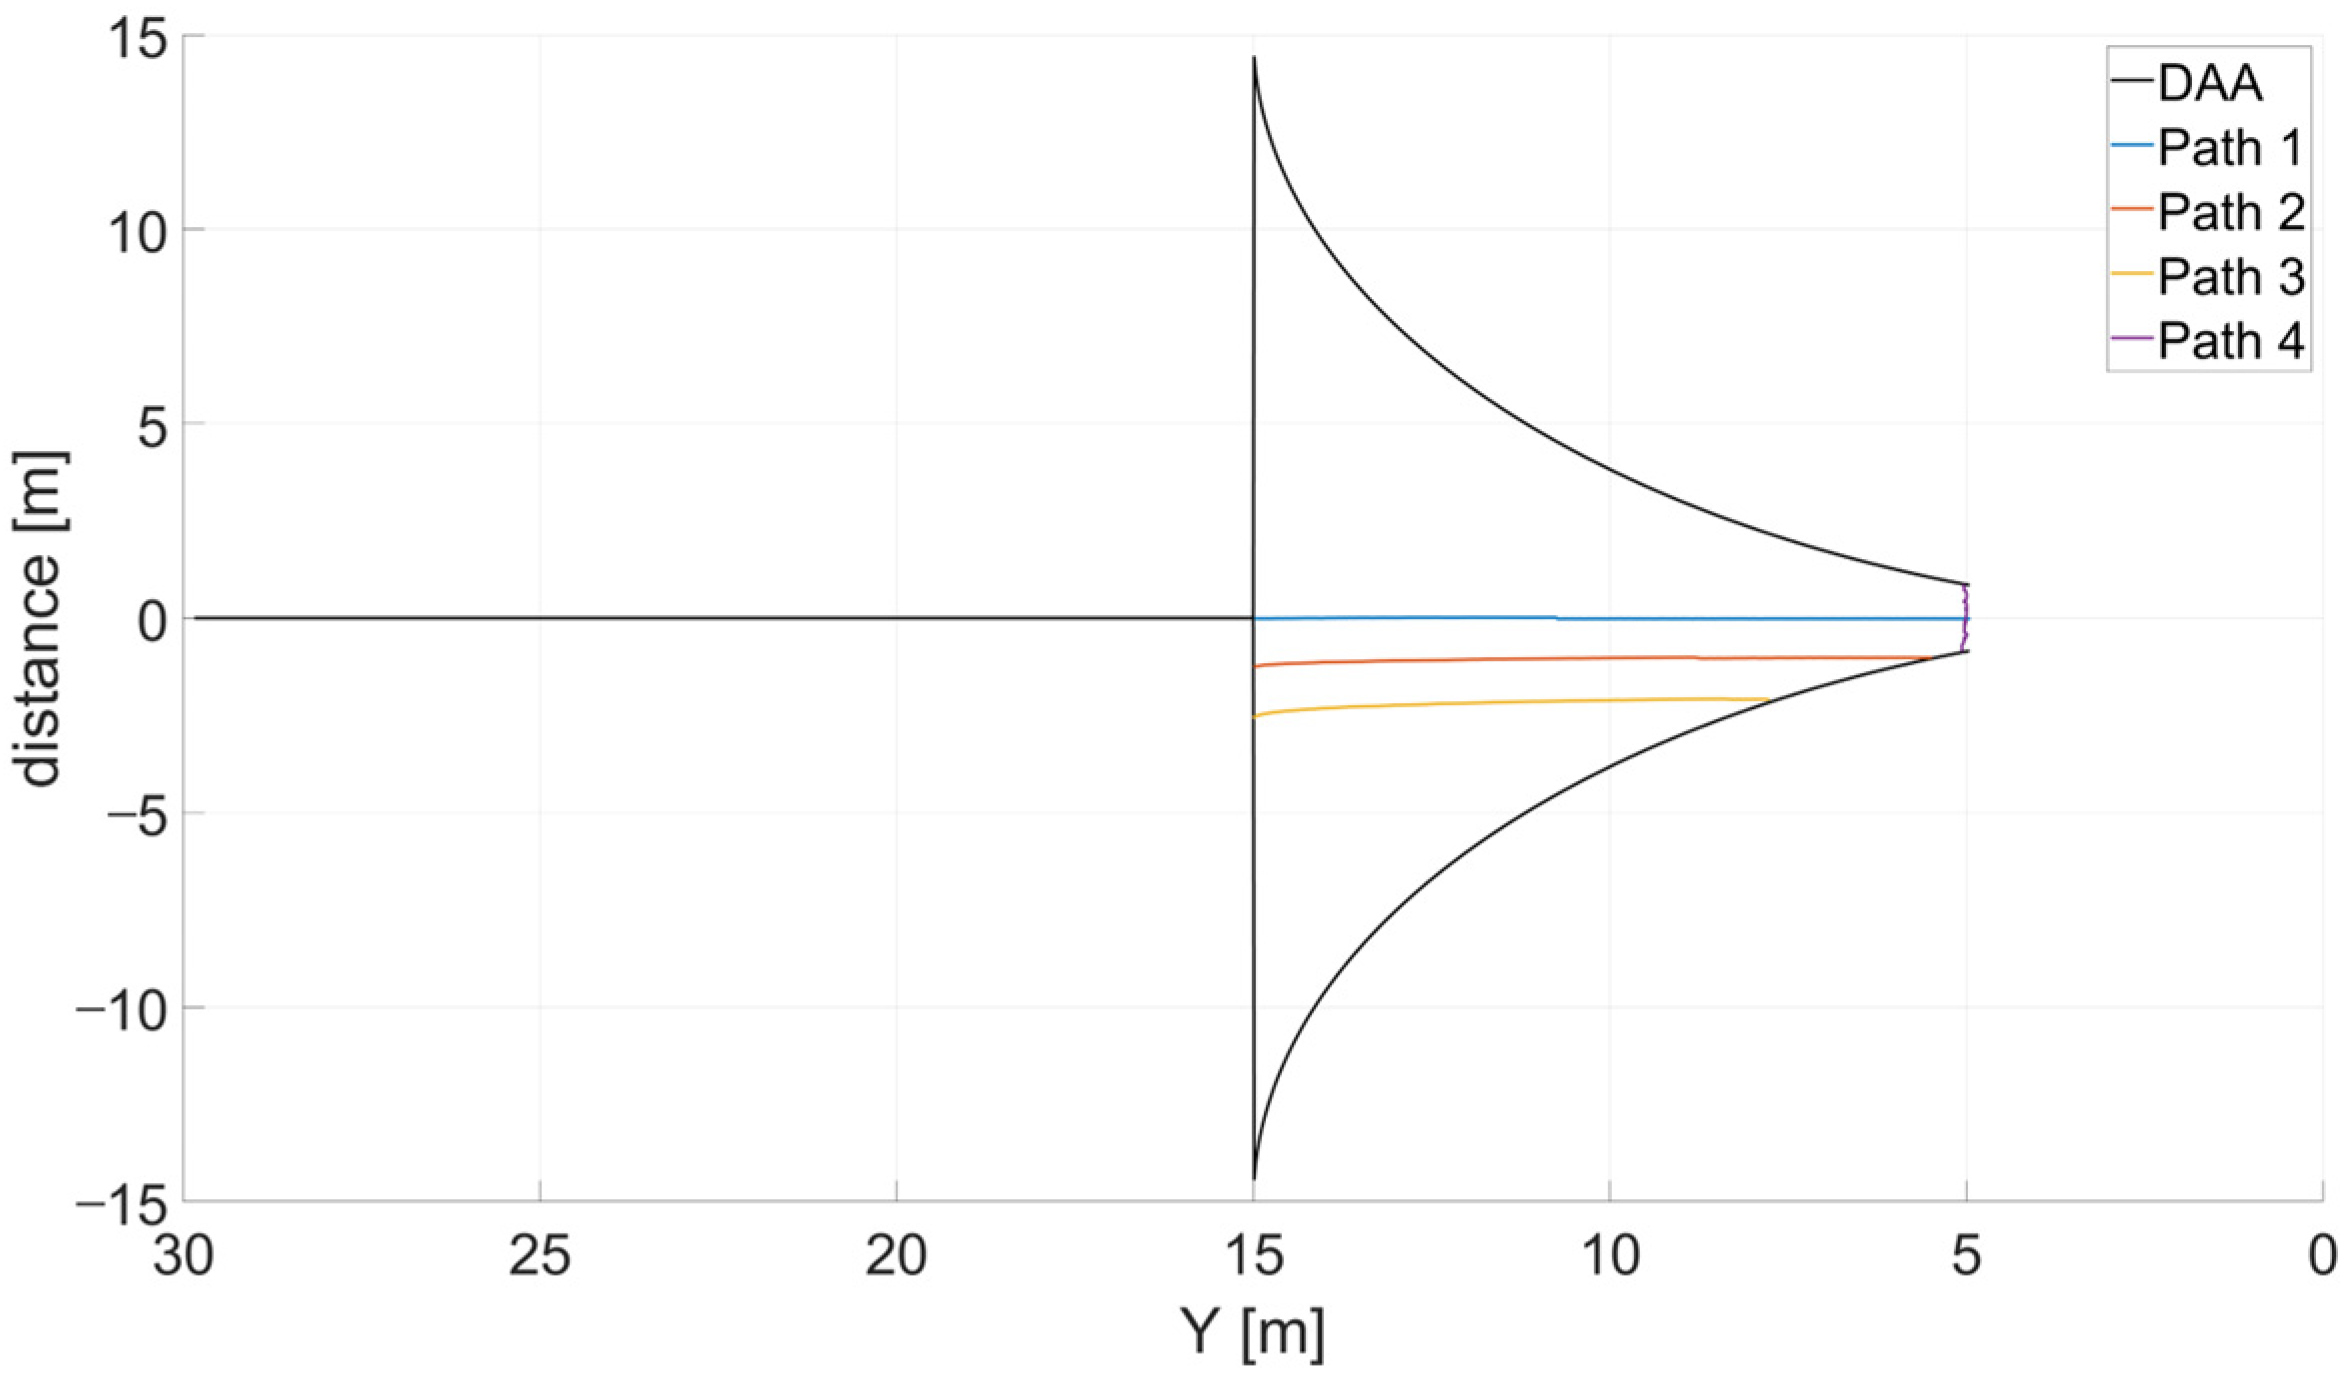
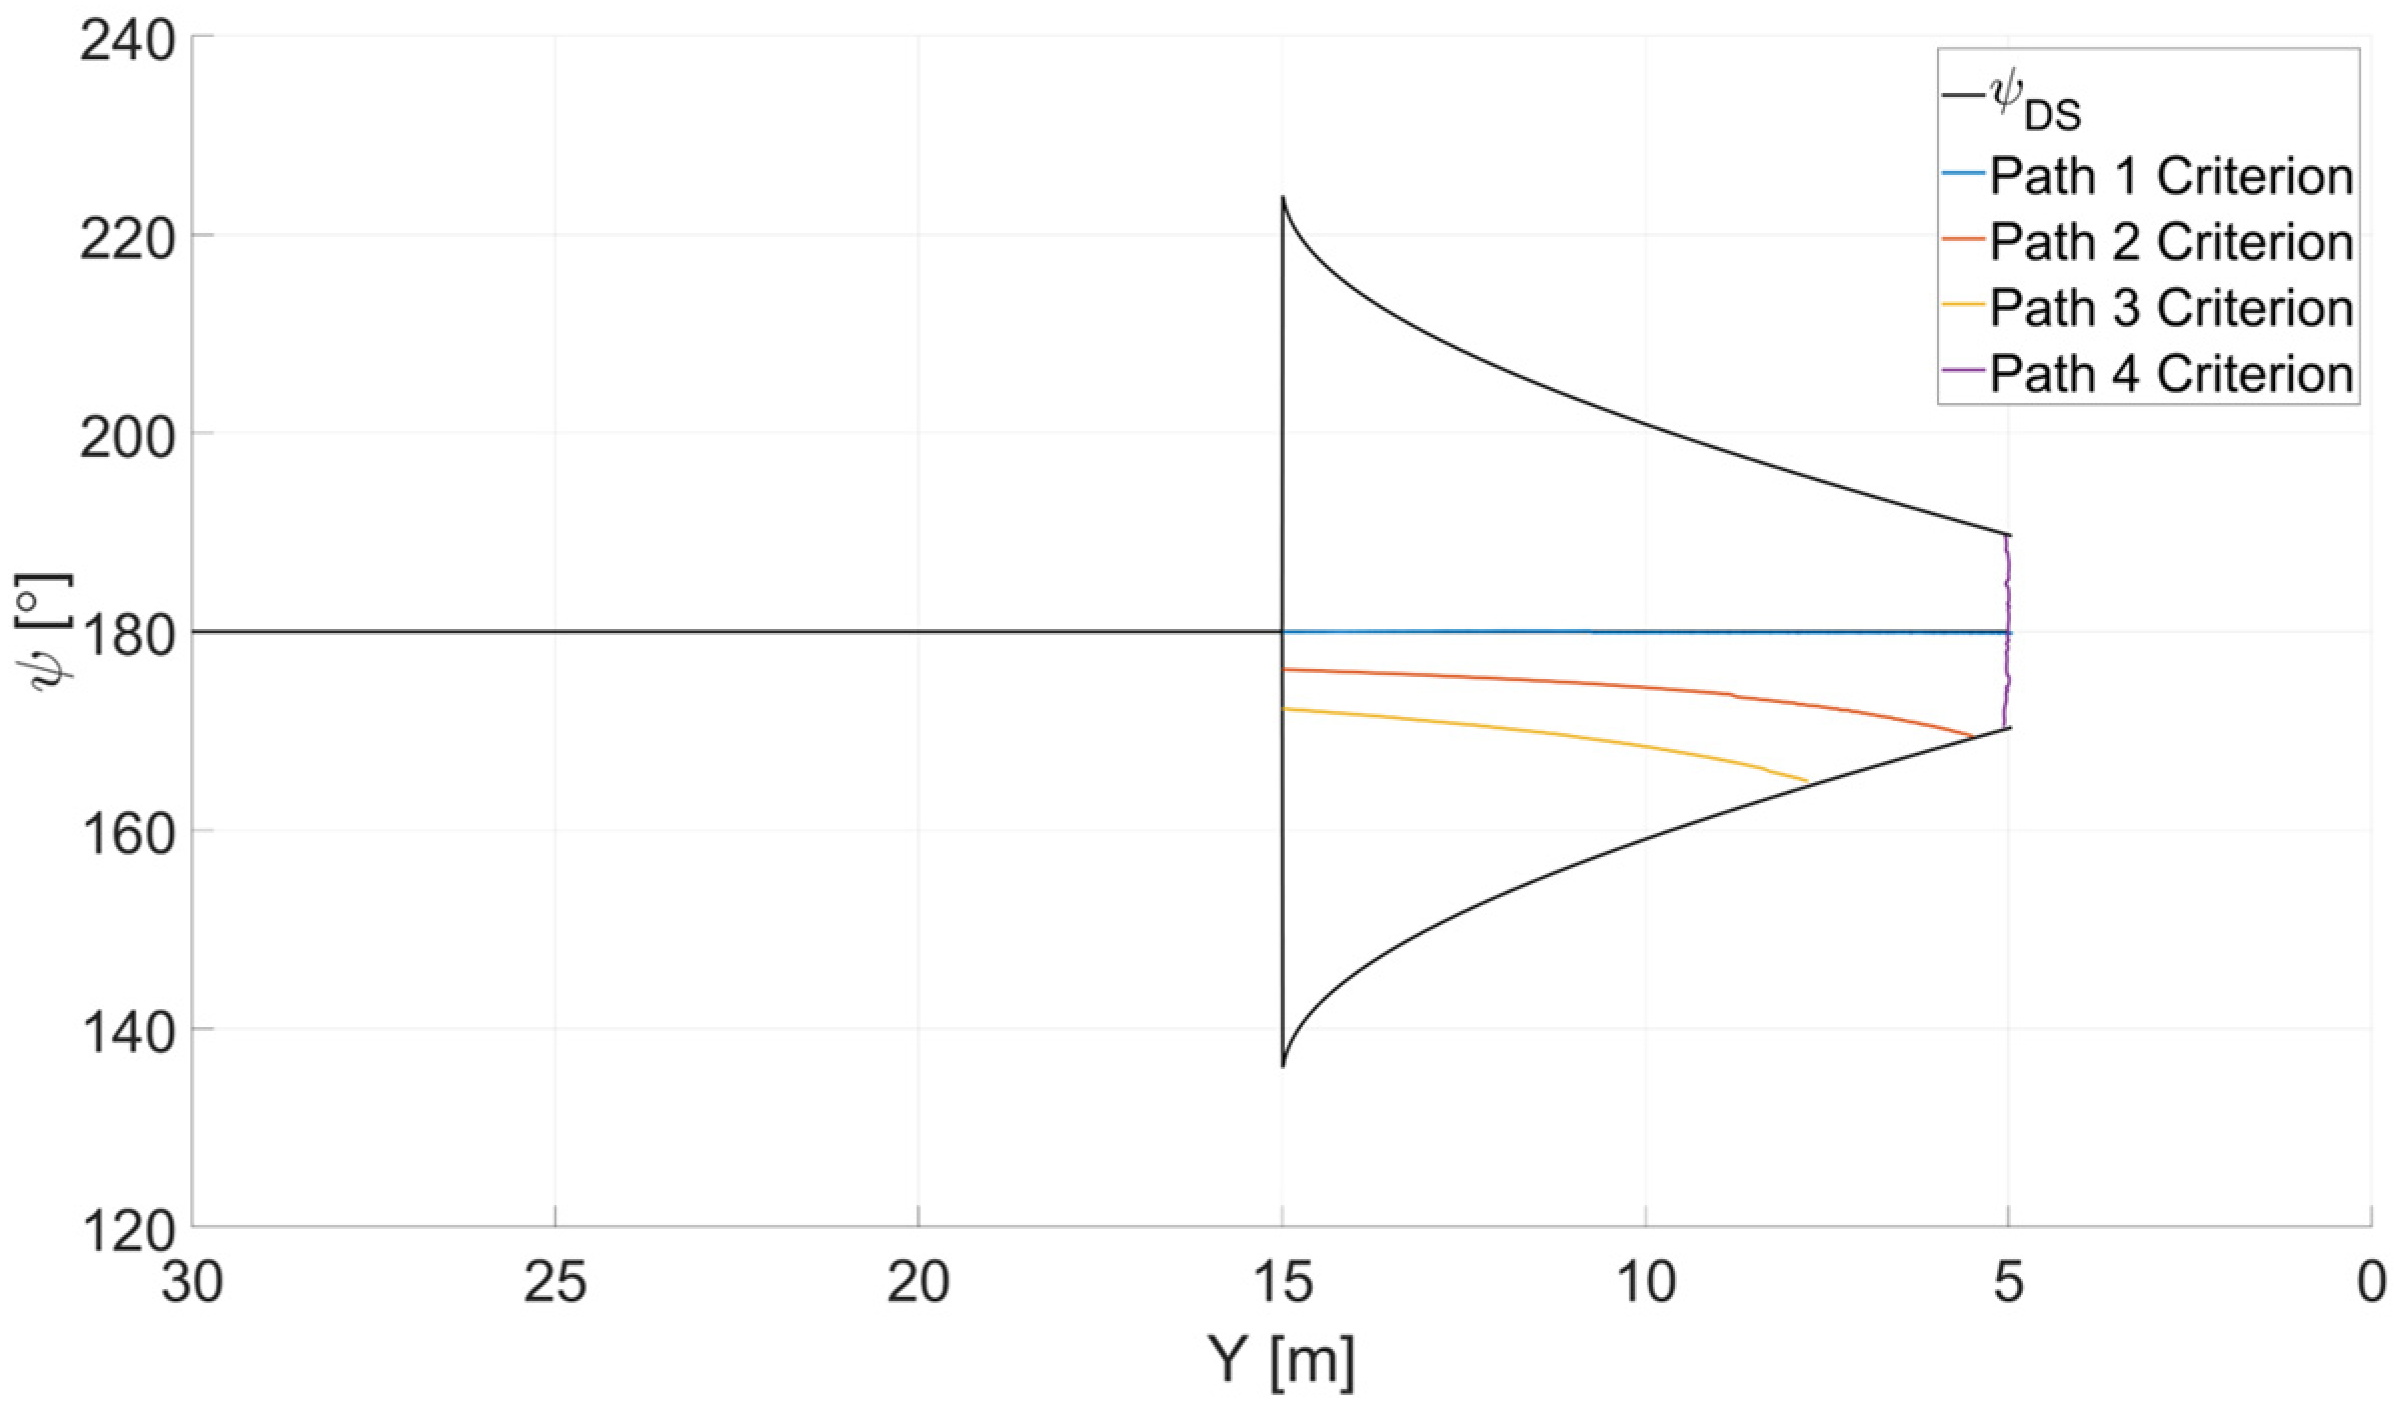
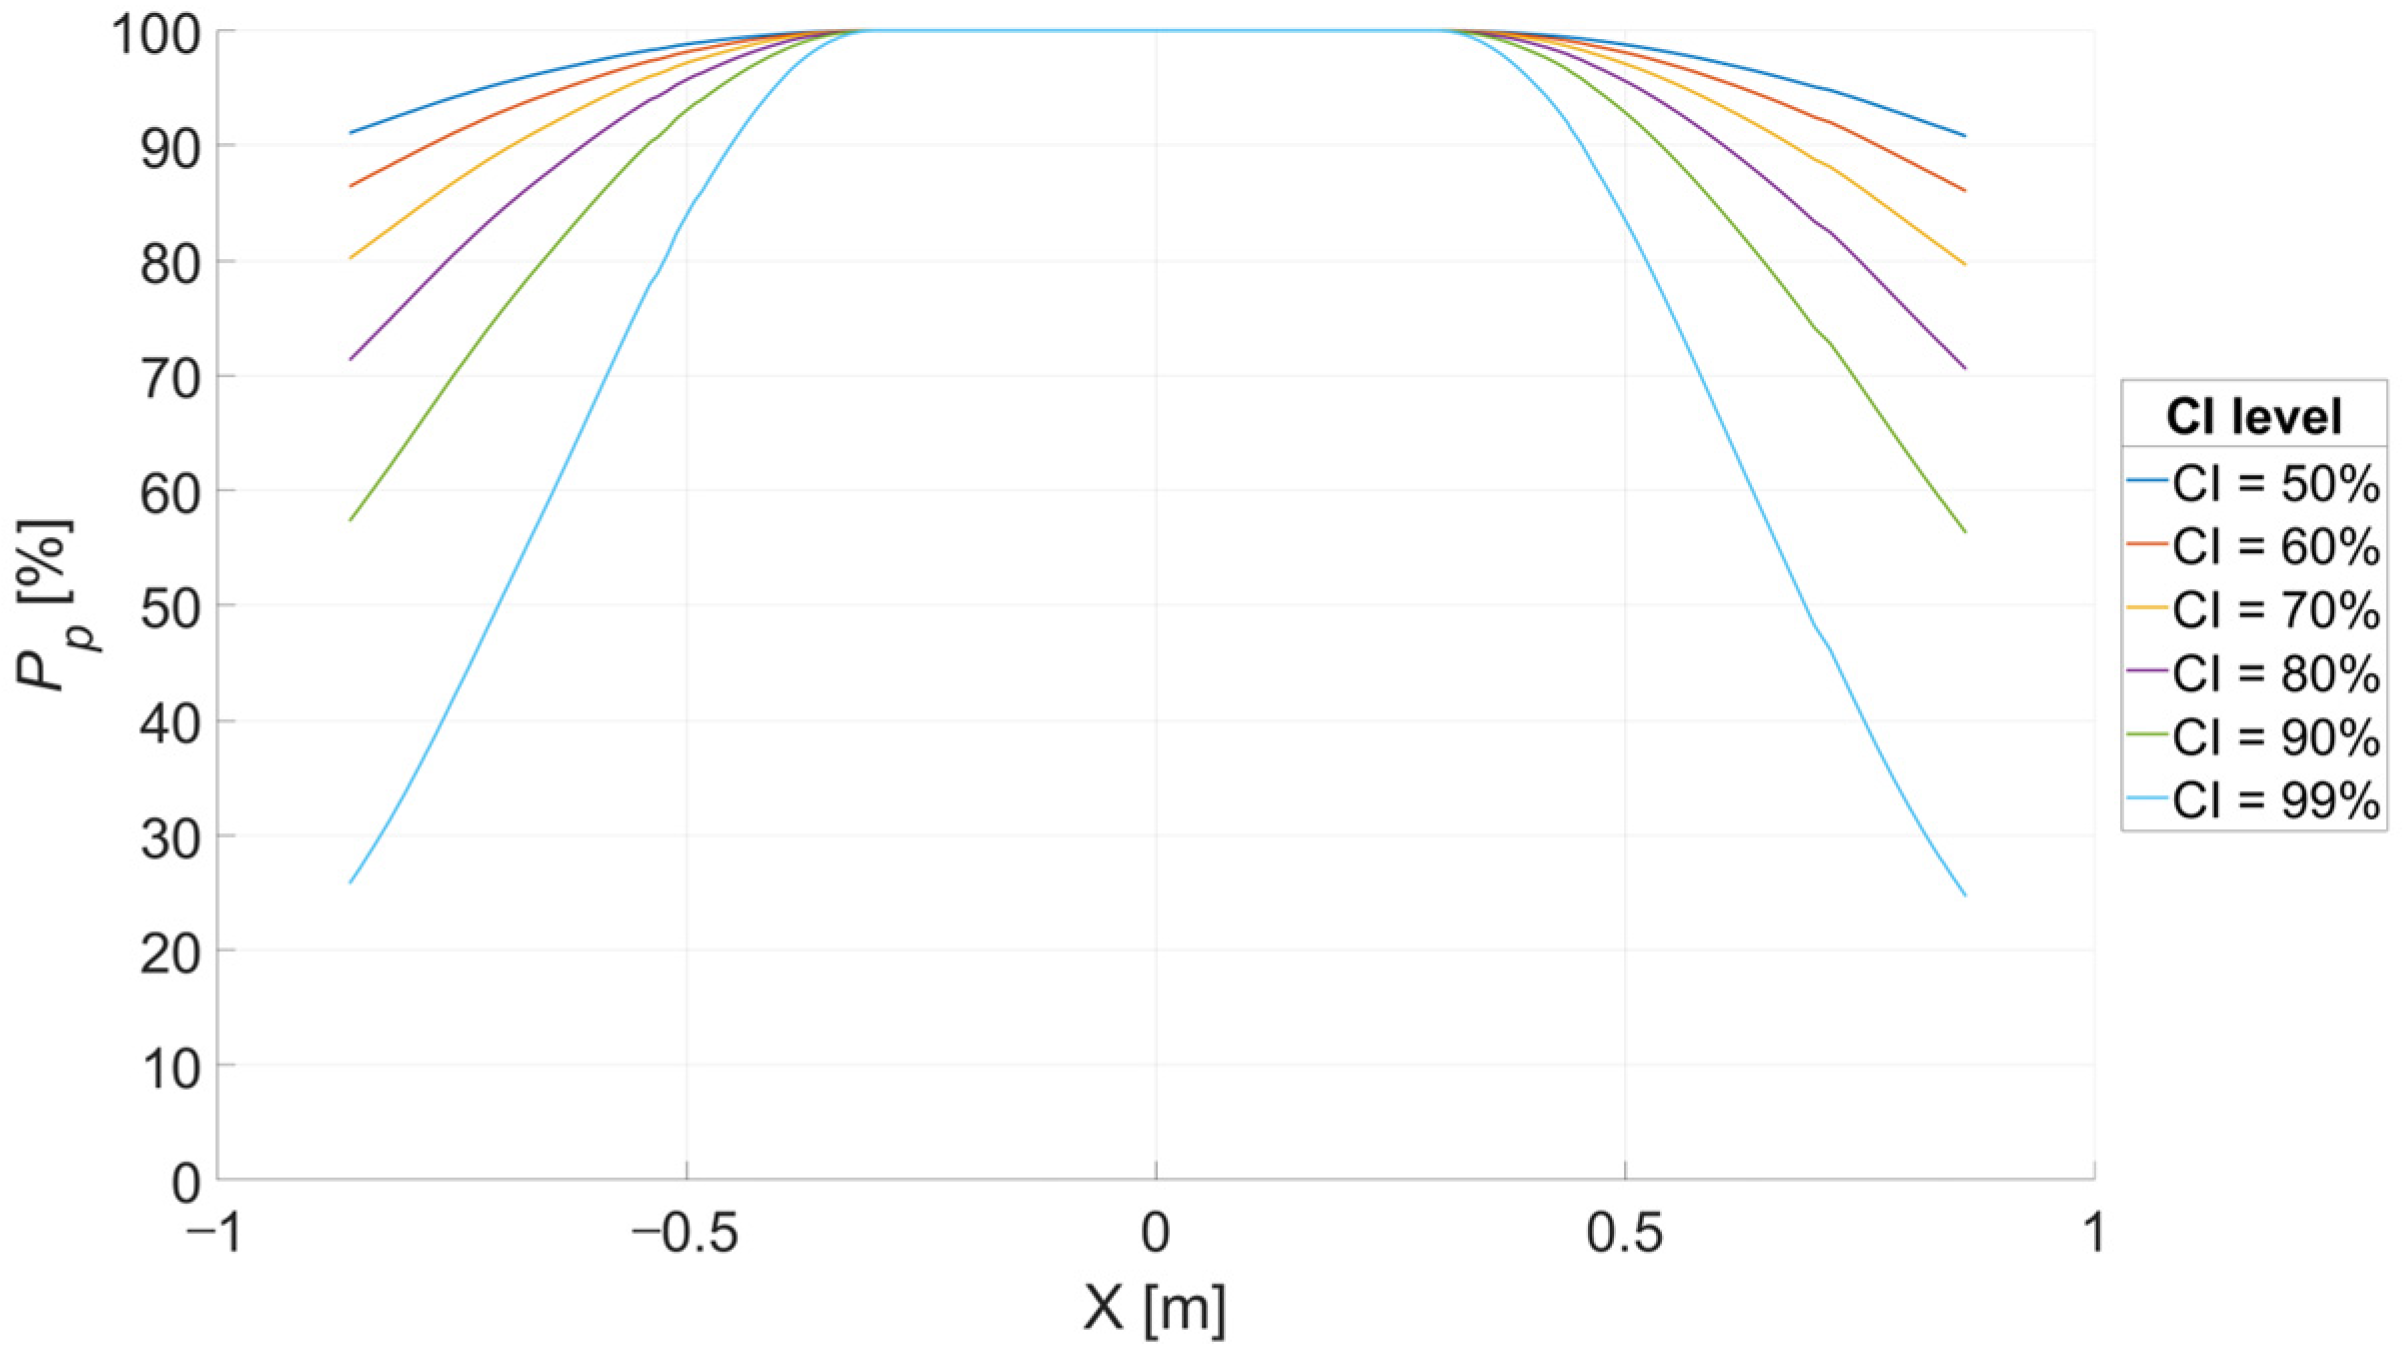
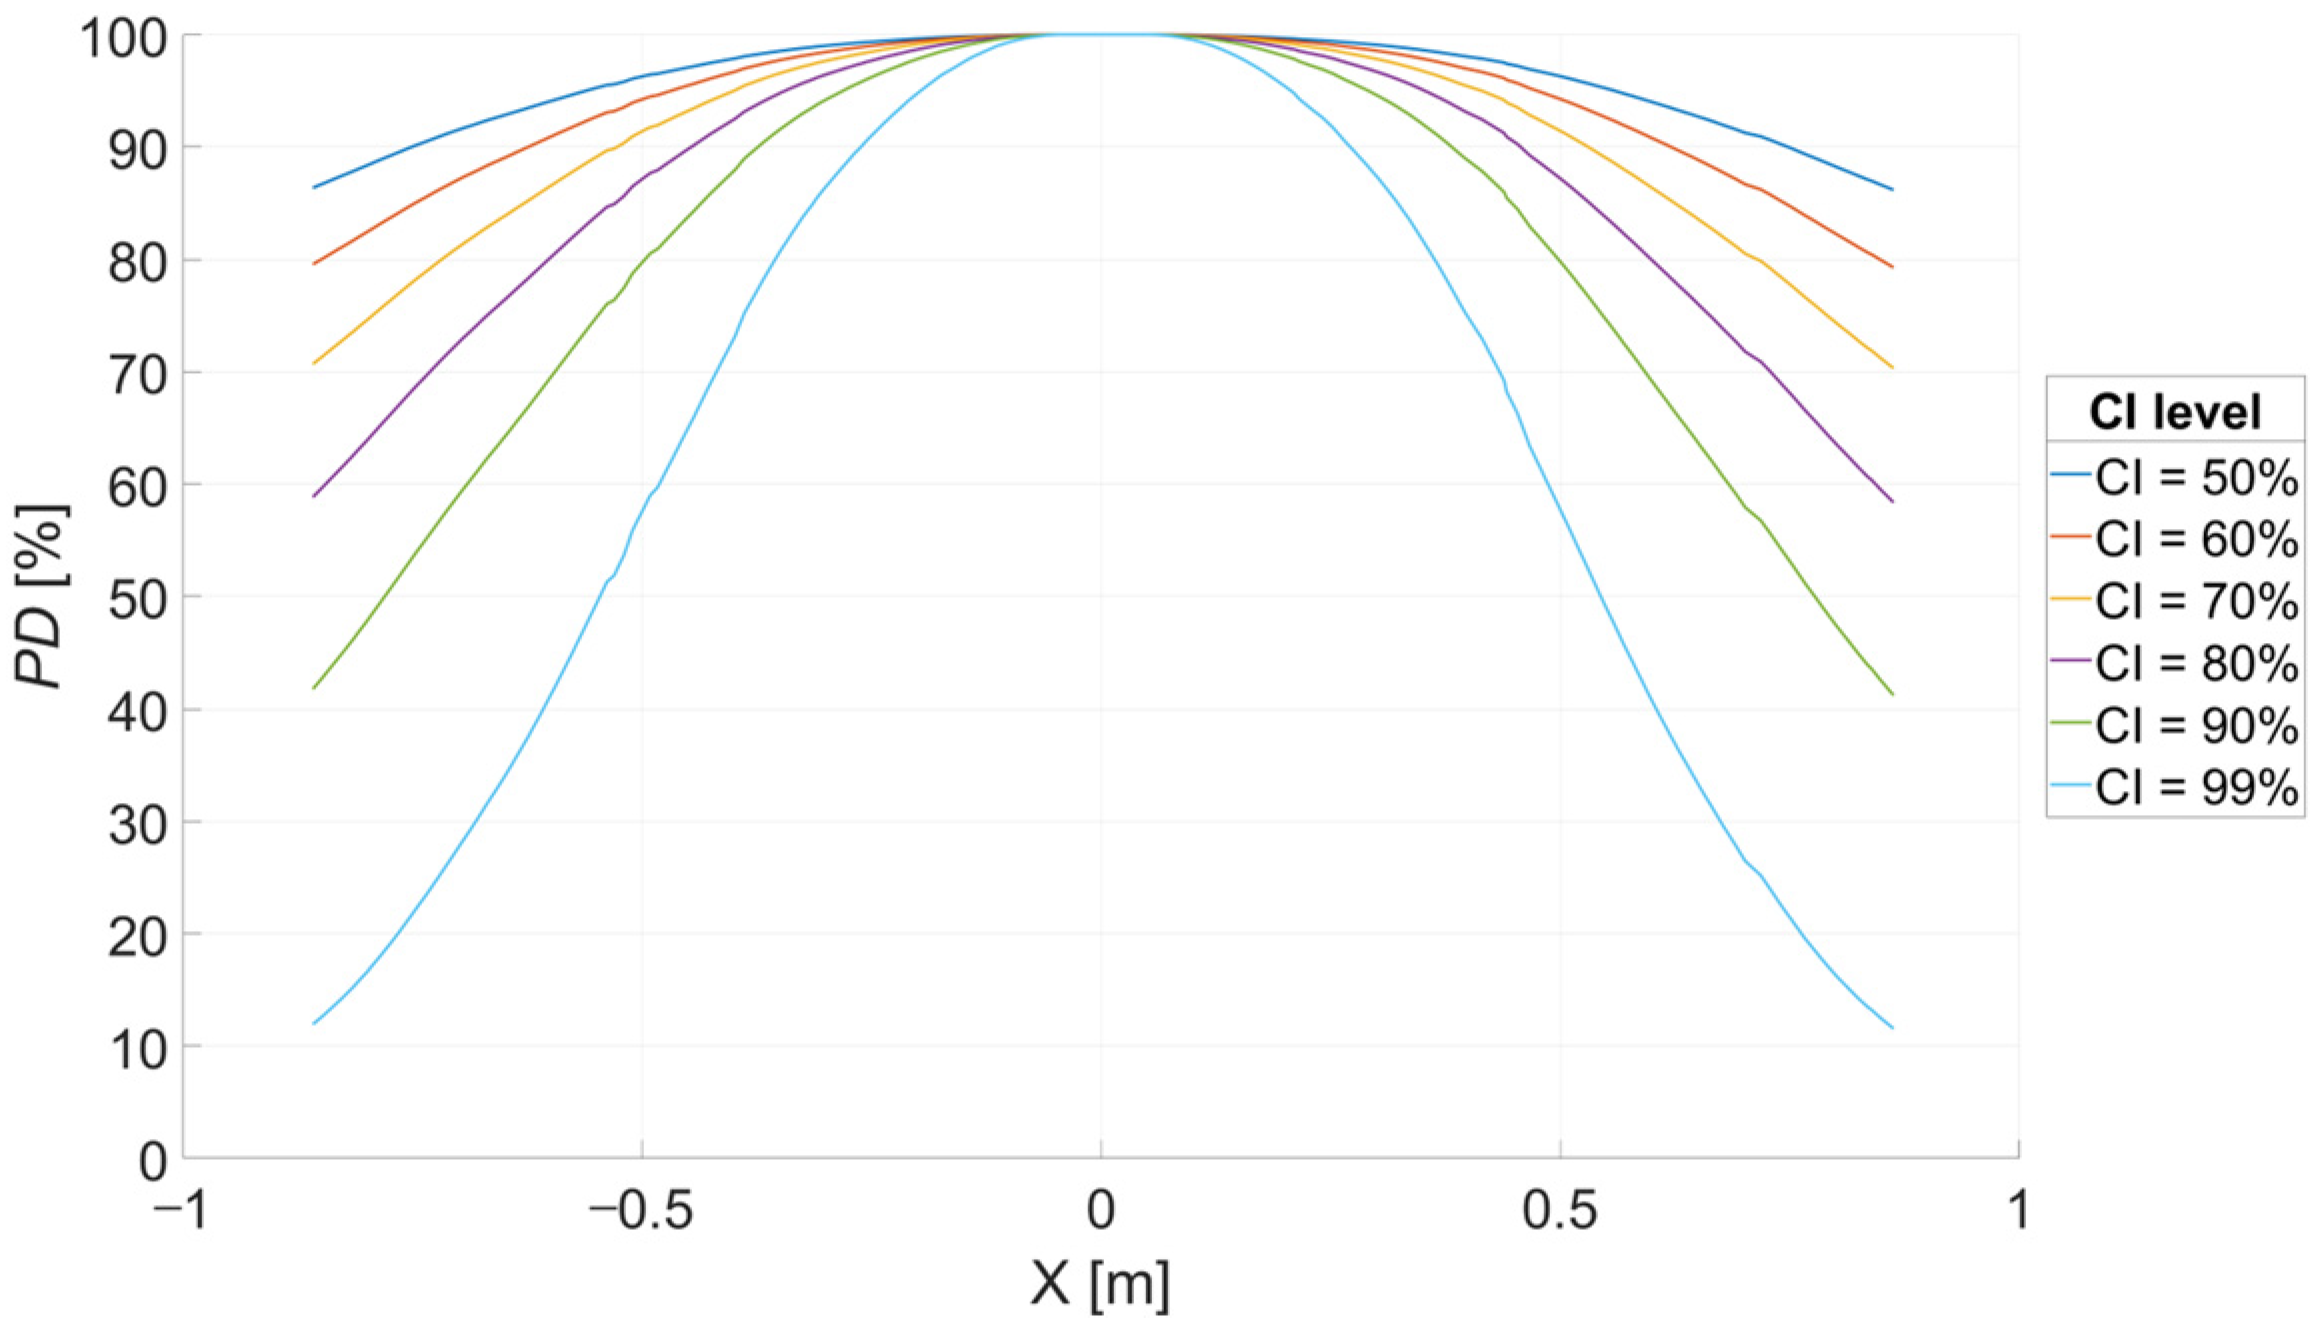
3.1. Functional Test
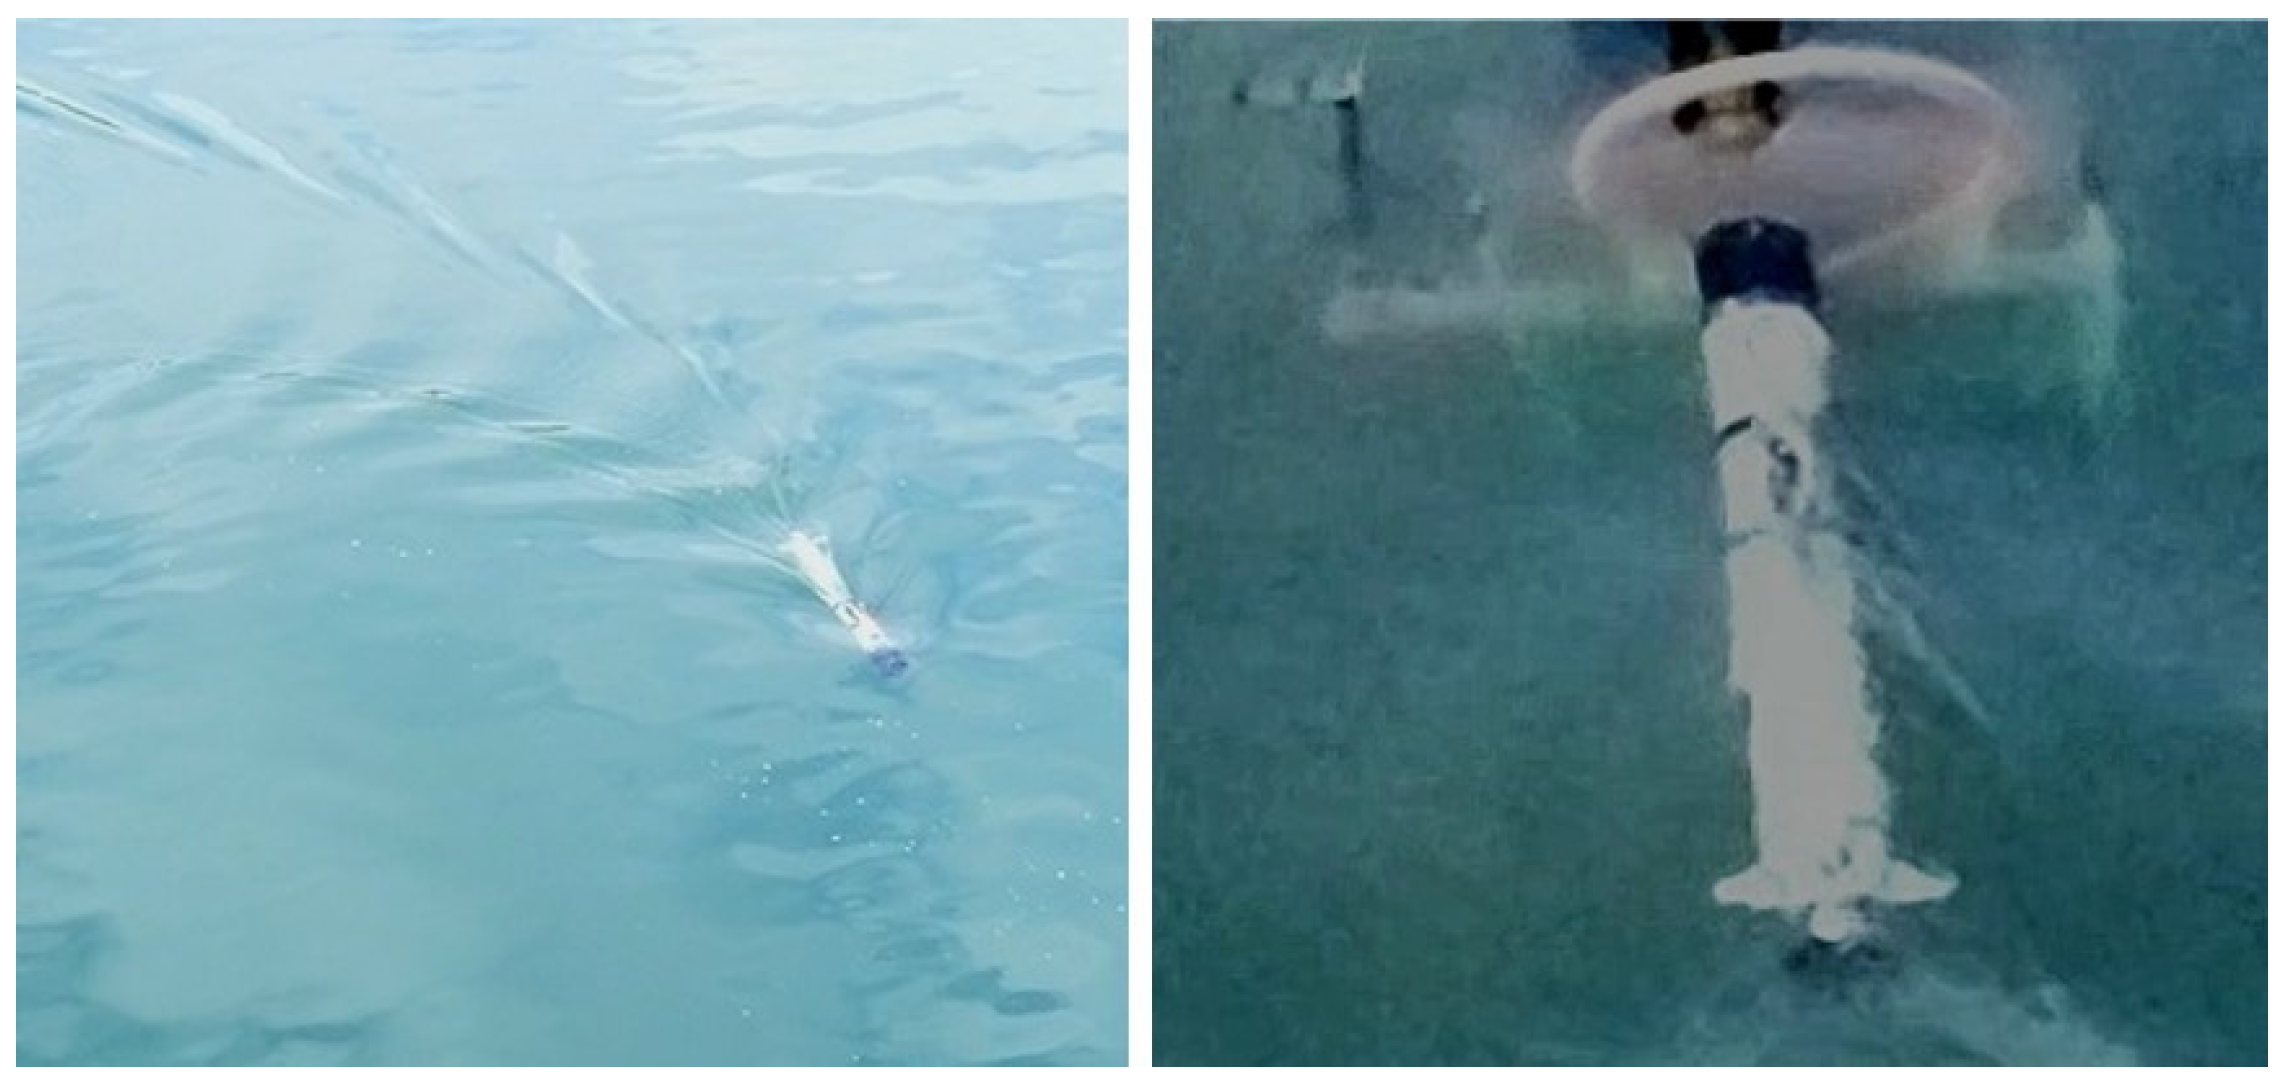
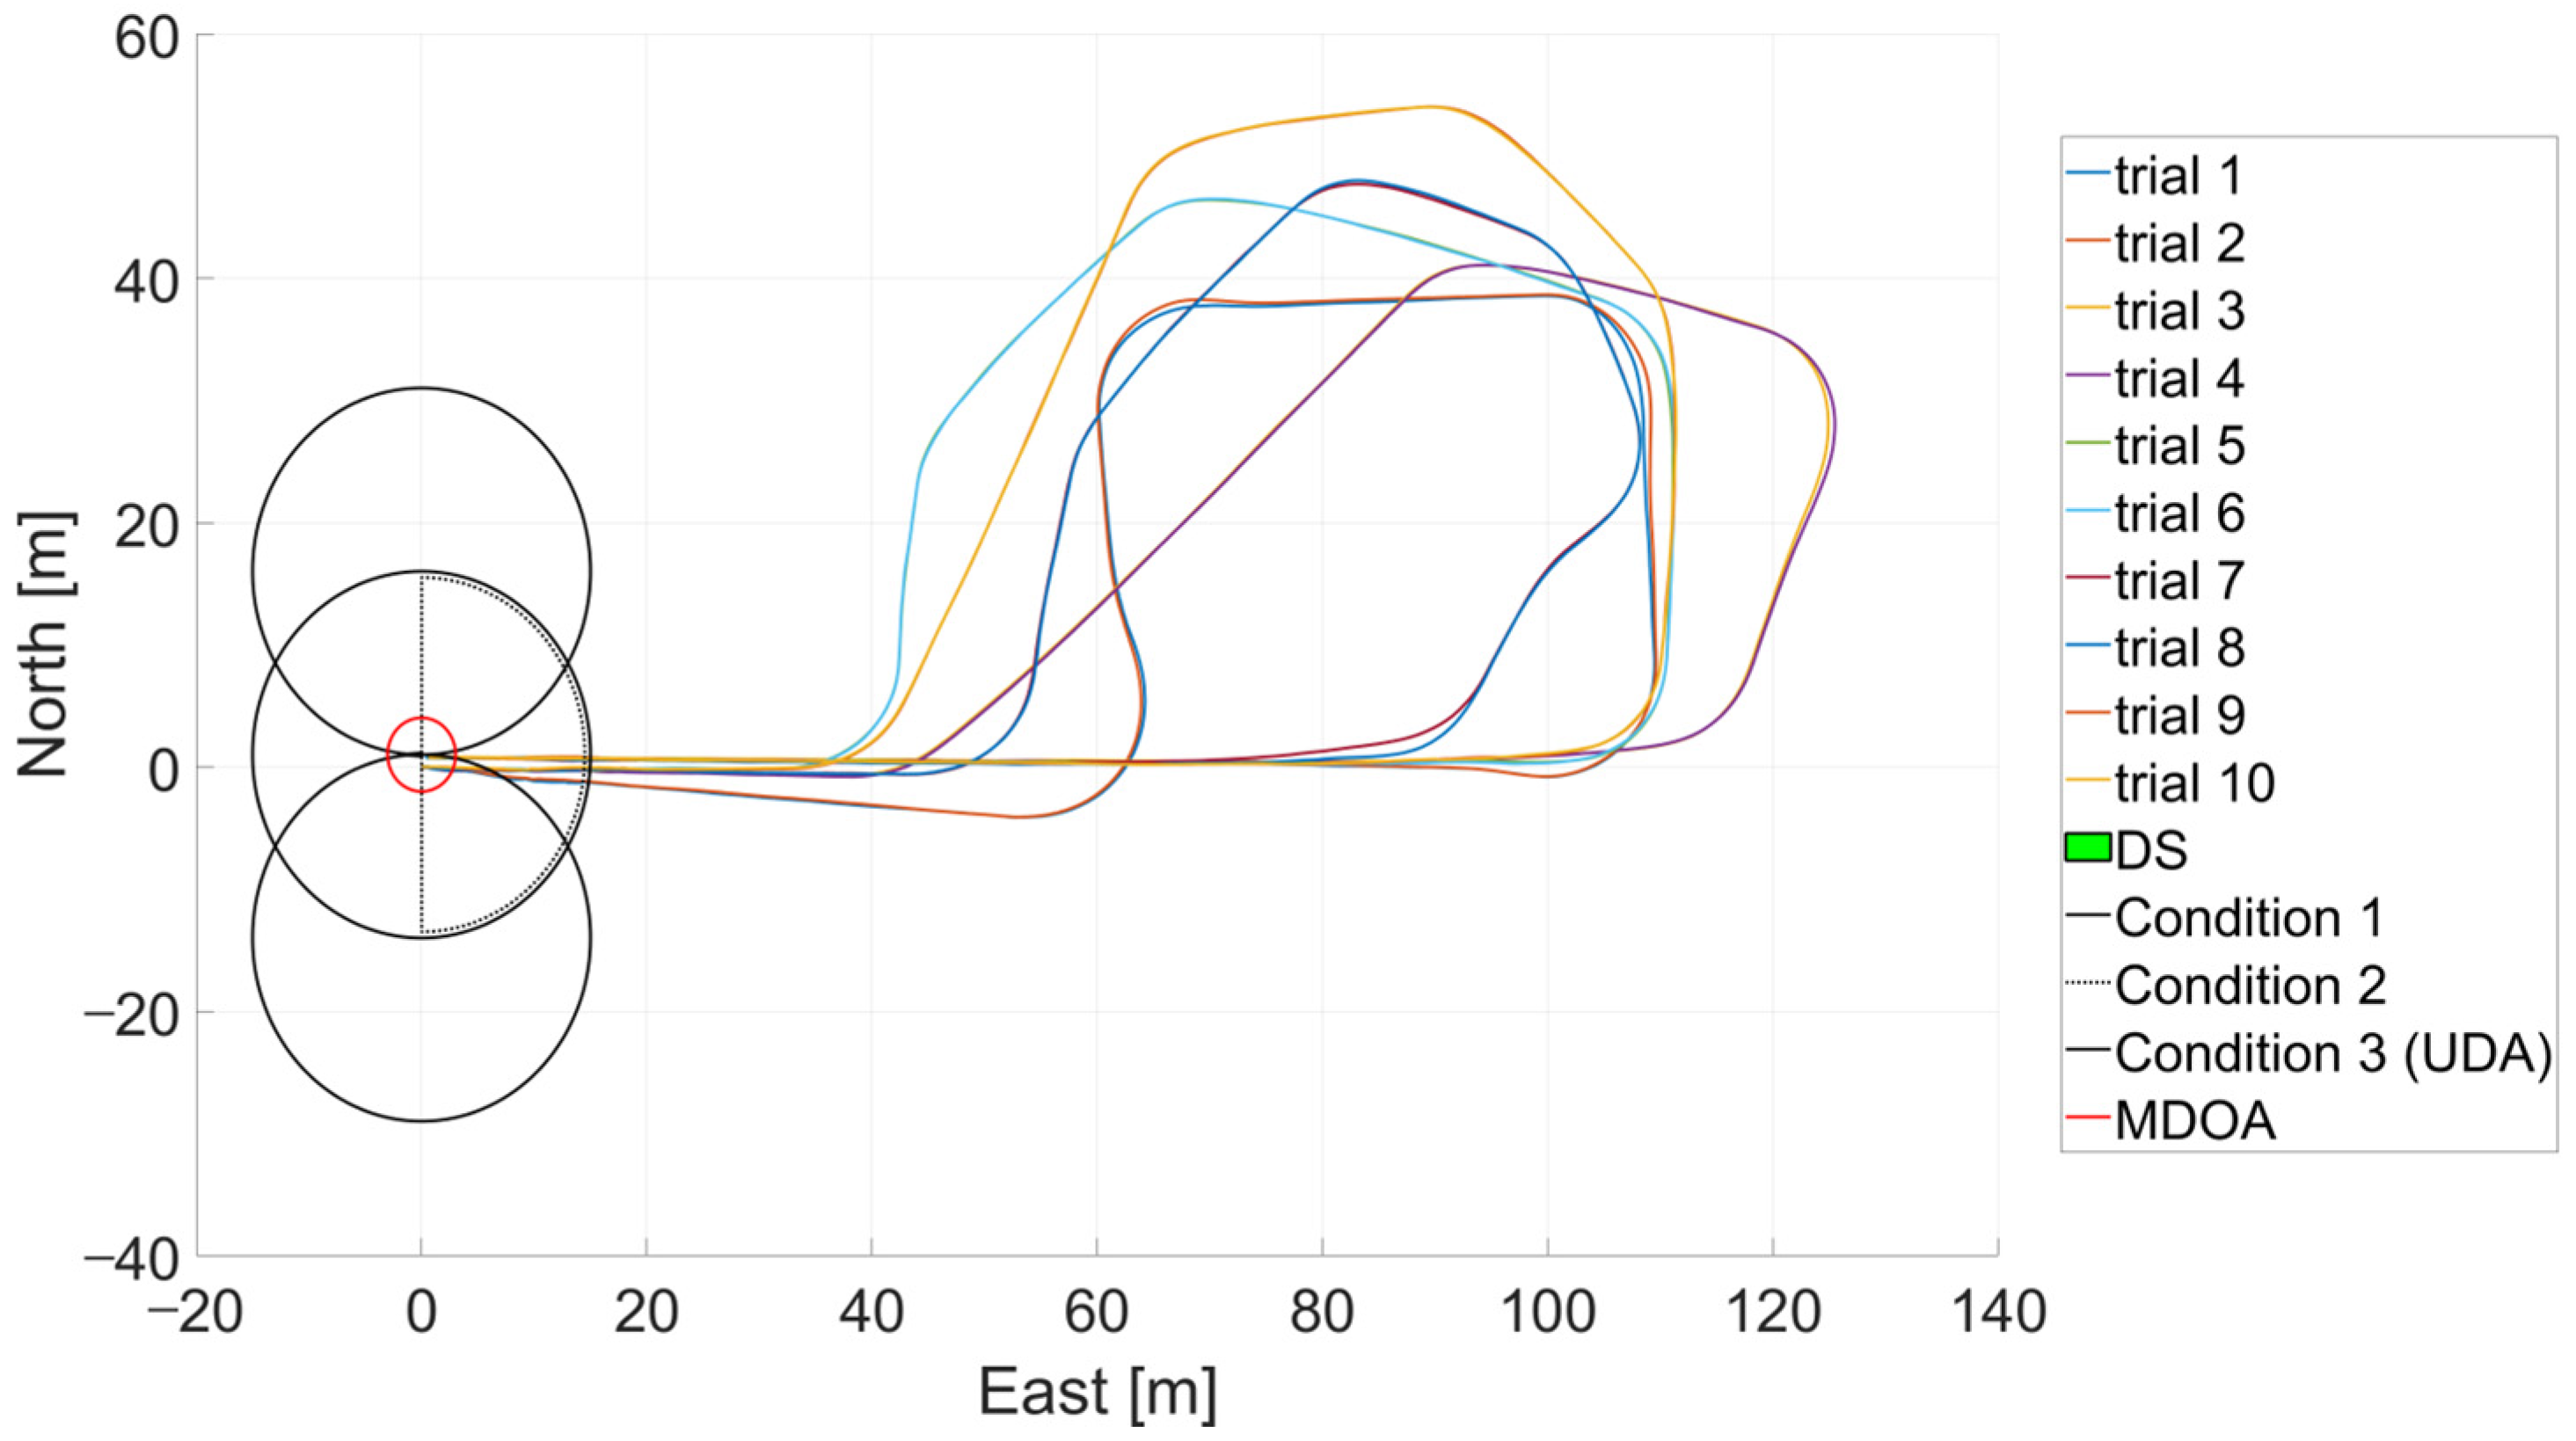
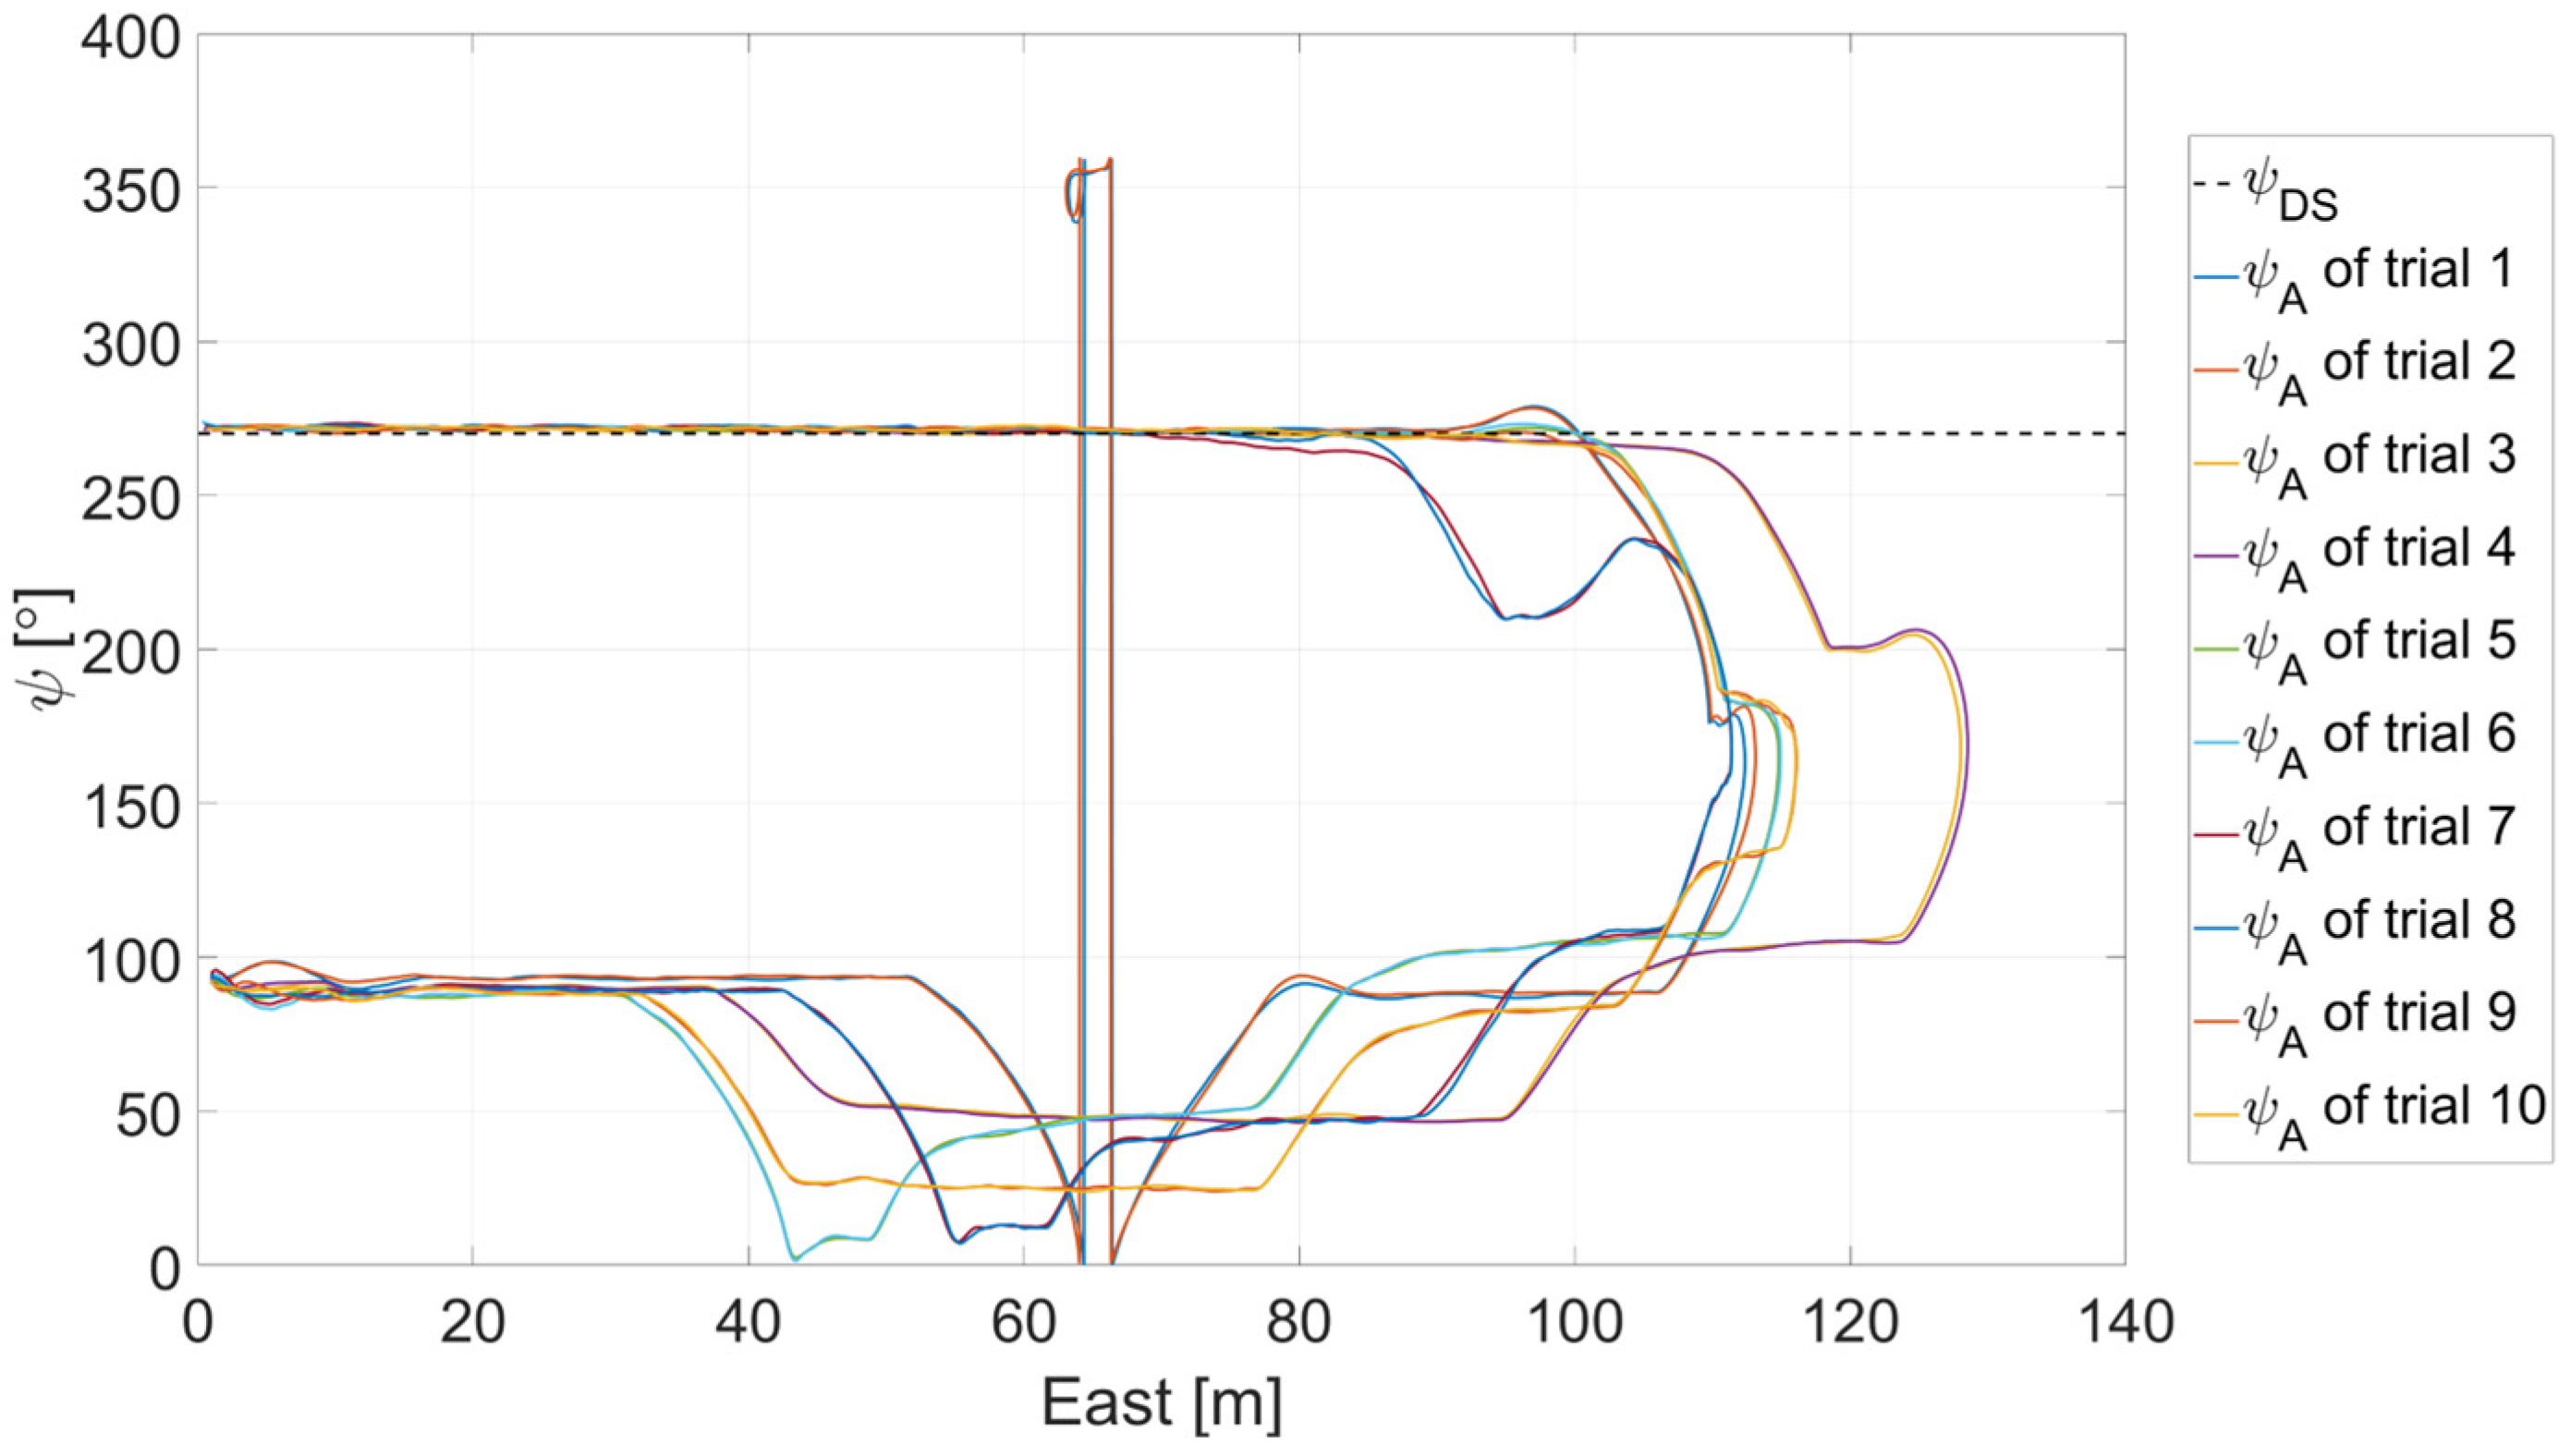
An experiment was conducted in a water tank to validate the functionality of the probability computation algorithm and check the probability-based index that varies with the hyperparameter k . A DS, with an entrance radius of 0.3 m , was installed at the end of the centerline of the water tank on the horizontal plane, and the local coordinate system was set as shown in Figure 5. The heading angle of the DS was set to 180 ° relative to the Y axis in the local coordinate system. An AUV, with a diameter of 0.2 m , was fixed to the hoist with its heading angle consistent with the DS, and data were obtained by moving the hoist such that the position of the AUV conformed to preset paths.
Figure 6 shows the change in position of the AUV with respect to the DAA. Here, the MTR of the AUV is 15 m . Figure 7 and Figure 8 show the changes in assessment criteria and states that occur as the separation between the AUV and the DS decreases. The results of the docking probability computation for each path, according to the CI levels of the normal distribution function at the assessment start point (ASP) and assessment end point (AEP), are shown in Table 1, Table 2 and Table 3. The CI level for determining the standard deviation of the normal distribution function during assessment was reviewed based on these data.
As shown in Figure 7, the position change along Path 1 is nearly identical to the center of the DAA, which is the position assessment criterion. This resulted in a 100% match with the criterion at both the ASP and AEP, regardless of the CI level. Similarly, in Figure 8, the heading angle is also nearly identical to the heading angle criterion, with a 100% match with the criterion. Consequently, the probability of docking appears to be 100%. For Paths 2 and 3, in contrast to Path 1, the AUV moves in states that deviate from the center of the DAA. In the initial state of the assessment for both states, the degree of deviation is relatively small compared to the width of the DAA. Therefore, the deviation does not significantly affect the assessment result, resulting in a high degree of match. However, as the distance between the AUV and DS decreases, so does the width of the DAA. Consequently, even though the deviation does not change, the AUV gradually approaches the boundary of the DAA, eventually leaving the DAA. The degree of match for the heading angle also gradually decreases. This is because the heading angle assessment criterion changes as the separation decreases, but the heading angle of the AUV remains the same. As a result, it is confirmed that the deviation has an inversely proportional effect on the separation between the AUV and the DS in relation to the assessment results.
The results from Path 1–3 show how the degree of state matching changes with varying assessment range while the AUV maintains a consistent deviation from the center of the DAA. In contrast, Path 4 is a route that crosses the DAA. Figure 9, Figure 10 and Figure 11 show how the degree of state matching and the probability of docking change as the deviation near the entrance area of the DS changes. In the result of the position assessment, a high degree of match is observed within the area corresponding to the entrance area of the DS. However, in the case of the heading angle assessment, a larger deviation occurs compared to the deviation in the position assessment. Consequently, a greater decrease in the degree of matching is observed, even within the entrance area of the DS. Even so, it is evident that if the heading angle had been directed towards the DS during the movement, there would have been a wider section with a higher degree of match.
Based on these results, two analyses can be deduced. Firstly, an increasing deviation from the criterion results in a decrease in the degree of state matching. Secondly, the deviation greatly affects the degree of state matching as the distance between the AUV and the DS decreases. Based on these factors, it is validated that the designed assessment method assesses the real-time states of the AUV by calculating the degree of state matching with the assessment criteria as intended. Since the designed assessment criteria represent the ideal states for reaching the DS based on the real-time state of the AUV, this indicates that the designed assessment method serves as a means to assess the real-time feasibility for docking. Therefore, the result of the assessment can be used to determine whether or not to dock until the AUV reaches the MDOA.
Moreover, a simple inference for the CI level can be drawn. When the AUV aligns with the heading angle condition, it can reach the DS at the boundary of the DAA. However, during the functional test, the heading angle of the AUV was constrained to match that of the DS. As a result, in Paths 2 and 3, the AUV satisfied the position condition but not the heading angle condition. Therefore, for an AUV located at the boundary of the DAA, the position match should be 50% or higher, while the heading angle match should be less than 50%. To reflect this in the assessment results, the CI level should be set at 80% or higher.

3.2. Field Test

An experiment was conducted in a real sea environment to validate the proposed assessment method and index (Figure 12). The AUV performed a total of 10 docking attempts, with two trials for each of the five paths, navigating straight from the last waypoint to the DS, as shown in Figure 13 and Figure 14. Due to the need for visual confirmation of successful docking at a shallow diving depth, an actual DS could not be used. Instead, a test module with the same entrance radius was utilized. The test module was positioned at coordinates (0, 1) m relative to the starting point, with a heading angle of 270 ° . The operating range of the docking guidance sensor was 15 m and, in accordance with Equation (8), the MDOA was 3.015 m . During the test, the AUV successfully docked in the test module nine out of ten times, failing in the second trial, resulting in a 90% success rate. This success rate was compared with the estimated probability-based index for each CI level, referring to the analysis results from the functional test.
It was confirmed in the functional test that the CI level for the normal distribution function should be higher than 80%. Therefore, assessments were made only at CI levels of 80%, 90%, and 99% in the field test. Table 4 and Table 5 display the degrees of position and heading angle matching of the AUV at the ASP and AEP. Table 6 lists the corresponding probabilities of docking. Comparing the degree of state matching and probability of docking at the AEP for each CI level with the success rate obtained through experiments, it can be seen that the results are most similar when the CI level is 90%. Therefore, if the normal distribution function in the state assessment is designed based on the corresponding CI level, the resulting probability of docking closely resembles the actual probability.

4. Conclusions

This paper presents a simple but effective assessment method for the underwater docking process of a torpedo-type AUV to a funnel-shaped DS. This method accounts for the maneuvering constraints due to the underactuated characteristics of the AUV and defines a specific assessment area. Within this area, the assessment is made for the position and heading angle of the AUV. The assessment results are expressed as probabilistic figures, indicating the degree of matching between the current states of the AUV and the ideal states for docking. To represent the results as probabilistic figures, the normal distribution function is employed, which is projected onto the assessment range that decreases with distance between the AUV and the DS. Ultimately, the probability of docking is estimated based on these degrees of state matching.
A reasonable confidence interval (CI) level for the normal distribution function is determined through the analysis of data obtained from functional tests. By comparing the success rate of underwater docking in real sea experiments with the probability-based index derived from the assessment, it was found that setting the CI level to 90% results in the index closely matching the success rate of docking. This confirms the effectiveness of the proposed assessment method and the validity of the index. If the index is equal to or exceeds the pre-defined threshold, the docking can be considered successful. Otherwise, if the index is lower, the AUV can perform a turn before reaching the MDOA to avoid collisions with the DS. The analysis of experimental results demonstrates that the probability-based index has the potential to serve as a standard for successful underwater docking of AUVs. Furthermore, the proposed assessment method proves its applicability to various unmanned systems striving to reach their destinations.
The main limitation of this algorithm is its failure to consider the performance of the sensors mounted on the AUV and DS, even though the assessment relies on them. To address this, future research will prioritize incorporating the error performance of sensors utilized in the docking process into the assessment process, thereby enhancing the credibility of the estimated probability of docking.

Author Contributions

Conceptualization, S.-J.C.; methodology, S.-J.C., J.-Y.K., H.-S.C. and J.-H.K.; software, S.-J.C.; validation, S.-J.C. and J.-Y.K.; formal analysis, S.-J.C. and H.-S.C.; investigation, S.-J.C.; writing—original draft preparation, S.-J.C.; writing—review and editing, S.-J.C., J.-Y.K. and H.-S.C.; supervision, J.-H.K.; project administration, J.-Y.K. All authors have read and agreed to the published version of the manuscript.

Funding

This research was supported by AUV Fleet and its Operation System Development for Quick Response of Search on Marine Disasters of Korea Institute of Marine Science & Technology Promotion (KIMST) funded by the Korea Coast Guard Agency (KIMST-20210547). Also, it was supported by Unmanned Vehicles Core Technology Research and Development Program through the National Research Foundation of Korea (NRF) and Unmanned Vehicle Advanced Research Center (UVARC) funded by the Ministry of Science and ICT, the Republic of Korea (NRF-2020M3C1C1A02086321).

Institutional Review Board Statement

Not applicable.

Informed Consent Statement

Not applicable.

Data Availability Statement

Not applicable.

Conflicts of Interest

The authors declare no conflict of interest.

References

  1. Li, D.; Wang, P.; Du, L. Path-planning technologies for autonomous underwater vehicles—A review. IEEE Access 2018, 7, 9745–9768. [Google Scholar] [CrossRef]
  2. Yazdani, A.M.; Sammut, K.; Yakimenko, O.; Lammas, A. A survey of underwater docking guidance systems. Robot. Auton. Syst. 2020, 124, 103382. [Google Scholar] [CrossRef]
  3. Yazdani, A.M.; Sammut, K.; Yakimenko, O.A.; Lammas, A. Feasibility analysis of using the hp-adaptive Radau pseudospectral method for minimum-effort collision-free docking operations of AUV. Robot. Auton. Syst. 2020, 133, 103641. [Google Scholar] [CrossRef]
  4. Chen, G.; Shen, Y.; Qu, N.; He, B. Path planning of AUV during diving process based on behavioral decision-making. Ocean Eng. 2021, 234, 109073. [Google Scholar] [CrossRef]
  5. Liu, C.; Fan, S.; Li, B.; Chen, S.; Xu, Y.; Xu, W. Path planning for autonomous underwater vehicle docking in stationary obstacle environment. In Proceedings of the Shanghai: OCEANS, Shanghai, China, 10–13 April 2016; IEEE Publications: New York, NY, USA, 2016; pp. 1–5. [Google Scholar] [CrossRef]
  6. Xie, T.; Li, Y.; Jiang, Y.; Pang, S.; Wu, H. Turning circle based trajectory planning method of an underactuated AUV for the mobile docking mission. Ocean Eng. 2021, 236, 109546. [Google Scholar] [CrossRef]
  7. Page, B.R.; Lambert, R.; Chavez-Galaviz, J.; Mahmoudian, N. Underwater docking approach and homing to enable persistent operation. Front. Robot. AI 2021, 8, 621755. [Google Scholar] [CrossRef]
  8. González-García, J.; Gómez-Espinosa, A.; Cuan-Urquizo, E.; García-Valdovinos, L.G.; Salgado-Jiménez, T.; Cabello, J.A.E. Autonomous underwater vehicles: Localization, navigation, and communication for collaborative missions. Appl. Sci. 2020, 10, 1256. [Google Scholar] [CrossRef]
  9. Horner, D.; Mqana, M.K. Moving horizon estimation for undersea docking. In Proceedings of the Oceans 2017, Aberdeen, UK, 19–22 June 2017; IEEE Publications: New York, NY, USA, 2017; pp. 1–8. [Google Scholar] [CrossRef]
  10. Ghosh, S.; Ray, R.; Vadali, S.R.K.; Shome, S.N.; Nandy, S. Reliable pose estimation of underwater dock using single camera: A scene invariant approach. Mach. Vis. Appl. 2016, 27, 221–236. [Google Scholar] [CrossRef]
  11. Fan, S.; Liu, C.; Li, B.; Xu, Y.; Xu, W. AUV docking based on USBL navigation and vision guidance. J. Mar. Sci. Technol. 2019, 24, 673–685. [Google Scholar] [CrossRef]
  12. Boyer, F.; Lebastard, V.; Chevallereau, C.; Mintchev, S.; Stefanini, C. Underwater navigation based on passive electric sense: New perspectives for underwater docking. Int. J. Robot. Res. 2015, 34, 1228–1250. [Google Scholar] [CrossRef]
  13. Park, J.-Y.; Jun, B.-H.; Lee, P.-M.; Lim, Y.-K.; Oh, J. Docking problem and guidance laws considering drift for an underactuated AUV. In Proceedings of the Spain: OCEANS, Santander, Spain, 6–9 June 2011; IEEE Publications: New York, NY, USA, 2011; pp. 1–7. [Google Scholar] [CrossRef]
  14. Sans-Muntadas, A.; Pettersen, K.Y.; Brekke, E.; Henriksen, V.F. A hybrid approach to underwater docking of AUVs with cross-current. In Proceedings of the OCEANS 2016 MTS/IEEE Monterey, Monterey, CA, USA, 19–23 September 2016; IEEE Publications: New York, NY, USA, 2016; pp. 1–7. [Google Scholar] [CrossRef]
  15. Fan, S.; Li, B.; Xu, W.; Xu, Y. Impact of current disturbances on AUV docking: Model-based motion prediction and countering approaches. IEEE J. Ocean. Eng. 2017, 43, 888–904. [Google Scholar] [CrossRef]
  16. Li, B.; Xu, Y.; Fan, S.; Xu, W. Underwater docking of an under-actuated autonomous underwater vehicle: System design and control implementation. Front. Inf. Technol. Electron. Eng. 2018, 19, 1024–1041. [Google Scholar] [CrossRef]
  17. Wu, L.; Li, Y.; Su, S.; Yan, P.; Qin, Y. Hydrodynamic analysis of AUV underwater docking with a cone-shaped dock under ocean currents. Ocean Eng. 2014, 85, 110–126. [Google Scholar] [CrossRef]
  18. Teo, K.; An, E.; Beaujean, P.-P.J. A robust fuzzy autonomous underwater vehicle (AUV) docking approach for unknown current disturbances. IEEE J. Ocean. Eng. 2012, 37, 143–155. [Google Scholar] [CrossRef]
  19. Esteba, J.; Cieślak, P.; Palomeras, N.; Ridao, P. Docking of non-holonomic AUVs in presence of ocean currents: A comparative survey. IEEE Access 2021, 9, 86607–86631. [Google Scholar] [CrossRef]
  20. Park, J.; Kim, J. Autonomous Docking of an Unmanned Surface Vehicle based on Reachability Analysis. In Proceedings of the 2020 20th International Conference on Control, Automation and Systems (ICCAS), Busan, Republic of Korea, 13–16 October 2020; pp. 962–966. [Google Scholar] [CrossRef]
  21. Cho, G.R.; Li, J.-H.; Park, D.; Jung, J.H. Robust trajectory tracking of autonomous underwater vehicles using back-stepping control and time delay estimation. Ocean Eng. 2020, 201, 107131. [Google Scholar] [CrossRef]
  22. Zhang, T.; Li, D.; Yang, C. Study on impact process of AUV underwater docking with a cone-shaped dock. Ocean Eng. 2017, 130, 176–187. [Google Scholar] [CrossRef]
  23. Sans-Muntadas, A.; Brekke, E.F.; Hegrenaes, Ø.; Pettersen, K.Y. Navigation and probability assessment for successful AUV docking using USBL. IFAC-PapersOnLine 2015, 48, 204–209. [Google Scholar] [CrossRef]
  24. Vu, M.T.; Choi, H.S.; Nhat, T.Q.M.; Nguyen, N.D.; Lee, S.D.; Le, T.H.; Sur, J. Docking assessment algorithm for autonomous underwater vehicles. Appl. Ocean Res. 2020, 100, 102180. [Google Scholar] [CrossRef]
Figure 1. Minimum turning radius (MTR) of the autonomous underwater vehicle (AUV) and the corresponding trajectory (MTRP).
Jmse 11 02127 g001
Figure 2. Docking assessment area (DAA).
Jmse 11 02127 g002
Figure 3. Normal distribution function defined within a limited zone according to the confidence interval (CI) level.
Jmse 11 02127 g003
Figure 4. Minimum distance for optimal avoidance (MDOA).
Jmse 11 02127 g004
Figure 5. Composition of the water tank environment for functional test.
Jmse 11 02127 g005
Figure 6. Changes in the position of the AUV by path acquired in the functional test.
Jmse 11 02127 g006
Figure 7. Position changes within the assessment range for each path.
Jmse 11 02127 g007
Figure 8. Heading angle changes within the assessment range for each path.
Jmse 11 02127 g008
Figure 9. Position assessment results for Path 4.
Jmse 11 02127 g009
Figure 10. Heading angle assessment results for Path 4.
Jmse 11 02127 g010
Figure 11. Probability of docking for Path 4.
Jmse 11 02127 g011
Figure 12. Field test of the underwater docking.
Jmse 11 02127 g012
Figure 13. Changes in position of each trial.
Jmse 11 02127 g013
Figure 14. Changes in heading angle of each trial.
Jmse 11 02127 g014
Table 1. Acquired data from Path 1 of the functional test.
CI LevelASPAEP
P p   ( % ) P ψ   ( % ) P D   ( % ) P p   ( % ) P ψ   ( % ) P D   ( % )
50%100.00100.00100.00100.00100.00100.00
60%100.00100.00100.00100.00100.00100.00
70%100.00100.00100.00100.00100.00100.00
80%100.00100.00100.00100.00100.00100.00
90%100.00100.00100.00100.00100.00100.00
99%100.00100.00100.00100.00100.00100.00
Table 2. Acquired data from Path 2 of the functional test.
CI LevelASPAEP
P p   ( % ) P ψ   ( % ) P D   ( % ) P p   ( % ) P ψ   ( % ) P D   ( % )
50%99.9099.8599.8889.3180.5784.83
60%99.8599.7799.8183.3271.3877.35
70%99.7799.6599.7176.5259.9767.74
80%99.6599.4699.5566.4345.7755.14
90%99.4299.1199.2750.9927.6137.52
99%98.5997.8698.2219.404.359.19
Table 3. Acquired data from Path 3 of the functional test.
CI LevelASPAEP
P p   ( % ) P ψ   ( % ) P D   ( % ) P p   ( % ) P ψ   ( % ) P D   ( % )
50%99.4699.3799.4284.6980.4882.56
60%99.1799.0299.0977.1571.2574.14
70%98.7498.5198.6267.4759.8063.52
80%98.0897.7497.9154.8145.5849.98
90%96.8596.3096.5837.1627.4231.92
99%92.5191.2391.868.974.286.19
Table 4. Degree of position matching ( P p ) of each trial.
TrialCI Level
80%90%99%
ASP
(%)
AEP
(%)
ASP
(%)
AEP
(%)
ASP
(%)
AEP
(%)
199.9960100.0099.9934100.0099.9839100.00
2100.00100.00100.00100.00100.00100.00
399.9991100.0099.9985100.0099.9963100.00
499.9838100.0099.9734100.0099.9352100.00
599.9876100.0099.9795100.0099.9501100.00
699.9881100.0099.9805100.0099.9524100.00
799.9612100.0099.9361100.0099.8444100.00
899.9753100.0099.9593100.0099.9009100.00
999.9926100.0099.9878100.0099.9704100.00
1099.9922100.0099.9871100.0099.9685100.00
Avg.99.9876100.0099.9796100.0099.9502100.00
Table 5. Degree of heading angle matching ( P ψ ) of each trial.
TrialCI Level
80%90%99%
ASP
(%)
AEP
(%)
ASP
(%)
AEP
(%)
ASP
(%)
AEP
(%)
1100.0085.3578100.0077.0537100.0053.0064
299.996198.772899.993697.987499.984495.1697
3100.0096.1025100.0093.6641100.0085.2663
499.998691.828599.997786.904799.994471.0498
5100.0086.1365100.0078.2145100.0054.9721
699.994288.627899.990481.973899.976761.6925
7100.0080.3448100.0069.7435100.0041.5854
8100.0082.4647100.0072.8010100.0046.1624
9100.0089.7582100.0083.7024100.0064.8421
1099.997185.129099.995276.713999.988252.4391
Avg.99.998688.452399.997781.875999.994462.6186
Table 6. Probability of docking ( P D ) of each trial.
TrialCI Level
80%90%99%
ASP
(%)
AEP
(%)
ASP
(%)
AEP
(%)
ASP
(%)
AEP
(%)
199.998092.389399.996787.780299.992072.8055
299.998199.384599.996898.988699.992297.5550
399.999598.031999.999296.780299.998192.3398
499.991295.827299.985593.222799.964884.2910
599.993892.809899.989888.439099.975074.1432
699.991294.142399.985490.539499.964678.5044
799.980689.635399.968083.513799.922264.4867
899.987690.810199.979685.323599.950467.9429
999.996394.740899.993991.489099.985280.5246
1099.994692.265499.991187.586599.978472.4148
Avg.99.993194.003799.988690.366399.972378.5008
Disclaimer/Publisher’s Note: The statements, opinions and data contained in all publications are solely those of the individual author(s) and contributor(s) and not of MDPI and/or the editor(s). MDPI and/or the editor(s) disclaim responsibility for any injury to people or property resulting from any ideas, methods, instructions or products referred to in the content.

