1. Introduction
According to the International Maritime Organization, international shipping is currently responsible for
of global trade and is the most efficient and cost-effective form of long-distance transportation [
1]. Despite international efforts to combat maritime piracy, it remains a serious threat to international shipping and is estimated to have a global financial impact of up to 16 billion dollars annually [
2]. Accidents such as collisions or groundings can lead to the loss of lives, environmental damage, and disruption of trade routes [
3,
4]. Furthermore, it is estimated that one fifth of all wild-caught fish is caught illegally or not reported, endangering marine ecosystems and resulting in industry losses upwards of 23.5 billion dollars [
5]. Most recently, the sabotage of the Nord Stream gas pipelines in the Baltic Sea [
6] has raised the issue of territorial protection and protection of key infrastructure assets. These vulnerabilities in our society highlight the need for maritime security, safety, and threat assessment, to protect the stability of the global supply chain and key infrastructure.
Real-life maritime laws and regulations are complex. While commercial vessels such as cargo and tankers mainly follow well-defined shipping lanes with near-constant speeds, other ship types, such as fishing vessels and sailing ships, have fewer constraints and more complex behaviors. Maritime security requires extensive knowledge of maritime traffic patterns. Research in this field has gained momentum over the past decade, thanks to the advent of the Automatic Identification System (AIS) [
7]. The AIS is compulsory for all vessels that exceed a certain tonnage, and it provides hundreds of millions of messages every day on a global scale [
8]. The data include static information, such as the unique identifier of the ships (MMSI), size, and dynamic information such as Global Positioning System (GPS) coordinates, speed, course, etc. The AIS forms the basis for modern maritime trajectory data collection, which allows one to model navigational characteristics and rules. The wide variety of possible maritime behaviors means that the most common method of analysis remains clustering, either of individual AIS updates [
9,
10] or of trajectories compared using specific similarity measures [
11,
12].
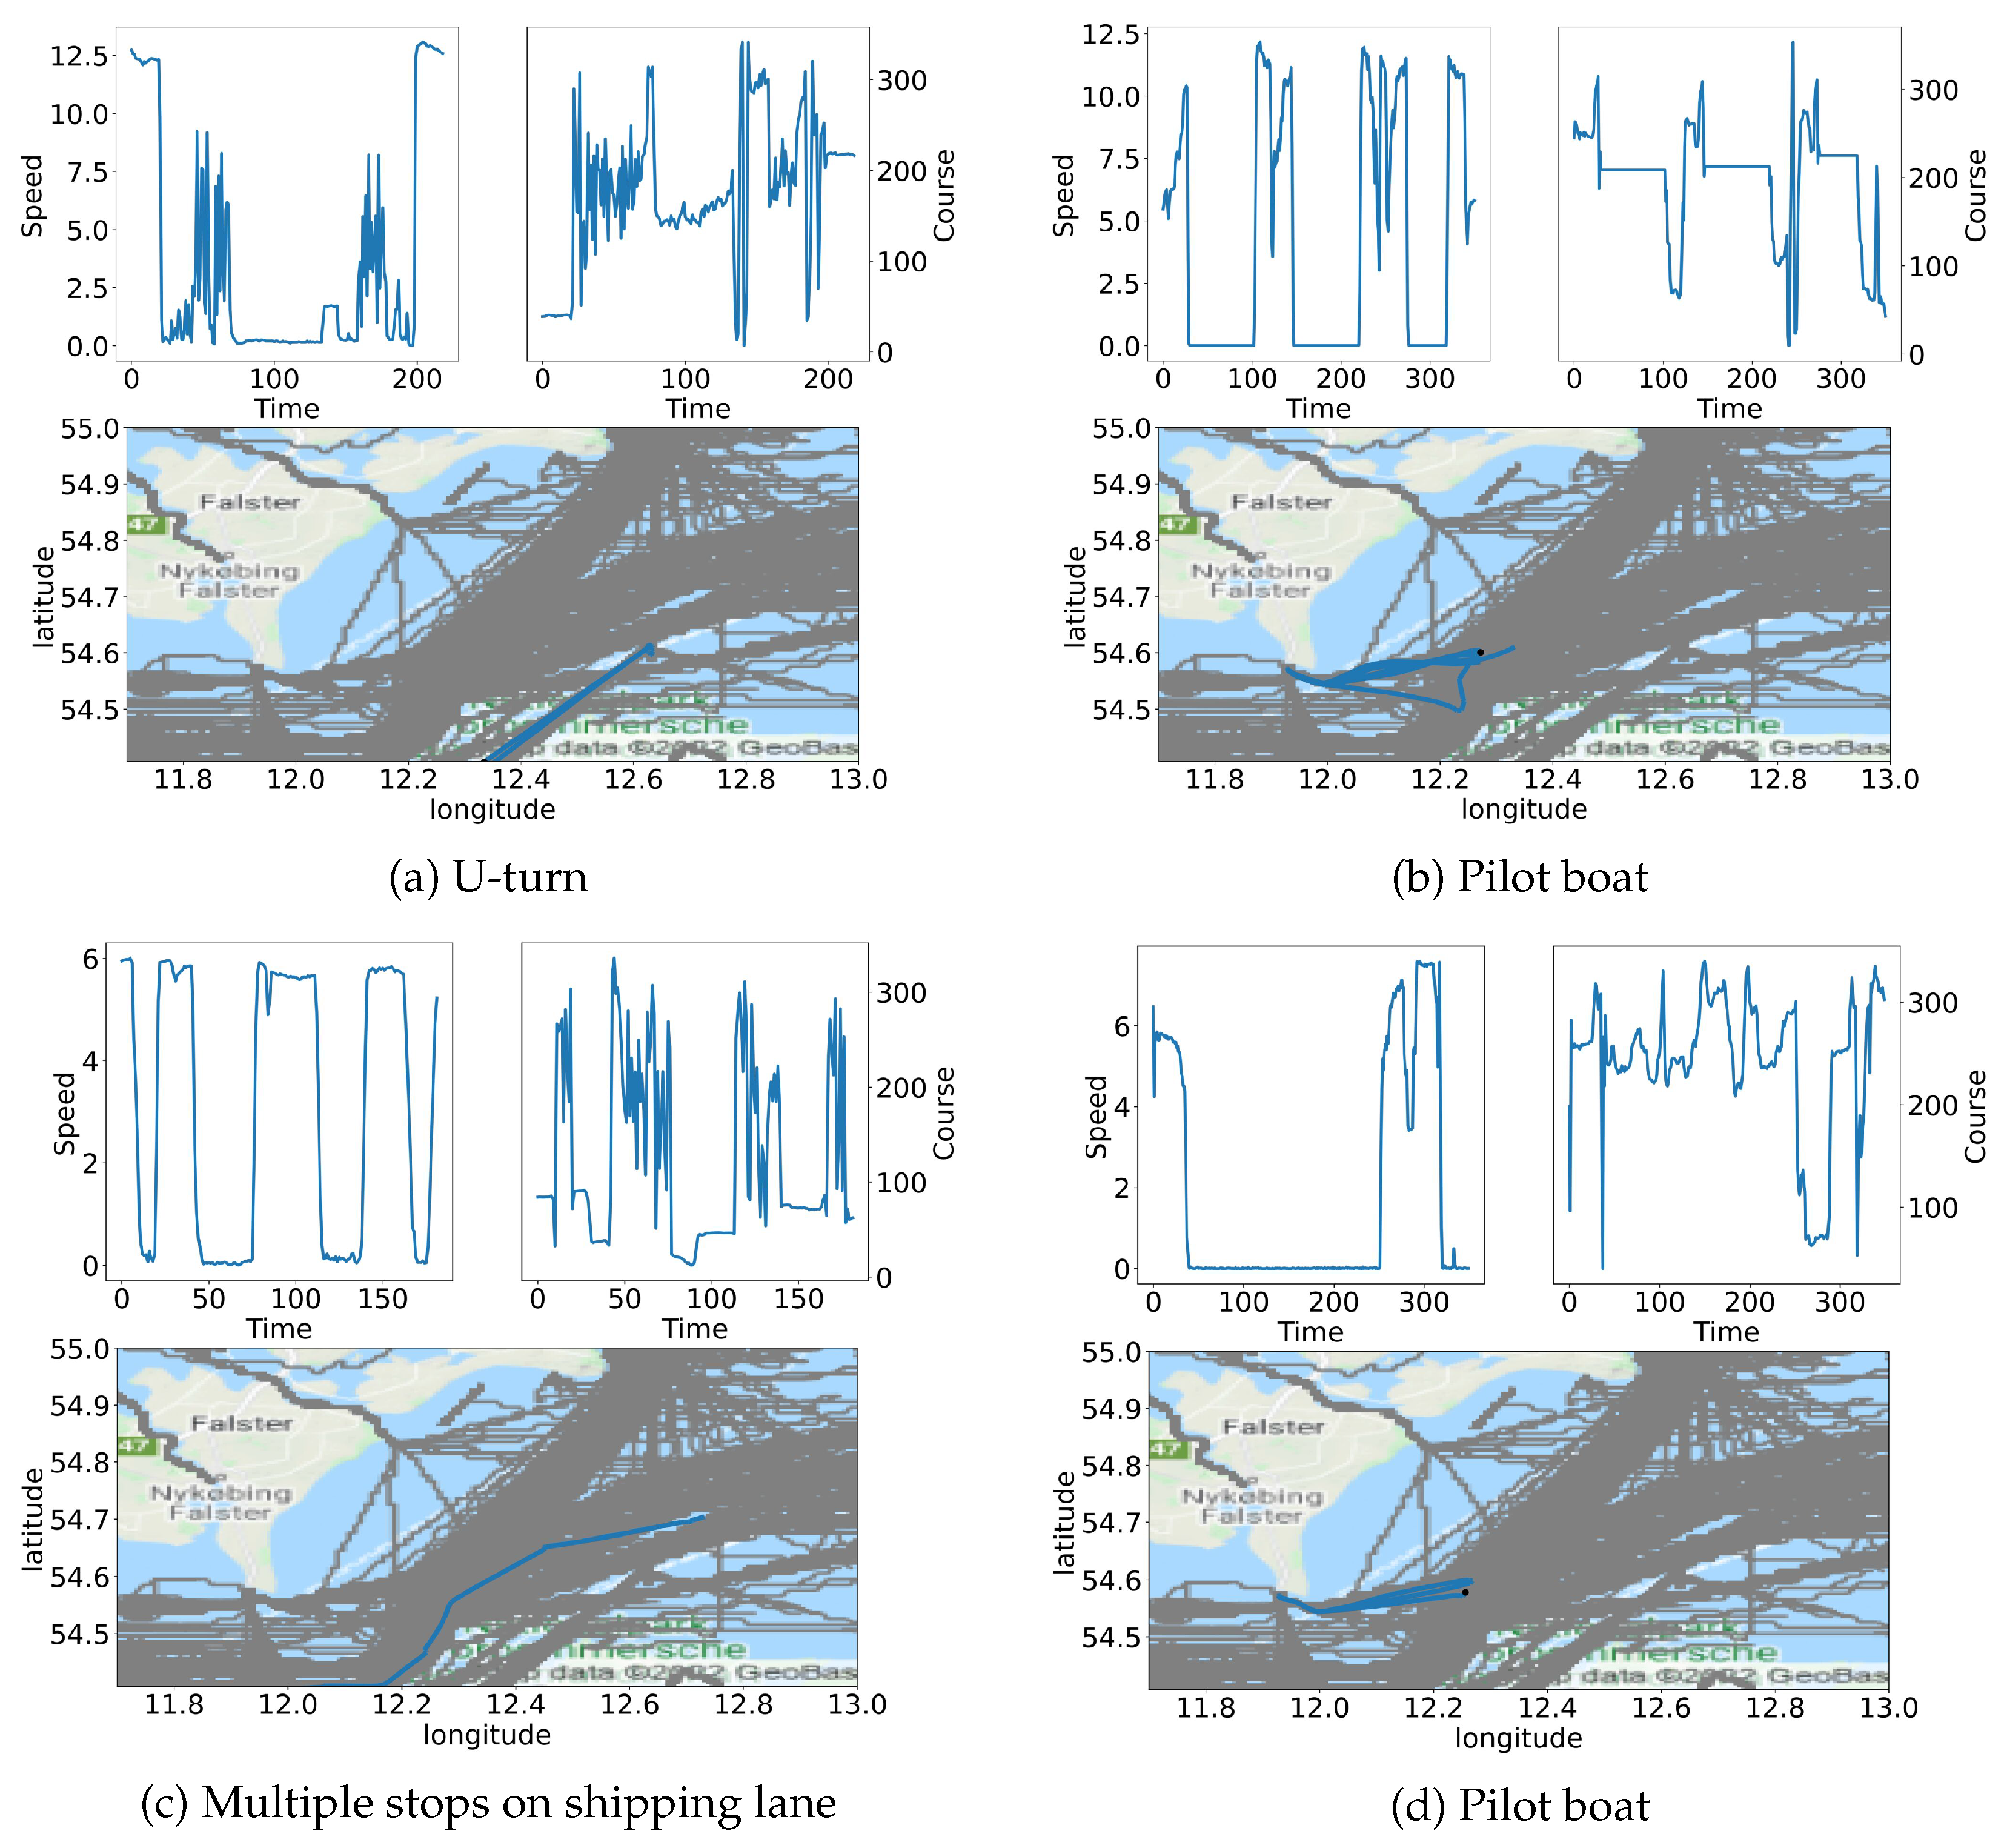
Dense and critical maritime areas are constantly monitored, but the ever-increasing traffic and amount of data call for automatic decision support for Vessel Traffic Service (VTS) operators. In practice, whether or not an event is abnormal is a combination of several factors: the location, the speed, the course, the type of vessel, and the time of day/week/year, etc. For instance, in specific locations, pilot boats steam between harbors and commercial traffic in the shipping lanes, but in other locations or for different ship types, this type of behavior may be highly unexpected. Similarly, it can be expected that diving vessels perform frequent starts or stops to support divers in the water, but if this behavior occurs near major shipping lanes, it can be considered abnormal unless permission has been granted. Automatic detection of abnormal maritime behaviors is thus a difficult, ill-defined problem that requires the disentanglement of multiple possible explanatory factors, of which location, kinematic behavior, and type of ship are the most important.
Previous works have shown that shipping lanes can be identified using only a positional clustering of vessels [
9,
11,
13]. However, to disentangle traffic not constrained to major shipping lanes, the exact route is less important than the local kinematic behavior—that is, changes in speed and course [
10,
14]. Recently, deep neural network models have been suggested for abnormality detection of multiple ship types [
13,
15]. These models classify as anomalies the trajectories for which they fail to predict the future position or to make an adequate reconstruction. The main drawback here is the lack of interpretability as to why the networks fail to predict/reconstruct the correct trajectory. According to Riveiro et al. and Stach et al. [
16,
17], abnormality detection models should offer a large degree of interpretability, to accommodate any skepticism VTS operators may have, and they should promote human–machine interaction [
16,
17]. At the same time, recent research on dynamical decision making indicates that automated systems for decision making tend to perform poorly, as human operators simply copy the decision of the automated system [
18]. This causes a degradation of operator experience and makes human operators less likely to take over manual control when needed. Furthermore, many previous studies simplify their data, to focus on a restricted Region of Interest (ROI) and on a single aspect of maritime traffic—for instance, the behavior of commercial merchant traffic [
19] or port entry/exit ways [
11,
12,
20]. However, such restrictions hinder the evaluation of the practical viability of the methods. Stach et al. [
17] further highlighted the need for standardized datasets annotated with maritime abnormalities, to bridge the gap between research and practical implementation in VTS operations.
A precise definition of what constitutes a maritime abnormality is difficult to state. To this day, however, many maritime surveillance operations are conducted manually by military or law enforcement. Thus, the reasons for flagging a behavior as abnormal are often classified information, and the specific type of behavior that interests operators is not fully known. For this reason, obtaining a large list of annotated maritime trajectories for training or evaluation is often impossible. Previous works [
21,
22] have used simulated or self-annotated labels based on extreme values. However, extreme values might not define abnormal trajectories of operational interest for surveillance operators, who are ultimately interested in deterring illegal or dangerous activities, such as the earlier examples. As for unsupervised methods, the most common way to evaluate them is through qualitative examples [
15,
23,
24]. This form of verification illustrates the potential type of abnormal behavior that could be flagged. However, it completely negates the issue of false negatives, which in a military or law enforcement operation may be of greater importance. Ideally, abnormality detection algorithms would be evaluated on datasets with known behavior of operational interest to operators. These datasets should be annotated by subject matter experts, and the annotations should reflect the degree to which the operators find the behavior suspicious or otherwise abnormal.
In this paper, we aim to overcome two gaps in the current research on vessel traffic abnormality detection: the lack of interpretability and contextualization of the predictions and the size and quality of the datasets used for evaluation. First, we introduce an abnormality detection algorithm that provides an explanation of the closest expected/normal behaviors. The normalcy model is learned using a two-step clustering method that disentangles positional and kinematic behavior. The training is performed on historical AIS data and consists of two stages: in the first step, a clustering is learned based on the positional data of the trajectories; in the second step, each positional cluster is refined on the basis of the kinematics of its trajectories—that is, speed and course. The final clustering of the whole data is thus a summary of the typical behavioral patterns in the area. Concurrently, a Local Outlier Factor (LOF) [
25] is trained on each positional cluster, also based on the kinematic data, to detect trajectories with abnormal speed and course sequences. In a practical scenario, a new trajectory is first assigned to one of the positional clusters. If flagged as abnormal, using an LOF, it is brought to the attention of an operator who can further assess the situation, using the kinematic clustering of the positional cluster as support.
Next, we present and use for the evaluation two large hand-annotated AIS traffic datasets for abnormal maritime behavior detection that we have created, based on contextual knowledge of the environment and news events. These datasets contain more than 30,000 trajectories from 11 types of vessels and are expected to be of operational interest to operators. Labeled abnormalities cover a full day and include a collision accident, Search and Rescue activity, and deviating commercial traffic. The collision accident is by itself an important test case, but may also serve as a proxy evaluation method for the detection of rendezvous situations that are of interest in finding smuggling events. Similarly, Search and Rescue activity is always of interest, especially as similar behavioral patterns may be seen in more nefarious activities like smuggling and illegal mapping of the seabed or seafloor infrastructure [
26]. For the sake of reproducibility and to foster research on methods suitable to a real-world scale, we provide public access to the datasets. Further details are given in
Section 4.1.
We summarize our contributions as follows:
We present a novel method for detecting abnormal maritime trajectories based on two-step clustering, which also provides a contextual decision support tool to help a VTS operator make the final decision.
We design positional and kinematic similarity measures that focus on different dimensions of maritime trajectories.
We provide evidence that a multi-step clustering approach can disentangle positional and kinematic information, resulting in a better description of behavioral patterns in a large ROI.
We provide public access to datasets of preprocessed maritime trajectories in regions of Danish waters, including annotations during a Search and Rescue event.
The paper is organized as follows. In
Section 2, we provide an overview of the related work within trajectory clustering. In
Section 3, we present our proposed two-step clustering. In
Section 4, we give a detailed description of the maritime traffic datasets that we publish and that we also use to show the ability of our proposed method to disentangle maritime traffic patterns, as well as to detect real-life abnormal trajectories from a ship collision. Finally, we present our conclusion in
Section 5.
2. Related Work
Clustering of maritime trajectories has been widely employed to extract traffic patterns and find abnormal trajectories. The type of behavior discovered by clustering spatio-temporal trajectories depends heavily on the chosen similarity measure. Laxhammar et al. [
27] suggested using the maximum synchronous Euclidean distance between each pair of coinciding points along two trajectories of the same length. The requirements of equal trajectory length and synchronous comparison can be relaxed by using either the Hausdorff distance [
12,
19,
28], Dynamic Time Warping (DTW) [
11,
29], or the Longest Common Subsequence (LCSS) [
24] to measure trajectory similarity. The Hausdorff distance is independent of the time component, which can make trajectories following the same route in opposite directions indistinguishable. In addition, from the clusters reported in [
19], we note that the Hausdorff distance may assign a large similarity to significantly different trajectories. Additionally, both of these methods have quadratic time complexity, and several works, therefore, suggest a compression using the Douglas–Peucker (DP) algorithm [
30]. Klaas et al. [
29] proposed a two-stage DP algorithm: first, reducing the trajectory based on the speed time series and, secondly, based on the position. This two-stage approach was found to better retain periods of acceleration, such as stops.
Several different clustering algorithms have been applied to clustering of trajectories. Methods such as K-means [
29] and K-medoids [
28] have been utilized in collaboration with different similarity measures. However, density-based clustering techniques have long been the predominant approach to data mining within maritime trajectory analysis. Pallotta et al. [
31] proposed the widely used TREAD method, to cluster trajectories into traffic routes, which can then be used for anomaly detection and trajectory prediction. TREAD is a point-based method that extracts the coordinates of new entries, exits, and stops within the ROI. These points are clustered using DBSCAN [
32], to form waypoints in which ships enter, exit, or stop within the ROI. A route between waypoints is then formed whenever a certain number of transitions between them have been observed. Several works [
11,
12,
19,
24] have combined the idea of a similarity measure and density-based clustering. First, trajectories are simplified using the DP algorithm. The similarities are then computed using the Hausdorff distance, DTW, or LCSS, before being clustered by DBSCAN. Wang et al. [
19] considered a hierarchical search over the hyperparameters of DBSCAN, which allowed for groups with different densities, and helped to find clusters in sparsely populated geographical regions.
Recently, trajectory similarities based on deep learning have been suggested. Murray et al. [
13] clustered the latent encodings of a Recurrent Variational Autoencoder (RVAE) trained for trajectory reconstruction using hierarchical DBSCAN and found clusters corresponding to the major shipping lanes. The clusters were then used to train neural networks to predict the future position. Luo et al. [
33] proposed a graph-based trajectory contrastive learning framework. A Graph Neural Network encoder was trained, using contrastive learning with five different trajectory augmentations. The similarity of two trajectories could then be computed by their distances in the latent space. The method was evaluated by downsampling random trajectories from the training set as test trajectories. The proposed similarity measure was found to perform better than traditional trajectory distance measures.
The abovementioned approaches only considered the positional input, yielding clusters that mostly corresponded to the primary shipping lanes. Zhen et al. [
28] introduced the difference of the average course in their similarity measure, and Liu et al. [
10] extended the DBSCAN clustering model, to consider not only the geographical distance of the coordinates, but also the difference in speed and course. This allowed them to distinguish between shipping lanes in opposite directions and to find speed differences within the main shipping lanes. However, the work was limited to small geographical areas and a limited number of ship types. Li et al. [
23] suggested a similar extension to the DBCSAN algorithm but split the speed and course differences into two different clustering models.
Knowledge about maritime traffic patterns is useful for detecting abnormal activity. Widyantara et al. [
24] directly reported outliers from the DBSCAN clustering, but several clustering methods have been extended with a detection step. Often, this step includes knowledge about the kinematic behavior. Pallotta et al. [
14] proposed a two-stage anomaly detection scheme, using the routes extracted by TREAD. First, using only the positional inputs, a trajectory was associated with a route. Afterwards, kinematic outliers were found, by comparing the speed and course to the average behavior of the route. Liu et al. [
10] proposed to divide the clusters into smaller geographical regions and compute the average kinematic values for each split. These values would then be used to detect abnormalities [
20]. Zhao et al. and Li et al. [
23,
34] used normal trajectories determined from DBSCAN clusters to train deep neural networks for trajectory prediction. Abnormalities were then detected, based on the prediction error.
Recently, an abnormality detection model based purely on deep learning has been suggested. Hu et al. [
21] suggested an ensemble of a Variational LSTM AutoEncoder and a Graph Variational AutoEncoder. Each ensemble member was trained to reconstruct the input trajectory, and the reconstruction errors were then combined, to make a final binary prediction of the abnormality. Liu et al. [
22] self-annotated training data based on extreme position, speed, or course values and trained a deep neural network to classify abnormalities. Nguyen et al. [
15] suggested a Variational Recurrent Neural Network (VRNN) for the detection of abnormalities based on trajectory reconstructions. In this work, Nguyen et al. also suggested an A-Contrario detection methodology, which was supposed to account for regional differences in reconstruction accuracy. Although the results reported using VRNN looked promising, our feedback from VTS operators mentioned the lack of explainability as a key limitation for operational use. The lack of explainability of decision support tools has been identified as a key issue for the automated detection of abnormal maritime behavior in surveys by Riveiro et al. and Stach et al. [
16,
17].
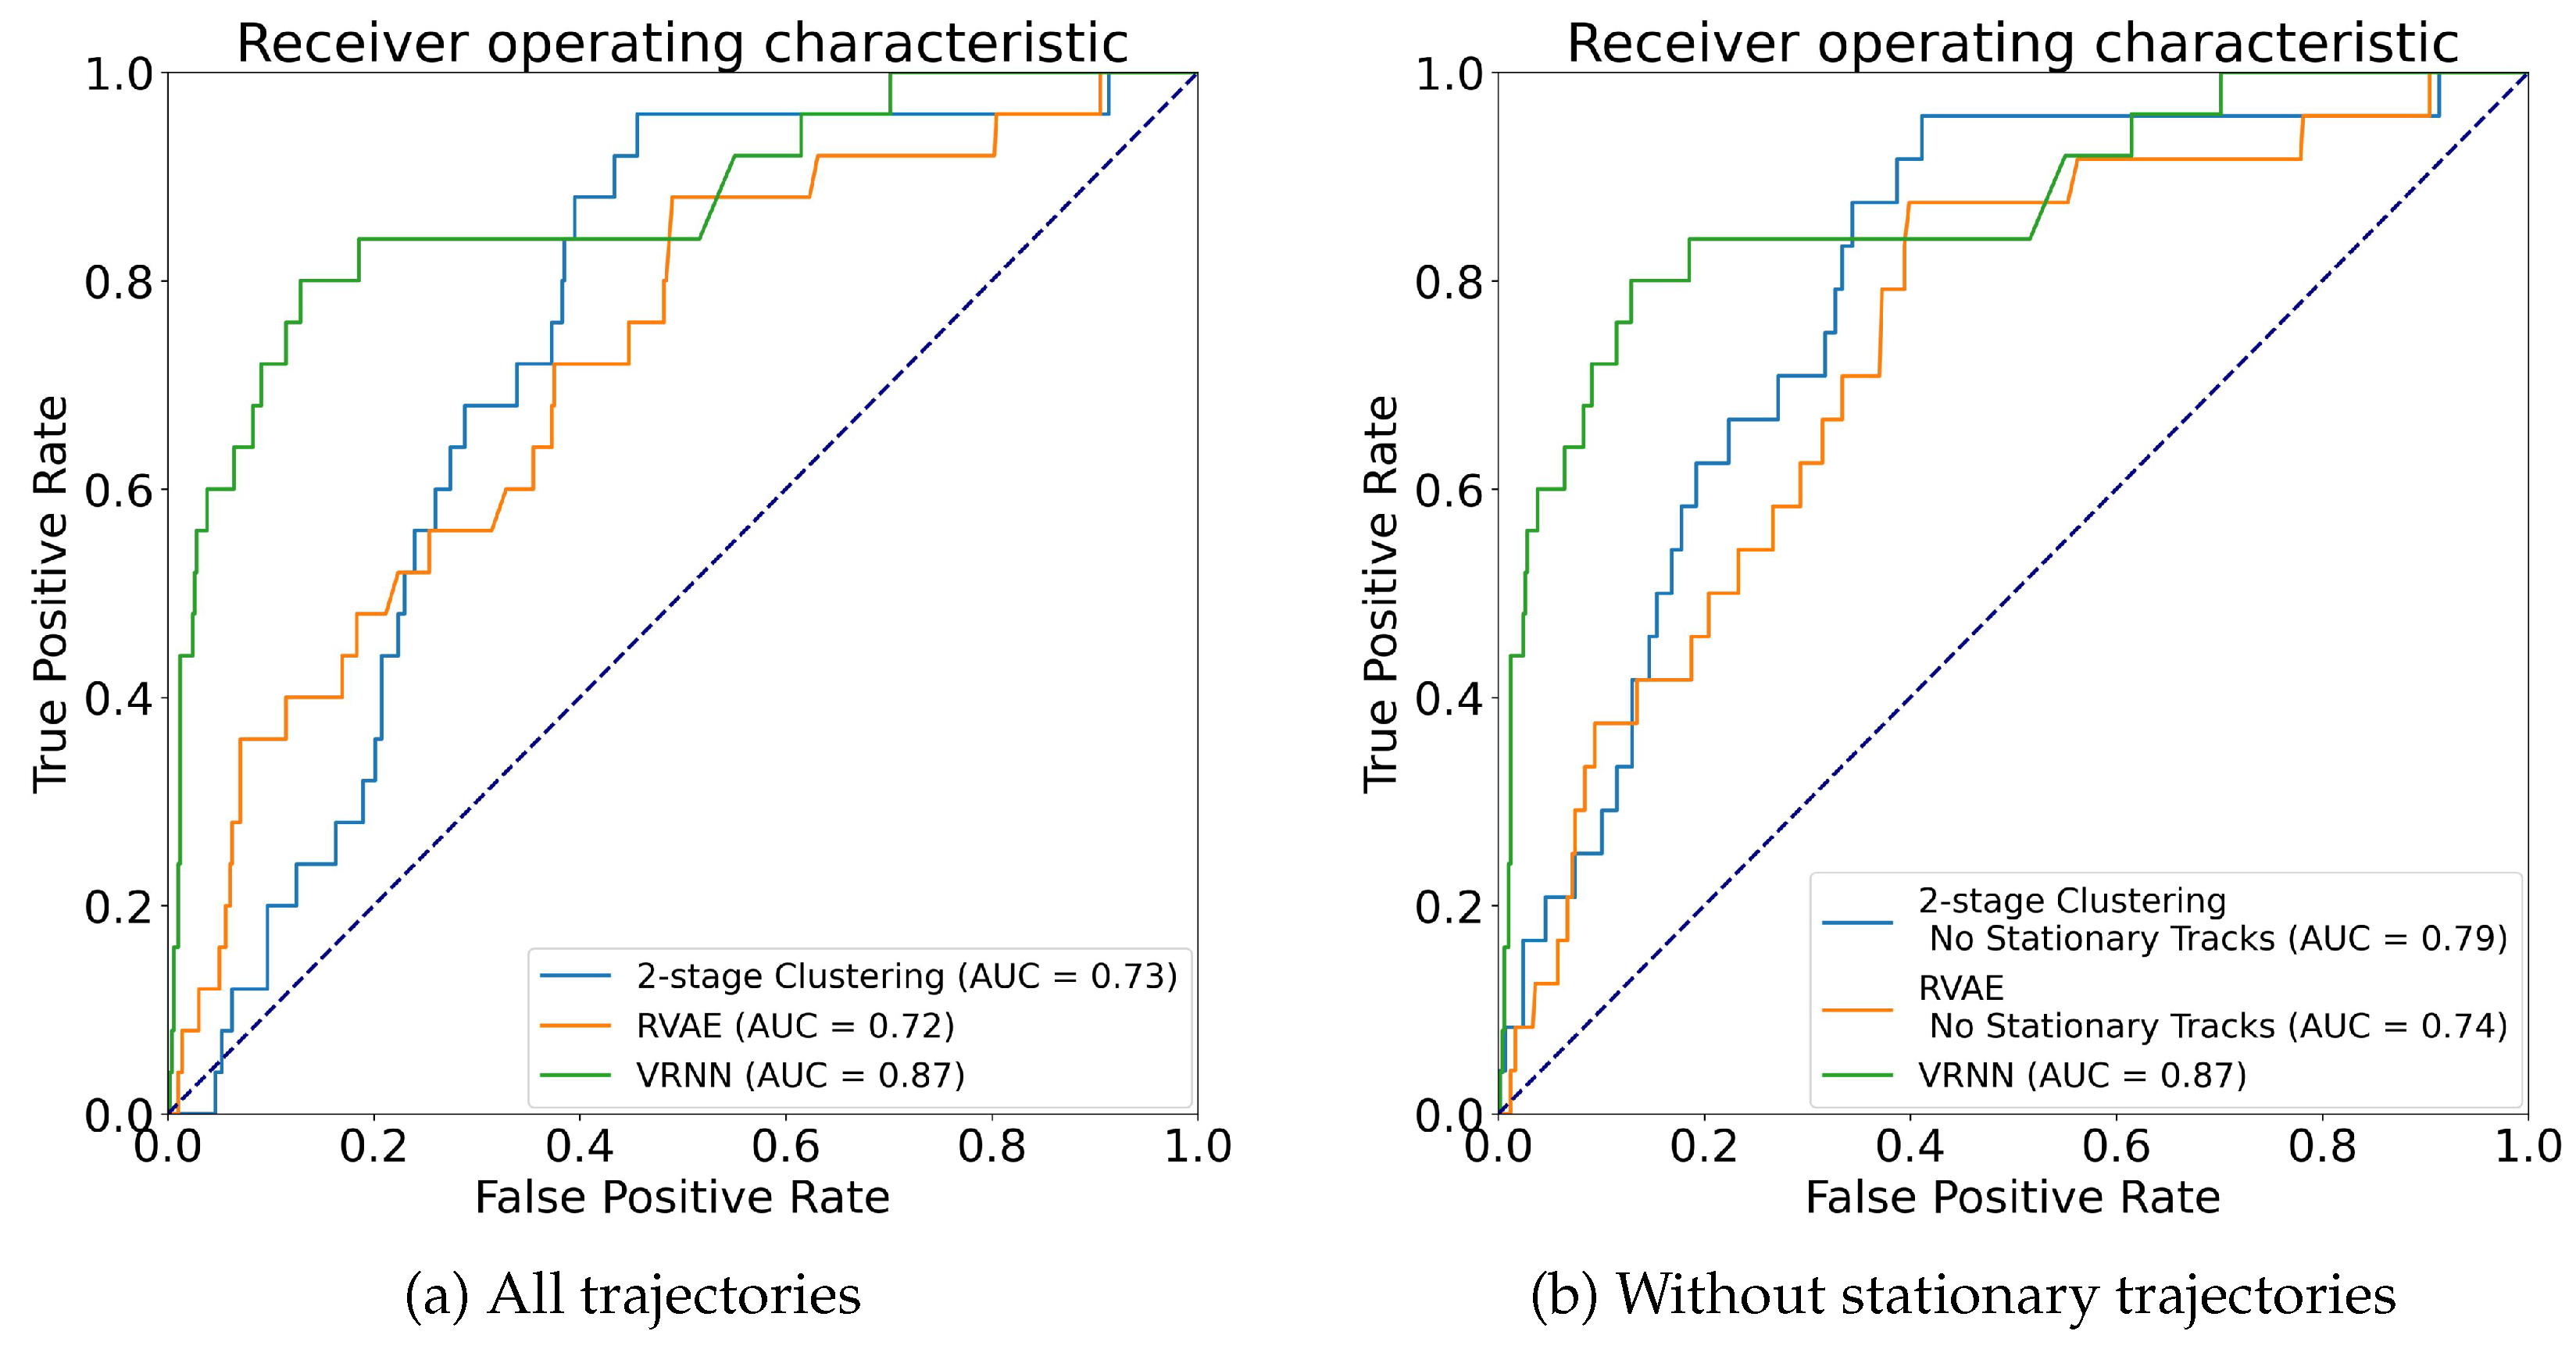
Table 1 summarizes the normalcy models and the limitations of these normalcy models utilized by the previous research discussed. We present a novel abnormality detection algorithm based on a positional clustering followed by a kinematic clustering of historical maritime trajectories. We rely on an efficient positional similarity measure, which allows us to process a large, complex dataset of maritime trajectories representative of real-life traffic in a reasonable time. The abnormality detection is made with respect to the kinematic of the vessel, for which we design an alternative similarity measure based on DTW. The latter is able to distinguish behaviors within the same positional clustering, giving VTS operators a clear summary of normal behavior when assessing the suggestion of our abnormality detector.
3. Methodology
In this section, we first discuss similarity measures for trajectories and then introduce our abnormality detection algorithm.
3.1. Notations
An AIS trajectory A of length is a four-dimensional time series , where , with each dimension representing, respectively, the longitude, latitude, speed, and course of the vessel as recorded in its AIS message at time t. For legibility, the timestamp t is used indiscernibly as an index of a variable, such that , or .
Throughout the section, we consider two AIS trajectories A and B of time duration and , and two timestamps and . Also, we assume that the trajectories are regularly sampled without missing data. The function d is a generic distance on or , depending on the context.
3.2. Similarity Measures
In the following, we discuss three commonly used trajectory similarity measures: the Hausdorff distance, the average Haversine distance, and Dynamic Time Warping (DTW). We define these similarity measures without specifying which dimensions of the time series are used (positional or kinematics), as this depends on the use case. We also propose a variant of DTW tailored to kinematic data.
3.2.1. Hausdorff
The Hausdorff distance [
35] between two trajectories corresponds to the maximum smallest distance realized by any pair of points in each one of the trajectories:
The computations require a comparison of all possible pairs of points, resulting in quadratic time complexity. Furthermore, the Hausdorff distance ignores the time component. This means that ships along parallel shipping lanes sailing in opposite directions are not distinguishable. Such a situation is studied in [
19].
3.2.2. Average Haversine
The quadratic time complexity and the issues mentioned above make the Hausdorff distance unsuitable for measuring the similarity of many long and complex sequences of geographical coordinates. On the other hand, the Average Haversine distance (AH) proposed in [
36] is able to compare the positional evolution of the AIS trajectories in linear time, with respect to the length of the trajectories. It is defined as a continuous distance measure, but it can be approximated using the trapezoidal rule and assuming a regular sampling:
where
and
is the Haversine distance [
36]. This similarity measure computes the geographical distance between the trajectory points one by one in a linear fashion until the length of the shortest trajectory is reached. This means that the measure places an increased weight on the beginning of the trajectories. Thus, we expect the measure to be able to separate trajectories based on their starting location. This is ideal in a real-time operational setting when observing new trajectories, as even short trajectories can very quickly be classified into a subset of historical trajectories with similar behavior.
3.2.3. Dynamic Time Warping
Dynamic Time Warping minimizes the pair-wise distance by re-indexing (alignment of) the data points in the trajectories, according to certain rules. It can be defined as follows:
where
is the set of all possible alignments that are sequenced pairs of indices
satisfying three constraints: (1) the beginning and end of the time series must be matched; (2) the sequence must be monotonically increasing in
i and
j; (3) all indices
i and
j must appear at least once. These ensure that the sequences start and end together and that each point on either sequence is mapped onto at least one point of the other sequence without these mappings crossing in time.
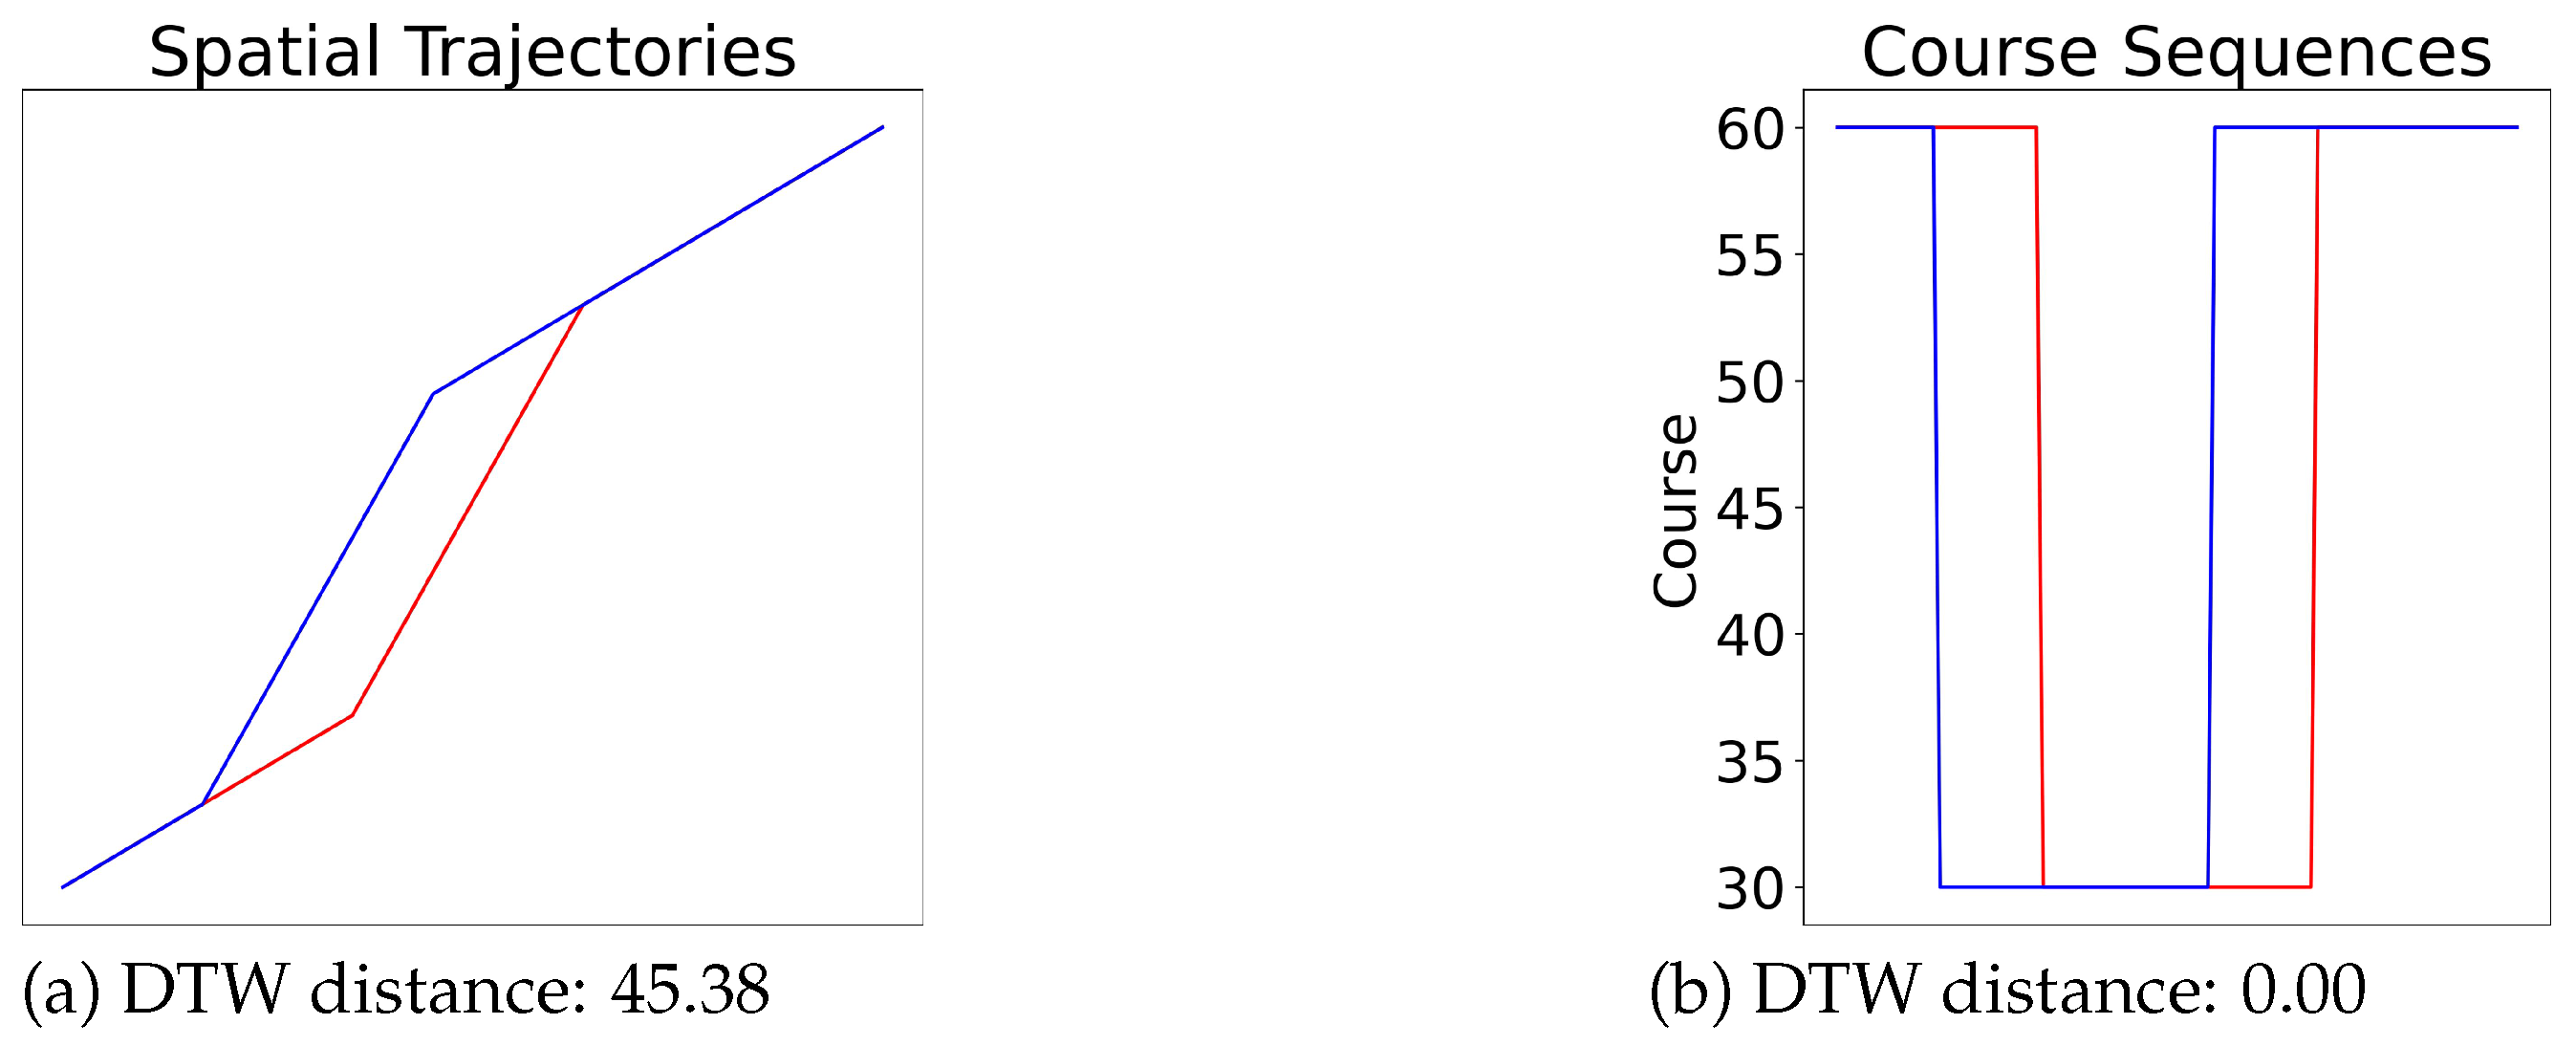
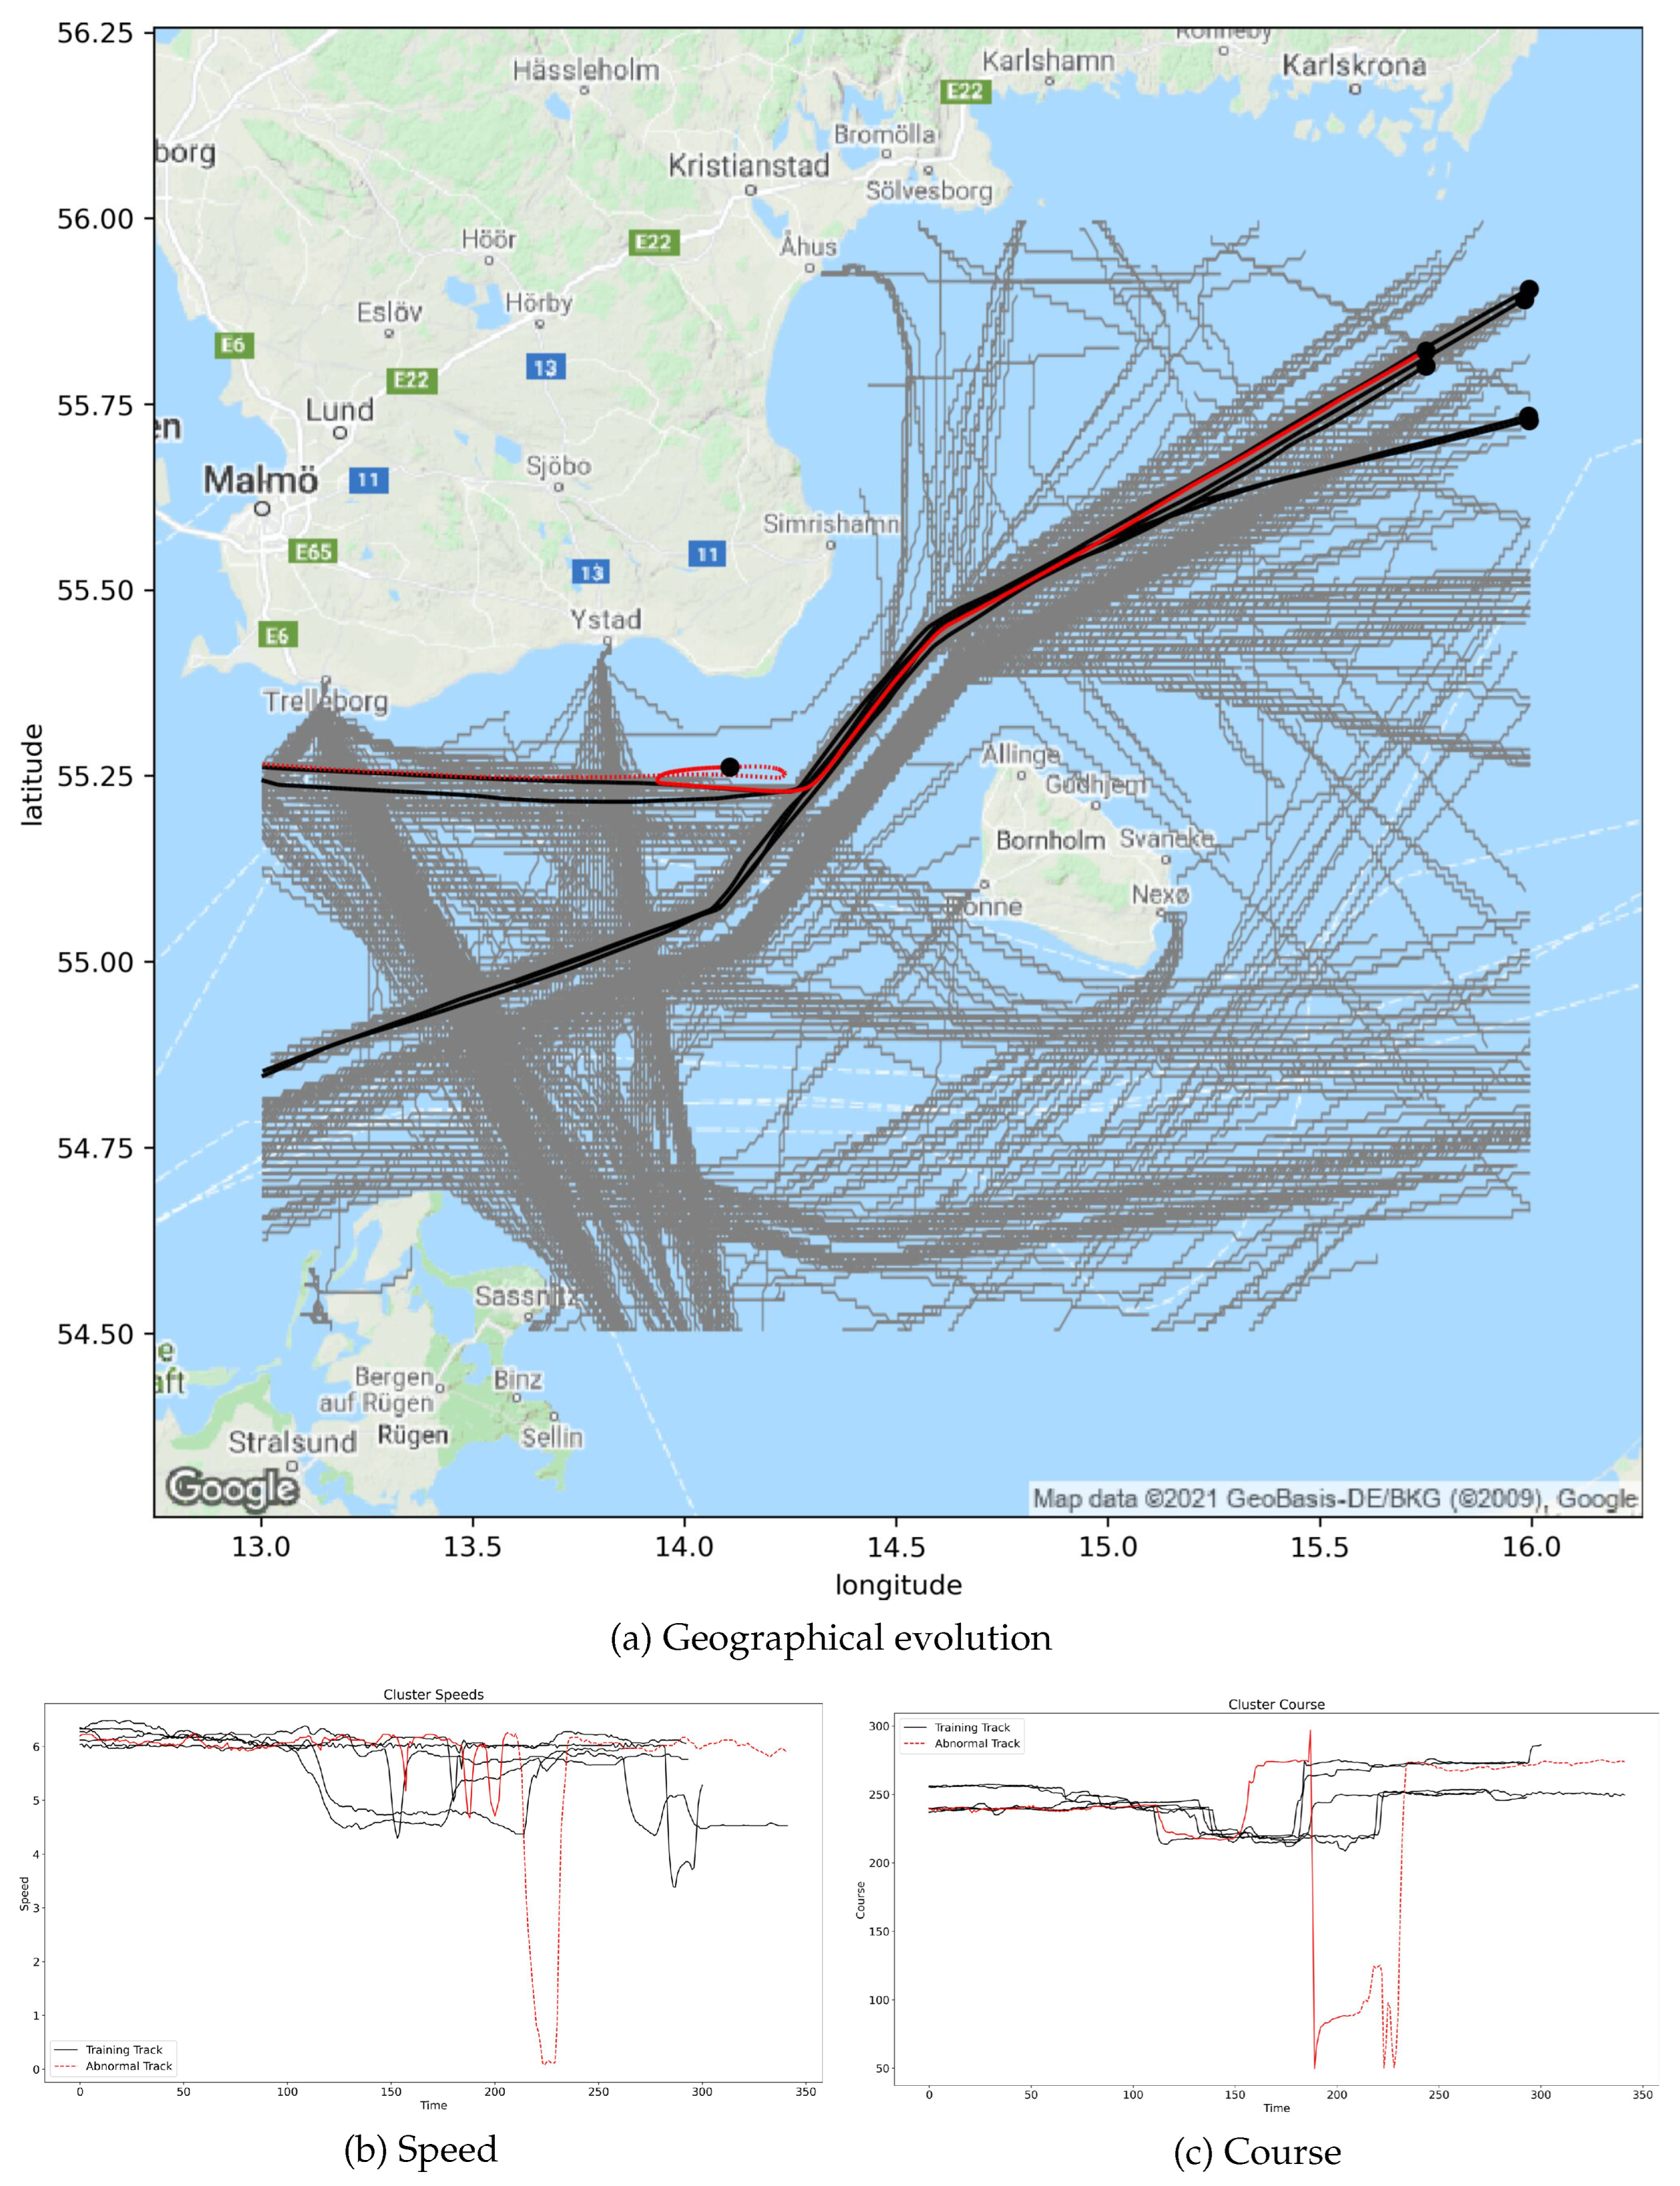
As DTW processes pairs of indices, it also has a quadratic time complexity. The DTW alignment may overestimate the distance of trajectories with similar behavior if this behavior is spread over a large area. For example, consider two trajectories with the same starting point and sailing along the same direction as illustrated in
Figure 1. At one point, trajectory A makes a 30 degree turn and continues in this direction, moving away from trajectory B. Later, trajectory B makes a similar 30 degree turn and continues parallel to trajectory A. Both vessels return to their initial course some time later, and the trajectories terminate at the same point. As these two trajectories have the same origin and terminal location and have similar behaviors throughout the journey, we would expect the distance between them to be very small. However, their distance, calculated by DTW on the sequence of geographical coordinates, may be significant. The re-indexing procedure of DTW aligns the course changes between the trajectories. However, due to the spatial nature of the geographical coordinates, DTW calculates the geographical distance between the location where the trajectories changed course. If we instead were to use the time series of the measured angles towards true north, the DTW distance would calculate the difference of the course values. As these values are the same before and after the changes, the DTW distance between the two trajectories would be zero. Using the time series data, we remove the spatial dependence, and DTW can properly calculate the similarity of the course after aligning the changes. Therefore, DTW is a good candidate as the building block of a similarity measure for course and speed time series.
3.2.4. Kinematic DTW
Following the previous discussion, we propose a variation of DTW for kinematic data, referred to as
. The measure is defined as the sum of the DTW of the time series of the speed and of the DTW of the course time series:
where
and
are, respectively, the speed and course sequences of trajectories
A and
B. The differences in speed and course at each timestamp are measured, respectively, by
and
, which correspond to the standardized absolute difference of the speed and the normalized angular difference in radians, respectively:
where
is the standard deviation of the speed computed empirically from the speed time series
and
.
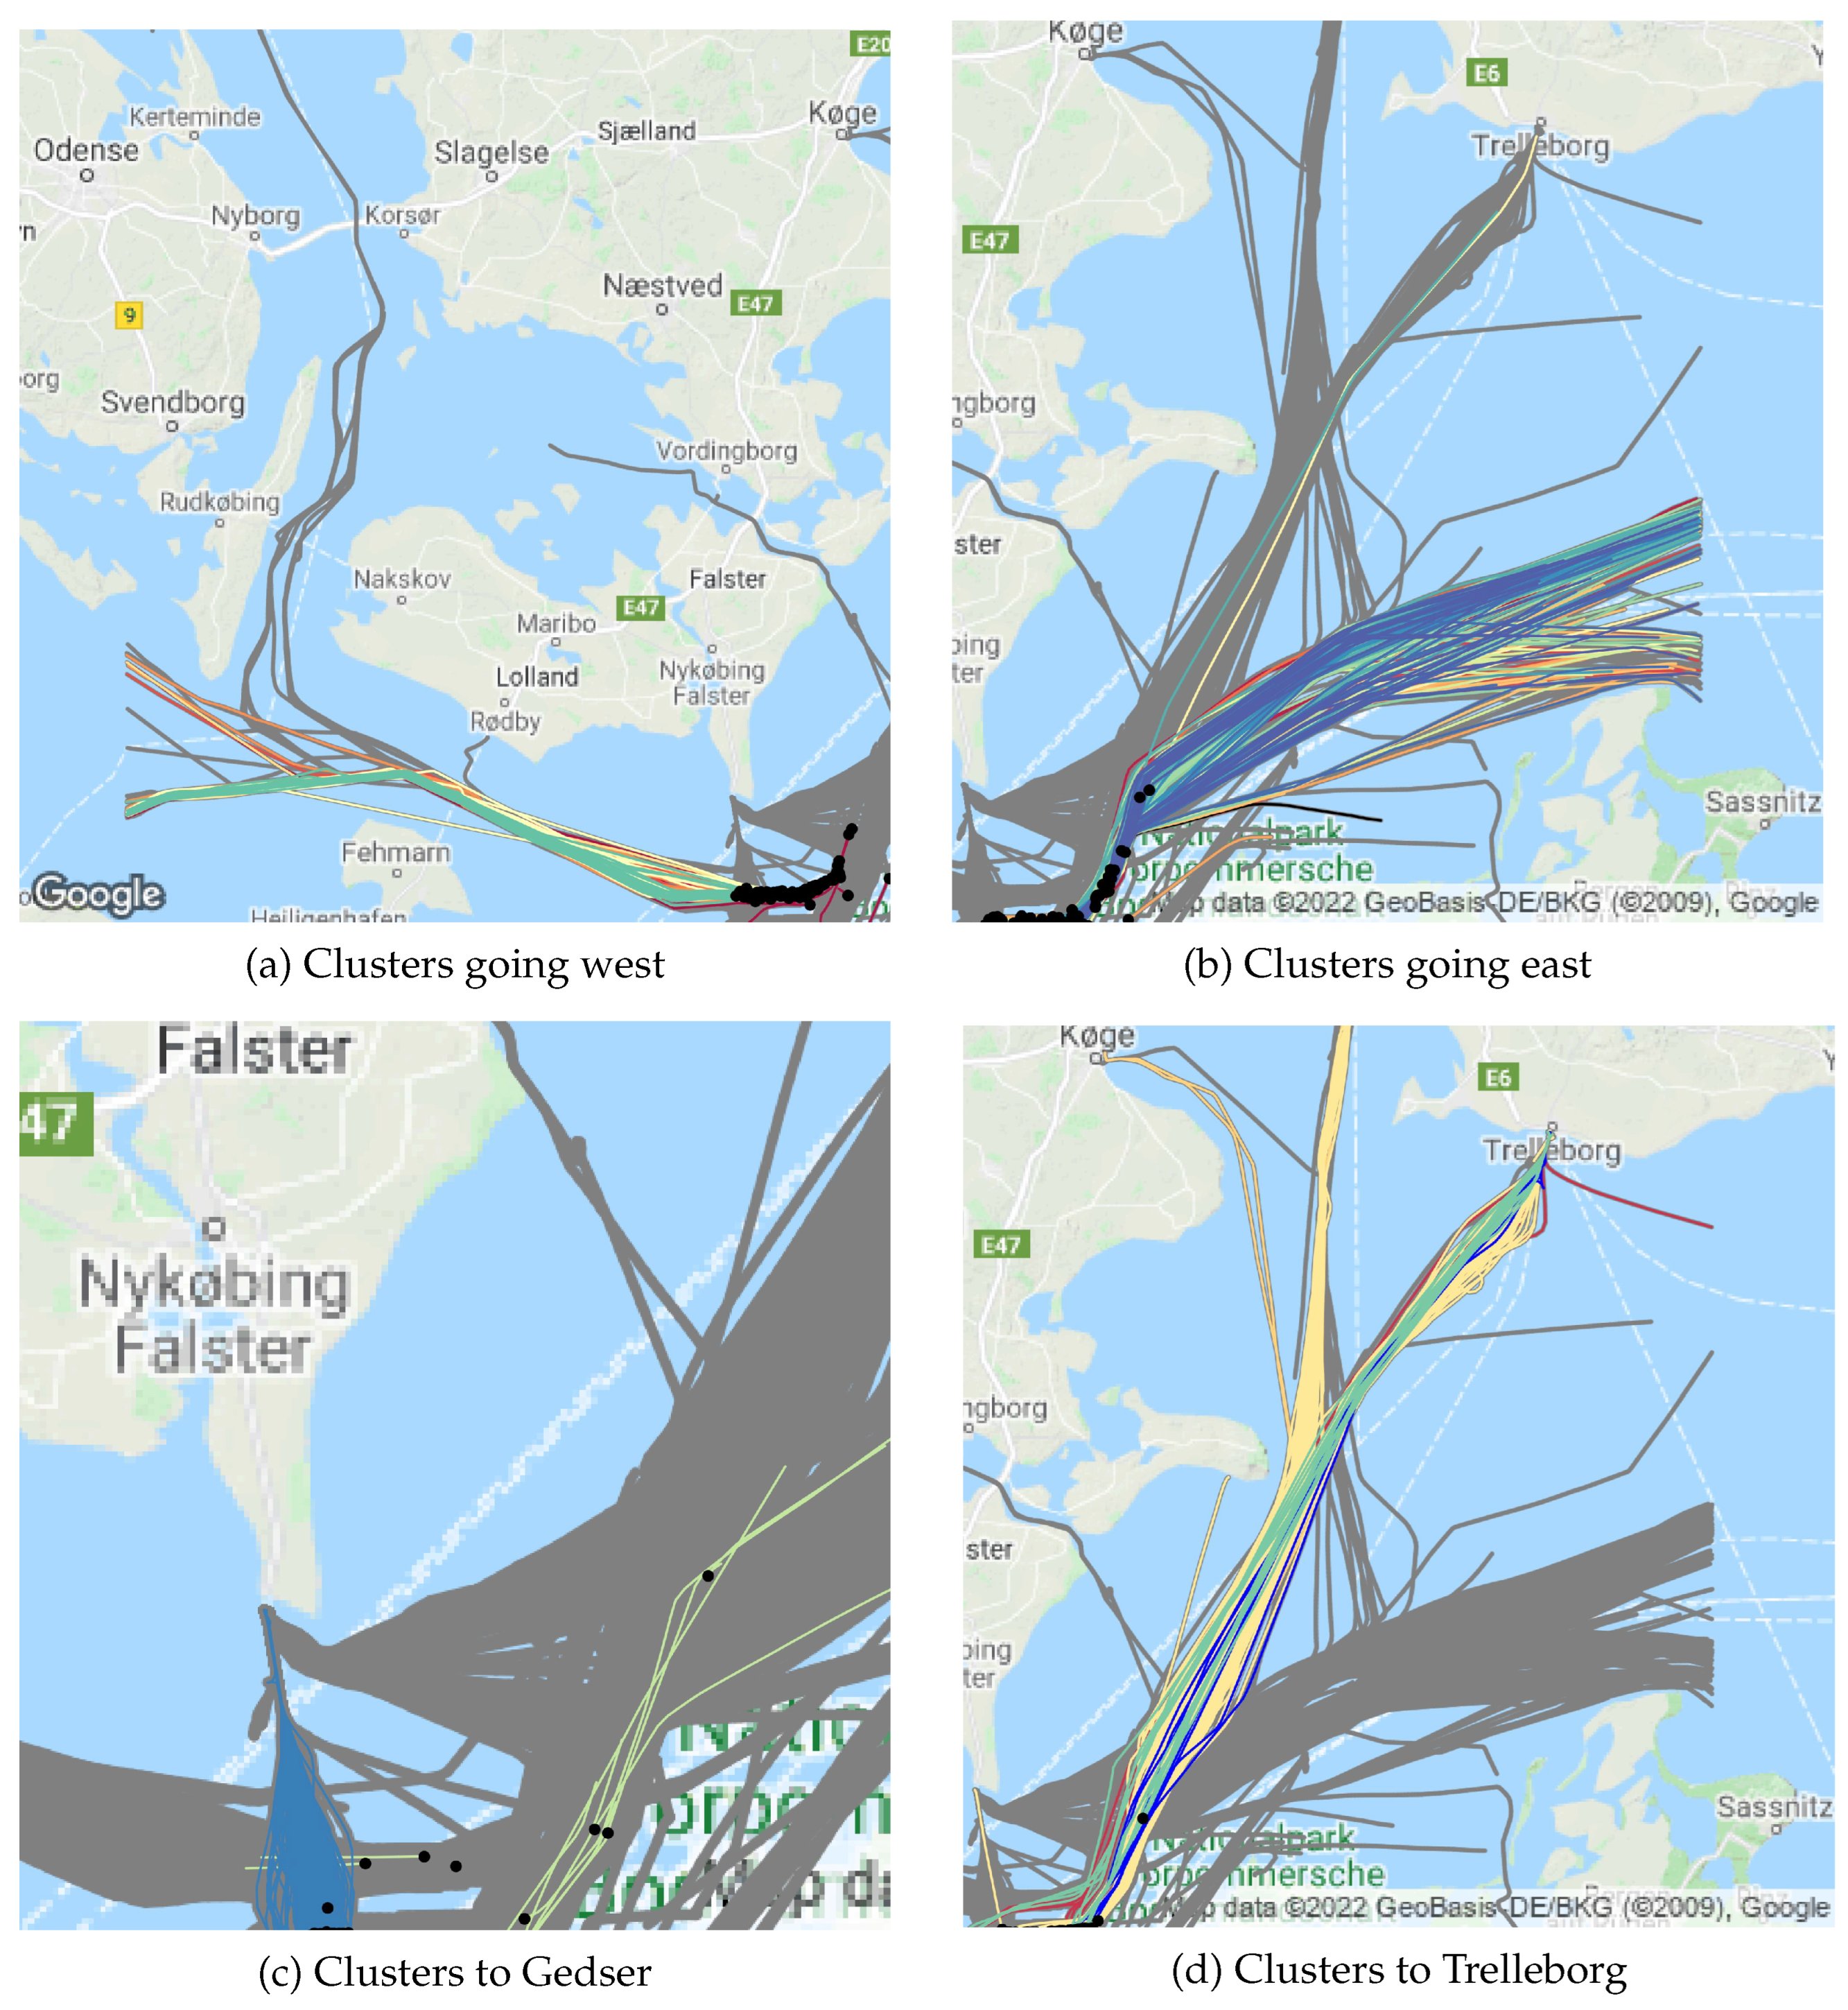
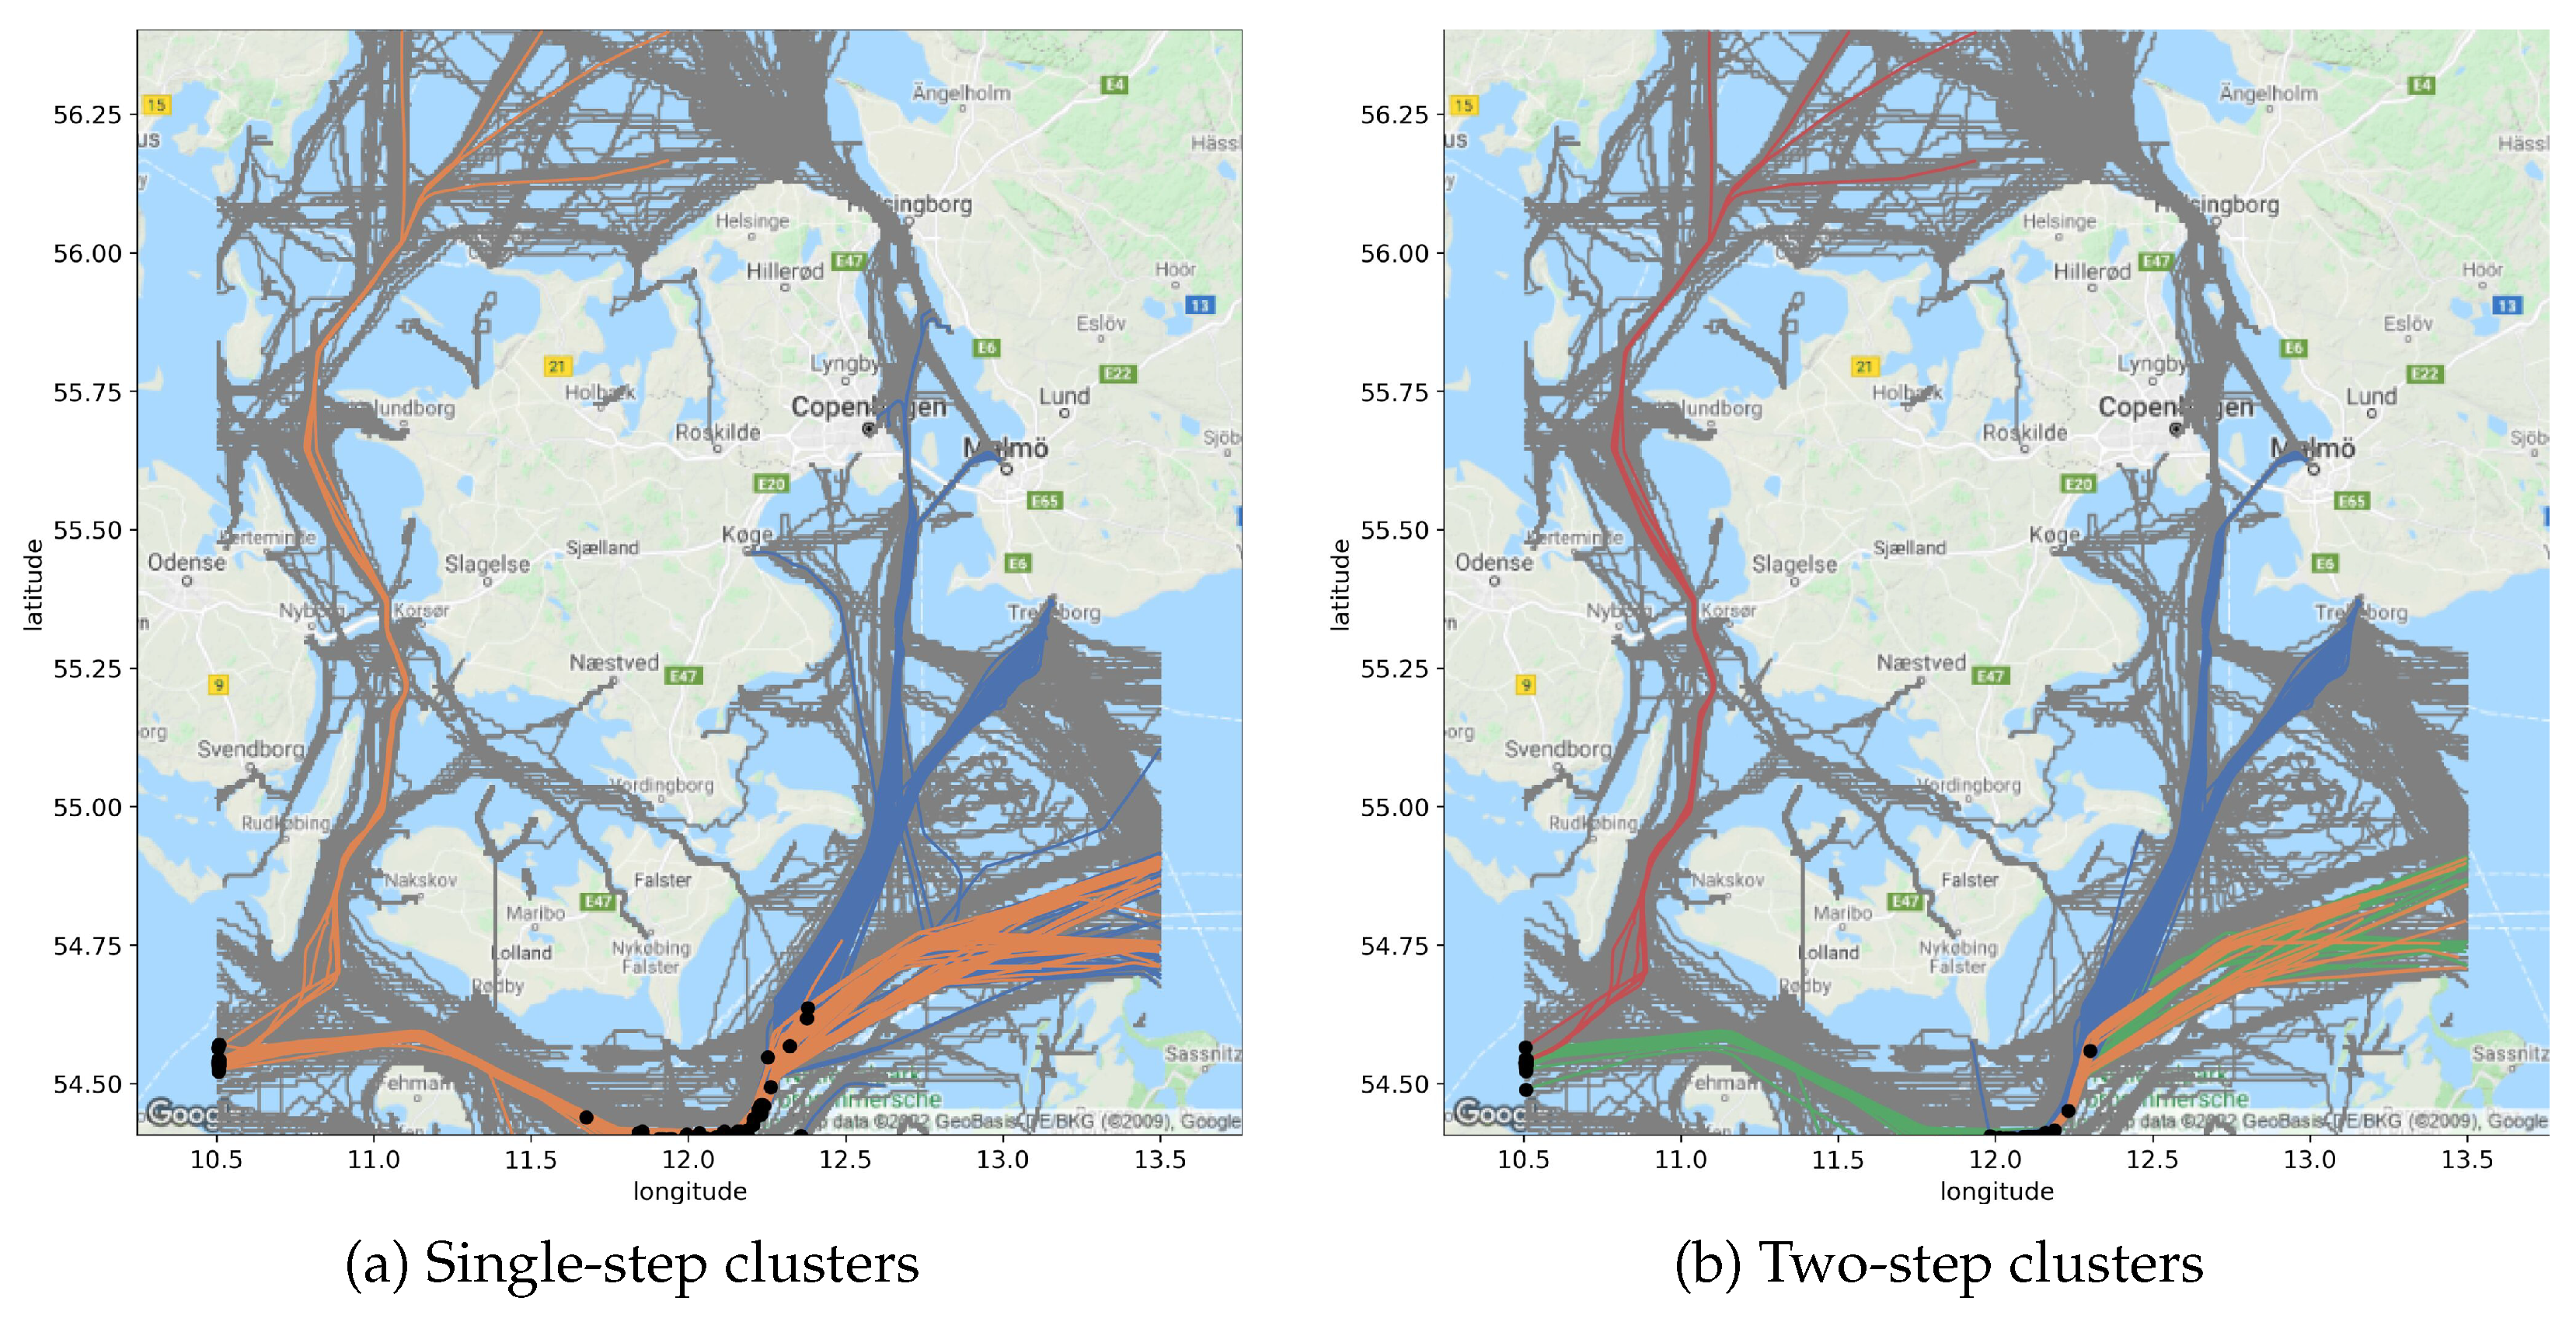
3.3. Two-Step Clustering for Abnormality Detection
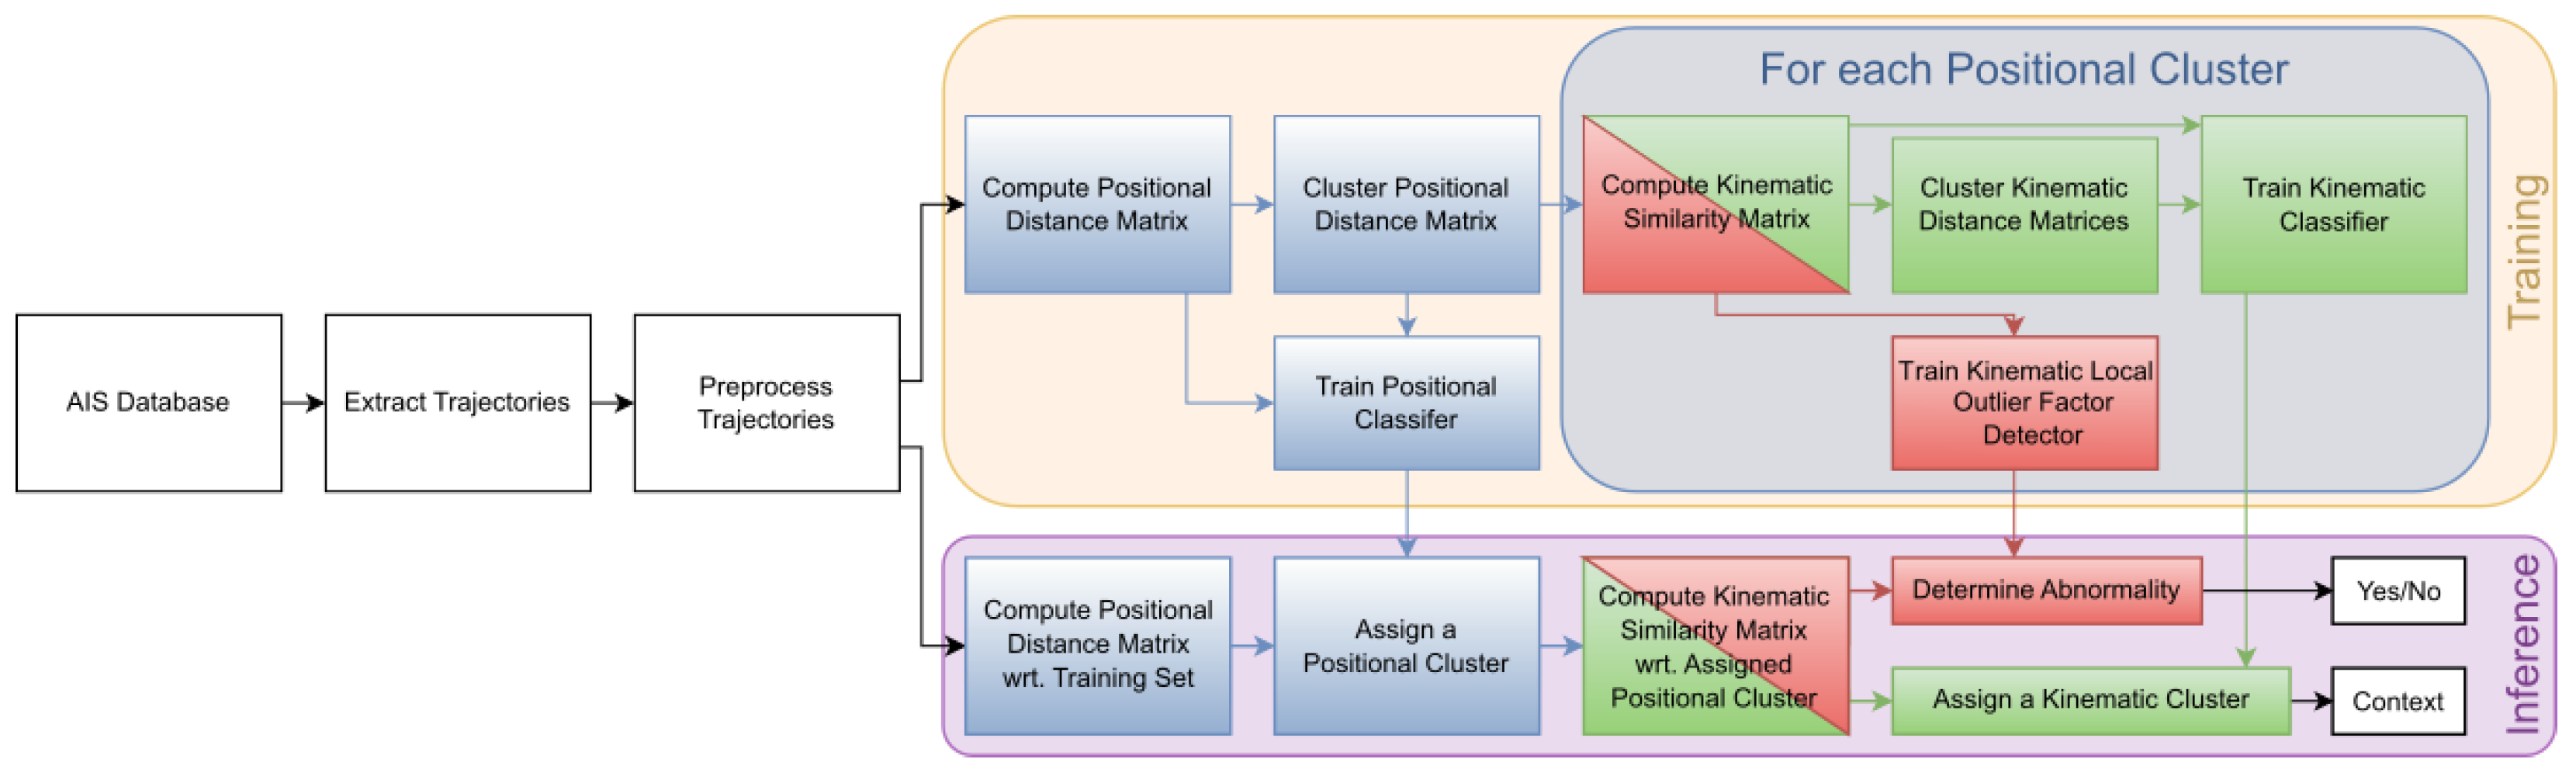
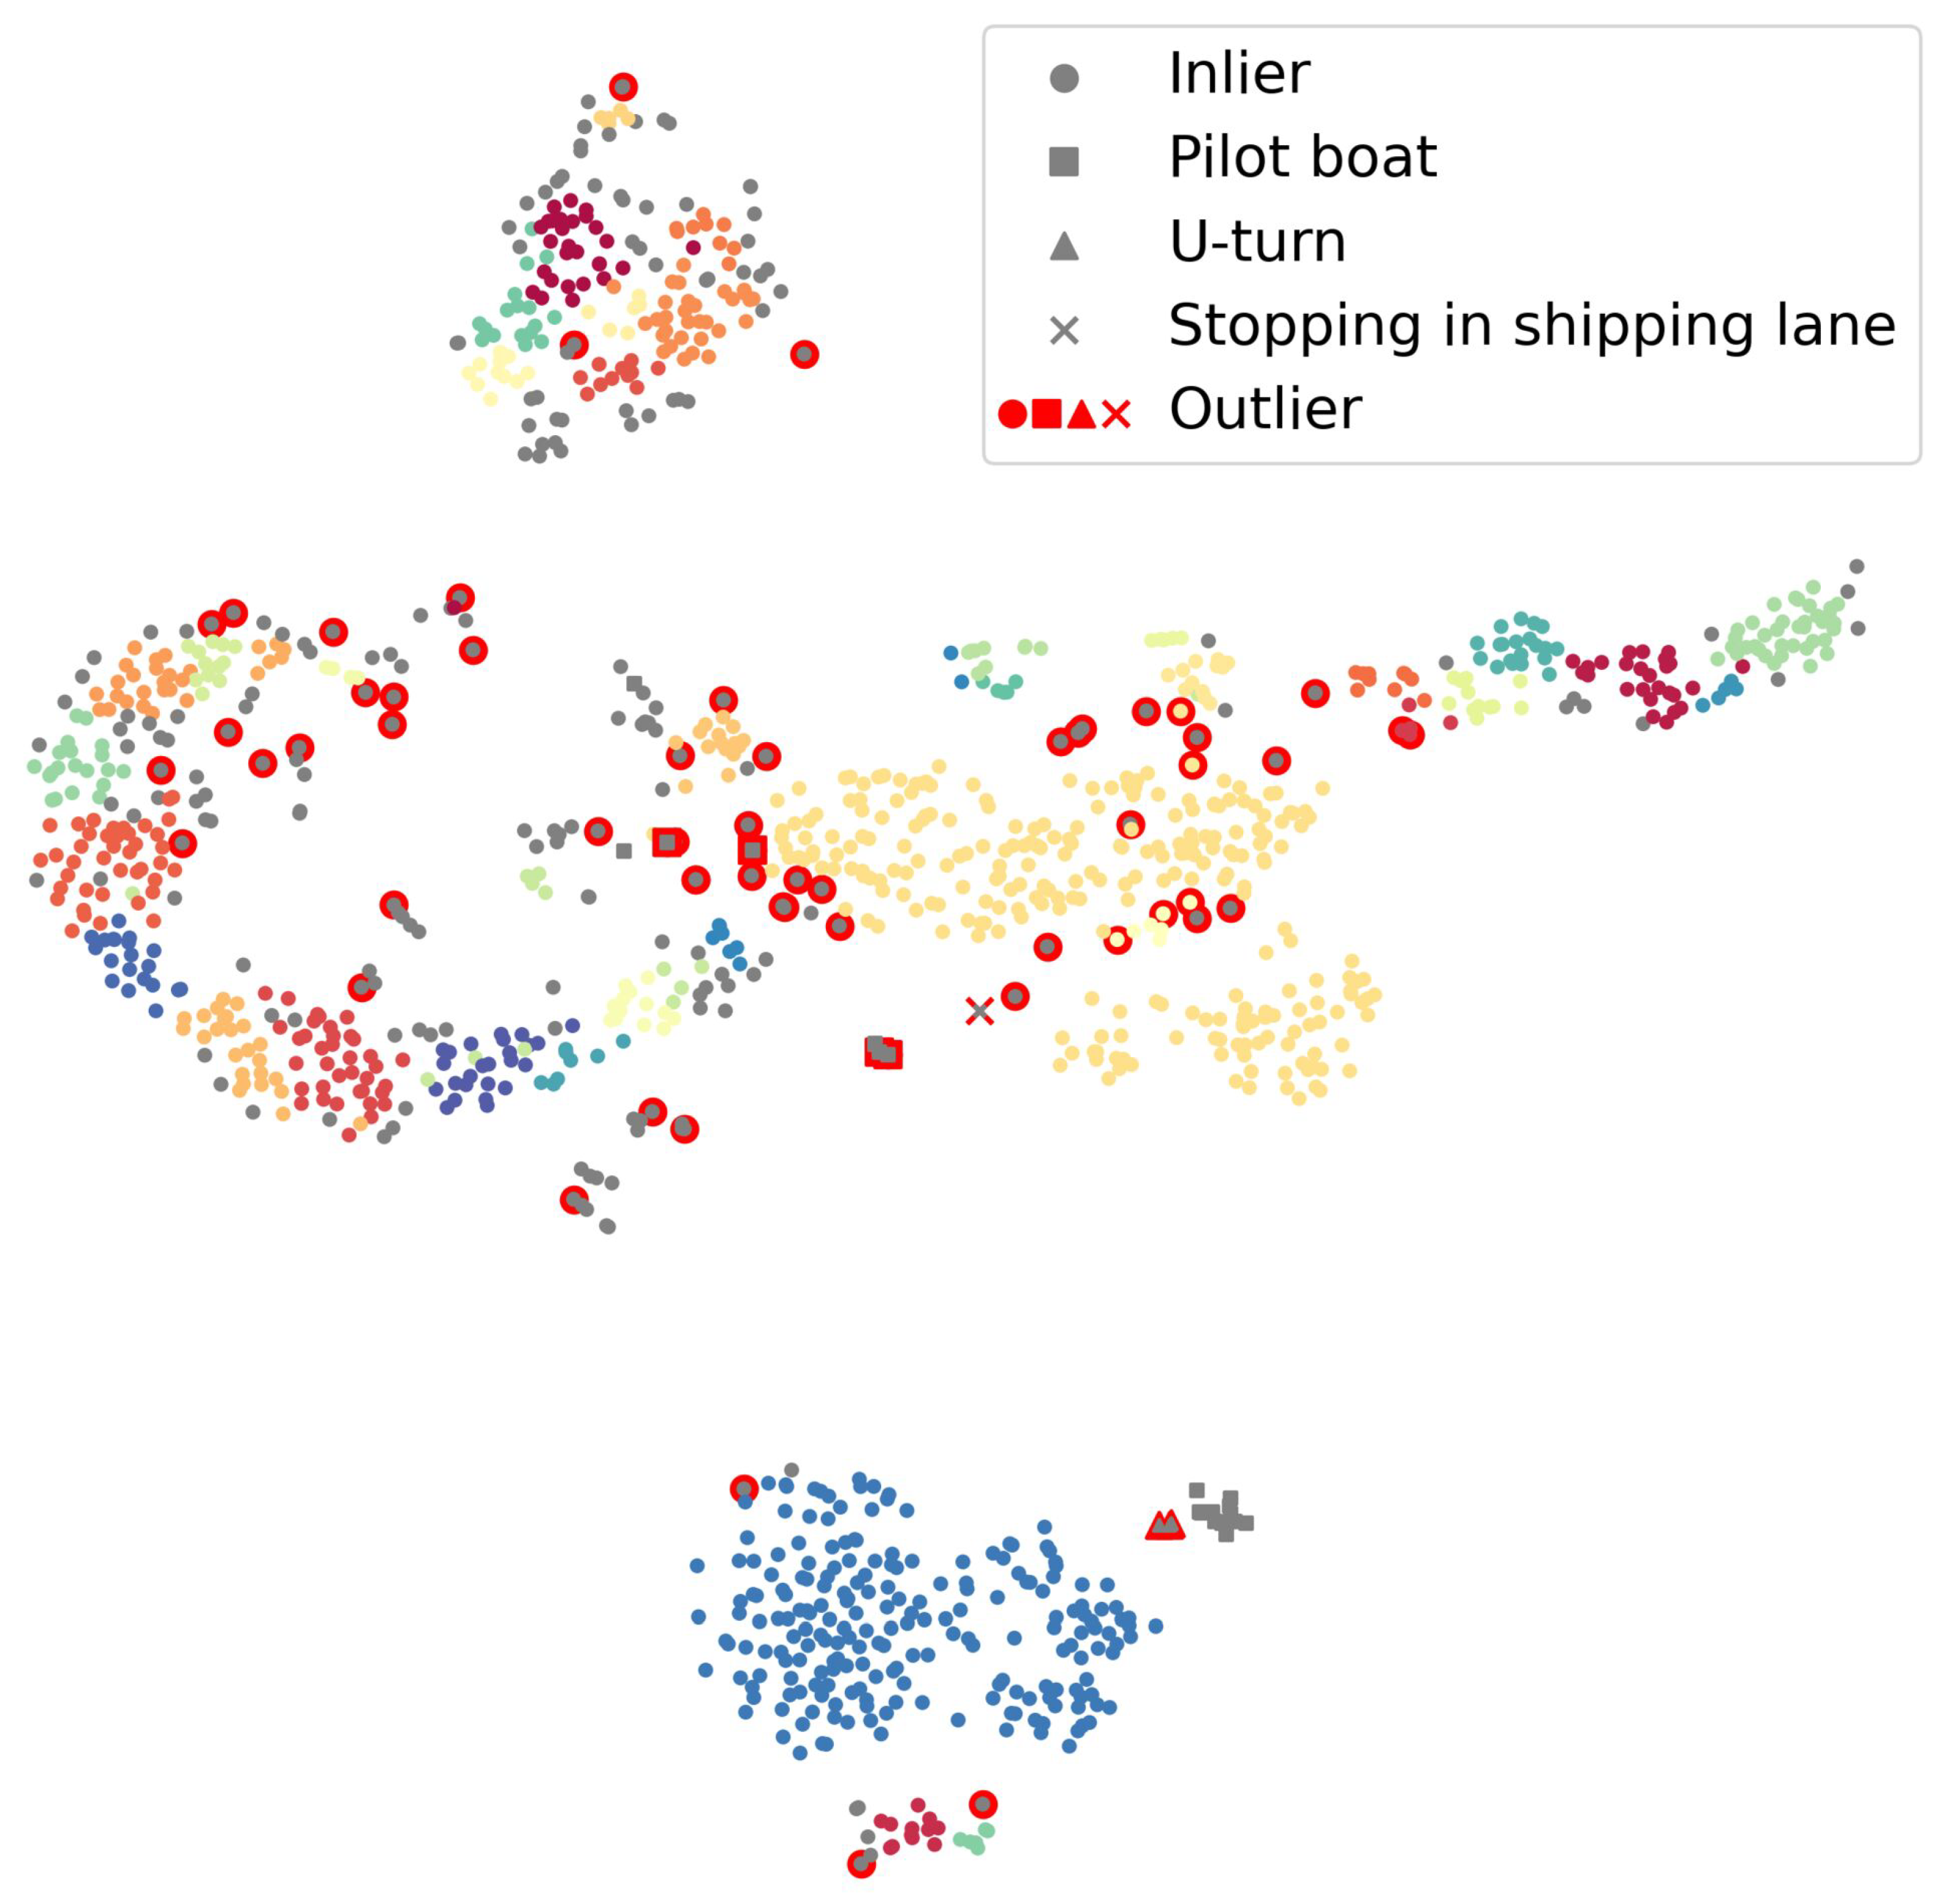
Our intention was to design an abnormality detection algorithm to assist VTS operators, which may serve as a contextual decision support tool and let them make the final decision based on the contextual information provided by the algorithm itself. The reason for a trajectory to be flagged as abnormal is that it is either similar to other abnormal trajectories or that it diverges from the most similar non-abnormal trajectories. It is important to state that the notion of the behavior of a vessel is not limited to a sequence of locations, but also includes its speed and course. The similarity measure involved, to compare trajectories, thus needs to take into account both the spatial and the temporal information. Note that the assignment of kinematic clusters gives a context to the prediction of the LOF, as it shows the most similar trajectories. Yet it is not an explanation, as the kinematic clustering is not used by the detector.
We modeled this line of thought as a two-step algorithm:
Assign an input trajectory to a cluster, based on its positional dimensions (latitude, longitude, and time).
Decide on abnormality, based on the kinematic dimension (speed and course), and provide a context to the decision with the most similar trajectories.
Figure 2 shows the flow of our proposed two-step method.
(1) Positional Clustering: The first step required clustering of a historical database and a classifier, using a fast-to-compute similarity measure, to ensure the reactivity of the system. Hence, the Hausdorff and DTW were excluded. Also, both measures either distort or simply disregard the time component, which is at odds with the rationale exposed above. We chose to rely, both for clustering and classifying, on the average Haversine distance (Equation (
2)), which has a linear complexity and compares synchronous positions. The clustering was a hierarchical clustering with average linkage which, once computed, allowed us to easily change the number of clusters and, thus, isolate outliers. During inference, cluster assignment was decided by a K-Nearest Neighbors (KNN) classifier with
trained on the clustering.
(2a) Abnormality Detection: As we did not have access to a large set of labels, we made the assumption that none of the historical trajectories were abnormal. Therefore, none of the positional clusters were considered as abnormal, and abnormality was defined as a divergence from the training set. More precisely, we defined it as a divergence with respect to the trajectories within the assigned positional cluster. As outlier detection, we employed the Local Outlier Factor (LOF) [
25] and
(Equation (
4)) as a similarity measure. Before calculating
, we compressed the trajectories, using the two-stage DP compression [
29]. As the trajectory had been assigned to a cluster based on its positional information, it could not be an outlier purely based on these data. The divergence needed to be measured on the basis of another aspect of the behavior, namely the variations of the kinematics (speed and course), which could be understood as the derivative of the positional data.
The LOF compares the density of the local neighborhood of a point to that of its KNN. If the density of a point is significantly lower than its neighbors, the point is flagged as an outlier. Following the discussion in [
27], we set
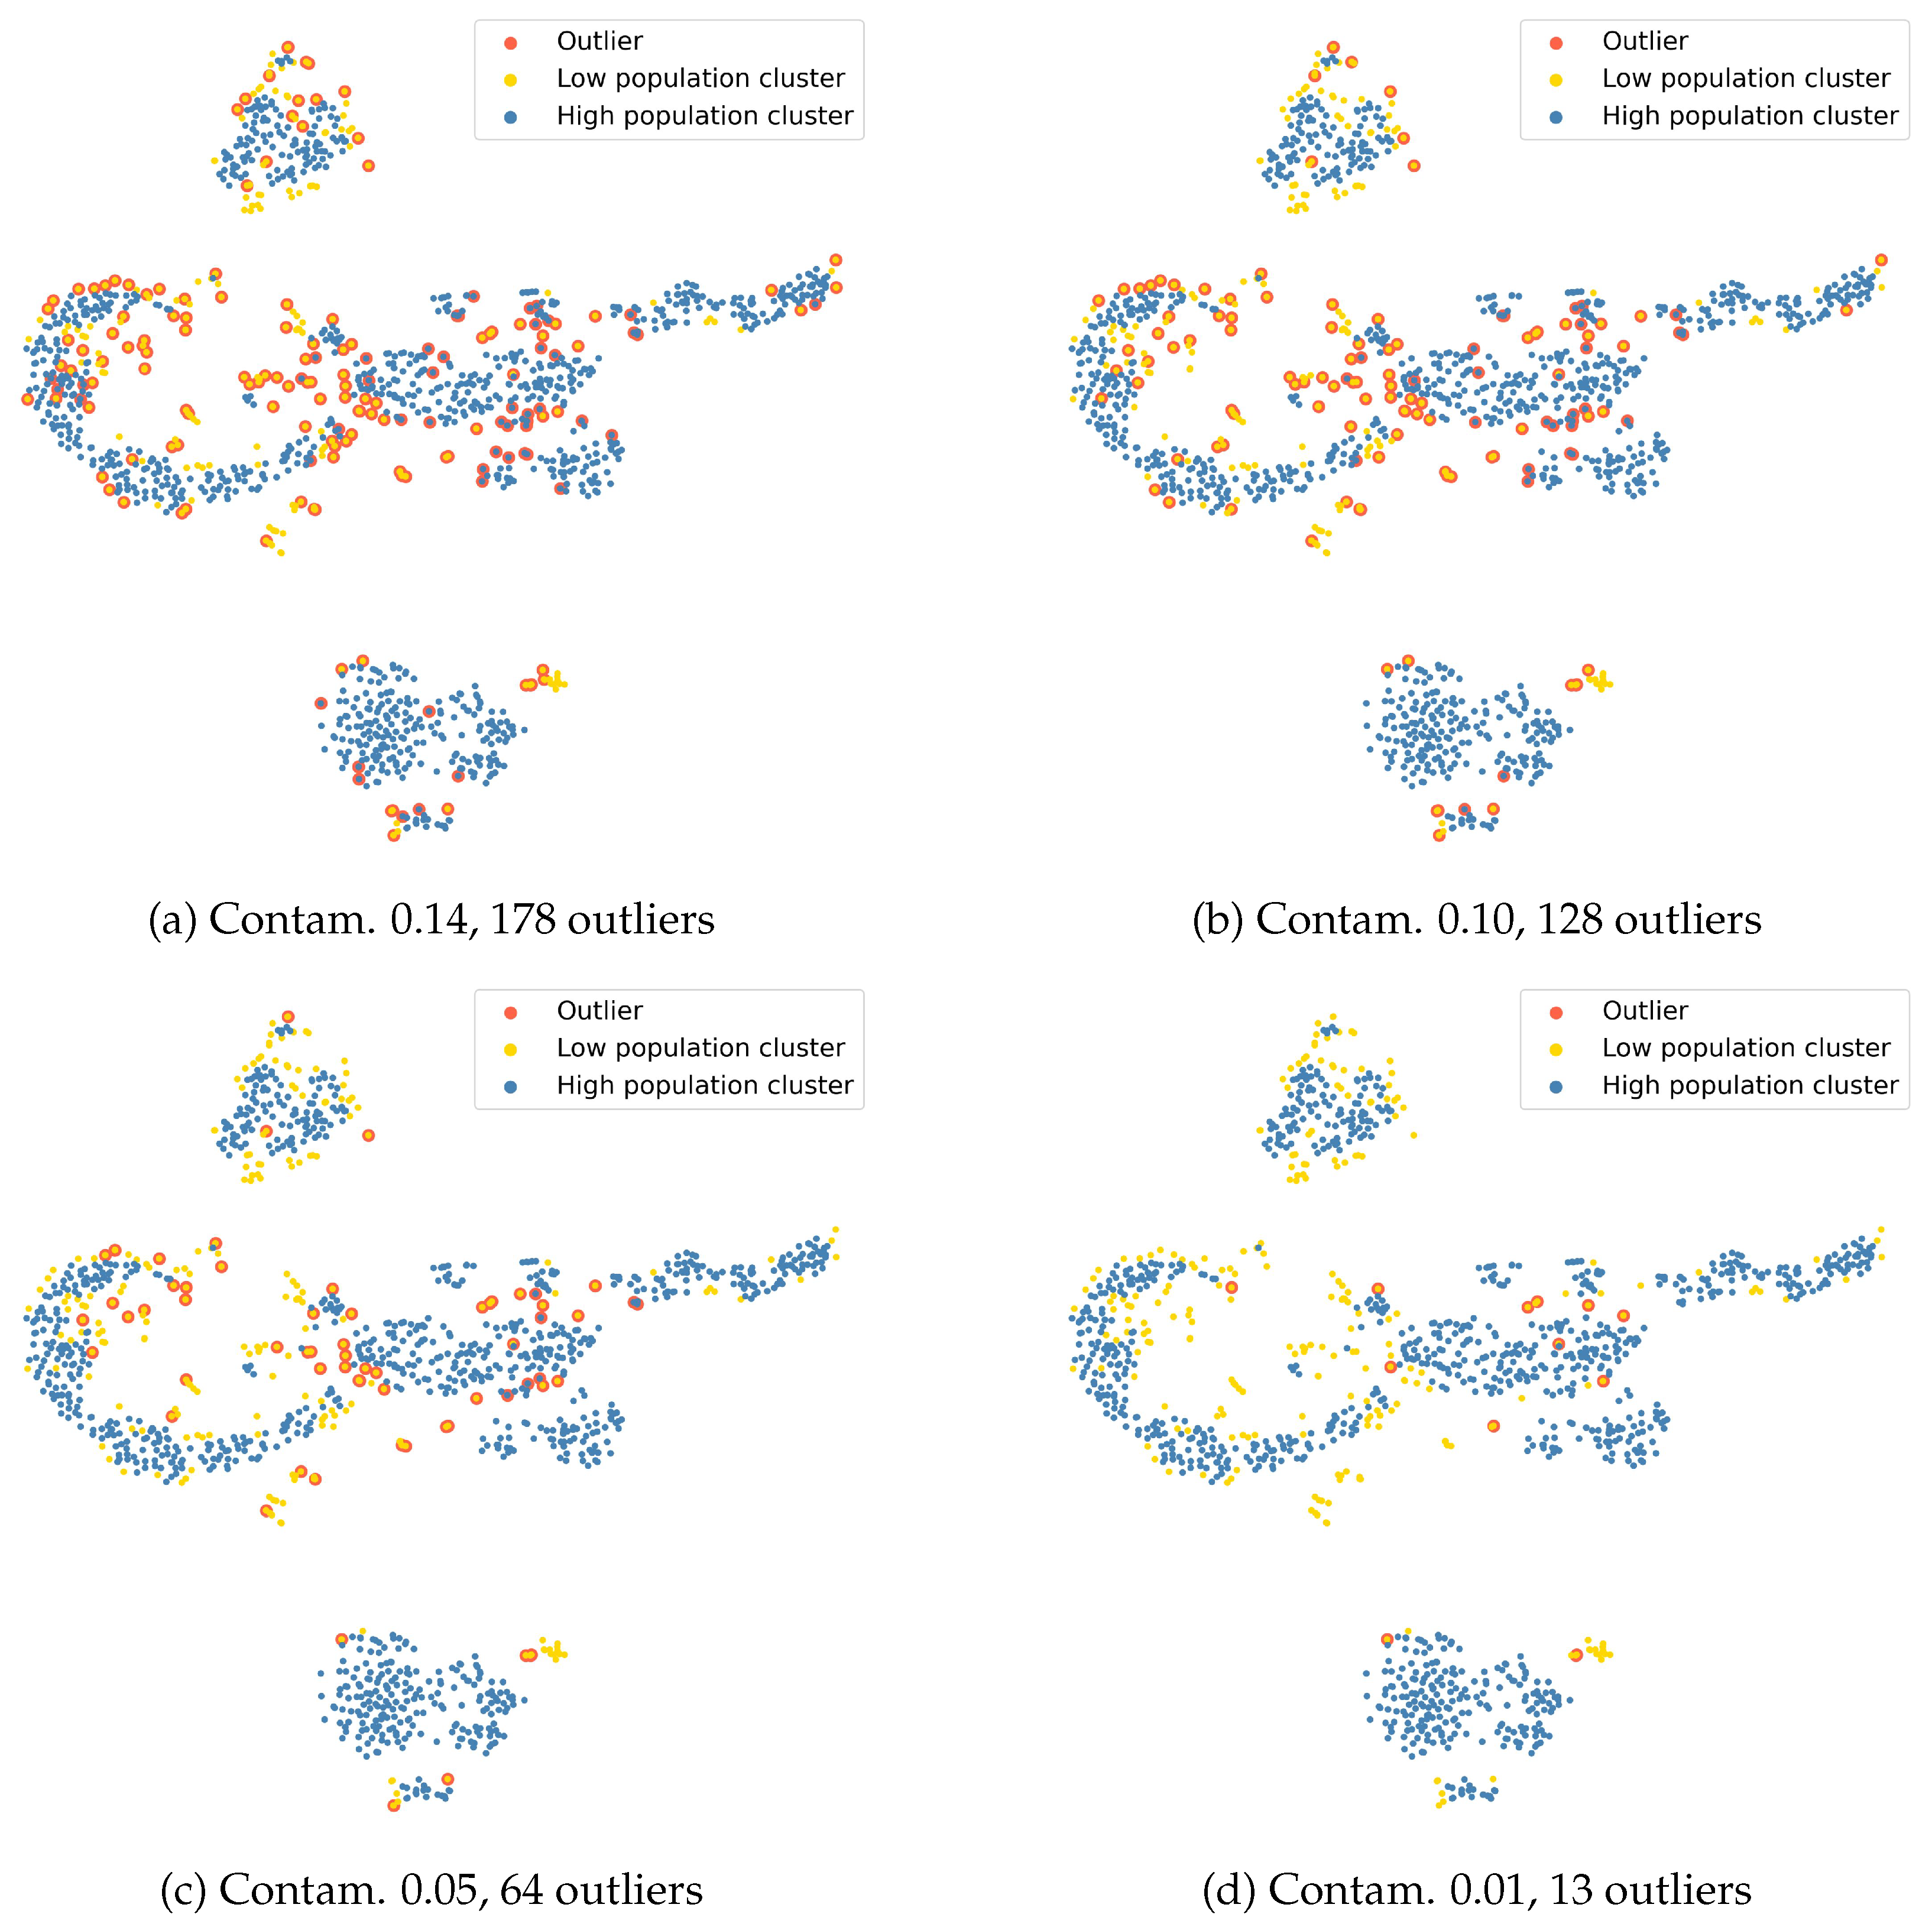
nearest neighbors for the LOF algorithm in our experiments. In practice, we did not see large changes in the number of outliers detected when varying that number. However, we recommend a low value to capture information only from the local neighborhood. The LOF also has a hyperparameter, called contamination, related to the expected percentage of outliers. As we expect only a small number of outliers, we recommend again to use small values for the hyperparameter. See
Section 4.6.2 for an ablation study.
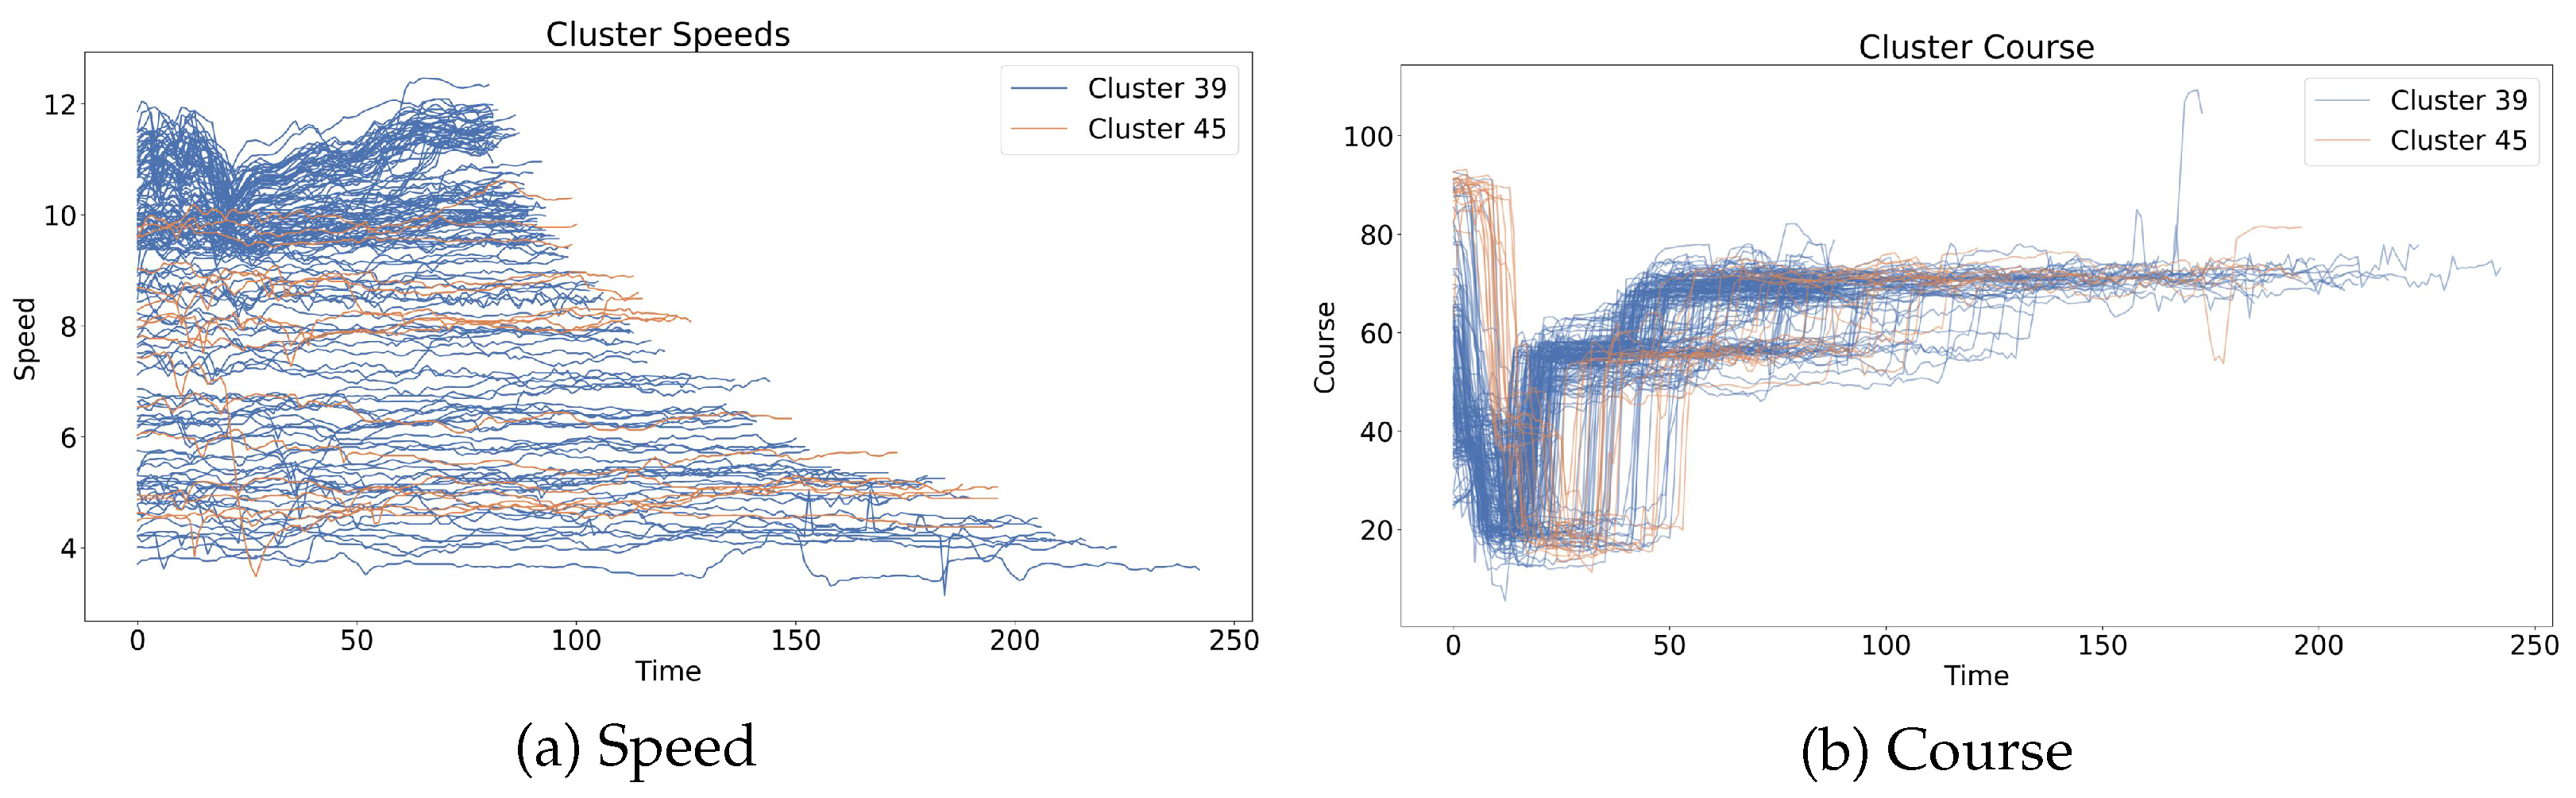
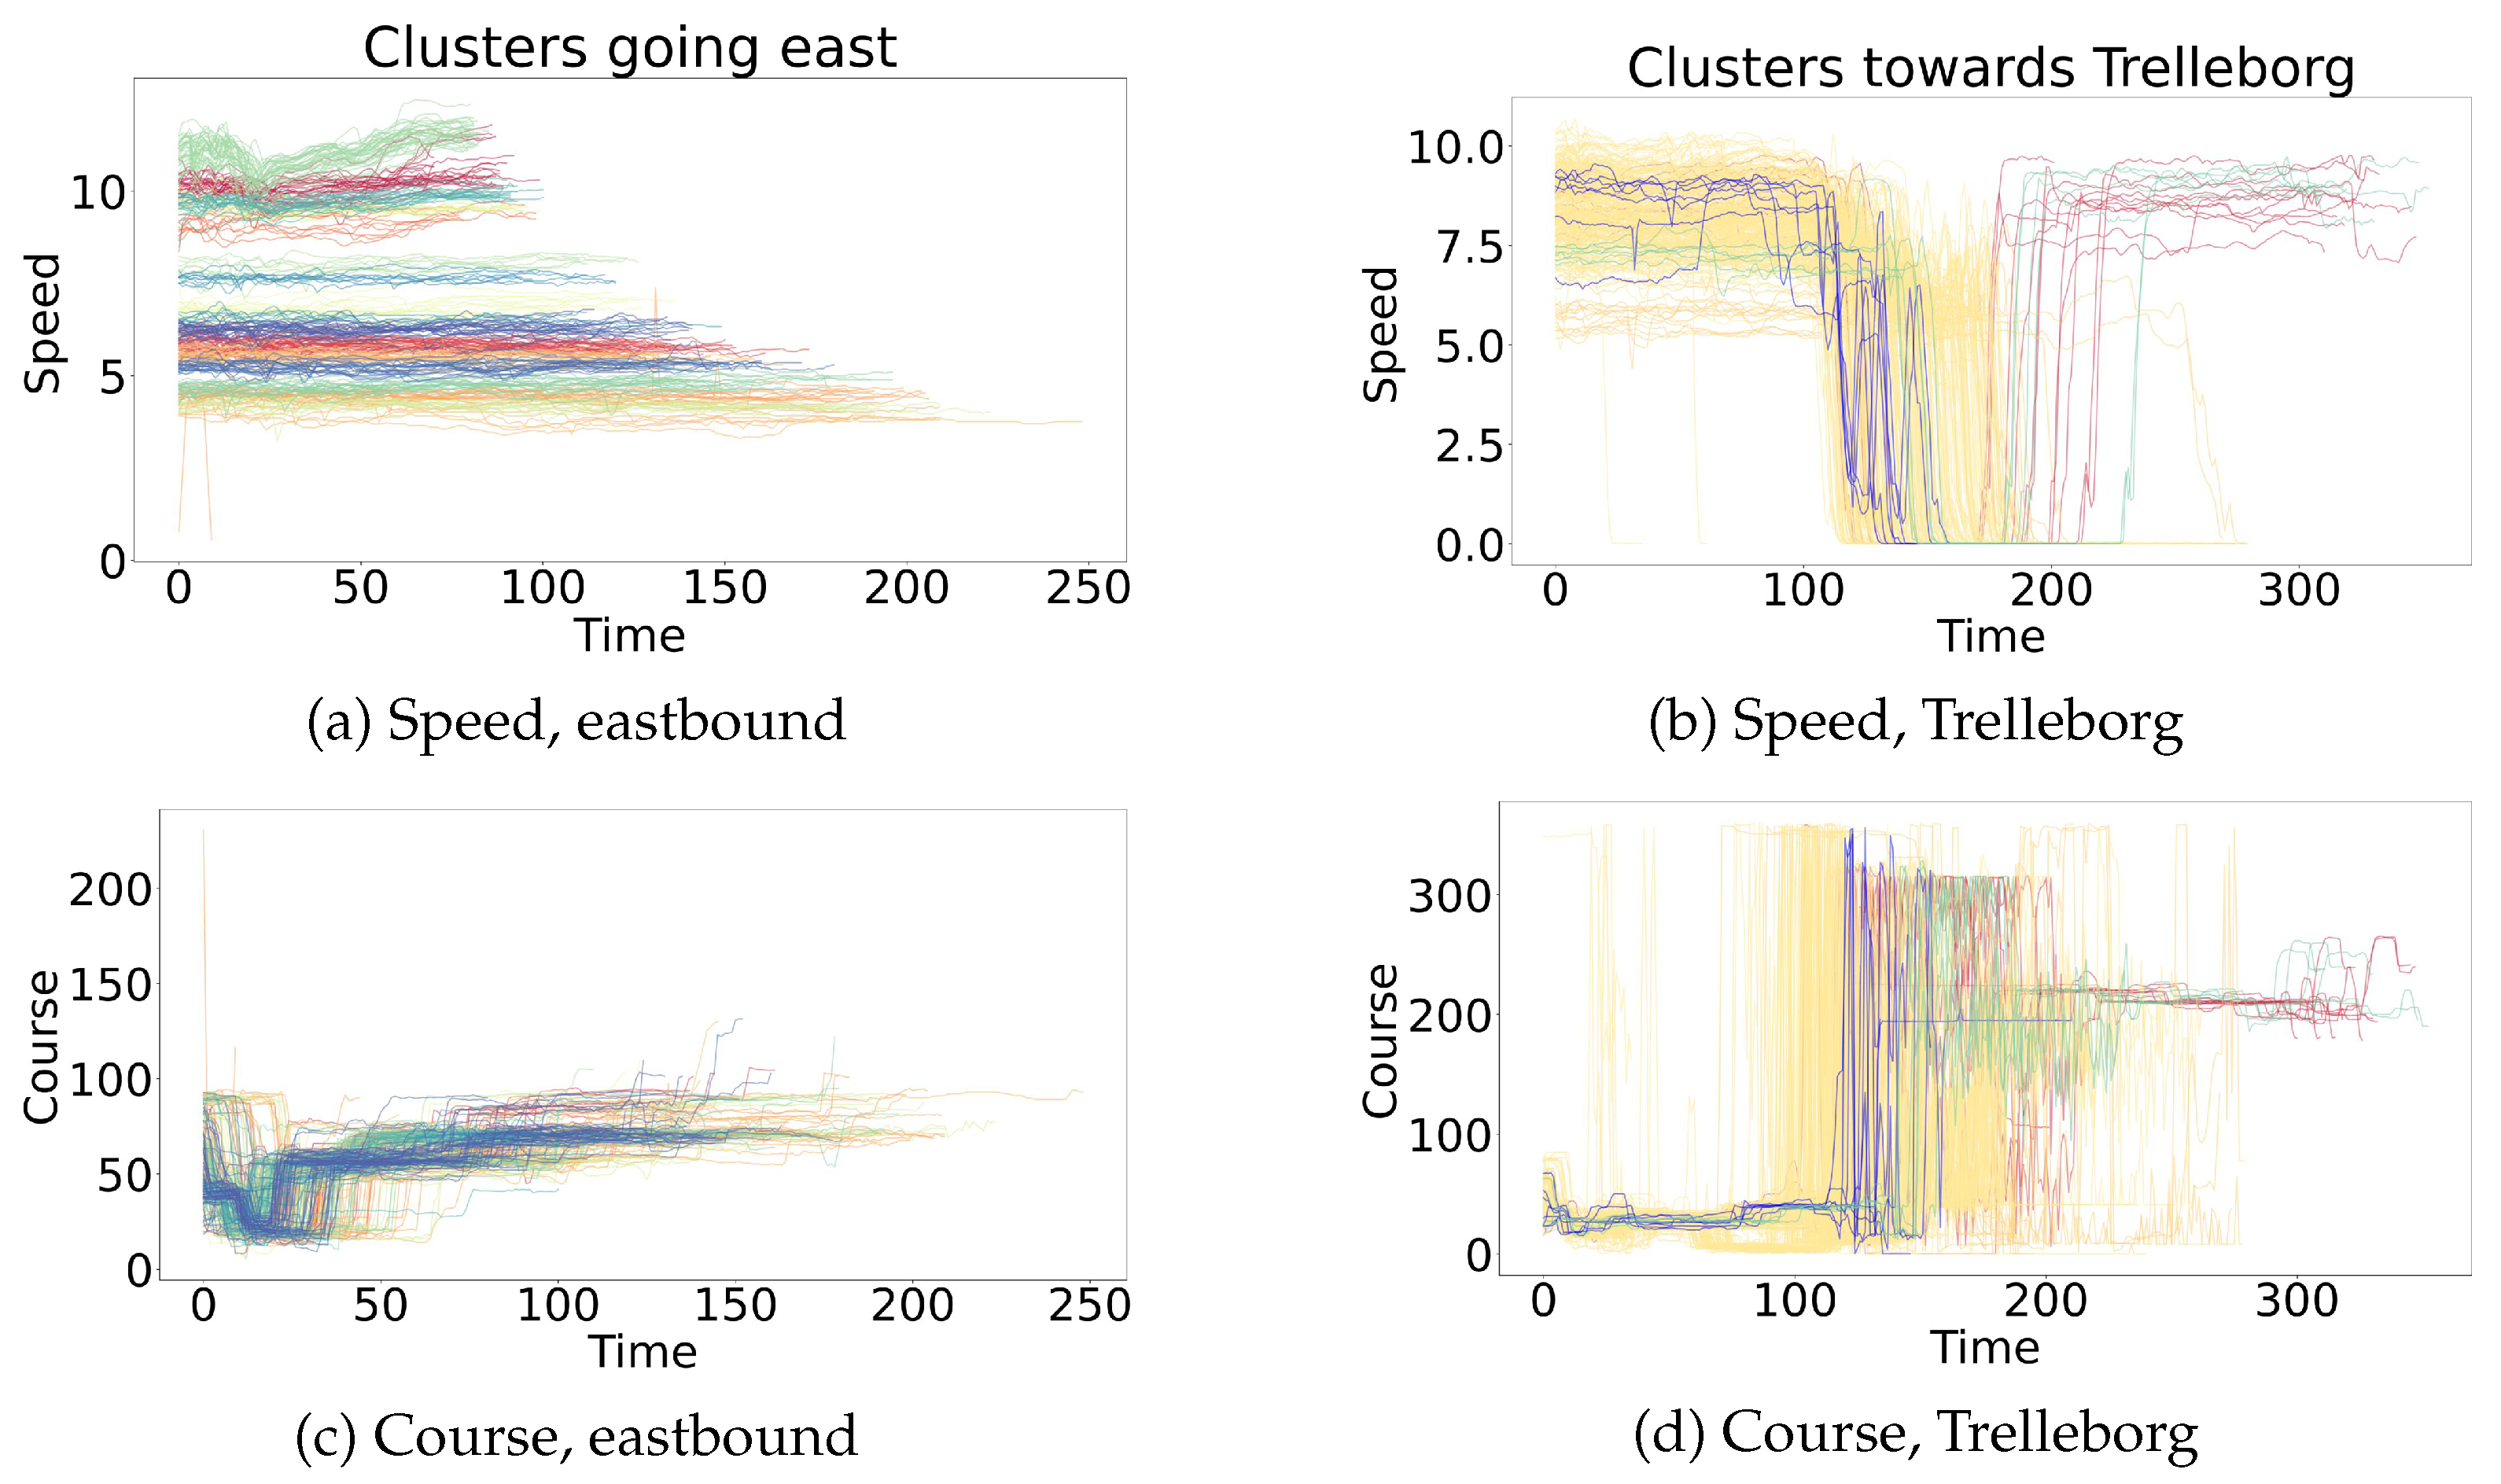
(2b) Kinematic Clustering: The explanation or context of the prediction of the LOF consists of the most similar historical trajectories. Again, with the aim of speeding up calculations, these trajectories will be extracted from a precomputed hierarchical clustering with average linkage of the trajectories of the assigned positional cluster, using as a similarity measure. The cluster assignment is decided by a KNN classifier with using and trained on that kinematic clustering.


 ,
, 


