Article

Simulation and Experimental Research on the Failure of Marine Sliding Bearings

1
College of Marine Engineering, Dalian Maritime University, Dalian 116026, China
2
Hebei Huabei Diesel Engine Co., Ltd., Shijiazhuang 050081, China
3
Navigation College, Dalian Maritime University, Dalian 116026, China
4
Ocean School, Yantai University, Yantai 264005, China
*
Author to whom correspondence should be addressed.
J. Mar. Sci. Eng. 2023, 11(1), 61; https://doi.org/10.3390/jmse11010061
Submission received: 2 December 2022 / Revised: 22 December 2022 / Accepted: 24 December 2022 / Published: 1 January 2023
(This article belongs to the Special Issue Failure Analysis of Marine Structure II)

Abstract

:
The performance of the marine sliding bearing affects the reliability of marine engineering directly. Nevertheless, sliding bearings are subjected to frictional forces and problems, such as wear and fatigue, that occur after long-term use, which leads to failure. In this study, a sliding bearing friction calculation program is developed using the Fortran language, which calculates the friction force of the bearing under different working conditions. Simultaneously, a component-level sliding bearing tribology testing machine is designed, which predicts the wear failure and explores the wear mechanism for different types of sliding bearings. The model calculation results are in good agreement with the experimental data, which verifies the model’s correctness. Through the wear test, the wear mechanism of the sliding bearing is mainly scratches, and the electroplating layer in the groove is squeezed out of it and attached to the surface of the aluminum alloy to reduce friction. The model and the testing machine provide theoretical guidance for the friction durability of sliding bearings used in marine engineering and guarantee the reliability of marine engineering.

1. Introduction

Marine engineering is becoming increasingly critical, and the stability of the power system is the premise of ensuring the normal operation of marine equipment. Sliding bearings are transmission parts widely used in marine projects such as ship’s main engines, auxiliary engines, offshore platforms, deep sea winches, and subsea compressors due to their high bearing capacity and wear resistance. However, the sliding bearing wears under heavy load, lack of lubricating oil, or long-term operation, which affects their life. Therefore, it is imperative to study the tribological properties of sliding bearings, explore methods for evaluating these properties, and explore the wear mechanism, to ensure the development of marine engineering [1,2,3].
Multiple scholars have carried out studies on the tribological properties of sliding bearings. Li et al. [4] used the sliding bearing as the supporting bearing for the high-speed rolling bearing test rig for the purpose of prolonging the service life, increasing the load capacity, and promoting the operating stability. Chen et al. [5] used the time-domain numerical integration method to study the influence of factors such as fit clearance, rotor unbalance, and bearing outer ring tightening torque on the vibration response. The bearing fit clearance fault test was performed to verify the simulation results. Chiang et al. [6] developed dynamic models of the pump rotor-bearing systems, including gyroscopic moments, rotary inertias, and bending and shear deformations. The models were analyzed in order to predict the natural frequencies, produce critical speed maps, and estimate the bearing stiffness. Lin et al. [7] reviewed the advantages of replacing the mechanical bearings of low-temperature pumps with radial high-temperature superconductor (HTS) bearings. Zeng et al. [8] studied the characteristics of the flow and pressure in the axletree room by a computed fluid dynamics method for the abrasion of the axletree. Analysis showed that the reason for the abrasion and high heat generation rate of the axletree was cavitation; the cavitation was caused by the flow acceleration effect of the local area. Iwata et al. [9] used a bearing tester that was certified by the International Organization for Standardization to reproduce the sliding behavior occurring between the crank journal and main bearings in actual engines. Henry et al. [10] developed an experimental approach to analyze the behavior of different types of thrust bearings with fixed geometry. They mainly focused on the capability of textured thrust bearings to lift up during start-up. Jang et al. [11] developed an analytical model to study an unloaded journal bearing. This model consisted of two concentric cylinders containing lubricant, where the inner one rotated at a specified rpm, and the outer one was stationary. The appropriate governing equations and numerical solution schemes for treating the transient heat transfer in the fluid and the bounding solids were then presented. Pathak et al. [12] investigated the antiseizure and antifriction characteristics of a number of AI-Si-Pb alloys with silicon contents in the range of 2–20 wt.% and lead contents in the range of 0–10 wt.% under different lubrication conditions using a bearing test machine. Li et al. [13] calculated the pressure of the oil film with surface roughness and introduced the generalized Reynolds equation of the average flow model. The oil film temperature control equation and the bearing heat conduction equation were used to calculate the bearing temperature. In this setting, the Reynolds equation, temperature control equation, and journal motion equation were combined to establish the transient thermoelastic fluid lubrication analysis model of journal bearings. To establish the calculation model of the hydrodynamic sliding bearing, Luo et al. [14] considered the conservation equation in the flow field of the sliding bearing under the boundary condition when the oil film breaks and subsequently applied the finite volume method to calculate the fluid character. Xie et al. [15] analyzed the relationship between bearing and coaxial neck rotation speed based on the computational fluid dynamics analysis of sliding bearing oil film and established an oil film finite element model. The variations of the oil film pressure, the bearing capacity, the oil film component distribution, and the bearing bush stress and strain were analyzed under the condition of journal speed variation. Gerzos et al. [16] used semi-Sommerfeld conditions as boundary conditions and obtained the lubrication state of non-Newtonian fluid and the static characteristics of bearings lubricated, using Newtonian fluid, by solving the N–S basic equation. Song et al. [17] found that the bearing capacity of oil film was inversely proportional to the gas holdup value at high speed. In order to reduce the influence of cavitation, the increase in oil supply pressure and the decrease in oil film thickness can be used.
Although multiple scholars have studied the tribological properties of sliding bearings, their work has always cut sliding bearings into small samples, which is far from reality. Moreover, the calculation is always separate from experimentation, and the wear mechanism of the sliding bearing is still ambiguous. In this study, a simulation model is established, and a component-level tribological test machine is designed to investigate the tribological properties of the sliding bearing by calculation and experiment. Furthermore, the wear mechanism is analyzed through the wear test. This study aims to provide theoretical guidance for the friction durability and life prediction of sliding bearings used in marine engineering.

2. Simulation Model

2.1. Assumption

The Fortran language was used to calculate the lubrication and force of the sliding bearing. The assumptions of the model are as follows:
(1)
The body force of the lubricating fluid is ignored;
(2)
It is modified. The lubricating fluid does not slide on the interface, that is, the relative velocity between the interface fluid and the surface is zero;
(3)
The fluid pressure and viscosity remain unchanged in the thickness direction of the lubricating oil film;
(4)
The thickness of the lubricating oil film is much smaller than the radius of curvature of the surface of the friction pair, so the influence of the oil film curvature is ignored;
(5)
The flow is laminar, and there is no turbulence in the lubricating oil film;
(6)
The inertial force of the lubricating fluid is ignored.

2.2. Average Reynolds Equation

The average Reynolds equation was used to characterize the rough surface via a statistical method. Afterward, the Reynolds equation was modified by the flow factor to consider the influence of the rough surface on lubrication. The governing equation is [18,19]:
x ( ϕ x ρ h 3 u P ¯ x ) + y ( ϕ y ρ h 3 u P ¯ y ) = 6 U ρ ϕ c h x + 6 U σ ( ρ ϕ s ) x + 12 ρ ϕ c h t
where h is the nominal lubricant film thickness, σ the root mean square of surface roughness, ϕx and ϕy are the pressure flow factors, ϕs denotes the shear flow factor, and ϕc represents the dimensionless contact factor. The pressure flow factor and shear flow factor are functions of the root mean square of surface roughness, surface orientation parameters, and lubricating oil film thickness obtained through local lubrication numerical analysis experiments. The dimensionless contact factor is a function of the root mean square of surface roughness and lubricating oil film thickness and is related to the way the surface roughness is distributed.

2.3. Oil Film Geometric Equation

(1) Nominal oil film thickness
The nominal oil film thickness refers to the oil film thickness between the two surfaces of the shaft and the bearing bush without considering the surface’s roughness. Its expression is:
h = h 0 + h x + h y
where h0 is the minimum oil film thickness between the lubricating surfaces of the bearing bush and the shaft. This is a critical parameter, which is often adjusted in the calculation to make the calculation results converge; hx and hy represent the incremental value of the bearing oil film thickness in the x- and y- directions, respectively.
(2) Actual oil film thickness
Due to the limitations of processing and manufacturing technology, as well as processing accuracy, it is impossible to process the sliding bearing and shaft with an absolutely smooth surface, so a certain roughness does exist on both surfaces of the bearing. Moreover, for multiple high-power internal combustion engines, the sliding bearing needs to bear a large alternating load. At this time, the oil film pressure of the bearing is significantly large, and the minimum oil film thickness of the bearing is extremely small, the roughness peak value of the bearing surface and the minimum oil film thickness value are almost of the same order of magnitude, and the bearing surface often produces contact with rough peaks. Thus, the surface morphology of the bearing has a major impact on the lubricating characteristics of the bearing. Therefore, the actual factors such as surface roughness and rough surface profile must be taken into account when carrying out the analysis of the bearing lubrication performance.
The force on the bearing surface generates elastic deformation, which causes the thickness of the oil film to change. Furthermore, the actual bearing surface is rough, and the surface morphology—especially the peaks and valleys—also causes changes in the thickness of the bearing oil film. In summary, when the bearing surface roughness and elastic deformation factors are taken into account, the calculated oil film thickness becomes the actual oil film thickness, which is expressed as:
h T = h + δ 1 + δ 2
where h is the nominal oil film thickness, δ1 and δ2 represent the random roughness height of the shaft and bearing surface, respectively, and the elastic deformation is negligible.
(3) Lubricating oil viscosity
In the numerical analysis of lubrication, the viscosity-temperature and viscosity-pressure characteristics of the lubricating oil are the influencing factors to be considered. The change in oil viscosity with temperature is a critical characteristic of oil. Lubricating oil viscosity is a macroscopic manifestation of the momentum and gravitational effects between the molecules inside the lubricating oil. When the temperature increases, the average velocity of the fluid molecules augments, and the momentum increases; the distance between the molecules increases while the force between the molecules decreases. Generally, the viscosity of liquids diminishes rapidly with increasing temperatures, while the viscosity of gases increases slightly with increasing temperatures. Moreover, the change in oil viscosity with pressure is a major characteristic of oil. When the pressure on the fluid increases, the distance between the fluid molecules decreases, the interaction force augments, and the viscosity increases. This study adopts the Roeland viscosity model [20,21].
u = u 0 exp { ( ln u 0 + 9.67 ) [ ( 1 + 5.1 × 10 9 p ) Z × ( T - 138 T 0 138 ) S 1 ] }
where T0 is the reference temperature, T is the actual temperature, u0 is the viscosity at T0, p is the actual pressure of the lubricating oil, Z is the viscosity-pressure index, and S is the viscosity-temperature index.
(4) Flow factor
The formula for calculating the pressure flow factor is as follows [18]:
{ ϕ x = 1.0 C e r H γ 1 ϕ x = 1.0 + C e r H γ > 1 ϕ y ( 1 , γ ) = ϕ x ( λ , 1 / γ )
where C and r are constants. ϕx and ϕy represent the pressure flow factors in the x- and y- directions, respectively. γ indicates the direction of bearing surface roughness: when γ is superior to 1, it means longitudinal rough stripes; when γ is inferior to 1, it means transverse rough stripes; and when γ is equal to 1, it means isotropic rough stripes. However, generally, γ is set to 1.
The formula for calculating the shear flow factor is as follows [19]:
ϕ s = ( δ 1 δ ) 2 Φ s ( H , γ 1 ) ( δ 2 δ ) 2 Φ s ( H , γ 2 )
where δ1 and δ2 represent the random roughness height of the shaft and bearing surface, respectively. γ1 and γ2 denote the grain direction parameters of the surface roughness of the shaft and bearing, respectively. ΦS is calculated as follows:
{ Φ s = A 1 H a e b H + c H 2 H 5 Φ s = A 2 e b H H > 5
where A1, A2, a, b, and c are constants.

2.4. Rough Contact Model

When the lubricating oil film is very thin, the asperities on the two rough surfaces of the bearing and journal will contact and interact with each other, which will have a certain impact on the lubricating performance of the lubricating surface. Greenwood and Tripp [22] established a roughness contact model to study the contact behavior of micro convex bodies. In this model, the probability density functions of various contact surface roughness height distributions are considered. When the probability density function of the roughness height distribution of two contact surfaces is a normal Gaussian distribution with a mean value equal to zero, the calculation expressions of the contact force between the asperities on the rough surface and the actual contact area of the rough surface are as follows:
p a s p = 16 2 15 π ( η β δ ) 2 E σ β F 2.5 ( H )
A c = π 2 ( η β δ ) 2 A F 2 ( H )
E = 1 1 v 1 2 E 1 + 1 v 2 2 E 2
F 2 ( H ) = { 1.705 * 10 4 exp ( 4.05419 ln ( 4.0 H ) + 1.37025 ( ln ( 4.0 H ) ) 2 ) H 3.5 8.8123 * 10 5 ( 4.0 H ) 2.1523 3.5 < H 4 0 H > 4
F 2.5 ( H ) = { 2.1339 * 10 4 exp ( 3.804467 ln ( 4.0 H ) + 1.341516 ( ln ( 4.0 H ) ) 2 ) H 3.5 1.1201 * 10 4 ( 4.0 H ) 1.9447 3.5 < H 4 0 H > 4
where pasp is the contact pressure of the rough asperity, Ac is the actual contact area of the rough surface, A is the nominal contact area, η and β are the contact parameters, E1 and E2 are the elastic moduli of the bearing bush and shaft, respectively, E’ is the comprehensive elastic modulus, and v1 and v2 are the Poisson’s ratio of the bearing bush and shaft, respectively. Moreover, F2(H) and F2.5(H) are calculated by an empirical formula. H is the film thickness ratio.

2.5. Friction

The roughness of the shaft and the bearing bush affect the lubrication’s performance. Under the steady-state load and the linear speed of the calibration condition, the friction mainly includes the rough contact friction and the fluid lubrication friction.
F T = F C + F V = A ( τ C + τ V ) d x d z
where τc is the rough contact shear stress and τv is the fluid lubrication shear stress.

2.6. Boundary Conditions

The boundary conditions are as follows:
p y | y = d 2 = p y | y = d 2 = 0 p ( x , l 2 ) = p ( x , l 2 ) = 0
where the x-direction represents the axial direction, and the y-direction represents the radial direction. d represents the diameter of the sliding bearing, and l denotes the width of the sliding bearing.

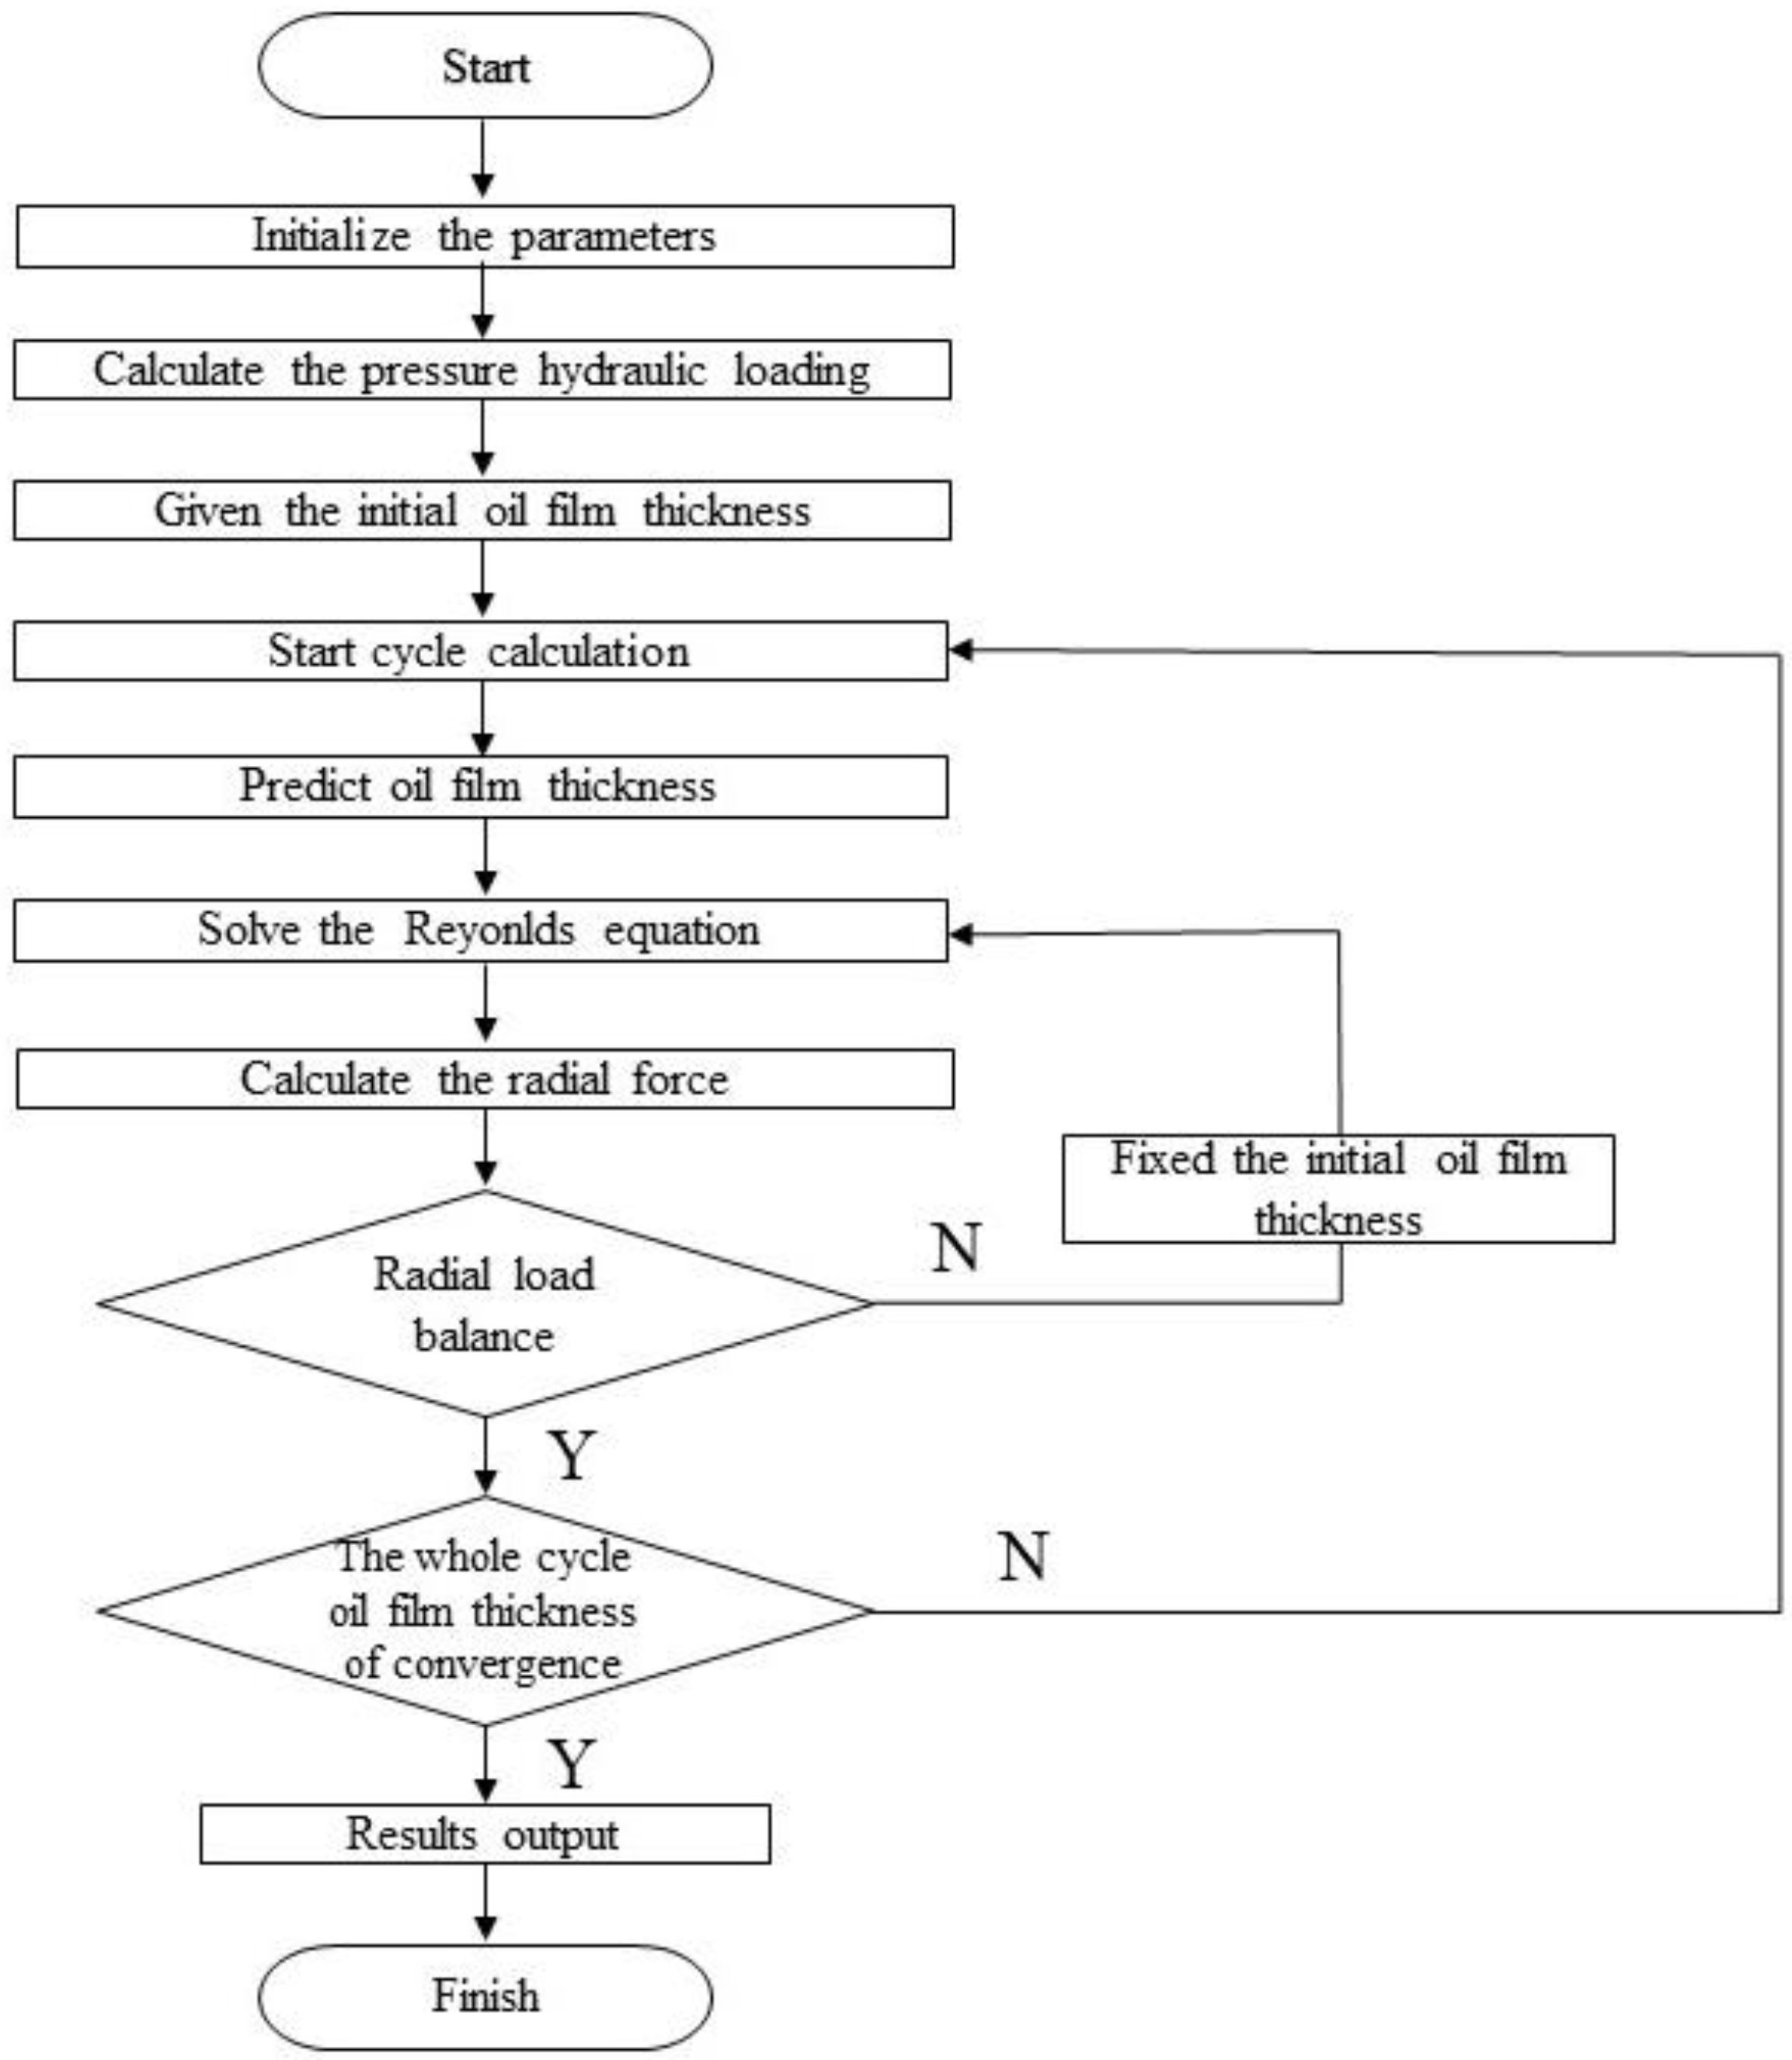
2.7. Calculation Process

The calculation process is shown in Figure 1. The program is based on the Fortran language. Firstly, each parameter of the model’s design is put into the calculation program, the load is applied to calculate the pressure on the sliding bearing, and the initial oil film thickness can be obtained at each position given the minimum oil film thickness. Secondly, the finite difference method is used to solve the average Reynolds equation, the over-relaxation iterative method is used to predict the thickness of the oil film gradually approaching the real, and the radial force of the sliding bearing is calculated to determine whether the radial load is balanced. Hence, if it is not balanced, correct the initial oil film thickness, and return to the step of solving the Reynolds equation. Recalculate according to the steps until the balance is reached, and subsequently proceed to the next step to judge whether the oil film thickness is converged. If it does not converge, go back to the beginning of the loop, and recalculate according to the steps until the result is output after convergence and the program ends. The rough peak contact friction and fluid lubrication friction between the bearing and journal can be obtained by solving the average Reynolds equation, and the friction under corresponding working conditions can be obtained by summing them. The value of calculation parameters are listed in Table A1 of Appendix A.

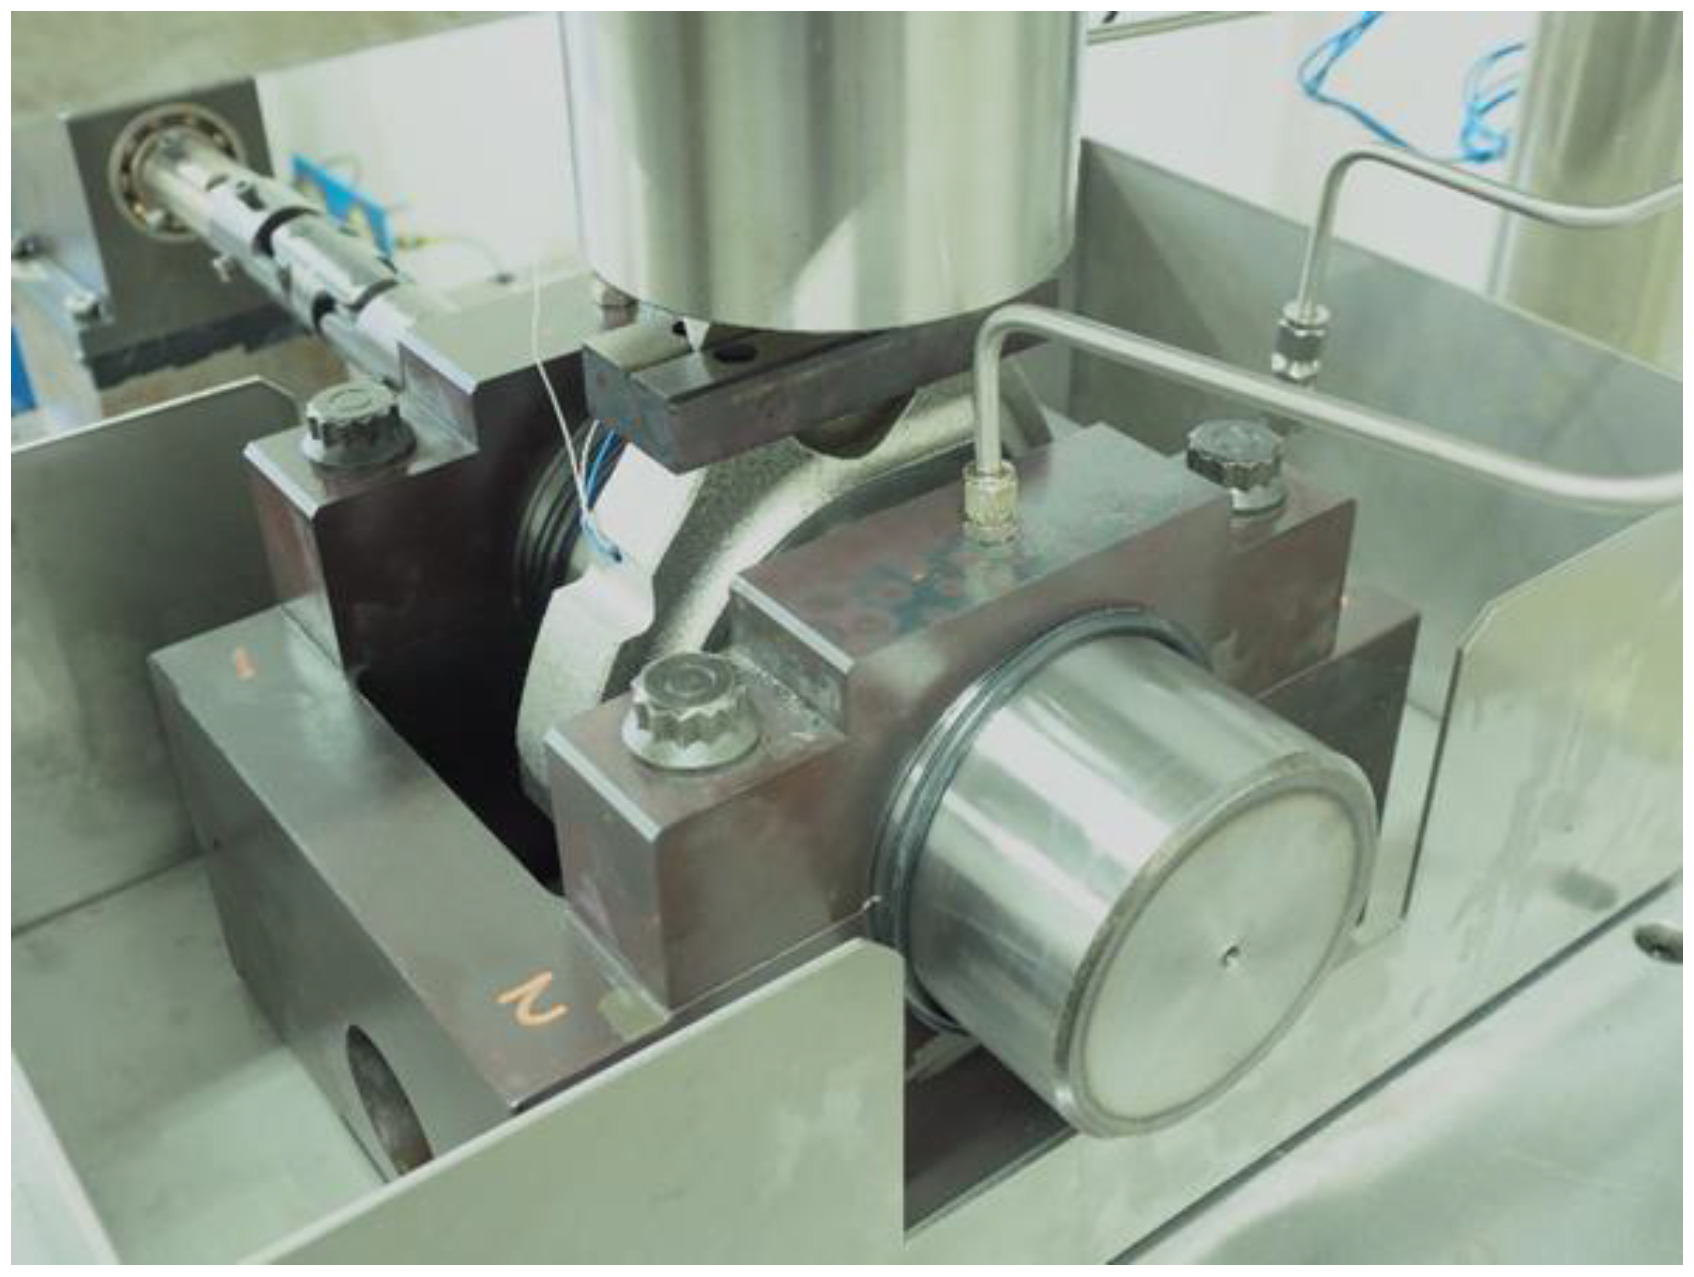
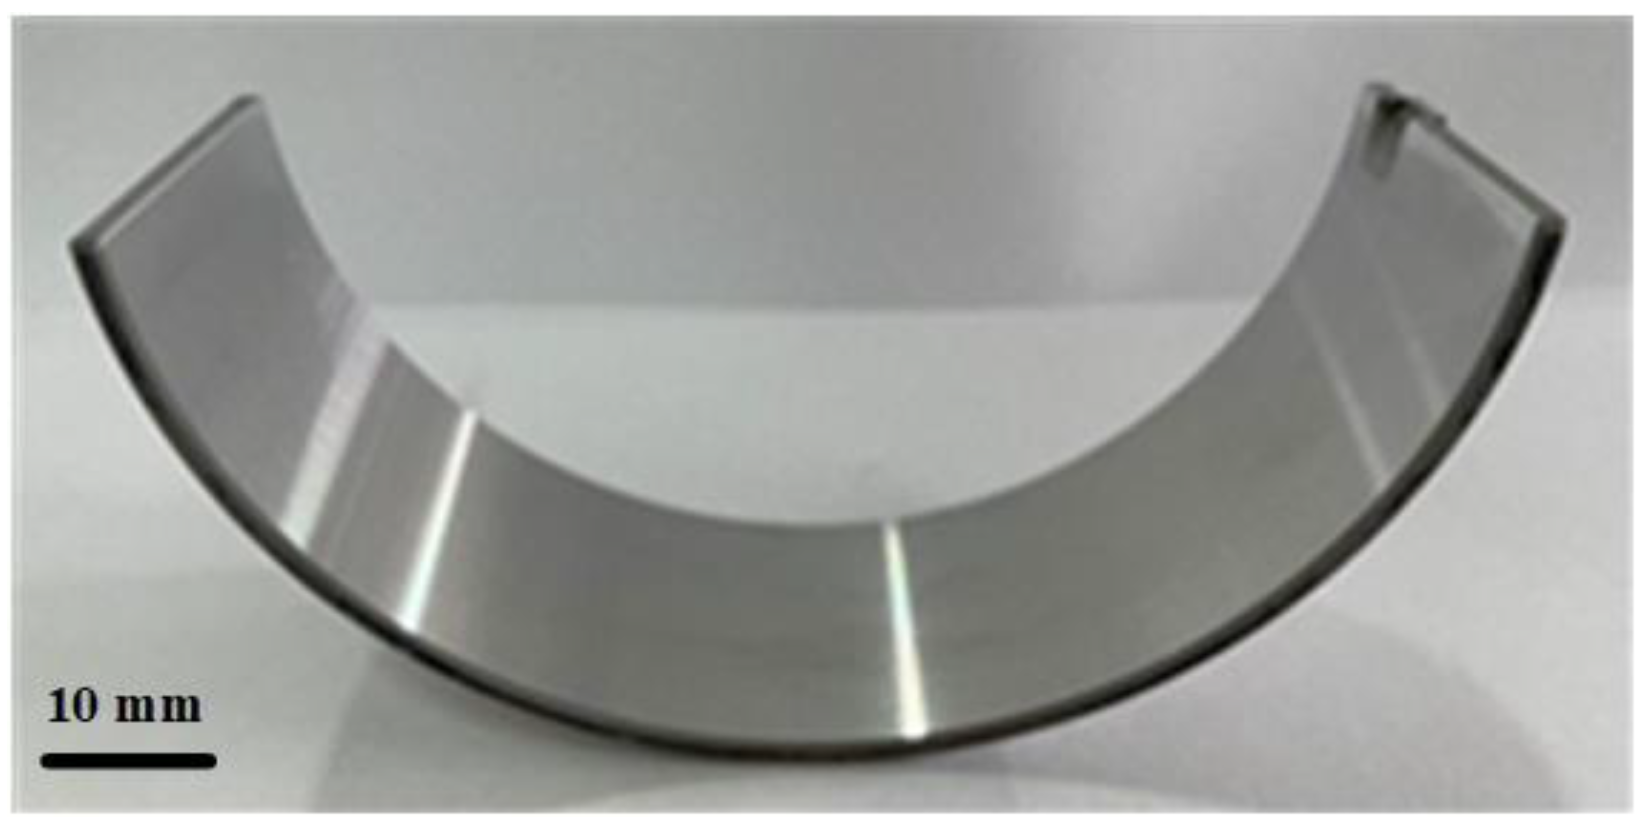
3. Experimental Details
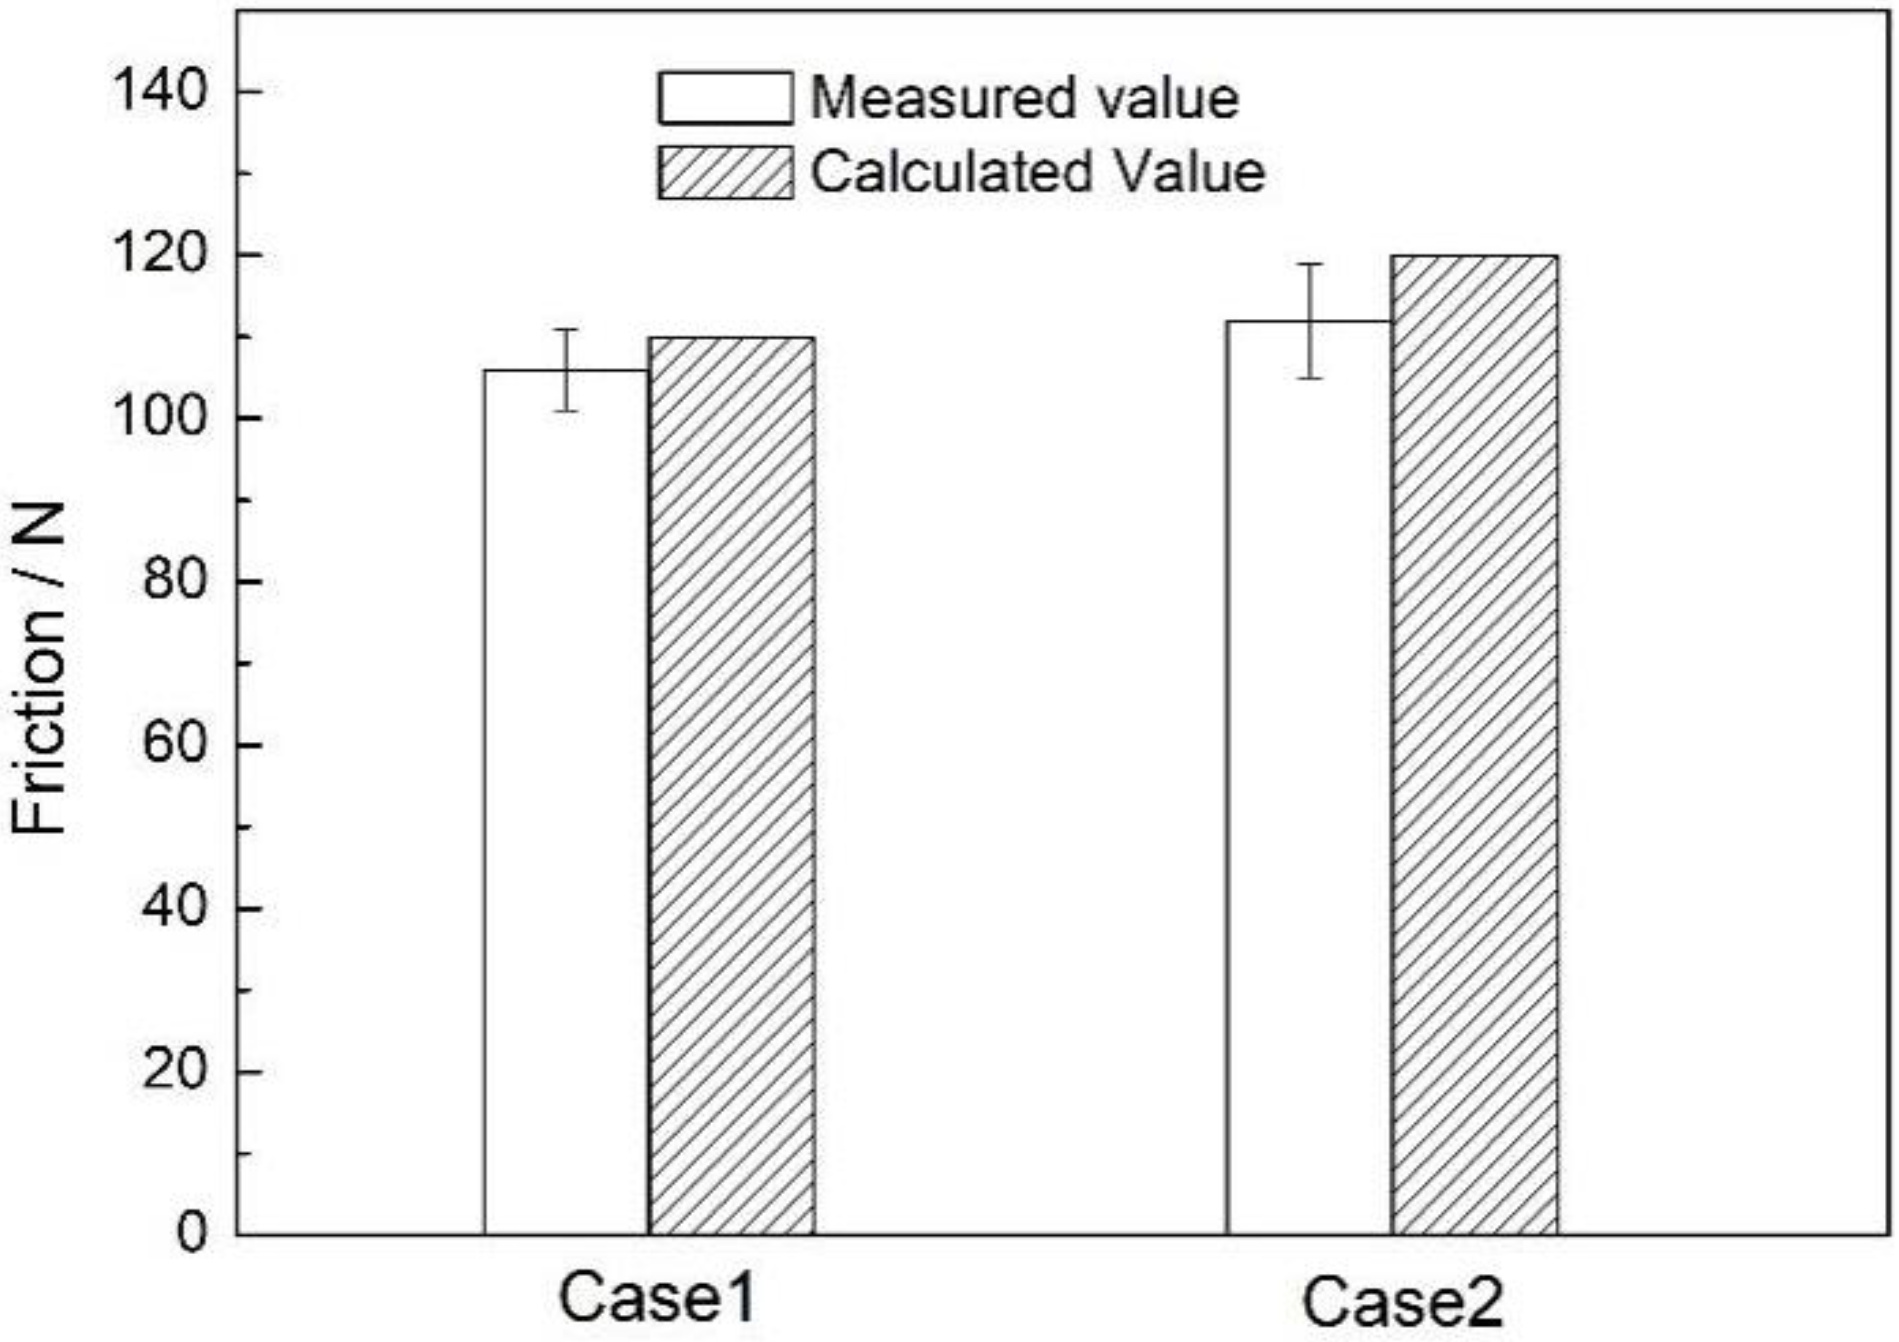
The component-level tribological test machine is shown in Figure 2. In the test, the sliding bearing was fixed and the straight shaft rotated under the drive of the motors, which provided the guarantee of the movement speed and the wear stroke for the relative friction movement of the shaft and the sliding bearing. The pressure is transmitted to the shaft along the vertical direction, providing a strengthened load to accelerate the wear. Moreover, an oil pipe was arranged below the bearing seat for the lubricating oil supply, forming an oil film between the shaft and the bearing. The friction force data was real-time collected by the sensor. The sliding bearing before testing is shown in Figure 3, while the structure diagram is shown in Figure 4. The sliding bearing is formed of steel, aluminum alloy, nickel, and PbSn18Cu2.
The wear test parameter is listed in Table 1. The sliding bearing bush is in the hydrodynamic lubrication state under normal working conditions, so it is difficult to wear. Therefore, in order to wear the bearing bush in a short time, appropriate working condition parameters are required to make the bearing bush in mixed lubrication or boundary lubrication state. The operating condition parameters are determined through a large number of tests. The speed is selected as 100 r/min, so that hydrodynamic lubrication cannot be formed. The operating temperature of the lubricating oil of the actual diesel engine is selected as the oil temperature, and the load is selected as 2 t and 3 t. Under this condition, the bearing pads will be worn after a certain period of wear. Therefore, the operating condition parameters are selected.

4. Validation

Two working conditions (Case 1 and Case 2) were selected to compare the calculated friction obtained by the simulation model and the measured friction acquired by the experiment. The loads of Case1 and Case2 are 2 tons and 3 tons, respectively, and the other parameters are the same. The measured friction is obtained during the period of normal operation. The comparison of the calculated average friction and the measured average friction is shown in Figure 5. The errors between the calculated average friction and the measured average friction are within 10% in two cases. Thus, verifying the simulation model is feasible.

5. Experimental Results and Mechanisms
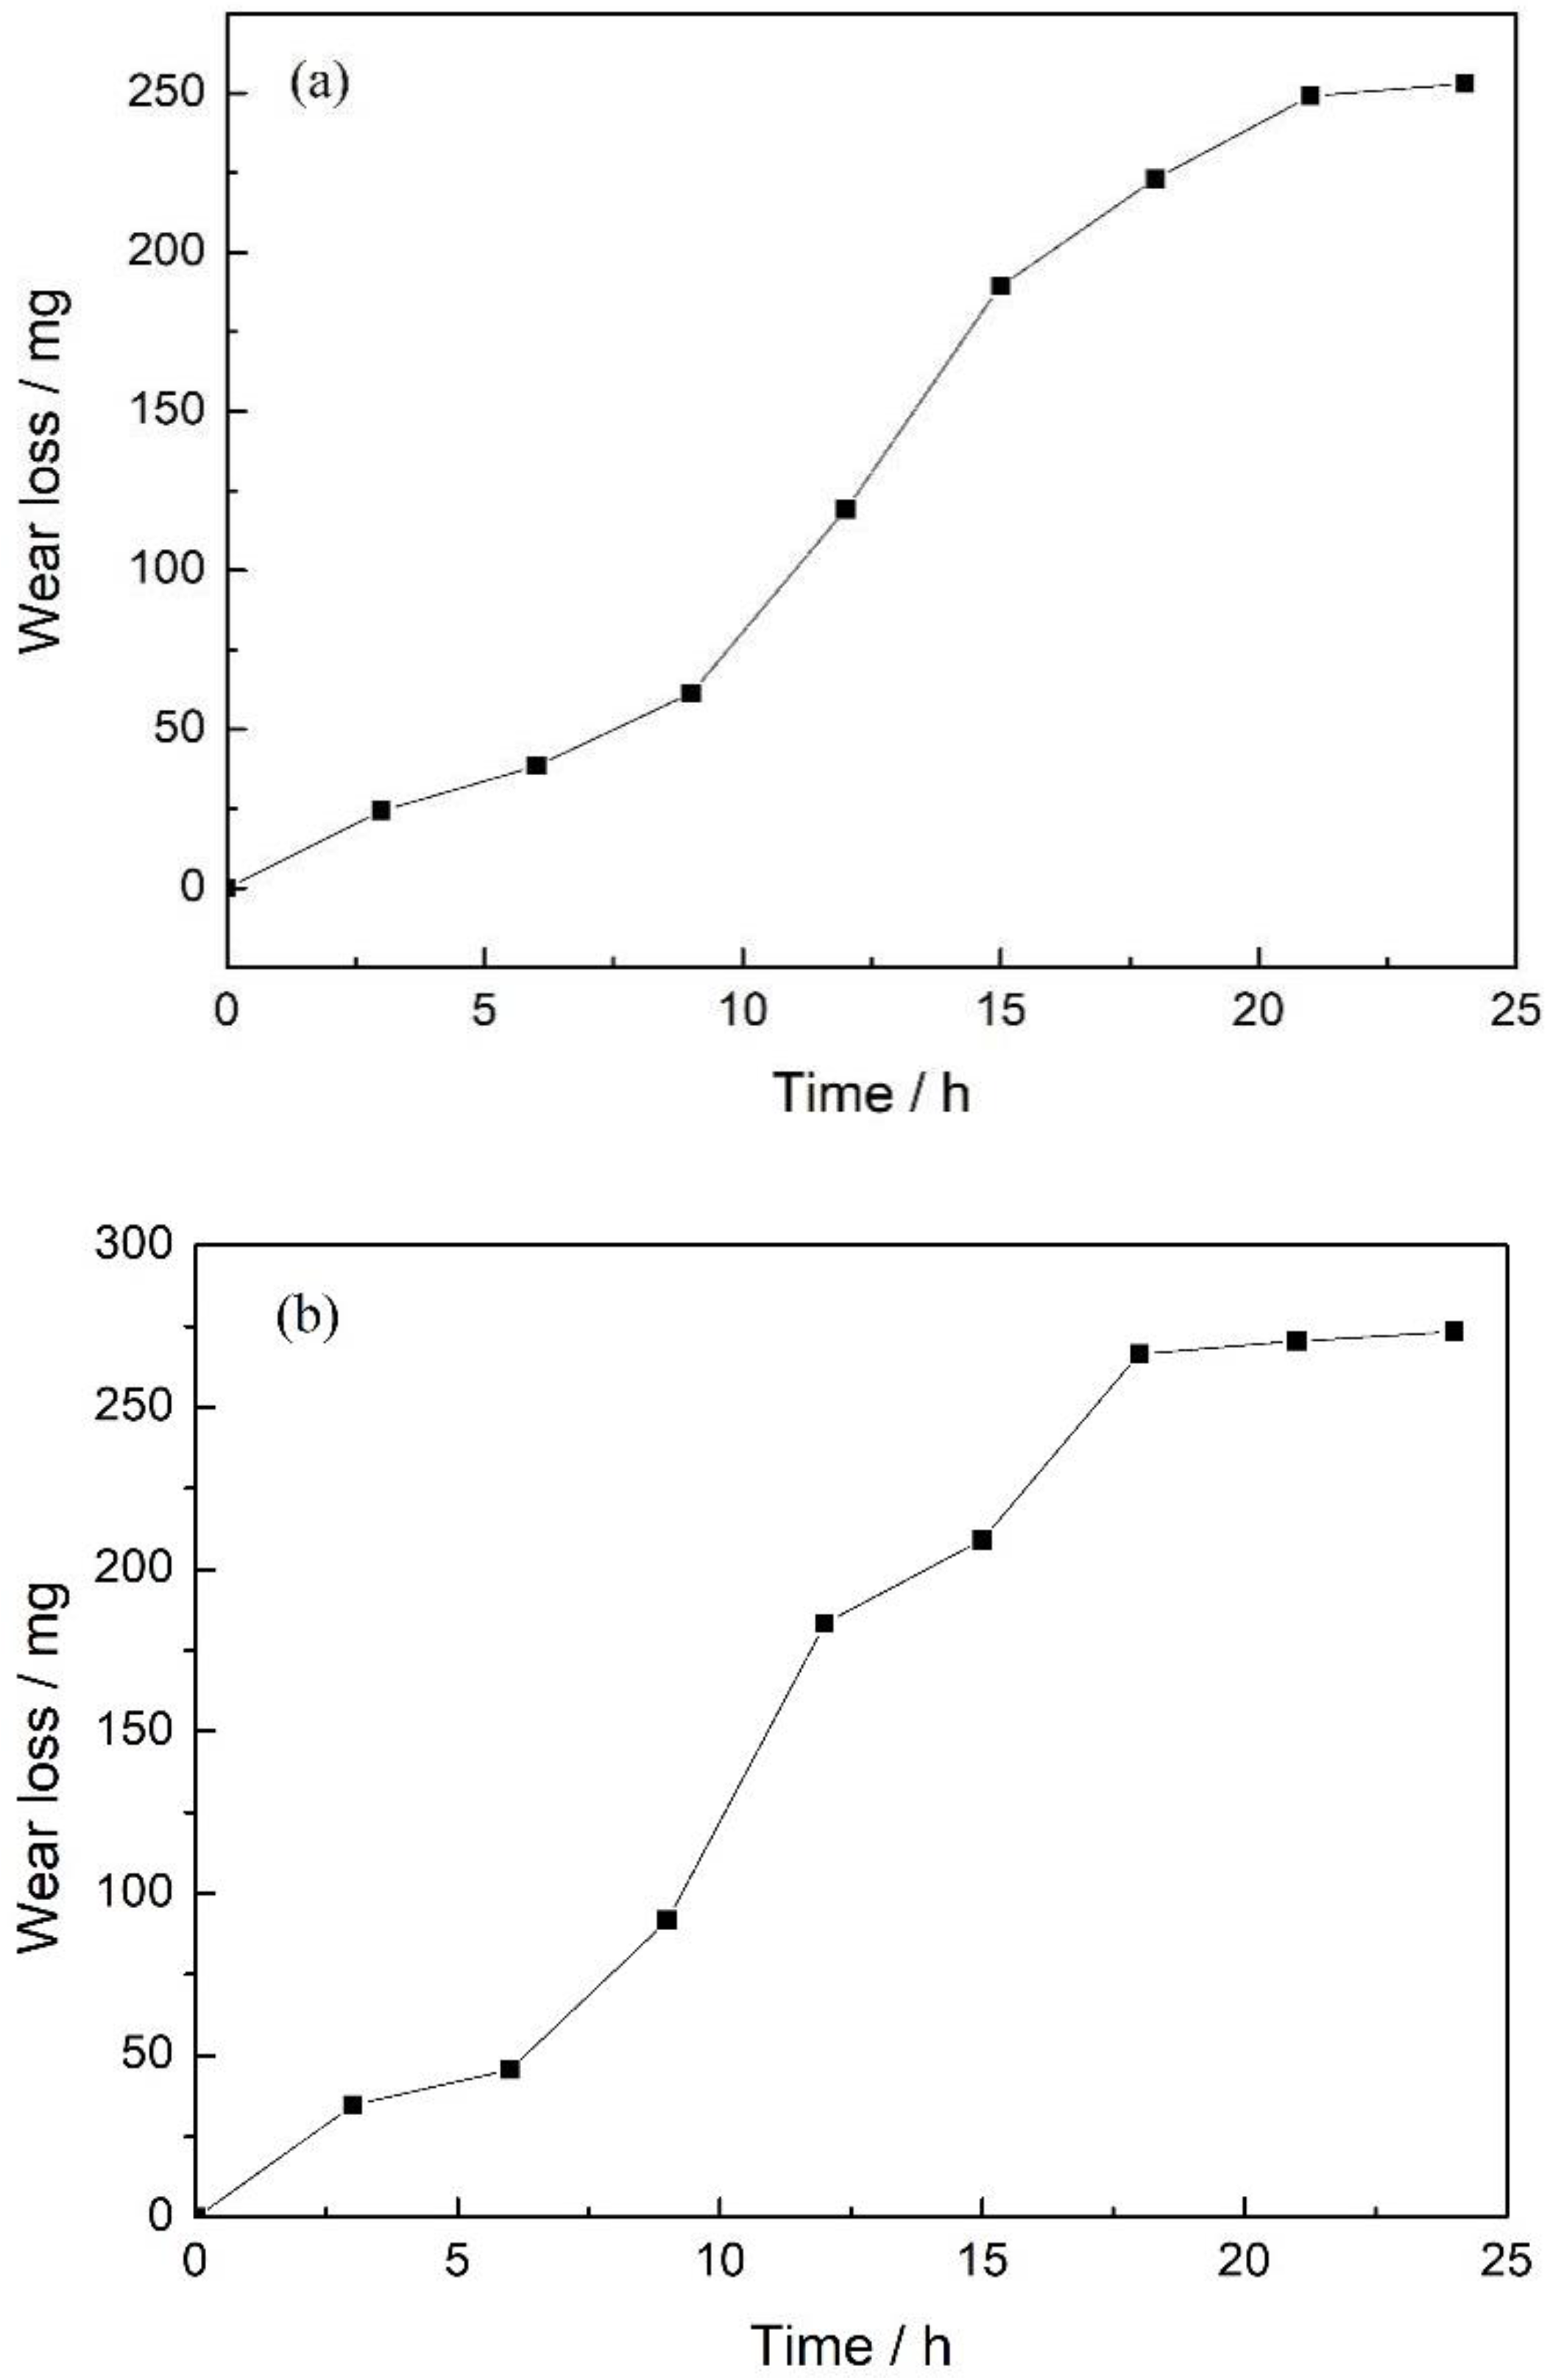
5.1. Wear Loss

An analysis balance (Mettler Toledo, Swiss) with an accuracy of 0.1 mg was used to calculate the varied weight of the bushing before and after tests. Figure 6 shows the wear loss for 24 h under the conditions of Case 1 and Case 2, and the wear amount is measured every 3 h. It is clear from the figure that with the increase in wear time, the wear amount is augmenting. In the beginning, the wear amount increases rapidly due to the fact that the wear rate is large, and after 21 h for Case 1 and 18 h for Case 2, the wear amount becomes flat. At the start, the asperities on the surface of the sliding bearing and the shaft surface are in contact with each other, and after a period of running-in, the asperities are gradually smoothed, so the initial wear amount is large. After reaching a certain running-in balance state, with the increase in time, the wear amount tends to become gentle.

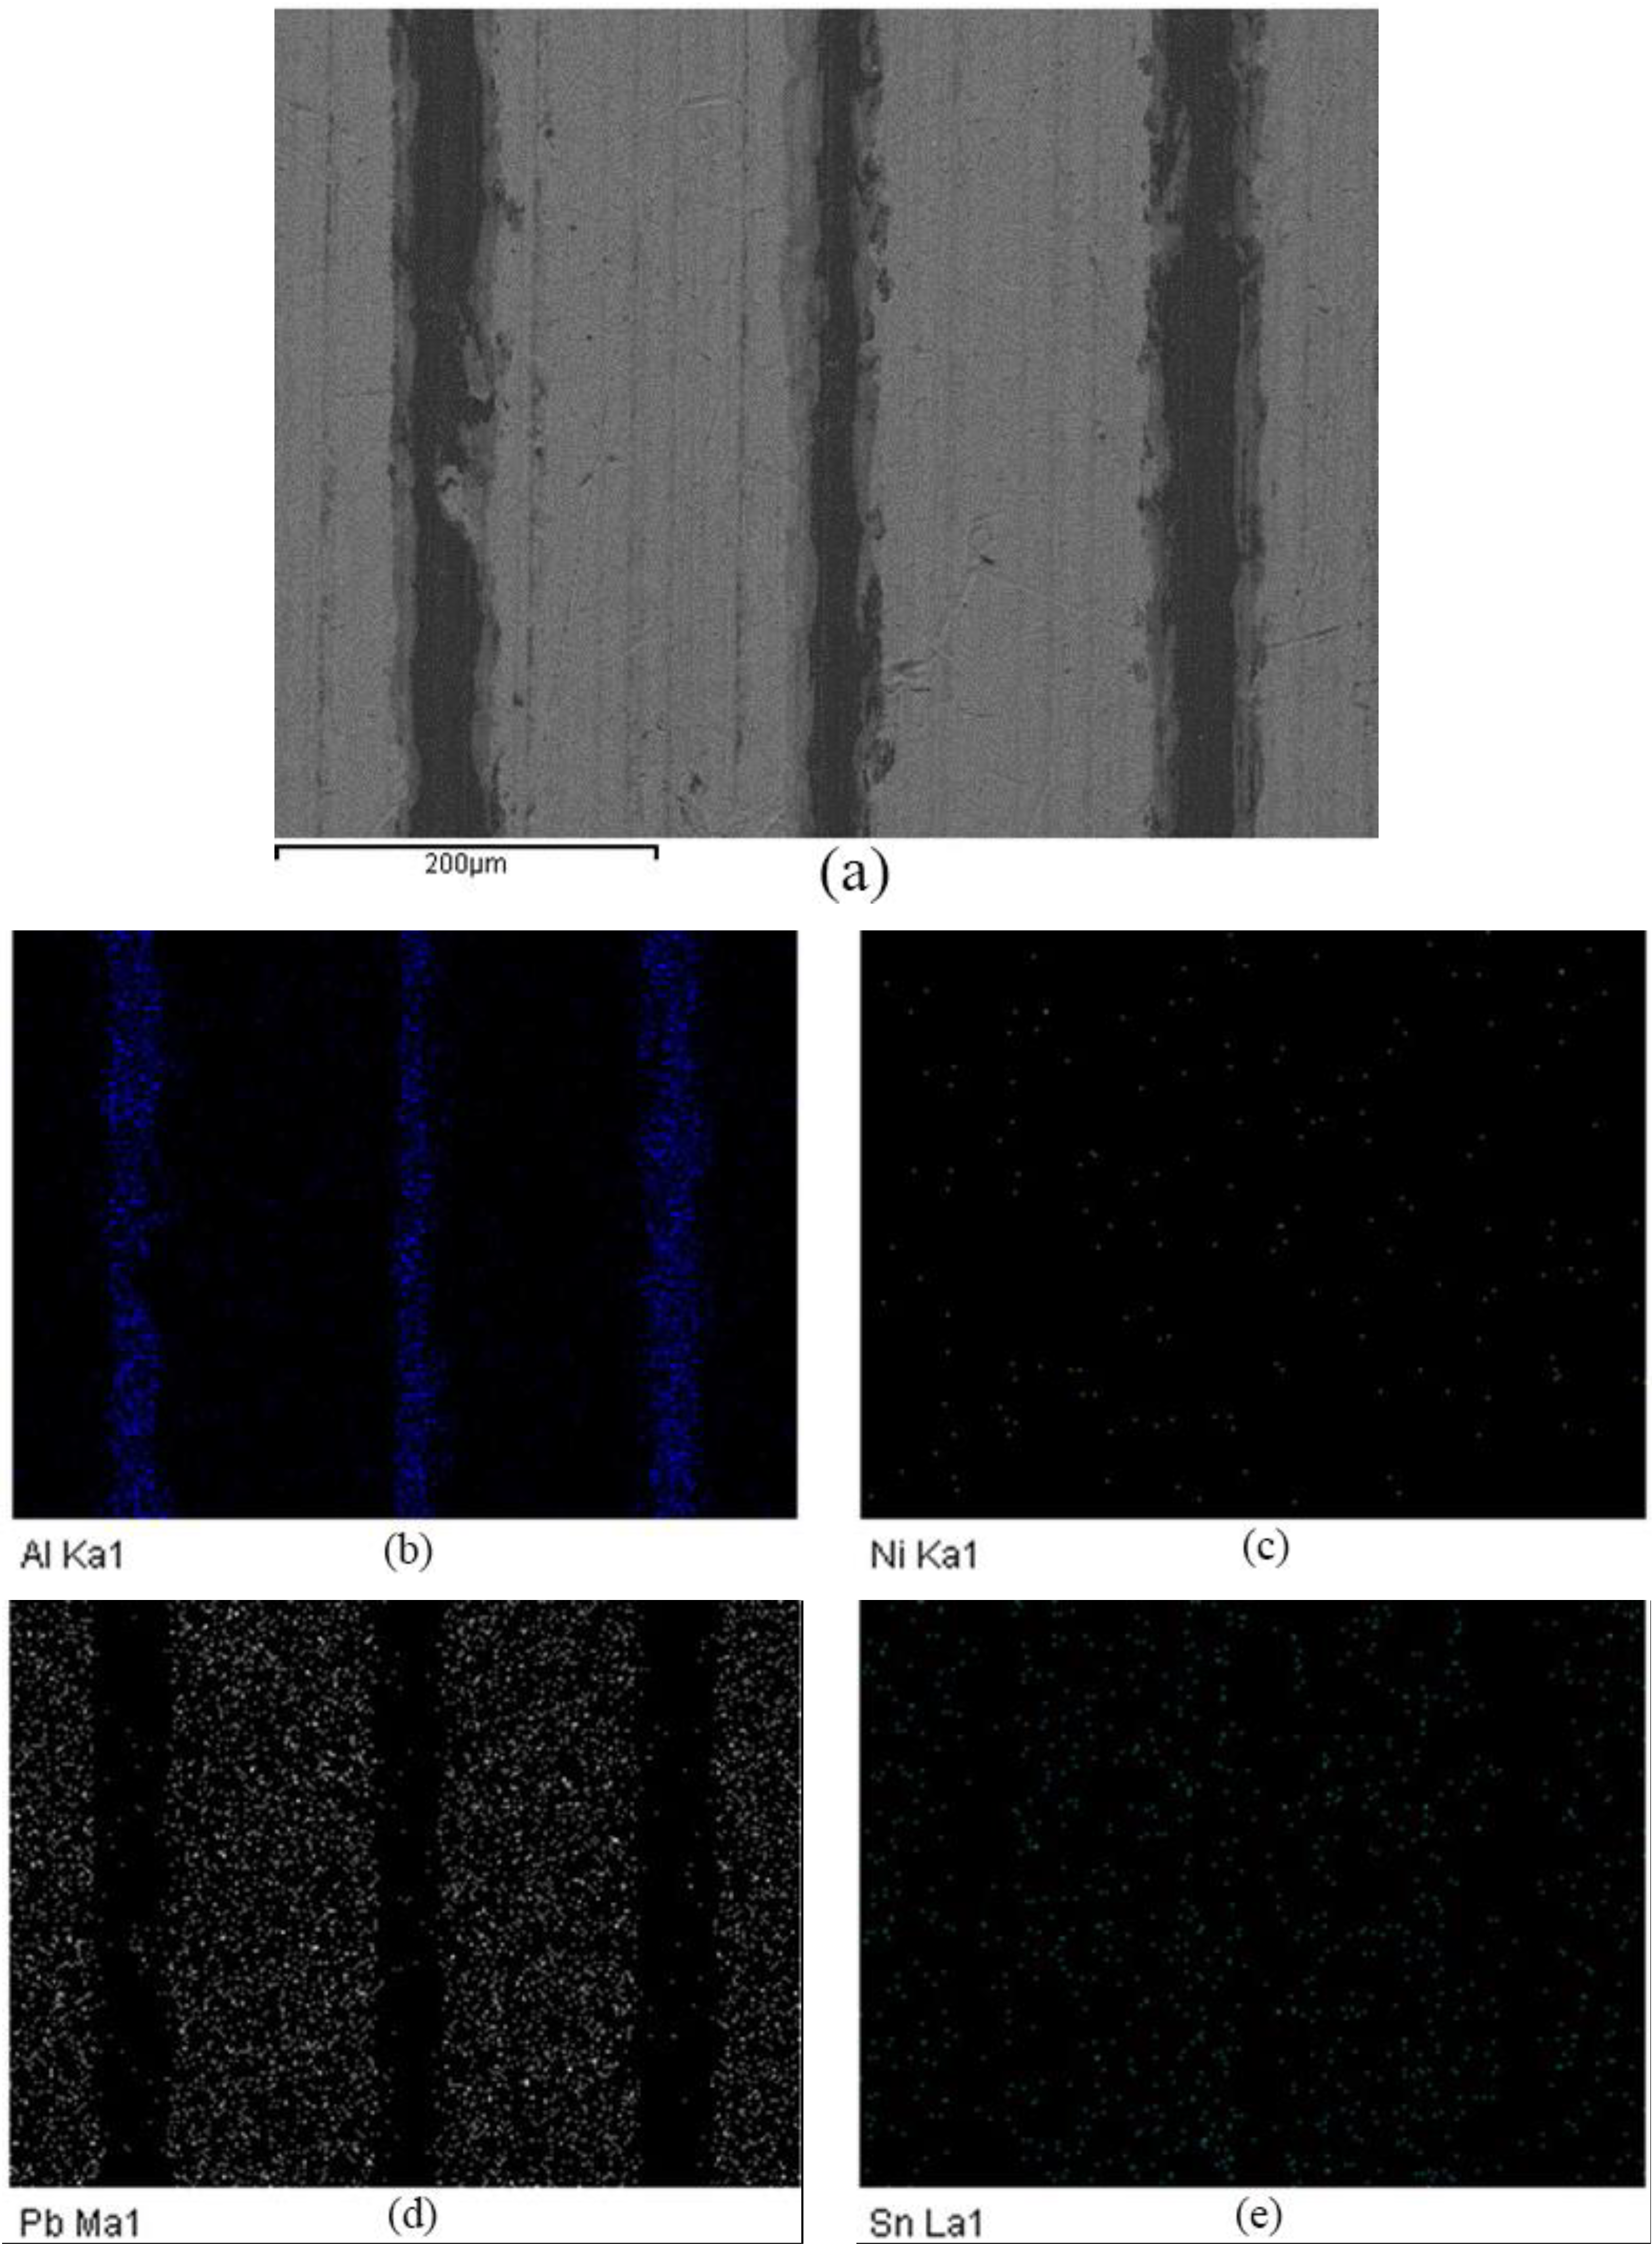
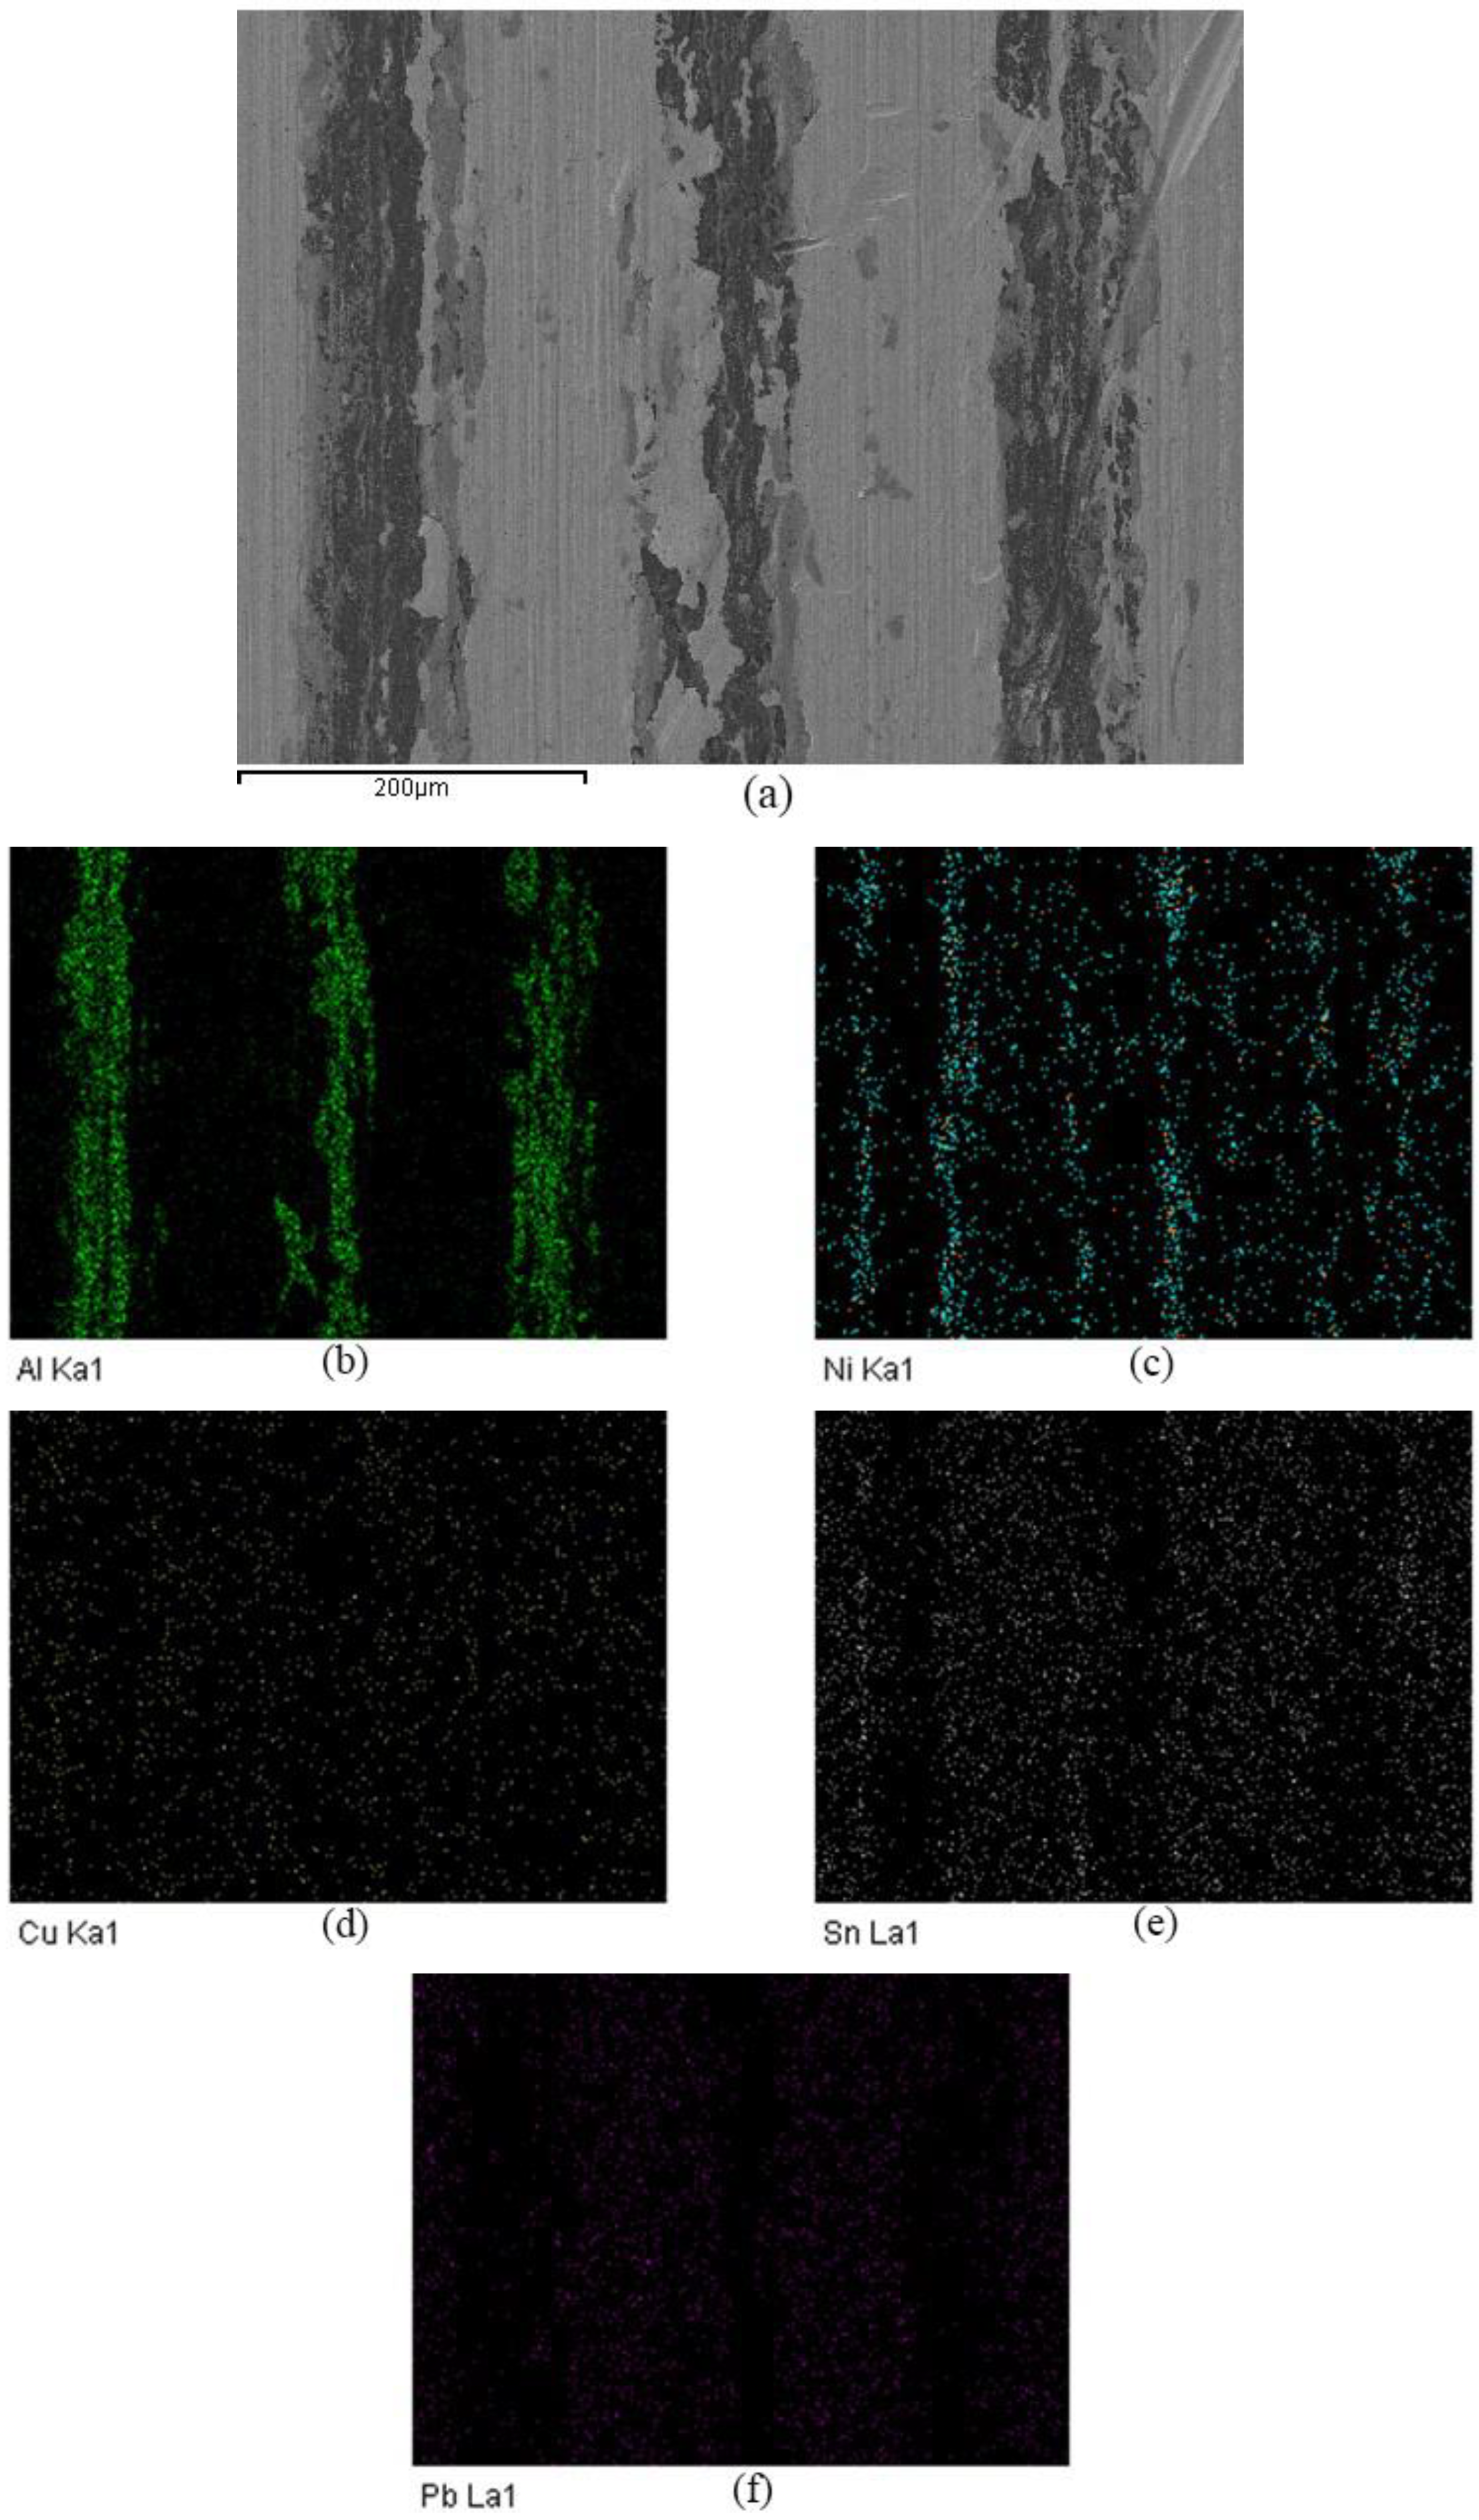
5.2. Wear Mechanisms

Philips-30 TMP scanning electron microscope with the energy dispersive X-ray spectrometer is used to investigate the surface and element. Figure 7 shows the original surface morphology and element distribution of the sliding bearing. The groove shape is clear, and the element distribution is uniform. The narrower part in the figure is the aluminum alloy, while the wider part is PbSn18Cu2. The overall surface is flat. Along the circumferential direction, there are clear marks of machining.
Figure 8 shows the surface micromorphology and element distribution after 24 h of wear. The surface coating is extruded and deformed, the edge of the coating is broken, and plastic rheology occurs simultaneously, which is attached to the surface of the aluminum alloy. There are visible scratches along the sliding direction.
Figure 9 shows the wear mechanism. Figure 9a is the original state of the sliding bearing. The aluminum alloy is combined with the steel back, there exists a groove structure on the surface of the aluminum alloy, and the nickel grid and PbSn18Cu2 ternary alloy are electroplated in the groove. The layers are well combined, and the surface coating is flat and evenly distributed. Figure 9b shows the wear mechanism of the sliding bearing. After wear, the groove structure remains, and the sliding bearing shows a trend of gradually thinning the surface. The height of the groove boss decreases, and the cross-sectional area becomes slightly wider. Under the rotational shearing action of the shaft and the sliding bearing, the ternary alloy in the groove will be taken out of the groove with the rotation of the shaft, and its edge will undergo plastic flow and adhere to the surface of the aluminum alloy boss.

6. Conclusions

In this study, the simulation and experiment are combined to investigate the wear failure of the sliding bearing. The method could provide theoretical guidance for the friction durability of sliding bearings used in marine engineering. The main conclusions are as follows:
(1)
The errors between the calculated average friction and the measured average friction are within 10%, which proves the correctness of the simulation model.
(2)
Through 24 wear tests, the wear loss of the sliding bearing is larger at the initial stage because the asperities on the surface of the sliding bearing and the shaft surface are in contact with each other, and it tends to become gentle after the running-in period.
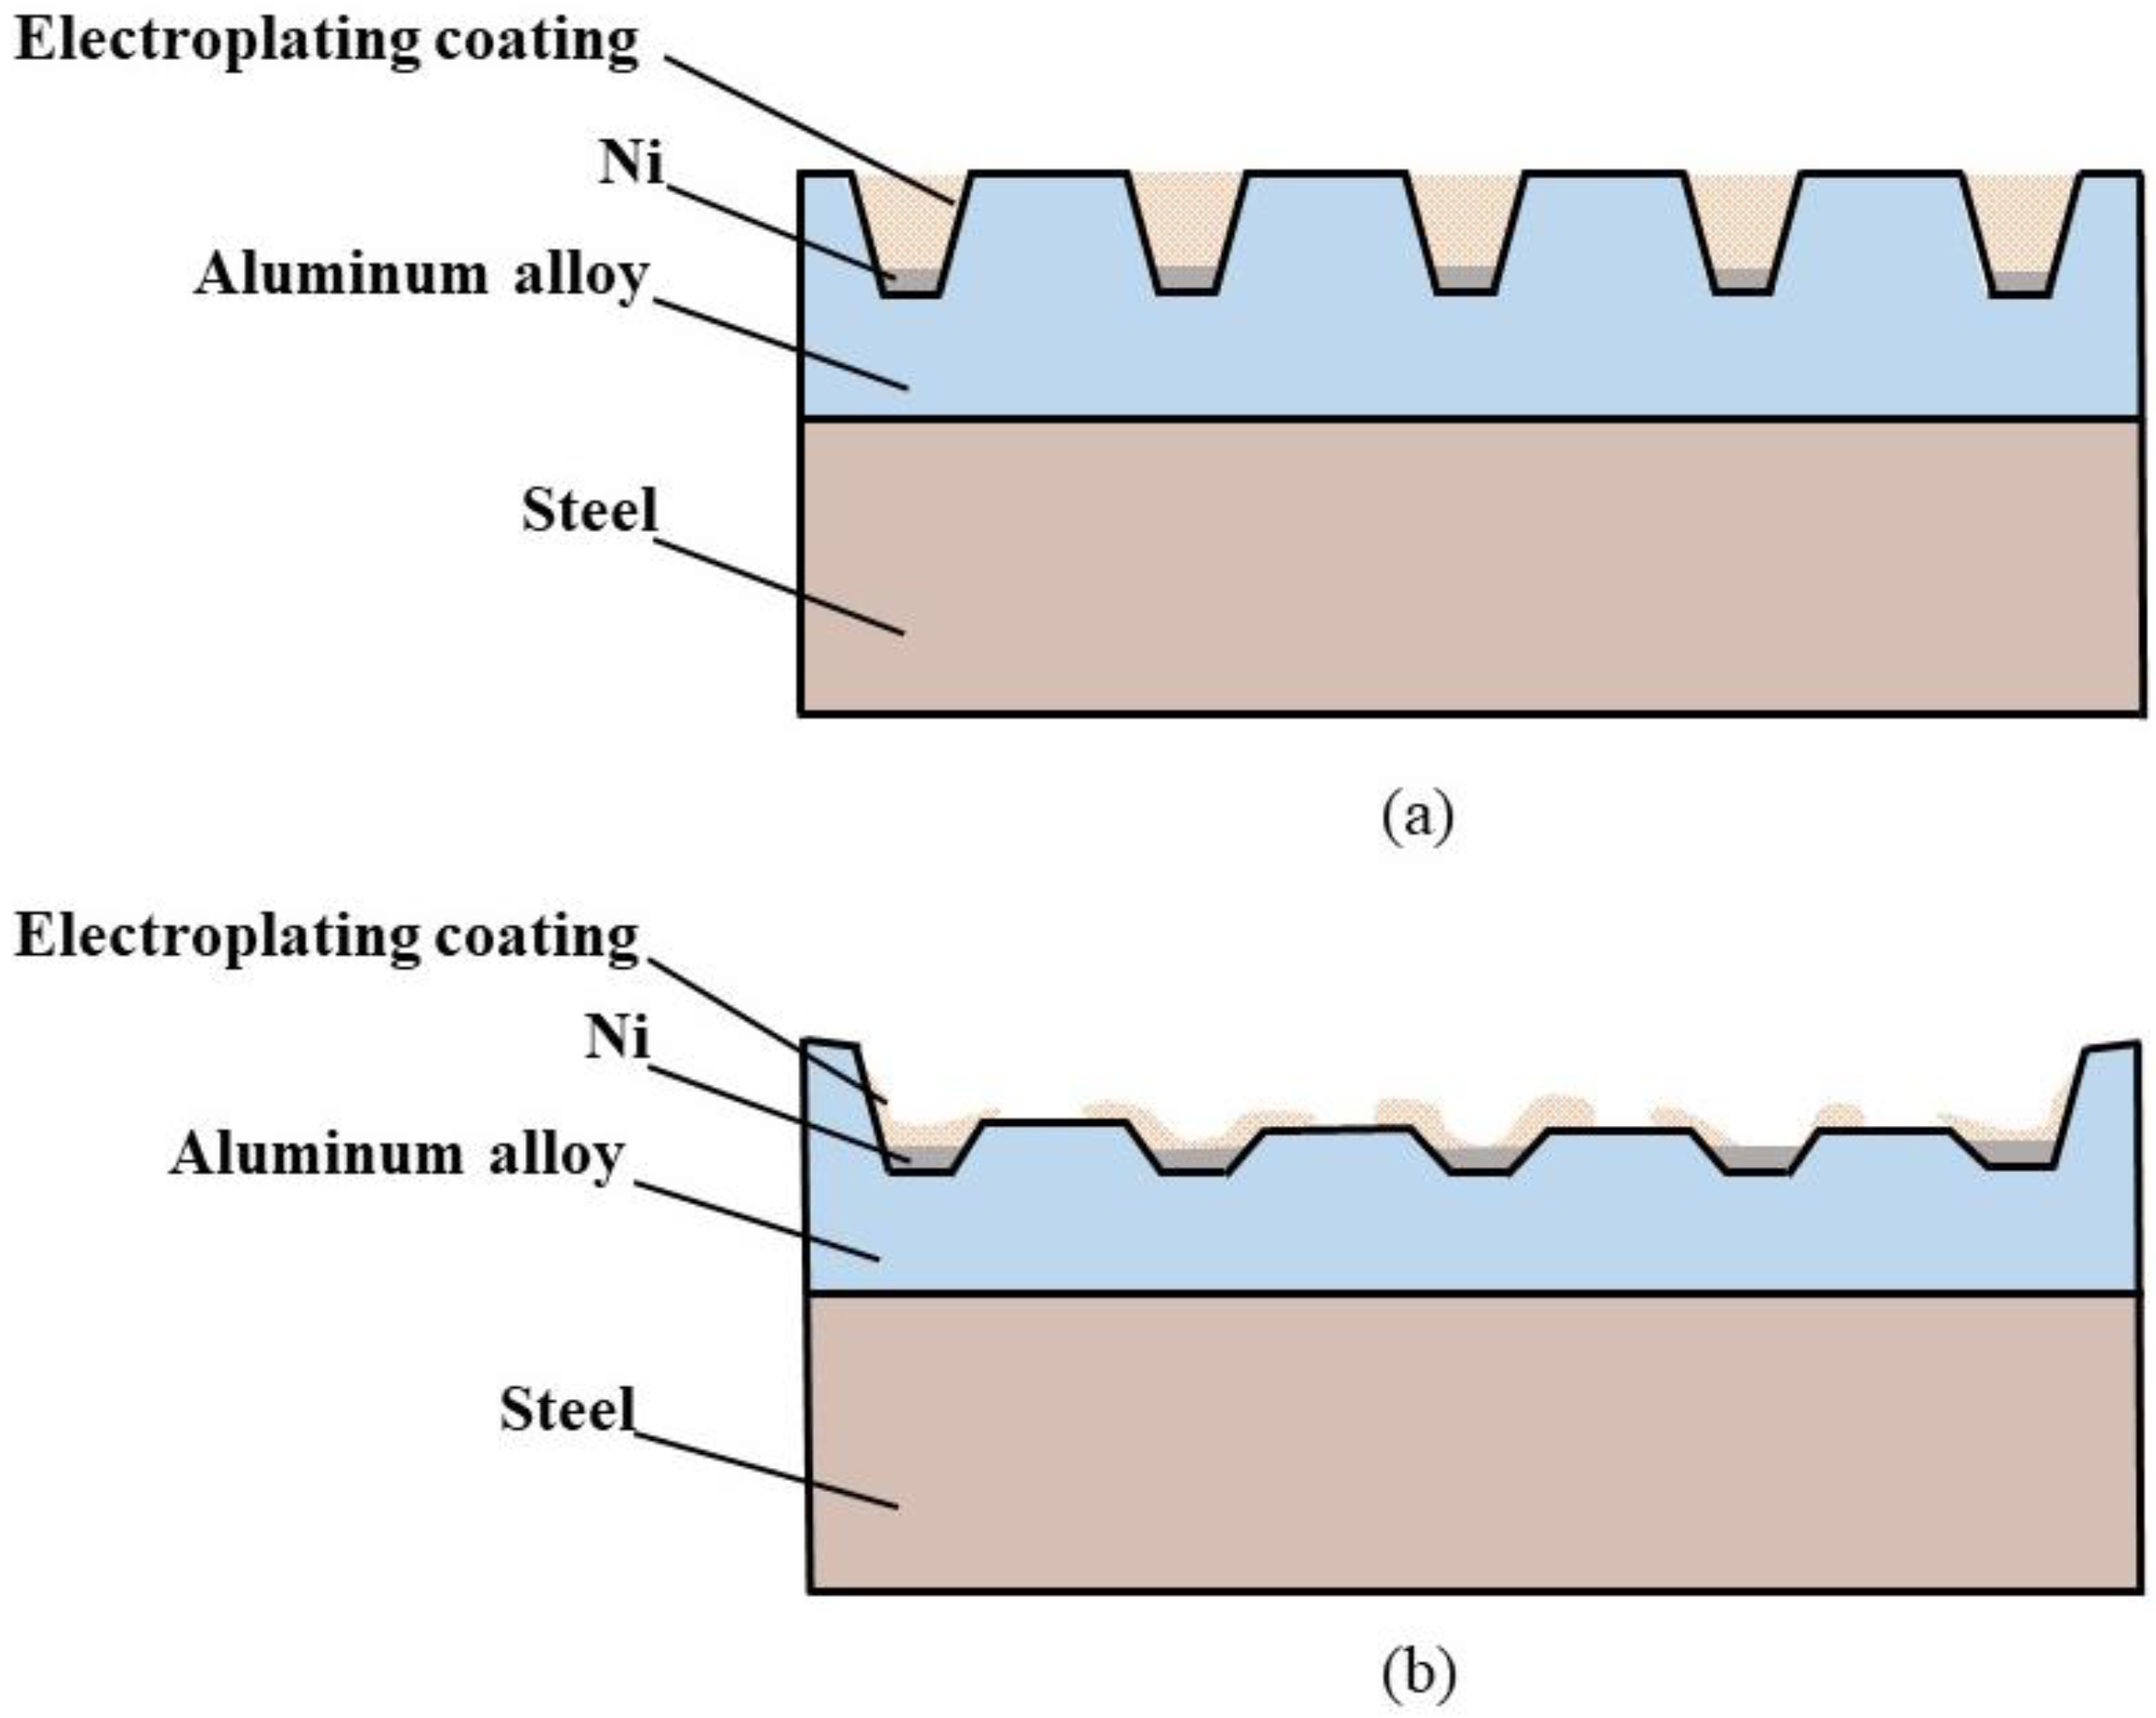
(3)
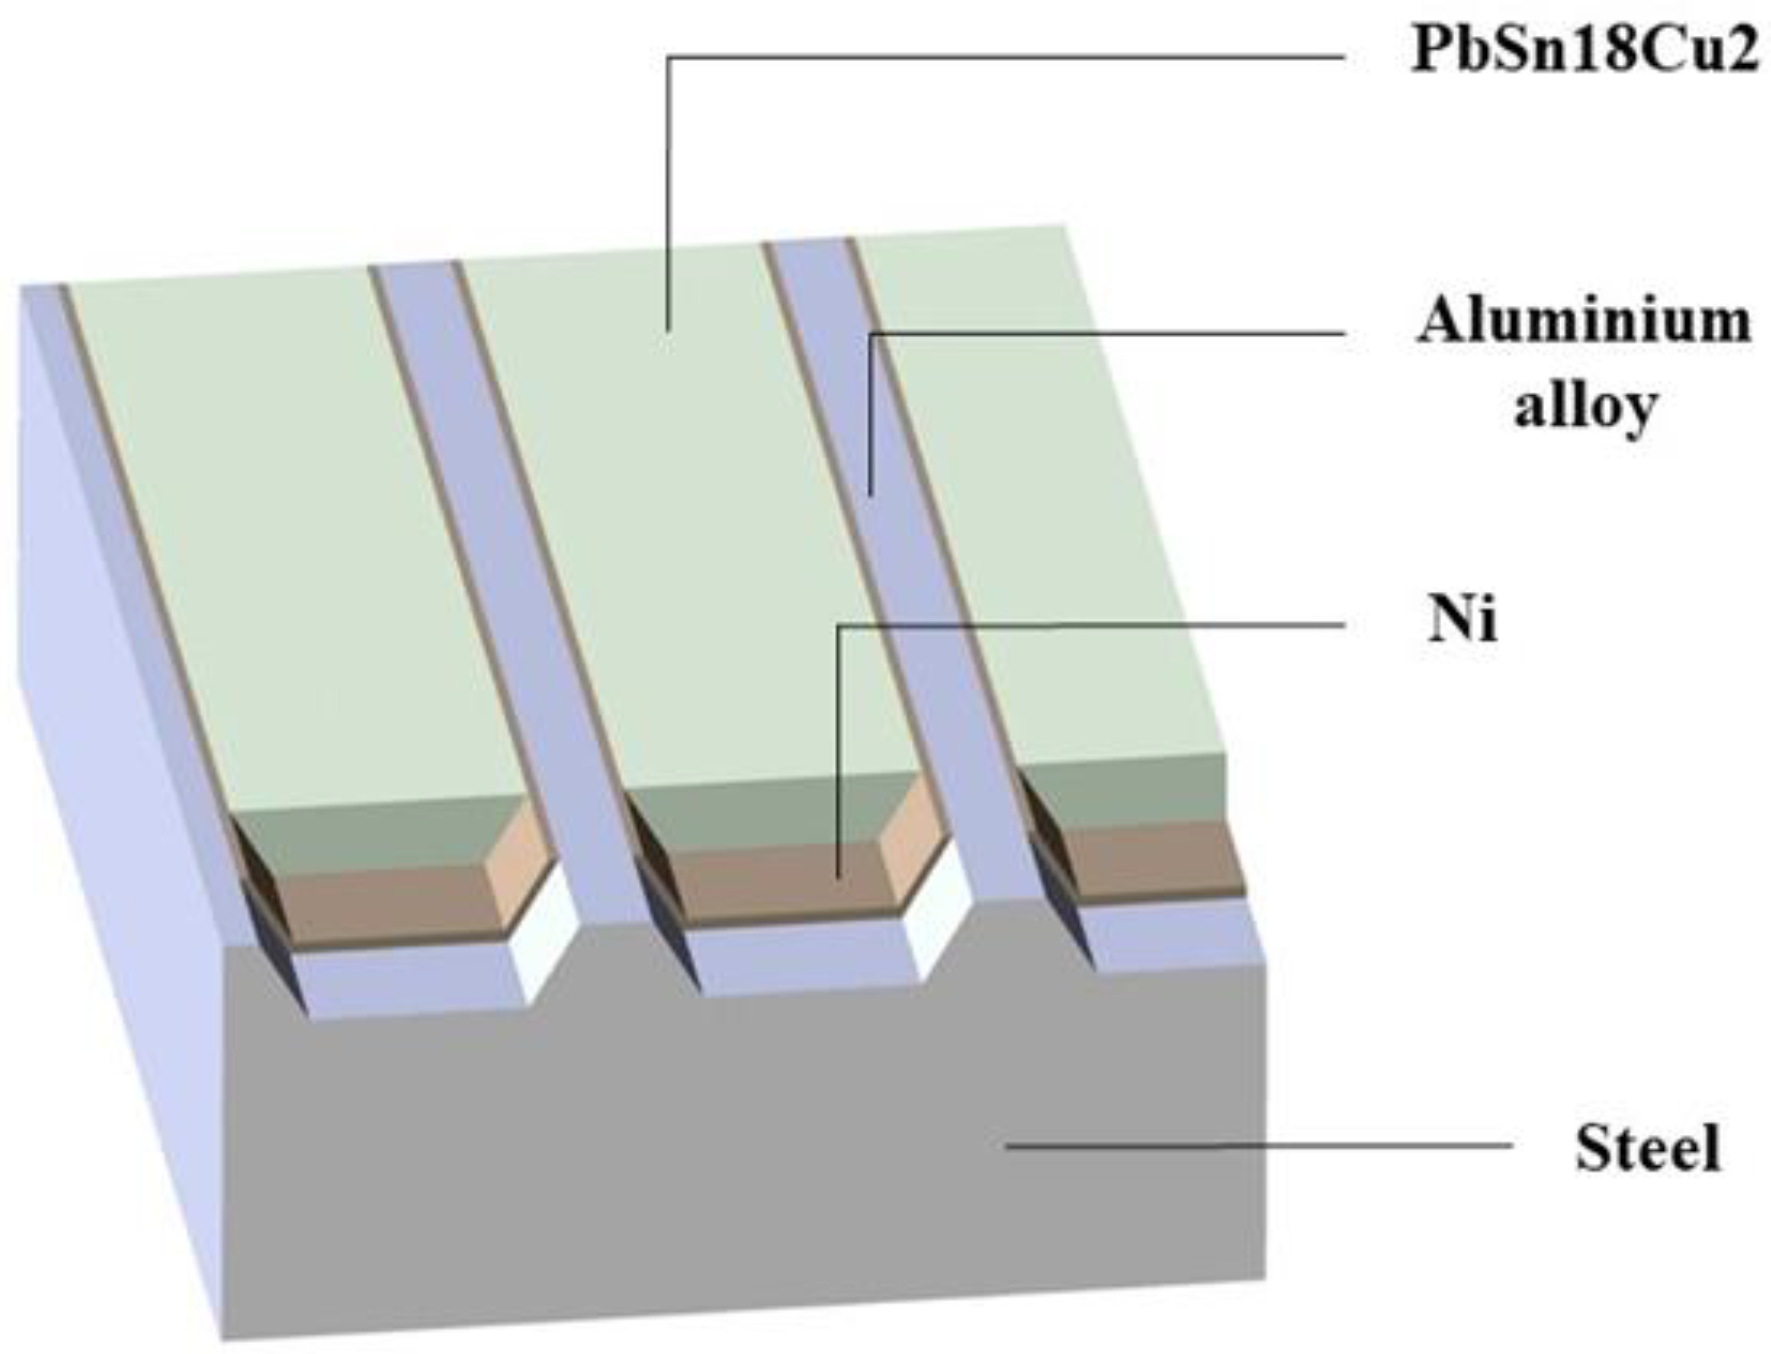
After wear, the groove structure remains, the height of the groove boss decreases, and the cross-sectional area becomes slightly wider. The ternary alloy in the groove will be taken out of the groove, and its edge will undergo plastic flow and adhere to the surface of the aluminum alloy. The research on the wear mechanism can provide guidance for the improvement of wear resistance technology.

Author Contributions

Data curation, D.L., M.H. and Y.Y.; methodology, W.W.; writing—original draft, F.D. All authors have read and agreed to the published version of the manuscript.

Funding

This research was supported by the Dalian High-level Talents Innovation Support Program (2020RQ129).

Institutional Review Board Statement

Not applicable.

Informed Consent Statement

Not applicable.

Data Availability Statement

Not applicable.

Conflicts of Interest

The authors declare no conflict of interest.

Nomenclature

ItemMeaning
hnominal lubricant film thickness
σroot mean square of surface roughness
ϕxthe pressure flow factor in the x-direction
ϕythe pressure flow factor in the y-direction
ϕsthe shear flow facto
ϕcthe dimensionless contact factor
hthe nominal oil film thickness
uthe actual viscosity
ttime
h0the minimum oil film thickness
hxthe incremental value of the bearing oil film thickness in the x-direction
hythe incremental value of the bearing oil film thickness in the y-direction
hTthe actual oil film thickness
δ1the random roughness height of the shaft
δ2the random roughness height of the bearing surface
T0the reference temperature
Tthe actual temperature
u0the viscosity at T0
pthe actual pressure of the lubricating oil
Zthe viscosity-pressure index
Sthe viscosity-temperature index
γthe direction of bearing surface roughness
γ1the grain direction parameters of the surface roughness of the shaft
γ2the grain direction parameters of the surface roughness of the bearing
paspthe contact pressure of the rough asperity
Acthe actual contact area of the rough surface
Athe nominal contact area
E1the elastic modulus of bearing bush
E2the elastic modulus of shaft
E’the comprehensive elastic modulus
v1the Poisson’s ratio of the bearing bush
v2the Poisson’s ratio of the shaft
Hthe film thickness ratio
Fcthe rough contact friction
Fvthe fluid lubrication friction
τcthe rough contact shear stress
τvthe fluid lubrication shear stress
xthe axial direction
ythe radial direction
dthe diameter of the sliding bearing
lthe width of the sliding bearing

Appendix A

Table A1. The value of calculation parameters.
ItemValue
h010 μm
δ10.8 μm
δ20.8 μm
E11.7 × 1011 Pa
E22 × 1011 Pa
v10.25
v20.29
d100 mm
l30 mm
Load2,3 tons
Speed100 r/min
Oil temperature90 °C
u00.08 Pa·s
S1.1
Z0.68
T025 °C
T90 °C
γ11
γ21
A11.899
A21.126
a0.98
b0.98
c0.05

References

  1. Zhu, J.X.; Li, H.C.; Wei, S.J.; Fu, J.F.; Xu, X. An approach of simulating journal bearings-gear pump system including components’ cavitation. Simulaiton Model. Pract. Theory 2021, 108, 102236. [Google Scholar] [CrossRef]
  2. Yang, C.Y.; Wang, S.J.; Lin, C.K.; Chung, L.L.; Liou, M.C. Analytical and experimental study on sloped sliding-type bearings. Struct. Control Health Monit. 2021, 28, e2828. [Google Scholar] [CrossRef]
  3. Brenkacz, L.; Witanowski, L.; Drosinska-Komor, M.; Szewczuk-Krypa, N. Research and applications of active bearings: A state-of-the-art review. Mech. Syst. Signal Process. 2021, 151, 107423. [Google Scholar] [CrossRef]
  4. Li, H.; Liu, H.; Qi, S.M.; Liu, Y. A high-speed rolling bearing test rig supported by sliding bearing. Ind. Lubr. Tribol. 2020, 72, 955–959. [Google Scholar] [CrossRef]
  5. Chen, G.; Qu, M.J. Modeling and analysis of fit clearance between rolling bearing outer ring and housing. J. Sound Vib. 2019, 438, 419–440. [Google Scholar] [CrossRef]
  6. Chiang, H.W.D.; Kuan, C.P.; Li, H.L. Turbomolecular pump rotor-bearing system analysis and testing. J. Vac. Sci. Technol. A 2009, 27, 1196–1203. [Google Scholar] [CrossRef]
  7. Lin, Q.X.; Jiang, D.H.; Deng, Z.G.; Ma, G.T.; Zheng, J.; Wang, W.J.; Shin, D.I.; Gu, X.; Lin, N.; Shao, M.L. Operation and improvement of liquid nitrogen pumps with radial high-temperature superconductor bearings. J. Low Temp. Phys. 2015, 180, 416–424. [Google Scholar] [CrossRef]
  8. Zeng, X.K.; Zhou, H.H.; Xiong, W.Y. CFD study on cavitation abrasion for axletree of main pump of tianwan NPP. Nucl. Power Eng. 2016, 37, 4–8. [Google Scholar] [CrossRef]
  9. Iwata, T.; Oikawa, M.; Chida, R.; Ishii, D.; Ogihara, H.; Mihara, Y.; Kano, M. Excellent seizure and friction properties achieved with a combination of an a-C:H:Si DLC-coated journal and an aluminum alloy plain bearing. Coatings 2021, 11, 1055. [Google Scholar] [CrossRef]
  10. Henry, Y.; Bouyer, J.; Fillon, M. Experimental analysis of the hydrodynamic effect during start-up of fixed geometry thrust bearings. Tribol. Int. 2018, 120, 299–308. [Google Scholar] [CrossRef]
  11. Jang, J.Y.; Khonsari, M.M.; Pascovici, M.D. Modeling aspects of a rate-controlled seizure in an unloaded journal bearing. Tribol. Trans. 1998, 41, 481–488. [Google Scholar] [CrossRef]
  12. Pathak, J.P.; Torabian, H.; Tiwari, S.N. Antiseizure and antifriction characteristics of Al-Si-Pb alloys. Wear 1997, 202, 134–141. [Google Scholar] [CrossRef]
  13. Li, S. Transient Coupling Study of Dynamics and Tribology on Sliding Bearing. Master’s Thesis, Harbin Engineering University, Harbin, China, 2017. [Google Scholar]
  14. Luo, Z. Analysis of Fluid-Structure Interaction Heat Transfer of Hydrodynamic Journal Bearing Considering Thermohydrodynamic. Master’s Thesis, Xiangtan University, Xiangtan, China, 2016. [Google Scholar]
  15. Xie, Y.; Zhang, B.; Hu, Y.M.; Ruan, D.F. Effect of journal rotation speed on characteristic of oil film and structure characteristic of bearings. Lubr. Eng. 2015, 40, 8–16. [Google Scholar] [CrossRef]
  16. Gertzos, K.P.; Nikolakopoulos, P.G.; Papadopoulos, C.A. CFD analysis of journal bearing hydrodynamic lubrication by Bingham lubricant. Tribol. Int. 2008, 41, 1190–1204. [Google Scholar] [CrossRef]
  17. Song, Y.; Ren, X.; Gu, C.W. Experimental and numerical studies of cavitation effects in a tapered land thrust bearing. J. Tribol. 2015, 137, 011701. [Google Scholar] [CrossRef]
  18. Patir, N.; Cheng, H.S. An average flow model for determining effects of three-dimensional roughness on partial hydrodynamic lubrication. J. Lubr. Technol. 1978, 100, 12–17. [Google Scholar] [CrossRef]
  19. Parir, N.; Cheng, H.S. Application of average flow model to lubrication between rough sliding surfaces. J. Lubr. Technol. 1979, 101, 220–230. [Google Scholar] [CrossRef]
  20. Houpert, L. New results of traction force calculations in elastohydrodynamic contacts. J. Tribol. 1985, 107, 241–245. [Google Scholar] [CrossRef]
  21. Wang, S.; Cusano, C.; Conry, T. Thermal analysis of elastohydrodynamic lubrication of line contacts using the Ree-Eyring fluid model. J. Tribol. 1991, 113, 232–242. [Google Scholar] [CrossRef] [Green Version]
  22. Greenwood, J.A.; Tripp, J.H. The Contact of Two Nominally Flat Surfaces. Proc. Inst. Mech. Eng. 1971, 185, 625–633. [Google Scholar] [CrossRef]
Figure 1. Calculation process.
Jmse 11 00061 g001
Figure 2. The component-level tribological test machine.
Jmse 11 00061 g002
Figure 3. Sliding bearing.
Jmse 11 00061 g003
Figure 4. Structure diagram of the sliding bearing.
Jmse 11 00061 g004
Figure 5. Comparison of the calculated average friction and the measured average friction.
Jmse 11 00061 g005
Figure 6. Wear loss of sliding bearing along with time. (a) Case 1 and (b) Case 2.
Jmse 11 00061 g006
Figure 7. Original surface morphology and element distribution of the sliding bearing. (a) Surface morphology, (b) Al distribution, (c) Ni distribution, (d) Pb distribution, (e) and Sn distribution.
Jmse 11 00061 g007
Figure 8. Surface morphology and element distribution of the sliding bearing after wear. (a) Surface morphology, (b) Al distribution, (c) Ni distribution, (d) Cu distribution, (e) Sn distribution, and (f) Pb distribution.
Jmse 11 00061 g008
Figure 9. Wear mechanism of the sliding bearing. (a) Original (b) and after wear.
Jmse 11 00061 g009
Table 1. Condition parameters.
CaseLoadSpeedOil TemperatureTime
Case 12 t100 r/min90 °C24 h
Case 23 t100 r/min90 °C24 h
Disclaimer/Publisher’s Note: The statements, opinions and data contained in all publications are solely those of the individual author(s) and contributor(s) and not of MDPI and/or the editor(s). MDPI and/or the editor(s) disclaim responsibility for any injury to people or property resulting from any ideas, methods, instructions or products referred to in the content.

