Article

System Reliability of a Semi-Submersible Drilling Rig Considering the Effects of the Main Nodes

1
School of Civil Engineering and Architecture, Taizhou University, Jiaojiang 318000, China
2
Department of Civil Engineering, Zhejiang University, Hangzhou 310000, China
*
Author to whom correspondence should be addressed.
J. Mar. Sci. Eng. 2023, 11(1), 52; https://doi.org/10.3390/jmse11010052
Submission received: 19 September 2022 / Revised: 18 December 2022 / Accepted: 20 December 2022 / Published: 29 December 2022
(This article belongs to the Section Ocean Engineering)

Abstract

:
In this paper, structural systems reliability analysis was used to estimate the system reliability of a typical semi-submersible based on the characteristic structure failure mechanisms under extreme wave loads. First, a three-dimensional simulation model was created for the chosen semi-submersible platform using an elastic-perfectly plastic material model, neglecting the effect of the strain hardening assumption. Then, under design wave conditions, and characteristic structural failure mechanisms of a semi-submersible platform were examined, and a system reliability model was developed based on the failure mechanism of the chosen platform. Finally, system reliability methods were used to determine the platform’s system reliability. It was discovered that the main node’s system reliability makes a significant contribution to the overall structure reliability, so it is strongly advised that the reliability of the main nodes be taken into account when determining the overall structure’s reliability. This research aims to apply reliability theory in offshore engineering and, ideally, to encourage the reliability-based design of semi-submersible platforms and other similar structures.

1. Introduction

One of the most popular hull systems for deep-water drilling and production platforms around the world is the semi-submersible. Because of its excellent hydrodynamic performance in adverse weather, structural performance is always one of the key concerns throughout the course of its service life. It is generally agreed upon that a system reliability approach should be used to design such structures. This approach can be used to optimize design parameters throughout the design process and can take into account the effects of uncertainties in materials, loading parameters, and other factors.
The American Society of Civil Engineers (ASCE) structural reliability committee [1] summarized the reliability in a publication at the time and discussed a solution to the problem of the system reliability of marine structures in 1983. Following that, numerous studies focused on using reliability theory to address reliability issues in marine structures.
It typically takes extensive numerical simulations and significant computational effort to assess the reliability of large structures. A novel method for the system reliability analysis of offshore structures was proposed by Cocconel. et al. (2017) [2] makes use of the dominant failure modes found through selective searching. The development of an artificial neural network model for the reliability analysis of steel structures was studied by Chojaczyk et al. [3] in 2015. This research revealed that, for complex structures, the artificial neural network-based reliability analysis method is a useful alternative to the conventional reliability analysis method. Using Monte Carlo simulation (MCS), Vazirizade et al. (2017) [4] trained an ANN and assessed the seismic reliability of the suggested structures. The techniques for choosing training sets are crucial for neural network-based approaches to structural reliability problems (Chojaczyk et al., 2015). To create samples for regression analysis and create the response surface, Latin hypercube sampling (LHS) has been widely used (Kang et al., 2015 [5]; Gaspar and Guedes Soares, 2013 [6]). In structural reliability analysis, the Monte Carlo method and response surface techniques have also been widely employed (Sadoughi et al., 2018 [7]); Pan and Dias, 2017 [8]; Gaspar et al., 2015 [9]). An ideal reliability-based design method for complex structural systems was put forth by Ang et al. [10] in 2021.
Moan and his students have conducted extensive research on the dependability of marine structures over the past 40 years. Their works include ship reliability analysis [11]. (Jia and Moan 2009), the reliability-based design of the ultimate hull girder strength [12] (Amlashi et al., 2011), fatigue reliability analysis of the jacket structure [13] (Dong et al., 2012), the fatigue reliability-based inspection and maintenance planning of gearbox components [14] (Rasekhi Nejad et al., 2014), the time-variant reliability assessment of FPSO reliability [15] (Yala-Uraga and Moan 2015), and uncertainty in forecasted environmental conditions [16]. Their work has had a significant impact on the methodology for calculating marine structure reliability as well as the calibration and calculation examples for various marine structures.
Researchers have looked into the pile–soil interaction and system reliability of jacket platforms (Asgarian et al., 2019 [17]; Bai et al., 2016 [18]; Zhao et al., 2020 [19]). A strength reliability analysis method for the local joint of a tension leg platform was published in 2012 by Shaoet. al. [20]. Ye et al.’s (2013) [21] investigation into the system reliability of a typical semi-submersible drilling rig showed that this issue had not yet been adequately addressed, according to additional research.
A semi-submersible platform is a very complex structural form, as opposed to ship-like structures. Typically, a systematic analysis plan should be created in accordance with a specified structure in order to conduct the structural analysis of a complex structure (Murotsuetal., 1984 [22]; Feng, 1988 [23]). First and foremost, when considering a semi-submersible platform, it is important to build both well-represented hydrodynamic and structural simulation models that correspond to the dimensions of a real semi-submersible platform. Second, the most unfavorable load conditions are frequently determined using the DNV (2005) [24] and ABS (2008) [25] rules. Finally, a semi-submersible platform system reliability model should be presented, and the system reliability of a typical semi-submersible platform was examined, taking into account the contribution of the main nodes.
The fundamental ideas of the system reliability assessment are introduced in Section 2. In Section 3, South China Sea-based semi-submersible platforms are illustrated with useful numerical examples. Section 4 and Section 5 present a case study that utilizes a typical semi-submersible platform while discussing the system reliability analysis method using the established numerical model. Finally, Section 6 presents the conclusions and summarizes them.

2. System Model Simplification

2.1. Reliability Prediction of Single Component

The likelihood of a specific preset function within the allotted time and under the allotted conditions is known as structural reliability. The probability that the structure will fail to perform a predetermined function is known as the structural failure probability P f . The structural failure probability is frequently used to assess structural reliability in the calculation of a structure’s reliability for the convenience of calculation and expression. Calculating structural failure probability in accordance with the statistical properties of random variables and the limit state equation of the structure forms the basis of the structural reliability analysis.
Failure and structural reliability are two occurrences that cannot coexist. As a result, failure probability and structural reliability probability work together. In structural reliability analysis, a function typically describes the structure’s operational state. When random factors X = x 1 , x 2 , , x n T have an impact on structural reliability, Equation (1) describes how the structure is functioning.
Z = g x 1 , x 2 , , x n < 0   f a i l u r e   s t a t e = 0   l i m i t     s t a t e > 0   r e l i a b l e   s t a t e
P s stands for the safety probability that the structure performs its current function under the given circumstances. P f stands for the structural failure probability in the event that the structure does not perform its current function safely. Failure and structural reliability are two events that are mutually exclusive and have a complementary relationship.
For ease of calculation and expression, this is frequently used to measure structural reliability because structural failure has a low probability (usually less than 0. 001) event. Let f x 1 , x 2 , , x n be the joint probability density function that corresponds to the basic random variable X = x 1 , x 2 , , x n T . Equation (1) is used to represent the structural function. The structural failure probability can be expressed as follows in accordance with the definition of structural reliability and the fundamental principle of the probability theory:
P f = P ( Z < 0 ) = Z < 0 f x 1 , x 2 , , x n d x 1 d x 2 d x n
It is challenging to directly solve the equation above in practice because the limit state function is nonlinear, and the variables are not independent of one another when there are multiple basic random variables present in the function. As a result, the simple approximation method is typically used instead of the direct solution method. Only the numerical eigenvalues of all the random variables can be taken into account, while means and variances can be used to describe their statistical properties. As a result, a reliability index is developed and used to determine the associated failure probability.
The relationship between structural safety and those n fundamental random variables can be described by a limit state function Z = g X , assuming that a set of random variables related to structural reliability analysis is X = x 1 , x 2 , , x n . This method defines then that a limit state function can be established to describe the relationships between structural safety and those n basic random variables. Equation (3) is the functional relations between the strength R and load S parameters to express the safety margin of the structure to determine whether the structure fails or not:
Z = g R , S = R S
where R denotes random variables describing the strength of structural components and S represents the load effect applied to the structure.
With the normal distribution of R and S, Cornell (1969) derived the reliability index β formula as follows:
β = μ Z σ Z
where μ Z and σ Z are the mean and standard deviation of Z, respectively.

2.2. System Reliability Calculation

2.2.1. Idealization of Structural System Failure

An actual engineering structure is made up of numerous parts, and depending on series systems and parallel systems the failure of one part will not result in the collapse of the entire structure. The failure of a structure typically begins with one component and spreads to neighboring components before ultimately leading to the failure of the entire structure. The component with the lowest reliability index is chosen as the first failure component, and the stress is then distributed throughout the modified structure. The reliability index values of the remaining components are then recalculated, and the component with the lowest reliability index is chosen as the second failure component. This process is repeated until the structural system is unable to fulfill its intended function. These two systems can combine to form some structural systems, though, occasionally, they may be more complex.

2.2.2. Series System

A series system is referred to as a “weakly connected” system and is represented by a chain. Any structural component’s limited state has the potential to cause structural failure. The precise material characteristics of structural elements or components no longer matter greatly in this ideal model. If a structural member is elastically deformable, excess yielding may be used to determine failure; if the member is brittle, the fracture of the member will cause structural failure. It is clear that a statically indeterminate structure is made up of a number of interconnected systems because the collapse of any one subsystem can result in the collapse of the entire structure. A realistic series structure is shown in Figure 1b, while Figure 1a depicts an idealized series system.
Therefore, any unit may induce a possible failure mode. The failure probability of a weakly connected structure composed of three units is:
P f = P F 1 F 2 F n
If the failure mode F i i = 1 , m is represented by the limit state equation G i X = 0 in the basic variable space, the basic reliability problem can be directly extended to:
P f = D X f X d X
where D X represents the vector form of all basic random variables (load, unit strength, unit attribute, size, etc.) and D belongs to the domain X, defining system failure. This can be defined by several failure modes, e.g., G i X 0 .

2.2.3. Parallel System—Perfect Plasticity

According to the series system model, when one component fails, the internal force is redistributed, which causes the failure of a second component, and so on. As a result, the failure probability of the first set of (brittle) components can be used to approximate the failure probability of the entire structural system. This approximation method is inapplicable, though, when there are numerous redundant brittle components because the residual strength becomes crucial. A parallel system, also known as a redundant system, is one in which the components of a structural system (or subsystem) are connected in such a way that one or more components can reach a limit state without having a significant impact on the failure of the entire system. Figure 2 displays two straightforward parallel systems. There are two types of redundant systems. We refer to this as “active redundancy” when the redundancy unit begins to function as soon as the structure is subjected to a light load. We refer to this as “negative redundancy” if the redundancy unit does not begin operating until a predetermined number of structural units fails or degenerates. This demonstrates how the redundancy component improves the system’s dependability.
The characteristics and failure definition of components or units determine whether active redundancy is beneficial or not. The “static theory” guarantees that active redundancy does not lower the structural system’s reliability for a perfect plastic system.
The failure probability of a parallel sub-system made up of three units under the influence of active redundancy can be written as:
P f = P F 1 F 2 F m
where F i represents the failure probability of the i t h structural component. Thus, it can be directly determined that Equation (7) can be expressed in X space as:
P f = D 1 X f Χ d Χ
The parallel system will not fail until all of the active components reach their respective limit states, in contrast to the series system. As a result, how well a system’s components function is crucial to understanding what constitutes a system failure.

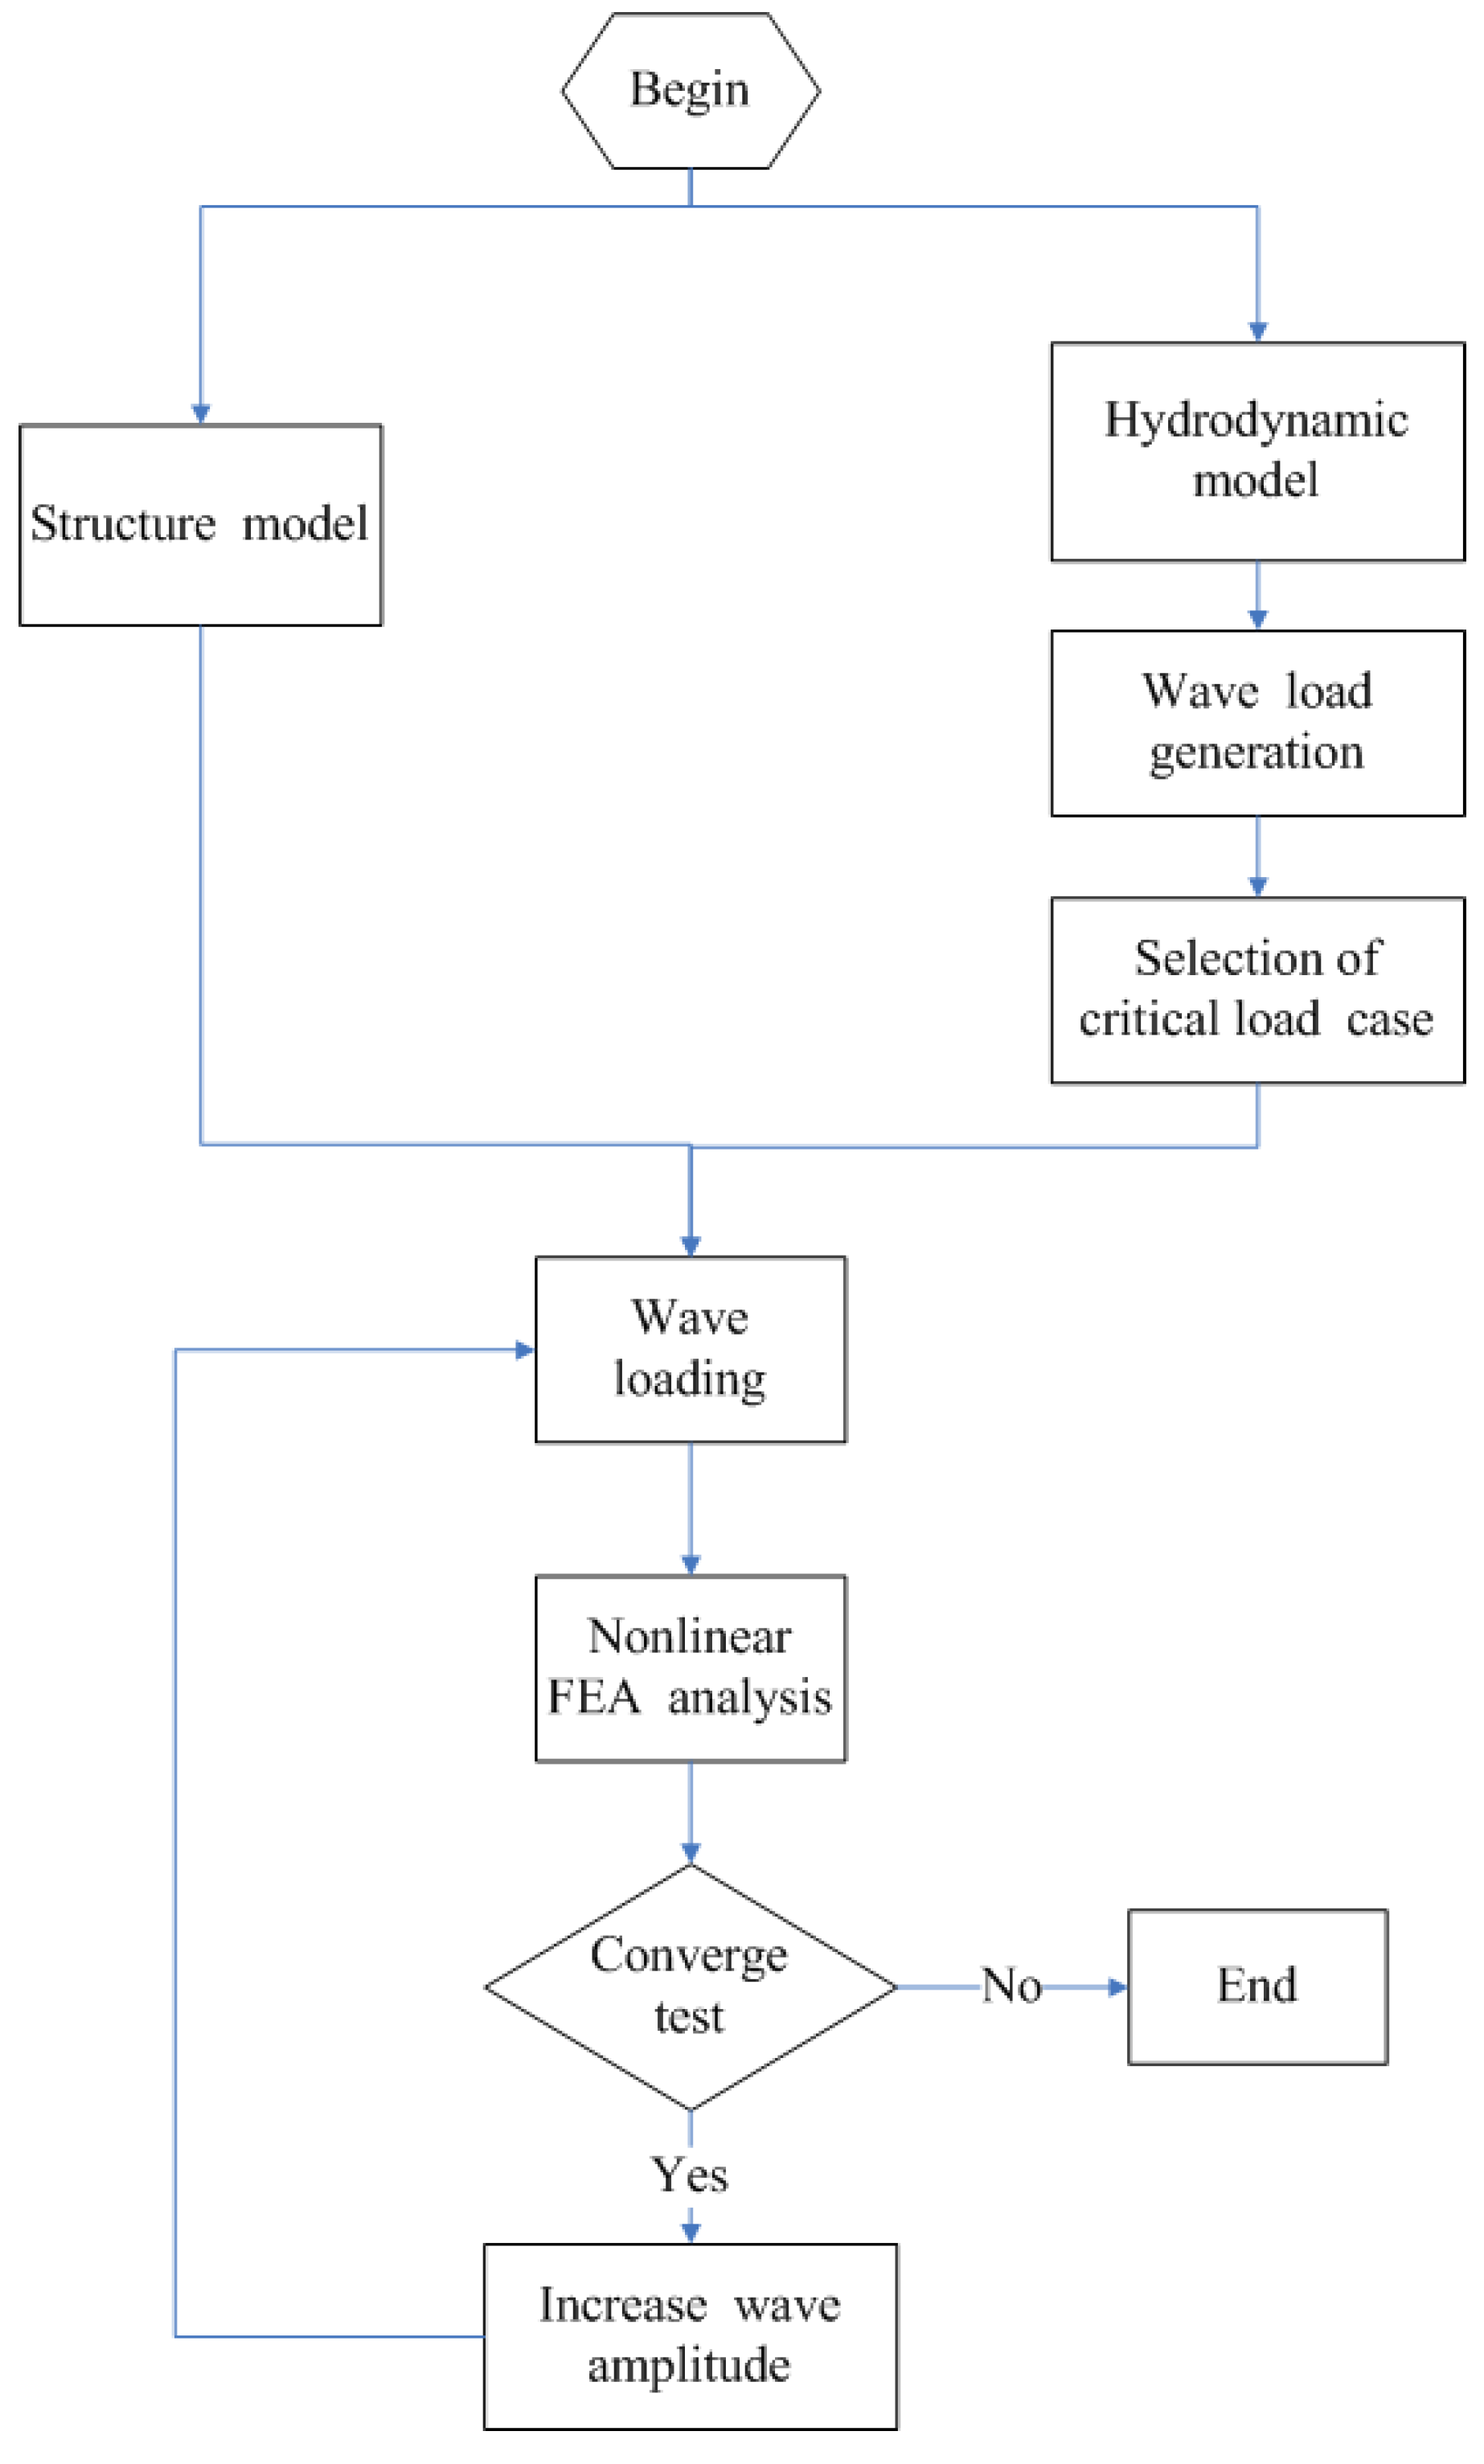
3. Numerical Simulation Model of Selected Semi-Submersible Platform

This paper focuses on a typical drilling semi-submersible platform that is braced between columns and has two parallel pontoons for column stabilization. Using the finite element software packages, ANSYS, a well-represented, nonlinear finite element model, was constructed to accurately predict the behavior of the structure [26].

3.1. Geometric Dimensions of the Object Platform

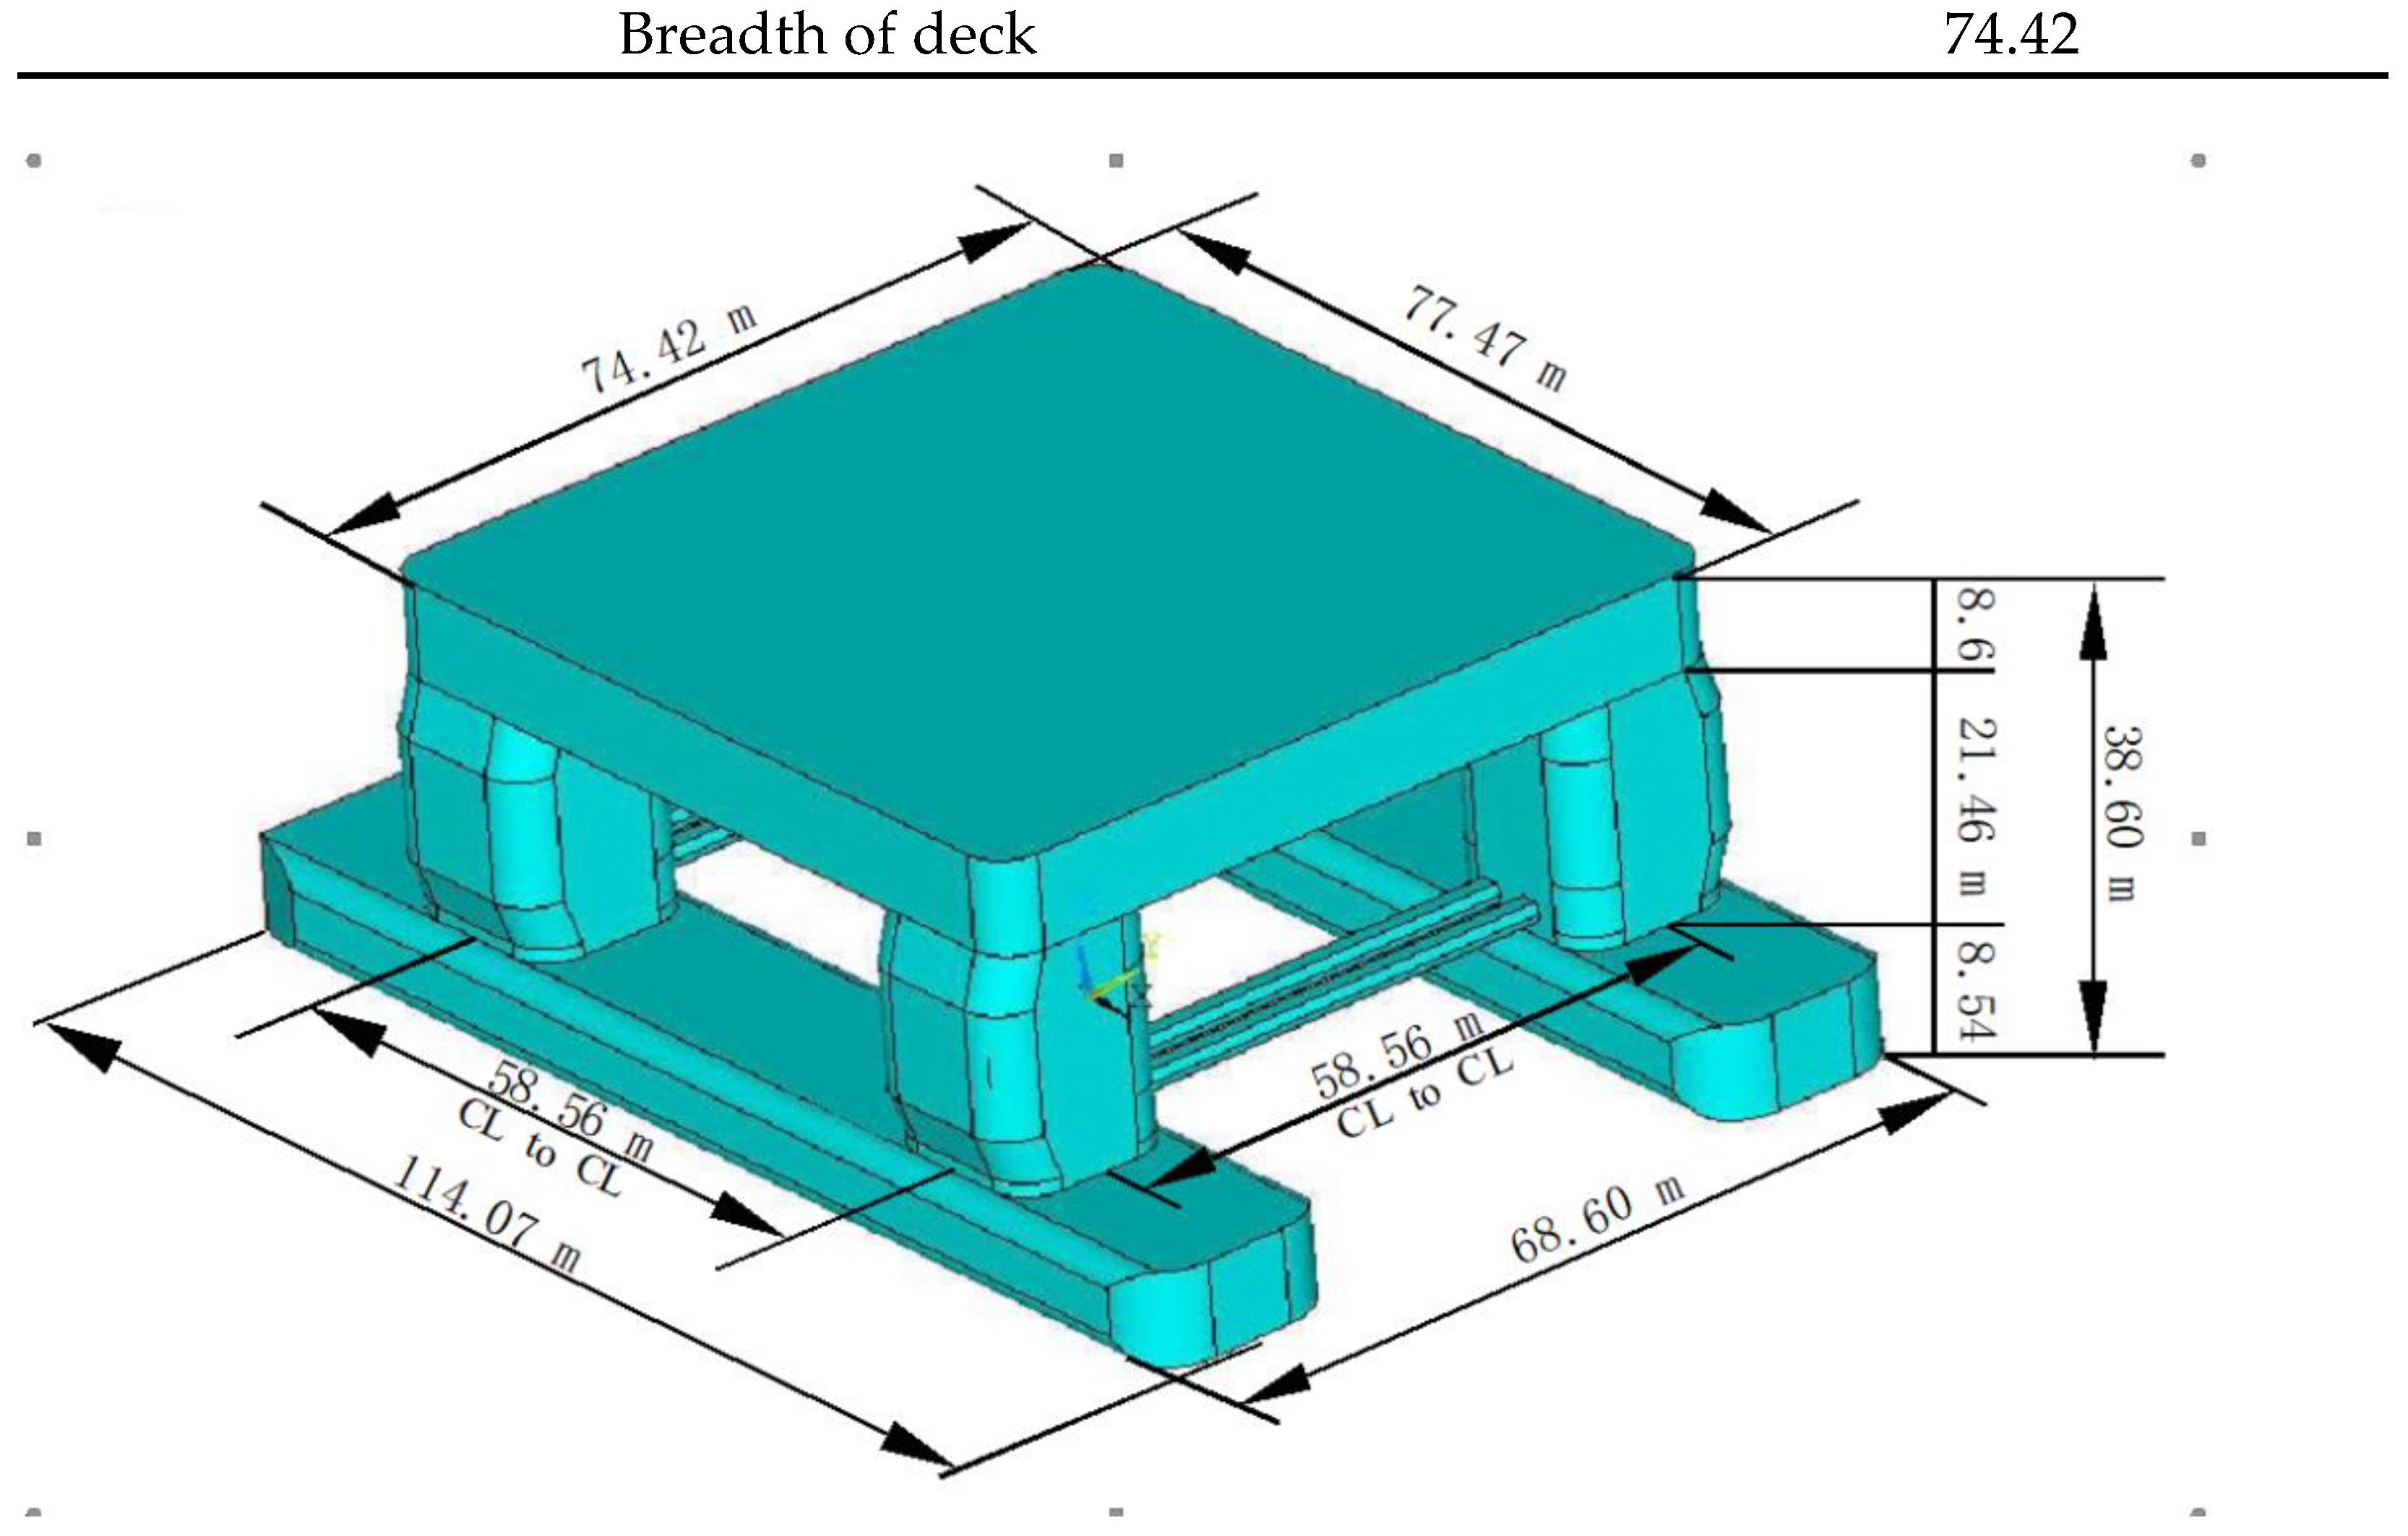
Figure 3 depicts the main components of the structure, including the pontoons, columns, horizontal braces, and deck, while Table 1 summarizes the platform’s main dimensions.

3.2. Material Properties

The strength of the structure is largely determined by the constitutive relation model, which depicts the relationship between stress and strain. The ideal elastic-plastic model is used in this paper, and strain hardening is not taken into account. The numerical model, EQ36, is used and has the following parameters: a Poisson’s ratio of υ = 0.3, Young’s modulus of E = 206 GPa, and yield stress of σ Y   = 315 MPa = 315 MPa.

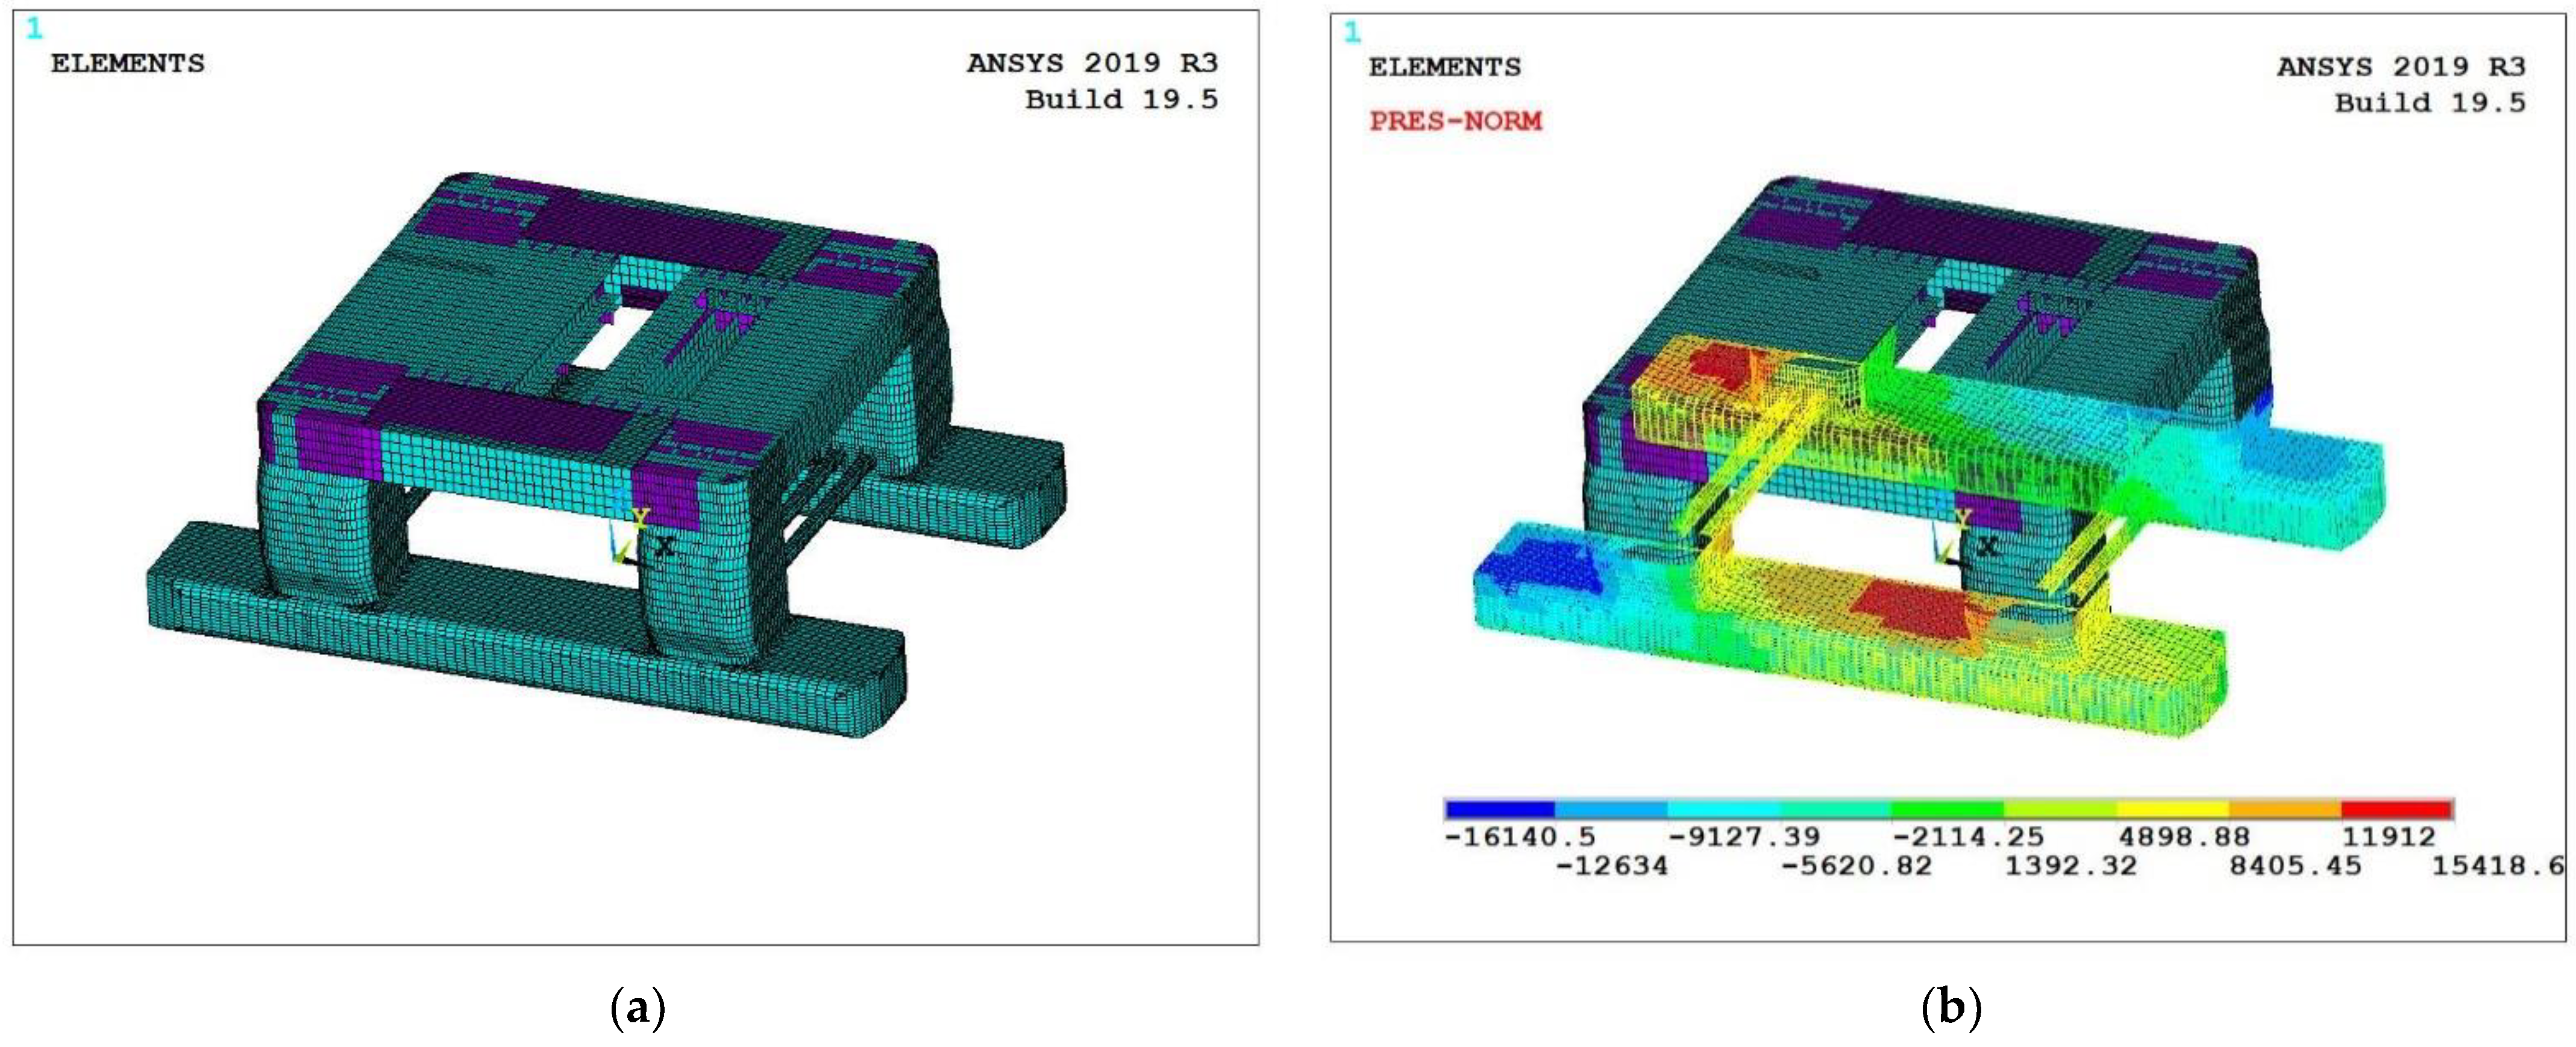
3.3. Environment Load Calculation

The environmental loads that are induced by waves traveling normally toward a semi-submersible platform are the most significant. The hydrodynamic software program WAMIT [27] is typically used to calculate the wave loads on a hull structure. A hydrodynamic model should be constructed in accordance with the platform dimensions shown in Figure 3 in order to generate the wave loading on the chosen platform. Following the generation of the wave loads, the most unfavorable load cases can be found by scanning thousands of wave parameters using the selection criteria that are strictly adhered to by the DNV [24] and ABS [25] rules. 
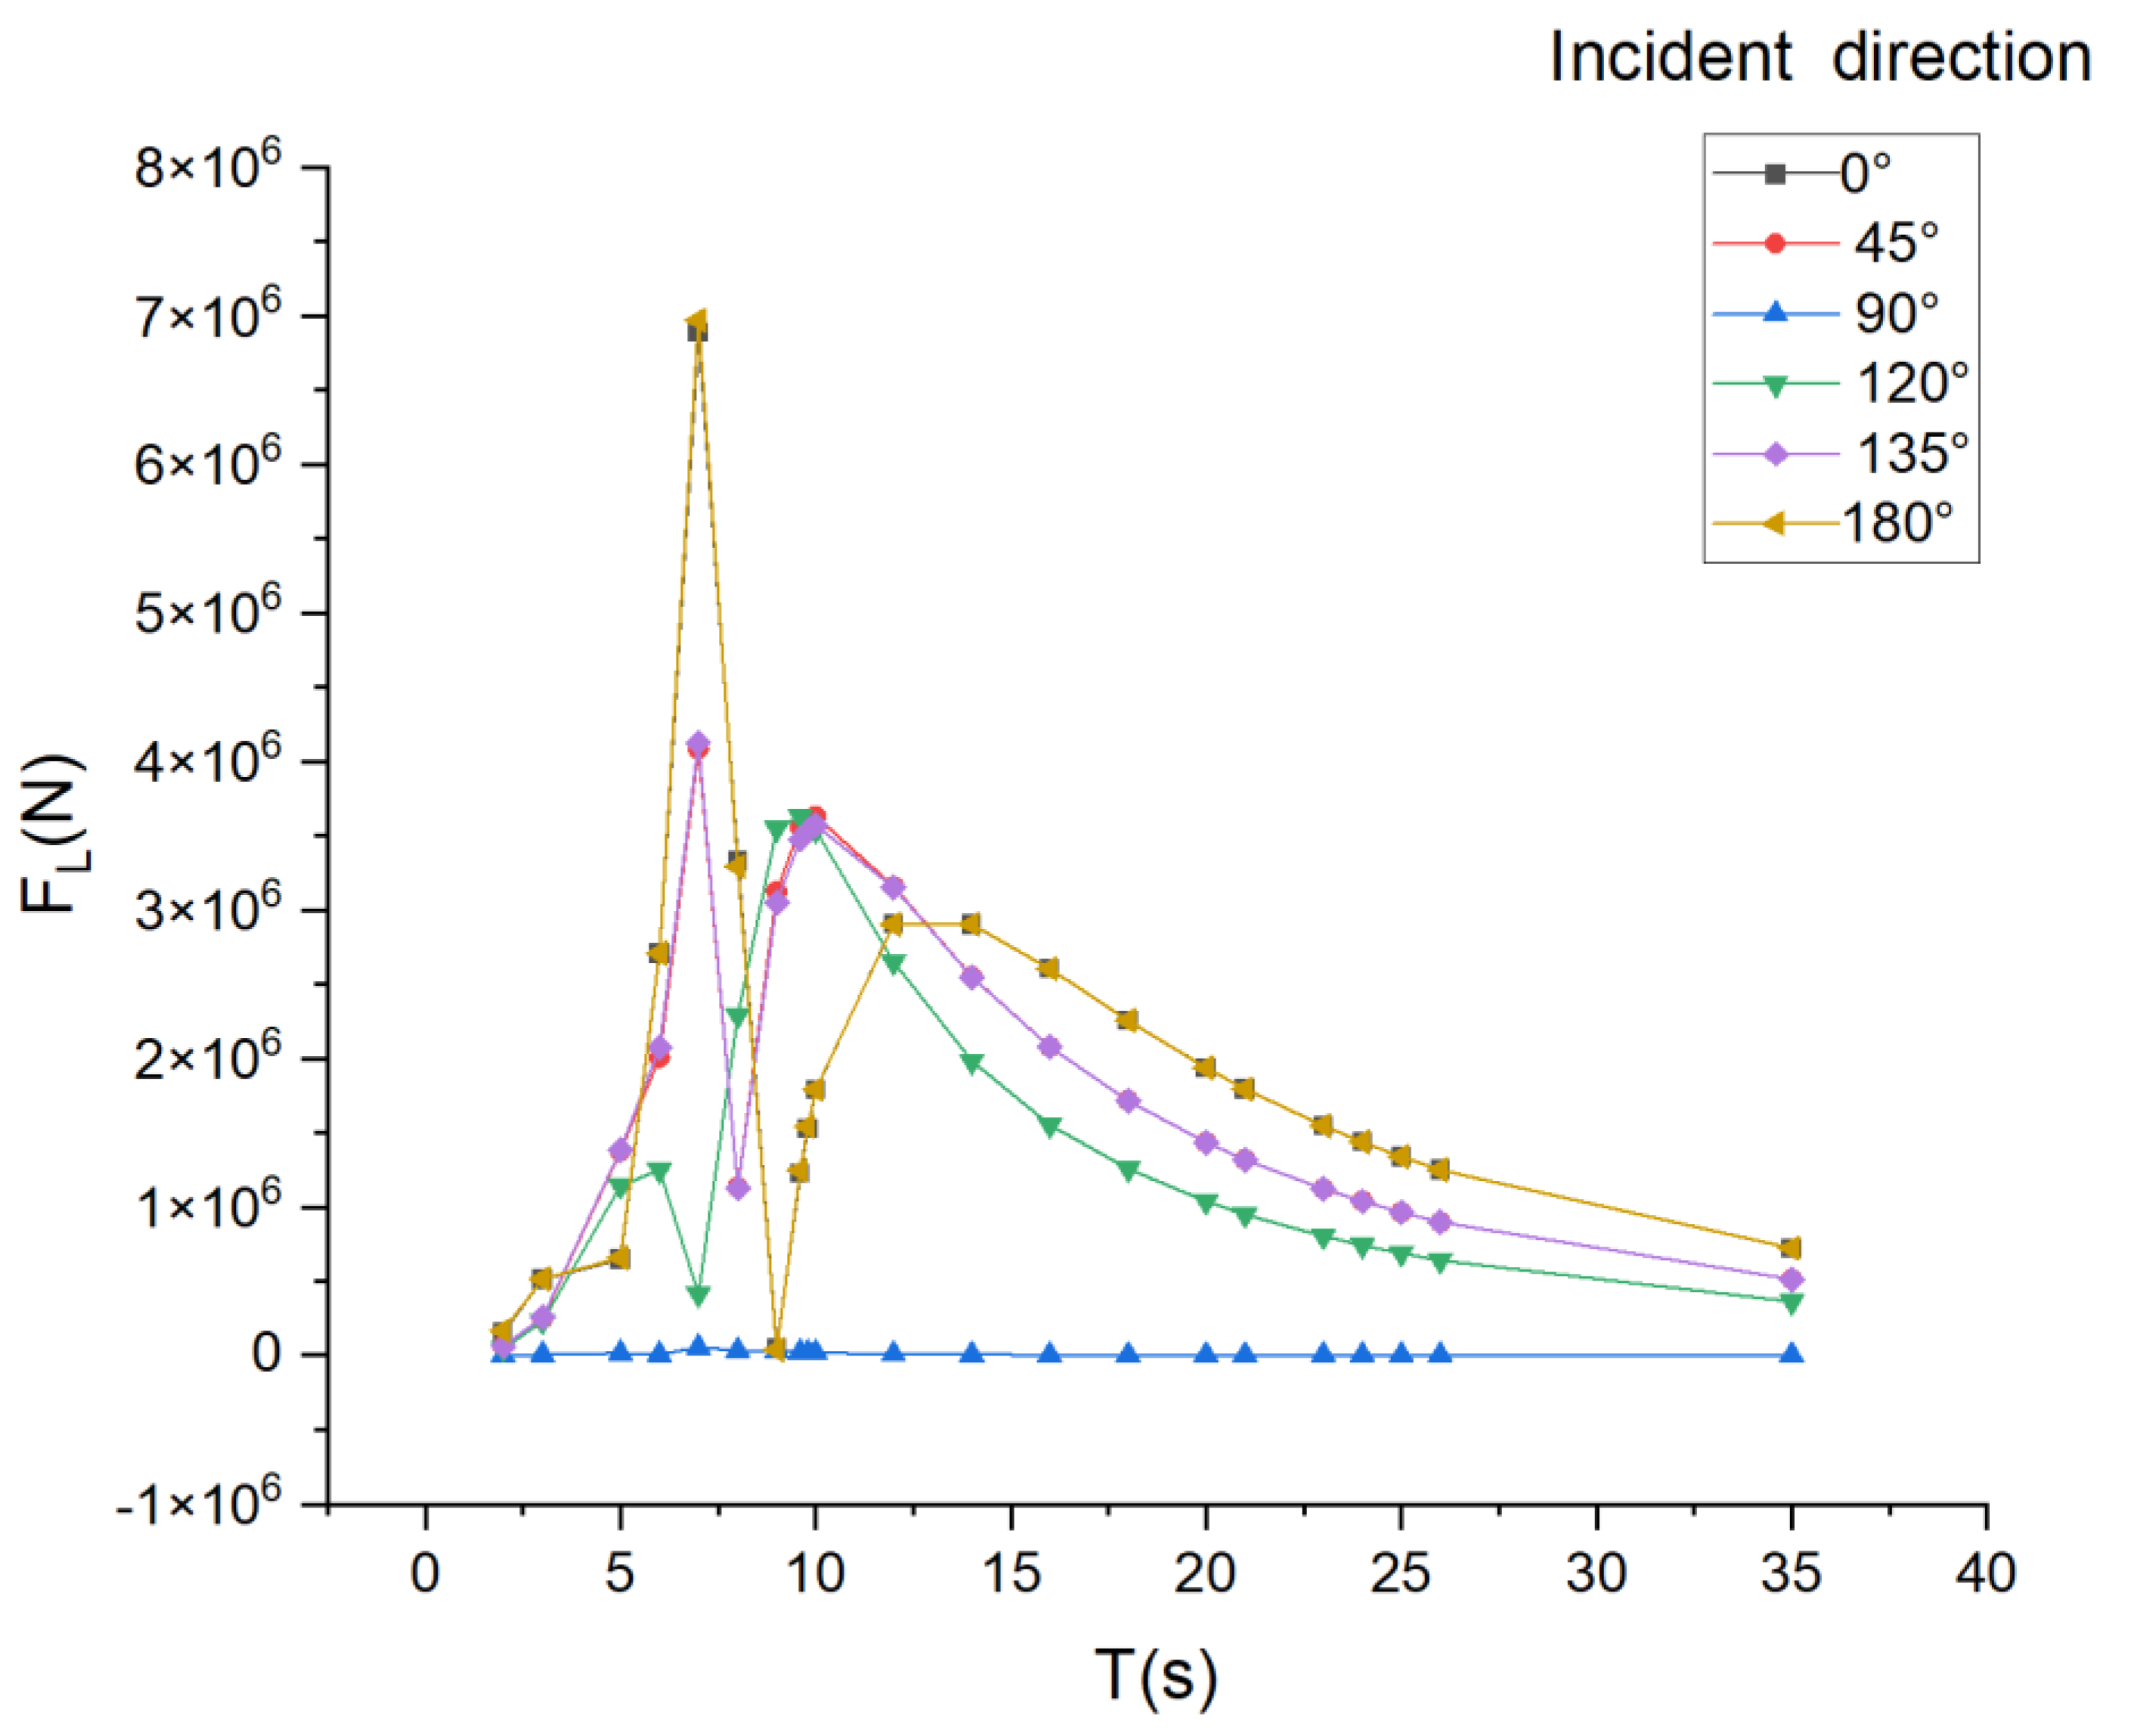
Table 2 lists the responses that correspond to each characteristic. The wave statistics in Table 3 are the foundation for the environmental criteria. Four different types of load cases, including split force ( F S ), shear force ( F L )), torsion moment ( M t ), and bending moment ( M b ), are used as candidate load cases for nonlinear finite element computations. 
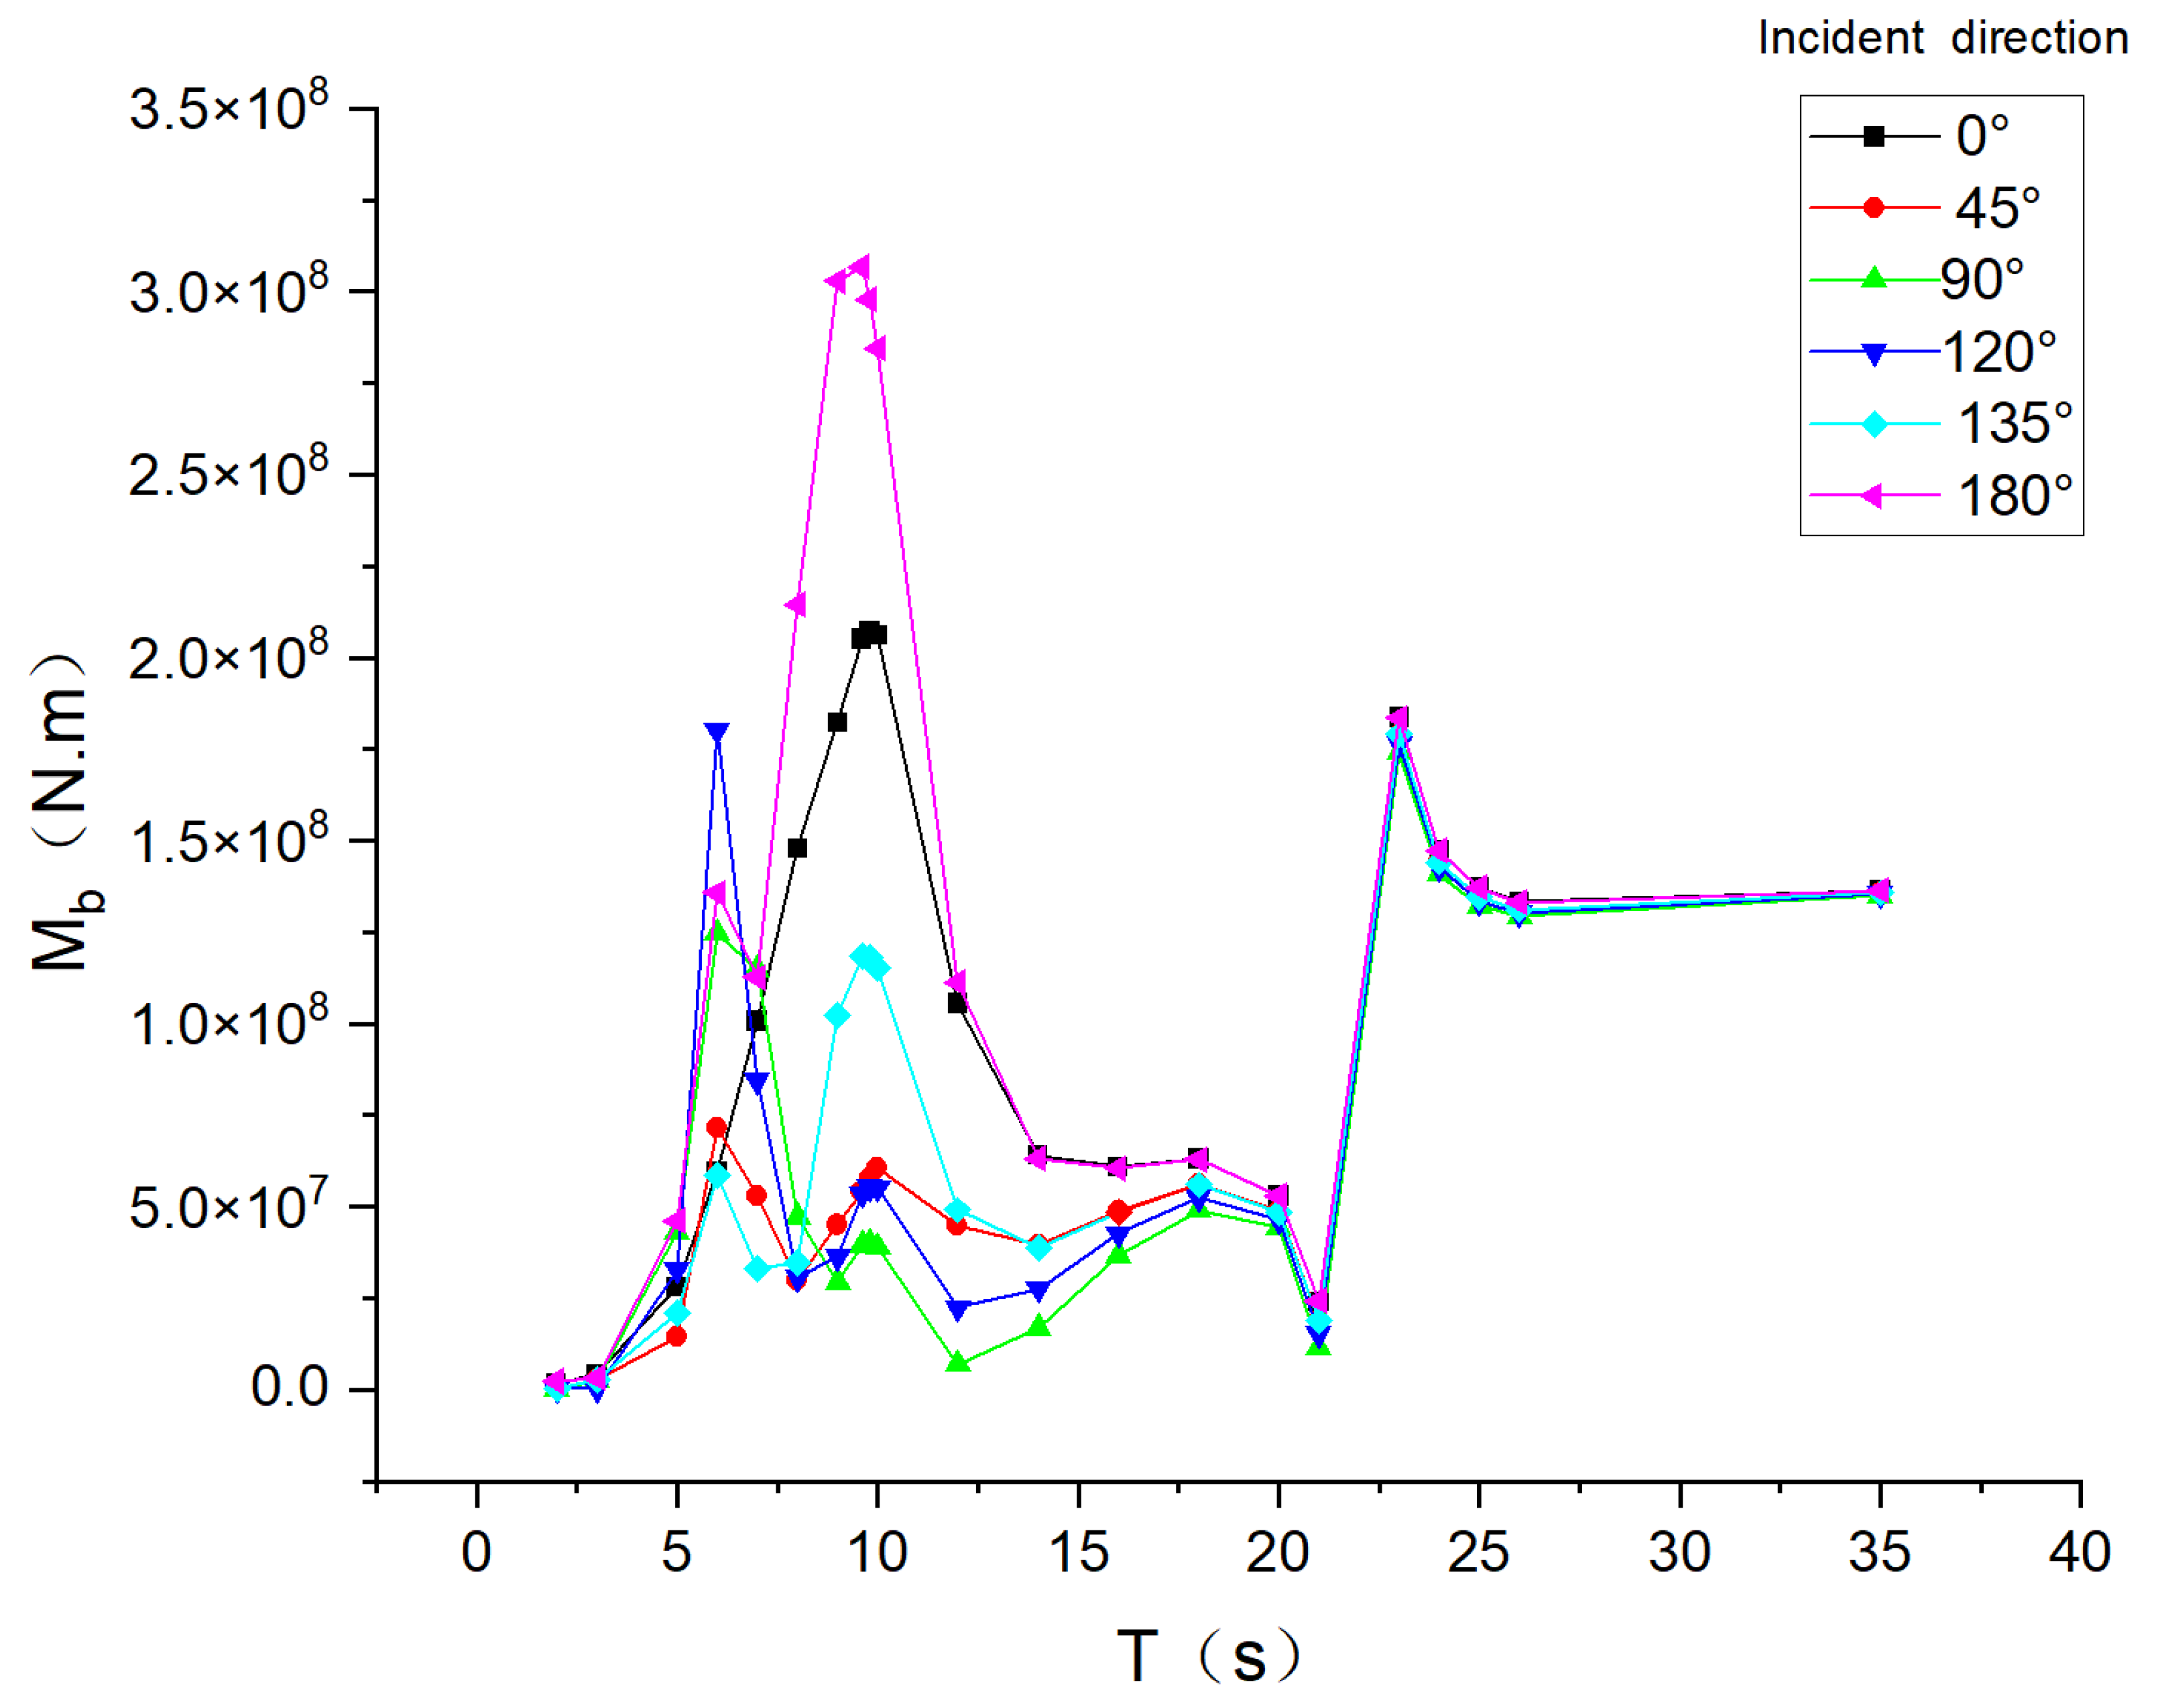
Table 3 provides a list of the final wave parameters. The wave amplitudes A d A are based on the maximum value obtained over a hundred years, and the wave direction angles are from the bow. The South China Sea’s statistical wave steepness was used to calculate the wave amplitudes in Table 3, which are used as a guide for the ULS analysis. The maximum values for the response amplitude operators (RAOs), which make up the main section load S F , are shown in Table 3. They represent the load per unit of wave amplitude for the corresponding design wave. Figure 4, Figure 5, Figure 6 and Figure 7 depict the ROA of a regular wave condition under various wave conditions.

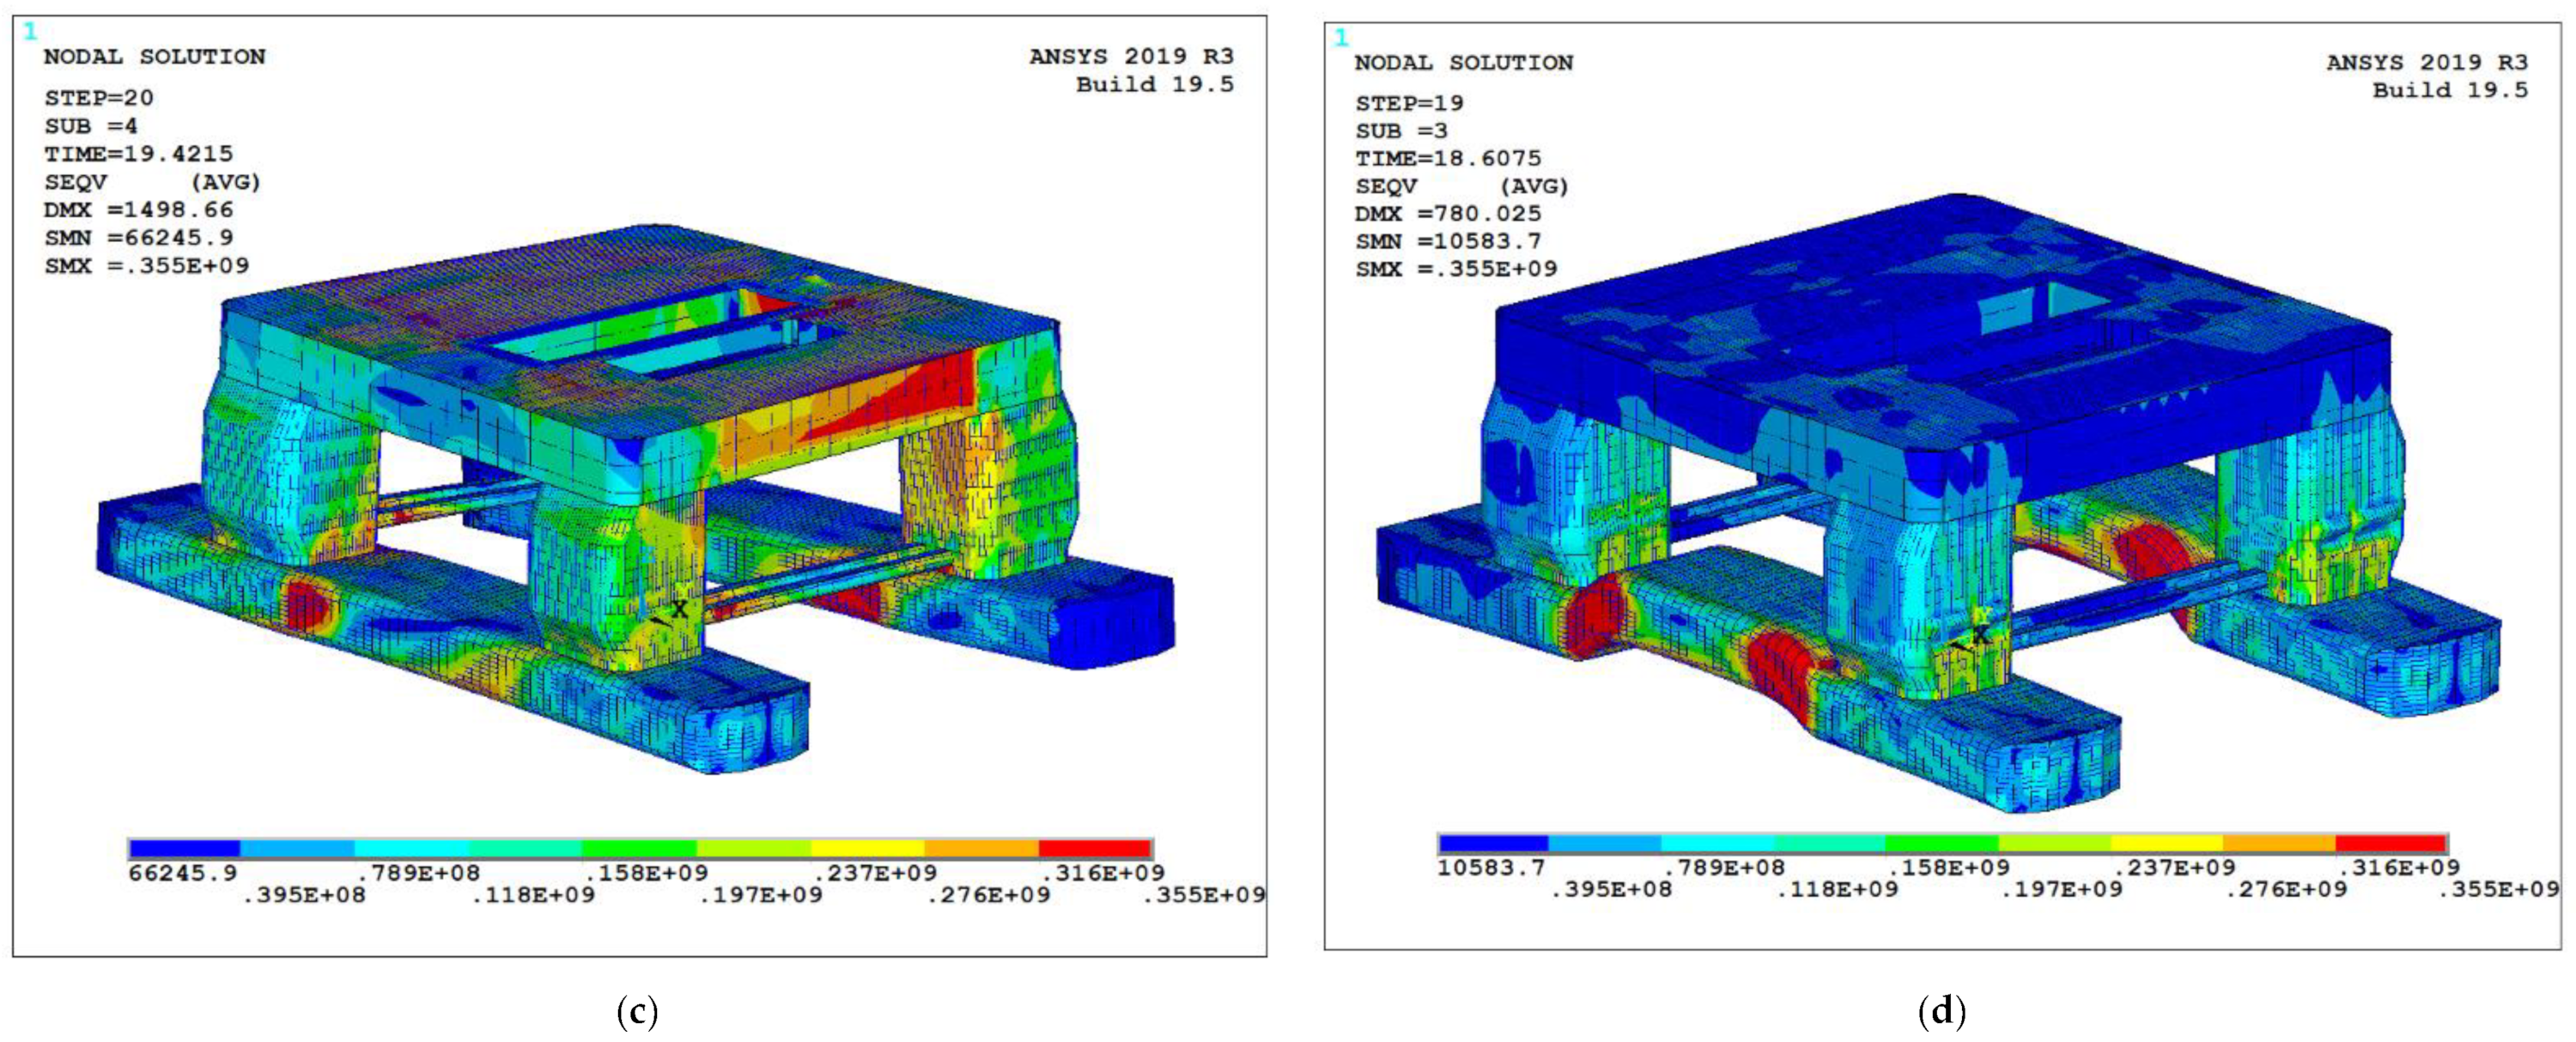
3.4. Nonlinear Finite Element Mesh Modeling

A finite element model is created using ANSYS [26] software in accordance with the general outline in Figure 3, as shown in Figure 8. As can be seen, the semi-submersible platform’s main support system is made up of pontoons, columns, a deck, and braces. Each of them is made up of sub-structural components similar to the stiffener, girder, and bulkhead. A large volume thin-walled three-dimensional shell combined with the beam is used to represent the global stiffness of the structure in the global FE model. Each component’s connections must be sufficiently detailed in the models.
It is necessary to consider computation time and memory size. However, a coarse mesh in crucial locations leads to irrational stresses. Mesh convergence studies were run on the entire simulation model before it was finished. The DNV and ABS rules’ recommendations for mesh size, elements, and element types were followed in this study [24,25]. We used four different element types (shell181, mass21, beam188, and solid65). It is obvious that the semi-connection submersible is crucial, and these parts use fine mesh with a mesh size of approximately 0.5 m. The remainder of the platform’s grid measures roughly one to fifteen meters.
This mesh strategy, which has practical and reasonable computational time and computer capacity requirements, is sufficient to capture the real structural behavior of the platform through trial-and-error test analysis. There are approximately 240,000 total elements in the model, and there are 835,344 total degrees of freedom.
Six degrees of freedom boundary conditions are employed in accordance with the DNV rule [24], consisting of three vertical restraints (Z), two transversal horizontal restraints (Y), and one longitudinal horizontal restraint (X).

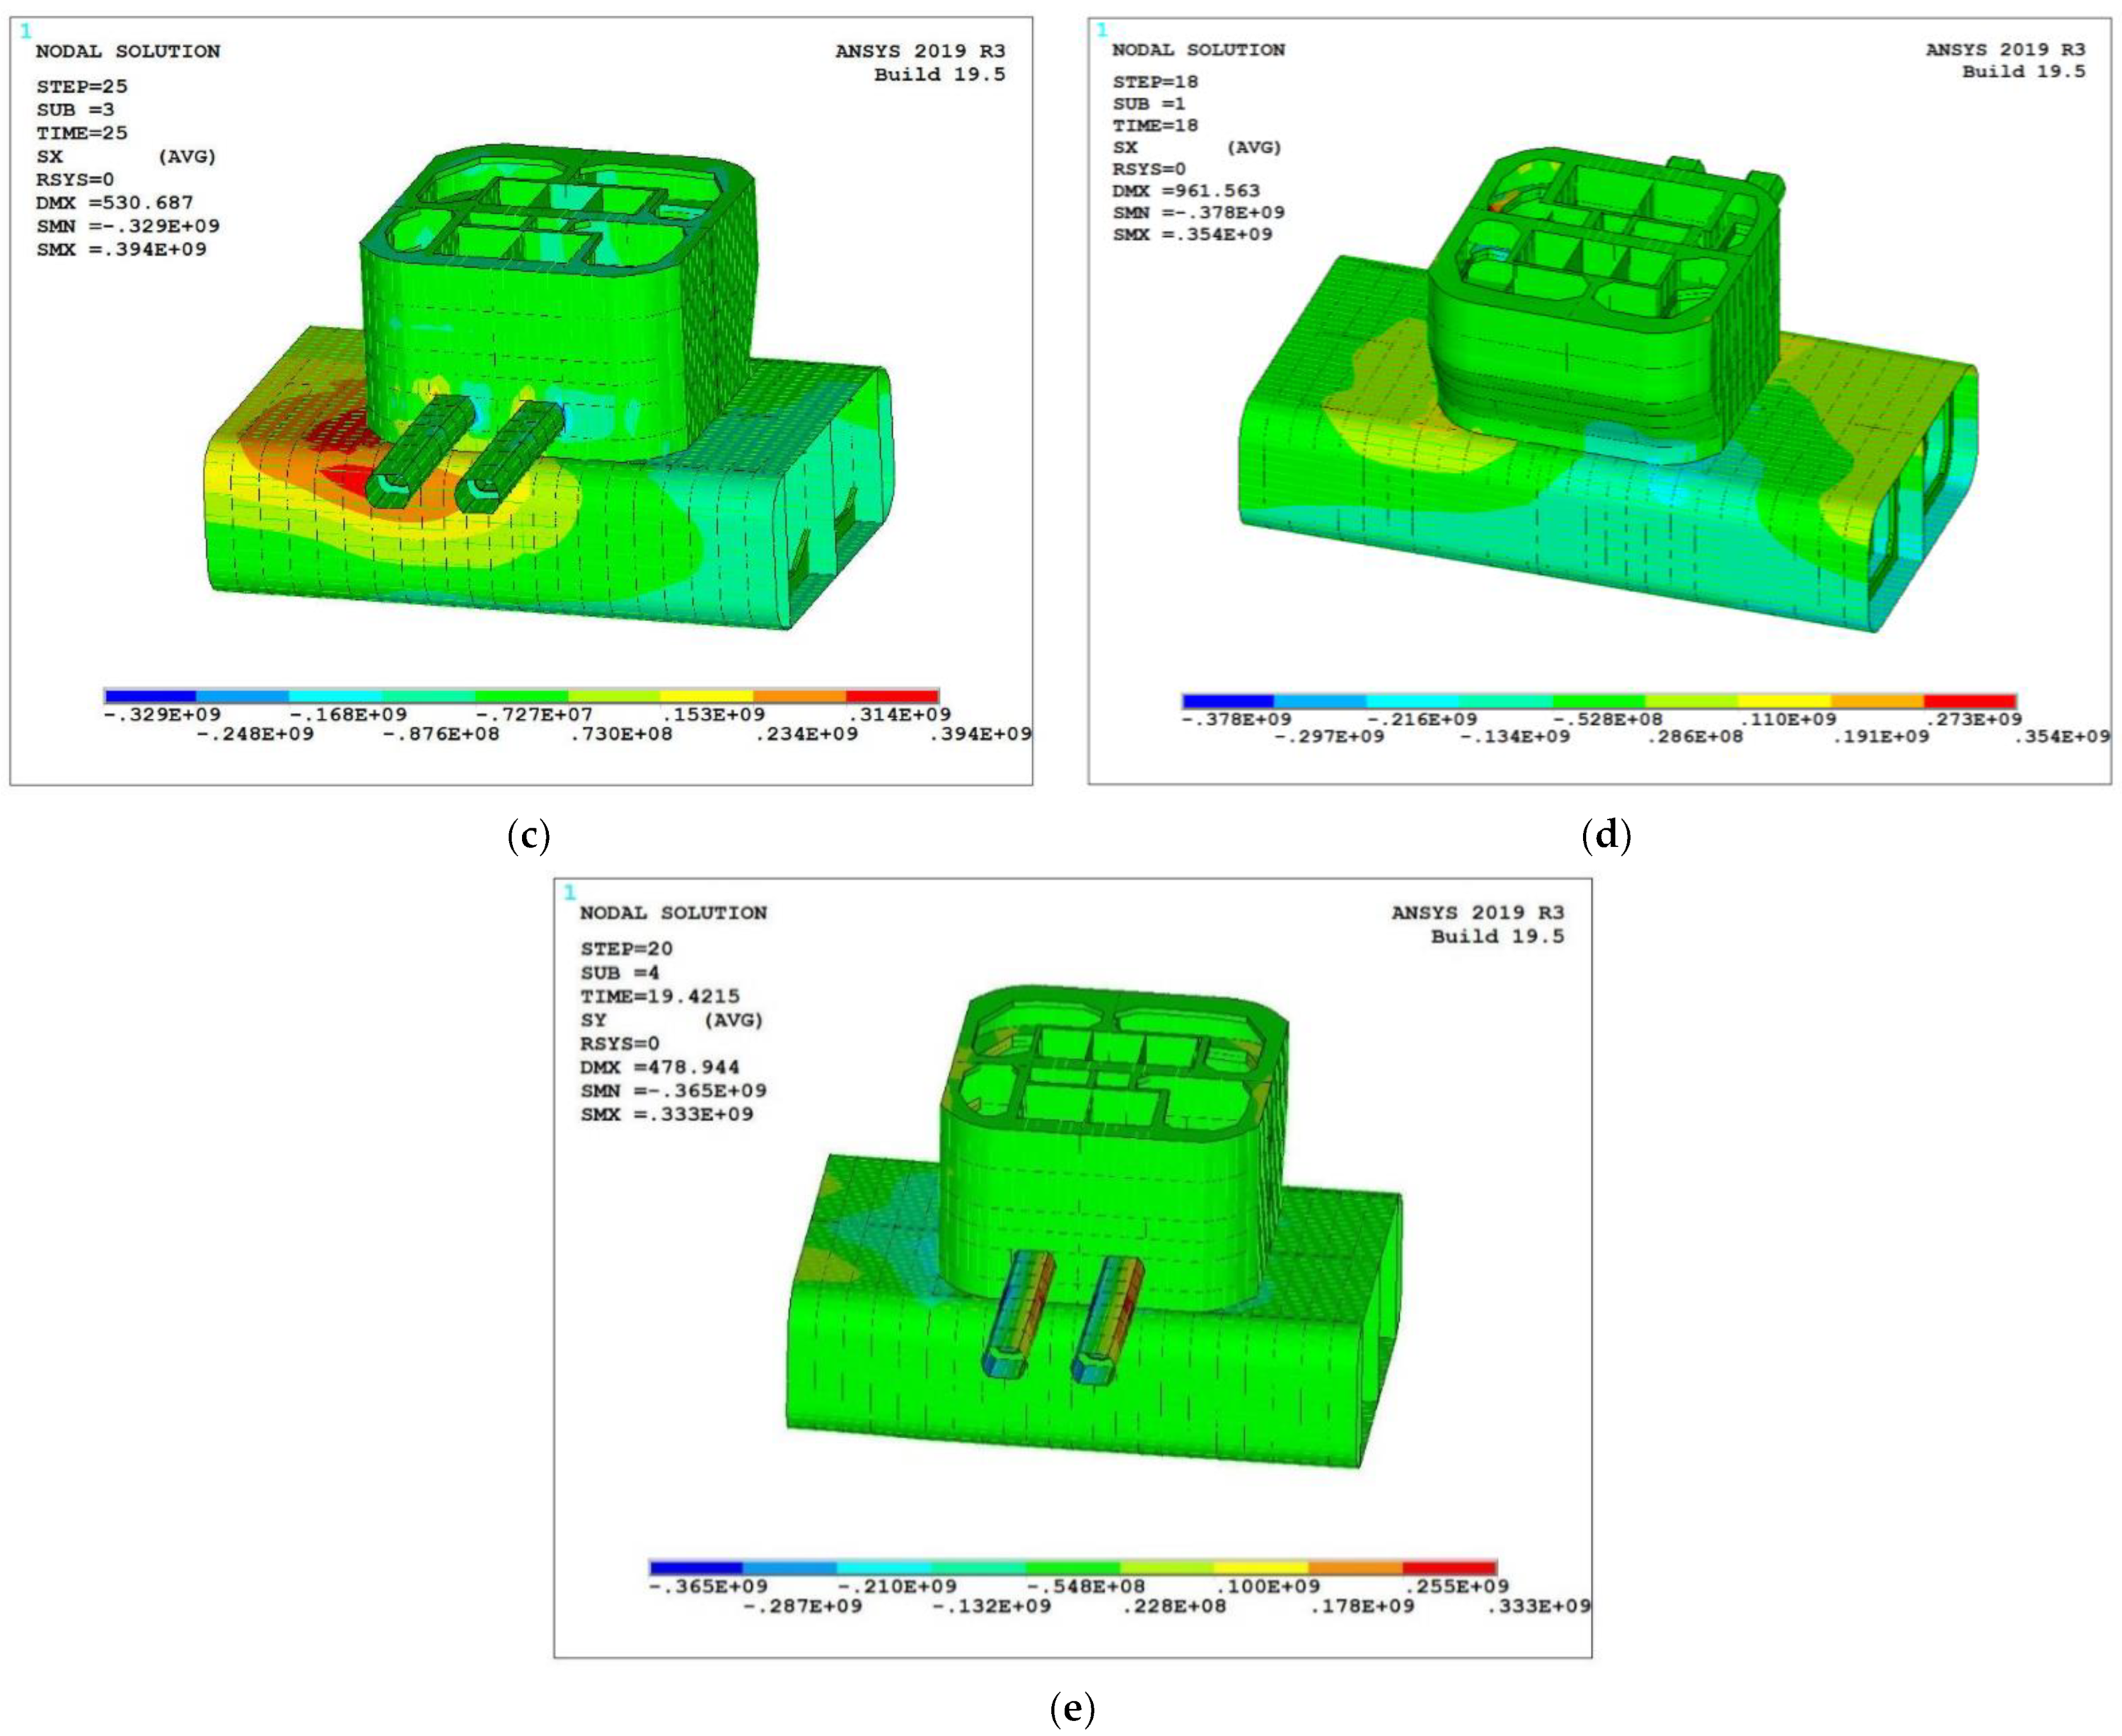
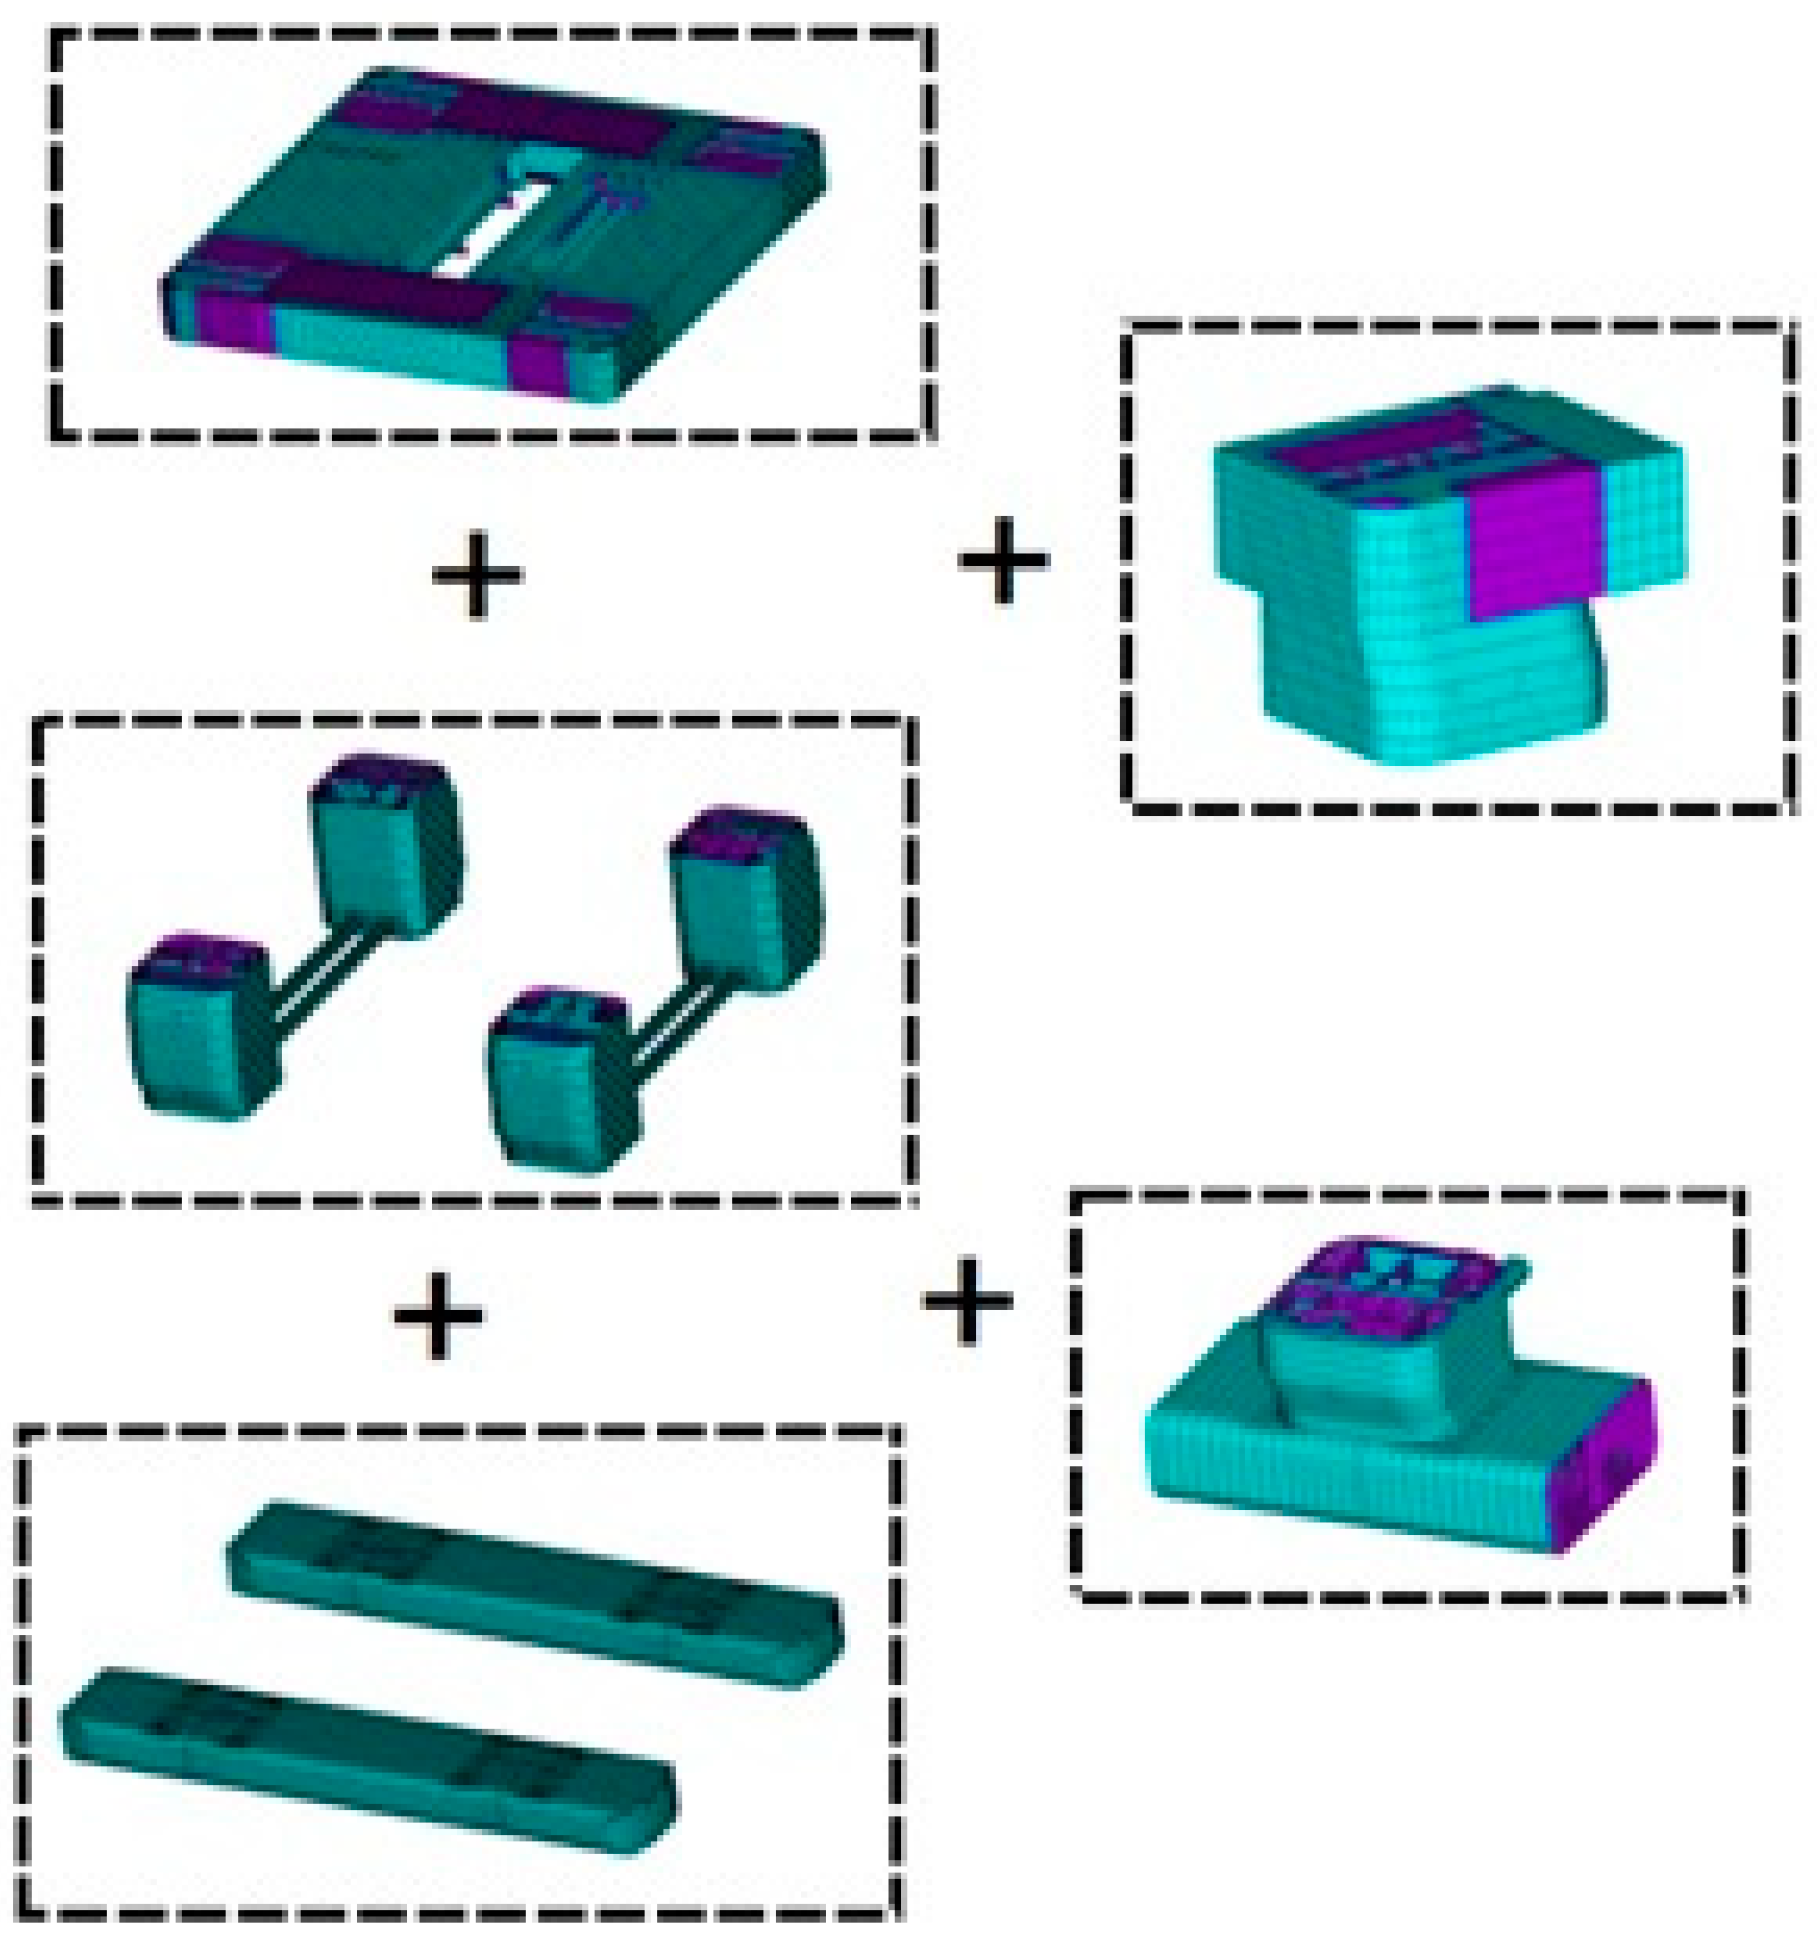
3.5. Main Nodes of the Object Platform

As shown in Figure 9, the platform connection nodes, which include the deck and column connection nodes (upper node) and the nodes of the columns and pontoon connection nodes (lower node), are being taken into consideration.
A precise method of computing the fine structure based on the Saint-Venant principle is sub-model technology. Sub-model technology is used to analyze the platform’s reliability for the local node, and it can increase accuracy and cut down on computational work. The cutting boundary can only pass-through body or shell elements according to conventional sub-model technology. Large calculation errors result from the presence of other types of elements, such as beam units, at the cutting boundary. A Beaml88 element serves as the reinforcement in the body model, and a SHELLl81 element serves as the reinforcement in the local node model. The traditional sub-model technology is currently being used to analyze which local node structures will result in inaccurate or even incorrect results. These can be avoided by selecting two or more cutting boundaries in the local node model that are farther from the area of concern, saving the nodes on the two cutting edges and the nodes in between them to create node files, and then performing displacement interpolation.

4. System Reliability of a Typical Semi-Submersible Platform

4.1. Global Strength Ultimate Limit States of the Object Platform

A structural analysis was performed using the method depicted in Figure 10. The entire platform gradually loses its ability to bear weight as the load grows. The structure reaches its maximum bearing capacity when the load reaches a certain level and is unable to support any more weight. The platform component has now undergone plastic deformation. Geometric nonlinearity was not taken into account in this study; only material nonlinearity was. The internal force of the control section was discovered to be the criterion of the ultimate state in the analysis of the platform’s maximum bearing capacity. It was assumed that the entire platform would be pushed down when the internal force of the control part stopped increasing as the load increased.
The final state of each load condition is depicted in Figure 11. It is clear that the collapse modes differ from one another, and these differences are consistent with the corresponding wave condition.

4.2. Local Node Performance of the Object Platform

The key to the reliability analysis of local nodes is identifying the mode of failure on the local nodes in the semi-submersible platform under various loads. The local nodes of the semi-submersible platform have a complex structure and can be thought of as a small system. There are numerous failure modes that can occur under various load conditions, and there is some correlation between them. The reliability analysis of the platform’s local nodes is made more challenging as a result. The reliability analysis will be considerably streamlined if the typical failure modes of the local nodes can be identified. All other failure modes can be taken as combinations of the common failure modes and various forms. Only wave loads are taken into account in this study because they significantly affect the service life of a semi-submersible platform.
Following the completion of the platform’s overall analysis under wave loading conditions, the procedure is followed to determine the various failure modes of the platform’s local nodes under various load conditions. Figure 12 displays the typical local node failure modes.

4.3. Ultimate Limit Expression of the Selected Platform

The various failure modes of the local nodes of the platform under various load conditions are obtained in accordance with the procedure, as shown in Figure 11, following the completion of the platform’s global analysis under wave loading conditions.
The main section load of the corresponding load case and the platform’s ultimate limit collapse are closely related. Based on the main section load, the recommended ultimate limit state expression for the ultimate limit state design is as follows:
Z = γ u R u γ w γ m S w
where, γ u represents the uncertainties associated with the wave model, R u represents the ultimate strength of the platform, S w represents the load effect on the platform random variable representing the wave-induced tension (or compression) force, and γ m represents the model uncertainties for predicting the semi-submersible strength. The load uncertainty variable γ m represents the model uncertainty variables.
The main section load S F causes the ultimate limit collapses of both the global and main nodes of each load case. Based on the main section load S F , the ultimate limit state expression for the ultimate limit state design is advised. As shown in Figure 12, the object platform induces very small section loads or moments ( F s , F L , M t ) when it is in a hydrostatic condition. The ultimate limit state expression for load cases involving the shear force, the split force, and the torsion moment is given by:
Z = γ u R u γ w γ m S w
where, R u represents the ultimate limit strength of the split force, the torsion moment, and the shear force and S w corresponds to the main section load. The main section load of the bending moment is decided by the combined effect of the hydrostatic pressure and the hydrodynamic pressure. The expression can be written briefly as follows:
Z = γ u M u M s w γ w γ m M w
where, M u is the maximum vertical bending moment strength of the semi-submersible platform, and M s w and M w represent the load effects of the bending moments induced by the hydro-static pressure and hydrodynamic pressure, respectively.
The main section load of the corresponding load case and the ultimate limit collapse of the object platform are closely related. Based on the main section load, the ultimate limit state expression for the ultimate limit state design is advised, and this expression can be summed up as follows:
Z = γ u R u γ w γ m S w
where, γ u represents the uncertainties associated with the wave model, R u represents the ultimate strength of the platform, S w represents the load effect on the platform random variable representing the wave-induced tension (or compression) force, and γ m represents the model uncertainties for predicting the semi-submersible strength. The load uncertainty γ m variable represents the model uncertainty variables.
The reliability analysis of the semi-submersible platform contains a lot of unknowns. The limit state equation of the structure can reflect these uncertainties by using random variables. The reliability calculation of the structures is directly influenced by the probability and statistical properties of the random variables. As a result, the platform itself, as well as the probability and statistical characteristics of the ultimate load capacity of the marine environment, play a crucial role. The literature on the structural reliability framework for FPSOs/FSUs published by the Universities of Glasgow and Strathclyde (2004) refers to the probability and statistical properties of other random variables in the limit state equation [28]. The probability and statistical distribution of the random variables are displayed in Table 4.

4.4. System Reliability Model of Semi-Submersible Platform

The chosen platform is made up of a number of parts, such as pontoons, columns, braces, and a deck. A well-known instance is the collapse of the Alexander L. Kielland platform in March 1980, which claimed 123 lives and left a ton of property in ruins. This incident suggests that if any structural components are lost, the entire structure will eventually capsize. According to the progressive analysis for these typical hydrodynamic loads, some structural elements fail before the entire structure crumbles. The failure of the corresponding components can be used to simplify each failure path, allowing the entire platform to be assumed in series. A semi-submersible platform’s system reliability model is shown in Figure 10. This model is used to calculate the system reliability. Figure 13 shows a model of a semi-submersible structure system’s reliability.
According to Section 2, structure reliability is divided into component-level and system-level reliability. As shown in Figure 13, the series structure system model can be used to determine the object platform’s system reliability. The failure probability of the entire structural system can be roughly equated to the failure probability of the first set of (brittle) components in the series system model. The approaches to these correlations are straightforward, and Equation (13) can be applied:
P F = 1 i = 1 m 1 P F i
where, F i obeys normal distribution and m approaches infinity.

5. Cass Study

5.1. Ultimate Bearing Capacity and Wave Load Effect

Table 5 displays the South Chinese Sea design wave parameters for various return periods as calculated in accordance with the DNV and ABS rules [24,25]. These wave parameters are used to run numerical simulations. Calculating the platform’s section load (moment) requires the use of an ANSYS post-processing tool. Table 6 contains more information about these loads (moments) in detail. Table 7 lists the main nodes’ section loads. The ultimate limit capacities of the entire structure and the main nodes are shown in Table 8 and Table 9, respectively.

5.2. System Reliability Computation Procedure of the Object Platform

The method for calculating the system’s reliability for a semisubmersible platform is shown in Figure 14. First, the critical wave loads were chosen, and a nonlinear finite element model was constructed. Second, the limit state function was determined, and the failure mode was calculated using a finite element model. The parameters of the limit state function were used to calculate the probability distribution, and for each load case, various aspects of the structure’s reliability were calculated using the semi-submersible platform’s system reliability model, as shown in Figure 14. It is determined how to calculate the reliability index of the system’s primary components, how to calculate the reliability of the overall system, and how to calculate the reliability index of the completed system.

5.3. Reliability Index of the Object Platform

Table 10 and Table 11 illustrate the structural reliability under various return periods with varying reliability indices, which are consistent with the finding that the failure probability rises gradually as the return period lengthens. Each load case’s reliability is roughly equal to the reliability index of the case’s dominant failure mode. In the condition of M t ., the minimum reliability index is 1.66 under the wave condition with a 500-year return period. It can also be seen that the load case of M b is also very critical for the chosen semi-submersible platform. There is not much in the literature on the appropriate system reliability index of the proposed deep-water semi-submersible platform, and the appropriate deep-water semisubmersible platform system reliability index is not clearly defined. The existing data suggest that the reliability index is 3.1, which is recommended by Xie [29] et al. However, his reliability calculation method is very simplified, resulting in a high-reliability index.
Overall, considering that the design service life is 25 years and the reliability calculated in this article has 100 years return period, 200 years return period, and 500 years return period, respectively, the system reliability obtained using the design wave design method is considered to be acceptable.

6. Conclusions

This study investigated the main nodes’ contributions while examining the system reliability of a typical semi-submersible drilling rig in design wave conditions. The application of the calculation methods is demonstrated by a typical semi-submersible drilling rig, and system reliability models and calculation techniques are discussed. On the basis of this research, the following conclusions are made:
  • According to the failure mechanism of the semi-submersible platform structural system, a system reliability model of a semi-submersible platform is proposed, including its main nodes. The system reliability model proposed in this study is used to determine the system reliability of an existing semi-submersible drilling rig.
  • This paper’s calculations show that the overall reliability of the semi-submersible platform is significantly influenced by the main nodes’ reliability. It is highly advised that the system reliability of the semi-submersible platform’s main node be taken into account.
  • The calibration of the reliability-based design criteria for semi-submersible platforms and related structures is supported by this work.

Author Contributions

Conceptualization, Q.Y. and W.-l.J.; methodology, Q.Y.; software, Q.Y.; validation, Q.Y., W.-l.J. and Y.B.; formal analysis, Y.B.; investigation, Q.Y.; resources, W.-l.J.; data curation, Y.B.; writing—original draft preparation, Q.Y.; writing—review and editing, Y.B.; visualization, Y.B.; supervision, W.-l.J.; project administration, W.-l.J.; funding acquisition, Y.B. All authors have read and agreed to the published version of the manuscript.

Funding

The National 863 High Technology Research: Research on platform safety assessment technology in disaster marine environment (Grant No. 2006AA09A109-5), the National Science and Technology major projects: Research on structural analysis technology of deep-water platform (2008zx05026-002) and the Taizhou Science and Technology Plan Project- Study on hydrodynamic performance of deep-water marine gravity cage system with single point mooring (20ny04).

Institutional Review Board Statement

Not applicable.

Informed Consent Statement

Not applicable.

Conflicts of Interest

The authors declare no conflict of interest.

Nomenclature

T Wave period
A d Wave amplitude
θ Phase angle
ϕ Incident direction
F s Main section load induced by split force
M t Global torsion moment induced by torsion moment
F L Main section load caused by shear force
M b Middle pontoon moment caused by bending moment
H s Significant wave height
AShear between column and deck
Bcolumn bending (vertical)
CPontoon shear (vertical)
DBending failure at the lower end of a column
EBending failure of transverse bracing
P f Structural failure probability
P fs Failure probability of structural system
S F main section load ( F S , F L , M t , M b , etc.)
R Resistance effect
S Load effect
μ s Load effect mean
μ R Mean of resistance effect
σ s Standard deviation of load effect
σ R Standard deviation of resistance effect
γ u Uncertainty parameters for ultimate strength calculation
γ w Uncertain parameters of load calculation
γ m Model uncertainty parameter
β Structural reliability index
ULSUltimate limit states

References

  1. Committee on Reliability of Offshore Structures. Application of reliability methods in design and analysis of offshore platforms. J. Struct. Eng. 1983, 109, 2265–2291. [Google Scholar] [CrossRef]
  2. Coccon, M.N.; Song, J.; Ok, S.Y.; Galvanetto, U. A new approach to system reliability analysis of offshore structures using dominant failure modes identified by selective searching technique. Ksce J. Civ. Eng. 2017, 21, 1–13. [Google Scholar] [CrossRef]
  3. Chojaczyk, A.A.; Teixeira, A.P.; Neves, L.C.; Cardoso, J.B.; Guedes, S.C. Review and application of artificial neural networks models in reliability analysis of steel structures. Struct. Saf. 2015, 52, 78–89. [Google Scholar] [CrossRef]
  4. Vazirizade, S.M.; Nozhati, S.; Zadeh, M.A. Seismic reliability assessment of structures using artificial neural Net- work. J. Build. Eng. 2017, 11, 230–235. [Google Scholar] [CrossRef]
  5. Gaspar, B.; Bucher, C.; Guedes Soares, C. Reliability analysis of plate elements under uniaxial compression using an adaptive re-sponse surface. Ships Offshore Struct. 2015, 10, 145–161. [Google Scholar] [CrossRef]
  6. Gaspar, B.; Guedes Soares, C. Hull girder reliability using a Monte Carlo based simulation method. Probabilistic Eng. Mech. 2013, 31, 65–75. [Google Scholar] [CrossRef]
  7. Sadoughi, M.K.; Li, M.; Hu, C.; MacKenzie, C.A.; Lee, S.; Eshghi, A.T. A high-dimensional reliability analysis method for simulation-based design under uncertainty. J. Mech. Des. 2018, 140, 071401. [Google Scholar] [CrossRef] [Green Version]
  8. Pan, Q.; Dias, D. An efficient reliability method combining adaptive support vector machine and monte Carlo simulation. Struct. Saf. 2017, 67, 85–95. [Google Scholar] [CrossRef]
  9. Sadoughi, M.; Li, M.; Hu, C. Multivariate system reliability analysis considering highly nonlinear and dependent safety events. Reliab. Eng. Syst. Saf. 2018, 180, 189–200. [Google Scholar] [CrossRef]
  10. Ang, H.S.; Leon, D.D.; Fan, W. Optimal reliability-based design of complex structural systems. Struct. Saf. 2021, 90, 102048. [Google Scholar] [CrossRef]
  11. Jia, H.; Moan, T. Comparative reliability analysis of ships under vector-load processes. J. Mar. Sci. Technol. 2009, 14, 485–498. [Google Scholar] [CrossRef]
  12. Amlashi, H.K.; Moan, T. A proposal of reliability-based design formats for ultimate hull girder strength checks for bulk carri-ers under combined global and local loadings. J. Mar. Sci. Technol. 2011, 16, 51–67. [Google Scholar] [CrossRef]
  13. Dong, W.; Moan, T.; Zhen, G. Fatigue reliability analysis of the jacket support structure for offshore wind turbine considering the effect of corrosion and inspection. Reliab. Eng. Syst. Saf. 2012, 106, 11–27. [Google Scholar] [CrossRef]
  14. Nejad, A.R.; Gao, Z.; Moan, T. Fatigue Reliability-based Inspection and Maintenance Planning of Gearbox Components in Wind Turbine Drivetrains. Energy Procedia 2014, 53, 248–257. [Google Scholar] [CrossRef] [Green Version]
  15. Ayala-Uraga, E.; Moan, T. Time-Variant Reliability Assessment of FPSO Hull Girder With Long Cracks. J. Offshore Mech. Arct. Eng. 2007, 129, 87–96. [Google Scholar] [CrossRef] [Green Version]
  16. Natskår, A.; Moan, T.; Alvær, P.Ø. Uncertainty in forecasted environmental conditions for reliability analyses of marine operations. Ocean Eng. 2015, 108, 636–647. [Google Scholar] [CrossRef] [Green Version]
  17. Bai, Y.; Yan, H.; Cao, Y.; Kim, Y.; Yang, Y.; Jiang, H. Time-dependent reliability assessment of offshore jacket platforms. Ships Offshore Struct. 2016, 11, 591–602. [Google Scholar] [CrossRef]
  18. Asgarian, B.; Zarrin, M.; Sabzeghabaian, M. Effect of foundation behaviour on steel jacket offshore platform failure modes under wave loading. Ships Offshore Struct. 2019, 14, 570–581. [Google Scholar] [CrossRef]
  19. Zhao, Y.; Dong, S.; Jiang, F.; Guedes Soares, C. System Reliability analysis of an offshore jacket platform. J. Ocean Univ. China 2020, 19, 47–59. [Google Scholar] [CrossRef]
  20. Shao, J.; He, Y.; Hu, D.; Xu, L.; Jin, W. Strength reliability analysis method for local joint of tension leg plat-form. Ocean Eng. 2012, 30, 25–32. (In Chinese) [Google Scholar]
  21. Qian, Y.; Jin, W.; Yong, H.; Yong, B. System reliability of a semi-submersible drilling rig. Ships Offshore Struct. 2013, 8, 84–93. [Google Scholar]
  22. Feng, Y. Enumerating significant failure modes of a structural system by using criterion methods. Comput. Struct. 1988, 30, 1152–1157. [Google Scholar] [CrossRef]
  23. Murotsu, Y.; Okada, H.; Taguchi, K.; Grimmelt, M.; Yo-Nezawa, M. Automatic generation of stochastically dominant failure modes of frame structures. Struct. Saf. 1984, 2, 17–25. [Google Scholar] [CrossRef]
  24. Column-Stabilised Units; DNV-RP-C103; Det Norske Veritas: Oslo, Norway, 2005.
  25. Rules for Building and Classing Mobile Offshore Drilling Units Modu-Part-3; ABS MODU; American Bureau of Shipping: Houston, TX, USA, 2008.
  26. ANSYS User’s Manual (Version 19.0); Swanson Analysis Systems Inc.: Houston, TX, USA, 2019.
  27. WAMIT User Manual Ver 6.3; WAMIT Inc.: Boston, MA, USA, 2006.
  28. Purnendu, K.; Das, B.E. Structural Reliability Framework for FPSOs/FSUs; Universities of Glasgow and Strathclyde: Glasgow, UK, 2004. [Google Scholar]
  29. Xie, X.; Hu, J.J.; He, B. The LRFD method research of semi-submersible platform. In Proceedings of the Academic Conference on Ship and Ocean Structure Mechanics in Memory of Academician Xu Binghan, Wuxi, China, 1 January 2011. (In Chinese). [Google Scholar]
Figure 1. Two simple series systems. (a) Series members, (b) Truss structures.
Jmse 11 00052 g001
Figure 2. Two simple parallel systems. (a) parallel members, (b) rigid-plastic frame.
Jmse 11 00052 g002
Figure 3. Configuration of the object platform.
Jmse 11 00052 g003
Figure 4. RAO of split force.
Jmse 11 00052 g004
Figure 5. RAO of longitudinal force.
Jmse 11 00052 g005
Figure 6. RAO of torsion moment.
Jmse 11 00052 g006
Figure 7. RAO of bending moment.
Jmse 11 00052 g007
Figure 8. Nonlinear finite element model developed for the object semisubmersible platform. (a) a finite element model of semi submersible platform, (b) a finite element model of semi submersible platform under wave loads.
Jmse 11 00052 g008
Figure 9. Main nodes of the object platform.
Jmse 11 00052 g009
Figure 10. Procedure for the ultimate limit state assessment.
Jmse 11 00052 g010
Figure 11. The ultimate limit states of the selected platform. (a) ULS of split force; (b) ULS of torsion moment; (c) ULS of shear force; (d) ULS of bending moment.
Jmse 11 00052 g011aJmse 11 00052 g011b
Figure 12. The main node deformation of the selected platform. (a) Shear between column and deck; (b) Column bending (vertical); (c) Pontoon shear (vertical); (d) Bending failure at the lower end of a column; (e) Bending failure at the end of transverse bracing.
Jmse 11 00052 g012aJmse 11 00052 g012b
Figure 13. System reliability model of semi-submersible structure.
Jmse 11 00052 g013
Figure 14. System reliability analysis procedure of semi-submersible platform.
Jmse 11 00052 g014
Table 1. Principal dimensions of the platform under consideration.
Principal Dimensions of the PlatformDimension (m)
Pontoon length114.07
Pontoon breadth68.60
Pontoon height8.54
Column spacing cl to cl longitudinal58.56
Column spacing cl to cl transverse58.56
Height of main deck30.000
Height of upper deck38.60
Length of deck77.47
Breadth of deck74.42
Table 2. Theoretical response description for typical design wave.
Design Wave TypeCharacteristic Response DescriptionWave Direction
Split forceThis response will normally give the maximum axial force in the transverse horizontal braces of a twin semi-submersible platform.Beam sea
Torsion momentThis response will normally give the maximum axial force in the diagonal horizontal and diagonal vertical braces of a conventional twin pontoon unit. For units without these braces, the main deck structure has to be designed for this moment.Diagonal sea
Shear forceThe longitudinal forces on pontoons and columns are maximized. The response will introduce an opposite longitudinal (and vertical) displacement for each pontoon and, thus, introduce the bending moment (S-moment) on the transverse braces.Diagonal sea
Bending momentThis response will normally give the maximum hogging or sagging bending moment in the middle of the pontoon.Head sea
Table 3. Wave parameters selected by design wave method.
Design Wave TypeWave Period (s)Incident Direction (°)Phase Angle (°) Max .   RAOs   of   S F
Split force990−33.61.33 × 107 N
Torsion Moment8.0120160.22.98 × 108 N × m
Shear force7135108.36.97 × 106 N
Bending moment9.6180132.83.05 × 108 N × m
Table 4. Failure function stochastic model.
VariableDistribution TypeCOVMean
R u Lognormal0.08calculate
S w Gumbel Extreme0.163calculate
γ u Normal0.11
γ w Normal0.11
γ m Normal0.11
Table 5. Characteristic wave parameters for different return periods.
Wave ParametersReturn Period (y)Load Case T s A d m ϕ ° θ °
Force Mode
Split force10019.68.8990−33.6
20029.48
500310.33
Torsion Moment10048.06.33120−19.8
20056.75
50067.36
Shear Force100710.08.15135165.3
20088.69
50099.47
Bending moment100109.88.21180132.4
200118.75
500129.54
Static 13
Table 6. Calculation results of the main section loads of the platform.
Section Load F s k N F L k N M t k N · m M b k N · m
Load Case
11.21 × 1079.40 × 1073.58 × 1082.23 × 108
21.23 × 1071.04 × 1083.61 × 1082.18 × 108
31.27 × 1071.14 × 1083.66 × 1082.07 × 108
41.38 × 1072.70 × 1071.97 × 1093.74 × 108
51.53 × 1072.80 × 1072.05 × 1093.76 × 108
61.75 × 1072.91 × 1072.23 × 1093.79 × 108
71.71 × 1071.50 × 1072.81 × 1082.44 × 108
81.83 × 1071.60 × 1073.37 × 1082.52 × 108
92.02 × 1071.74 × 1073.83 × 1082.59 × 108
105.82 × 1062.02 × 1075.48 × 1088.79 × 108
116.34 × 1062.12 × 1075.59 × 1089.15 × 108
127.09 × 1062.27 × 1075.71 × 1089.67 × 108
137.60 × 1048.65 × 1057.80 × 1073.38 × 108
Table 7. Calculation results of the internal force of the control section of the local connection node of the object platform.
Section ForceA (kN∙m)B (kN)C (kN∙m)D (kN∙m)E (kN)
Load Case
11.43 × 1071.04 × 1077.92 × 1062.85 × 1087.54 × 106
21.99 × 1071.06 × 1078.22 × 1063.04 × 1088.53 × 106
32.50 × 1071.09 × 1078.76 × 1062.98 × 1089.86 × 106
46.20 × 1071.29 × 1071.81 × 1075.30 × 1082.57 × 106
56.92 × 1071.37 × 1071.96 × 1075.47 × 1082.10 × 106
67.78 × 1071.48 × 1072.07 × 1075.64 × 1081.98 × 106
73.44 × 1075.90 × 1064.10 × 1055.02 × 1081.28 × 107
83.43 × 1076.37 × 1062.94 × 1055.10 × 1081.32 × 107
93.41 × 1077.04 × 1061.26 × 1055.22 × 1081.38 × 107
105.48 × 1081.17 × 1064.01 × 1065.04 × 1086.81 × 106
115.81 × 1081.18 × 1064.42 × 1065.12 × 1086.85 × 106
126.30 × 1081.19 × 1065.01 × 10+5.24 × 1086.91 × 106
Table 8. Ultimate cross section internal force.
Section Load Type
F s (kN) F L (kN) M t (kN × m) M b (kN × m)
4.44 × 1072.12 × 1084.47 × 1091.56 × 109
Table 9. Ultimate bearing capacity of the control section internal force of the local connection node of the object platform.
Section Load Type
ABCDE
1.46 × 1093.18 × 1074.36 × 1071.19 × 1092.95 × 107
Table 10. Reliability calculation results of the local connection nodes of the semi-submersible platform.
ModeABCDETotal
Load Case β β P f
14.336.349.905.735.194.337.5 × 10−6
24.266.219.865.524.764.241.1 × 10−5
34.166.009.825.584.254.042.6 × 10−5
43.553.479.523.568.653.226.3 × 10−4
53.333.179.463.459.102.971.5 × 10−3
63.042.979.383.339.172.743.1 × 10−3
76.279.909.753.763.313.265.6 × 10−4
86.019.939.753.703.193.158.2 × 10−4
95.689.979.753.623.022.991.4 × 10−3
109.598.493.843.755.533.611.5 × 10−4
119.598.203.623.695.513.472.6 × 10−4
129.597.813.333.615.493.246.0 × 10−4
Table 11. System reliability of the object structure for each load case.
Mode F s F L M t M b Main Nodes Whole Platform
Load Case ββ P f s
14.973.228.887.124.333.011.30 × 10−3
24.912.848.867.194.242.812.50 × 10−3
34.82.498.827.364.042.437.52 × 10−3
44.517.493.255.413.222.251.22 × 10−2
54.147.373.15.392.971.952.54 × 10−2
63.667.252.785.362.741.664.82 × 10−2
73.749.19.236.833.262.311.05 × 10−2
83.59.019.026.723.152.181.45 × 10−2
93.138.858.626.632.992.002.25 × 10−2
107.48.397.612.623.612.486.57 × 10−3
117.128.247.552.443.472.271.16 × 10−2
126.768.037.482.183.241.972.47 × 10−2
Disclaimer/Publisher’s Note: The statements, opinions and data contained in all publications are solely those of the individual author(s) and contributor(s) and not of MDPI and/or the editor(s). MDPI and/or the editor(s) disclaim responsibility for any injury to people or property resulting from any ideas, methods, instructions or products referred to in the content.

