1. Introduction
Floating offshore wind is a promising industry. Compared to the fixed offshore wind industry, the space available at sea is enormous. Moreover, the floating turbines are considered less intrusive from a visual and noise point of view.
The main challenge for the floating wind industry is the Levelized Cost of Electricity (LCOE). LCOE can be seen as the lifetime cost of an energy source per unit of energy generated [
1]. LCOE for floating offshore wind could vary in the next decades from 125 EUR/MWh to 50 EUR /MWh [
2]. Floating wind energy must improve its LCOE for better acceptance. The industry is already showing some improvements, and the latest auction results (in Spain or France) [
3] suggest that floating offshore wind LCOE might decrease based on the new technology improvements [
4].
Reducing investment expenditures is a way to achieve the LCOE target. The investment expenditures in the installation are estimated to represent between 12 and 22% of the total costs over a lifetime. Conducting the construction properly can minimize investment expenditures.
The installation and logistics phases are where significant cost reductions can be achieved [
2,
5]. Catapult Offshore Renewable Energy Group finds that many LCOE reduction initiatives are related to logistics. According to Poulsen and Bay Hasager [
6], efficient logistics plans are expected to reduce costs significantly.
Currently, several floating wind farms are under planning worldwide [
7]. There is a need for researchers and practitioners to improve logistics during offshore wind farm manufacturing, especially during the construction and installation phase. Increasing distances from the coast and rising sizes of the wind turbines [
8] along with the development of ever more refined floating platforms [
9,
10] are also making the subject even more relevant due to more difficult logistical challenges. The improvement in the installation and logistics could reduce construction costs and contribute to a better LCOE.
In this context, this study develops a model for wind farm design and offshore logistics identifying the main costs. The method evaluates and compares possible offshore logistics spread to support the wind turbine construction phase. Different installation scenarios and the resulting requirements for the installation are presented.
Chapter 2 explore the available knowledge on floating wind logistics and identifies research areas of improvement. A description of the methodology adopted is presented in chapter 3. A project’s descriptive parameters and structure are explained in chapter 4. Chapter 5 identifies the main logistical aspects related to the case study evaluated. A discussion about the main elements identified is presented in chapter 6. Chapter 7 performs a sensitivity analysis of model variables. Chapter 8 identifies the main challenges for the EU market. This paper concludes with the findings of this research.
2. State-of-the-Art
The studies on modelling logistic requirements and installing an offshore wind farm have increased over the last few years. This modelling and analysis allow practitioners to analyze the installation of a floating wind farm in advance so that developers can prepare for specific outcomes in terms of cost or delay. Several authors focus on construction operations and weather risk analyses.
Poulsen and Hasager [
6] propose a logistics model related to modules, components, people, tools, and onshore and offshore transportation equipment. Kaiser and Snyder [
11] analyze wind turbine logistics during construction. Main installation vessels, foundations, turbines, substations and install inner-array or export cable are described.
Thomsen [
12] describes the installation process with detailed installation vessel characteristics. Skiba [
13] analyses the challenge of installation works at sea. Moreover, other studies have been conducted to improve the use of installation vessels, which have been identified as the bottleneck of the installation process [
14].
The European Wind Energy Association [
15] presented a method allowing a dynamical installation planning of shorter periods based on up-to-date weather forecasts. Scholz-Reiter et al. [
16] applied a mixed integer linear programming (MILP) model to determine the installation schedule in different weather conditions and loading operations. Lange et al. [
17] developed a discrete simulation tool of the supply chain based on weather windows to install units efficiently. Ait-Alla et al. [
18] presented a MILP model considering the weather in a deterministic manner. They reviewed the outcome of two installation scenarios. The model minimizes the installation costs by considering vessel utilization and fixed costs that span the length of the installation period. Barlow et al. [
19] review the susceptibility of vessels and operations to weather constraints during installation. Irawan et al. [
20] look to address offshore wind construction scheduling issues through an integer linear programming method. The authors combine weather data and vessel availability to identify the optimal installation with the lowest costs and shortest schedules.
Muhabie et al. [
21] consider weather restrictions, distances, vessel capabilities and assembly scenarios in a discrete event simulation tool. Sarker and Faiz [
22] present a cost model developed for wind turbine installation and transportation. The study also analyses the impact of decision variables on the total cost. Barlow et al. [
23] explore the impact of critical logistical decisions on the cost and duration of the installation. Boulougouris [
24] explained the appropriate reactions to disrupted installation schedules using a rolling-horizon optimization tool. Backe [
25] developed the logistical planning of offshore wind farm installation through mathematical optimization.
Paterson et al. [
26] present a software tool using Monte Carlo simulation and embedded forecasting and logistical models. Maples et al. [
27] propose a specialized turbine assembly procedure. Navigant Consulting [
28] review the evolution of installation concepts in the previous ten years. Vis and Ursavas [
29] suggest a preassembly strategy based on the number of components for installation onsite and the maximum number of turbines to be loaded on a vessel.
The literature described above mainly focuses on installation vessel planning and optimization based on weather conditions. Besides, the documents are related to fixed offshore wind farms. Therefore, there is no intention in the present paper to push it further, even in the case of floating wind farms, where the offshore installation aspects are simple. Nevertheless, further academic contributions could be made in the logistical aspects (wind farm design, storage, main components, costs) of the floating wind farm construction.
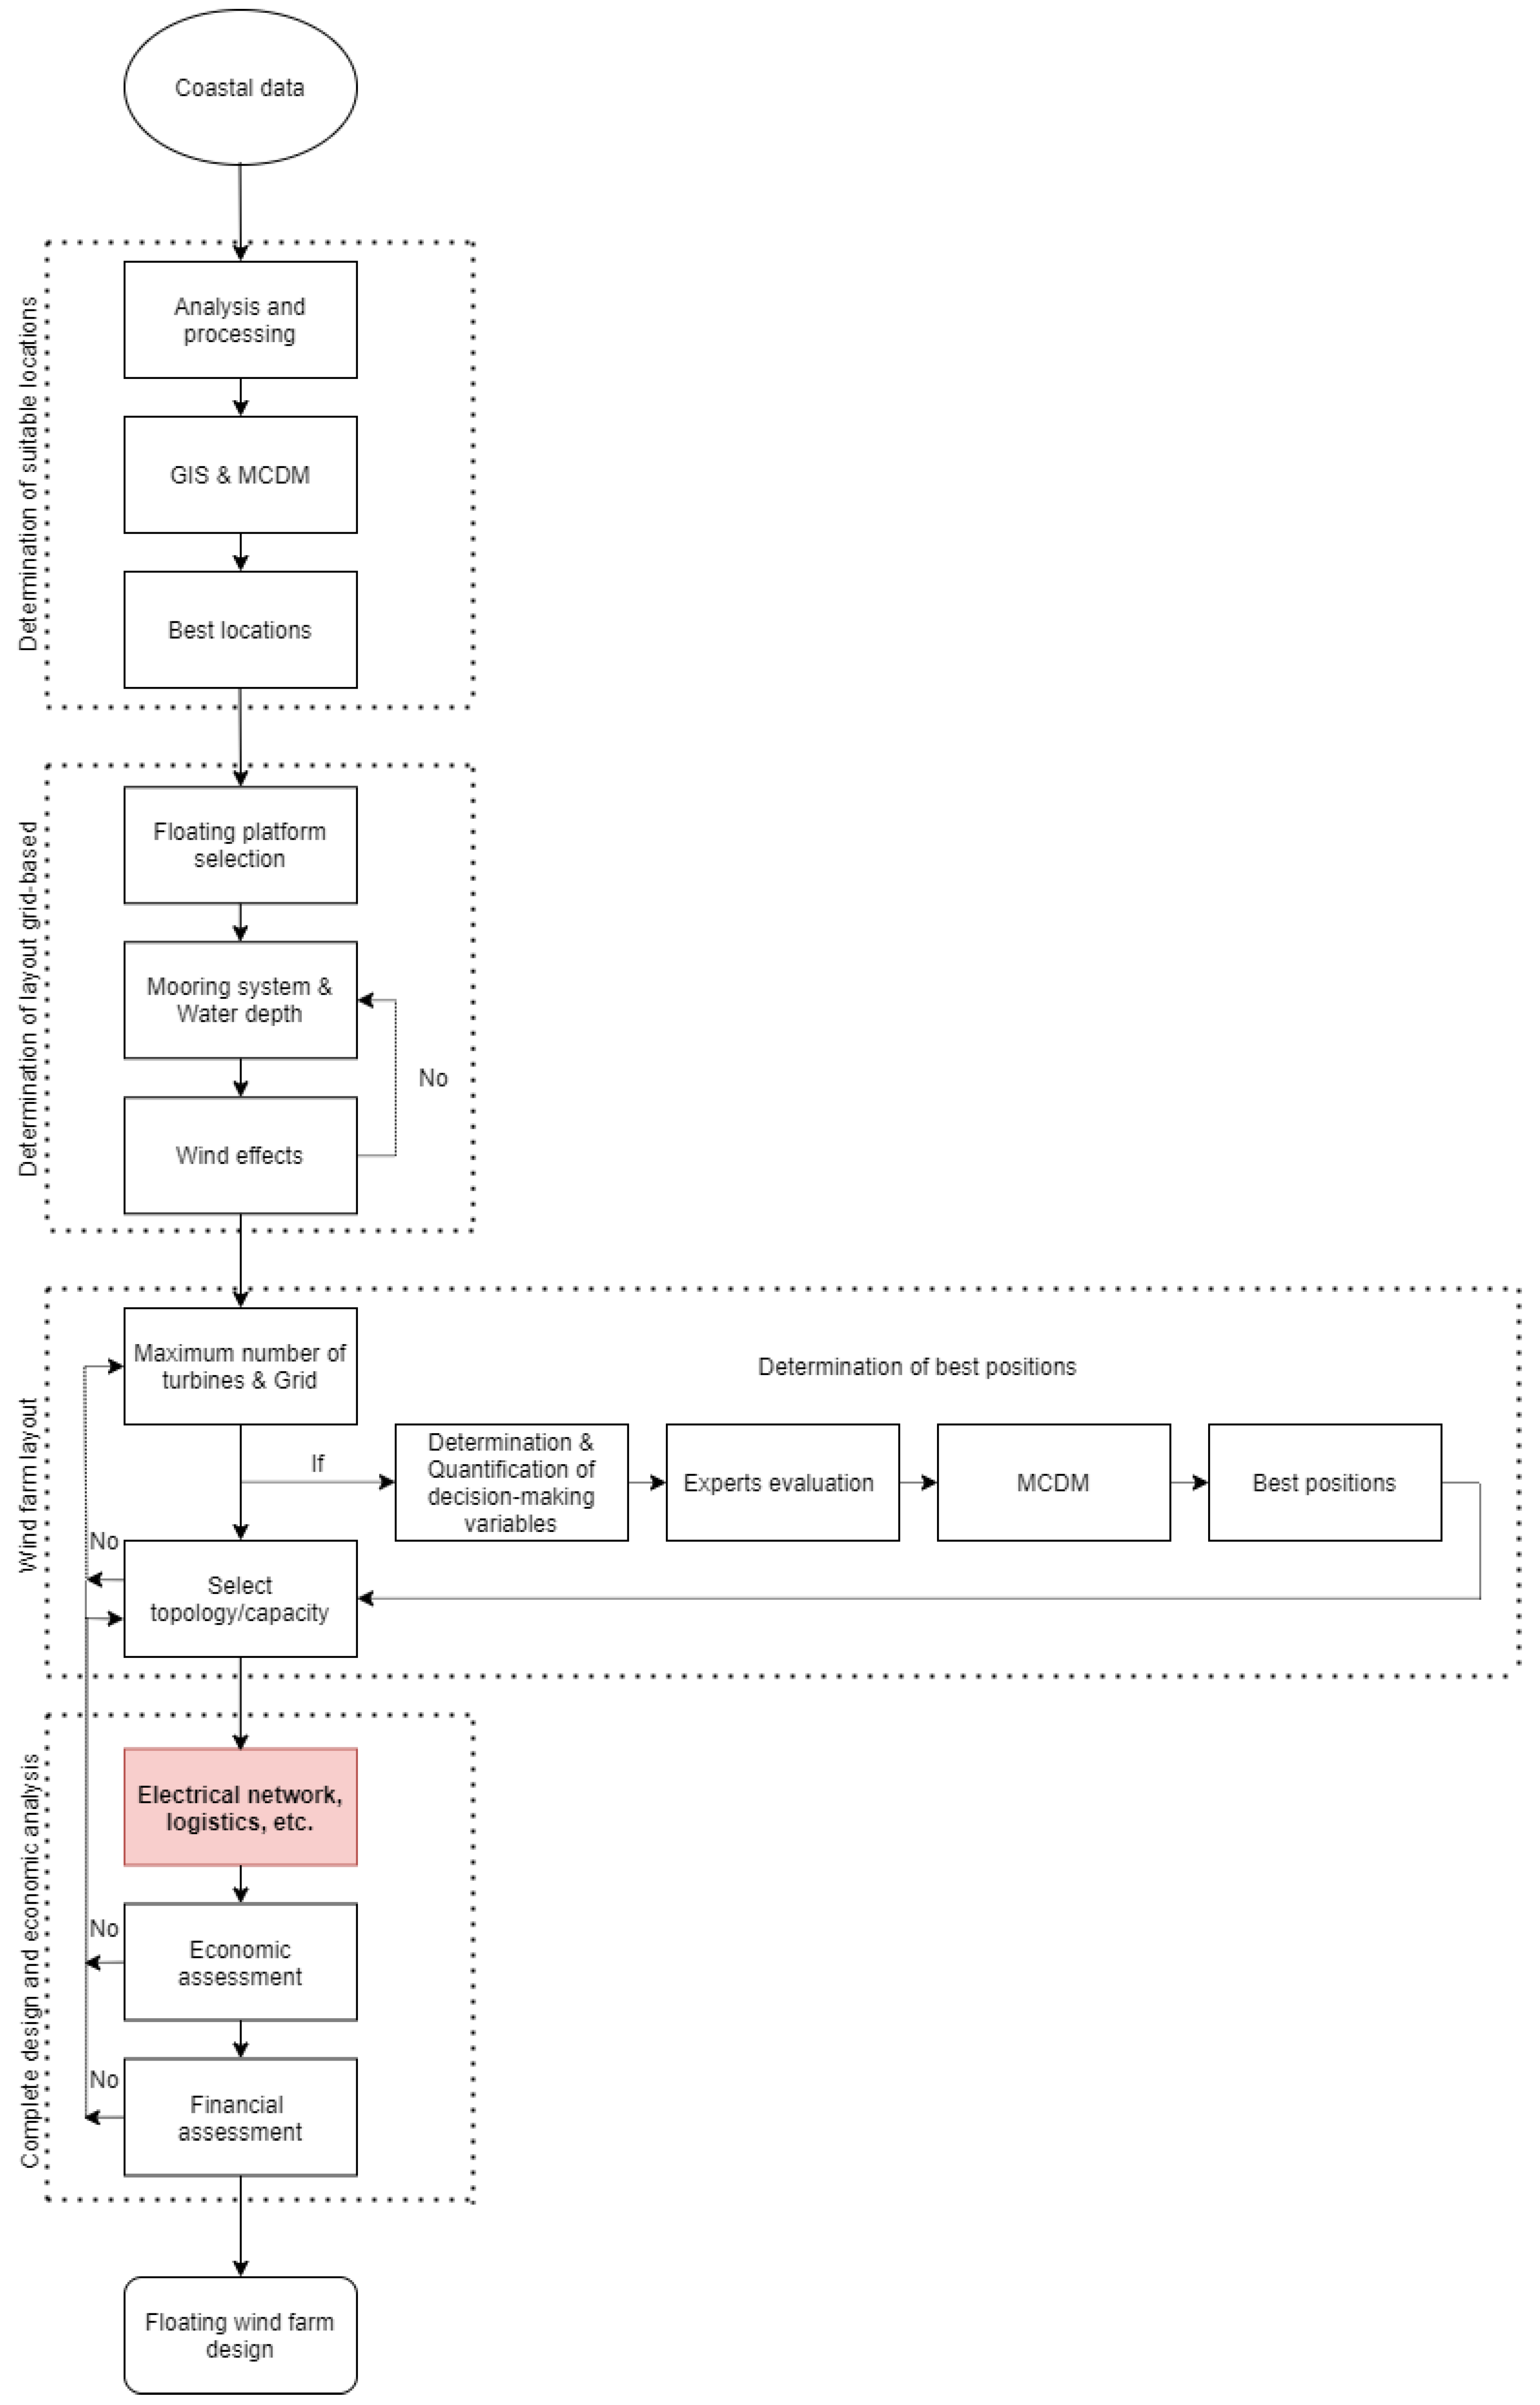
To tackle this objective, a model is constructed based on offshore wind literature and data applied to the wind farms developed in the Arcwind project. However, dedicated literature was not found on proper planning and improving logistics during the construction phase. Considering the lack of knowledge, the present paper aims to develop a floating farm design logistics tool. The tool can work separately or be included in the previous tools developed by Díaz and Guedes Soares and related to the site selection and wind farm design (see
Figure 1) [
30,
31,
32,
33,
34,
35]. This tool offers adaptability to planners and investors as required. The tool can simulate the complete installation of a floating offshore wind farm, handled in phases, and considers the constraints of the operations, materials and vessels.
3. Methodology to Improve Floating Offshore Wind Farm Installation Planning
This paper employs a logistics simulation tool to determine the main installation aspects of a floating wind farm in advance. Moreover, the installation processes are analyzed to identify the durations and to prepare a complete economic evaluation.
The proposed model is based on literature and in-house knowledge related to floating wind technologies. The model can precisely measure the cost to a more targeted level, enabling companies to analyze the costs further. Several parameters are required for each wind farm concept: the cost per time unit of supplying resource capacity (technicians, vessels, staff) and the unit times of consumption of resource capacity by products and services, among others related to the technology, deployed.
The method can incorporate real operations by including process duration and weather conditions. The model calculates the cost of an hour worked in the wind farm depending on the total hours used. These indicators help plan improvements.
The main steps of this work are shown in
Figure 2. The system represents a specific logistic setup for a floating farm construction. The objective is to determine the main logistic aspects of a floating farm as efficiently as possible. Based on the method application, some patterns are identified, and some recommendations are drawn to improve wind farm planning. A secondary objective is to identify the fundamental steps in a construction phase of a wind farm construction to reduce the execution time.
When determining the logistic aspects of floating wind farms in any given region, four main issues can be addressed more or less independently of each other: determining the electrical infrastructure (array cable, export cable and substation), offshore and onshore substations, port or shipyard characteristics and, finally, installation time. Methodological approaches for addressing these independent, fundamental aspects are developed in this work and then combined into the economic and financial module of floating wind farm design.
Creating the Model
Analyzing the logistic impacts of constructing floating farms requires a large amount of specific data such as capital costs, labor rates, region-specific inputs, personal expenditure patterns, and price deflators.
The first step of the model is to define a floating wind farm project. This is critical, particularly for the floating wind, because the main components (e.g., floating foundation type) are susceptible to project parameters. For this first version of the methodology, representative projects are derived based on a review of the multiple project proposals and concepts under consideration at the time of the model’s development [
36].
The model contains default values for all inputs necessary to perform an analysis. However, the user can also modify values or select between different options (e.g., floating foundation type, mooring system, etc.). To develop the input data, the Consortium of the Arcwind project estimated the data associated with individual line items for the representative project described in previous studies [
36,
37,
38]. Some data, such as logistic times, required space, and costs, are derived from different sources (floating wind professionals, renewable energy studies, project-related case studies, etc.). These sources helped to establish a baseline for analysis (
Appendix A). Once specific data were estimated from different study parameters, other external resources were used (see
Table 1). Then, the estimates were refined based on the data available.
4. Project Descriptive Data
4.1. Locations
In the scope of the Arcwind project, several locations were determined through the study of the ZEE of the European Atlantic coast and the application of the methodologies proposed by Diaz et al. [
32] and Loughney et al. [
69]. More than one hundred locations could host a floating wind farm guaranteeing an energy potential capable of covering a large part of the electricity demand of the Atlantic countries.
After the application of the MCDM methodologies by Diaz et al. and Lounghley et al. [
30,
69] and based on the results obtained two locations by floating platform were selected to complete floating wind farm designs.
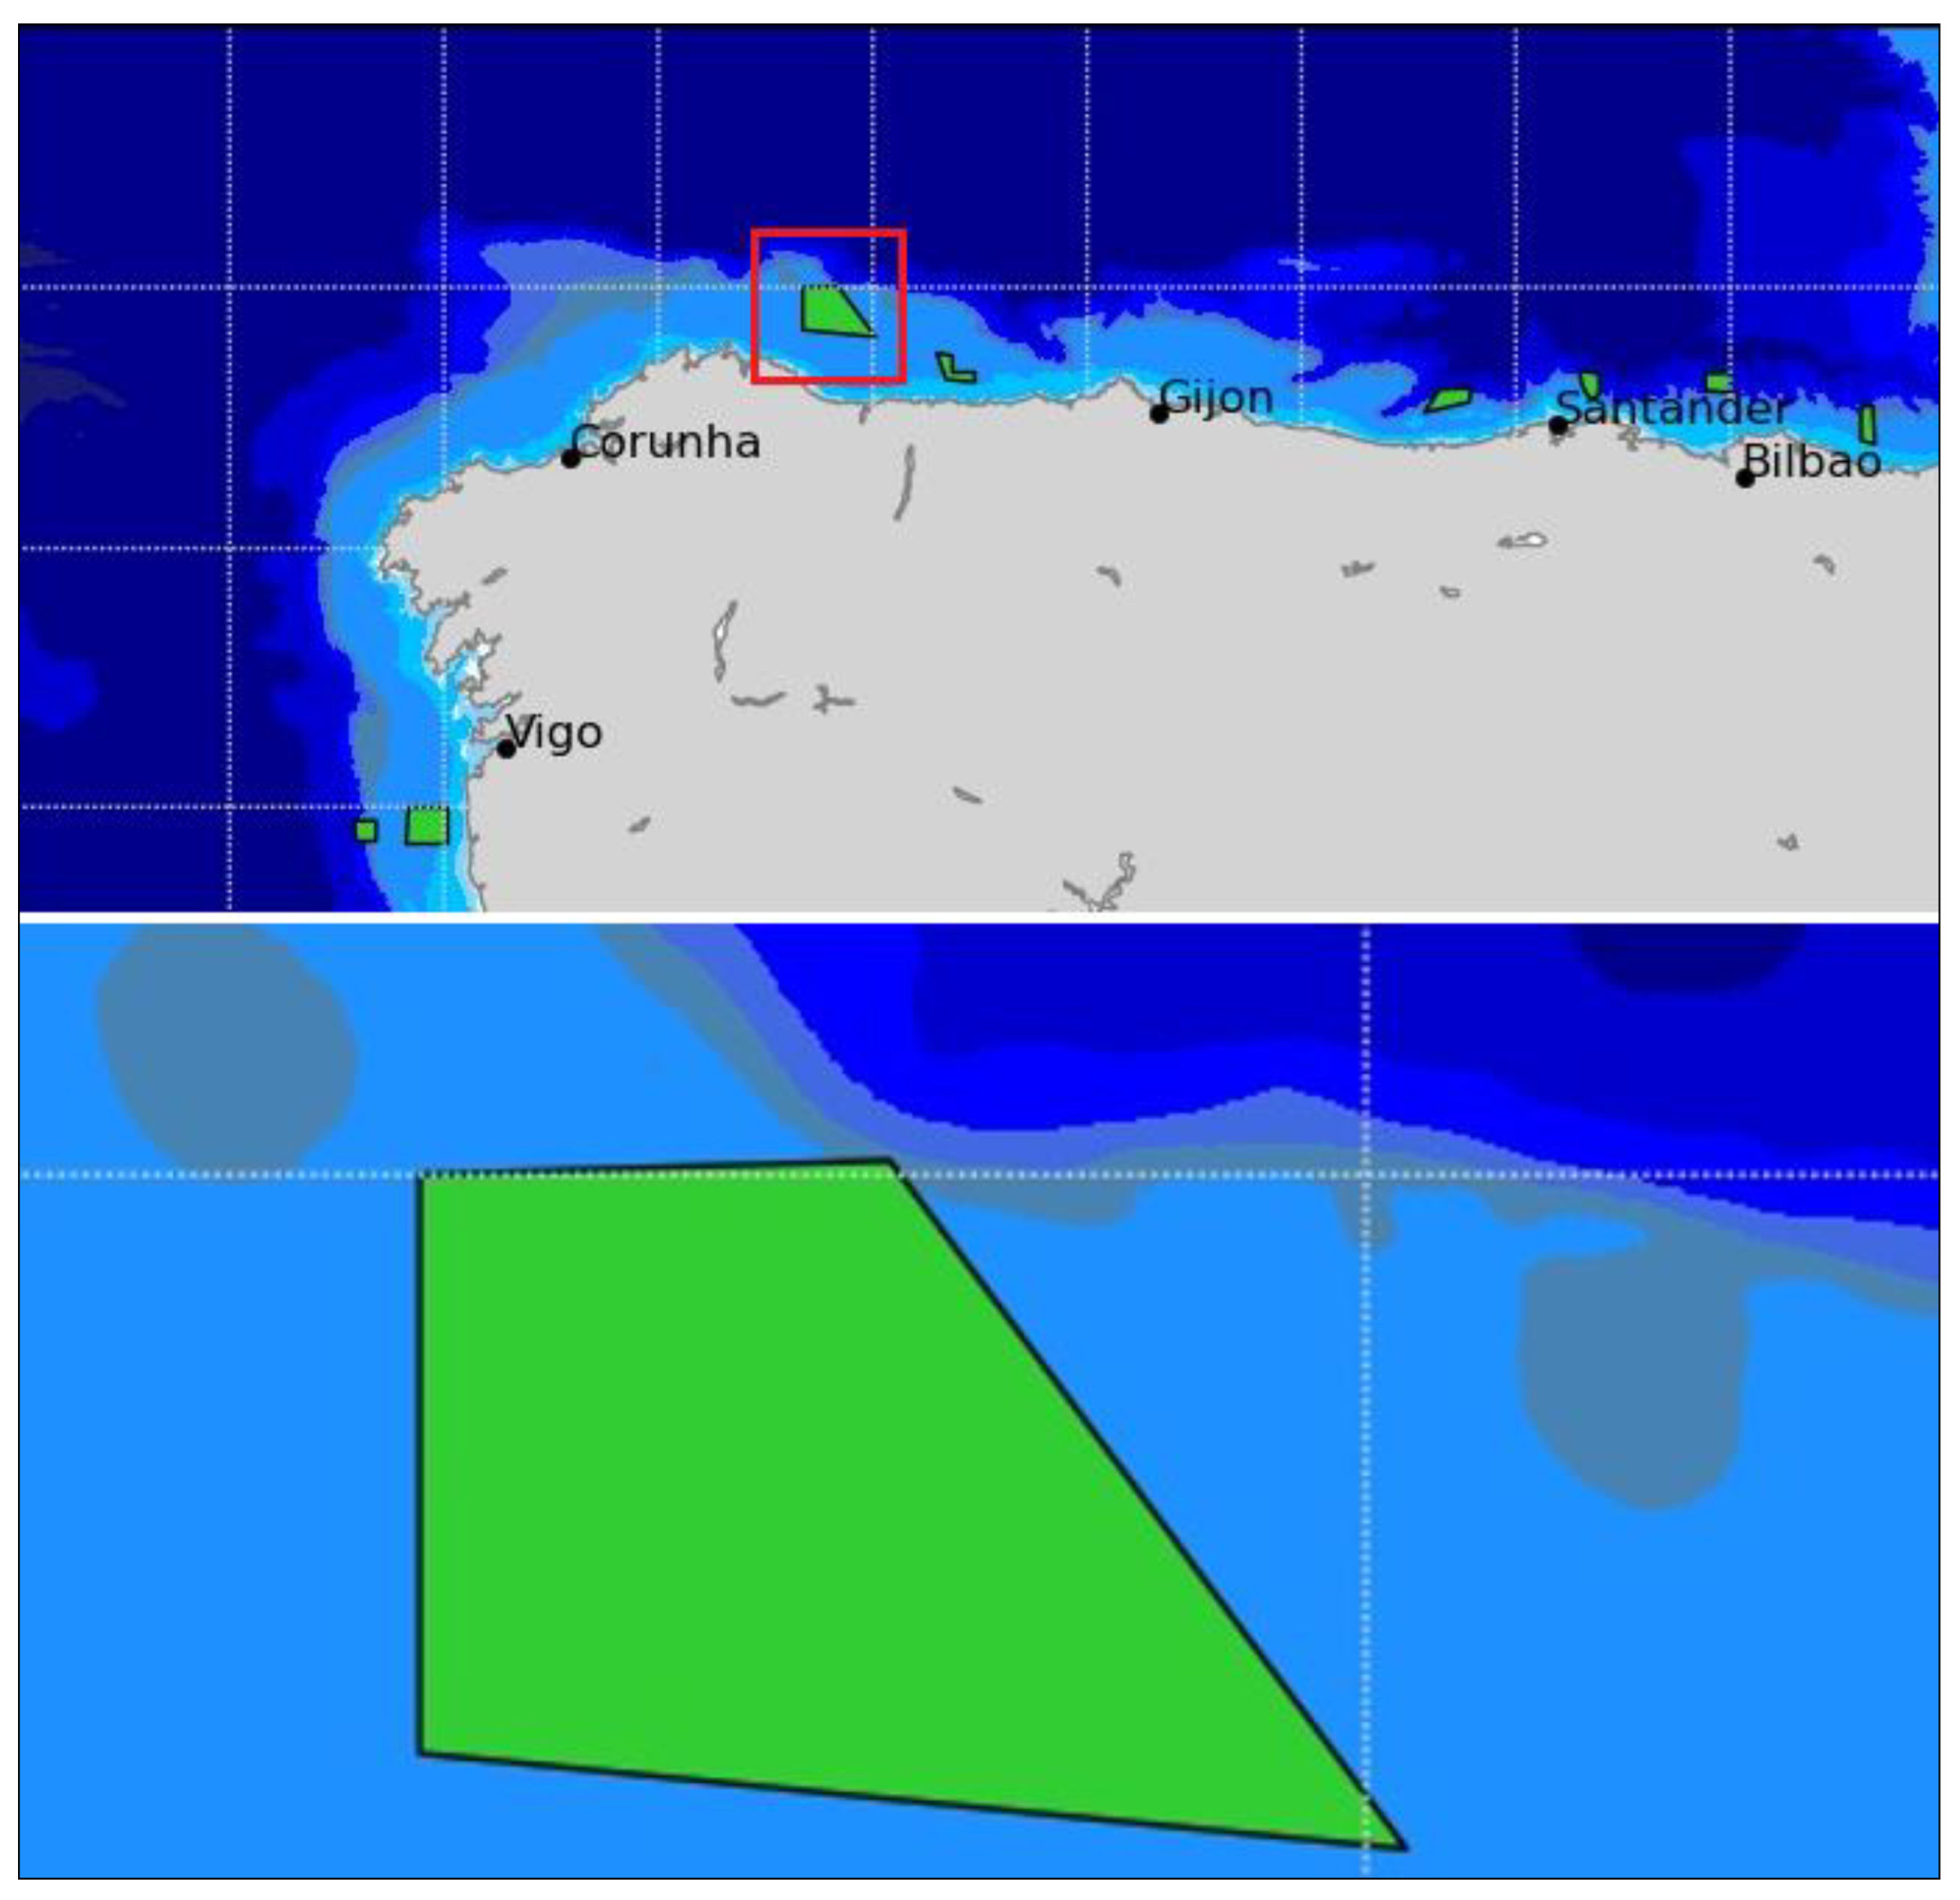
Ribadeo site is located on the Galician Coast (see
Figure 3) in the Northwest of Spain (latitude, longitude: 43.837, −7.326). The location is characterized by a wind velocity of 9.3 m/s and a wind potential of 4923 h/yr. F15 site is a location situated on the West of Ireland coast in the region of Clare (latitude, longitude: 52.7, −10.5). The area is characterized by excellent wind resources and good conditions for the positioning of floating wind turbines.
Table 2 shows other details that emphasize the potential of the areas proposed.
4.2. Floating Platform Selection
Floating support structures have emerged in recent years and are in a phase of rapid growth. The type of platform selected depends, among others, on water depth, ground conditions, turbine size, and wave loading. The fabrication and installation capabilities will also impact the foundation construction and design process.
Tension leg platforms (TLP) are floating foundations vertically moored to the seafloor by tendons. Given the structure dimensions, it is possible to manufacture and transport this to staging harbors using heavy-lift transport vessels. Compared with other foundation solutions, this concept will significantly increase the costs associated with this operation. Once mobilized at the staging port, suitable installation vessels transport the foundations to the wind farm site. TLP will be generally manufactured and stored in a location near the wind farm site, but transition pieces are generally manufactured and transported to store in the same place that the foundations. TLPs are installed by embedding the suction piles mooring systems into the ground using large hammers and, where necessary, drills. A steel transition piece typically is used to provide the interface between the WTG and the foundation. Transition pieces are connected to the foundation either through a grouped or bolted connection.
TLP foundations for offshore WTGs are usually manufactured and delivered directly to the wind farm site using offshore tugs. Still, the requirement for many units at low-cost places significant focus on standardization and process optimization for manufacturing and installation. The use of concrete helps to reduce costs.
5. Installation and Logistics
Floating offshore wind energy installations show significant differences, ranging from the installation process to different cost structures within the life cycle of a wind turbine. The connection of offshore wind farms to the energy grid, weather conditions, installation processes, and operation and maintenance of offshore wind turbines influence the energy cost. The accessibility to offshore locations represents a considerable difference in the cost structure during the installation process [
70,
71,
72,
73].
According to estimates, the total logistics costs for a floating offshore wind farm are about 5–10% of the total investment costs, 10% less than the regular price for a fixed offshore wind farm. To understand the installation process and the connected logistic effort, it is necessary to know the main components of a floating wind turbine that also have to be dealt with as transport units.
The upper section composed by a hub, usually three rotor blades and a nacelle is supported by a tower (modular structure) that is fixed on the floating structure (see
Table 3). References [
74,
75,
76] describe the three types of foundation structures developed in the Arcwind project, CENTEC-TLP, Sath and Telwind. In this case, the TLP concept was selected.
There needs to be a standardized setup of a logistics network to install a floating offshore wind farm. The specific offshore wind farm projects define the number of wind energy turbines and the location. Another decisive factor for the logistics network is the vessel concept for the installation [
77].
The complexity of floating wind farm installation depends on the collaboration of the entire logistics network. The involved network partners, the installation method at sea, port characteristics, and the type and number of available construction spaces are key parameters.
In this scenario, the installation process starts with the component manufacturers that produce the main components of the offshore wind energy turbine. The production of the main components is divided into foundation structures (in this case, TLPs), the two upper tower segments, the set of rotor blades, the nacelle, the hub, the lower tower segment (transition piece), and the mooring system. The following partner in the network is the logistics service provider that arranges the transports between the component manufacturers and the port of shipment. The port operator is responsible for storing and handling the components at the port of shipment. Finally, the components are taken over by the construction company that operates the installation process and tugs. These vessels transport and install the floating wind energy turbines and related equipment.
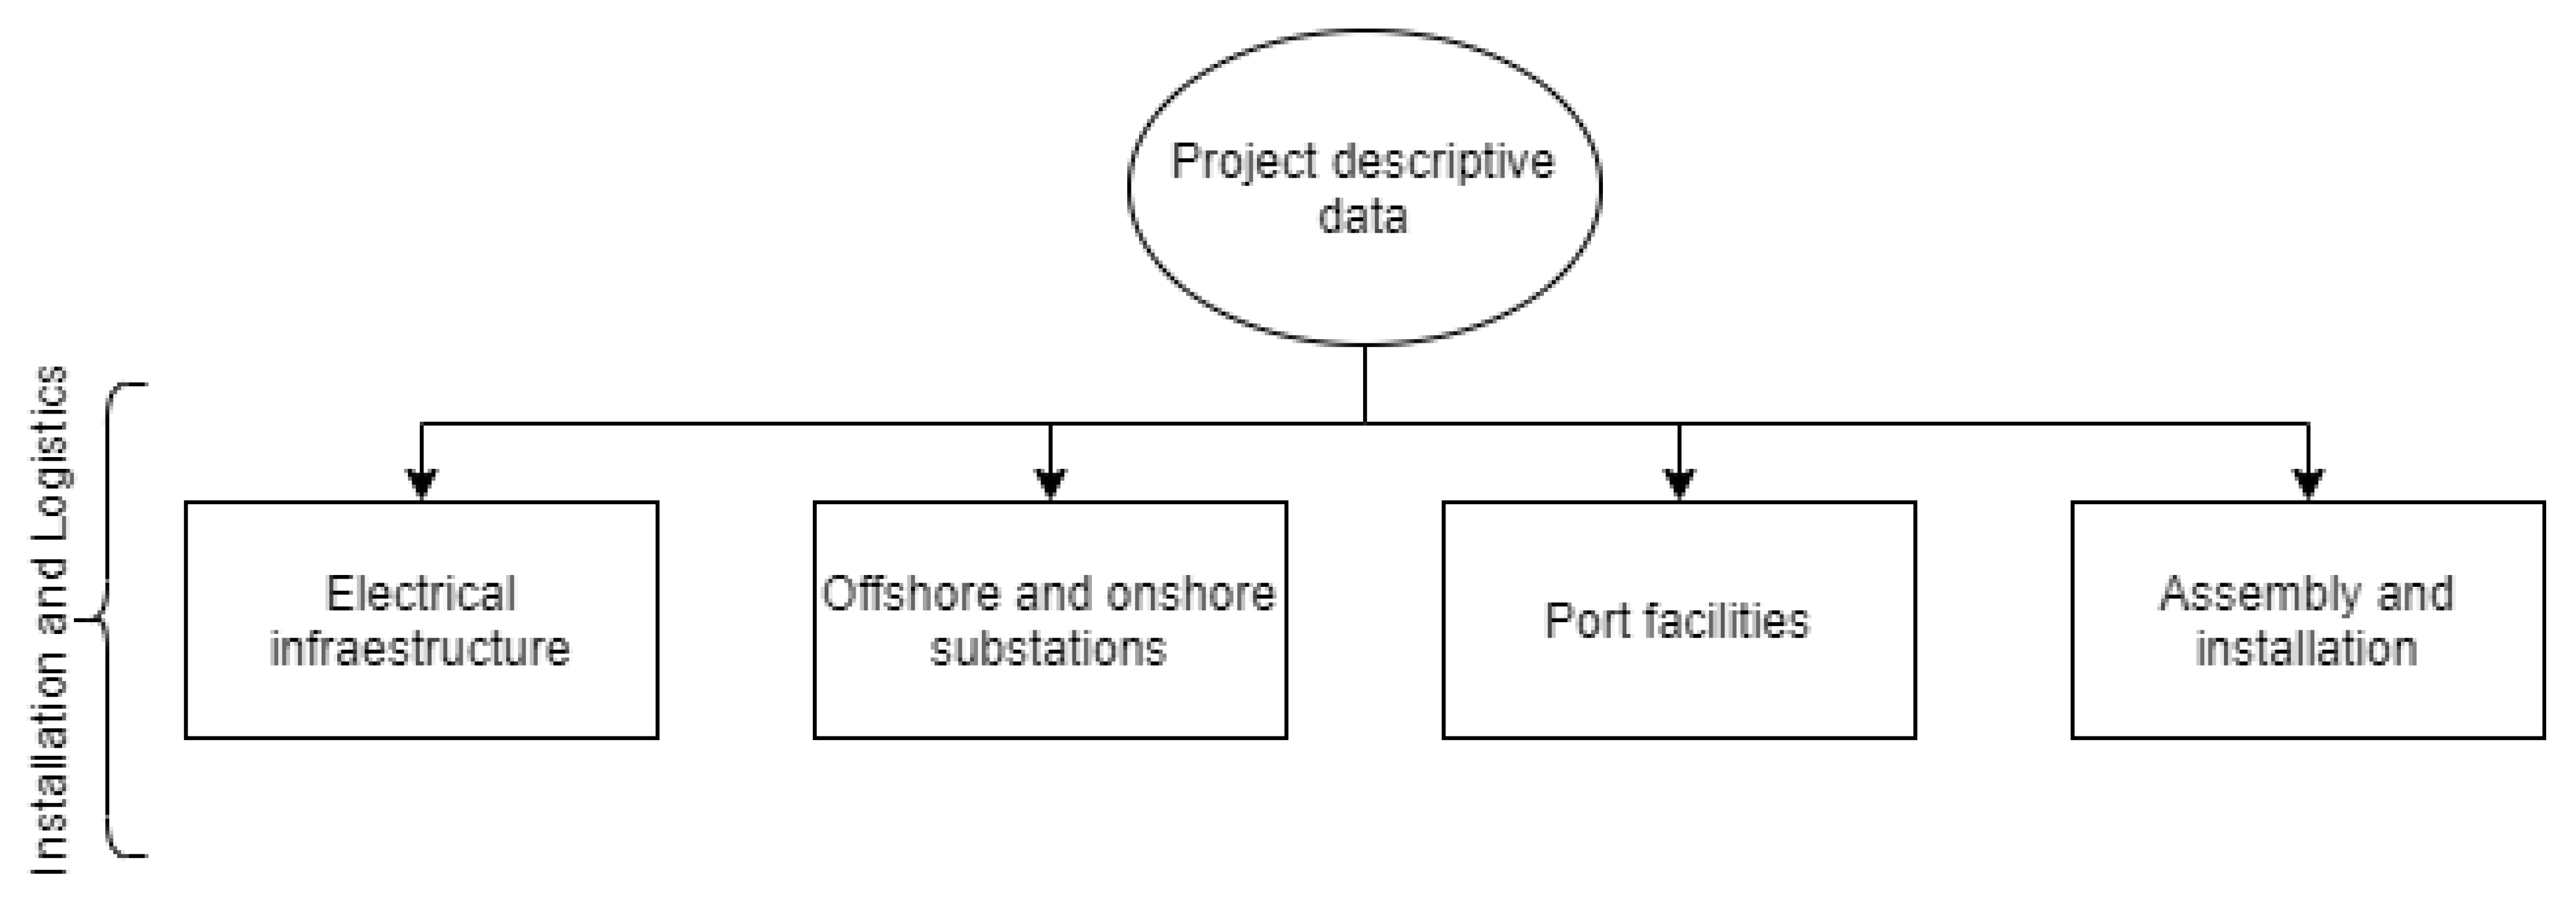
This methodology highlights critical challenges related to supply chain management for floating wind projects, focusing on the installation and transportation infrastructure, equipment, and logistics. This study concerning the previous step of wind farm design covers the following topics:
- -
Electrical infrastructure
- -
Offshore and onshore substations
- -
Port facilities
- -
Assembly and installation
The key components of the supply chain can be broken down into four major components for floating wind farms, namely wind turbines, support structures, cables (including array cables and export cables), and offshore/onshore substations. These components represent the major physical offshore components that comprise the floating wind farm. There are undoubtedly other minor components as well as onshore infrastructure, all of which should not be overlooked. For each of these key components, the supply chain also includes the equipment and infrastructure associated with the transport, storage, and installation of the components and the related service providers. Contractually, the supply transportation, storage, and installation of these components may be provided individually by firms or combined work packages (e.g., supply, transportation, and installation cables). Typically, a single project director will oversee the entire project and the various contractors delivering the work packages. A critical aspect of the project director’s role is supply chain management. To facilitate the discussion of some of the requirements and challenges associated with the installation and transportation of major offshore wind components, it is helpful to provide an overview of these components and the defining characteristics critical to the transportation and installation aspects of supply chain management.
The primary components for Wind turbine generators (WTGs) include hundreds of subcomponents and parts which must be assembled before transport to the project installation. Assembly and finishing of these major components are typically performed at specialist coastal facilities by the WTG original equipment manufacturer. For example, the nacelle must be assembled with the drive train, generator, and control systems. These assembly sites are crucial, both in terms of investment and the development of supply chain hubs in the nearby area. Given the number of parts and subcomponents, these sites represent significant opportunities for clustering the supply chain.
After the major components are assembled, the WGT can be transported and installed in several different ways. The objective of pre-assembly onshore is to minimize the number of lifts and amount of assembly required offshore. The total pre-assembly, however, results in heavier, more complex transport that is subject to more restrictive weather limitations.
The floating foundation type and the associated mooring system represent fundamental aspects of the floating farm design. In this model, three full-scale floating wind turbines are considered for tool application (Semisub, Spar and TLP), but the TLP concept is selected to be the option for intermediate depth waters of Ribadeo and Ireland locations as case studies. There are currently several widely different concepts under development. Therefore, a generic approach to floating wind farm designs is difficult. However, in this study specific aspects of these three types of platforms are considered for the farm design to some degree.
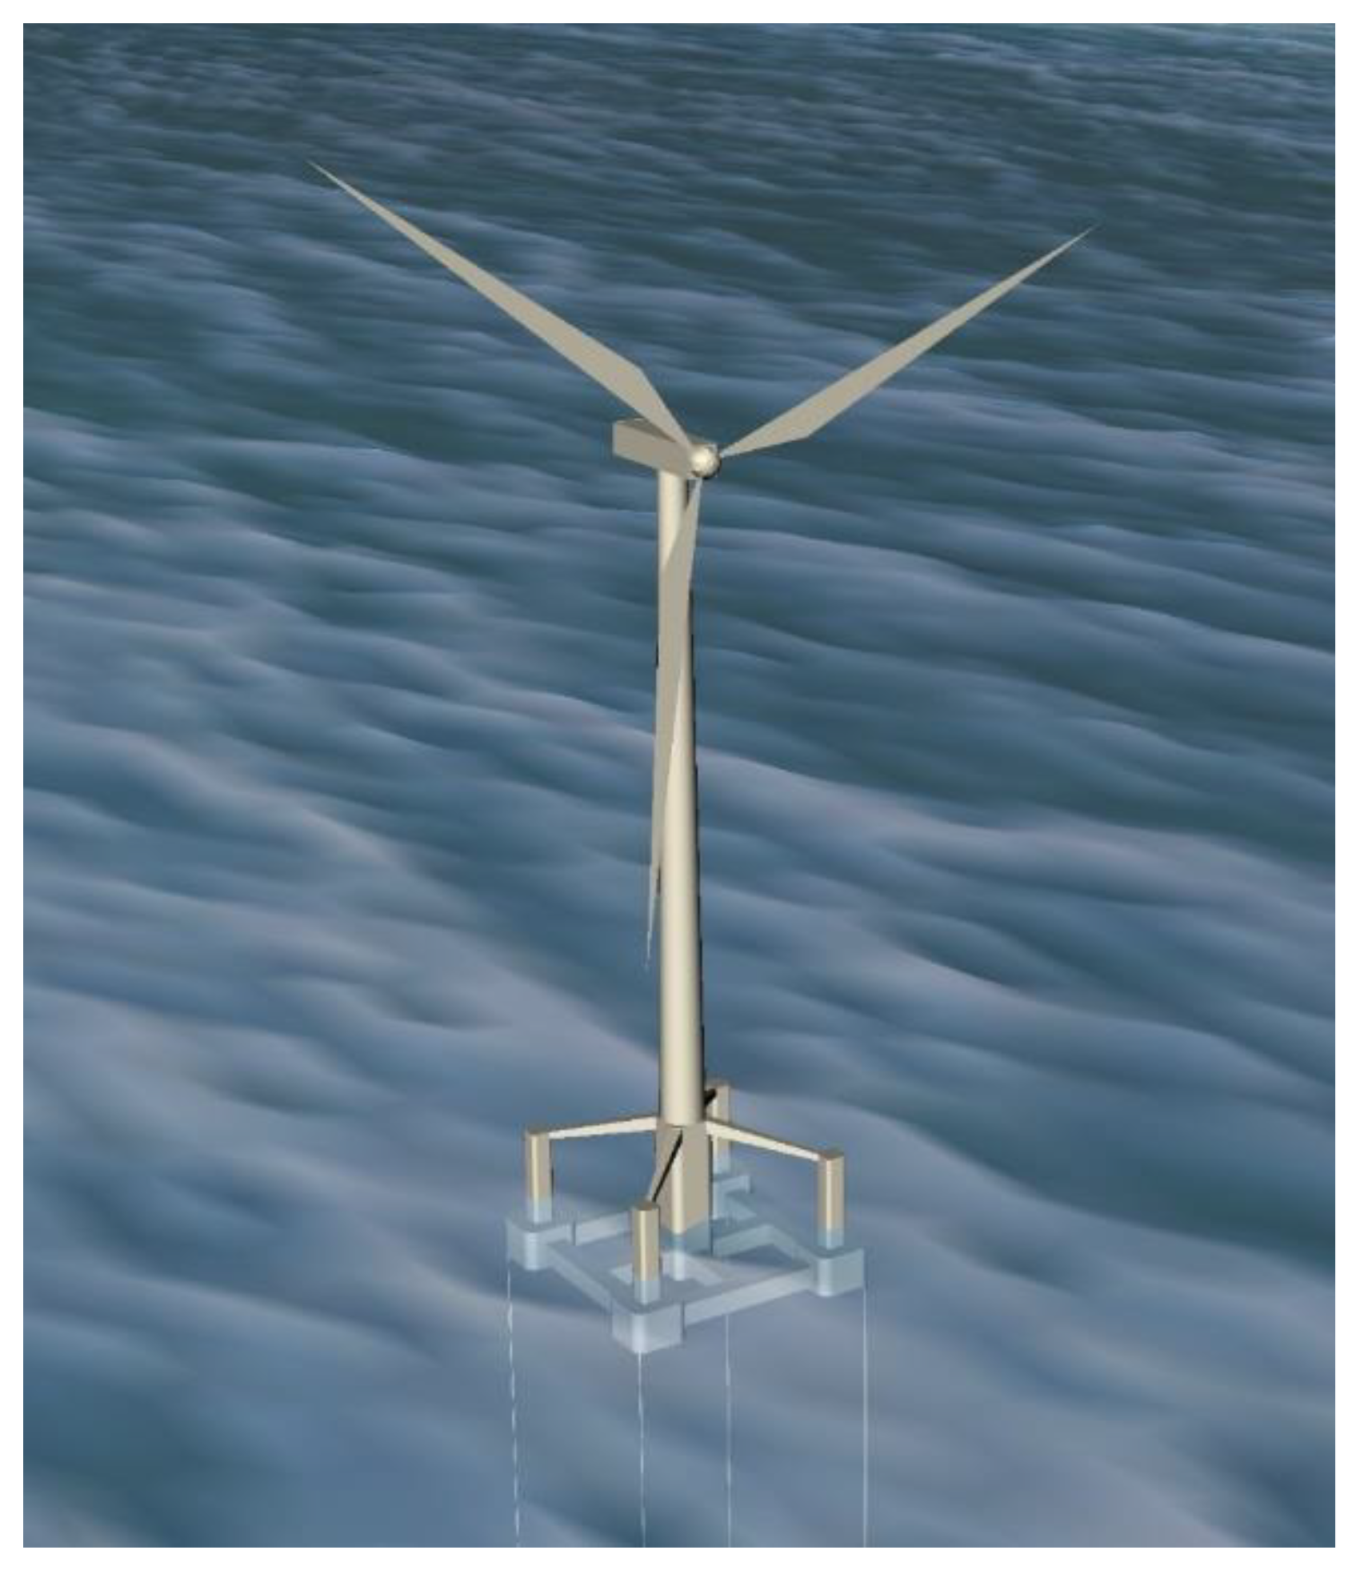
A free-float capable TLP (FTLP) has been extensively studied by Uzunoglu and Guedes Soares [
74] as a floating wind platform (see
Figure 4). This technology presents advantages such as relying on ordinary tugs instead of specialized vessels for transport. This approach is convenient because wind farms are planned for a high number of units. The dynamically stable design capable of free-floating on a shallow draft performs well as a common TLP [
78]. The structure can be towed without being concerned with depth limits [
79].
5.1. Electrical Infrastructure
Electrical cables are typically made up of three copper cores set into an XLPE (cross-linked polyethene) base, surrounded by steel wire armoring. Fiberoptic cables provide a communication channel for the wind farm. For array cables, 33 kV has been used to date, although there is significant R&D qualification work and future projects using large capacity WTGs that will utilize 66 kV lines. Export cables typically operate at 132 kV, but increasingly, 320 kV is being used.
Cables are typically manufactured at coastal manufacturing facilities where cables are loaded onto a vessel. For export cables, load out generally is in a single length of possibly tens of kilometers. This is due to the challenge of installing field joints and the desire to fabricate and load the export cable in a single length. Load-out of export cables can take several days, and due to the size and weight of these cables, special equipment (extremely large carousels) is required for transport and storage. Dedicated cable laying vessels are generally used to transport the export cables to the project site and install the export cables, typically using a subsea cabling plough to bury the cable in the seabed.
Array cables are generally lighter and shorter than export cables and thus typically do not have the same logistics constraints. Array cables can be transported in shorter lengths and are more flexible and therefore less onerous to handle than export cables. Array cables are often pre-cut to the necessary lengths, transported on individual drums, and stored at a staging port. The installation approach for array cables is similar to export cables in that a cabling plough is typically used to bury the cables, however cables, but the range of vessel options is generally larger. Array cables are often installed by offshore service vessels.
Table 4 shows the main electrical system characteristics determined through the proposed tool for the floating wind farms under study.
5.2. Offshore and Onshore Substation
The offshore substation steps the voltage from the array cable operating voltage to the export system voltage. This plant includes transformers, reactors, switchgear, control, fire protection, and low-voltage auxiliary systems. All this equipment is contained in a sizeable fabricated topside structure which usually includes two or more stories and is installed upon a support structure (usually a jacket). Depending on the size of the project, there may be more than one offshore substation.
Several different concepts have been developed for offshore substations. The most commonly used concept is a lifted substructure and topside transported to the site (typically on a barge) and installed with a heavy lift crane vessel. Other concepts include:
Self-installing substructures and topsides.
Subsea base frames with floating jack-up topsides.
Topside float-over designs.
The design, transportation, and installation of offshore substations for offshore wind projects have many similarities to offshore oil and gas installations. It draws heavily from the infrastructure and equipment used in that industry. The main components of substations are presented in
Table 5.
5.3. Port Facilities
Port facilities can be divided into manufacturing and mobilization ports. A manufacturing port is typically located in the vicinity of OWF manufacturing facilities and is used to deploy the manufacturers’ support structure and WTG components before deploying offshore. Mobilization ports are used when temporary parking of equipment before deployment offshore is necessary, particularly in developing areas without an existing nearby manufacturing port. In the case of floating concepts, the port of manufacturing and mobilization could be the same since the concrete platforms do not need a special place as in the case of steel where the shipyards represent a key place. If there is a manufacturing port nearby, it generally has its staging area, which makes a separate mobilization port unnecessary. However, equipment is necessary, thus requiring a marshalling or staging port. Ports also need adequate water depth to allow the floating platforms and tug vessels to move the equipment and a waterway width typically over 200 m to transport the rotor-hub installed blades.
Port facilities play an essential role in the development of reliable supply chain management systems (see
Table 6). Preferably they have enough area for future expansion and are in the vicinity of existing major port facilities for joint sharing of the facilities should there be a need. Hence, it is necessary to have dedicated FOWF port facilities. Another important aspect is the location of the port facility of the project locations. FOWF supply chain manufacturers will be located in ports they deem best located for their needs in terms of proximity to their target markets.
Port facilities are expected to have a significant amount of land to store the WTG and support structure components waiting to be assembled out at the quayside. Considering the ever-growing size of WTG components and the preference for ports to be utilized to supply multiple FOWF projects simultaneously, one can easily understand the amount of land required in these operations. WTG foundation components are generally produced by service providers other than the main WTG supplier; nevertheless, they operate from the same port facilities, where the manufacturing facility is located. In many cases, when the foundation is manufactured in steel the TLPs and Transition pieces are transported from two separate manufacturer ports to the marshalling port facility or another manufacturing port with load-out capacity, where these components are assembled at the later stage of the project.
Another important factor determining the location of supply port facilities, apart from the apparent logistics reasons, is the availability of the in-port transportation and load-out personnel experienced in delicate load-out operations to sea-going installation vessels.
Installation Vessels and Equipment
The selection of vessels and equipment for floating offshore wind farm construction is a critical process. It must balance the potentially competing objectives of lowering costs, minimizing durations, and ensuring safe operations with minimal environmental impact. FOWFs are composed of large, prefabricated, specialized components pre-assembled in the coastal facilities. Over time, these components have increased in size as more giant turbines have been utilized to bring the Levelized Cost of Energy (LCOE) down to levels competitive with other energy sources in the coming decades. Due to the size and distinct shapes of these components and the serial nature of the installations, the offshore wind industry was quick to develop and chart floating concepts once the applications moved from experimental development to the commercial deployment phase. There are many similarities between offshore wind and oil and gas marine installation operations, especially concerning Health, Safety, and Environment (HSE) practices and installation methods for structural components. However, purpose-built floating foundations are designed to address the unique challenges associated with the installation of OWF components “easily”.
Towing capacity and marine maneuvers to minimize repeated operations using carrying the optimum amount of equipment during each deployment will be a bottleneck. Optimized transporting plans are essential to ensure that the number of deployments corresponds with the port logistics towards completing the installation phase with as few deployments as possible. The coordination of port logistics with the manufacturing and delivery of other components, in order not to keep any group in the supply chain idle for an extended amount of time, is important to ensure the best optimization and efficiency of the supply chain system and to minimize storage requirements. Depending on the proximity of the wind farm to shore, additional offshore tugs may be necessary for the optimized supply chain management.
In the current market, the installation vessels are either wholly owned by the OWF development Engineering Procurement Construction and Installation companies or international marine construction service companies. Heavy lift Vessels (HLV), which dominate the substation installations, are generally owned by maritime construction service companies that have historically serviced the offshore oil and gas industry’s construction needs. Substation installation, given its sizes, design, and generally singular units, is more similar to oil and gas installation than other components of FOWF installations.
Dredging and onshore marine construction companies are other contributors to the current fleet. As the offshore oil and gas industry, installation vessels in the OWF industry also operate under a day rate system. A more predictable summer timeframe and a fixed rate in the less predictable winter operations fluctuate up and down based on market conditions. This statement is particularly true for the oil and gas industry, as observed in the years. However, the day rates for the FOWF installation vessels have a direct correlation with the available ships on the market, which again is affected by the announced installation targets of individual governments and their actions to support these targets.
The increased number of floating wind projects announced in Europe alone will push up the existing installation vessel market, even before including the projects announced outside Europe. Implementation of large-scale projects outside Europe, without the necessary infrastructure towards a sustainable and self-sufficient supply chain, will intensify international competition for the available vessels and result in upward pressure on prices similar to the current state of the fix offshore wind farms.
5.4. Assembly and Installation
One of the critical aspects of supply chain management is coordinating the supply of components with the installation process. When there is a mismatch in installation and supply rate, this can lead to either significant construction delays or increased storage requirements that can significantly impact the cost. For most critical offshore wind farm components, particularly foundations and turbines, manufacturing each unit is considerably longer than the time to install each unit. This generally requires a sufficient supply of components to be stored at the manufacturing port or marshalling port (if applicable) to ensure that the installation process is not delayed due to waiting on parts. The installation process is subject to seasonal variation in the rate at which units can be installed, generally with higher rates during the summer than the winter.
On the other hand, the manufacturing process is generally not subject to such seasonal variation (or at least not to the same degree). This difference is essential when assessing the delivery approach and the port requirements for a project, particularly storage. Having a sufficient cushion of components in storage is critical to managing delay risks in construction. Any installation delays will have knock-on effects that can lead to greater than day-for-day delays in completion. Therefore, time control is crucial for the proper functioning of the project and the correct installation (see
Table 7) [
80,
81].
One of the key aspects of managing the supply and installation is selecting a delivery method appropriate for a given project. There are several methods for delivering wind farm components from the operational areas to the offshore wind farm site. These include the following:
Loading at a manufacturing port and transporting to and off-loading at a staging port for storage. Loading of components onto a transport vessel (or barge) at the manufacturers’ facility and off-loading into a floating barge in a sheltered harbor near the offshore site, to be stored, awaiting assembled process.
Towing of the components with an offshore tug vessel at the manufacturers’ premises, and positioning at the offshore site.
It loads the mooring components directly onto the installation vessel (also offshore tug) at the manufacturers’ premises and installation at the offshore site.
The selected approach for any project must consider the distances between manufacturing locations and the project site availability of various types of vessels, and the capabilities of the relevant port facilities, including potential manufacturing facilities and marshalling ports.
6. Discussion
The floating offshore wind logistics and installation has never been technically evaluated due to the lack of knowledge and technology barriers. This work tackles a new option to determine the logistic aspects related to a floating farm design. The tool is applied in two locations on the European Atlantic coast which contribute to understanding the new alternatives to assimilate and contribute to the diversification of the European energy matrix.
In this section, the floating wind project ‘‘Ribadeo and F15”, located on the European Atlantic coast, was evaluated from a logistical point of view. The offshore knowledge is implemented in an in-house tool that allows for determining the critical aspects of a floating farm installation.
The project comprises a total of 113 wind turbines of the type DTU-10MW [
82]. The areas are located 18 and 41 km from the shore in Ribadeo and F15 locations, respectively. The water depth at the installation site is up to 150 m in both cases.
The TLP concept requires a port capacity of 1864 m2 per turbine and has a total cost considering the staging of 20.4 MEUR and 6.1 MEUR for each project. The port should have cranes up to capacities of 600 t and 1000 t.
In the conceptualization of this tool, several vessels are considered. Because of the floating technology, the conventional tug and offshore tug are considered for the installation phase. As mentioned previously, only a boat that can tug a floating turbine is not considered the specific pre-assembly. The vessels will be leased.
The tool considered a complete pre-assembly strategy of the floating platform, as defined in the previous section, was deemed to be possible.
Table 4 shows the given distribution of processing time in some of the assembly aspects.
The results showed that the installation strategy would need, on average, 936 and 292 days for the Spanish and Irish floating farms, respectively. This process improves the currently used technique in a fixed offshore wind, with a time reduction improvement that could represent more than 30%.
The values of the floating wind energy projects evaluated in this study are estimated based on international market prices/regulations and installation assumptions based on the technology used. Some of this information is determined in previous modules of the Arcwind floating farm design (see
Figure 1).
7. Comparison and Sensitivity Analysis
Due to the relatively immature stage of development of the floating wind industry, there is a limited knowledge of how installation and logistics will be undertaken. Options include a new installation method and infrastructure required or using new methods; the length of time for different tasks; and the strategies (operational space, capabilities, etc.). It is also difficult to get accurate values and specific conditions, for example, different materials, port costs, vessel day rates, etc. This is partially because only three floating farms have been installed but also because this information is commercially sensitive. Some values are confidential, and others are highly dependent on the market.
Therefore, validation of the installation and logistics tool comparing results with figures in the current literature. In summary, it was found that the main economic and time values are in line with the documents cited in
Table 1. This indicates that the outputs from the present model are reasonable, although a bit higher end of the DNV GL [
42] estimates and in line with NREL [
27,
44,
53], even when the other studies focus more on other types of floating foundations.
However, it is essential to remember that in the literature, figures are for projects in different regions based on different approaches and models. The structure and scope of several models are unavailable, so it is impossible to identify where potential differences in the assumptions and functionality of the models could account for the variance in results. It is anticipated that as empirical data become available from the future floating projects of actual wind farms, the installation and logistics tool can be further validated and calibrated based on these data.
Given the difficulties validating values, sensitivity analysis (see
Appendix B) was also conducted to confirm that the impact of variations is as expected. The analysis was performed on the items presented in
Section 5. The model’s parameters varied, including the number of turbines, water depth, distance to the electrical grid, distance to the port and weather conditions (schedule variability). The expected increases and decreases were found, validating that the model works as intended.
Moreover, the not linear variation in some variables, under the increase or decrease in one of the main parameters, exemplified the robustness of the model and the strengths derived from the knowledge of industry experts and the data considered.
8. Challenges for the EU Market
The EU floating wind market is in its infancy, and the first projects will face several supply-chain challenges that will impact logistics [
83], including the following:
There is currently a lack of manufacturing capability for the key components in the vicinity of major development areas (i.e., the Atlantic coast). Manufacturers of key components, particularly WTGs, will likely not invest in domestic production facilities until there is a sufficient pipeline of advanced projects. Therefore, initial projects will likely rely heavily on manufacturing far from project sites.
The EU Atlantic ports generally do not currently have sufficient capacity to support large-scale floating offshore wind projects. With a few exceptions, existing ports usually are lacking in one or more critical areas such as load-bearing capacity, crane capacity, and storage capability.
EU installation contractors and service providers generally have limited experience building floating offshore wind projects, thus representing a significant knowledge and experience gap.
Given these factors, supply chain management will be critical for EU floating wind projects. These projects will need to develop creative solutions to balance storage needs effectively, delivery rates, and installation rates considering the constraints mentioned above and challenges. The use of concrete or steel could create significant variations in the performance of the logistics chain and its associated costs. The development of floating wind substations could be also a critical aspect for the support the floating wind farms in deeper waters. With a heavy reliance on imports and domestic manufacturing far from project sites, marshalling or staging ports will likely be necessary; however, many EU ports do not have sufficient quayside storage, thus requiring storage at another location, for example, at a WTG manufacturing facility or floating foundation shipyard. This may result in extra handling and associated cost.
The floating option may help manage storage space constraints and handle the unitization of project cargo, i.e., making many pieces of cargo (e.g., WTG components) into single-unit transportation. Such units can then be towed with tug vessels.
One of the key selling points for floating offshore wind is the economic development potential. Maximize this potential for early projects and facilitate knowledge transfer; opportunities for joint venture work should be fully explored. Such arrangements can bring expertise from the North Europe region but locate as much manufacturing work as possible locally within the vicinity of the project and take advantage of local resources, including manufacturing capabilities and other skills from the naval industry and civil construction industry.
9. Conclusions
The floating offshore wind industry is growing and is expected to contribute to the global energy supply mix in the coming decades. The construction of floating wind projects has many similarities to the construction of offshore fixed infrastructure. Still, the serial nature of the manufacturing and installation of offshore wind components and the intense cost reduction pressure drives a need for robust supply chain management that is unique to the floating wind. Effective supply chain management for offshore wind requires sufficient planning early in the project development process to identify appropriate ports and vessels and select supply, transportation, and installation approaches optimized for a given project. Supply chain management approaches have evolved with the industry, and large-scale commercial projects in the EU will significantly benefit from these developments. However, the first EU projects will face significant supply chain challenges and novel, and innovative approaches may be required to address some of these challenges. Leveraging European experience in the fixed offshore wind while maximizing local content will help reduce cost and manage risk while helping to build a domestic industry, ensuring that floating wind can fulfil its promise of clean, reliable, and secure electrical power.


