
Optimization of Blade Position on an Asymmetric Pre-Swirl Stator Used in Container Ships

Abstract
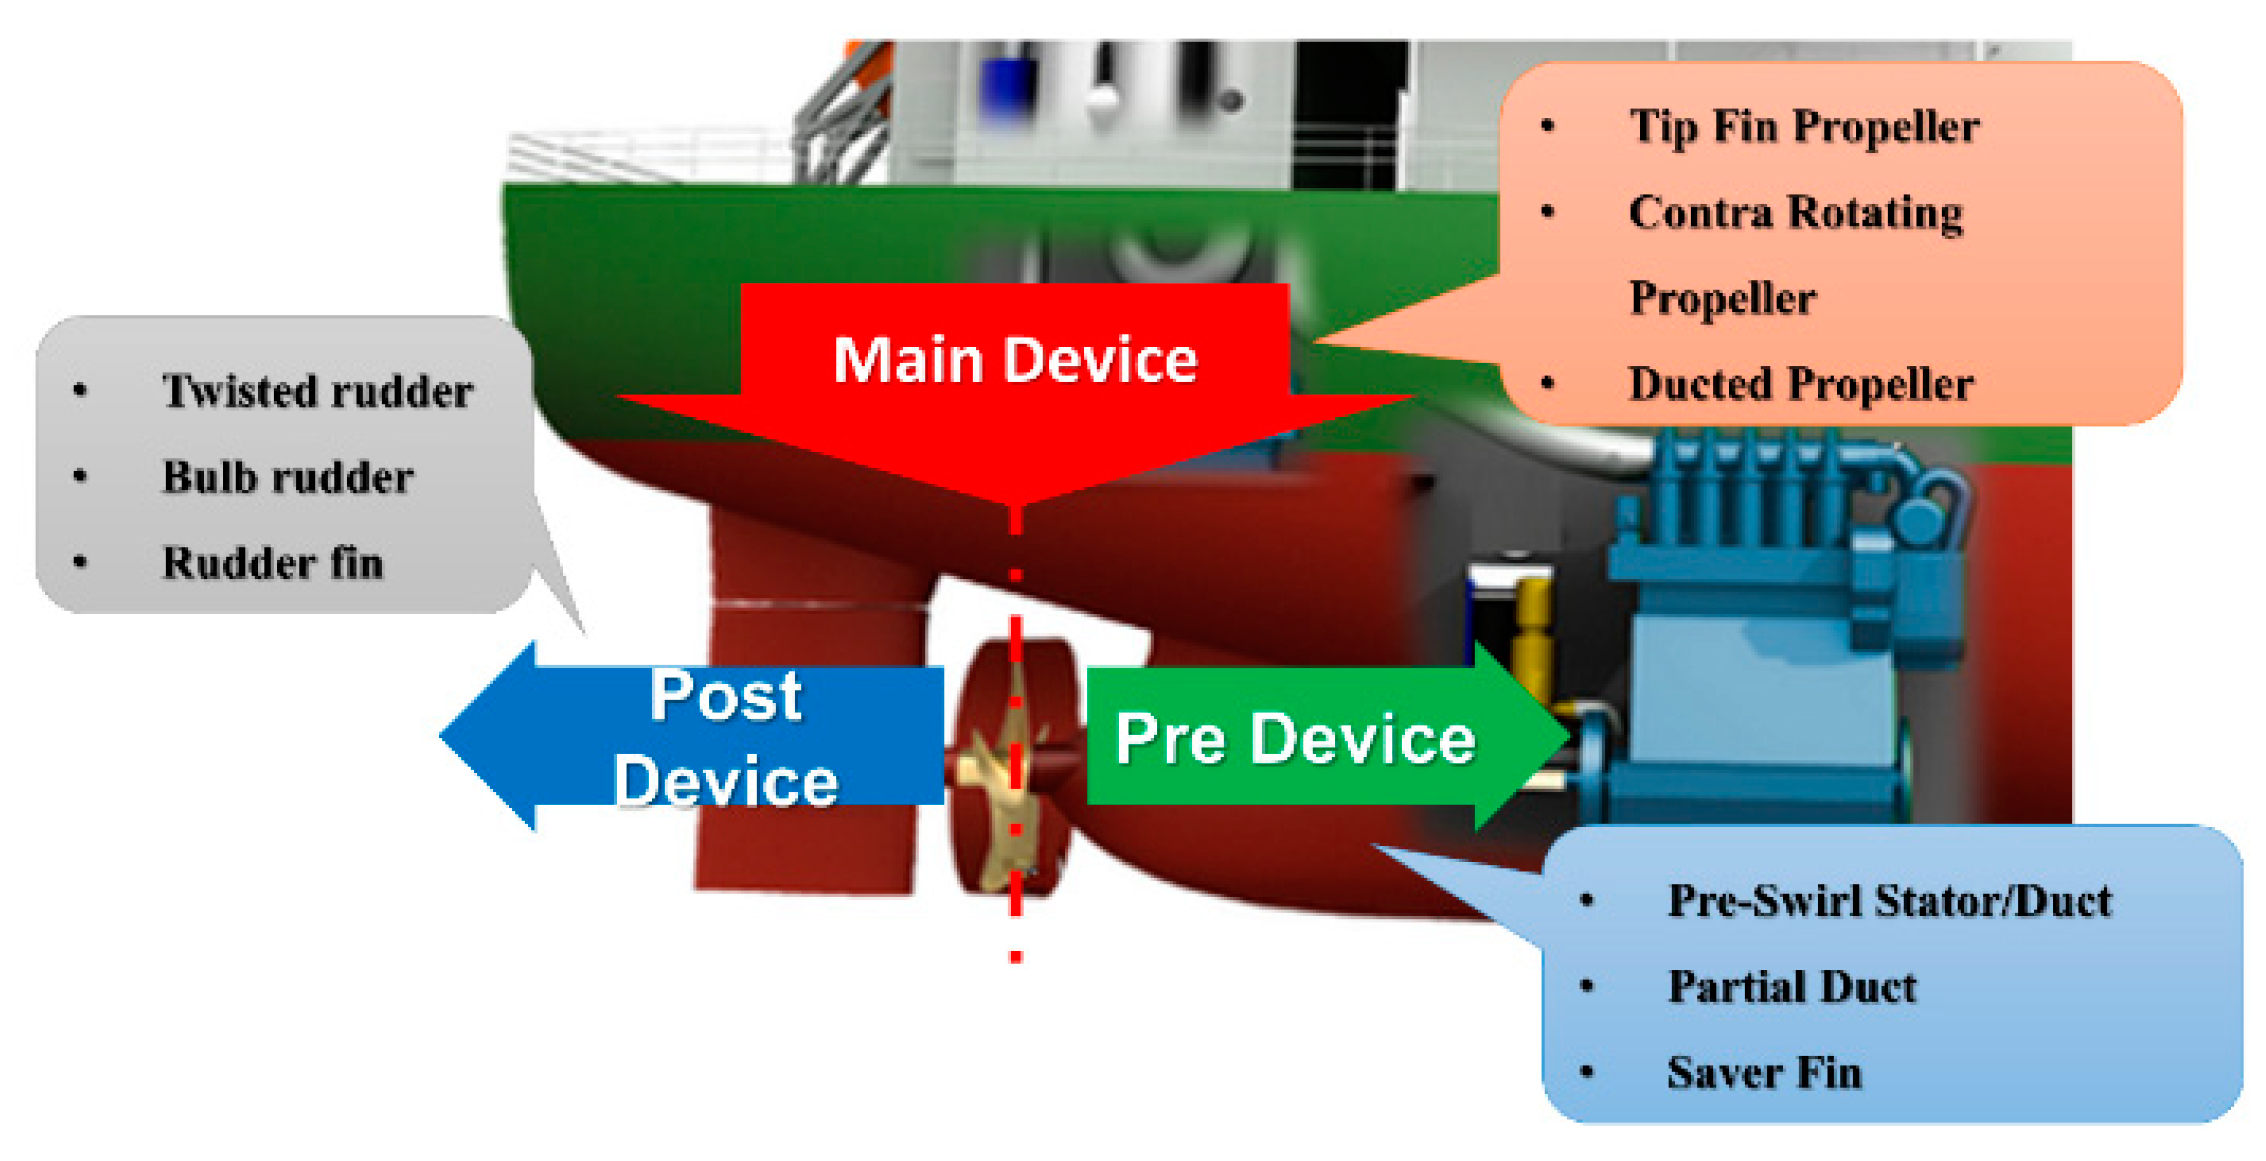
:1. Introduction
2. Materials and Methods
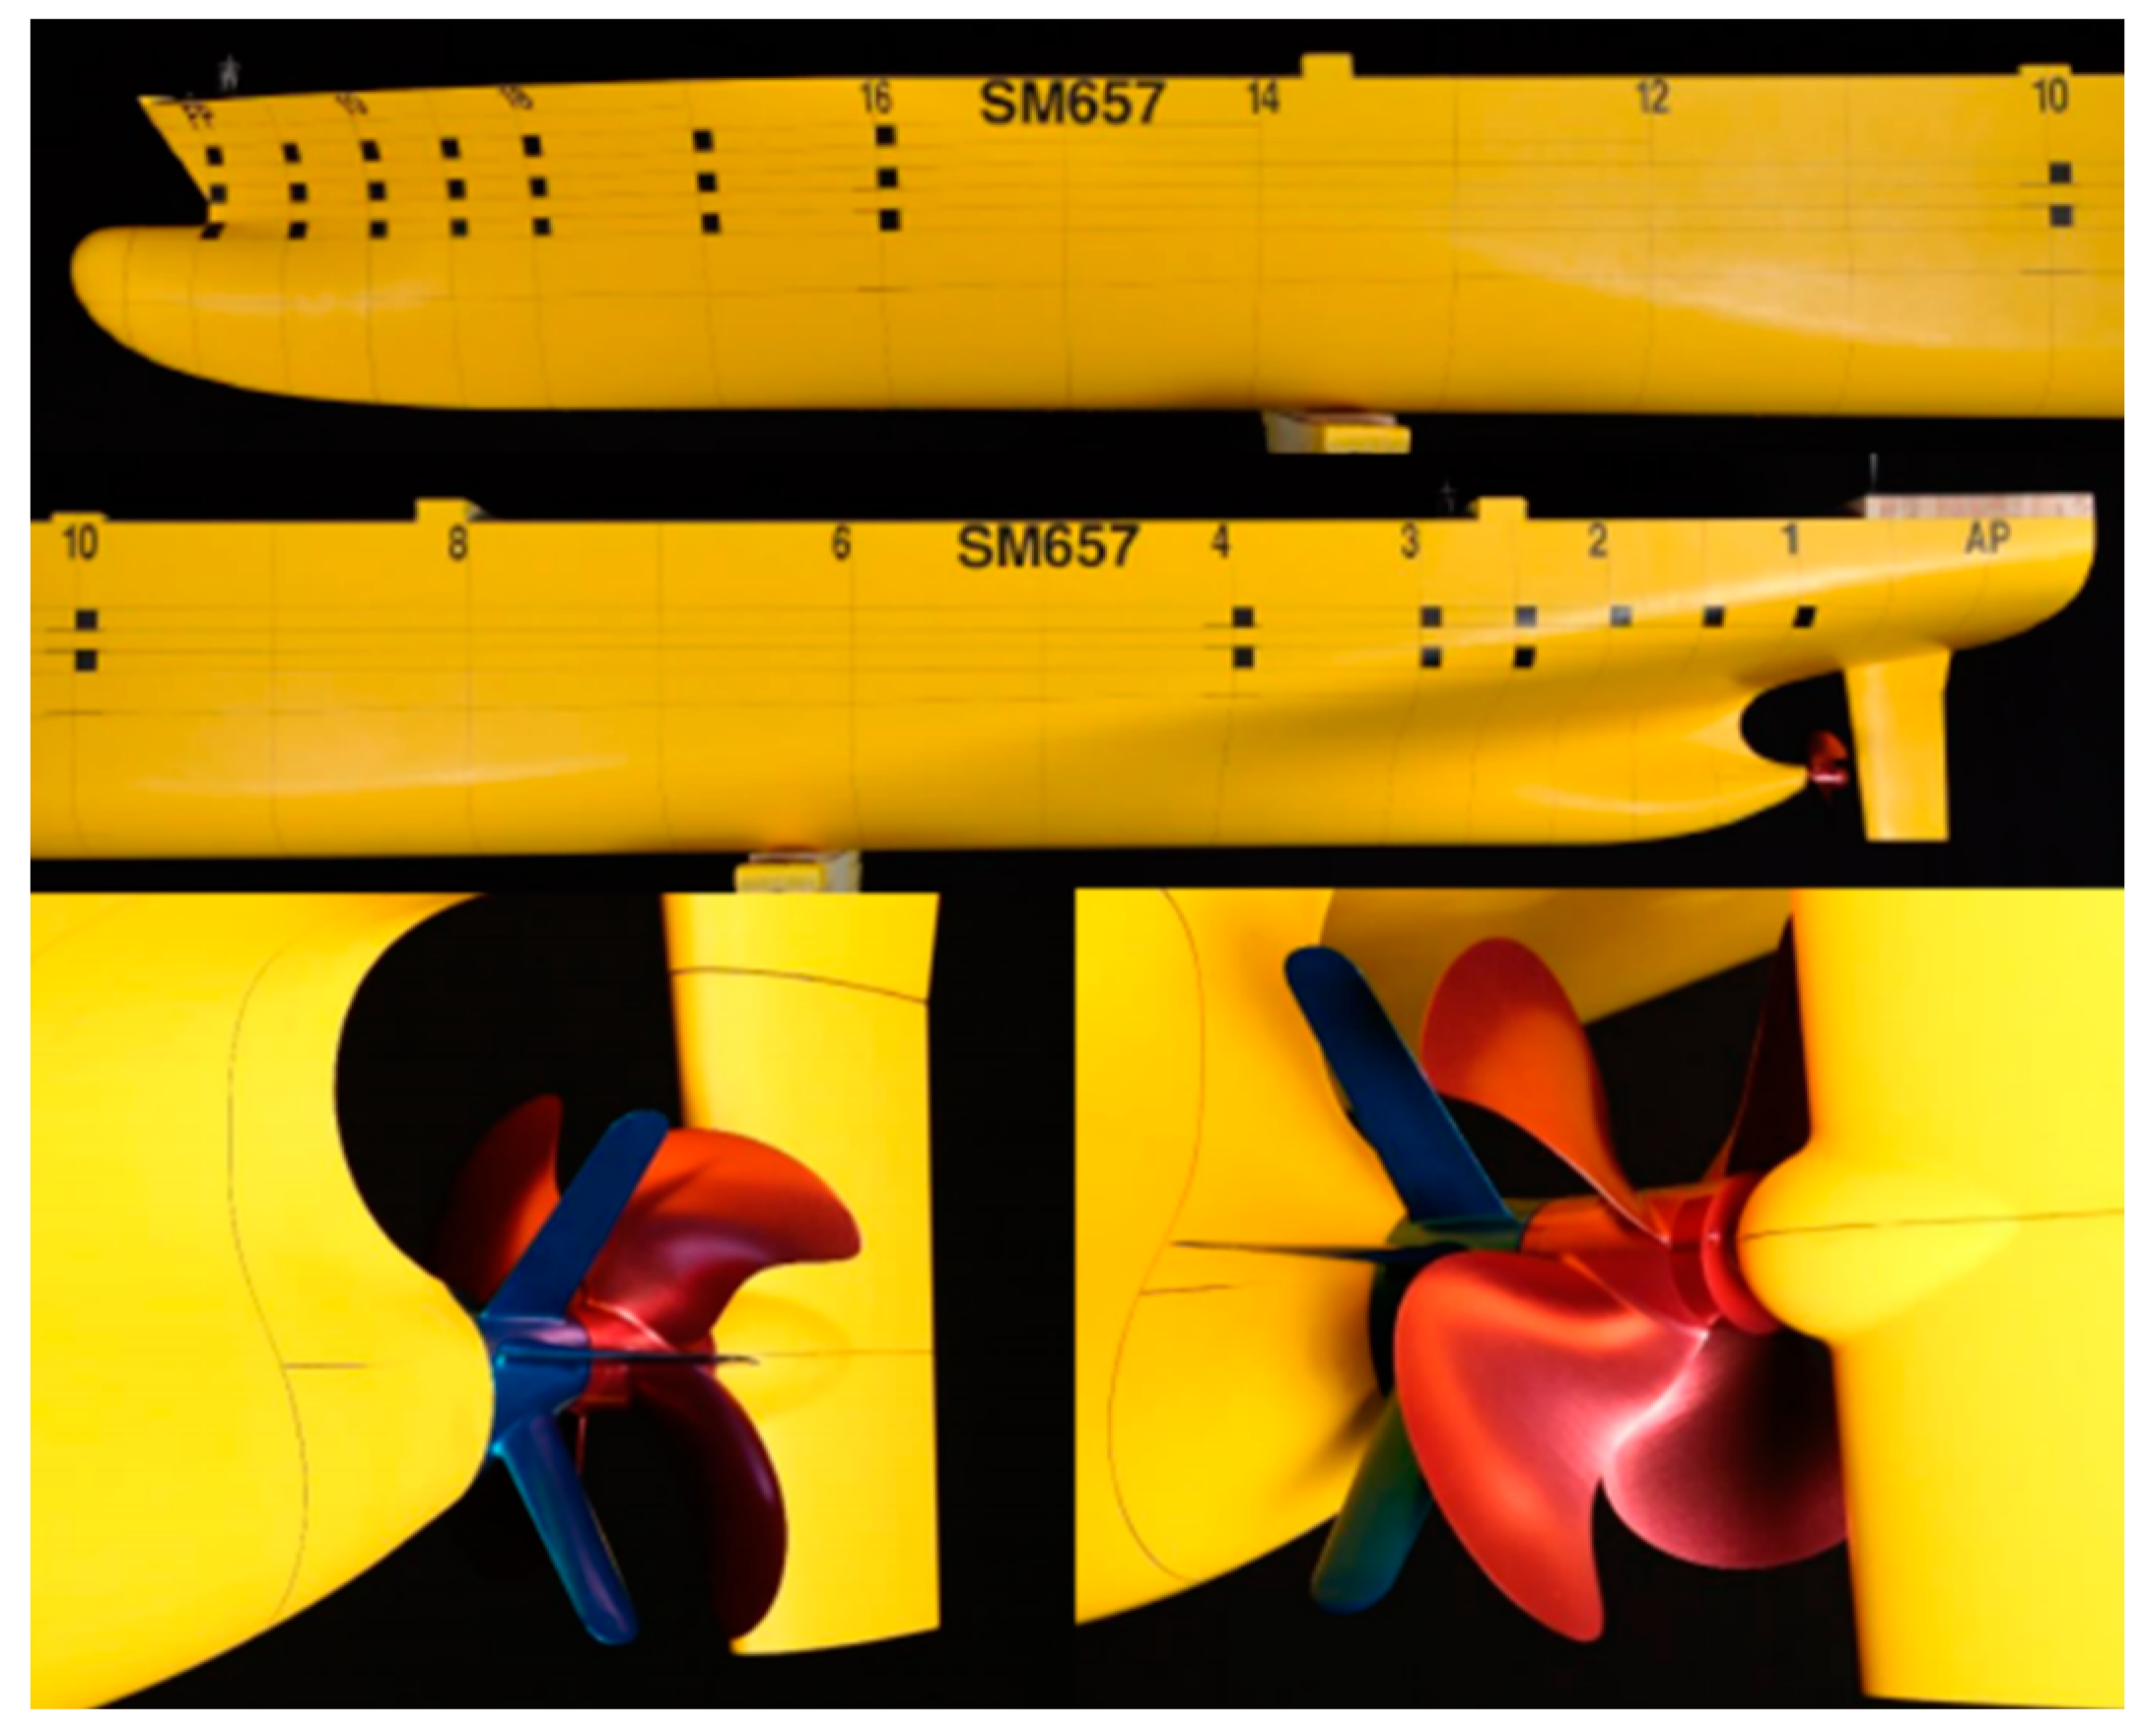
2.1. Target Ship and Propeller
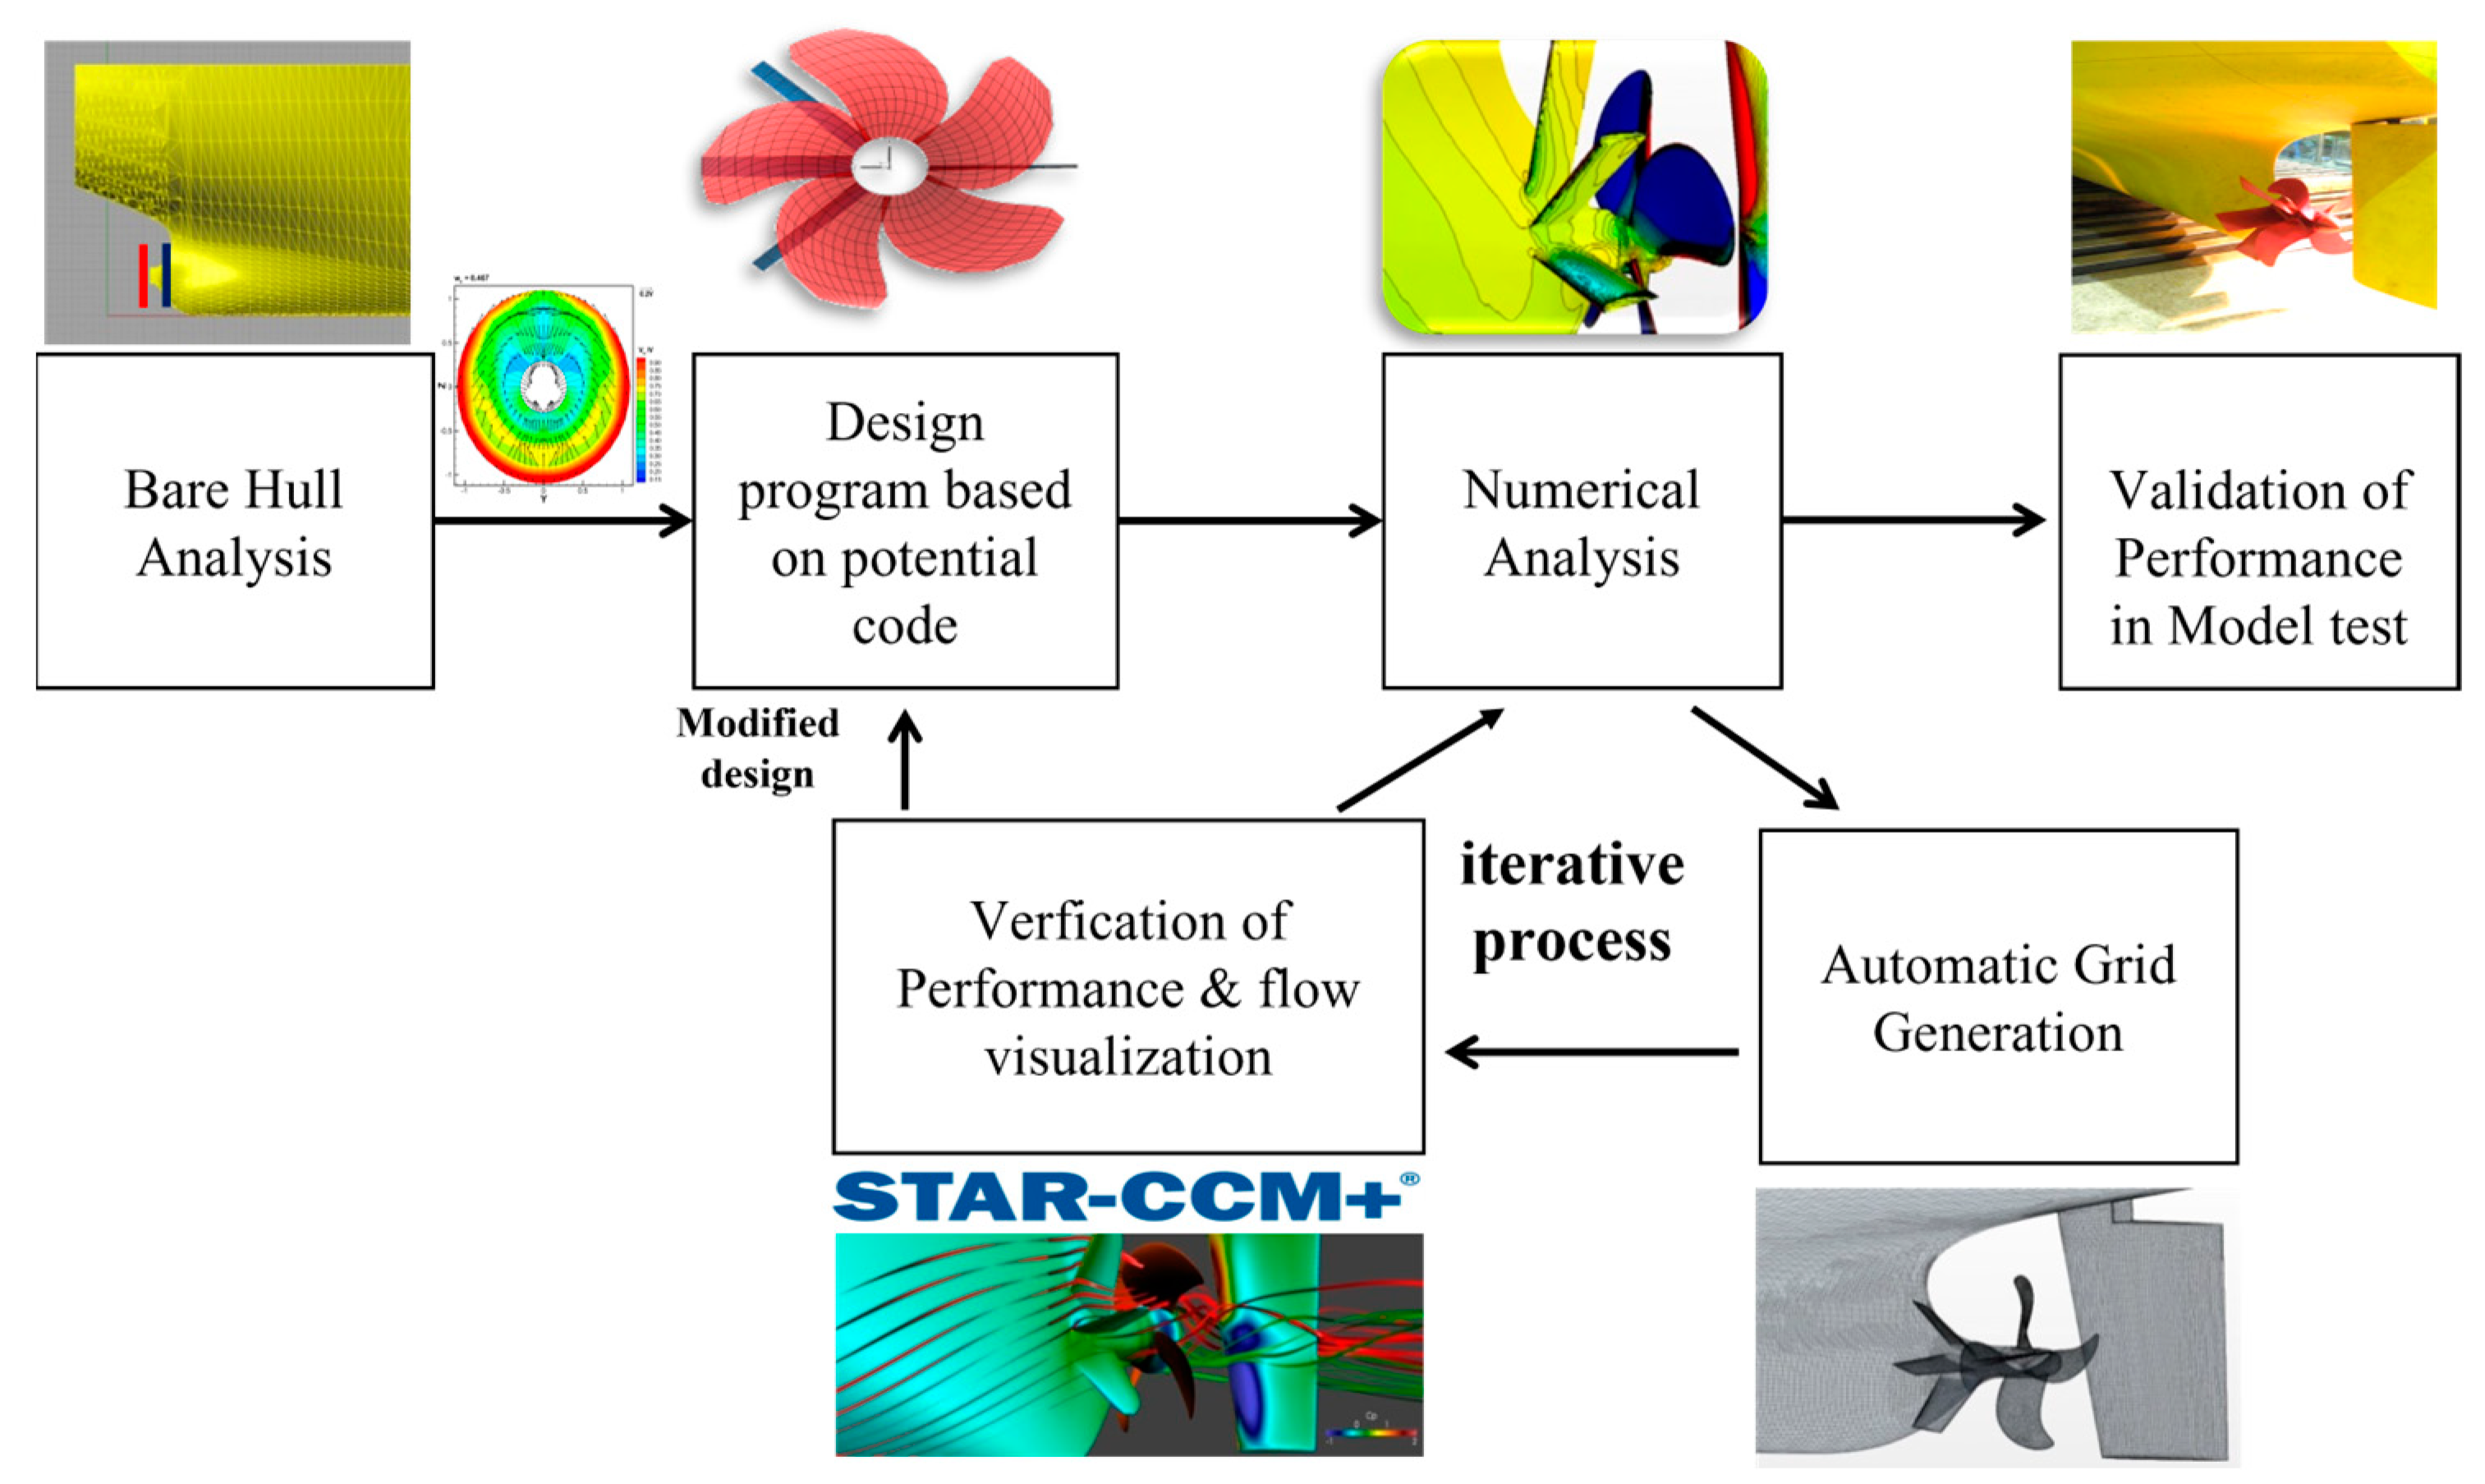
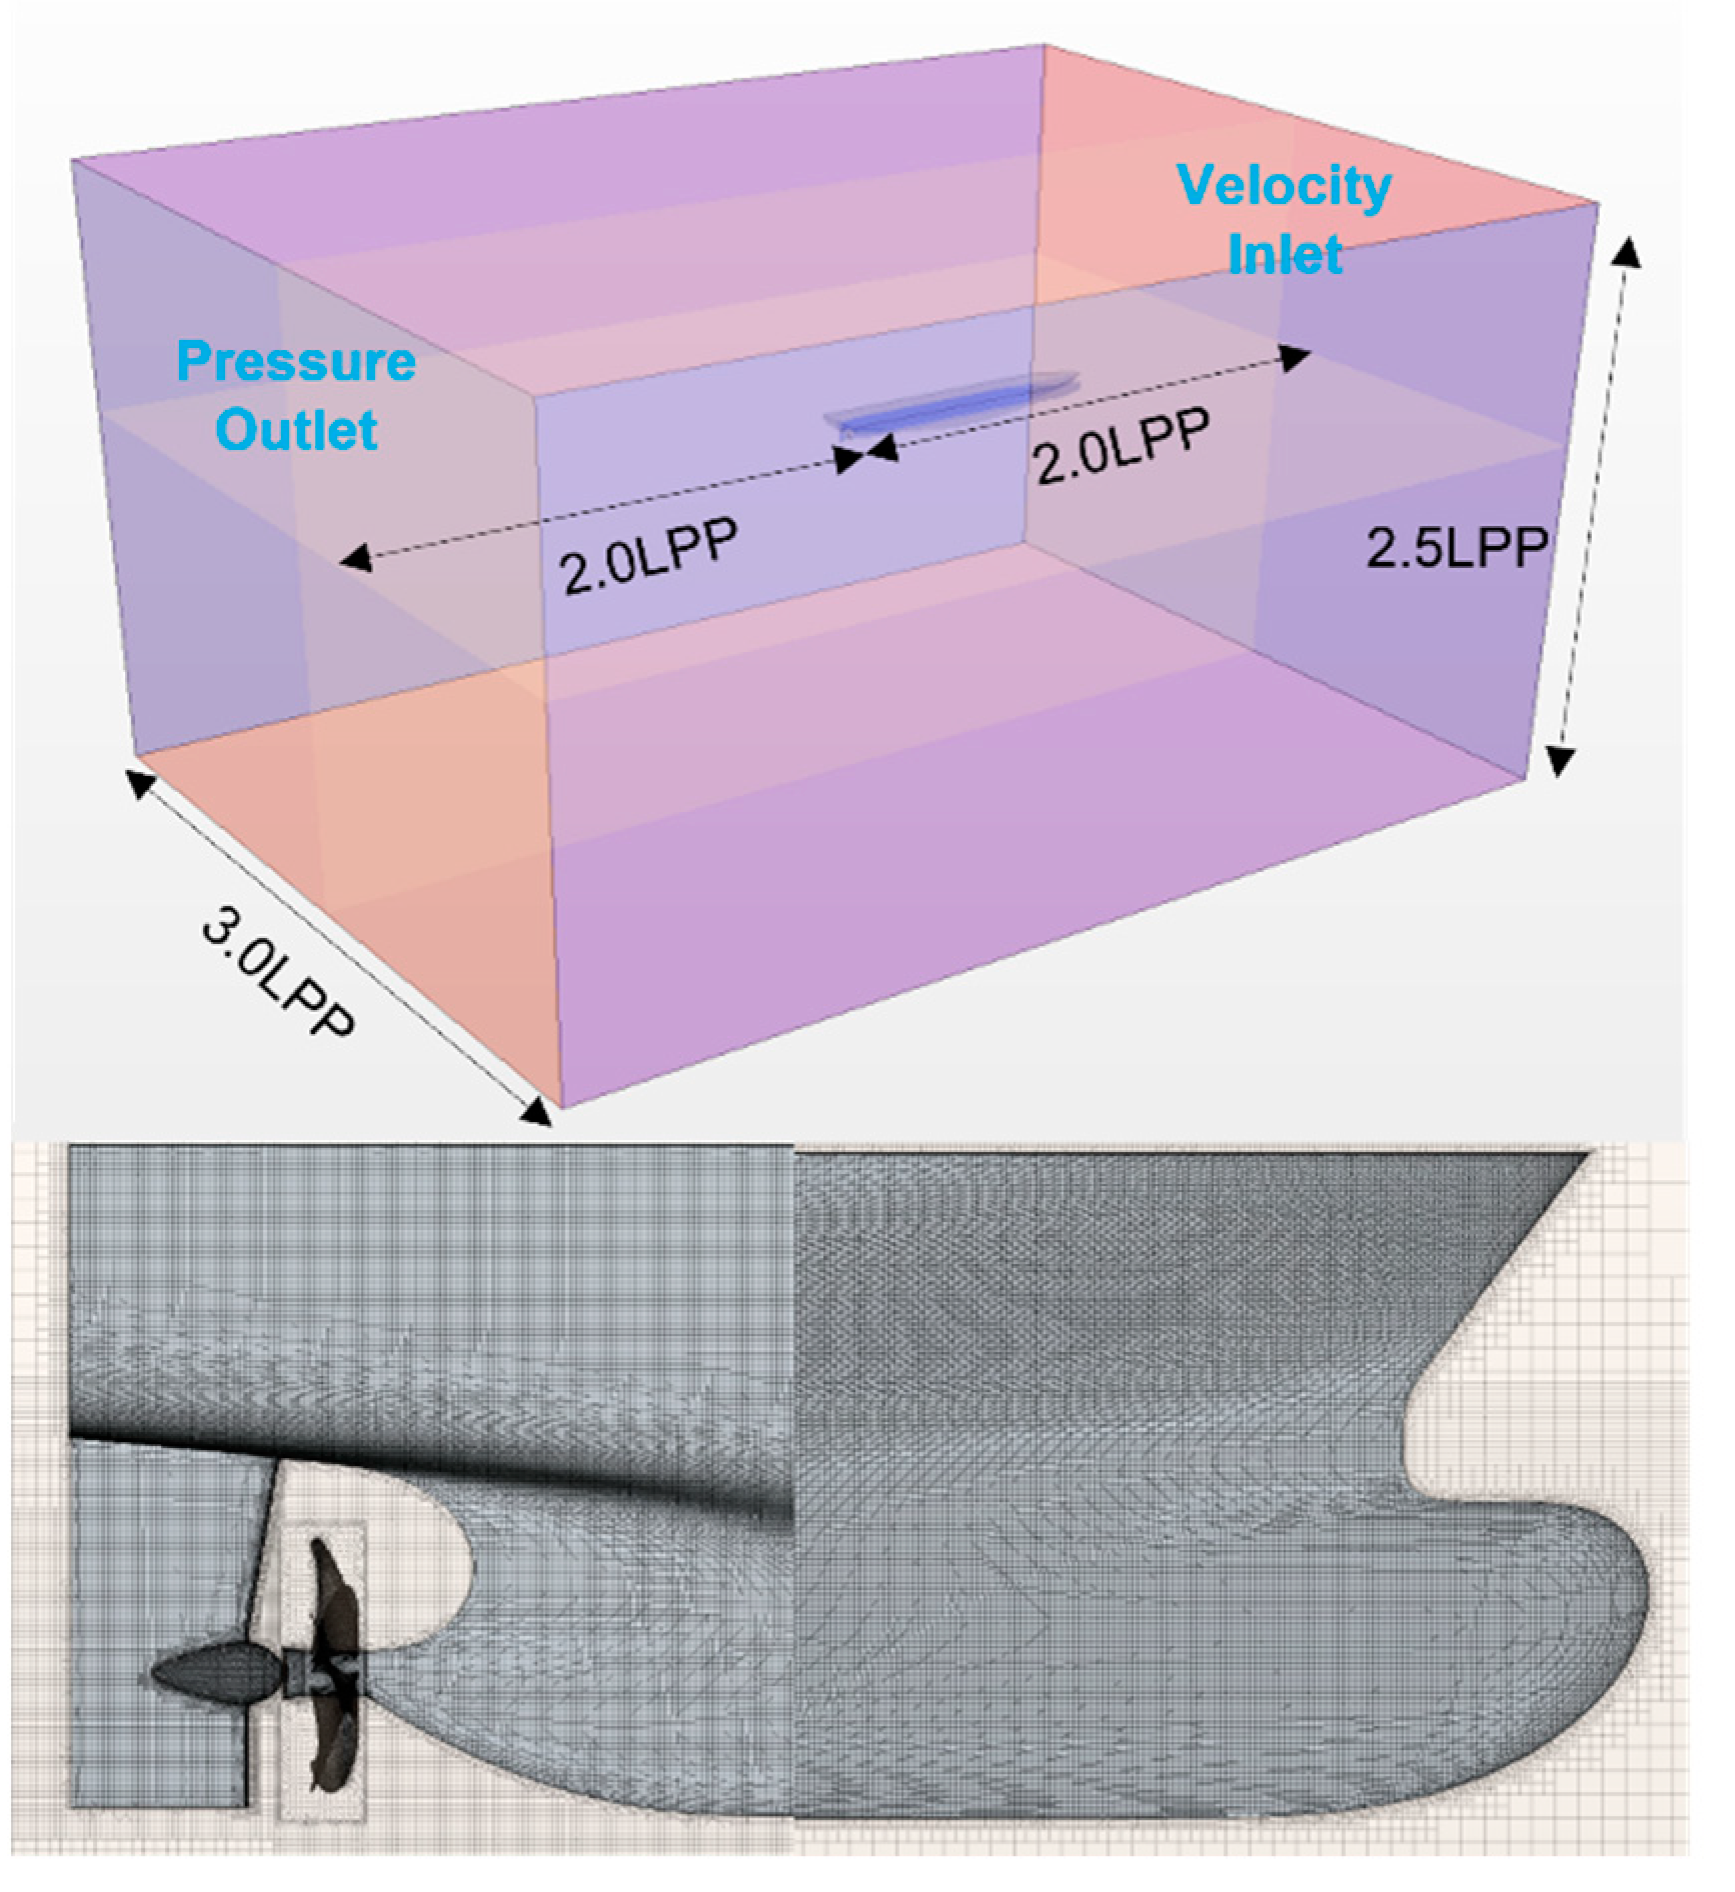
2.2. Numerical Analysis and Validation of the Proposed Design
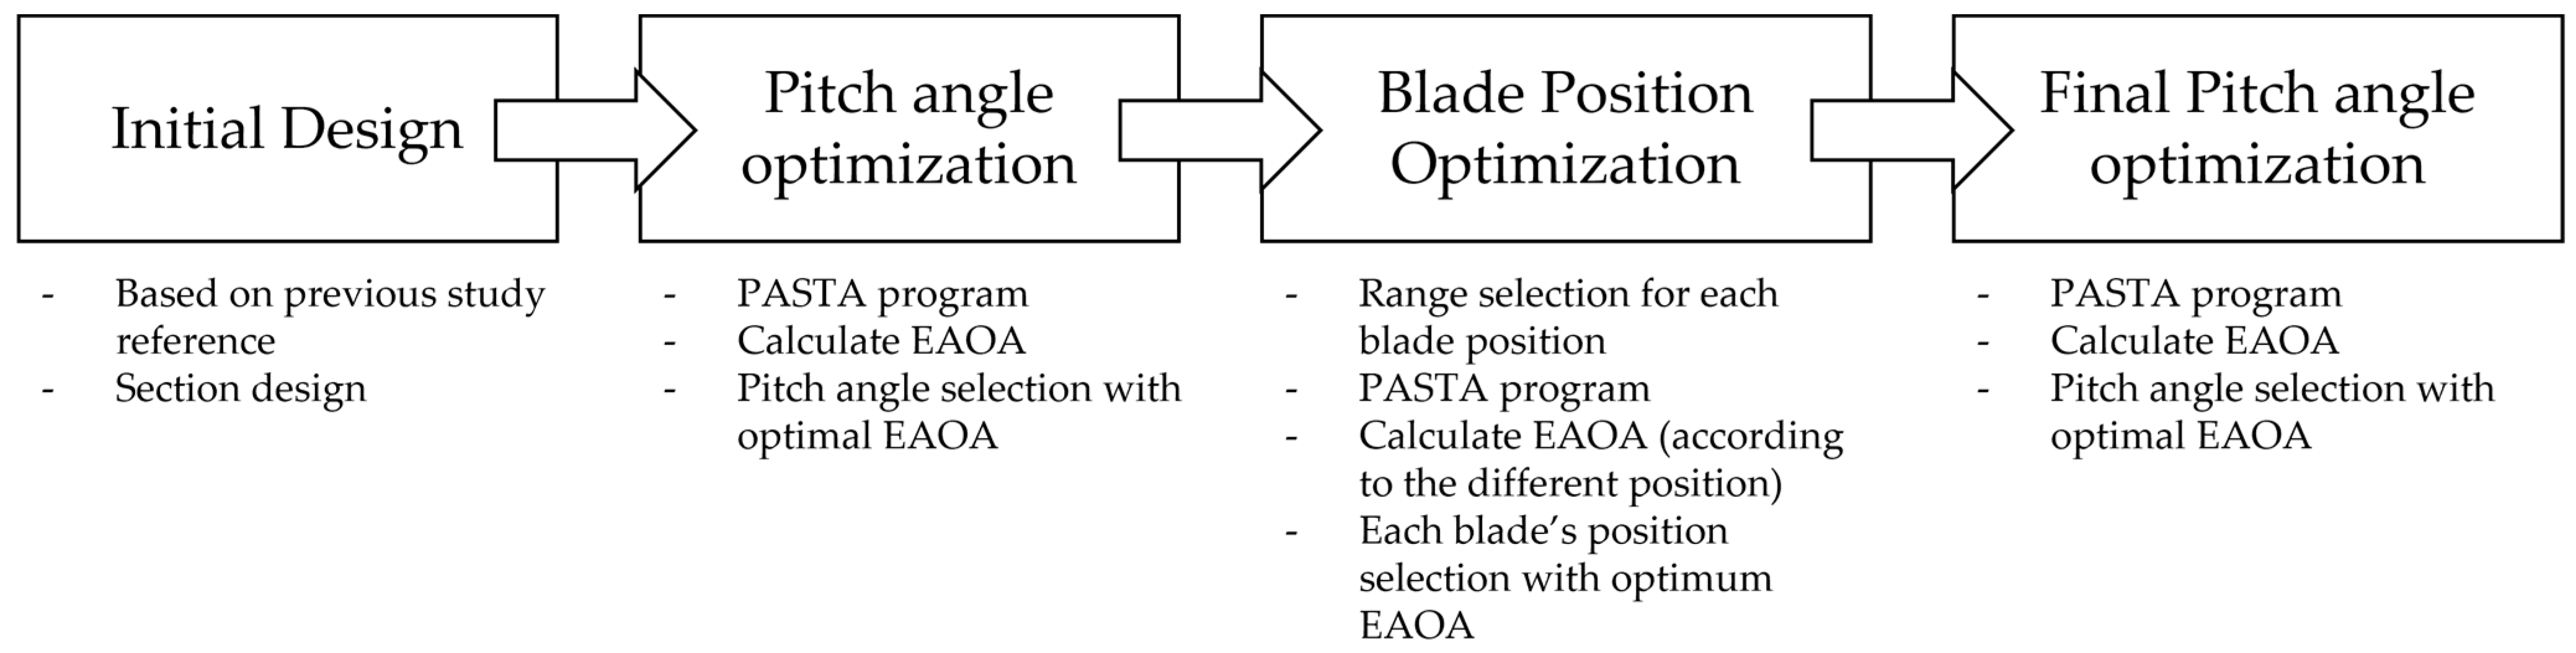
2.3. Optimization of the PSS Design
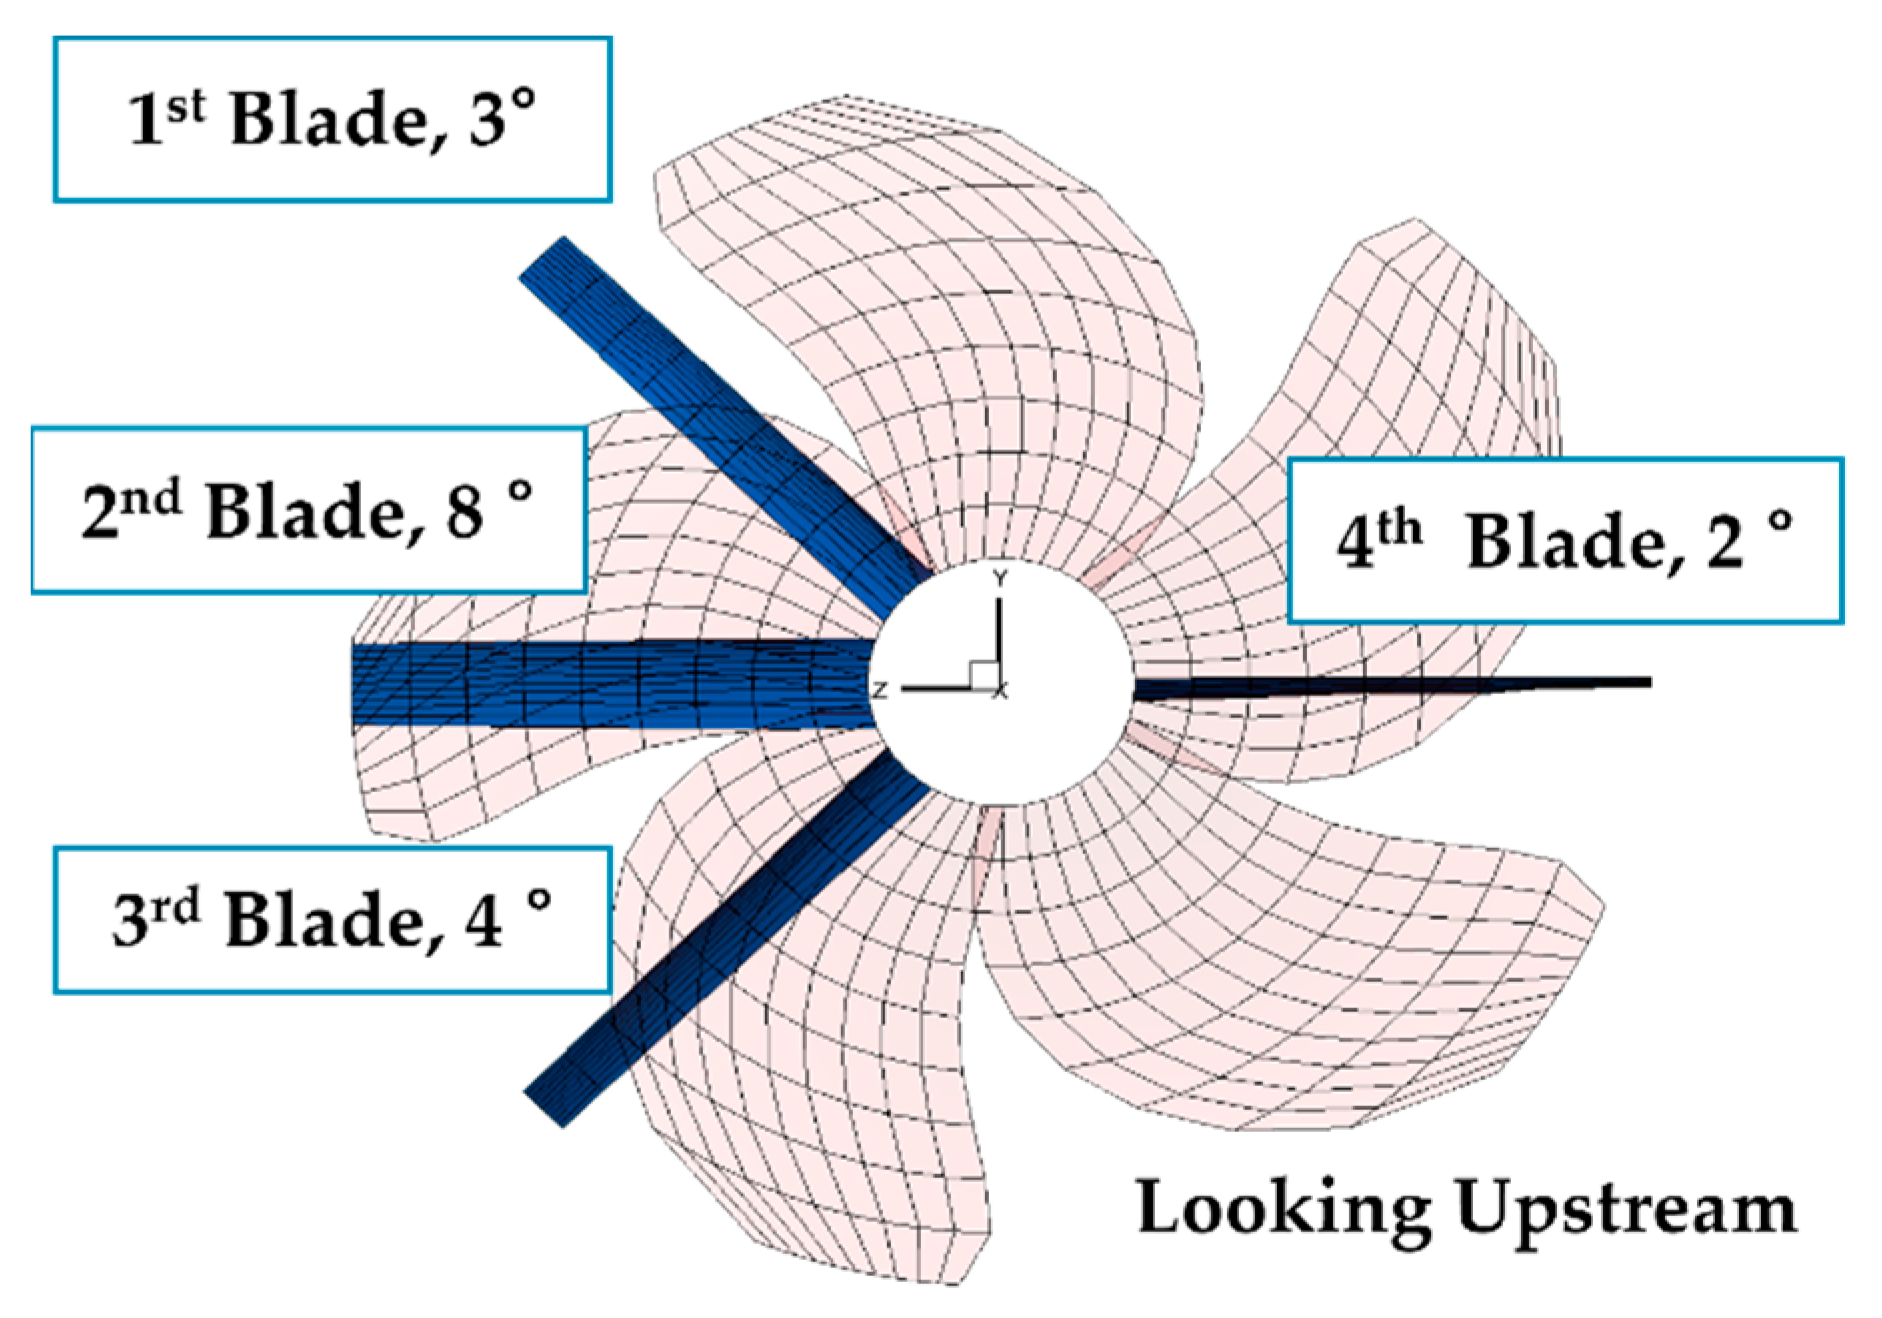
2.3.1. Initial Design of PSS
2.3.2. Final Design of PSS
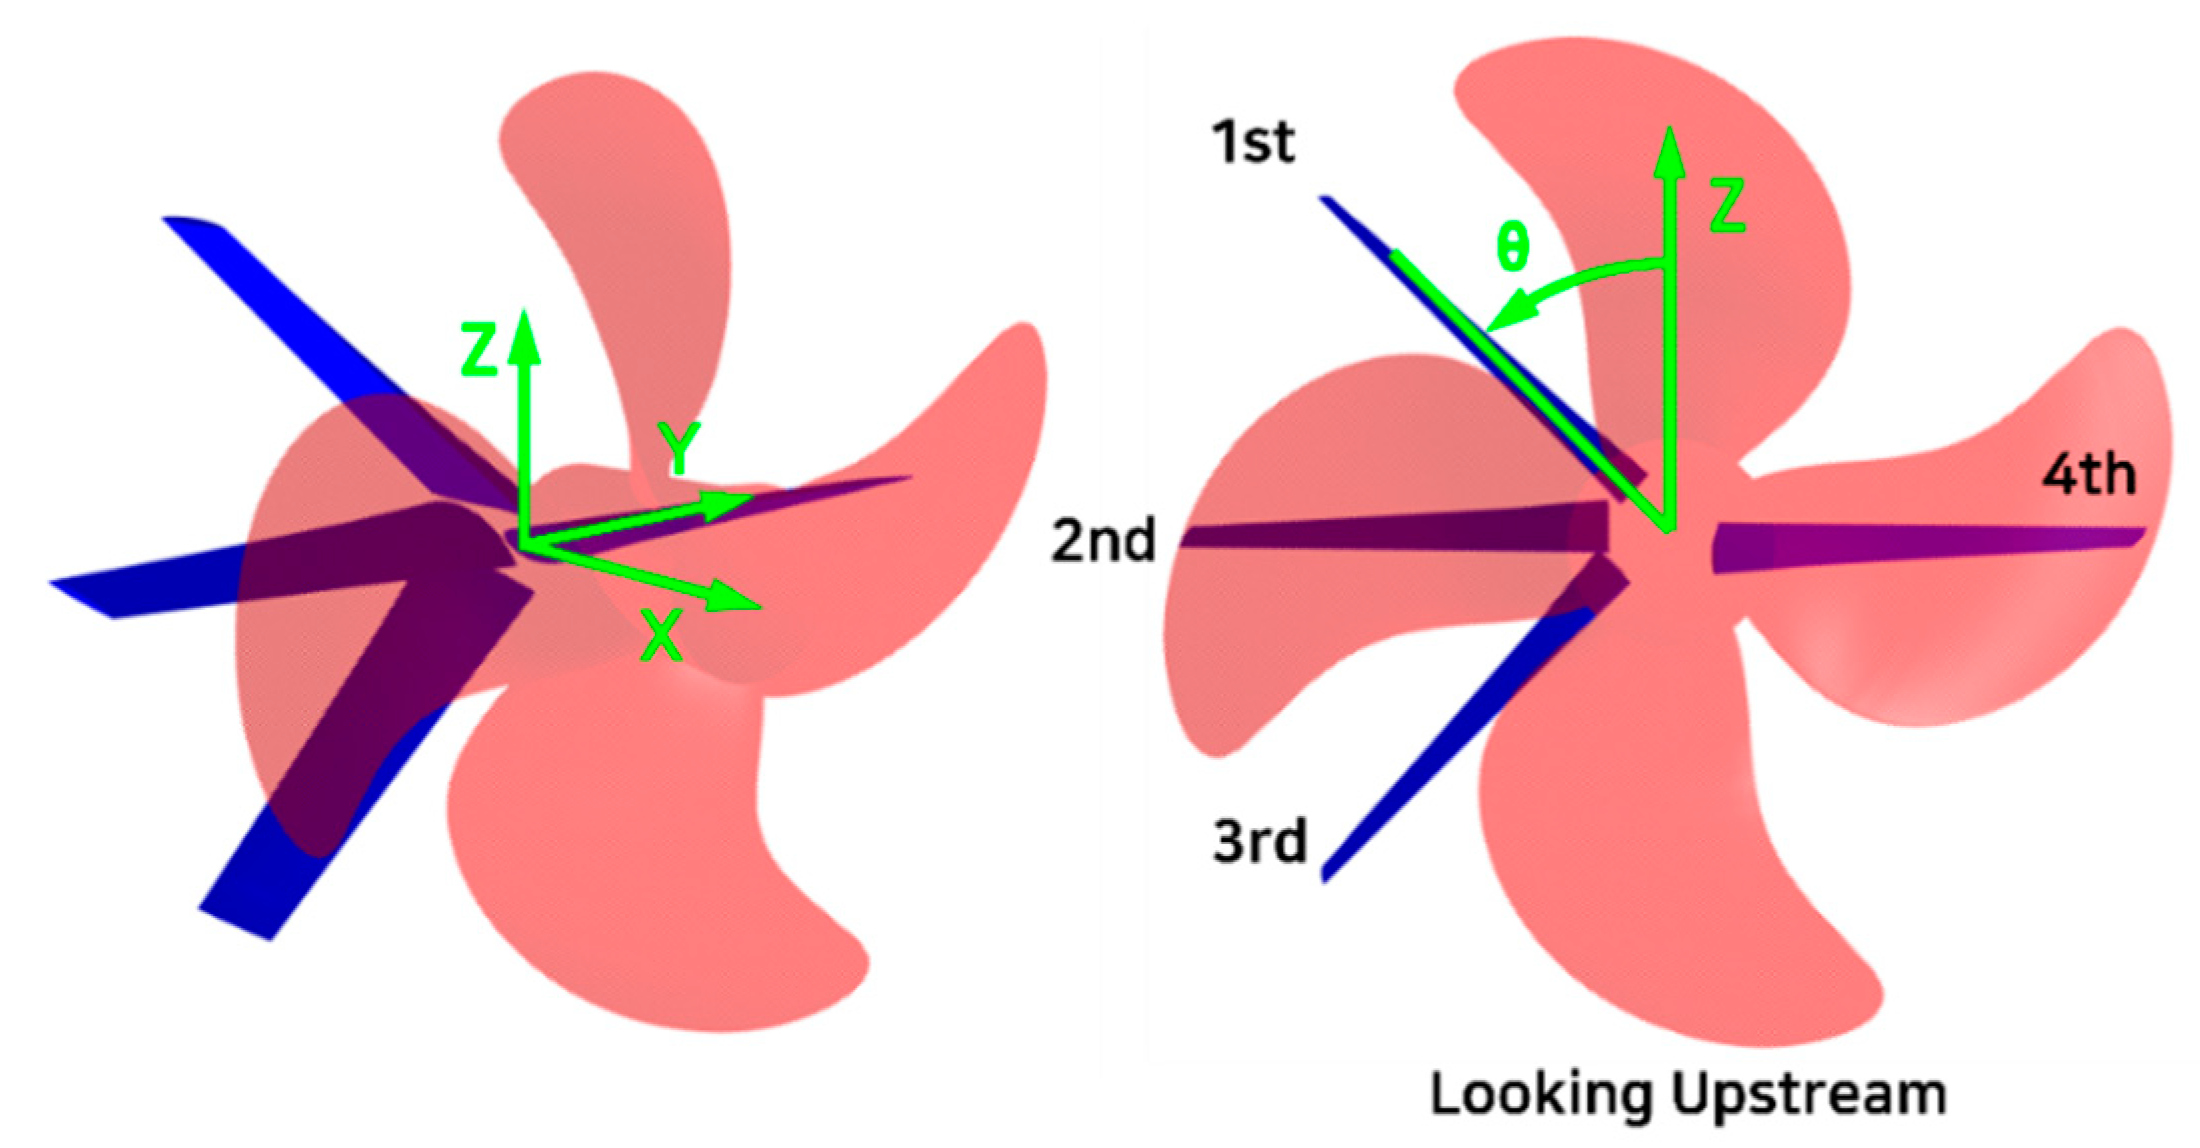
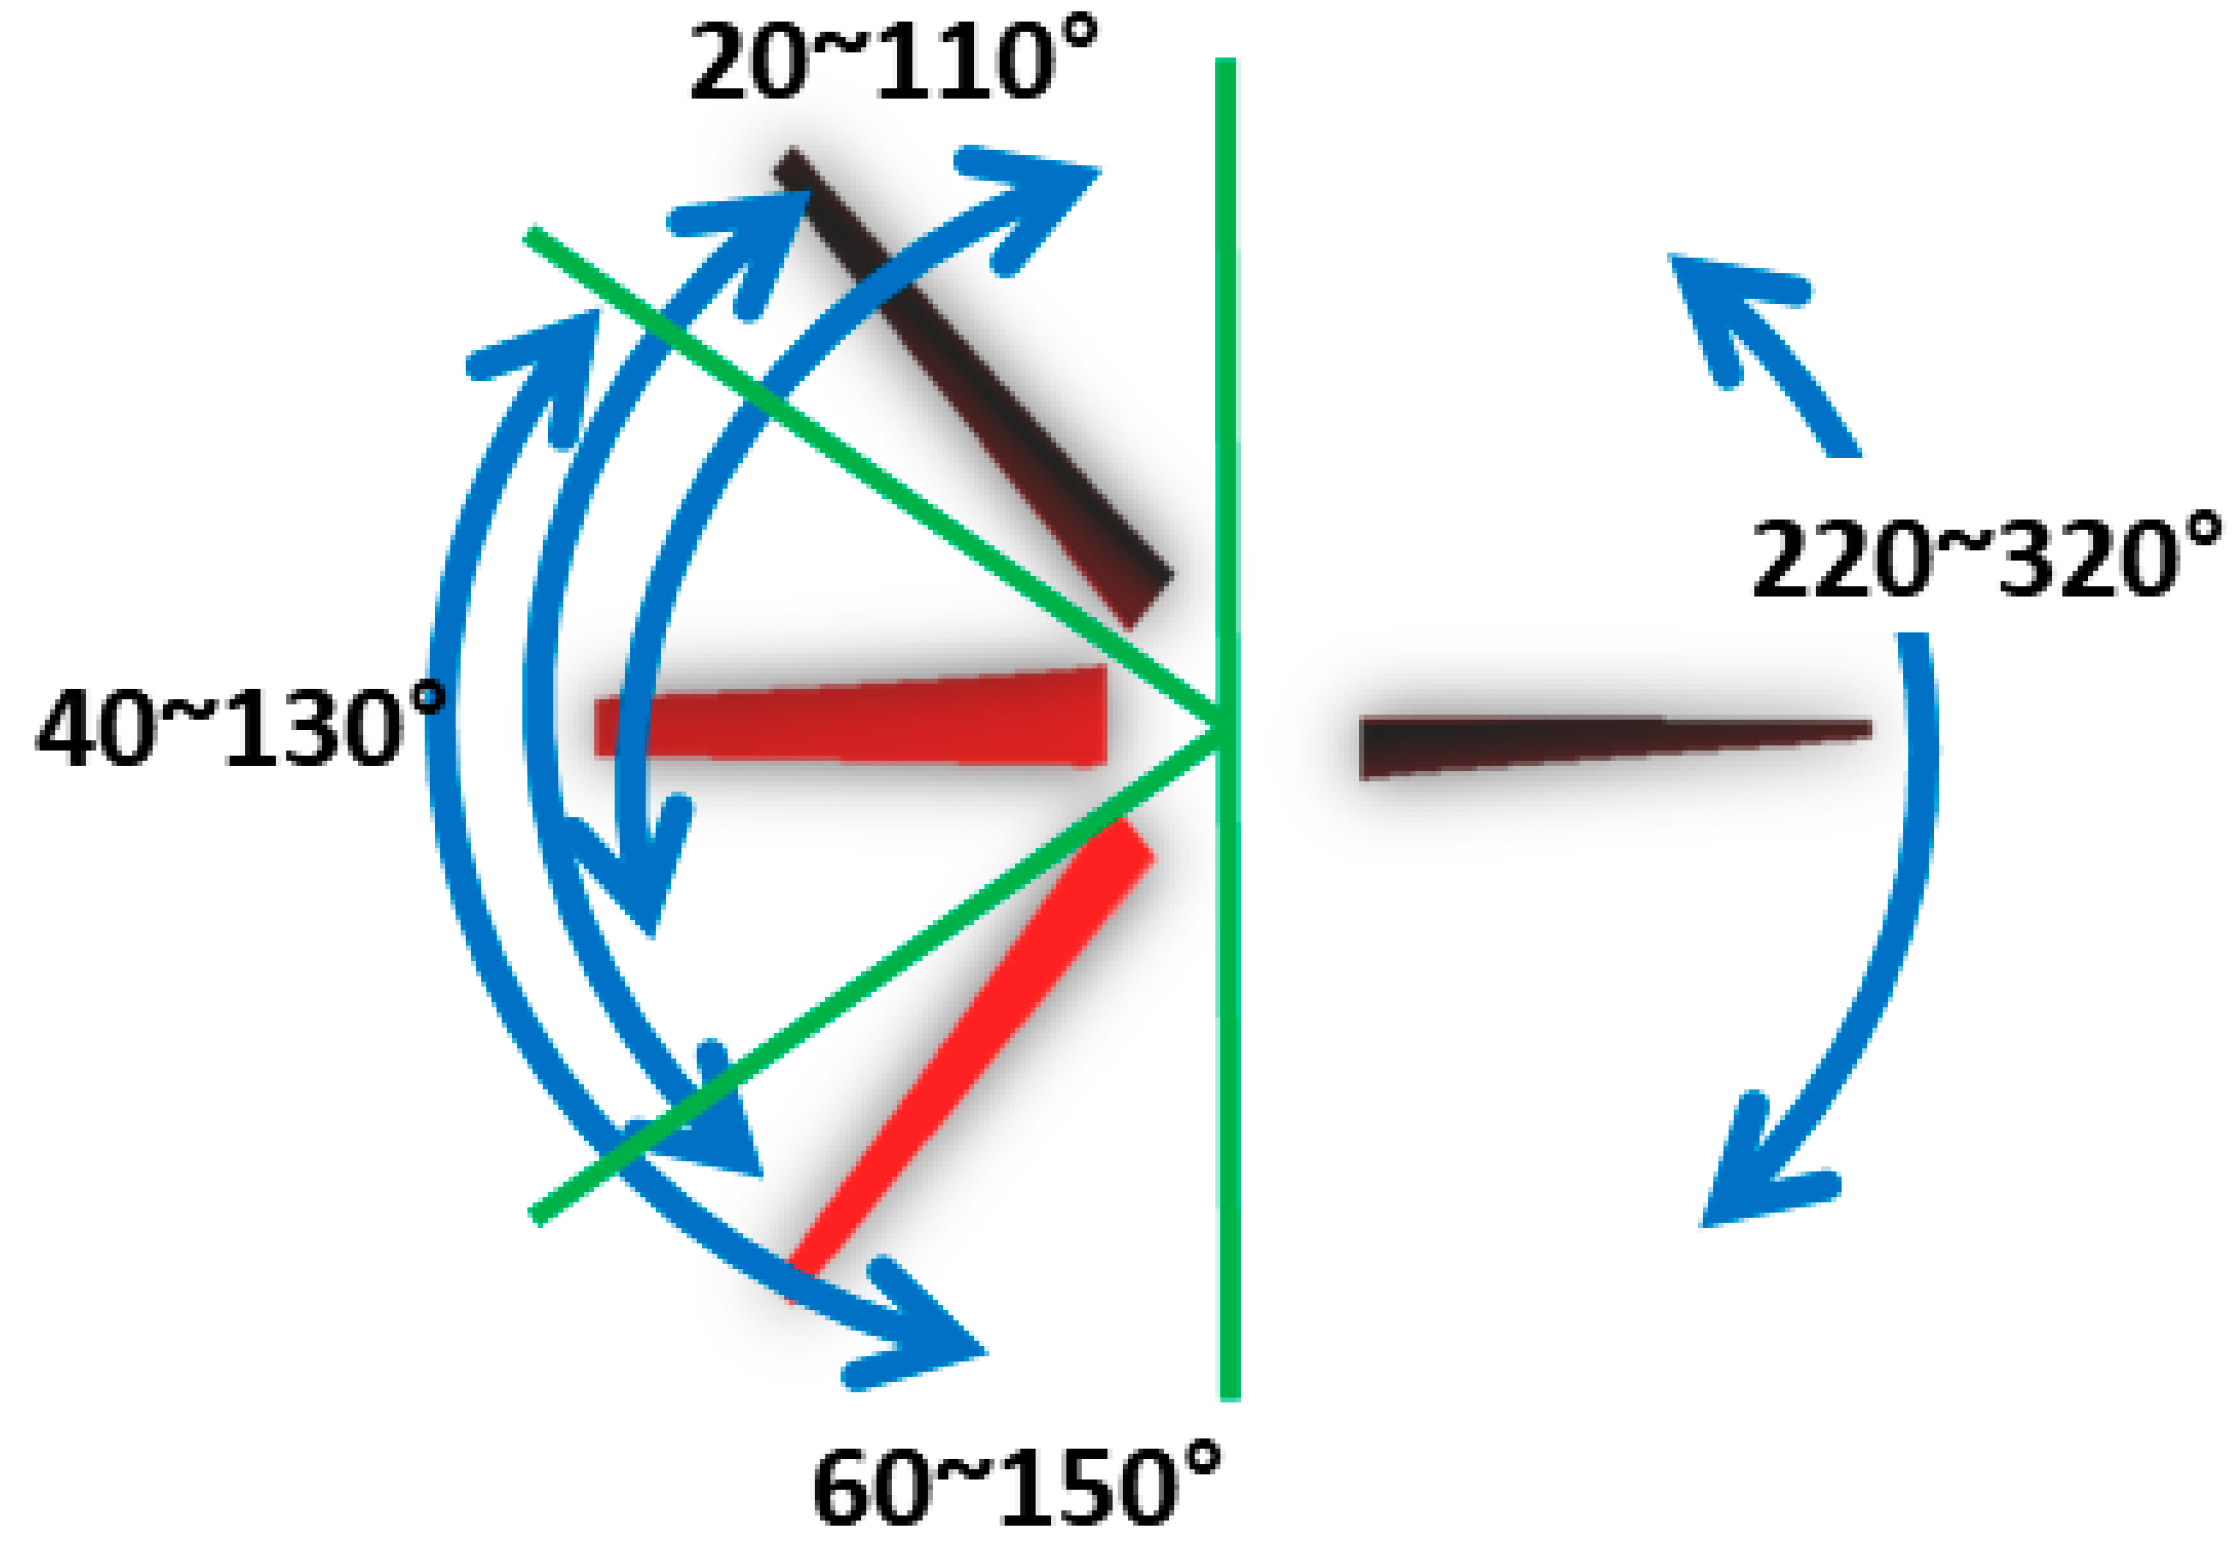
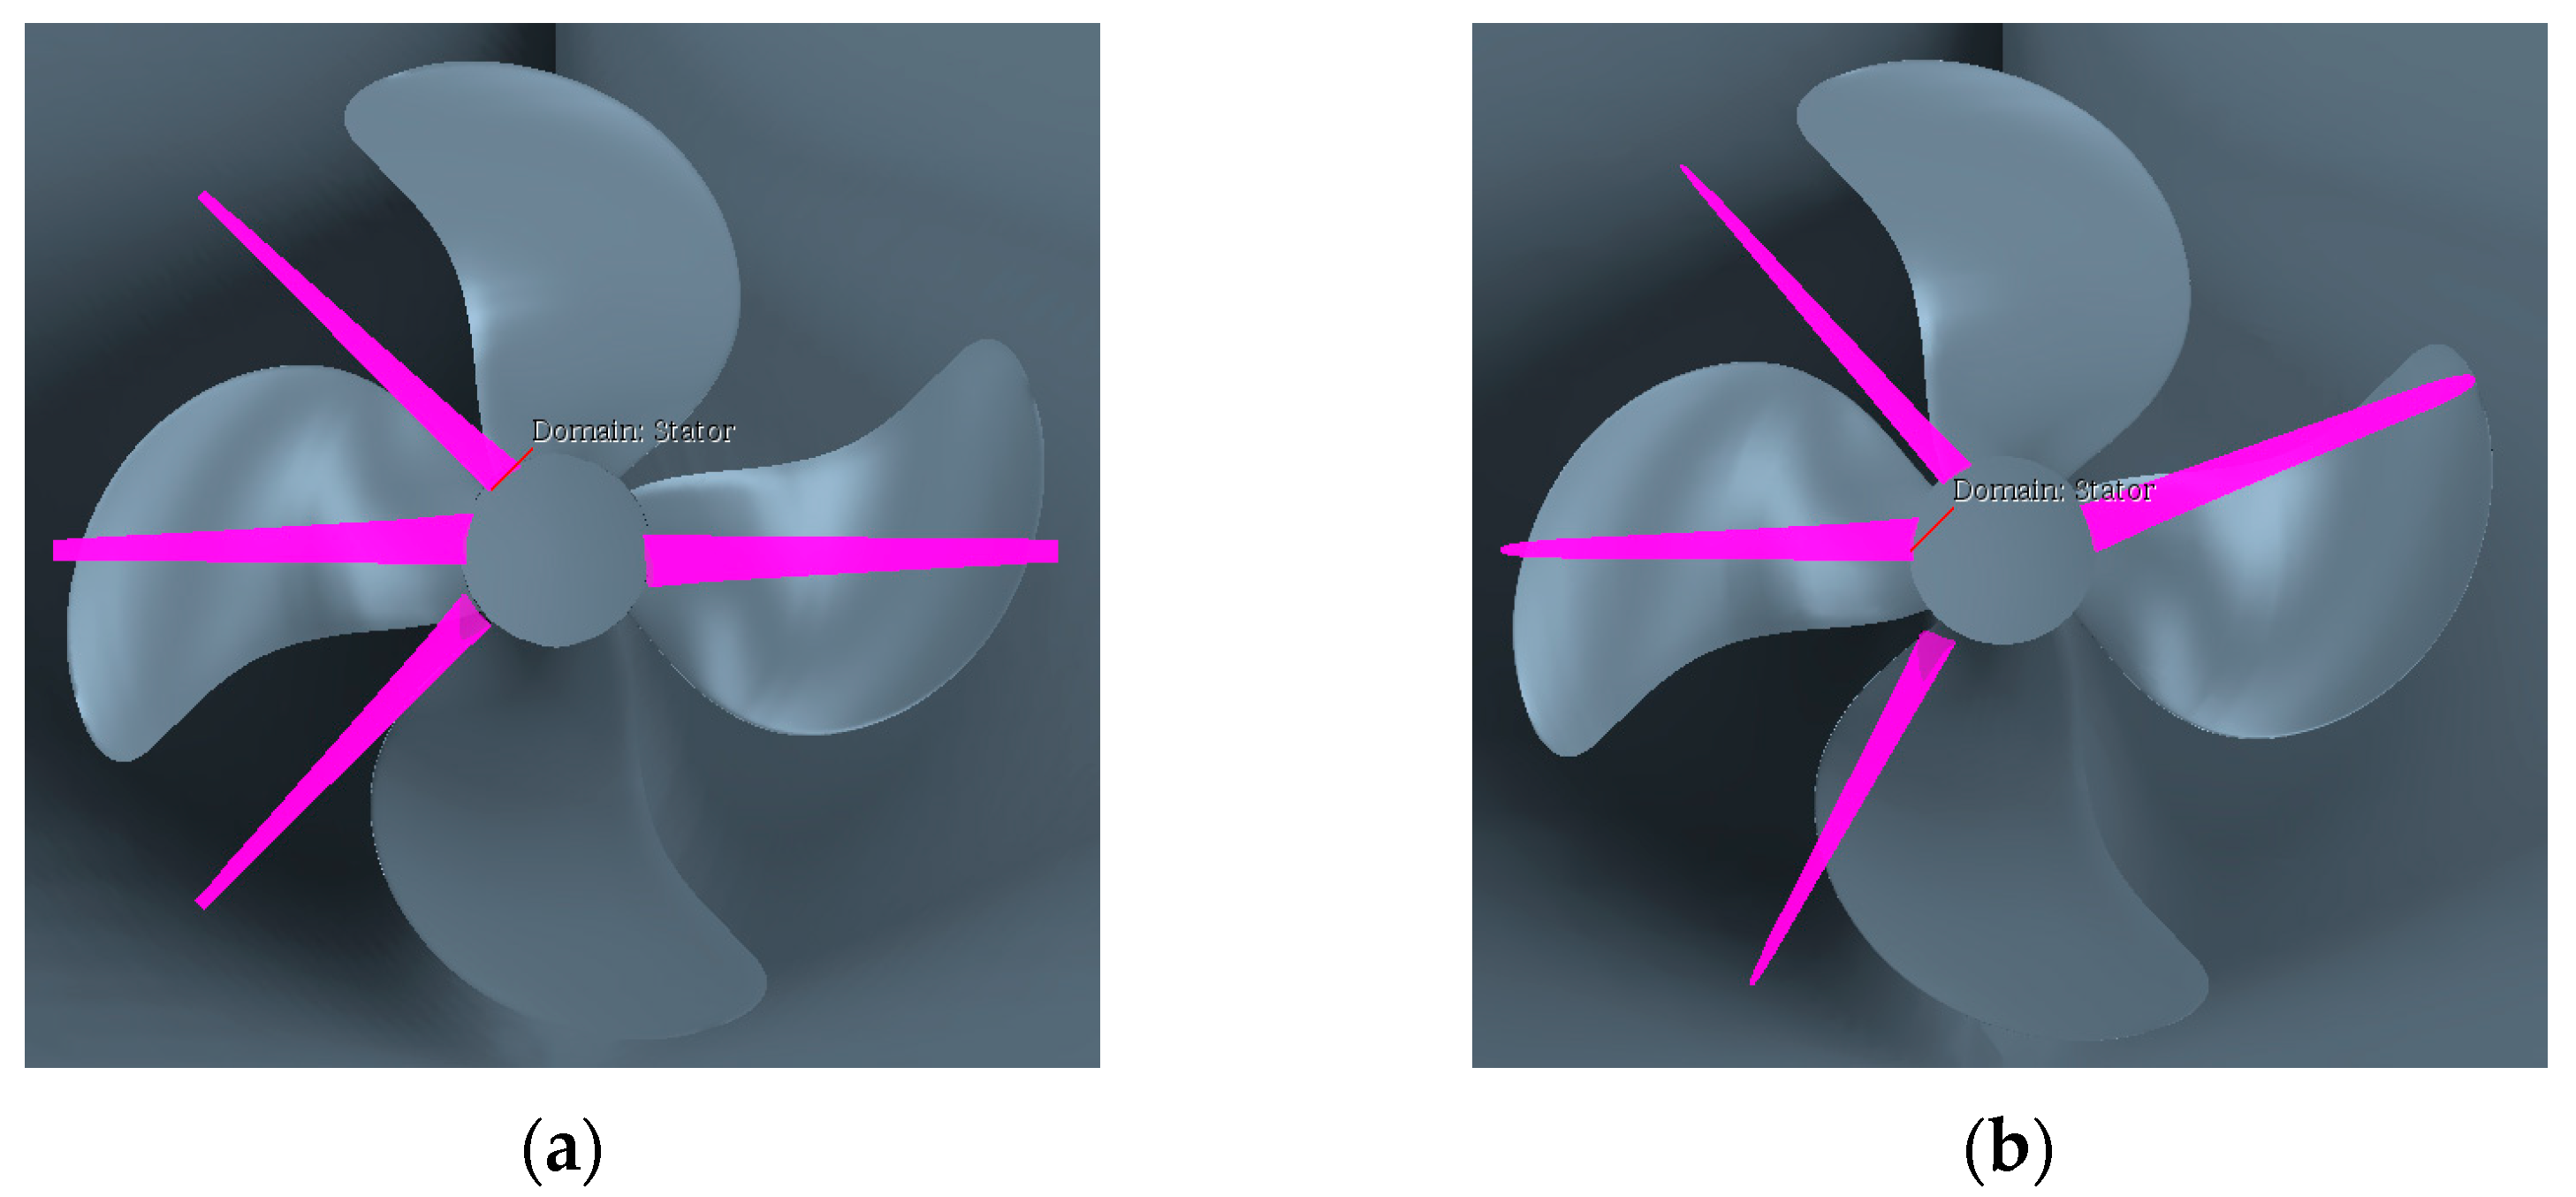
Blade Position
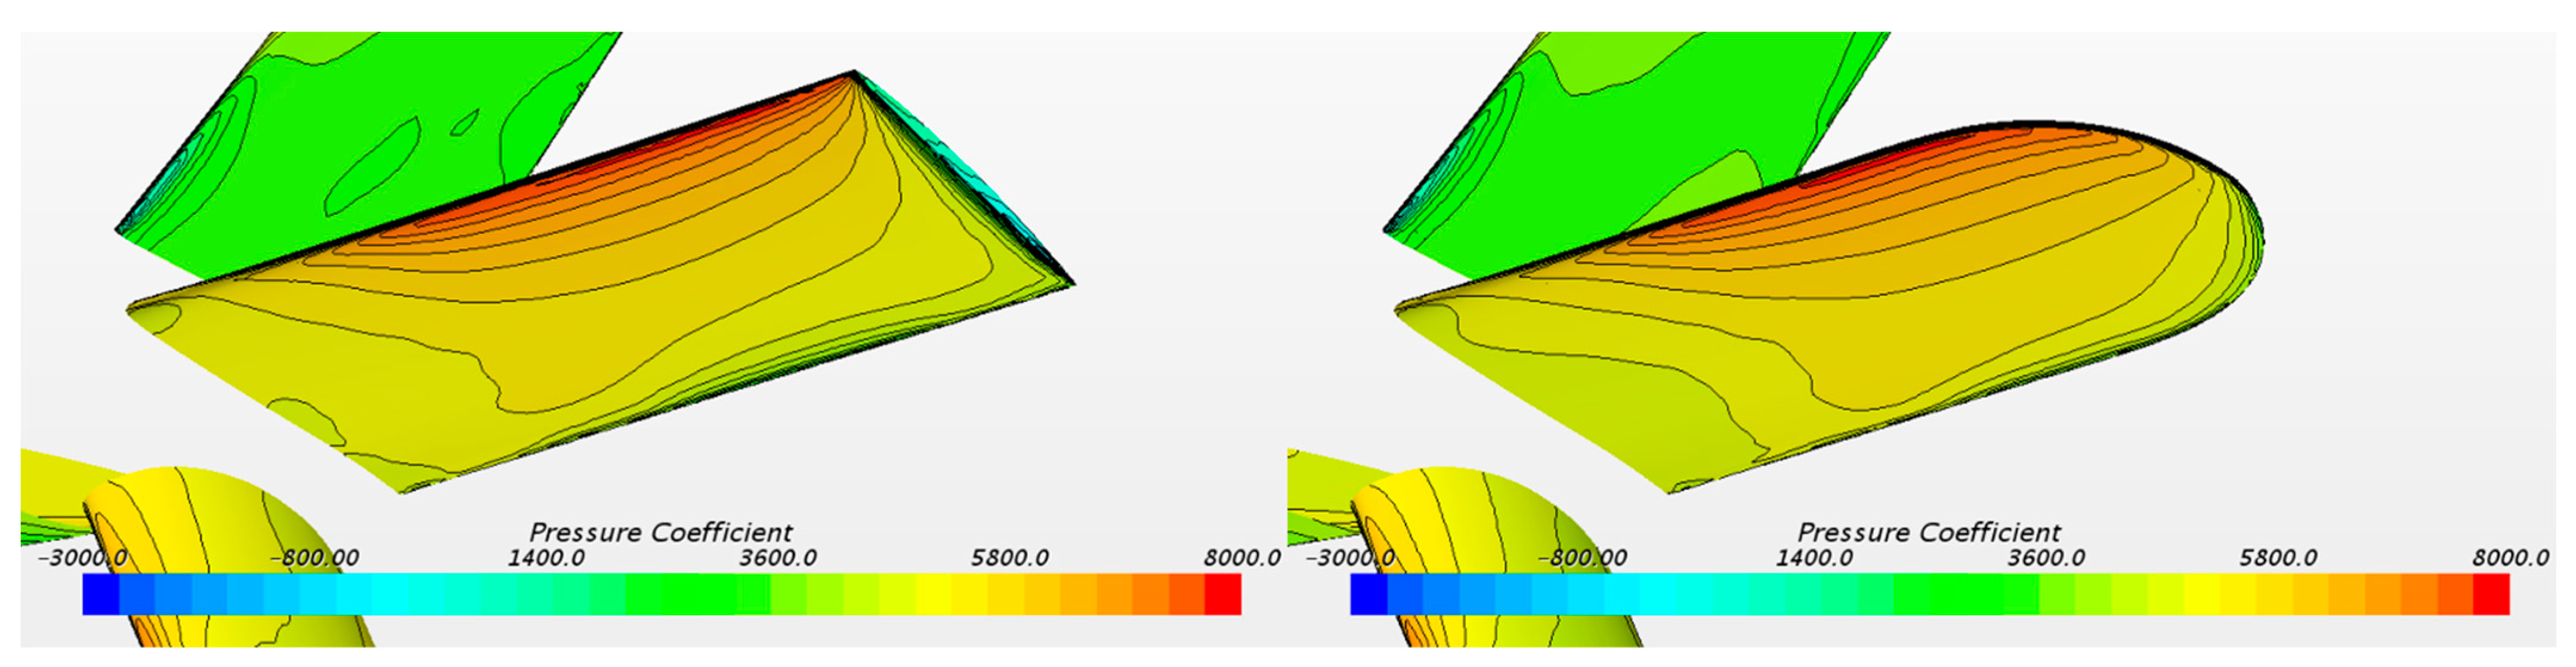
Tip Rounding
3. Results and Discussion
3.1. Comparison of CFD Result
3.2. Performance Validation through Model Test
3.2.1. Test Condition
3.2.2. Analysis of the Model Test Results
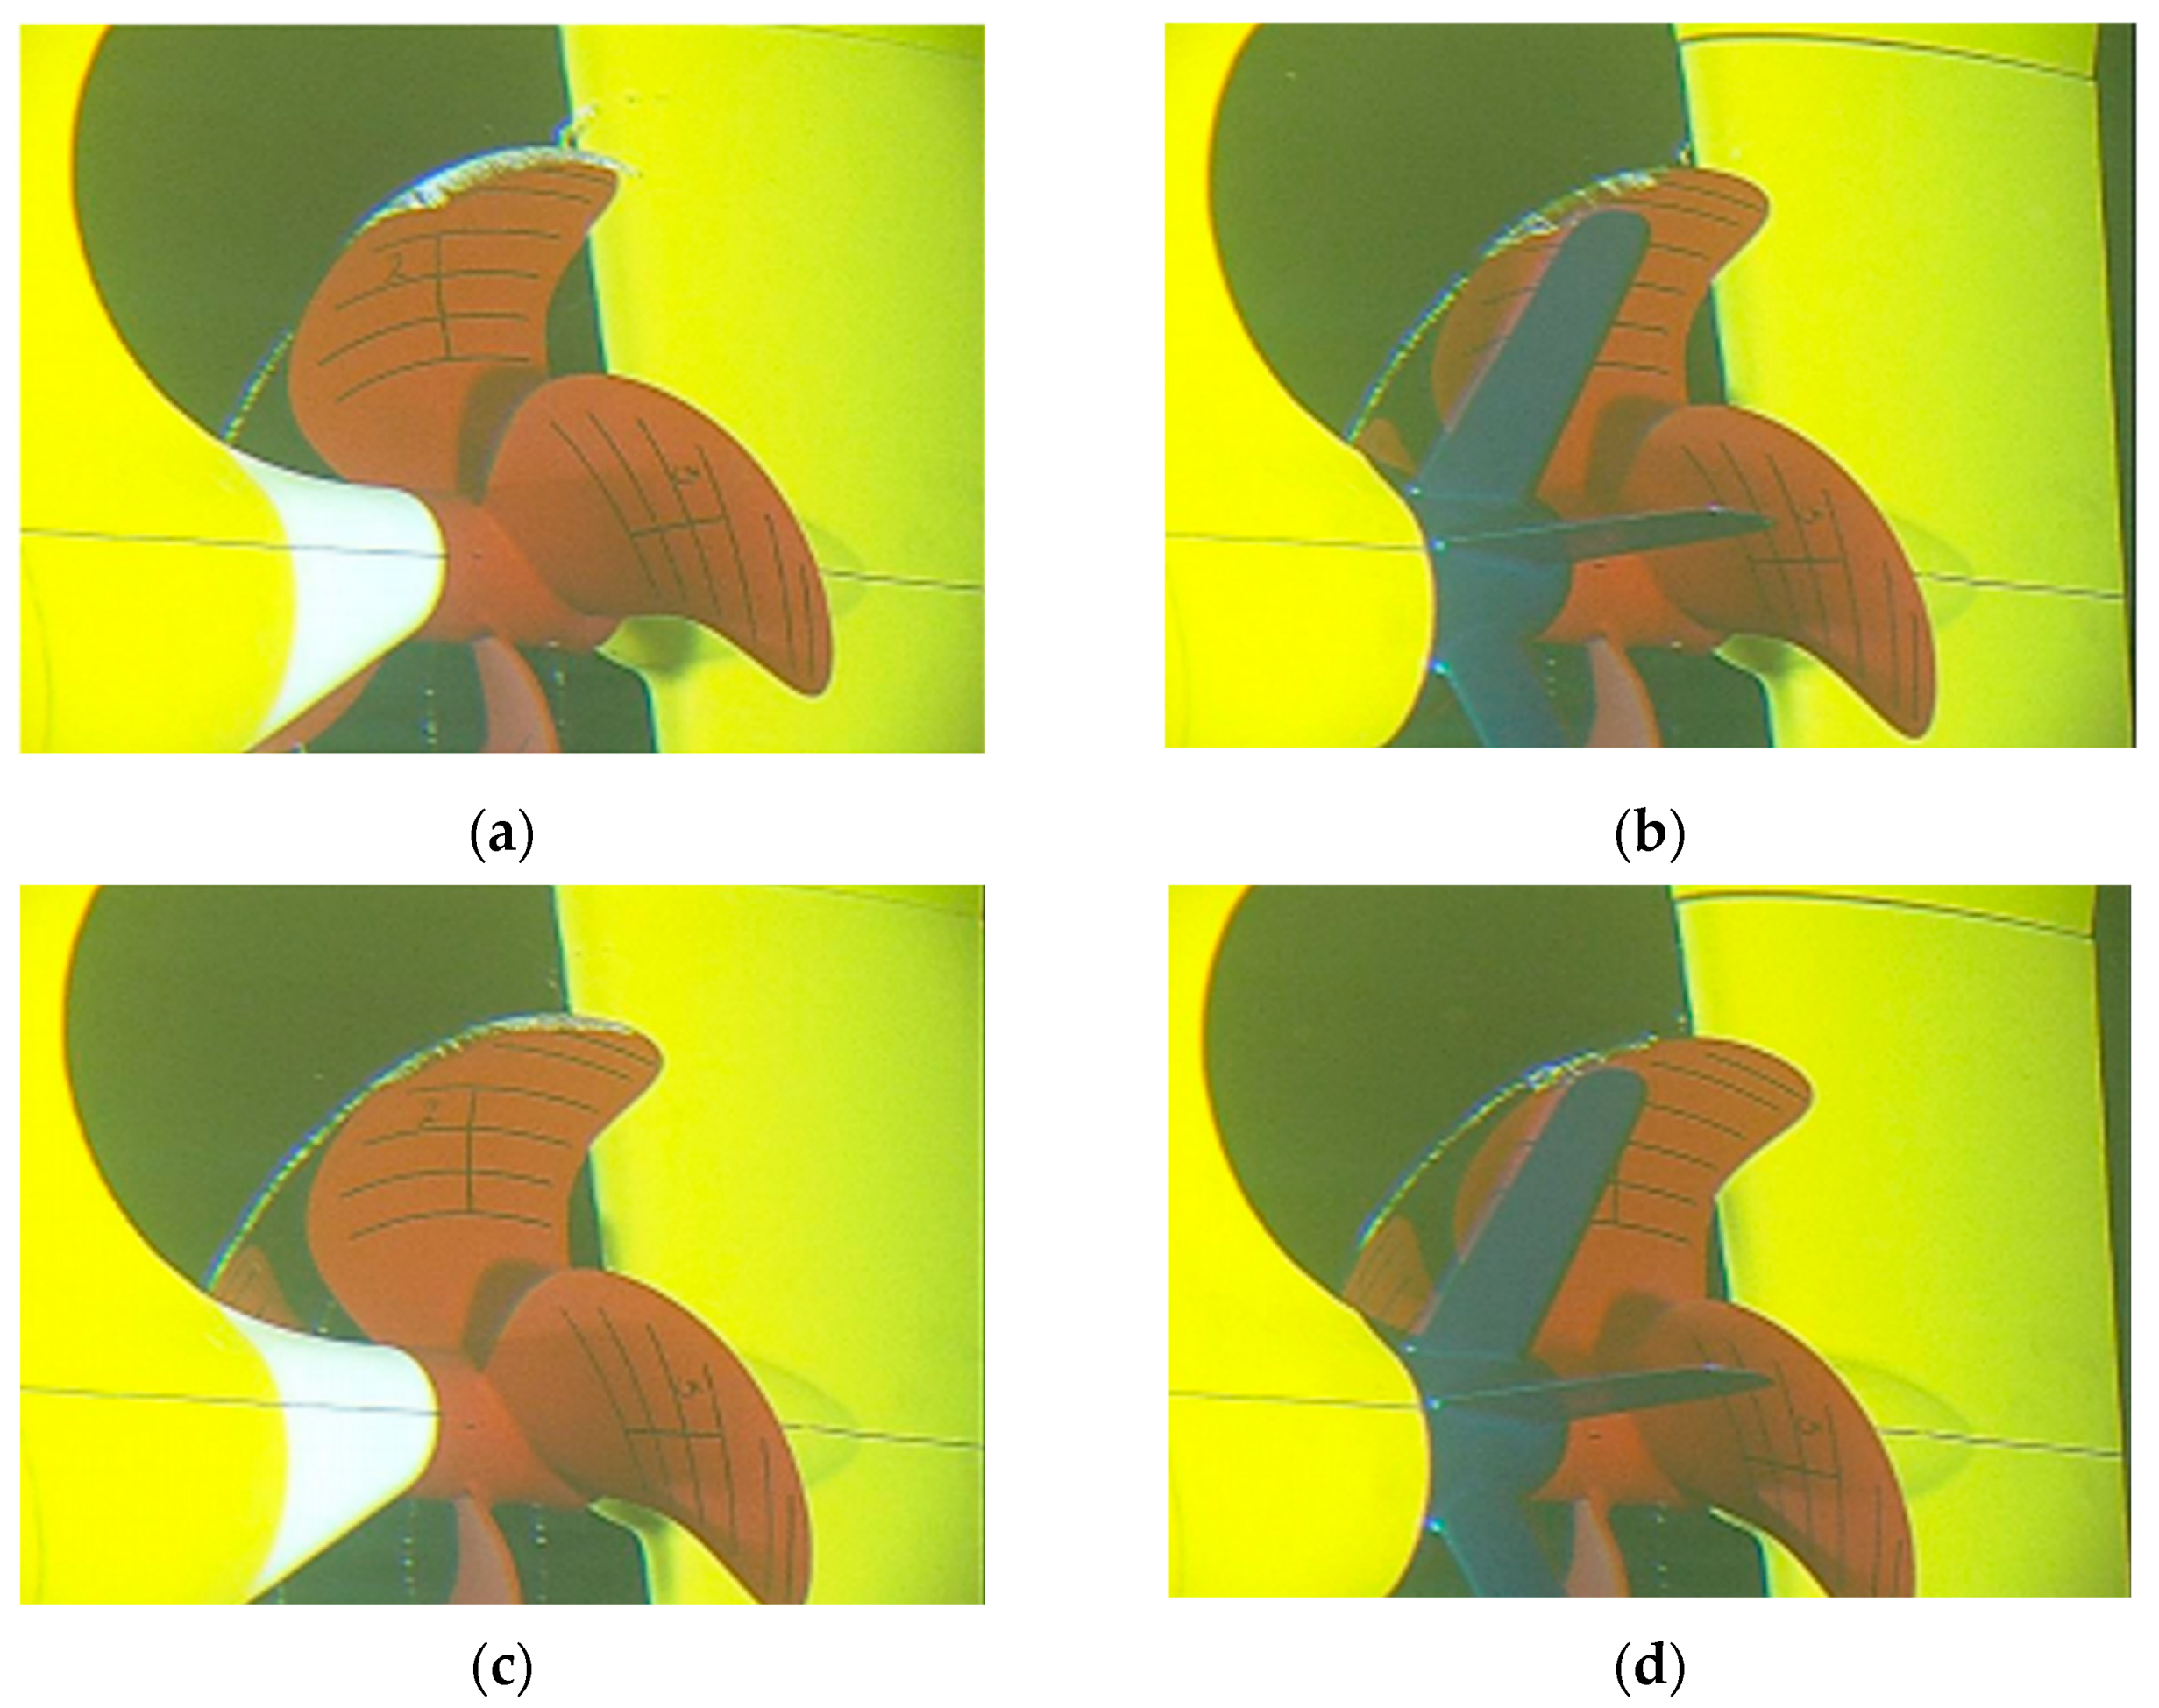
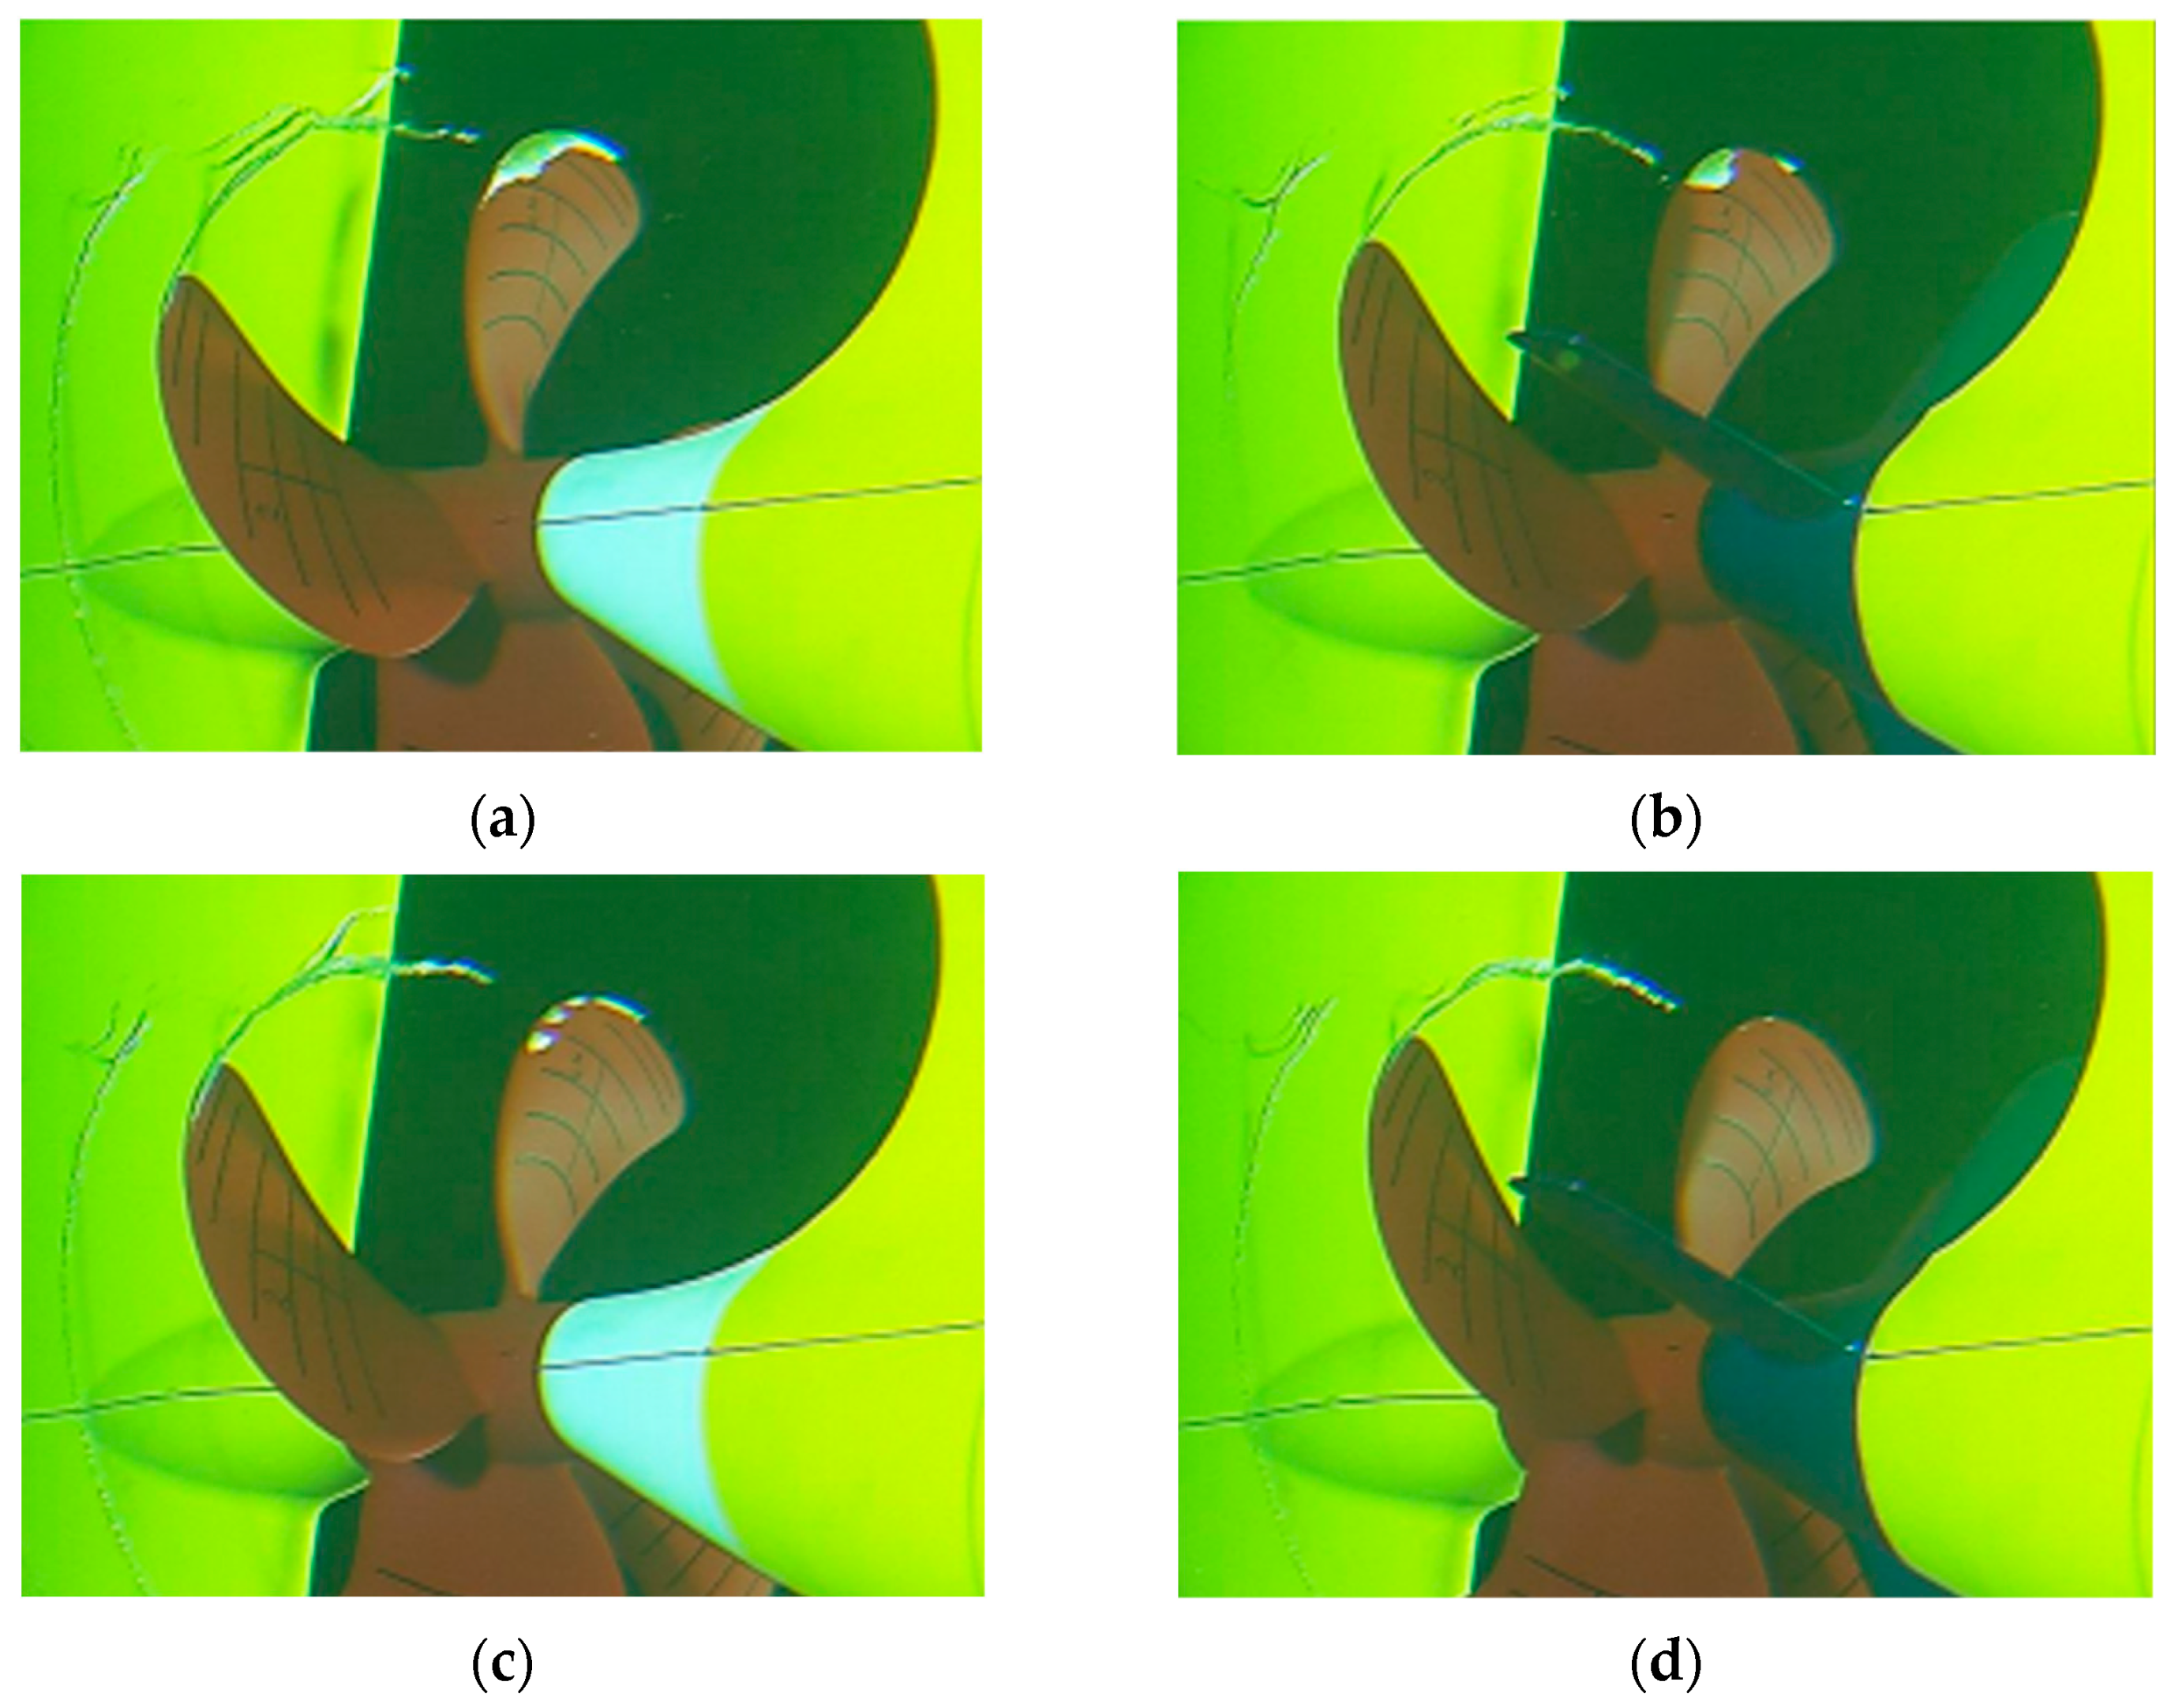
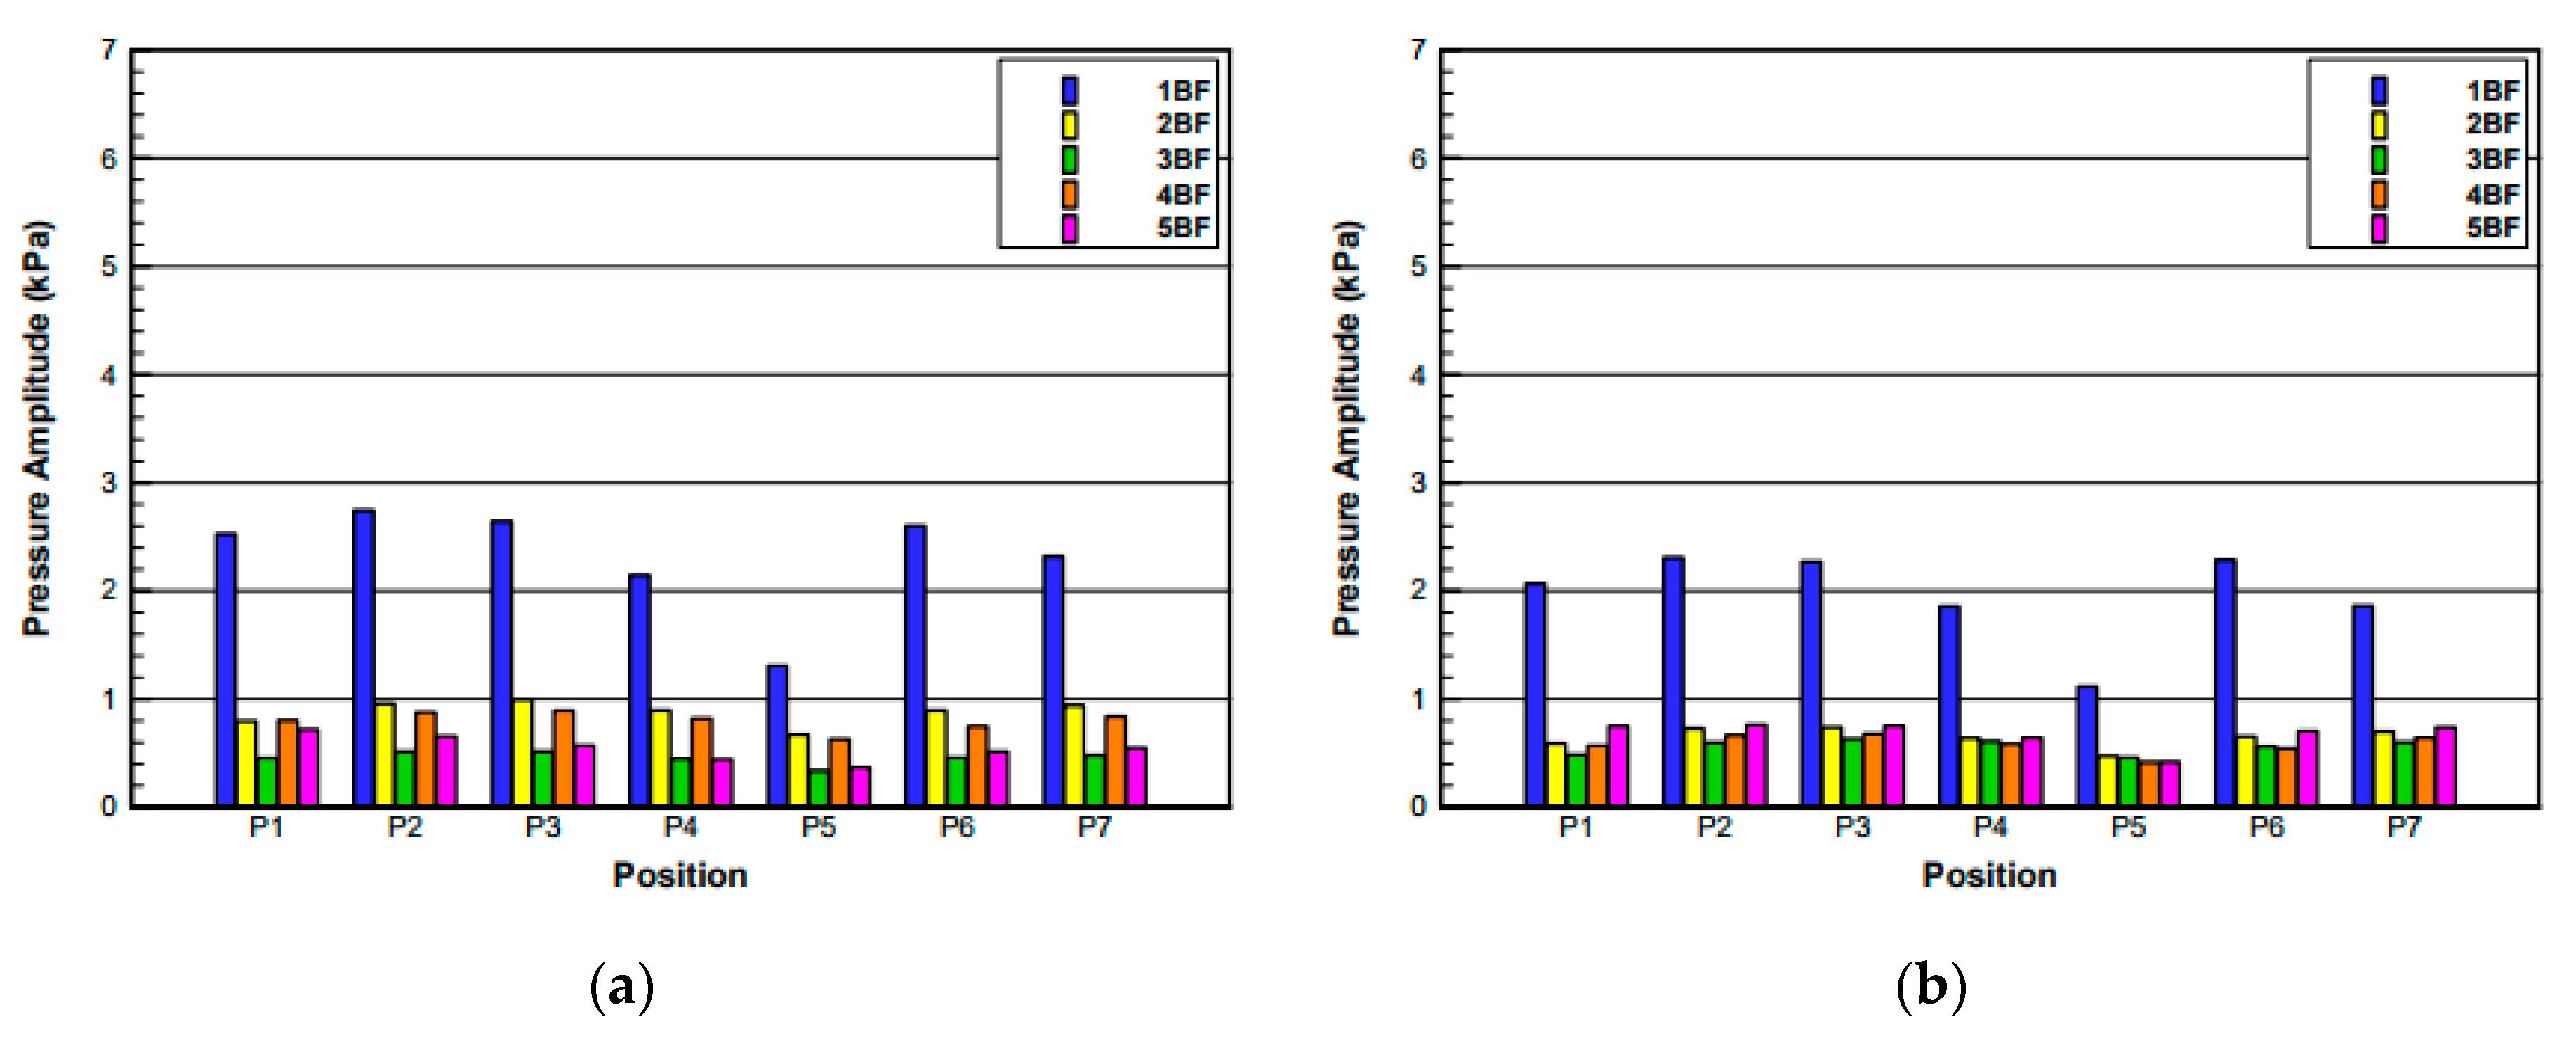
3.3. Comparison of Cavitation Performance by Model Test
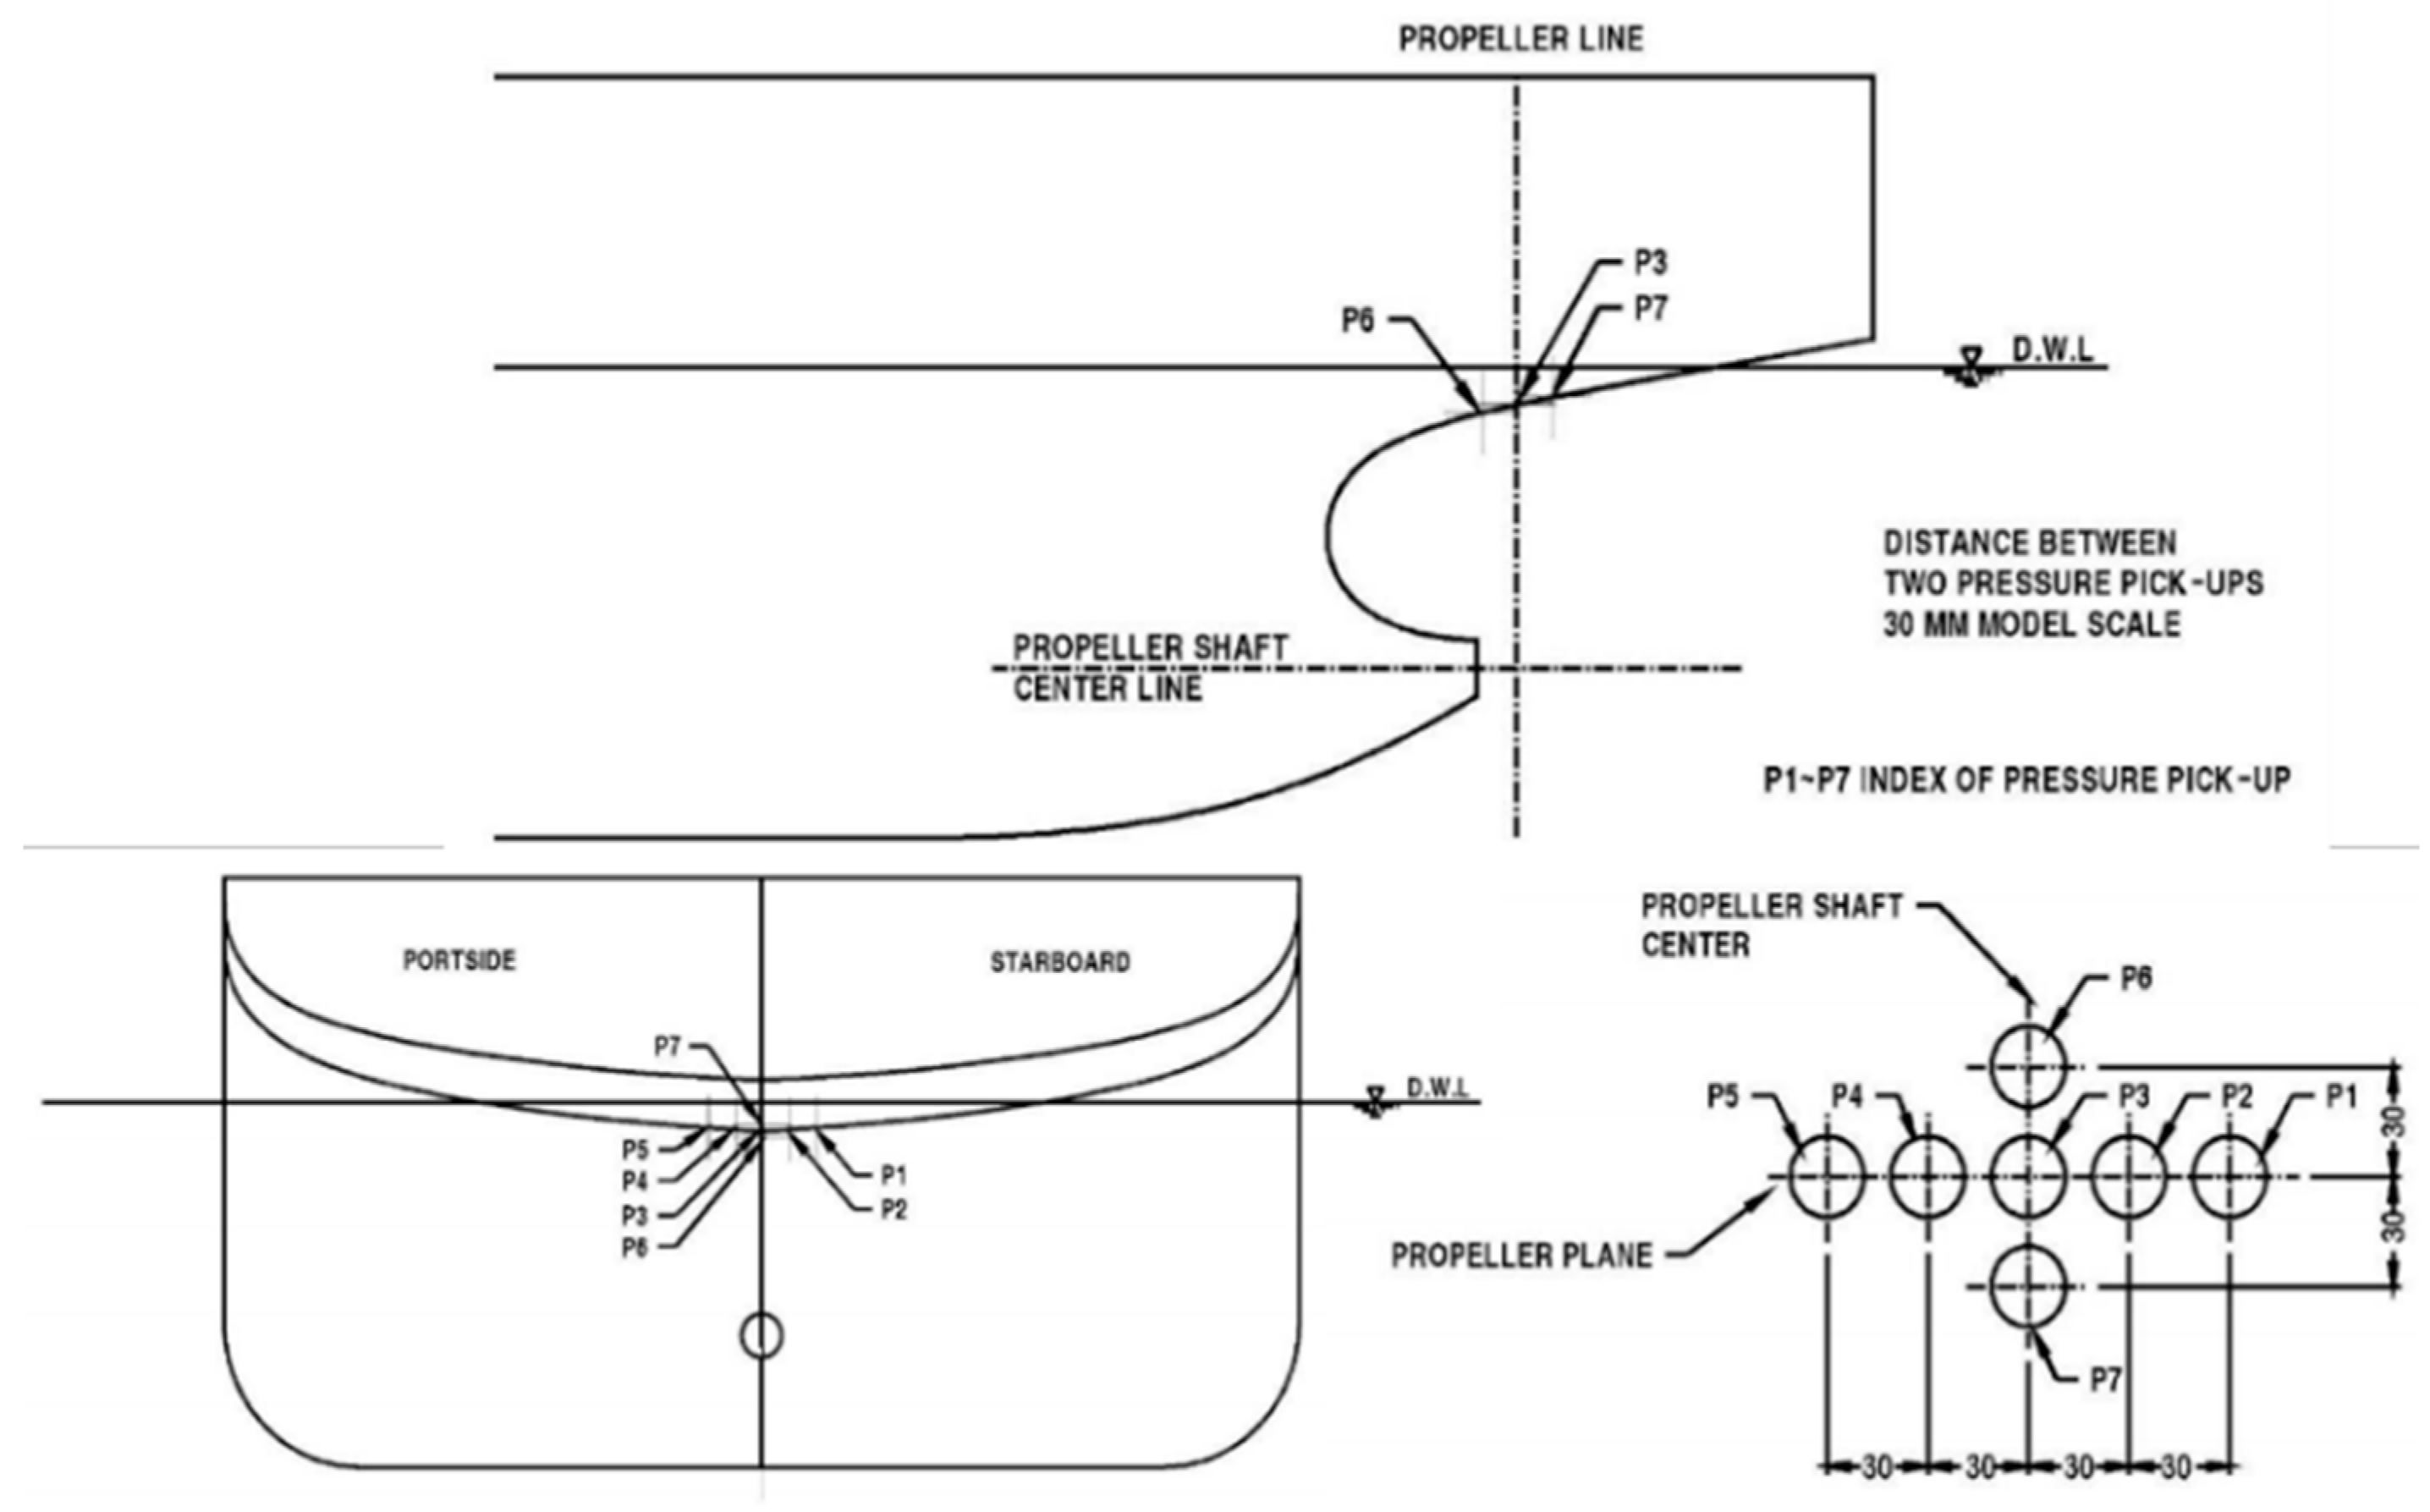
3.3.1. Test Condition
3.3.2. Analysis of Model Test Results
4. Conclusions
Author Contributions
Funding
Institutional Review Board Statement
Informed Consent Statement
Data Availability Statement
Conflicts of Interest
References
- Ekanem Attah, E.; Bucknall, R. An analysis of the energy efficiency of LNG ships powering options using the EEDI. Ocean. Eng. 2015, 110, 62–74. [Google Scholar] [CrossRef]
- Ancic, I.; Sestan, A. Influence of the required EEDI reduction factor on the CO2 emission from bulk carrier. Energy Policy 2015, 84, 107–116. [Google Scholar] [CrossRef]
- Vladimir, N.; Ancic, I.; Sestan, A. Effect of ship size on EEDI requirements for large container ships. J. Mar. Sci. Technol. 2018, 23, 42–51. [Google Scholar] [CrossRef]
- Ivanova, G. Analysis of the specifics in calculating the index of existing marine energy efficiency EEXI in force since 2023. In Proceedings of the 13th Electrical Engineering Faculty Conference, Resort „St.St. Constantine and Elena, Varna, Bulgaria, 8–11 September 2021; pp. 1–4. [Google Scholar]
- Perera, L.P.; Ventikos, N.P.; Rolfsen, S.; Anders, O. Advanced data analytics towards energy efficient and emission reduction retrofit technology integration in shipping. In Proceedings of the 31st International Ocean and Polar Engineering Conference, Rhodes, Greece, 20 June 2021. [Google Scholar]
- Wang, S.; Psaraftis, H.N.; Qi, J. Paradox of international maritime organization’s carbon intensity indicator. Commun. Transp. Res. 2021, 1, 100005. [Google Scholar] [CrossRef]
- Meng, Q.; Du, Y.; Wang, Y. Shipping log data based container ship fuel efficiency modeling. Transp. Res. Part B 2016, 83, 207–229. [Google Scholar] [CrossRef]
- Peters, A.; Lantermann, U.; Moctar, O. Numerical prediction of cavitation erosion on a ship propeller in model- and full-scale. Wear 2018, 408, 1–12. [Google Scholar] [CrossRef]
- Berteta, D.; Brizzolara, S.; Gaggero, S.; Viviani, M.; Savio, L. CPP propeller cavitation and noise optimization at different pitches with panel code and validation by cavitation tunnel measurements. Ocean. Eng. 2012, 53, 177–195. [Google Scholar] [CrossRef]
- Kang, J.G.; Kim, M.C.; Shin, Y.J. Study on compact pre-swirl duct for slender aft-body crude oil carrier. J. Mar. Sci. Eng. 2022, 10, 396. [Google Scholar] [CrossRef]
- Takekuma, K.; Tsuda, S.; Kawamura, A.; Kawaguchi, N. Development of reaction fin as a device for improvement of propulsive performance of high block coefficient ships. J. SNAJ 1981, 150, 30–44. [Google Scholar] [CrossRef] [PubMed]
- Lee, J.T.; Kim, M.C.; Suh, J.C.; Kim, S.H.; Choi, J.K. Development of a preswirl stator-propeller system for improvement of propulsion efficiency: A symmetric stator propulsion system. J. Soc. Nav. Archit. Korea 1992, 29, 132–145. [Google Scholar]
- Kim, M.C.; Lee, J.T.; Suh, J.C.; Kim, H.C. A study on the asymmetric pre-swirl stator system. J. Soc. Nav. Archit. Korea 1993, 30, 30–44. [Google Scholar]
- Bakica, A.; Vladimir, N.; Jasak, H.; Kim, E.S. Numerical simulations of hydrodynamic loads and structural responses of a Pre-Swirl Stator. Int. J. Nav. Archit. Ocean. Eng. 2021, 13, 804–816. [Google Scholar] [CrossRef]
- Bakica, A.; Vladimir, N.; Malenica, S.; Im, H.I. Numerical procedure for pre-swirl stator structural integrity evaluation. Ocean. Eng. 2022, 258, 12. [Google Scholar] [CrossRef]
- Bakica, A.; Malenica, S.; Vladimir, N.; Senjanovic, I. Hydroelastic analysis of pre-swirl stator. Mar. Struct. 2022, 85, 13. [Google Scholar] [CrossRef]
- Kim, M.C.; Chun, H.H.; Kang, Y.D. Design and Experimental Study on a New Concept of Preswirl Stator as an Efficient Energy-Saving Device for Slow Speed Full Body Ship. In Proceedings of the 2004 SNAME Annual Meeting, Washington, DC, USA, 30 September 2004. [Google Scholar]
- Kang, Y.D.; Kim, M.C.; Chun, H.H. A study on the design of a biased asymmetric pre-swirl stator propulsion system. J. Soc. Nav. Archit. Korea 2004, 41, 13–21. [Google Scholar]
- Lee, C.M.; Shin, Y.J.; Kim, M.C.; Choi, J.E.; Chun, H.H. Design of asymmetric pre-swirl stator for LNG carrier according to variation of stator shapes. J. Soc. Nav. Archit. Korea 2016, 53, 37–44. [Google Scholar] [CrossRef] [Green Version]
- Lee, K.S.; Kim, M.C.; Shin, Y.J.; Kang, J.G. Design of asymmetric pre-swirl stator for KVLCC2 considering angle of attack in non-uniform flow fields of the stern. J. Soc. Nav. Archit. Korea 2019, 56, 352–360. [Google Scholar] [CrossRef]
- Shin, Y.J.; Kim, M.C.; Kang, J.G.; Kim, H.U.; Shin, I.R. Validation of optimally designed stator-propeller system by EFD and CFD. Brodogr. Teor. I Praksa Brodogr. I Pomor. Teh. 2019, 70, 133–151. [Google Scholar] [CrossRef]
- Lee, J.T.; Kim, M.C.; Van, S.H.; Kim, K.S.; Kim, H.C. Development of a Preswirl Stator Propulsion System for a 300K VLCC. J. Soc. Nav. Archit. Korea 1994, 31, 1–13. [Google Scholar]
- Becker Mewis Duct. Available online: https://www.becker-marine-systems.com/products/product-detail/becker-mewis-duct.html (accessed on 29 November 2022).
- Shin, Y.J. A Study on the Analysis of Interactions and Optimal Design of Energy Saving Devices by Ship Types. Ph.D. Thesis, Pusan National University, Busan, Republic of Korea, 2019. [Google Scholar]
- Kwon, J.I. A Study on the Biased Asymmetric Pre-swirl Stator for a Container Ship. Master’s Thesis, Pusan National University, Busan, Republic of Korea, 2013. [Google Scholar]
- Shin, Y.J.; Kim, M.C.; Kang, J.G.; Lee, J.H. Study on Performance of Asymmetric Pre-Swirl Stator according to Variations in Dimensions and Blade Tip Shape. J. Ocean. Eng. Technol. 2016, 30, 431–439. [Google Scholar] [CrossRef]
- Lee, S.G.; Cho, S.J.; Ha, W.H.; Lee, I.W.; Kim, H.T.; Lee, K.W. Development of Hull Form and Basic Design with Energy Saving Device for LNG Fueled Feeder Container Ship; TRKO202200005831; Ministry of Trade, Industry and Energy: Sejong City, Republic of Korea, 2021.
- International Towing Tank Conference. 1978 ITTC Performance Prediction Method. In Proceedings of the 29th ITTC, Online, 13–18 June 2021. [Google Scholar]
- International Towing Tank Conference. Scaling method for ship wake fraction with pre-swirl devices. In Proceedings of the 29th ITTC, Online, 13–18 June 2021. [Google Scholar]


| Full Scale | Model Scale | |
|---|---|---|
| Scale ratio | 27.2 | |
| Length PP [m] | 185.00 | 6.801 |
| Length WL [m] | 186.30 | 6.849 |
| Breadth [m] | 32.26 | 1.186 |
| Design Draught [m] | 10.00 | 0.368 |
| W.S.A [m2] | 7351.05 | 9.936 |
| Design Speed [knots] | 19.0 | |
| Propeller Diameter [m] | 6.80 | 0.25 |
| Number of Blades | 4 | |
| Mean Pitch Ratio | 0.874 | |
| Expanded Area Ratio | 0.606 | |
| Full Scale | Model Scale | |
|---|---|---|
| Scale ratio | 26.4 | |
| Length PP [m] | 163.00 | 6.17 |
| Length WL [m] | 160.59 | 6.08 |
| Breadth [m] | 27.50 | 1.04 |
| Design Draught [m] | 8.75 | 0.33 |
| W.S.A [m2] | 5591.00 | 8.02 |
| Design Speed [knots] | 19.0 | |
| Propeller Diameter [m] | 6.60 | 0.250 |
| Number of Blades | 5 | |
| Mean Pitch Ratio | 0.952 | |
| Expanded Area Ratio | 0.625 | |
| Analysis Conditions | |
|---|---|
| Program | Star-CCM+ (Ver 11.02) |
| Governing Equation | Incompressible RANS Equation |
| Discretization | Cell Centered FVM |
| Turbulence model | Reynolds Stress Model |
| Wall function | Non-Equilibrium |
| Rotation method | Sliding Moving Mesh |
| Velocity-Pressure Coupling | SIMPLE Algorithm |
| Number of Mesh | 8,000,000 |
| y+ | 200 |
| EFD (SSMB) 1 | 0.266 | 0.186 | 0.706 | 1.035 | 1.111 | 0.810 |
| CFD (PNU) 2 | 0.268 | 0.201 | 0.701 | 1.055 | 1.093 | 0.809 |
| 0.2 | 0.25 | 0.3 | 0.4 | 0.5 | 0.6 | 0.7 | 0.8 | 0.9 | 0.95 | 1.0 | |
|---|---|---|---|---|---|---|---|---|---|---|---|
| Chord/Diameter | 0.177 | 0.174 | 0.171 | 0.165 | 0.159 | 0.153 | 0.147 | 0.142 | 0.136 | 0.133 | 0.130 |
| Camber/Chord | 0.085 | 0.082 | 0.078 | 0.071 | 0.063 | 0.054 | 0.045 | 0.035 | 0.024 | 0.019 | 0.013 |
| Thickness/Diameter | 0.037 | 0.035 | 0.033 | 0.030 | 0.026 | 0.023 | 0.019 | 0.016 | 0.012 | 0.011 | 0.009 |
(rps) | (Nm) | (W) | Diff (%) | |
|---|---|---|---|---|
| Bare | 8.28 | 1.58273 | 82.34 | - |
| w/PSS | 7.93 | 1.61248 | 80.37 | −2.39 |
| Case (Degree) | KT | Equivalent Angle of Attack (Degree) | ||||
|---|---|---|---|---|---|---|
| 1st Blade | 2nd Blade | 3rd Blade | 4th Blade | Average | ||
| 40/90/150/290 | 0.224 | −11.29 | −11.74 | −12.18 | −14.30 | −12.38 |
| 35/100/150/290 | 0.224 | −11.59 | −11.82 | −11.71 | −14.26 | −12.34 |
| 35/85/150/265 | 0.223 | −11.25 | −11.91 | −12.27 | −13.49 | −12.23 |
| 35/85/150/285 | 0.221 | −10.92 | −11.71 | −12.17 | −14.09 | −12.22 |
| 35/80/150/285 | 0.221 | −10.68 | −11.74 | −12.34 | −14.10 | −12.21 |
| ⋮ | ||||||
| 100/120/140/220 | 0.205 | −7.00 | −8.77 | −8.73 | −12.37 | −9.22 |
| 105/125/145/220 | 0.206 | −6.99 | −8.99 | −8.64 | −12.24 | −9.22 |
| 110/130/150/220 | 0.206 | −7.05 | −9.15 | −8.51 | −12.09 | −9.20 |
| 25/45/65/320 | 0.205 | −7.38 | −8.11 | −8.27 | −13.00 | −9.19 |
| 20/40/60/320 | 0.207 | −7.05 | −8.25 | −8.14 | −12.76 | −9.05 |
| Case | Design Parameter | Performance | |||||
|---|---|---|---|---|---|---|---|
| Blade Position | Tip Rounding | (rps) | (Nm) | (W) | Diff (%) | ||
| Bare Hull | N/A | N/A | 8.28 | 1.58273 | 82.34 | - | |
| Pre-Swirl Stator | Reference | 45/95/135/270 | N/A | 7.93 | 1.61248 | 80.37 | −2.39 |
| Case 1 | 40/90/150/290 | N/A | 7.97 | 1.59588 | 79.89 | −2.98 | |
| Case 2 | 45/95/135/270 | 0.9R | 7.81 | 1.63599 | 80.27 | −2.52 | |
| Case 3 | 40/90/150/290 | 0.9R | 7.95 | 1.59563 | 79.68 | −3.23 | |
| Combined ESD | Case 4 | 40/90/150/290 | 0.9R | 7.93 | 1.59426 | 79.41 | −3.56 |
| Case | |||||||||
|---|---|---|---|---|---|---|---|---|---|
| Bare | CFD | 9415 | 0.292 | 0.288 | 0.243 | 1.062 | 1.054 | 0.684 | 0.766 |
| EFD | 10,141 | 0.273 | 0.246 | 0.180 | 1.087 | 1.015 | 0.689 | 0.761 | |
| w/ESD | CFD | 9094 | 0.375 | 0.370 | 0.268 | 1.163 | 1.065 | 0.648 | 0.803 |
| EFD | 9739 | 0.342 | 0.315 | 0.192 | 1.179 | 1.020 | 0.664 | 0.799 | |
| Item | Bare | w/ESD |
|---|---|---|
| Draught at Stern [m] | 10.0 | |
| Stern Wave Height [m] | 1.3 | |
| NCR Power [kW] | 11,798 | |
| Sea Margin [%] | 15 | |
| Number of Revolutions [rpm] | 103.70 | 101.8 |
| Ship Speed [knots] | 19.01 | 19.21 |
| Advance Coefficient, | 0.6276 | 0.5912 |
| Thrust Coefficient, | 0.1731 | 0.1903 |
| Cavitation Number at 0.7R, | 2.1611 | 2.2746 |
Disclaimer/Publisher’s Note: The statements, opinions and data contained in all publications are solely those of the individual author(s) and contributor(s) and not of MDPI and/or the editor(s). MDPI and/or the editor(s) disclaim responsibility for any injury to people or property resulting from any ideas, methods, instructions or products referred to in the content. |
© 2022 by the authors. Licensee MDPI, Basel, Switzerland. This article is an open access article distributed under the terms and conditions of the Creative Commons Attribution (CC BY) license (https://creativecommons.org/licenses/by/4.0/).
Share and Cite
Jin, W.-S.; Kim, M.-C.; Kang, J.-G.; Shin, Y.-J.; Lee, K.-W. Optimization of Blade Position on an Asymmetric Pre-Swirl Stator Used in Container Ships. J. Mar. Sci. Eng. 2023, 11, 50. https://doi.org/10.3390/jmse11010050
Jin W-S, Kim M-C, Kang J-G, Shin Y-J, Lee K-W. Optimization of Blade Position on an Asymmetric Pre-Swirl Stator Used in Container Ships. Journal of Marine Science and Engineering. 2023; 11(1):50. https://doi.org/10.3390/jmse11010050
Chicago/Turabian StyleJin, Woo-Seok, Moon-Chan Kim, Jin-Gu Kang, Yong-Jin Shin, and Kyuong-Wan Lee. 2023. "Optimization of Blade Position on an Asymmetric Pre-Swirl Stator Used in Container Ships" Journal of Marine Science and Engineering 11, no. 1: 50. https://doi.org/10.3390/jmse11010050