Article

Waveform Design Using Coprime Frequency-Modulated Pulse Trains for Reverberation Suppression of Active Sonar

1
Institute of Acoustics, Chinese Academy of Sciences, Beijing 100190, China
2
Key Laboratory of Science and Technology on Advanced Underwater Acoustic Signal Processing, Chinese Academy of Sciences, Beijing 100190, China
3
University of Chinese Academy of Sciences, Beijing 100190, China
*
Author to whom correspondence should be addressed.
J. Mar. Sci. Eng. 2023, 11(1), 28; https://doi.org/10.3390/jmse11010028
Submission received: 3 November 2022 / Revised: 24 November 2022 / Accepted: 17 December 2022 / Published: 26 December 2022
(This article belongs to the Special Issue Underwater Acoustics and Digital Signal Processing)

Abstract

:
Over the last two decades, low-frequency active sonar has become an attractive tool for underwater target detection. The reverberation to signal ratio (RSR) of transmitted waveforms is an important factor affecting the detection capability of low-frequency active sonar. Therefore, reasonable waveform design for reverberation suppression of active sonar is an important topic. Pulse trains of linear frequency-modulated (PTFM) waveforms have been proposed and manifested their good performance in suppressing reverberation. The number of sub-pulses is positively related to the reverberation to signal ratio; the lower the number of sub-pulses, the lower the reverberation to signal ratio. However, to avoid ambiguity in a Doppler measurement, the PTFM waveforms have a requirement for the number of sub-pulses to be satisfied, which prevents its reverberation suppression performance from being further improved. In this paper, we propose a coprime pulse train of linear frequency-modulated (CPTFM) waveform, which reduces the number of sub-pulses to some extent. Therefore, the ability of reverberation suppression of the CPTFM waveform can be improved. The RSR was chosen as the metric to evaluate the waveform’s ability to suppress reverberation, and the theoretical formula for the RSR of the CPTFM waveform was derived in zone A and B. With the overlap of zones A and B brought about by the decrease in the number of sub-pulses, the average RSR of zones A and B is used in this paper to evaluate the reverberation suppression ability of the waveform. The simulation experiment shows that the proposed CPTFM waveform decreases the average RSR by 7 dB and 20 dB in comparison to the reference PTFM waveform and continuous waveform (CW), which is consistent with the theoretical results by the derived formulas.

1. Introduction

Low-frequency active sonar (LFAS) has gradually become a powerful tool in underwater detection [1]. Active sonar can obtain the maximum amount of target information through waveform design and can improve the ability of interference suppression. In underwater detection, various tasks are carried out, such as target detection, classification, and so on [2]. With increasing attention paid to active sonar, waveform design has become a hot issue. For various tasks, active sonar can emit signals according to the characteristics of different waveforms.
At present, to perform target detection, continuous waveforms (CWs), linear frequency-modulated (LFM) waveforms [3], and hyperbolic frequency-modulated (HFM) [4] waveforms are mainly used. The CW signal has a fixed frequency and duration. It is a Doppler-sensitive signal, which can measure the Doppler information of the target, and possesses good velocity resolution. LFM and HFM waveforms are Doppler-insensitive, but have good range resolution. In practical application, a Doppler-insensitive waveform can use a replica to match the receiving signal, which can greatly reduce the consumption of computing resources and is more convenient for engineering applications. However, this paper mainly compares the reverberation suppression performance of Doppler-sensitive signals, so Doppler-insensitive signals are not discussed here and their performance is referenced in the literature [1]. Binary phase-shift keying (BPSK) waveforms and Costas waveforms have both good range resolution and velocity resolution, and they can detect the target from the perspectives of velocity and range [2,5]. Yet, the reverberation suppression performance of these pulses is limited, due to the small frequency shift of the target replica spectrum relative to the transmitted bandwidth [1].
To achieve superior target detection of active sonar, reverberation suppression is a problem that must urgently be solved. For reverberation suppression, one method is to use signal processing methods, such as an adaptive pre-whitener based on the AR model [6], a principal component inverse (PCI) algorithm [7], signal subspace extraction (SSE) [8], and the fractional Fourier transform method [9]. Another method for reverberation suppression is to design a reasonable transmitted waveform, which itself has a good ability to inhibit reverberation. The sinusoidal frequency-modulated (SFM) waveform is widely used in radar and was first applied in sonar in paper [10]. The SFM waveform can solve the Doppler information of the target and can suppress reverberation. However, the range resolution of the SFM waveform is poor [10,11,12]. Hague et al. studied a generalization of the SFM waveform, which is known as the generalized SFM (GSFM) waveform [12,13,14]. The ambiguity function of the GSFM waveform approaches a thumbtack shape, which determines the waveform’s ability to detect weak targets in the presence of strong reverberation [12]. Doisy et al. designed the pulse trains of linear frequency-modulated (PTFM) waveforms by making use of the smaller energy of the cross-spectrum between the replica of the comb spectrum signal and the reverberation signal [1,15,16,17]. Experimental research [18] and Q-function analysis [19] show that PTFM waveforms have a good ability to suppress reverberation, compared with CW and HFM waveforms. However, to avoid ambiguity in a Doppler measurement, the PTFM waveform restricts the number of sub-pulses.
In this paper, we propose a coprime pulse train of linear frequency-modulated (CPTFM) waveform to mitigate the reverberation influence, which eliminates the limit of Doppler ambiguity by applying the robust Chinese remainder theorem [20,21,22,23]. Reverberation-to-signal ratio (RSR) is the metric to evaluate the ability of different waveforms to suppress reverberation. This paper proposes the average RSR to evaluate the ability of the CPTFM waveform in suppressing reverberation. The theoretical analysis shows that the average RSR of the CPTFM waveform is 8 dB lower than the reference PTFM waveform. Simulated experiments are conducted to evaluate the capabilities of reverberation suppression and detection of low-speed targets. The average RSR of the simulation experiments remains consistent with the theoretical results.
The remainder of this paper is divided into the following four sections. The Section 2 introduces the concept of a reverberation-to-signal ratio and describes the concept of a reverberation zone. The CPTFM waveform is described in detail in Section 3. In Section 4, the simulation experiment is introduced in detail, and respective RSRs of CW, PTFM, and CPTFM waveforms are compared, and the superior performance of the CPTFM waveform in reverberation suppression is verified from the simulation experiment. Finally, the paper is summarized in Section 5. Note that the idea for this article has been published in a conference paper [24] written by the authors. The contribution of this paper is the detailed derivation of formulas for the different reverberation zones of CPTFM waveforms and the use of average RSR to evaluate the superior performance of CPTFM over CW and PTFM waveforms. The theoretical analysis verifies the reverberation suppression capability of the waveforms used in this paper.

2. PTFM and Its Performance in Different Reverberation Zones

In this section, first, the respective expressions of the reverberation level, signal level, and reverberation-signal ratio are derived through the traditional signal processing method. Second, this section also describes reverberation zones A and B, respectively corresponding to very low and low Doppler targets. This helps to compare the detection ability of different waveforms to targets with different speeds in reverberation-limited environments.

2.1. Reverbaration Theory

In this sub-section, the relevant knowledge of reverberation theory is introduced in detail. First, we derive the general expressions of signal level and reverberation level after the conventional signal processing algorithm (beamforming and matched filtering). This expression is established in Doisy’s paper [1]. The specific process is as follows:
(1)
Normalized beamforming, where b ( θ ) is the array beam pattern of a beam steered in direction θ .
(2)
Matched filtering with a series of normalized Doppler scaled replicas e ( α t ) of transmitted waveform e ( t ) .
The energy of the transmitted signal is defined as follows:
E = 1 2 t | e ( t ) | 2 d t
After beamforming and matched filtering with the replica signal e ( α 0 t ) using the target Doppler, the target signal power received by the array at the target direction θ 0 (reflected from the target) is calculated as follows:
S = | b ( θ 0 ) t | e ( α 0 t ) | 2 d t | 2
The term | b ( θ 0 ) | is the array beam pattern in the direction θ 0 of the target. The final term represents the result of the matched filter. The target Doppler is α 0 = 1 + 2 V c cos θ 0 + 2 V r c , in which V is the sonar speed, V r is the absolute target radial speed, θ 0 is the bearing of the target relative to a sonar platform, and c is the speed of sound in water.
The reverberation level after beamforming and matched filtering with the replica signal e ( α 0 t ) using the target Doppler is represented by the following:
R R = θ = 0 2 π | b ( θ ) | 2 [ t | C α θ , α 0 ( t ) | 2 d t ] d θ
where C α θ , α 0 is the result of the matched filter between the replica matched to the target Doppler and the reverberation scatters in direction θ . The result of the matched filter of the replica signal e ( α 0 t ) and the reverberation signal in direction θ is given by the following:
C α θ , α 0 ( t ) = u e ( α θ u ) e ( α 0 ( u + t ) ) * d u
where α θ = 1 + 2 V c cos θ is Doppler of the scatter, and V is the speed of the towed linear array.
In the noise-limited environment, the higher the energy of the transmitted signal is, the higher the SNR will be. In the reverberation-limited environment, this is not the case. Therefore, simply increasing the energy of the transmitted signal does not improve the detection capability. The main purpose of waveform design is to minimize the RSR, in turn improving the detection capability in reverberation-limited situations. The RSR is shown in the following formula [1]:
RSR = θ 2 π | b ( θ ) | 2 [ t | C α θ , α 0 ( t ) | 2 d t ] d θ | b ( θ 0 ) t | e ( α 0 t ) | 2 d t | 2
By applying Parseval’s theorem, the formula can be converted to the frequency domain, and RSR expressions can be changed as follows:
RSR = θ 0 2 π | b ( θ ) | 2 [ f | E θ ( f ) E 0 ( f ) | 2 d f ] d θ S
where E ( f ) is the spectrum of the transmitted waveform.
E 0 ( f ) =   e ( α 0 t ) e i 2 π f t d t
E θ ( f ) =   e ( α 0 t ) e i 2 π f t d t

2.2. Pulse Train of Frequency-Modulated Waveform

The PTFM waveform has a sub-pulse length T 0 , bandwidth B, and central frequency f 0 , and the number of sub-pulses is N. The PTFM waveform can be described as follows:
e ( t ) = n = 0 N sin 2 ( π n N ) p ( t n T 0 )
where
p ( t ) = exp ( i 2 π t [ f 0 + B t 2 T 0 ] ) , for   0 t T 0 = T N
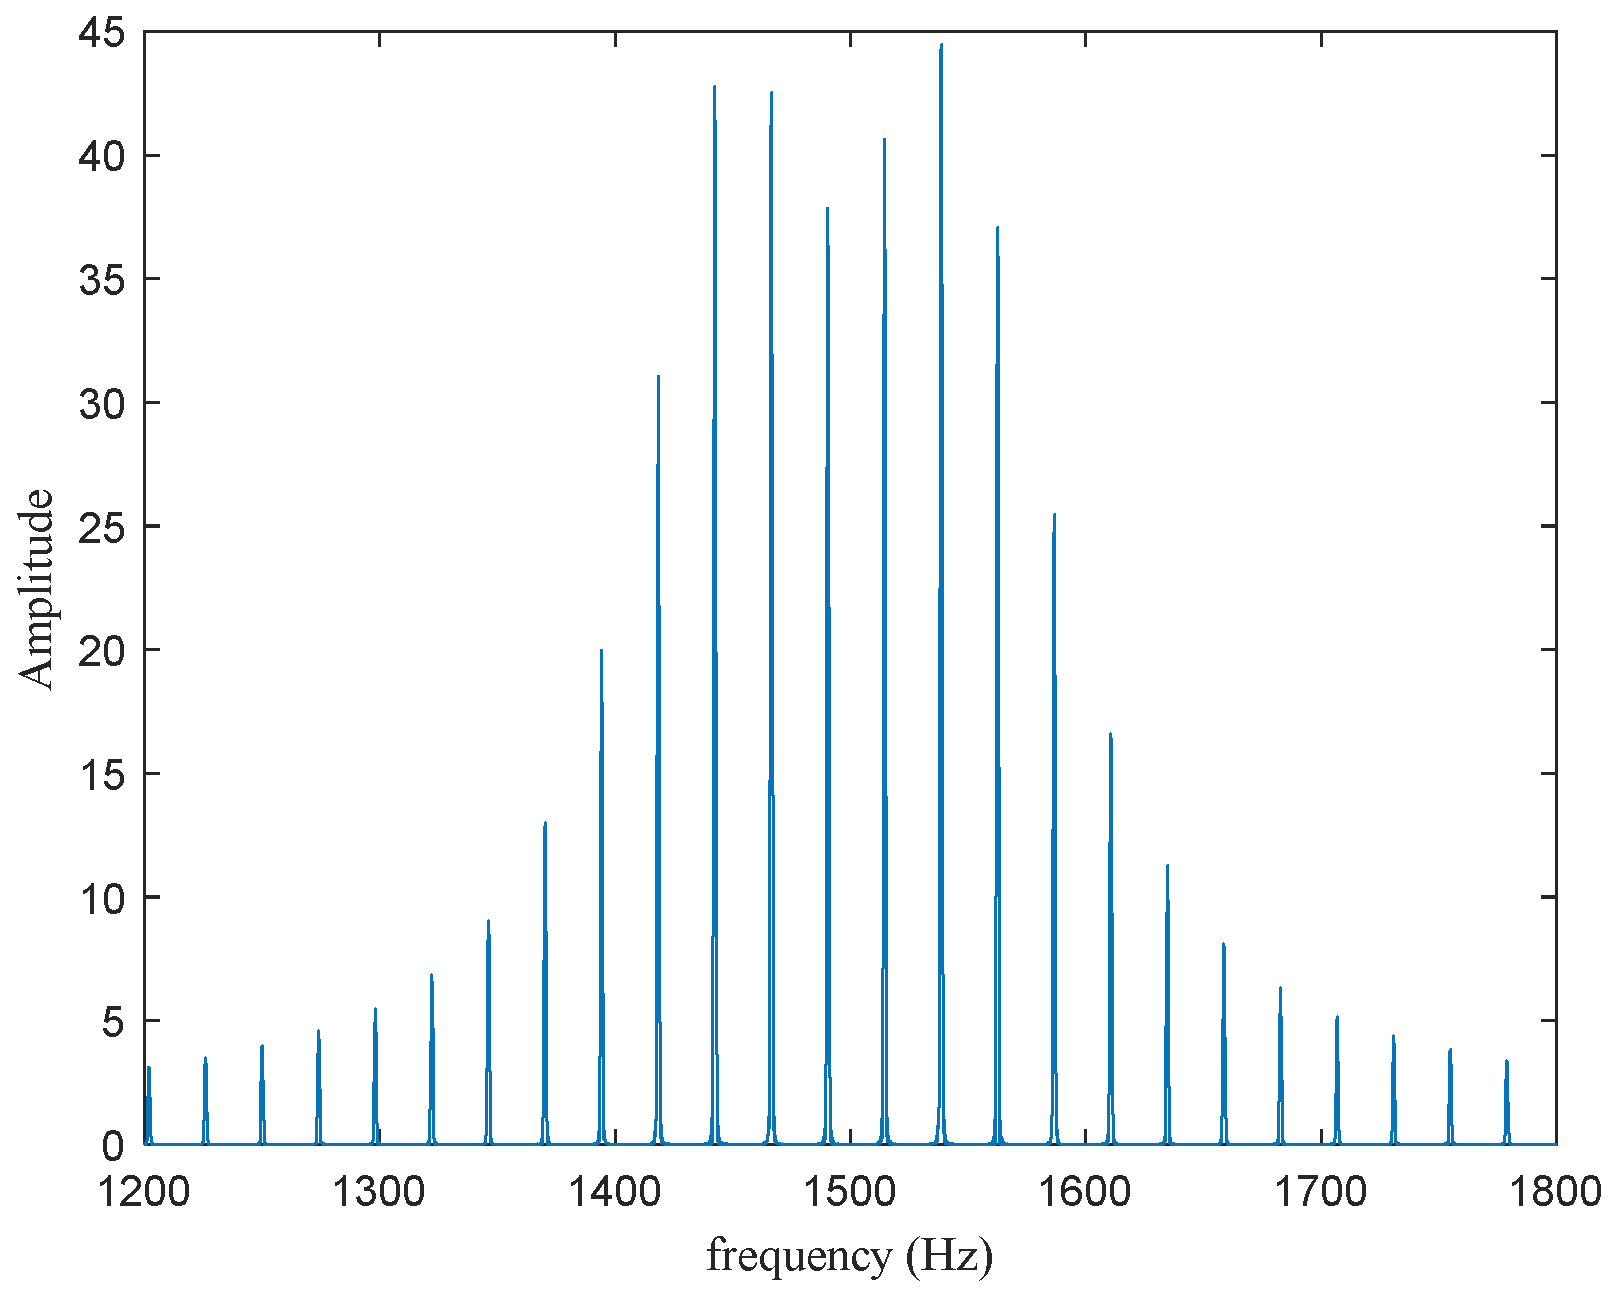
Figure 1 depicts the spectrum of a PTFM signal with a shading function sin2. The spectrum consists of several lines at the frequency f m = m / T 0 , f 0 B / 2 f m f 0 + B / 2 
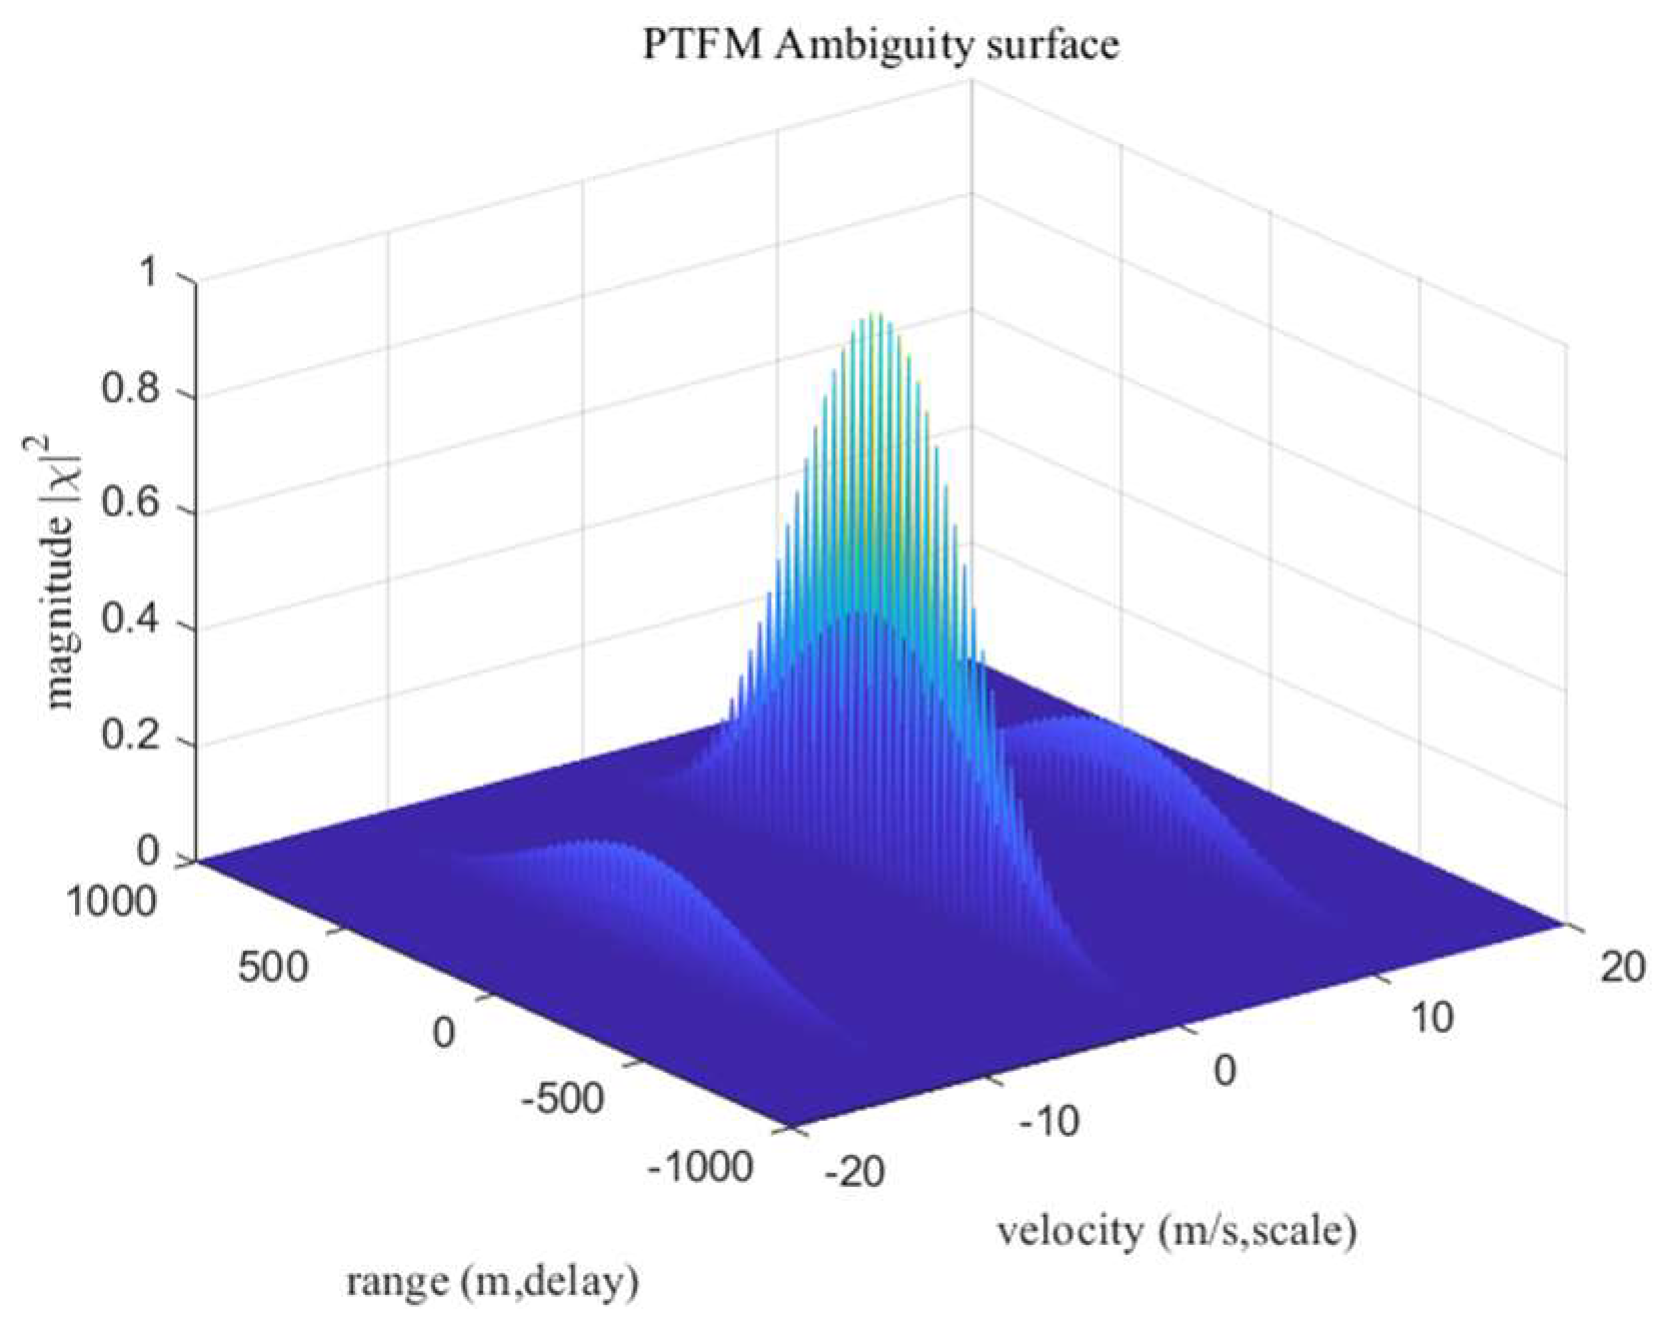
, which is comb-shaped. The ambiguity function of a PTFM waveform is shown in Figure 2, and there is an obvious trick in the ambiguity function. Since the volume under the ambiguity surface is one, it can be seen from Figure 2 that the high-Doppler target has a raised peak, thus the low-Doppler target has a lower side lobe near it. Compared with the CW and HFM waveforms, the PTFM waveform has a better ability to detect low-speed targets.
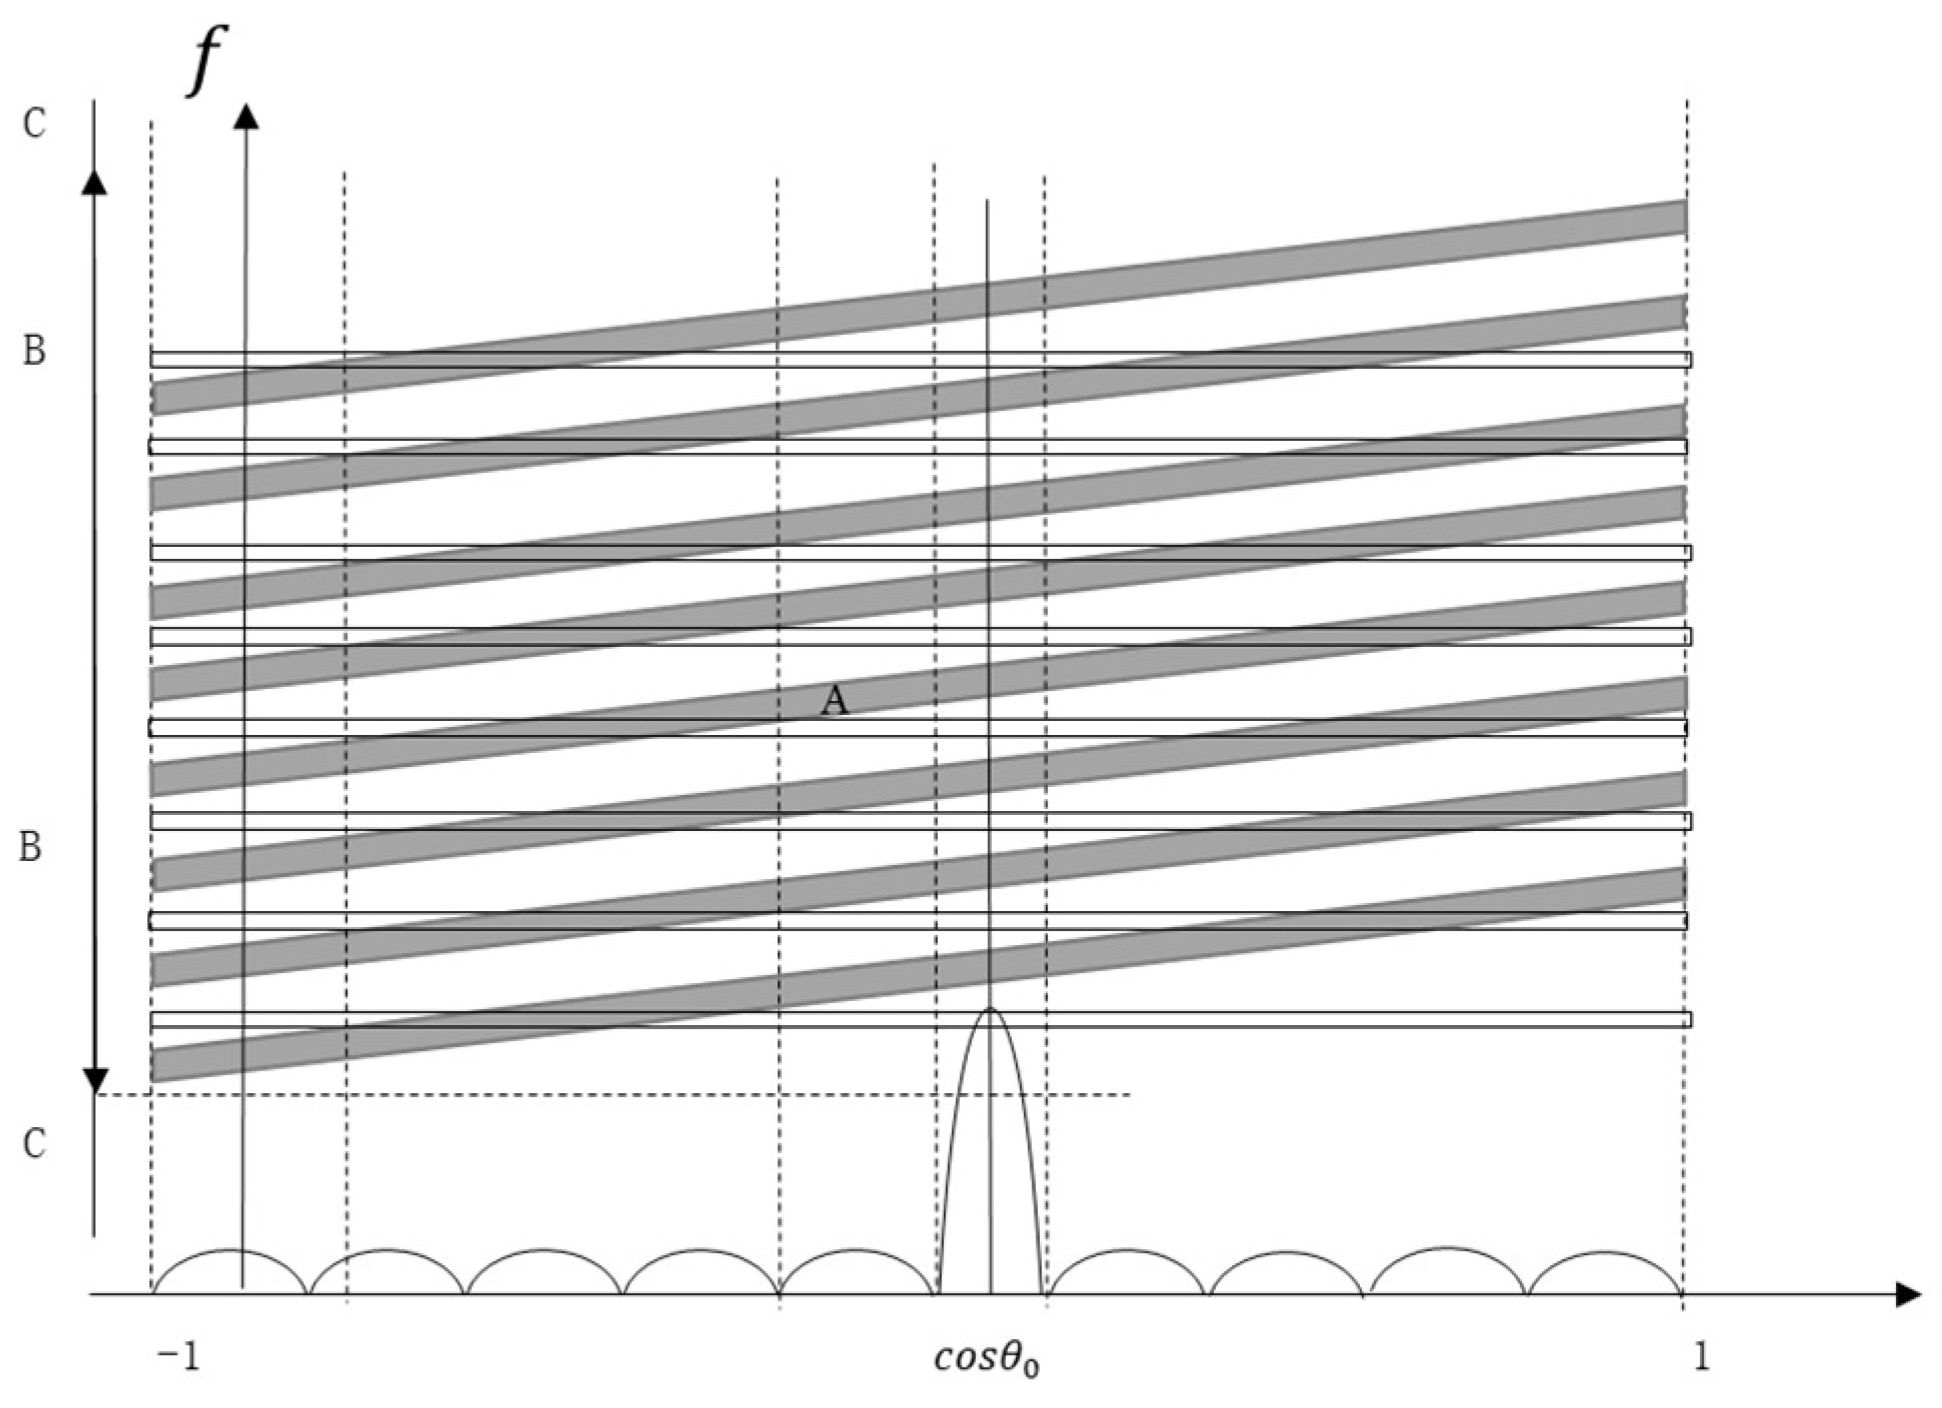
The reverberation level of the PTFM waveform based on the integral (3) is shown in Figure 3. The vertical axis is the frequency and the horizontal axis is the cosine of the bearing ( cos θ ), while the reverberation spectrum of a PTFM waveform corresponds to the comb lines in this representation, described by the following:
f = f m ( 1 + 2 V c cos θ )
The reverberation zone can be divided into three zones: A, B, and C, which respectively correspond to very low, low, and high Doppler targets in Figure 3. Very low Doppler targets (zone A) signify that their Doppler shift falls within the Doppler spread of reverberation in the main lobe of the beam pattern. In zone A, the target and scatterer cannot be distinguished from the Doppler shift information. Low Doppler targets (zone B) are such that their Doppler shift matches the Doppler shift of scatters within the sidelobes of the beam pattern. High Doppler targets (zone C) are those in which scatter Doppler shift does not match the target’s Doppler shift.
Due to the comb spectrum of the PTFM waveform, the cross-spectrum between the replica and reverberation appears in multiple directions. The number of the overlaps in the cross-spectrum is equal to M = ceil ( 4 V T N λ 0 ) derived by Doisy. The specific expressions of the target radial speed range and RSR in different zones of the PTFM waveform have been derived. These formulas are only introduced in brief in this paper. The zones are introduced in the following part. V is the sonar speed and V r is the absolute target radial speed.
  • Zone A: The range of target speed for a PTFM waveform in zone A is:
    V β λ 0 L 2 λ 0 T V r V β λ 0 L + 2 λ 0 T
    where β is the coefficient dependent on the array shading, λ 0 is the waveform length, and L is the length of the linear received array. The expression of RSR for Hamming and sin2 pulse shadings in zone A is:
    RSR 1 2 2 θ 3 N B  
    where 2 θ 3 is the −3 dB width of the main lobe of the beam pattern.
  • Zone B: The range of target speed for a PTFM waveform in zone B is:
    V β λ 0 L + 2 λ 0 T ( Zone   A   boundary ) V r V ( 1 cos θ 0 ) + 2 λ 0 T ( Zone   C   boundary ) V ( 1 + cos θ 0 ) 2 λ 0 T ( Zone   C   boundary ) V r V β λ 0 L 2 λ 0 T ( Zone   A   boundary )
This zone is the closest situation to real anti-submarine warfare. The RSR in zone B is represented by the following:
RSR = 1 2 N B Δ θ 10 SLL 10
where Δ θ corresponds to the angular interval of overlap between the replica and reverberation spectra. The frequencies of the scatters in this interval matches the target Doppler channel. The SLL is the average beam sidelobe level over the angular interval Δ θ . In order to avoid ambiguity in a Doppler measurement, Doisy restricts the discussion to the case M = 1 . Therefore, the number of sub-pulse waveforms needs to satisfy N = 4 V T λ 0 .
3.
Zone C: The target speed range in zone C is:
V ( 1 + cos θ 0 ) 2 λ 0 T V r V ( 1 cos θ 0 ) + 2 λ 0 T
No scatterer’s Doppler in zone C matches the Doppler of the target. The RSR for zone C for sin2 shading is:
RSR 1 2 N B 2 θ 3 10 SSLL 10
where SSLL is the spectral sidelobe level.
According to the expression, the RSR of PTFM is directly related to the number of sub-pulse waveforms. To avoid Doppler ambiguity, PTFM limits the number of sub-pulses. In this paper, a new waveform, CPTFM, is proposed to solve the problem of ambiguity velocity to some extent and improve the reverberation suppression ability. The RSRs of CPTFM in zone A and B are derived in detail.

3. CPTFM Waveform

To avoid ambiguity in a Doppler measurement and obtain the best performance in zone B, the PTFM waveform restricts the number of sub-pulses N = 4 V T λ 0 . However, the RSR in zone B depends heavily on the number of sub-pulses N . In this paper, we propose a waveform, coprime pulse train of frequency-modulated (CPTFM), and take advantage of the Chinese remainder theorem to obtain Doppler information of the target. Therefore, there is no need to place a limit on the number of the sub-pulses like PTFM, which has a very important impact on the reverberation level of the signal, so good reverberation suppression performance is achieved. In this section, the waveform we proposed is described in detail.

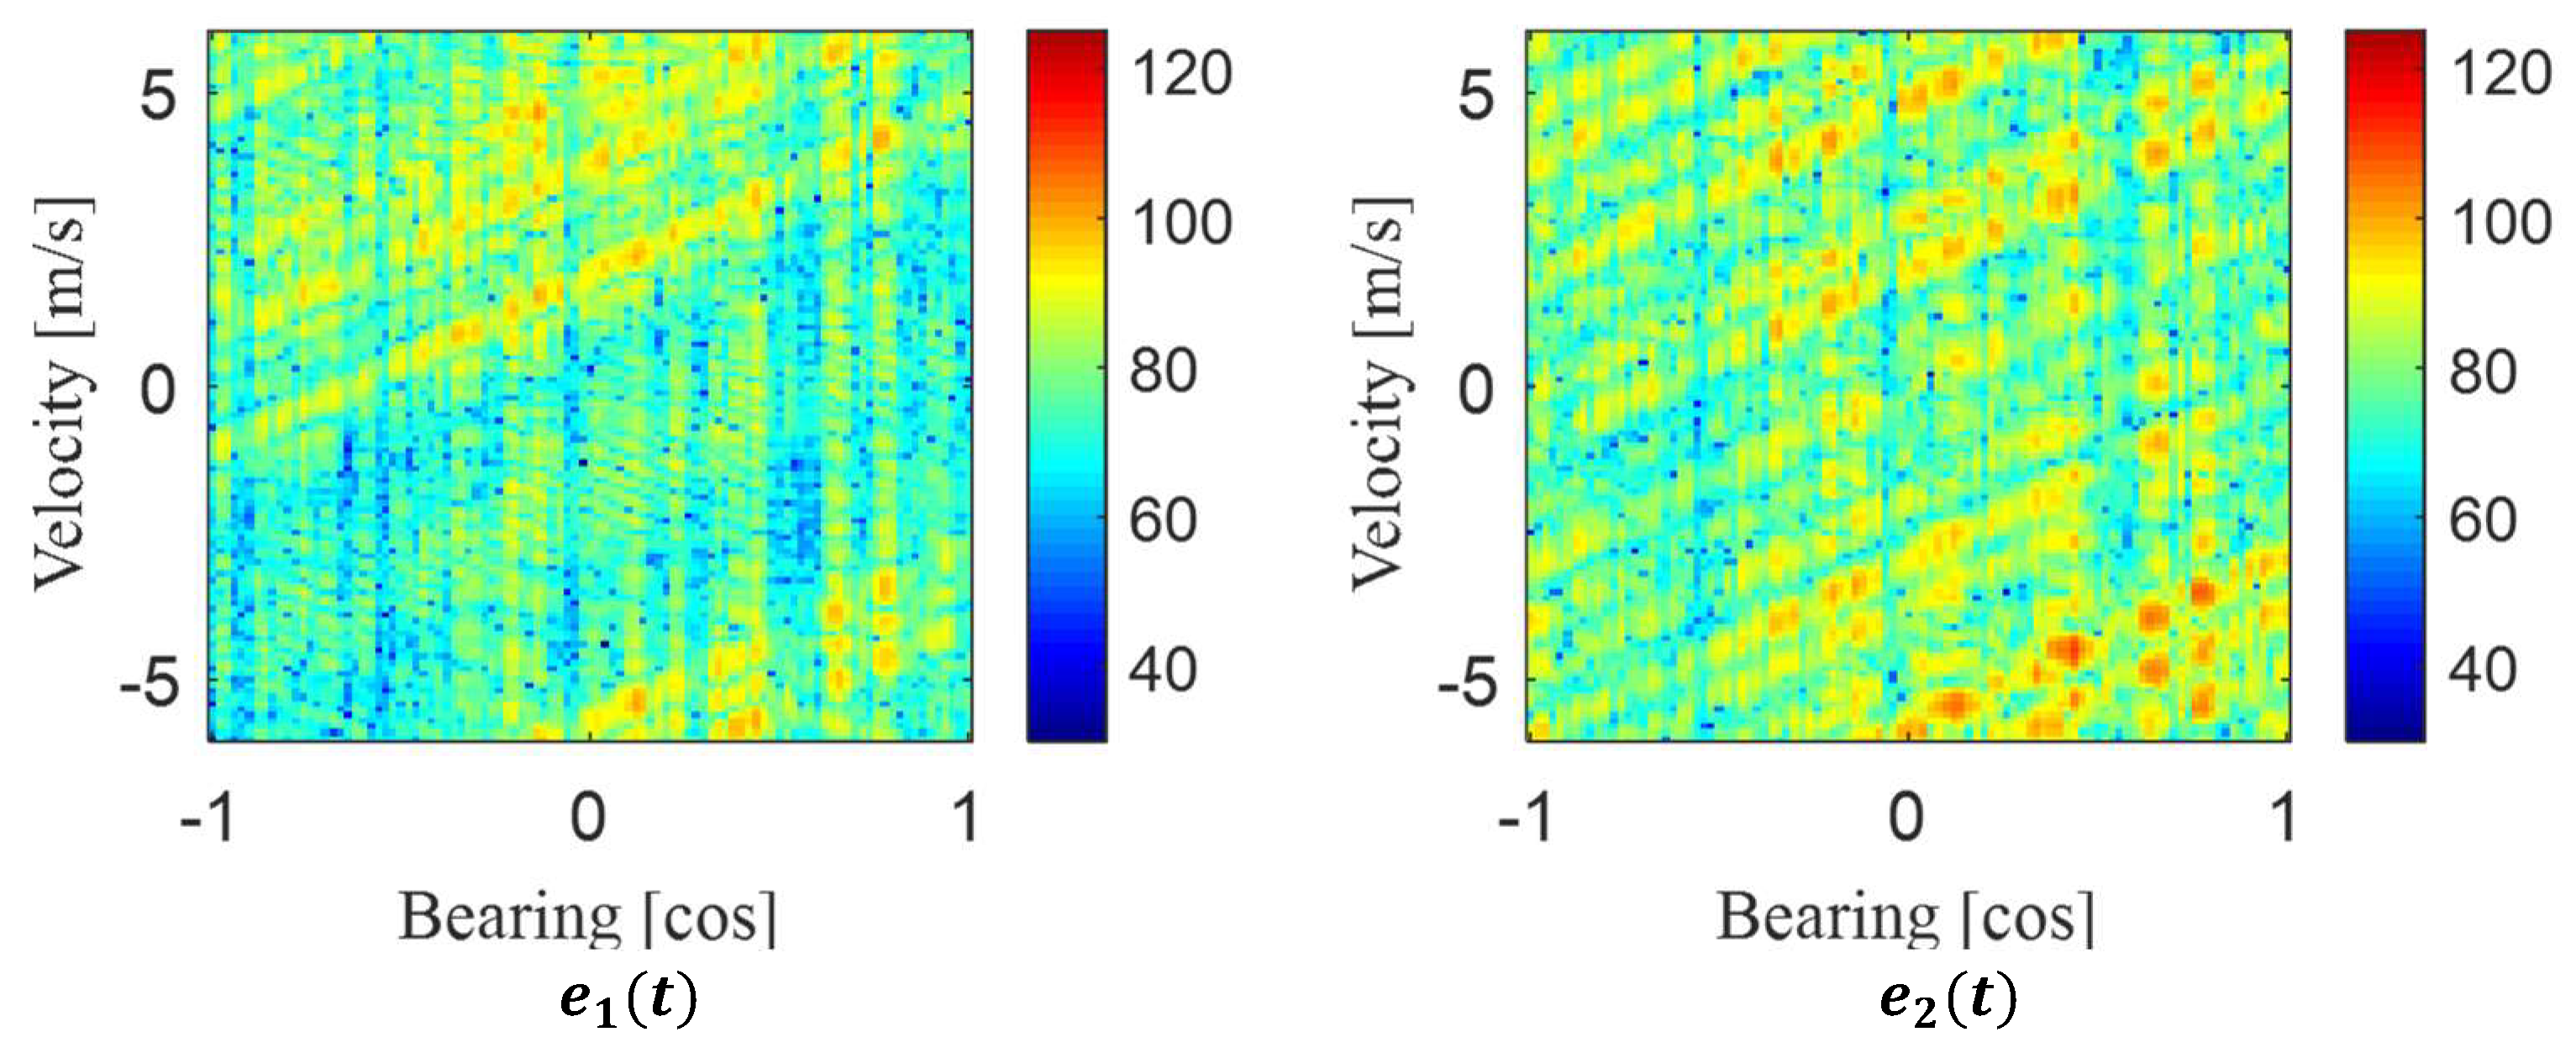
3.1. Coprime Pulse Trains of Frequency-Modulated Waveform

The proposed waveform is composed of two sub-waveforms with low and coprime ambiguity velocities. Two sub-waveforms can simultaneously provide two independent ambiguity velocity measurements. By applying the robust Chinese remainder theorem, the velocity ambiguity is resolved from the two independent measurements [23,25]. The focus of this paper is reverberation suppression, and the specific formula of velocity ambiguity is not considered. Our proposed waveform for active sonar is written as follows:
e ( t ) = e 1 ( t ) + e 2 ( t )
where e 1 ( t )   and e 2 ( t ) are the two orthogonal coprime sub-waveforms. The lengths of the two sub-waveforms are T 1 and T 2 , and their central frequencies are f 1 and f 2 , respectively. Their bandwidth B settings are the same. Therefore, e 1 ( t ) can be written as shown below:
e 1 ( t ) = n = 0 N 1 sin 2 ( π n N 1 ) p ( t n T 1 )
where
p ( t ) = exp ( i 2 π t [ f 1 + B t 2 T 1 ] ) , for   0 t T 1 = T N 1
where N 1 = r o u n d ( T / T 1 ) is the number of p ( t ) in e 1 ( t ) . Next, e 2 ( t ) can be written as
e 2 ( t ) = n = 0 N 2 sin 2 ( π n N 2 ) p ( t n T 2 )
where
p ( t ) = exp ( i 2 π t [ f 2 + B t 2 T 2 ] ) ,   for   0 t T 2 = T N 2
where N 2 = r o u n d ( T / T 2 ) is the number of p ( t ) in e 2 ( t ) .
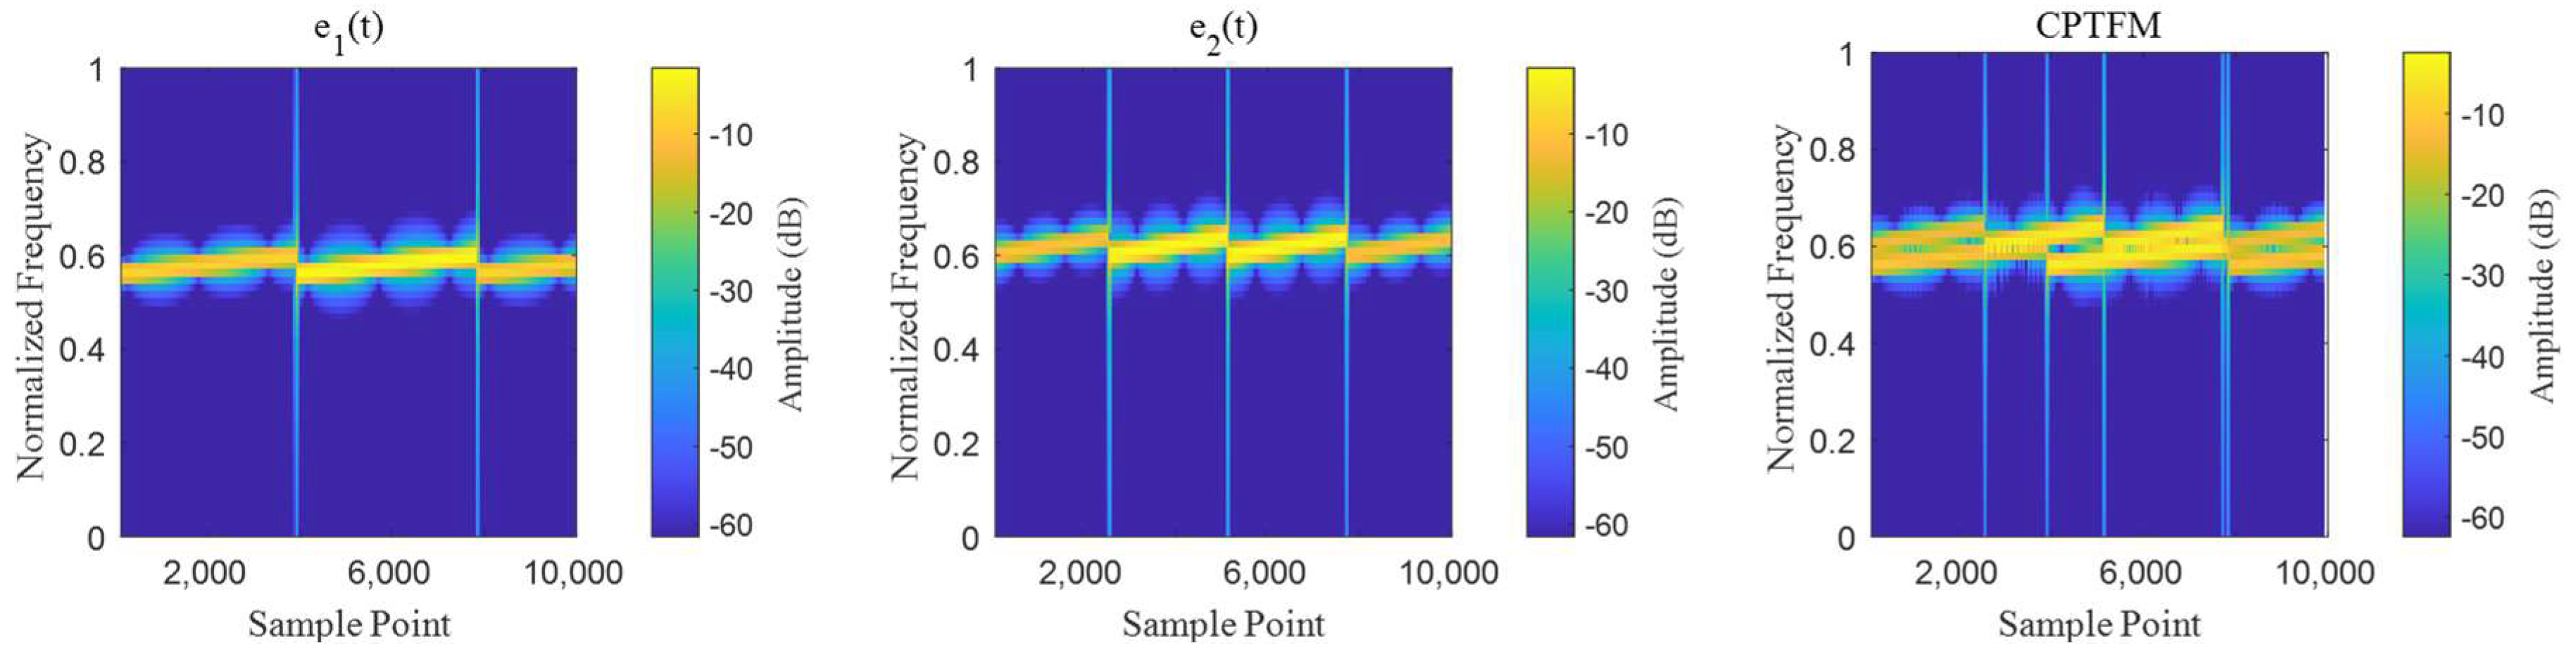
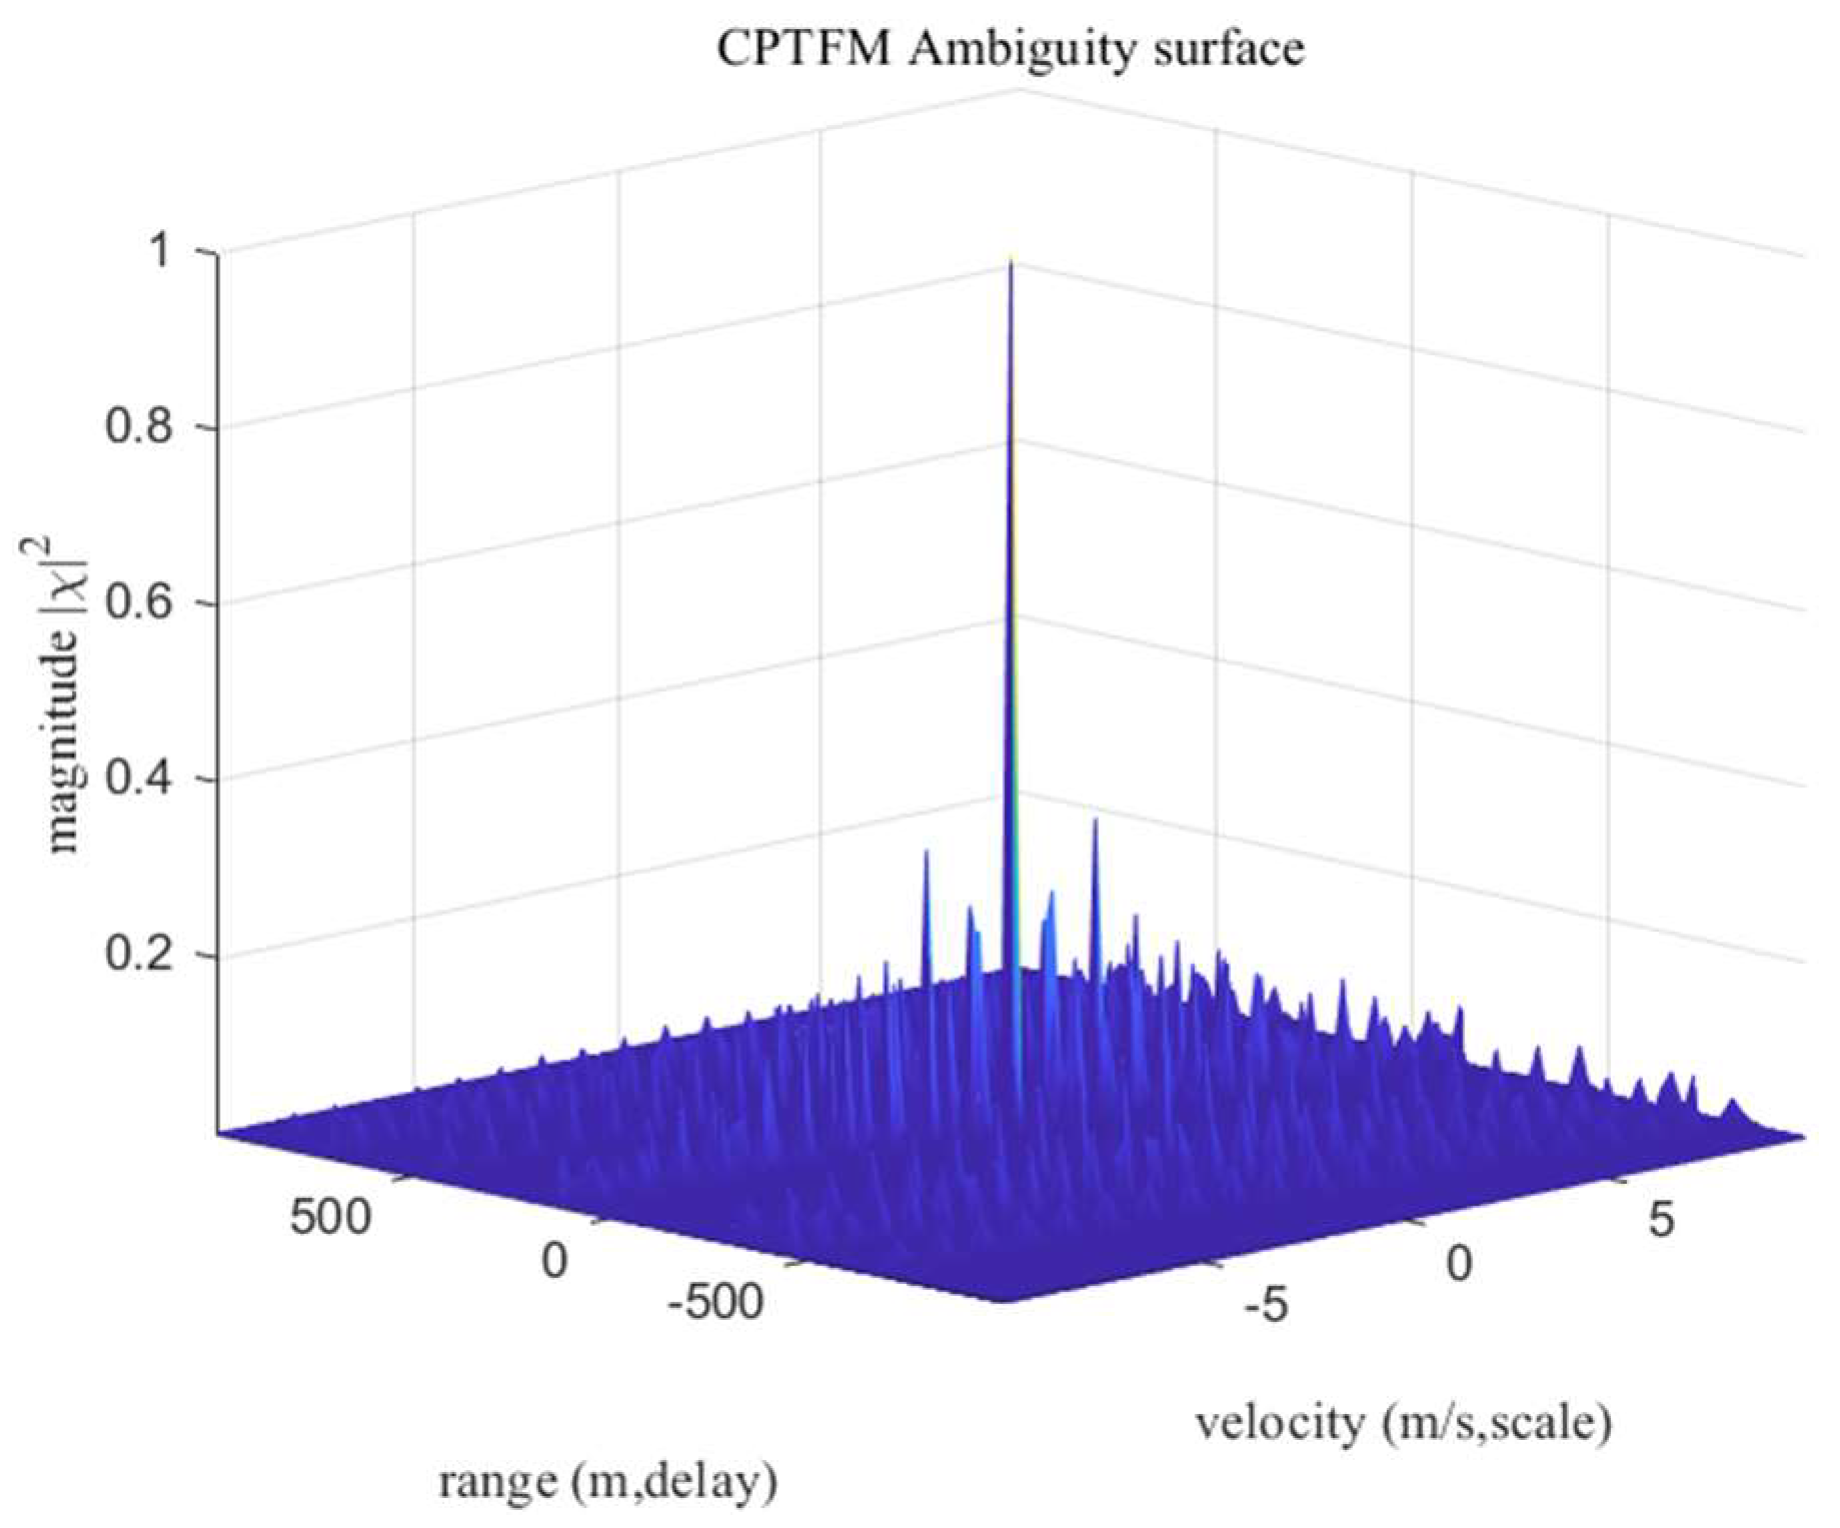
The time-frequency diagram of the CPTFM waveform is shown in Figure 4. The number of sub-pulses of the two sub-waveforms is coprime. The ambiguity function of this waveform has a shape that resembles a thumbtack and has more sensitive Doppler resolution and range resolution than PTFM shown in Figure 5. Simply viewed from the perspective of ambiguity surface, CPTFM has a strong ability to suppress reverberation and improve the detection ability for low Doppler targets.

3.2. Limitation of Ambiguity Velocity

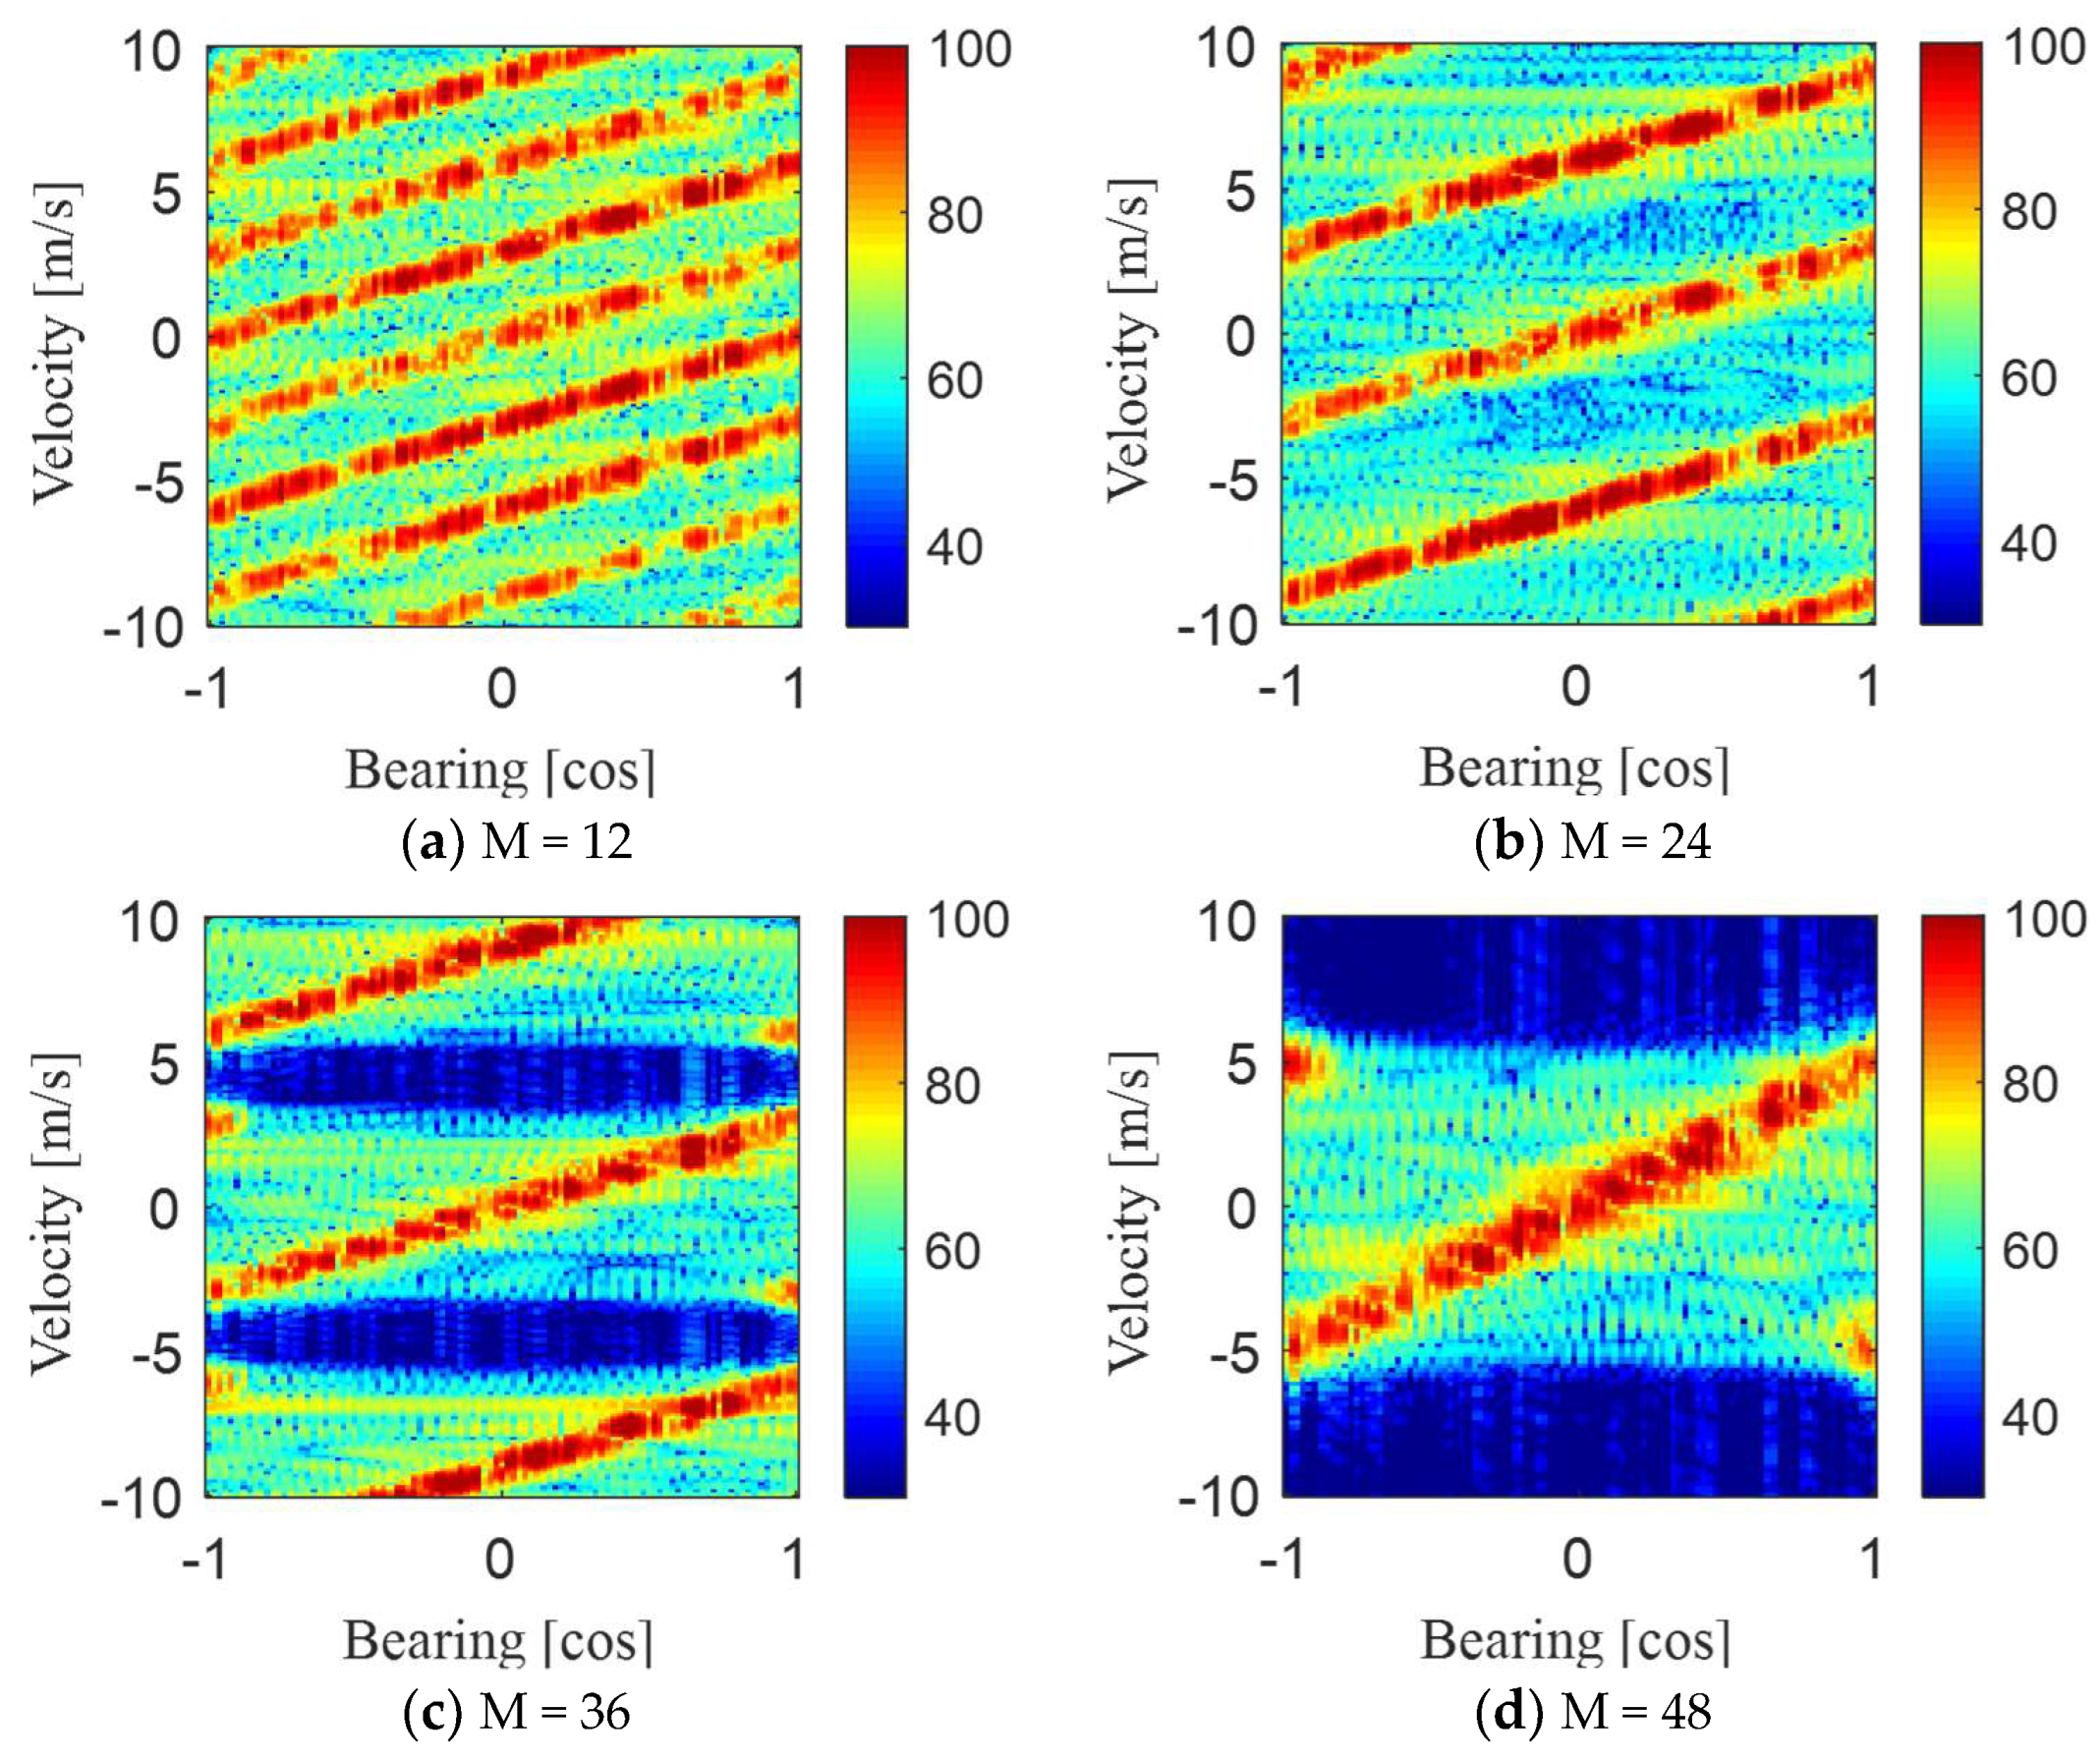
Due to the comb shape of the PTFM spectrum, the cross-spectrum of the target and reverberation originates from multiple directions. The angular interval between these directions is N λ 0 / 2 V T . The number of overlap spectra is M = c e i l ( 4 V T N λ 0 ) . When M 1 , the Doppler ambiguity phenomenon occurs, as shown in Figure 6. As can be seen, the reverberation zone gradually exhibits Doppler ambiguity as the number of sub-pulses decreases. If the energy of the target is less than the reverberation, then it would be difficult to distinguish the target from the reverberation or to obtain the Doppler velocity of the target. Therefore, to avoid such a situation, Doisy only discussed the reverberation suppression performance of the PTFM waveform for the case M = 1 . According to the previous sections, however, RSR shows a positive correlation with the number of sub-pulses, and limiting the number of sub-pulses also limits the reverberation suppression capability to some extent. As can be seen from the figure, as the number of sub-pulses decreases, the reverberation level in zone A is gradually decreasing and therefore the detection of targets in this zone is improved. For CPTFM, it is not necessary to satisfy the above equations. The robust Chinese remainder theorem is used to solve the problem of Doppler ambiguity. At the same time, the target in zone A is distinguished easily.
The ambiguity velocity of e 1 ( t ) is expressed as follows:
V a m 1 = c 4 f 1 T 1
V a m 2 = c 4 f 2 T 2
where f 1 and f 2 are the central frequency of the two sub-pulse signals, and T 1 and T 2 are the pulse width of the two sub-pulse signals. The maximum ambiguity velocity of our proposed signal is:
V m a x = V a m 1 Γ 2 = V a m 2 Γ 1
V a m 1 V a m 2 = Γ 1 Γ 2
where Γ 1 and Γ 2 are two integers and coprime.
This paper does not deal with the specific Doppler solution problem, but focuses on the reverberation suppression performance of the waveform. Only the maximum ambiguity velocity of the CPTFM waveform is required to meet the actual usage requirements, and this paper focuses on analyzing how the corresponding reverberation suppression capacity of this waveform changes when the number of sub-pulses decreases.

3.3. Reverberation Zones of CPTFM

3.3.1. Zone A

The CPTFM signal consists of two PTFM waveforms. Each sub-waveform has its own corresponding zone A, and their ranges of target radial speed are as follows:
( 1 + 2 V cos ( θ 0 ) c + 2 V r c ) f 1 2 T ( 1 + 2 V cos ( + ) ( θ 0 ) c ) f 1 + 2 T ± 2 k 1 N 1 T ,   for   e 1 ( t ) ( 1 + 2 V cos ( θ 0 ) c + 2 V r c ) f 1 + 2 T ( 1 + 2 V cos ( ) ( θ 0 ) c ) f 1 2 T ± 2 k 1 N 1 T ,   for   e 1 ( t ) ( 1 + 2 V cos ( θ 0 ) c + 2 V r 2 c ) f 2 2 T ( 1 + 2 V cos ( + ) ( θ 0 ) c ) f 2 + 2 T ± 2 k 2 N 2 T ,   for   e 2 ( t ) ( 1 + 2 V cos ( θ 0 ) c + 2 V r 2 c ) f 2 + 2 T ( 1 + 2 V cos ( ) ( θ 0 ) c ) f 2 2 T ± 2 k 2 N 2 T ,   for   e 2 ( t )
where k 1 and k 2 are nonnegative integers, k 1 = 0 , 1 , M 1 1 ,   k 2 = 0 , 1 , M 2 1 ,   M 1 = c e i l ( 4 V T N 1 λ 0 ) ,   M 2 = c e i l ( 4 V T N 2 λ 0 ) . For optimal performance in zone B, PTFM restricts the number of overlaps, so that k = 0 . However, for the designed CPTFM waveform, the number of overlaps has no restriction. In this case, the target speed range associated with zone A is simplified as follows:
V β λ 0 L 2 λ 0 T ± k 1 N 1 T λ 0 V r 2 λ 0 T + V β λ 0 L ± k 1 N 1 T λ 0 , for   e 1 ( t ) V β λ 0 L 2 λ 0 T ± k 2 N 2 T λ 0 V r 2 λ 0 T + V β λ 0 L ± k 2 N 2 T λ 0 , for   e 2 ( t )
For a CPTFM signal, the signal energy is S = 2 ( 3 T 8 ) 2 . Since the sub-waveform of the CPTFM waveform is a PTFM waveform, the sub-pulse of the PTFM waveform is a linear frequency modulation signal, with the respective durations of T p 1 and T p 2 , and the same band-width B / 2 . Therefore, the spectrum amplitude of the CPTFM among the frequency bandwidth B is as follows:
| E 0 ( f ) | 2 T p 1 B 2 [ n = 0 N 1 sin 2 ( π n N 1 ) e i 2 π f n T p 1 ] 2 ,   f 0 B 2 f f 0 | E 0 ( f ) | 2 T p 2 B 2 [ n = 0 N 2 sin 2 ( π n N 2 ) e i 2 π f n T p 2 ] 2 ,   f 0 f f 0 + B 2
The formula for the square amplitude of the spectrum at frequency f m is as follows:
| E 0 ( f m ) | 2 T N 1 B 2 ( N 1 2 ) 2 = T N 1 2 B ,   f 0 B 2 f m f 0 | E 0 ( f m ) | 2 T N 2 B 2 ( N 2 2 ) 2 = T N 2 2 B ,   f 0 f m f 0 + B 2
The square amplitude of the overlapped spectrum between the reverberation and replica signals is:
f | E θ ( f ) E 0 ( f ) | 2 d f = ( T N 1 2 B ) 2 B 2 N 1 + ( T N 2 2 B ) 2 B 2 N 2 = T 2 8 B ( N 1 + N 2 )
Based on Formula (31), the RSR for zone A is determined by the following formula:
R S R 4 9 2 θ 3 N 1 + N 2 B 1 2 2 θ 3 ( N 1 + N 2 ) B

3.3.2. Zone B

In this zone, the replica spectral crosses with the reverberation spectral in several directions. These directions add up to the total reverberation strength. In this case, the target radial speed associated with zone B for e 1 ( t ) and e 2 ( t ) is calculated as follows:
V β λ 0 L + 2 λ 0 T ± k 1 N 1 T λ 0 V r 2 λ 0 T + V ( 1 cos θ 0 ) ± k 1 N 1 T λ 0 , for   e 1 ( t ) V ( 1 + cos θ 0 ) 2 λ 0 T ± k 1 N 1 T λ 0 V r 2 λ 0 T V β λ 0 L ± k 1 N 1 T λ 0 , for   e 1 ( t ) V β λ 0 L + 2 λ 0 T ± k 2 N 2 T λ 0 V r 2 λ 0 T + V ( 1 cos θ 0 ) ± k 2 N 2 T λ 0 , for   e 1 ( t ) V ( 1 + cos θ 0 ) 2 λ 0 T ± k 2 N 2 T λ 0 V r 2 λ 0 T V β λ 0 L ± k 2 N 2 T λ 0 , for   e 2 ( t )
For CPTFM, the number of pulses is no longer a limiting factor. We can keep CPTFM and PTFM in the same bandwidth B (the bandwidths of the two sub-waveforms are set to B/2, so that the entire bandwidth of the waveform is B), and duration T. At the same time, the ambiguity velocity of both waveforms is guaranteed to be almost identical, reducing the number of CPTFM sub-pulses for better reverberation suppression. The RSR of zone B is determined as follows:
RSR 1 2 Δ θ ( N 1 + N 2 ) B 10 S L L 10
Average RSR zone: With the decrease of pulse number, the Doppler ambiguity phenomenon gradually occurs. The CPTFM waveform is composed of two sub-waveforms, and the number of pulses of each sub-waveform is small. Consequently, there is a repetition phenomenon between zones A and B, and zone C gradually disappears. The reverberation suppression ability of the waveform proposed in this paper cannot be compared by using the RSRs in zones A and B alone. To better evaluate the ability of waveforms to suppress reverberation, the concept of average RSR in zones A and B is proposed in this paper. According to the radial speed range of zones A and B described in the preceding sections, the formulas of the average RSR for CW, PTFM, and CPTFM waveforms are defined as follows:
R S R C W , a v e = T 2 2 θ 3 2 V A + T 2 Δ θ 10 S L L 10 V B 2 V A 2 θ 3 + V B Δ θ = T 2 2 V A + T 2 10 S L L 10 V B Δ θ 2 θ 3 2 V A + V B Δ θ 2 θ 3 T 2 2 V A + T 2 10 S L L 10 V B 2 V A + V B
R S R P T F M , a v e = 1 2 N B 2 θ 3 2 V A + 1 2 N B Δ θ 10 S L L 10 V B 2 V A 2 θ 3 + V B Δ θ = 1 2 N B 2 V A + 1 2 N B 10 S L L 10 V B Δ θ 2 θ 3 2 V A + V B Δ θ 2 θ 3 1 2 N B 2 V A + 1 2 N B 10 S L L 10 V B 2 V A + V B
R S R C P T F M , a v e = 1 2 N 1 B 2 θ 3 2 V A M 1 + 1 2 N 2 B 2 θ 3 2 V A M 2 + 1 2 N 1 B Δ θ 10 S L L 10 V B M 1 + 1 2 N 2 B Δ θ 10 S L L 10 V B M 2 2 V A 2 θ 3 + V B Δ θ = 1 2 B 2 θ 3 2 V A ( M 1 N 1 + M 2 N 2 ) + 1 2 B Δ θ 10 S L L 10 V B ( M 1 N 1 + M 2 N 2 ) ( 2 V A 2 θ 3 + V B Δ θ ) ( M 1 + M 2 ) 1 2 B 2 V A ( M 1 N 1 + M 2 N 2 ) + 1 2 B 10 S L L 10 V B ( M 1 N 1 + M 2 N 2 ) ( 2 V A + V B ) ( M 1 + M 2 )
where V A = ( V β λ 0 L + 2 λ 0 T ) , V B = ( V ( 1 cos θ 0 ) + 2 λ 0 T V β λ 0 L 2 λ 0 T ) are the Doppler ranges of zones A and B. Combining the bearing information, the areas of zone A and zone B can be derived and the average RSR of the two zones can be obtained. In Table 1, the average RSRs of CPTFM, CW, and PTFM waveforms are summarized.

4. Simulation

In this section, the simulation results of CPTFM are compared with other classical waveforms (CW and PTFM). After observation, it is shown that CPTFM exhibits superior performance in detecting low Doppler targets than the other waveforms in high-reverberation backgrounds.

4.1. Simulation Parameter Configuration

Assuming a homogeneous distribution of scatters in a plane of the array, the Doppler shift of the reflected echo of a scatterer is set as α θ = 1 + 2 V c cos θ ,     θ ( 0 ° , 180 ° ) . The time delay from the scatterer is also uniformly distributed in each direction. Therefore, the simulated reverberation signal received by the array conforms to the following expression:
R e v = θ τ e ( α θ ( t τ ) )
The Doppler shift of the target is set as α θ 0 = 1 + 2 V c cos θ 0 + 2 V r c , where θ 0 is the bearing of the target. The target velocity V r is set as 1 m/s, and τ 0 is the time delay of the reflected target echo, τ 0 = 2 in this simulation. The simulated target signal is:
T a r = e ( α θ 0 ( t τ 0 ) )
The simulated received signal is:
S i g = R e v + T a r
During the simulation, several pulse types are simulated to compare their performance under the (almost) same parameters. In the following subsections, diverse waveforms and their parameters are described.
  • CW pulse: The pulse duration of the CW pulse was 2 s. The frequency of the CW pulse was set at 1500 Hz. This pulse had a high Doppler resolution at the expense of a very poor range resolution.
  • PTFM pulse: During this simulation, the PTFM pulse, centered at 1500 Hz, consisted of 48 LFM sub-pulses with a duration of 2 s. The bandwidth of the signal was 200 Hz.
  • CPTFM pulse: The proposed waveform in this article has two sub-waveforms, namely e 1 ( t )   and   e 2 ( t ) . We set the center frequencies f 1   and   f 2 of   e 1 ( t )   and   e 2 ( t ) to be 1450 Hz and 1550 Hz, respectively. Both the bandwidths B 1   and   B 2   of   e 1 ( t )   and   e 2 ( t ) were 100 Hz. The ambiguity velocity V a m 1   and   V a m 2   of e 1 ( t )   and   e 2 ( t ) were set to 0.33 m/s and 0.47 m/s. The duration of e 1 ( t )   and   e 2 ( t ) were set to 2 s. These setup parameters of the two sub-waveforms were chosen to guarantee that our proposed waveform had the same center frequency and bandwidth as the other waveforms (CW and PTFM), thus making them comparable. Considering the values of V a m 1 , V a m 2 , f 1   and   f 2 , the number of repetitions of e 1 ( t )   and   e 2 ( t ) were observed to be three and four. The waveforms used for e 1 ( t )   and   e 2 ( t ) were PTFM in our design. The reverberation zone generated by the two sub-waveforms alone is shown in Figure 7. It can be clearly seen that zones A and B overlap, which is consistent with the theoretical analysis discussed previously. In the case of ensuring the same energy of CPTFM and e1 and e2, the use of the CPTFM waveform can make the overlapping A and B zones produce lower reverberation level, which is more favorable to the detection of targets in the reverberation-limited environment.

4.2. Theoretical Gain

In the simulation, it is assumed that the space of array elements is half–wavelength d = 0.5   m , the array has 64 array elements, and the array length is 31.5   m . Based on the simulation information, the theoretical average RSR of the transmitted signal in zones A and B is calculated. Due to the fact that the performance in zone B depends on the output of the beamform, the sidelobe measurements in Doisy’s paper are used in this simulation. Table 2 shows the superior theoretical gain of CPTFM compared with PTFM and CW. As can be seen from Table 2, the wideband CPTFM waveform performs better than the CW waveform in the reverberation zone, with a theoretical gain of approximately 20 dB. CPTFM has a theoretical gain of 8.5 dB over the PTFM waveform. In the following part, simulation experiments can prove that CPTFM meets the theoretical gain described above.

4.3. Analysis of Simulation Results

Next, the power of the transmitted signal is normalized to 1, and the received signal is generated through the simulated reverberation environment. The bearing-Doppler diagram is obtained through traditional beamforming and matched filtering with several Doppler-shifted replicas for diverse waveforms. As described in Section 3, CPTFM contains two sub-waveforms, each of which has multiple A and B zones, and some zones of the sub-waveforms are crossed. As can be seen from the Figure 7, there is partial crossover in zones A and B of sub-waveforms e 1 and e 2 . Therefore, the reverberation levels in zones A and B are almost impossible to estimate separately. Based on this, the average RSR between zones A and B is calculated for performance comparison.
In the simulation, it is assumed that the target runs at a low (absolute speed V r = 1   m / s ) speed and the bearing of the target is cos θ 0 = 0.2 . The received signal is matched filtered with a replica signal with Doppler shift α θ = 1 + 2 V c cos θ 0 + 2 V r c to obtain the time-bearing diagrams of different waveforms, as shown in the upper plot of Figure 8. As can be seen, for both CW and PTFM waveforms, there are obvious reverberation zones, which tend to mask the real target. In addition, the range resolution of both waveforms is insufficient as can be seen in the middle plot of Figure 8. Compared with the CW and PTFM waveforms, the CPTFM waveform possesses better reverberation suppression and range resolution ability. In addition, if a ping at 2 s is processed additionally with different Doppler shift replica signals, a velocity-bearing diagram is display, as shown in the lower plot of Figure 8. Directly visible from the velocity-bearing display is the large difference among the CPTFM, PTFM, and CW waveforms. The PTFM and CW waveforms have obvious A and B zones, while that in the CPTFM is not obvious. When the target is moving at a low speed, then CPTFM, PTFM, and CW waveforms can determine the target speed information, but it is seen that PTFM and CW signals have a high reverberation level in zone A, which causes interference to target detection and increases the false alarm probability. If the target runs at a very low speed, then the target echoes of PTFM and CW are hidden in the reverberation of zone A, so that the presence of the target cannot be confirmed. However, CPTFM can still clearly confirm the existence of the target and can determine its bearing and speed information.
In order to avoid the effect of the end-fire beam on the reverberation level, the bearing is constrained between −0.8 and 0.8 in the calculation of the average RSR, and the target velocity range is now between −3 m/s and 3 m/s. The average RSR of zone A and zone B is calculated from the velocity-bearing diagram in the lower plot of Figure 8, and the reverberation suppression gain of CPTFM compared to PTFM and CW waveforms is obtained. The gain results of the simulation are shown in Table 3 and are in good agreement with the theoretical gain. In summary, it can be concluded that the waveform has a good reverberation suppression ability.

4.4. Discussion

As can be seen from Table 3, the reverberation suppression gain of CPTFM over CW is consistent with the theoretical results. The average gain of CPTFM over PTFM is also consistent with the theoretical analysis.
As can be seen from Figure 8, CPTFM has better reverberation suppression capability compared to PTFM and CW waveforms, effectively suppressing the reverberation outside the target orientation in the time-bearing diagram. In addition, as shown in the middle of Figure 8, the CPTFM waveform has better range resolution than the CW and PTFM waveform. From the lower plot of Figure 8, the CPTFM waveform does not have an obvious zone A and therefore has the ability to detect low-speed moving targets in the reverberation-limited zone compared to the CW and PTFM waveforms.

5. Conclusions

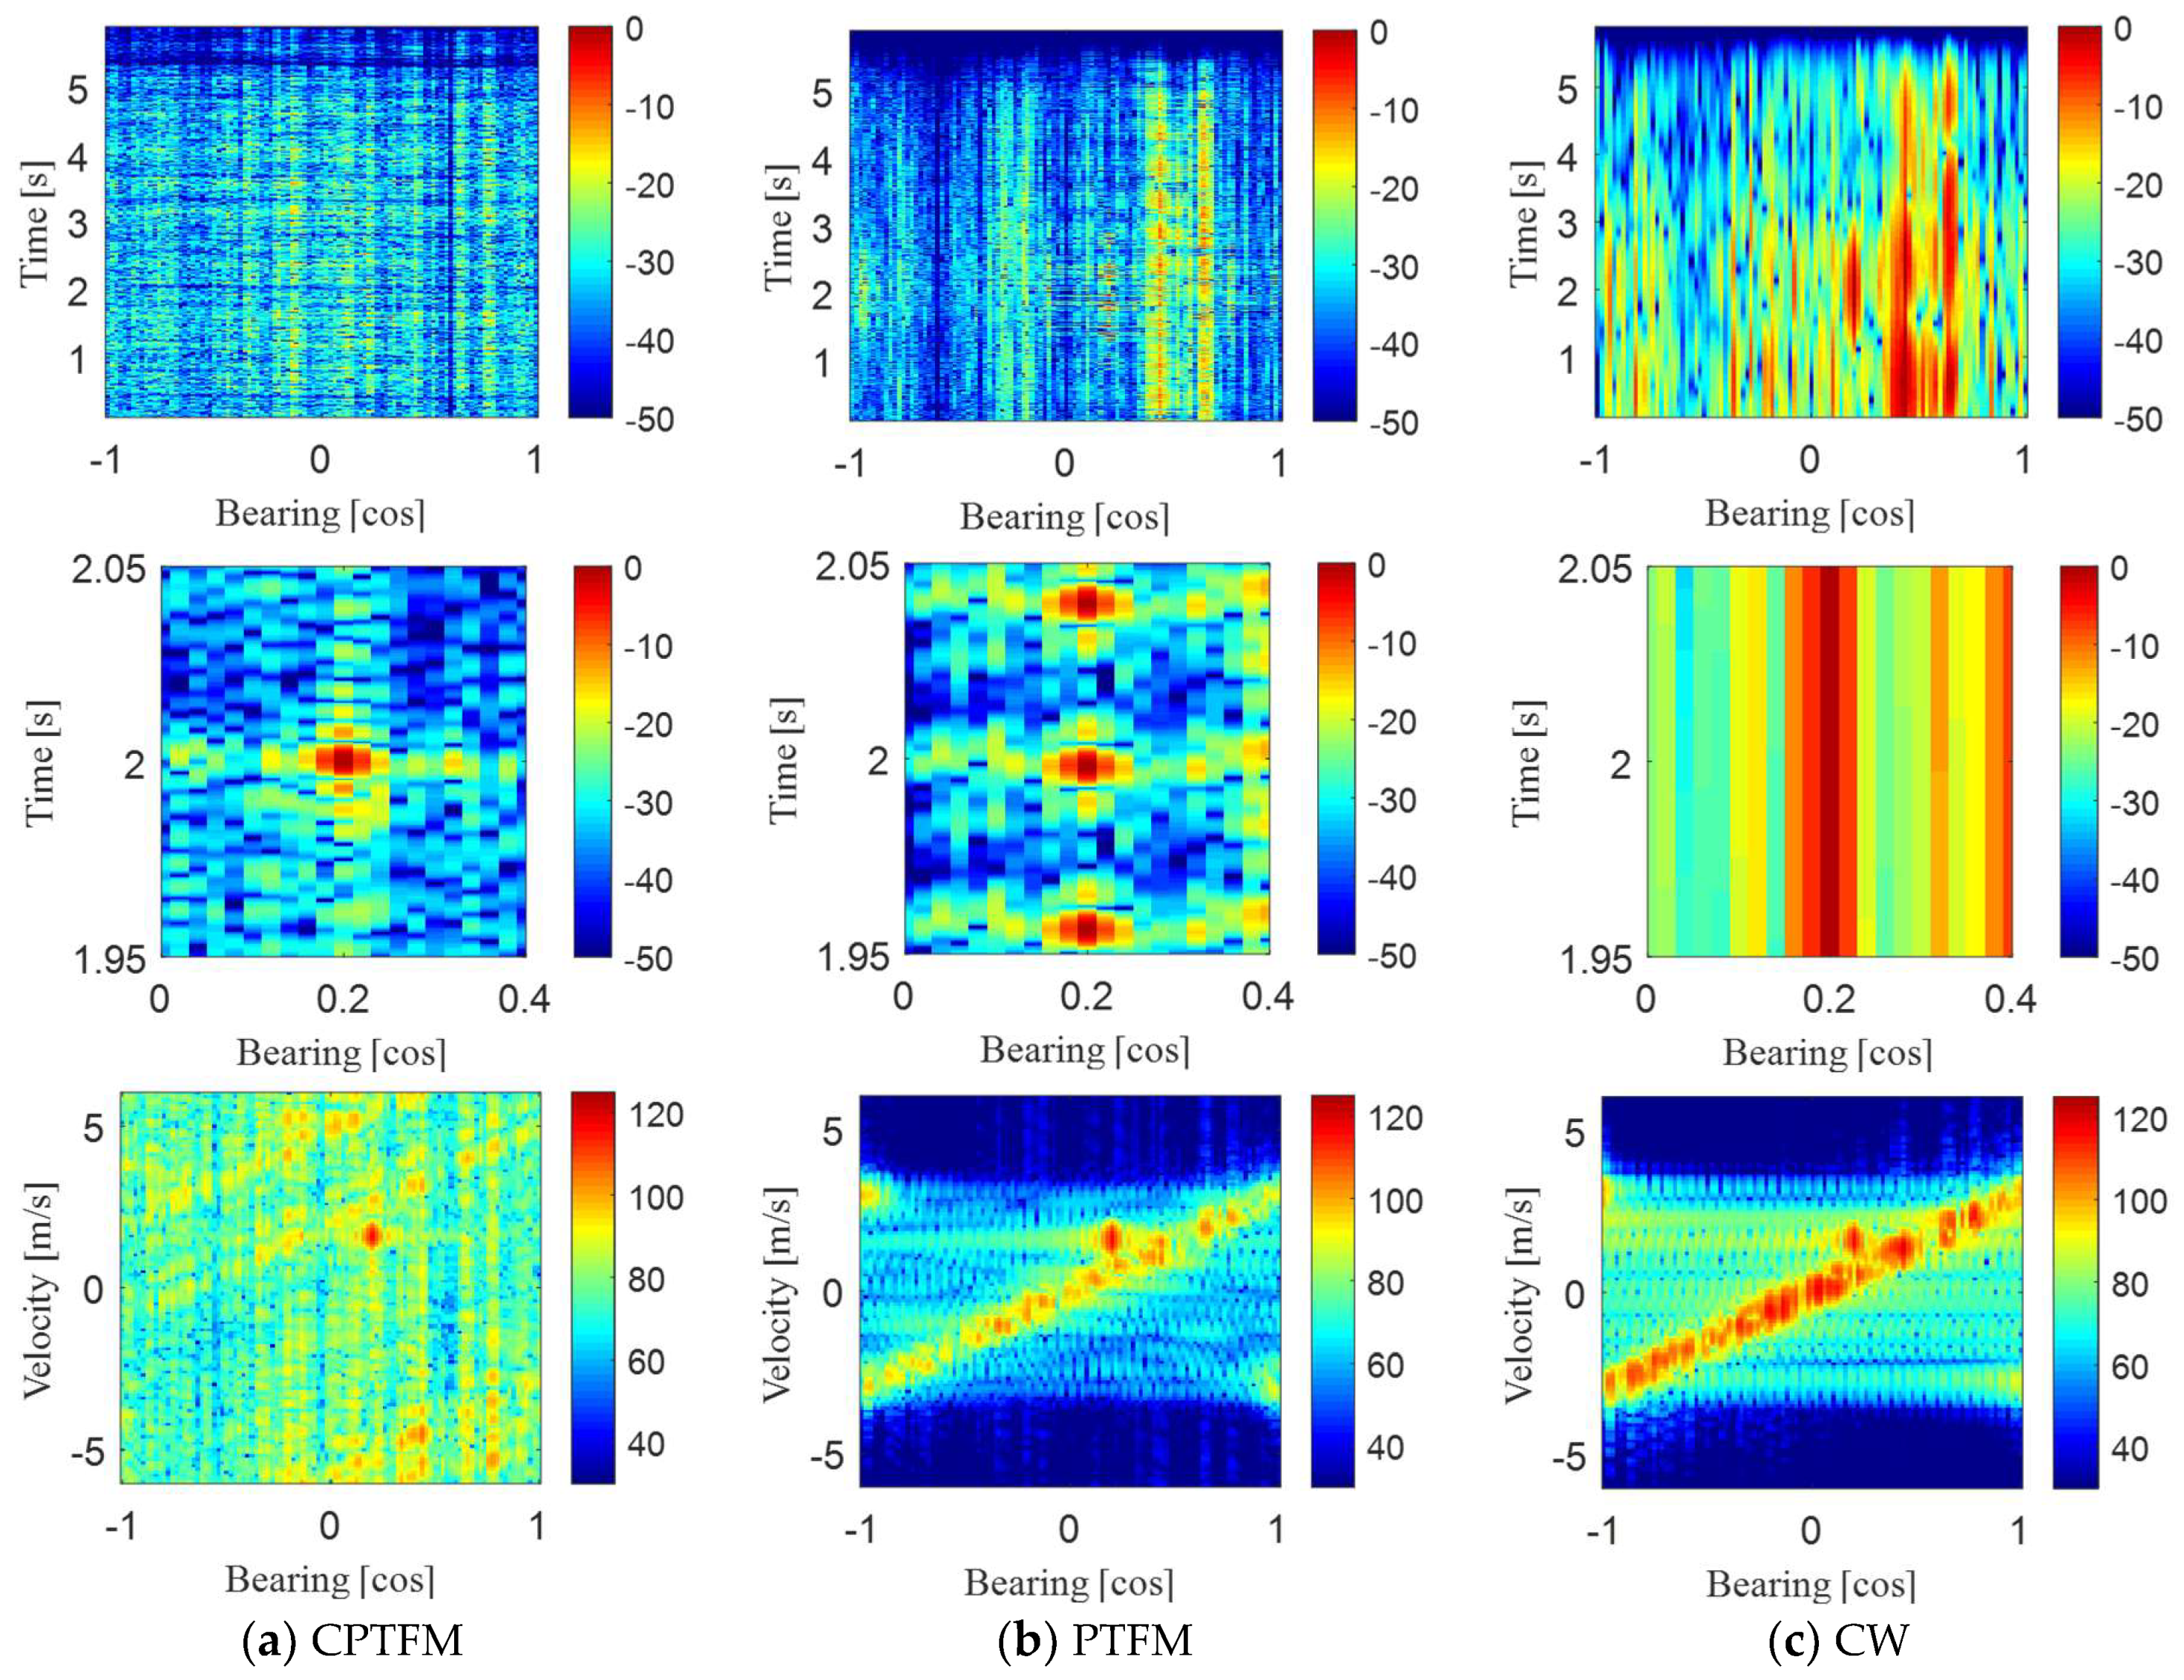
The purpose of waveform design is to design a suitable waveform from the transmitter side to produce a lower reverberation level and improve the detection capability of targets in the reverberation-limited environment. It has been shown that the PTFM waveform has a good reverberation suppression capability. Theoretical analysis shows that the reverberation level is positively correlated with the number of sub-pulses. However, to avoid Doppler ambiguity, the PTFM waveform limits the number of sub-pulses, which to some extent hinders the reverberation suppression capability of the PTFM waveform. The proposed CPTFM waveform uses two sub-PTFM waveforms, which obtains the Doppler information of the target from the two independent measurements, and reduces the number of sub-pulses as much as possible to obtain better reverberation suppression capability.
The PTFM and CW waveforms have obvious A and B reverberation zones, while that in the CPTFM is not obvious. In this paper, the average RSR of the two zones is derived and used as a metric to evaluate the reverberation suppression capability of the waveforms. In a typical low-frequency active sonar scenario, theoretical analysis shows that the CPTFM waveform has an average RSR gain of 8.5 dB and 20.7 dB over CW and PTFM waveforms in zone A and B. Analysis of the simulated experiment also shows good results, in agreement with the derived theory. The CPTFM waveform has a gain of 19.5 dB over the CW waveform, which matches the theoretical result. Compared with the PTFM waveform, the gain is 6.97 dB in zone A and B. The simulations also show that the CPTFM waveform has good range resolution and velocity resolution.

Author Contributions

Conceptualization, all the authors; methodology, X.C. and C.C.; validation, all the authors; resources, S.L.; writing—original draft preparation, X.C.; writing—review and editing, X.C., S.L., C.C. and Z.L.; supervision, S.L., Y.L. and H.H.; project administration, Y.L.; All authors have read and agreed to the published version of the manuscript.

Funding

This research was funded by the National Natural Science Foundation of China under grant number 62001469.

Institutional Review Board Statement

Not applicable.

Informed Consent Statement

Not applicable.

Data Availability Statement

The study did not report any data; all data can be generated from simulation.

Conflicts of Interest

The authors declare no conflict of interest.

References

  1. Doisy, Y.; Deruaz, L.; van Ijsselmuide, S.P.; Beerens, S.P.; Been, R. Reverberation Suppression Using Wideband Doppler-Sensitive Pulses. IEEE J. Ocean. Eng. 2008, 33, 419–433. [Google Scholar] [CrossRef]
  2. Jourdain, G.; Henrioux, J.P. Use of Large Bandwidth-Duration Binary Phase-Shift Keying Signals in Target Delay Doppler Measurements. J. Acoust. Soc. Am. 1991, 90, 299–309. [Google Scholar] [CrossRef]
  3. Hermand, J.P.; Roderick, W.I. Delay-Doppler Resolution Performance of Large Time-Bandwidth-Product Linear Fm Signals in a Multipath Ocean Environment. J. Acoust. Soc. Am. 1988, 84, 1709–1727. [Google Scholar] [CrossRef]
  4. Kroszczynski, J.J. Pulse Compression by Means of Linear-Period Modulation. Proc. IEEE 1969, 57, 1260. [Google Scholar] [CrossRef]
  5. Pecknold, S.P.; Renaud, W.M.; McGaughey, D.R.; Theriault, J.A.; Marsden, R.F. Improved Active Sonar Performance Using Costas Waveforms. IEEE J. Ocean. Eng. 2009, 34, 559–574. [Google Scholar] [CrossRef]
  6. Kay, S.; Salisbury, J. Improved Active Sonar Detection Using Autoregressive Prewhiteners. J. Acoust. Soc. Am. 1990, 87, 1603–1611. [Google Scholar] [CrossRef]
  7. Ginolhac, G.; Jourdain, G. “Principal Component Inverse” algorithm for detection in the presence of reverberation. IEEE J. Ocean. Eng. 2002, 27, 310–321. [Google Scholar] [CrossRef]
  8. Li, W.; Zhang, Q.; Ma, X.; Hou, C. Active Sonar Detection in Reverberation via Signal Subspace Extraction Algorithm. Eurasip J. Wirel. Commun. Netw. 2010, 2010, 981045. [Google Scholar] [CrossRef] [Green Version]
  9. Yu, G.; Piao, S.C.; Han, X. Fractional Fourier transform-based detection and delay time estimation of moving target in strong reverberation environment. IET Radar Sonar Navig. 2017, 11, 1367–1372. [Google Scholar] [CrossRef]
  10. Collins, T.; Atkins, P. Doppler-sensitive active sonar pulse designs for reverberation processing. IEE Proc. Radar Sonar Navig. 1998, 145, 347–353. [Google Scholar] [CrossRef]
  11. Ward, S. The use of sinusoidal frequency modulated pulses for low-Doppler detection. In Proceedings of the Annual Conference of the Marine-Technology-Society, Honolulu, HI, USA, 5–8 November 2001. [Google Scholar]
  12. Hague, D.A.; Buck, J.R. The Generalized Sinusoidal Frequency-Modulated Waveform for Active Sonar. IEEE J. Ocean. Eng. 2016, 42, 1–15. [Google Scholar] [CrossRef]
  13. Guan, C.Y.; Zhou, Z.M.; Zeng, X.W. Optimization of the Generalized Sinusoidal Frequency Modulated pulse trains for Continuous Active Sonar. In Proceedings of the IEEE International Conference on Signal Processing, Communications and Computing (ICSPCC), Qingdao, China, 14–16 September 2018. [Google Scholar]
  14. Hague, D.A.; Buck, J.R. A Generalized Sinusoidal Frequency Modulated Waveform for Active Sonar. In Proceedings of the 46th Asilomar Conference on Signals, Systems and Computers, Pacific, Grove, CA, USA, 4–7 November 2012. [Google Scholar]
  15. Doisy, Y.; Deruaz, L.; Prunel, B.; Been, R.; Beerens, S.P.; van IJsselmuide, S.P. Sonar Waveforms for Reverberation Rejection Part III: More Experimental Results. In Proceedings of the UDT Europe 2000—Conference Proceedings Undersea Defence Technology, London, UK, 27–29 June 2000. Session 6A.2. [Google Scholar]
  16. Doisy, Y.; Deruz, L.; Been, R. Sonar waveforms for reverberation rejection, part I: Theory. In Proceedings of the UDT Pacific 2000, Undersea Defence Technology Conference, Sydney, Australia, 7–9 February 2000; pp. 19–24. [Google Scholar]
  17. Guan, C.; Zhou, Z.; Zeng, X. Optimal Waveform Design Using Frequency-Modulated Pulse Trains for Active Sonar. Sensors 2019, 19, 4262. [Google Scholar] [CrossRef] [PubMed] [Green Version]
  18. Wang, X.T.; Guo, R.; Cai, Z.M. Experimental Research on Doppler Spread of Reverberation Using PTFM Signals. In Proceedings of the IEEE International Conference on Digital Signal Processing (DSP), Beijing, China, 16–18 October 2016. [Google Scholar]
  19. Guo, R.; Wang, X.T.; Cai, Z.M. Comparison Research on Reverberation Strength Excited by PTFM and CW Signals. In Proceedings of the 13th IEEE International Conference on Signal Processing (ICSP), Chengdu, China, 6–10 November 2016. [Google Scholar]
  20. Wang, W.J.; Xia, X.G. A Closed-Form Robust Chinese Remainder Theorem and Its Performance Analysis. IEEE Trans. Signal Process 2010, 58, 5655–5666. [Google Scholar] [CrossRef] [Green Version]
  21. Xiao, L.; Xia, X.G.; Wang, W.J. Multi-Stage Robust Chinese Remainder Theorem. IEEE Trans. Signal Process 2014, 62, 4772–4785. [Google Scholar] [CrossRef] [Green Version]
  22. Chi, C.; Vishnu, H.; Beng, K.T. Resolving Velocity Ambiguity Based on Robust Chinese Remainder Theorem for Multi-Frequency Pulse-to-Pulse Coherent Doppler Sonar. In Proceedings of the Conference on OCEANS MTS/IEEE Charleston, Charleston, SC, USA, 22–25 October 2018; IEEE: New York, NY, USA, 2018. [Google Scholar]
  23. Chi, C.; Vishnu, H.; Beng, K.T. Utilizing Orthogonal Coprime Signals for Improving Broadband Acoustic Doppler Current Profilers. IEEE J. Ocean. Eng. 2020, 45, 1516–1526. [Google Scholar] [CrossRef]
  24. Cui, X.; Chi, C.; Li, S.; Huang, H. Coprime Pulse Trains of Frequency-Modulated for Suppressing Reverberation. In Proceedings of the OCEANS 2021: San Diego–Porto, San Diego, CA, USA, 20–23 September 2021. [Google Scholar]
  25. Chi, C.; Vishnu, H.; Beng, K.T.; Chitre, M. Robust Resolution of Velocity Ambiguity for Multifrequency Pulse-to-Pulse Coherent Doppler Sonars. IEEE J. Ocean. Eng. 2020, 45, 1506–1515. [Google Scholar] [CrossRef]
Figure 1. Spectrum of a PTFM waveform with a central frequency of 1500 Hz and a bandwidth of 200 Hz.
Jmse 11 00028 g001
Figure 2. Ambiguity surface of a 2 s, 200 Hz PTFM waveform with 48 sub–pulses.
Jmse 11 00028 g002
Figure 3. Reverberation zones for a PTFM waveform. Zone A is the grey striped band, The zone in the middle of zone A is zone B.
Jmse 11 00028 g003
Figure 4. Time–frequency diagram of CPTFM waveform.
Jmse 11 00028 g004
Figure 5. Ambiguity surface of the CPTFM waveform in this article.
Jmse 11 00028 g005
Figure 6. Speed–bearing diagram for PTFM waveform with different numbers M of sub–pulses.
Jmse 11 00028 g006
Figure 7. Reverberation zones for sub–waveform e 1 (left) and e 2 (right) of the CPTFM waveform.
Jmse 11 00028 g007
Figure 8. Time–bearing diagram and velocity-bearing diagram in zones A and B for CPTFM, PTFM and CW waveforms. The top row is a time–bearing diagram of different waveforms, the middle row is a zoomed-in time–bearing diagram around the target, and the bottom row is a velocity–bearing diagram of different waveforms.
Jmse 11 00028 g008
Table 1. R S R a v e for CW, PTFM, and CPTFM waveforms in zones A and B.
Codes R S R a v e
CPTFM 1 2 B 2 V A ( M 1 N 1 + M 2 N 2 ) + 1 2 B 10 S L L 10 V B ( M 1 N 1 + M 2 N 2 ) ( 2 V A + V B ) ( M 1 + M 2 )
PTFM 1 2 M B 2 V A + 1 2 M B 10 S L L 10 V B 2 V A + V B
CW T 2 2 V A + T 2 10 S L L 10 V B 2 V A + V B
C P T F M C W 1 2 B 2 V A ( M 1 N 1 + M 2 N 2 ) + 1 2 B 10 S L L 10 V B ( M 1 N 1 + M 2 N 2 ) ( T 2 2 V A + T 2 10 S L L 10 V B ) ( M 1 + M 2 )
C P T F M P T F M 1 4 B 2 V A ( M 1 N 1 + M 2 N 2 ) + 1 4 B 10 S L L 10 V B ( M 1 N 1 + M 2 N 2 ) ( 1 2 M B 2 V A + 1 2 M B 10 S L L 10 V B ) ( M 1 + M 2 )
Table 2. Theoretical average RSR gain of the CPTFM over the CW and PTFM pulses.
Pulse-Type R S R a v e
C P T F M C W 20.7 dB
C P T F M P T F M 8.5 dB
Table 3. Simulated average RSR gain of the CPTFM over the CW and PTFM pulses.
Waveform TypeAverage RSR in Zone A and B [dB]
CPTFM/CW19.5 dB
CPTFM/PTFM6.97 dB
Disclaimer/Publisher’s Note: The statements, opinions and data contained in all publications are solely those of the individual author(s) and contributor(s) and not of MDPI and/or the editor(s). MDPI and/or the editor(s) disclaim responsibility for any injury to people or property resulting from any ideas, methods, instructions or products referred to in the content.

