Article

Leakage Fault Diagnosis of Lifting and Lowering Hydraulic System of Wing-Assisted Ships Based on WPT-SVM

Marine Engineering College, Dalian Maritime University, Dalian 116026, China
*
Authors to whom correspondence should be addressed.
J. Mar. Sci. Eng. 2023, 11(1), 27; https://doi.org/10.3390/jmse11010027
Submission received: 24 November 2022 / Revised: 17 December 2022 / Accepted: 20 December 2022 / Published: 26 December 2022
(This article belongs to the Special Issue Advanced Marine Energy Harvesting Technologies)

Abstract

:
Wing-assisted technology is an effective way to reduce emissions and promote the decarbonization of the shipping industry. The lifting and lowering of wing-sail is usually driven by hydraulic system. Leakage, as an important failure form, directly affects the safety as well as the functioning of hydraulic system. To increase the system reliability and improve the wing-assisted effect, it is essential to conduct leakage fault diagnosis of lifting and lowering hydraulic system. In this paper, an AMESim simulation model of lifting and lowering hydraulic system of a Very Large Crude Carrier (VLCC) is established to analyze the operation characteristics of the hydraulic system. The effectiveness of the model is verified by the operation data of the actual hydraulic system. On this basis, a wavelet packet transform (WPT)-based sensitive feature extracting method of leakage fault for the hydraulic system is proposed. Subsequently, a support vector machine (SVM)-based multi-classification model and diagnosis method of leakage fault are proposed. The study results show that the proposed method has an accuracy of as high as 97.5% for six leakage fault modes. It is of great significance for ensuring the reliability of the wing-sail operation and improving the utilization rate of the offshore wind resources.

1. Introduction

Maritime transportation is one of the most critical ways for global trade [1], ships contribute significantly to world trade but also emit many pollutants. In recent years, the issue of emissions from the shipping industry has received extensive attention. The International Maritime Organization (IMO) pointed out in the fourth greenhouse gas study report that the current annual emissions of greenhouse gases from the shipping industry are about 1076 million tons [2]. It is expected that CO2 emissions will increase by about 50% by 2050 compared with 2018. IMO has issued a series of new regulations for the shipping industry to deal with the increasing shortage of energy and air pollution [3,4], including SEEMP, EEDI, EEXI and CII, which aim to reduce greenhouse gas emissions from the shipping industry [5]. Energy conservation and emission reduction have become the development requirements of the shipping industry [6]. The use of green and clean energy contributes to the sustainable development of the shipping industry [7,8]; the main engine output power can be reduced significantly by utilizing wind power for navigation assistance, as well as ship CO2 emissions [9,10,11]. The most direct and effective way of wind-assisted navigation is sail-assisted technology. The specific forms of sail include airfoil sail (the wing) [12], rotary sail [13,14], kite sail [15], etc. Due to its better aerodynamic characteristics and stability [16], the airfoil sail is one of the most commonly used sails on large ocean-going ships.
Currently, the wing is mainly driven by the hydraulic system on ships. Internal leakage often occurs in hydraulic pumps [17], hydraulic valves [18], hydraulic cylinders, and other components of the hydraulic system. The occurrence of leakage faults is related to factors such as the deterioration of seals [19], and it is usually challenging to detect in time. When the leakage fault occurs in the lifting and lowering hydraulic system, the wing cannot be lifted or lowered as designed, which will highly reduce the service efficiency. Meanwhile, the ship’s safety will be seriously endangered if the wing cannot be lifted or lowered normally when the ship arrives/departs the port or is sailing in restricted waters. Therefore, early diagnosis of internal leakage is essential [20].
Many scholars have paid attention to fault diagnosis methods of hydraulic systems and conducted relative research. Kumar et al. [21] studied the influence of single piston leakage on pump output flow, motor torque, and power by establishing a hydraulic piston pump dynamic model. Shi et al. [22] extracted the feature subset to reflecting the fault by denoising the vibration signal of hydraulic, and obtained the fault diagnosis results through decision-making information fusion. An effective fault states detecting method for hydraulic valve internal wear is proposed by them. Qiu et al. [23] studied the relationship between the internal leakage and energy characteristics of the hydraulic cylinder pressure by computational fluid dynamics (CFD) analysis, A leakage diagnosis method was proposed by decomposing the energy features into statistics after extracting the energy features with WPT.
Machine learning methods have become popular in solving fault diagnosis problems as rapid development of computer technology, such as artificial neural networks (ANN), decision tree algorithms, and support vector machines (SVM) [24]. Panda et al. [25] studied the pattern recognition problem of hydraulic pumps under different fault degrees and used One-Against-One (OAO) technology to realize the fault multi-classification problem based on SVM. The C4.5 decision tree method was used to select time-frequency signal characteristics of hydraulic system vibration signals, and the effectiveness of SVM online condition monitoring was verified by importing the selected characteristics into SVM classification [26]. Zhang et al. [27] extracted features from the original signal by using variational mode decomposition (VMD); they obtained the appropriate classifier parameters by optimizing the mixed kernel support vector machine (MSVM), and successfully realize the classification of different levels of fault. Zhang et al. [28] proposed to combine the improved convolutional neural network (MCNN) with the SVM for the multi-source phenomenon of fault signals; the fast classification of friction faults is realized by using MCNN and SVM. Tang et al. [29] constructed a good performance diagnostic model by an adaptive convolutional neural network (CNN) with Bayesian optimization. Based on the standard LeNet-5 model, Zhu et al. [30] solved the uncertainty of manual adjustment by optimizing the CNN hyper-parameters with particle swarm optimization (PSO), and realized the wear fault diagnosis of the plunger pump. Wang et al. [31] established a general sparse dictionary based on the sparse theory, the optimal kernel function type and kernel parameters of SVM are selected by sparse coding, and the fault diagnosis classification of bearings is realized by the PSO algorithm. Lan et al. [32] extracted fault features with three methods; they verified the excellent classification performance of extreme learning machine (ELM) classifier through ELM for fault classification.
The studies on diagnosis analysis mentioned above mainly considered the conventional noise and vibration signals. However, due to its complex system structure and poor working environment, the wing needs to bear the wind alternating load during navigation when it provides assisted force for ships, it is difficult to obtain the noise and vibration signals because of the interference signals. Therefore, it is hard to achieve effective leakage fault diagnosis through vibration signals. In practical terms, only a small sample pressure signal can be obtained from the wing lifting and lowering hydraulic system, and the pressure signal is usually a high-frequency and non-smooth state. Therefore, the studies mentioned cannot effectively perform fault diagnosis for the wing lifting and lowering hydraulic system. WPT has high accuracy in decomposing the full frequency components of the pressure signal [33], and has a strong time-frequency localization decomposition ability and good performance in processing high-frequency transient signals, which lays a foundation for feature extraction and recognition of the pressure signals. SVM has an excellent performance in solving the pattern recognition problems of small samples and multi-dimensional structure [34], it also has awesome learning and generalization performance. Therefore, SVM is suitable to solving the fault diagnosis problems of the wing lifting and lowering hydraulic system. A WPT-SVM based fault diagnosis method is proposed in this paper, which can realize the leakage fault diagnosis of different critical equipment by using internal pressure signal of the wing lifting and lowering hydraulic system, ensuring the reliability of the hydraulic system.
There are two contributions of this paper: (1) a hydraulic simulation model of the wing lifting and lowering hydraulic system is established, and the model’s effectiveness is verified by the data of existing hydraulic system. The model can realize the analysis of the operating characteristics of hydraulic system; (2) a fault diagnosis method of the wing lifting and lowering hydraulic system based on WPT-SVM is proposed. The method can realize the diagnosis of different leakage fault states of the critical equipment of the hydraulic system with high accuracy, to improve the reliability of the wing lifting and lowering hydraulic system and the energy efficiency of the wing-assisted ship.

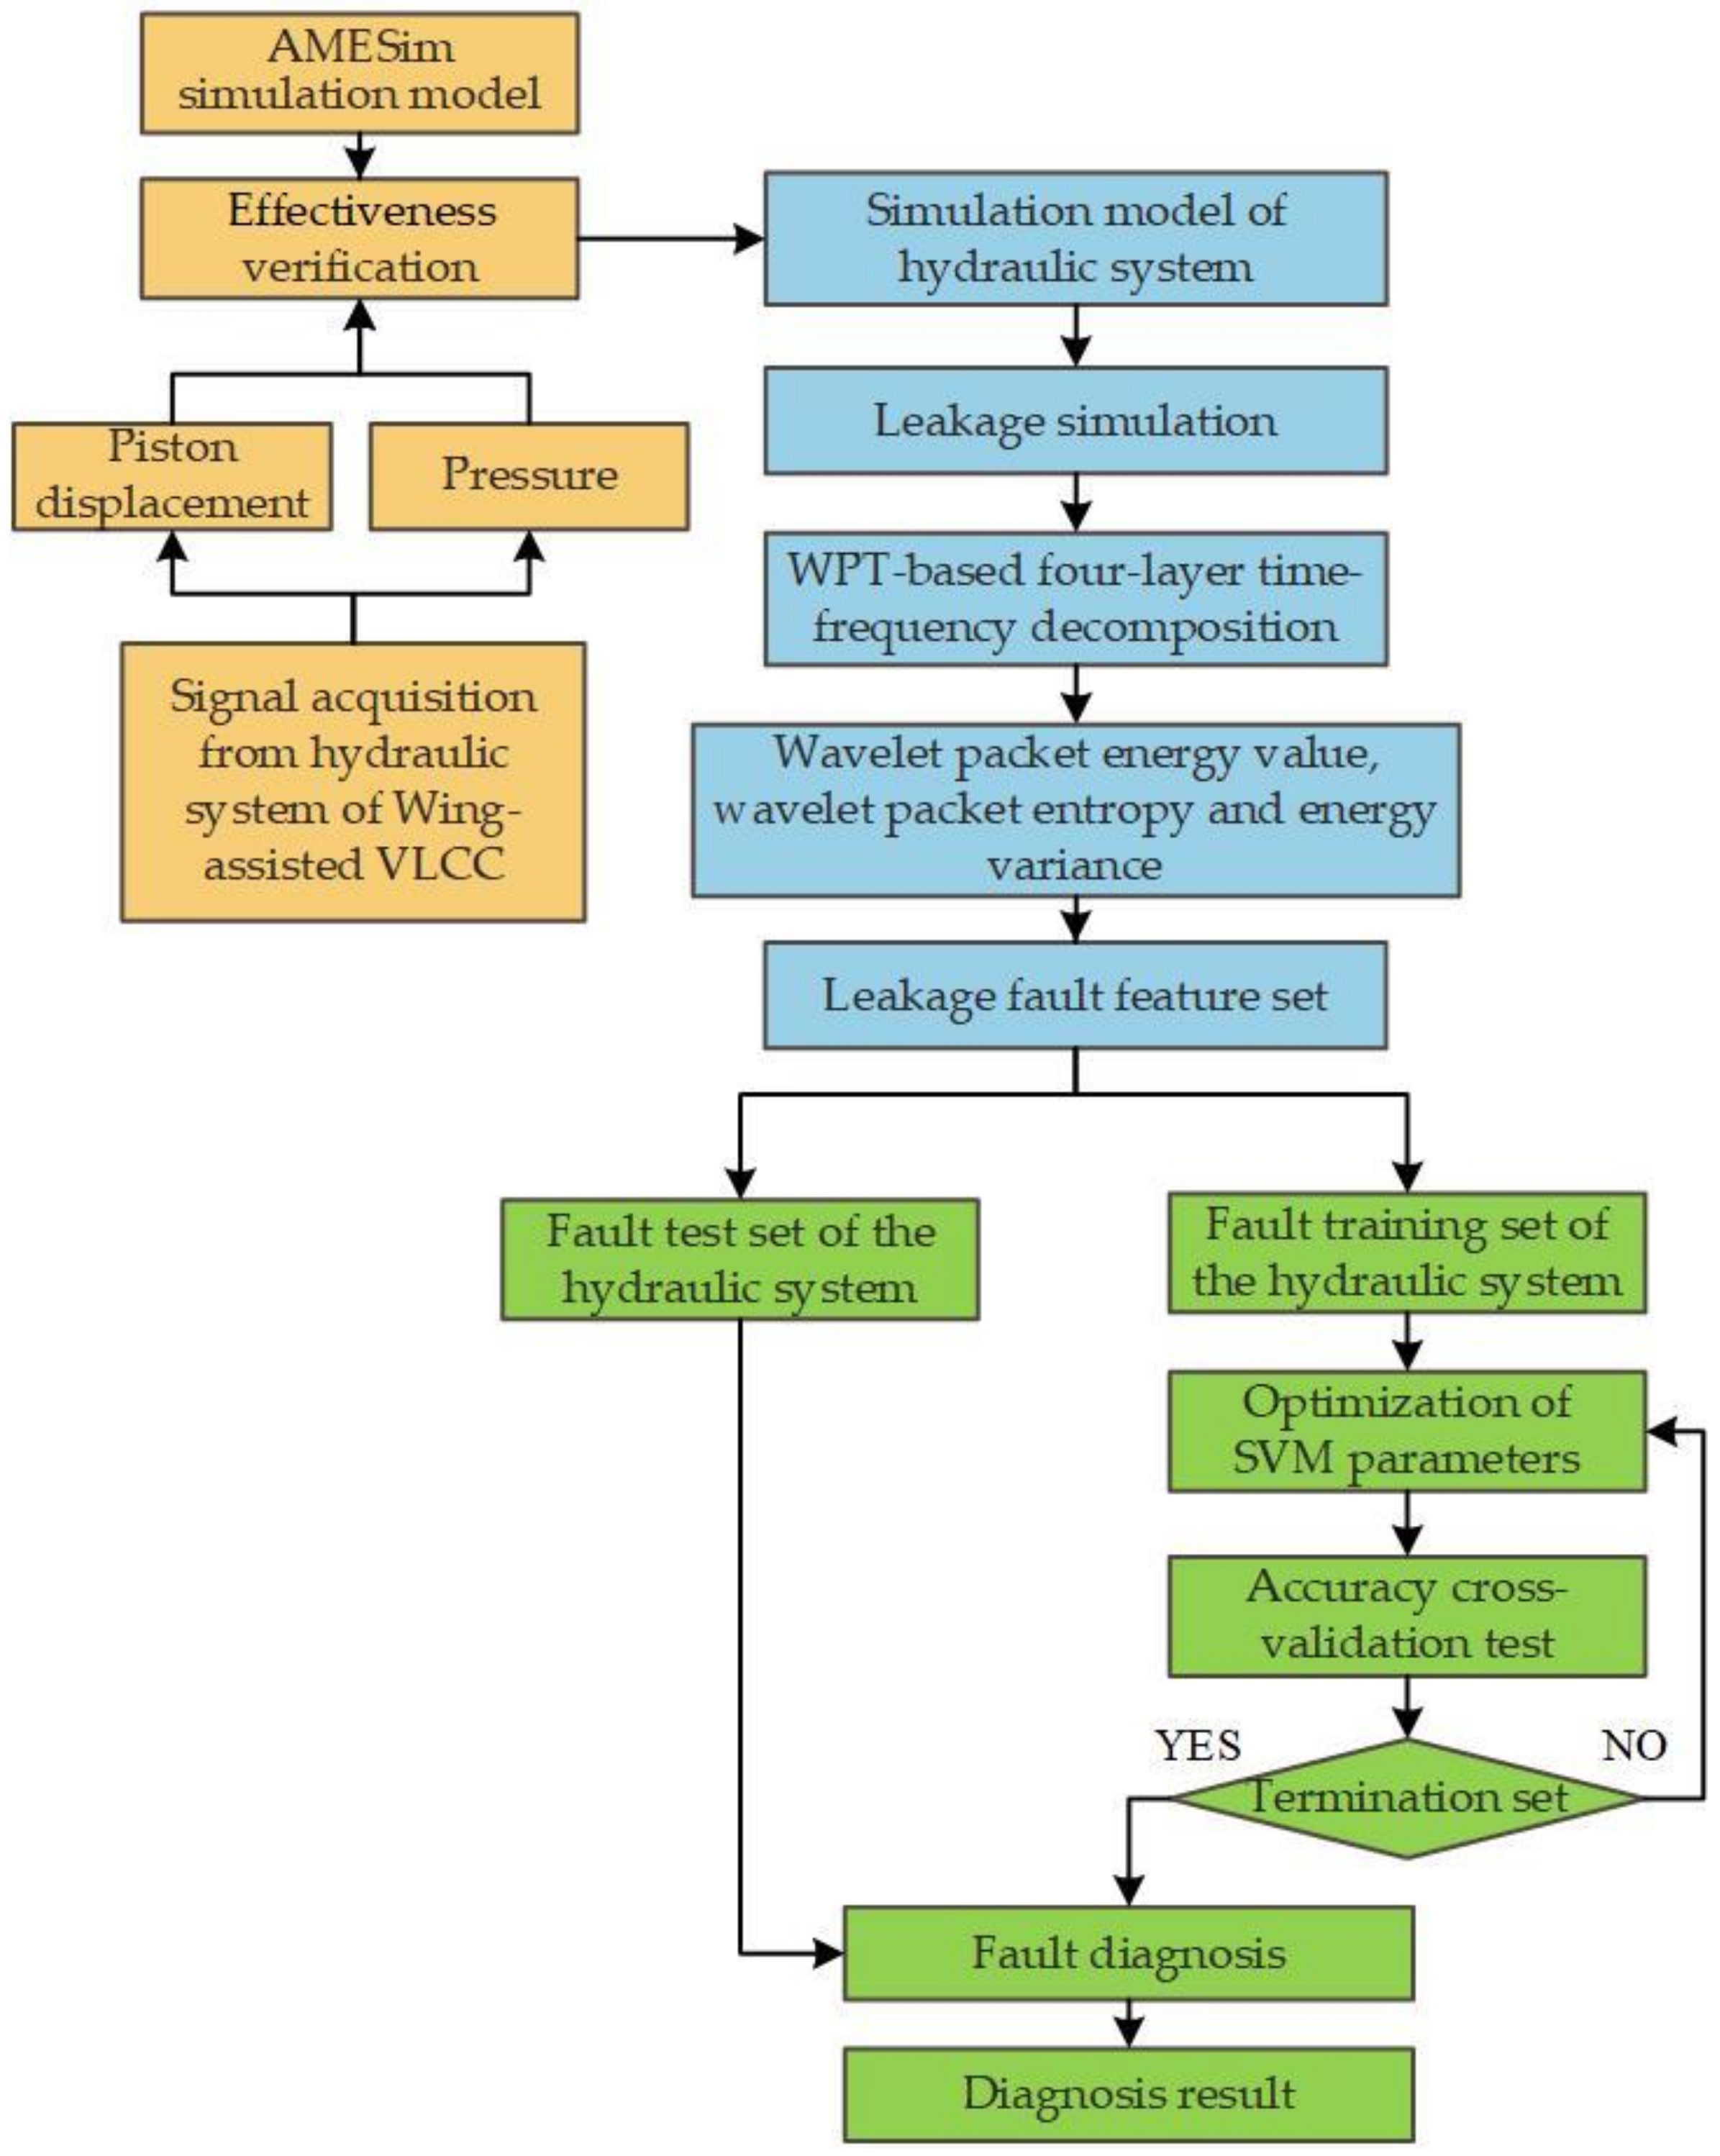
2. WPT-SVM Based Fault Diagnosis Method

Figure 1 shows the diagnosis process: Firstly, the AMESim simulation model of the wing lifting and lowering hydraulic system is established by analyzing the components of the system, the model’s effectiveness is verified by the piston displacement and pressure of the hydraulic system. Then, the leakage fault states are simulated by setting different leakage conditions.
Secondly, the pressure signals of the hydraulic cylinder are decomposed to extract the leakage fault features by using WPT, and the fault feature set is established.
After that, a multi-classifier is trained by using the fault feature set based on SVM, the classifier is optimized by grid search, so that the leakage fault diagnosis classification model is obtained.
Finally, the fault diagnosis of the wing lifting and lowering hydraulic system is performed to verify the accuracy of the method with a typical hydraulic leakage fault mode case.

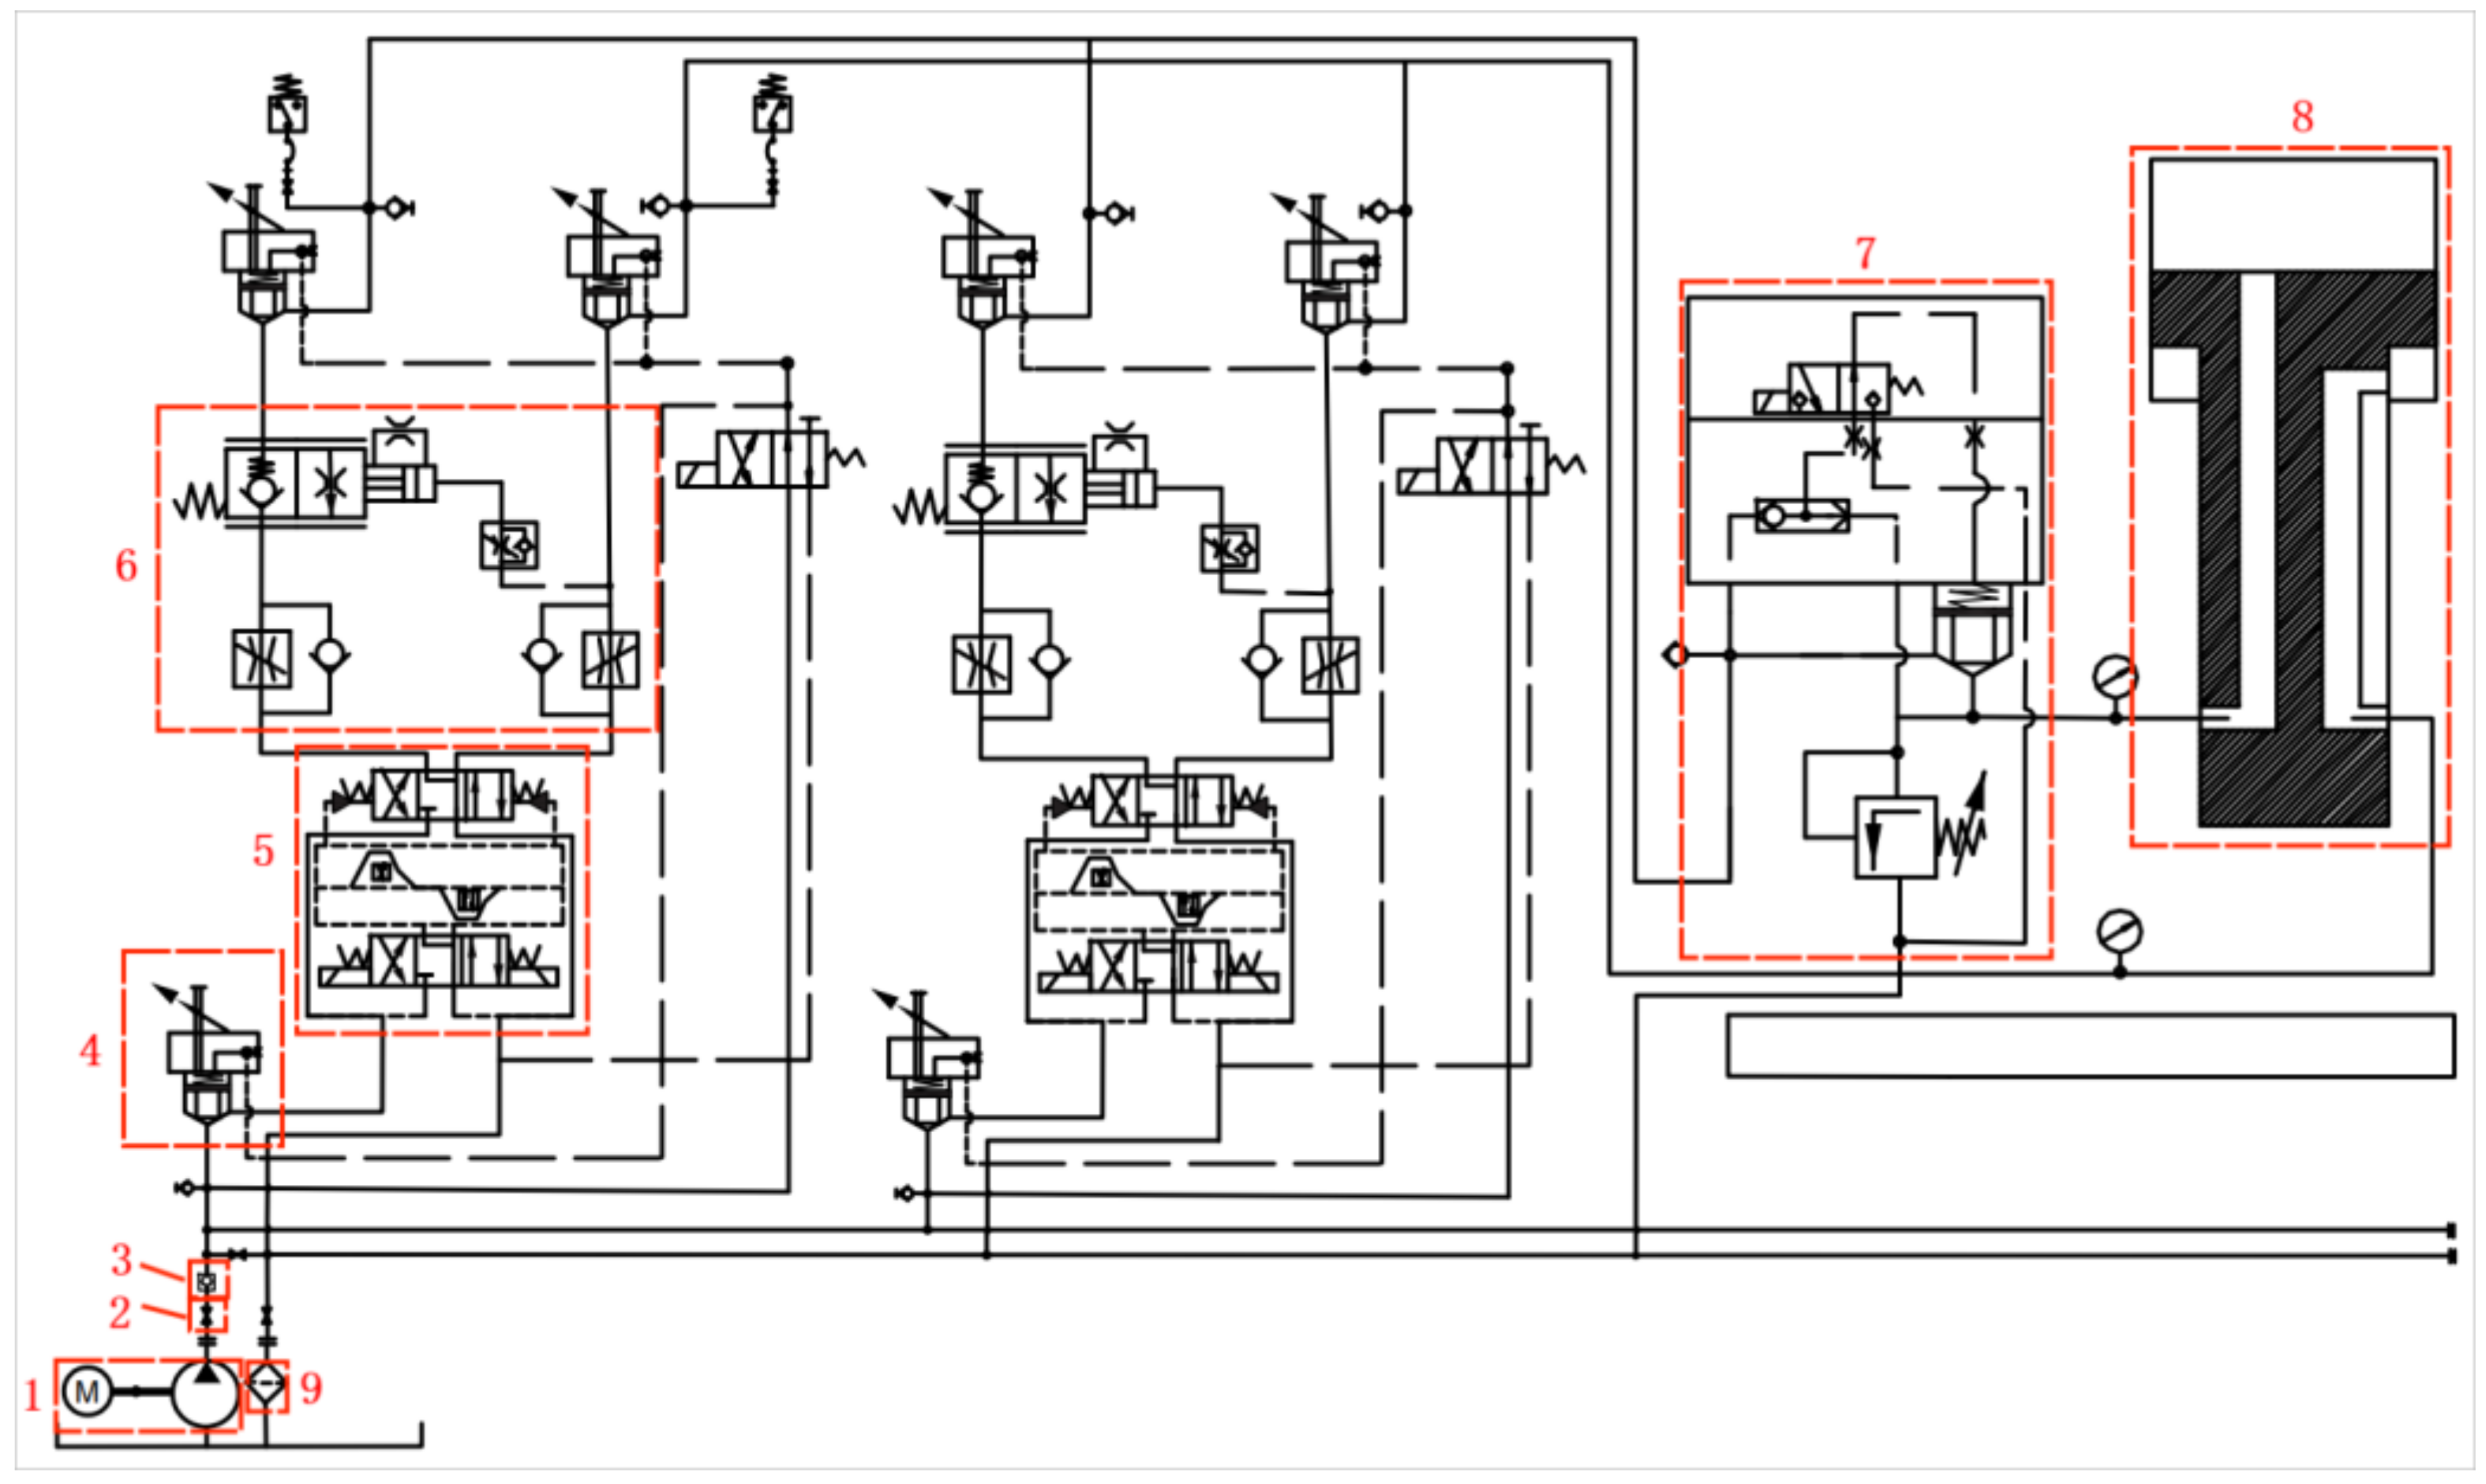
2.1. Modelling of the Wing Lifting and Lowering Hydraulic System

At present, wing-assisted technology has entered the stage of practical application, it is impractical to create fault artificially on the actual system to obtain the system signal in the fault state in consideration of the safety of wing equipment and ship. Therefore, a simulation model is established to analyze the operating state of the hydraulic system based on the schematic diagram, the actual equipment, and operating parameters for the wing lifting and lowering hydraulic system of a VLCC. As shown in Figure 2, the hydraulic pump provides power for the whole system, the electromagnetic directional valve controls the lifting or lowering action of the wing, the hydraulic cylinder act as the actuator, the balance valve group protects the wing from lowering abnormally due to its large mass and the influence by the ship’s listing and heeling during sailing. The safety globe valve group guarantees that the wing can be quickly lowered in case of emergency.
An AMESim simulation model is established based on the component of existing hydraulic system with the power bond graph theory, as is shown in Figure 3.
The pressure sensors can be placed at the outlet of the hydraulic pump and the inlet/outlet of the hydraulic cylinder. The state performance of the hydraulic system can be simulated by adjusting the parameters of the control module, load simulation module, friction leakage module, etc.; thus, the leakage faults can be simulated.

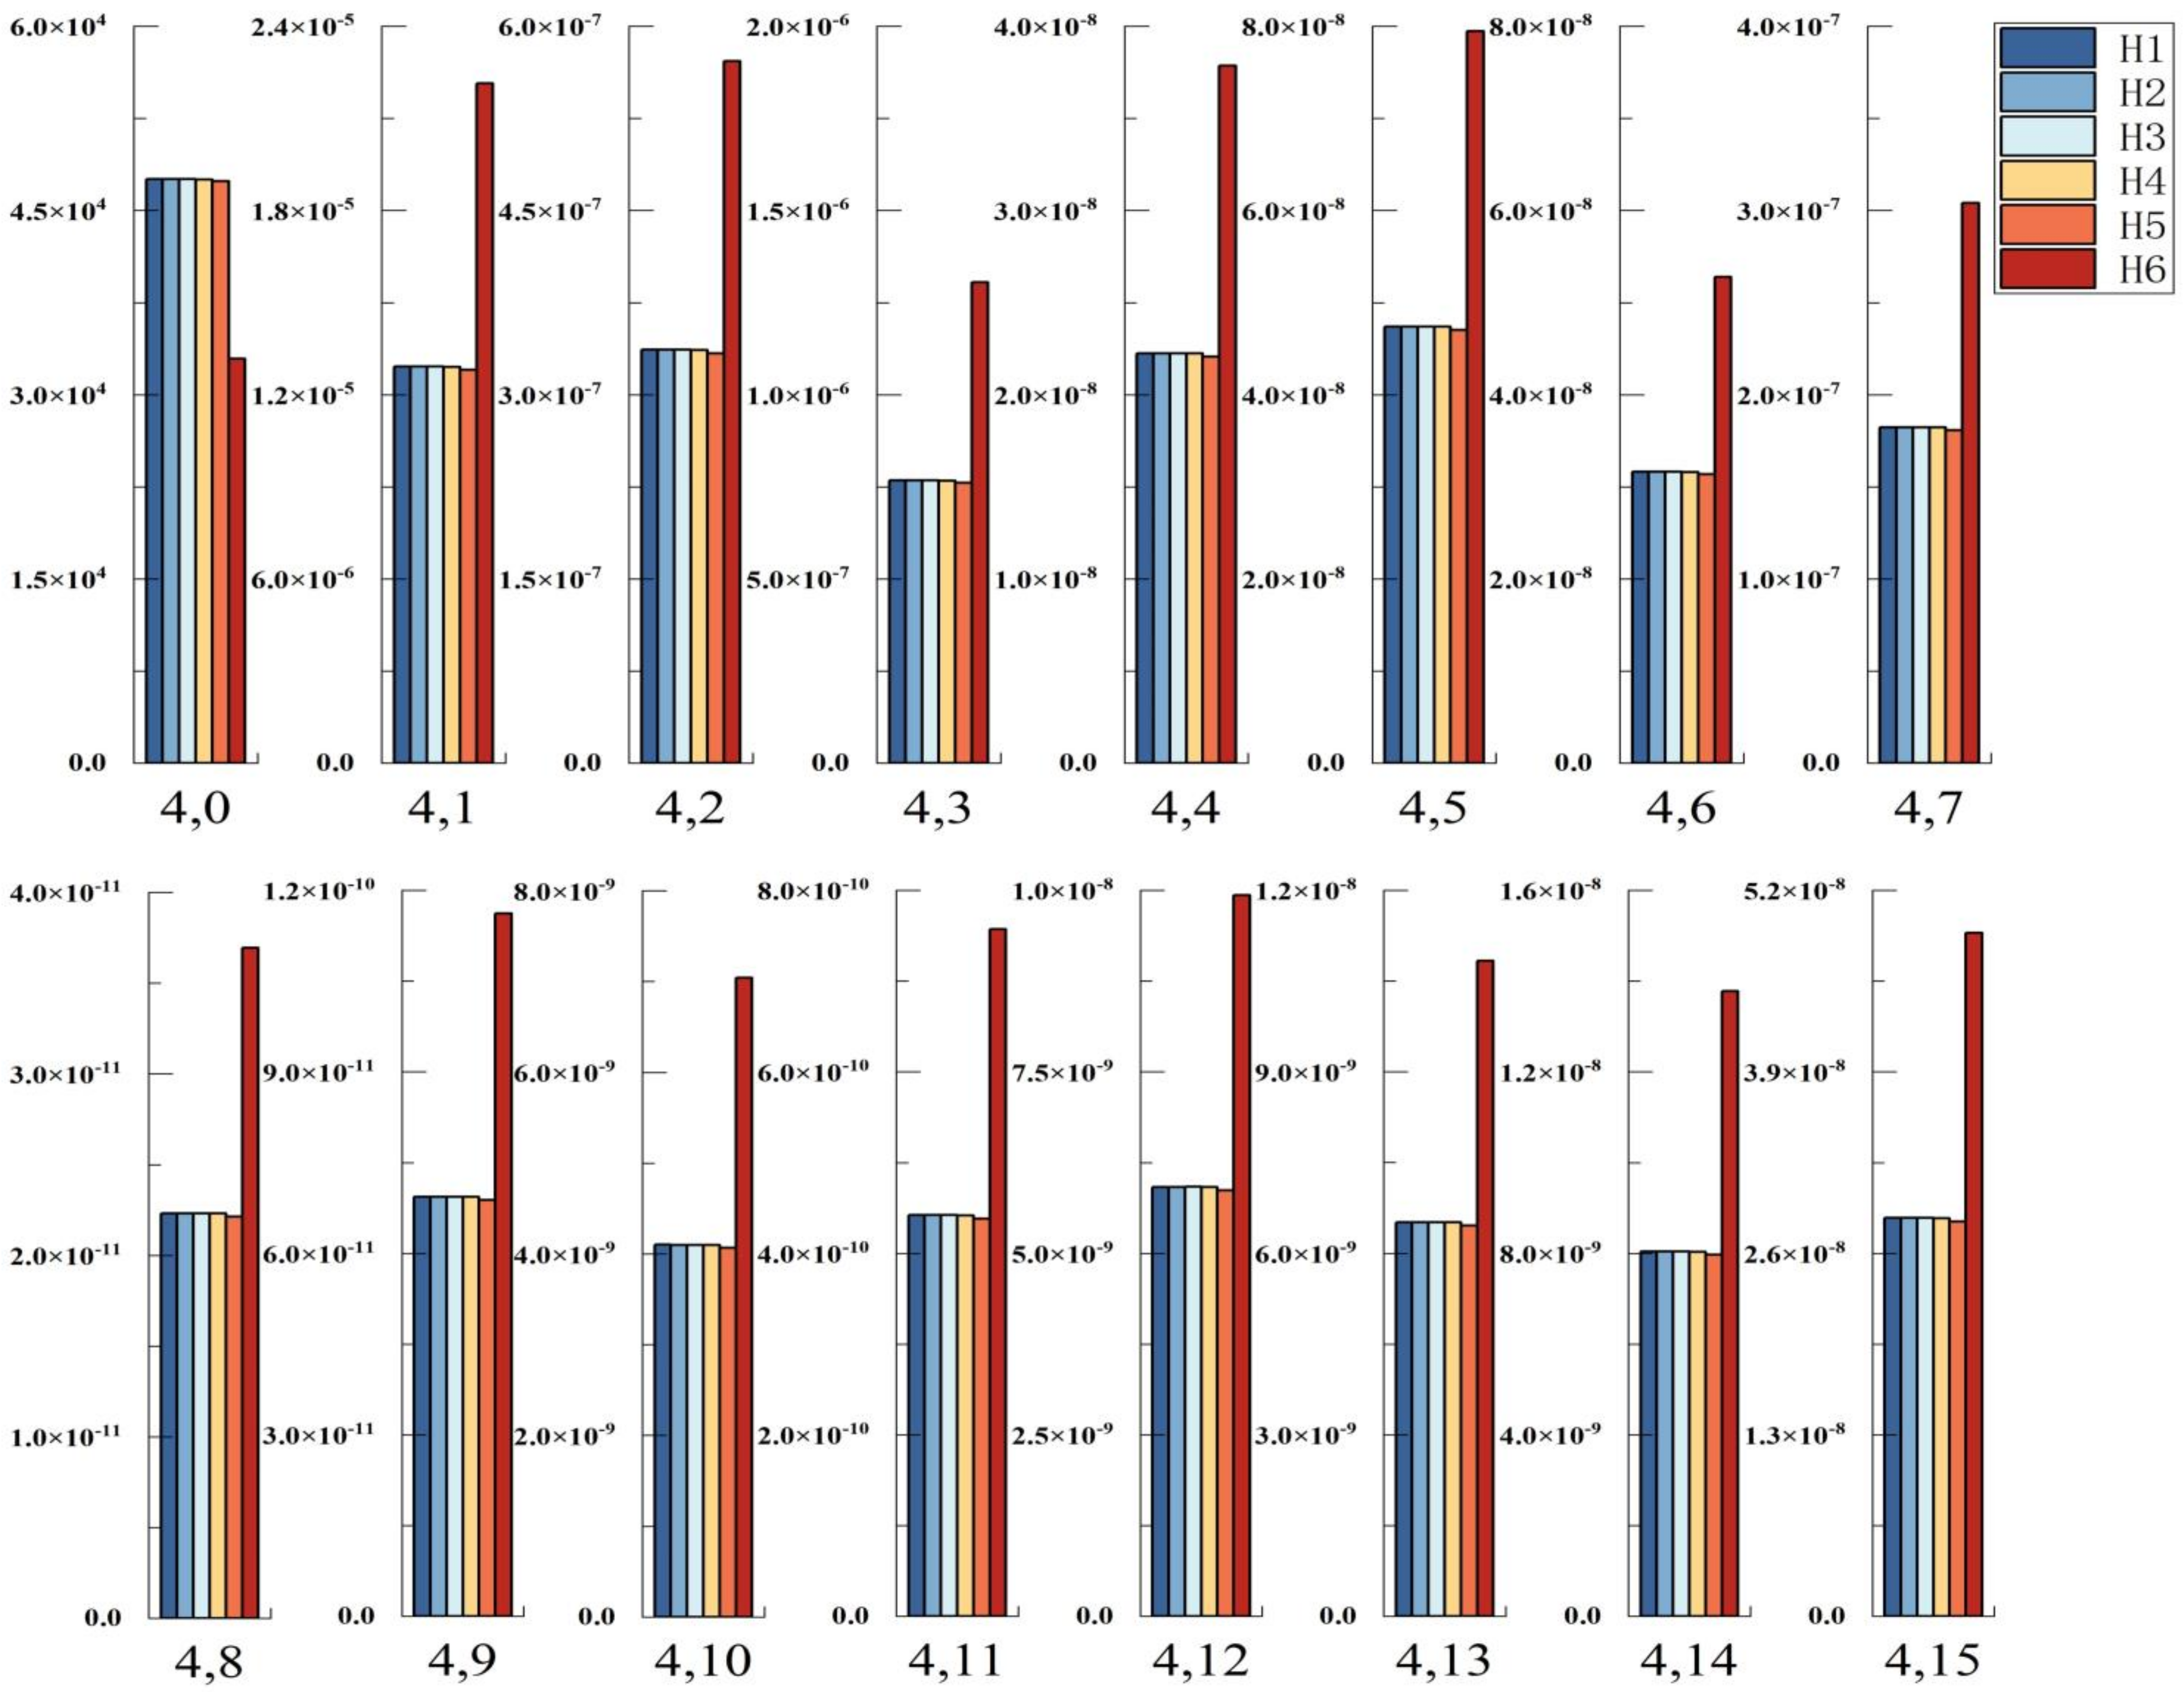
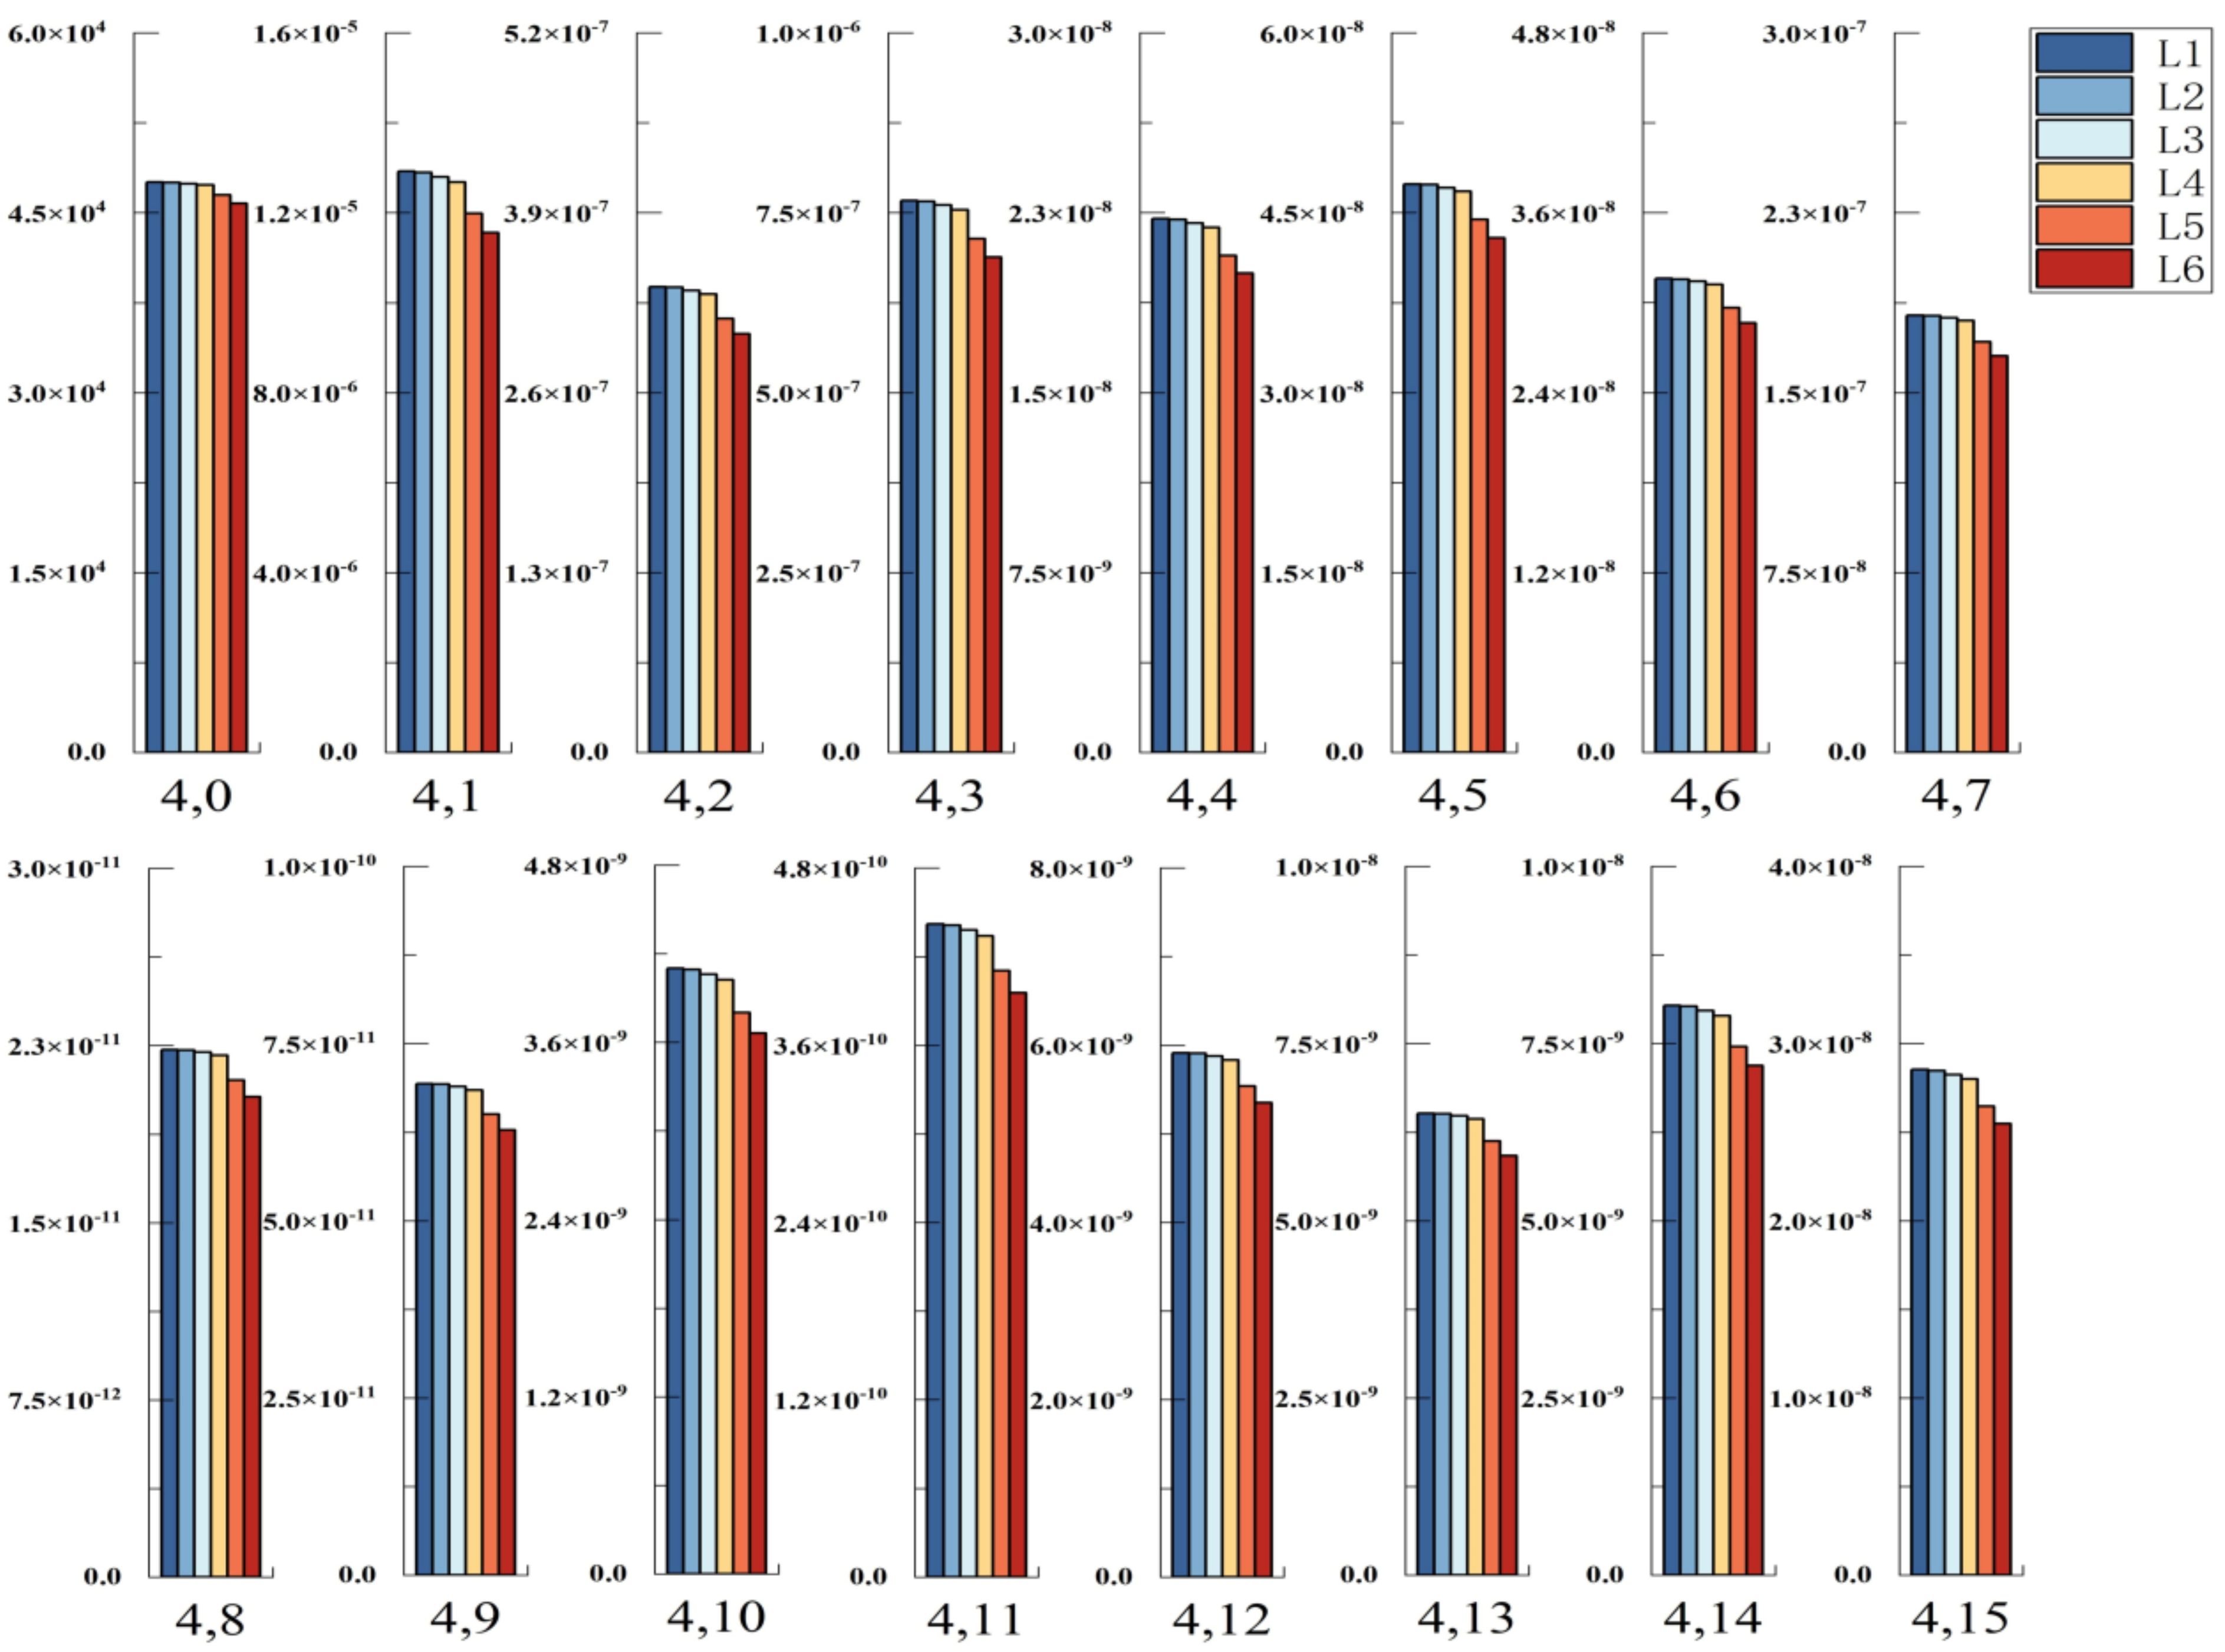
2.2. WPT Based Fault Feature Extraction Method of the Hydraulic System

Since the hydraulic system signals contain a lot of information and noise interference [35,36], it is necessary to process all kinds of signal data to extract useful information to provide materials for the learning process of the classifier. Therefore, the hydraulic system pressure signal in time and frequency is decomposed to obtain the sensitive characteristic parameters of internal leakage.
Firstly, the stress state of the hydraulic cylinder piston is analyzed, as shown in Figure 4. The resultant force acting on the hydraulic cylinder piston in the hydraulic system is:
F w i n g = p 1 A 1 p 2 A 2 m m a s s g
In the above formula, A1 is the area of the hydraulic cylinder piston side, A2 is the contact area between the hydraulic oil and the hydraulic cylinder piston rod side, mmass is the mass of the wing and the piston, and g is the acceleration of gravity. The resultant force acting on the piston will change when the wing is lifting or lowering. Fwing ≥ 0 when the wing is lifting, Fwing ≤ 0 when wing is lowering, and Fwing = 0 when the wing stays still. The piston side pressure of the hydraulic cylinder p1 is:
p 1 = F w i n g + p 2 A 2 + m m a s s g A 1
and the piston rod side pressure p2 is:
p 2 = p 1 A 1 F w i n g m m a s s g A 2
where A1 and A2 can be expressed as follows:
A 1 = π d p 2 4
A 2 = π d p 2 d r 2 4
where dp is the diameter of piston head and dr is the diameter of piston rod.
The hydraulic cylinder internal pressure signal frequency is separated and filtered based on the WPT decomposition principle. Then, the high-frequency region, which reflects the hidden details of the pressure signal and the low-frequency region, which macroscopically reflects the signal state is obtained [37]. A wavelet packet can be defined as follows:
L 2 ( R ) = j Z W j
where L2(R) is the space, Wj is the wavelet subspace. L2(R) can be decomposed into the direct sum of subspaces Wj according to different scale factors j to achieve multi-resolution analysis. The decomposition algorithm and the reconstruction algorithm comprise to wavelet packet decomposition data processing algorithm. Let f(t) be the signal to be processed, and p j i ( t ) is ith wavelet packet node (j, i) on the 2j decomposition scale. Equation (7) shows the wavelet packet decomposition algorithm:
p j 2 i 1 ( t ) = k H ( k 2 t ) p j 1 i ( t ) p j 2 i ( t ) = k G ( k 2 t ) p j 1 i ( t )
where t = 1, 2, …, 2Jj; i = 1, 2, …, 2j; J = log2N.
The wavelet packet reconstruction algorithm is:
p j i ( t ) = 2 k H ( t 2 k ) p j + 1 2 i 1 ( t ) + k G ( t 2 k ) p j + 1 2 i ( t )
where j = J−1, J−2, …, 1, 0; i = 2j, 2j−1, …, 2, 1. H(t) is a low-pass filter, G(t) is a high-pass filter.
The hydraulic cylinder pressures are selected as signal processing objects, and a db6 wavelet is selected. The hydraulic cylinder pressure signal is decomposed into four layers based on WPT time-frequency decomposition technology. Sixteen wavelet packets are extracted from the four-layer decomposition results of pressure signals for analysis. The decomposition structure is shown in Figure 5.
The sub band signal range of the hydraulic cylinder pressure signal is reconstructed after decomposition, and the energy quantization value is calculated. The reconstructed signal of the (i, j) sub band is represented by Si,j, and S0,0 is the hydraulic cylinder pressure signal before decomposition. The relationship between the decomposed signals of all sub bands in the fourth layer is as follows:
S 0 , 0 = S 4 , 0 + S 4 , 1 + S 4 , 2 + S 4 , 3 + S 4 , 4 + + S 4 , 14 + S 4 , 15
Calculating the energy of the reconstructed signals of the above sub bands, and let E4,j be the quantized energy values of the sub band signals S4,j (j = 0, 1, 2, …, 15), then:
E 4 , j = 0 T S 4 , j ( t ) 2 d t = k = 0 n x j , k 2
where T represents the acquisition time length of the pressure signal, k (k = 0, 1, 2, …, n) represents the number of signal points in signals S4,j, xj,k represents the amplitude of each signal point. The quantization value of the total energy of the wavelet packet is:
E = j = 0 2 4 1 E 4 , j
E is a quantitative evaluation of the pressure signal. The energy quantization results of all sub bands are taken as elements to construct a feature vector M, which is:
M = E 4 , 0 , E 4 , 1 , E 4 , 2 , E 4 , 3 , E 4 , 4 , E 4 , 5 , E 4 , 6 , E 4 , 7 , , E 4 , 14 , E 4 , 15
The characteristic vector M can be normalized and quantized according to the total energy E, and the processing result M′ can be expressed as:
E 4 , j = E 4 , j E
M = E 4 , 0 , E 4 , 1 , E 4 , 2 , E 4 , 3 , E 4 , 4 , E 4 , 5 , E 4 , 6 , E 4 , 7 , , E 4 , 14 , E 4 , 15
The energy entropy is suitable for leakage fault characteristics analyzing, which is defined as:
W E = i = 1 n P i log P i
P i = E i i = 1 n E i
where Pi is the percentage of the ith sub band in pressure signal energy, WE is the energy entropy of wavelet packet, Ei is the ith sub band energy. This paper also uses the variance of energy change of wavelet packet as the leakage sensitive feature. The energy variance of wavelet packet is in Equation (17):
σ 2 = 1 n i = 1 n ( E i E m e a n ) 2
where Emean is the sub band energy average value, σ2 is the variance of energy, n is the number of sub bands after decomposition.
WPT can analyze the hydraulic cylinder internal pressure signal, and can reflect the implied information in the signal from the aspect of signal energy distribution, which is helpful in revealing the system state information contained in the pressure signal.

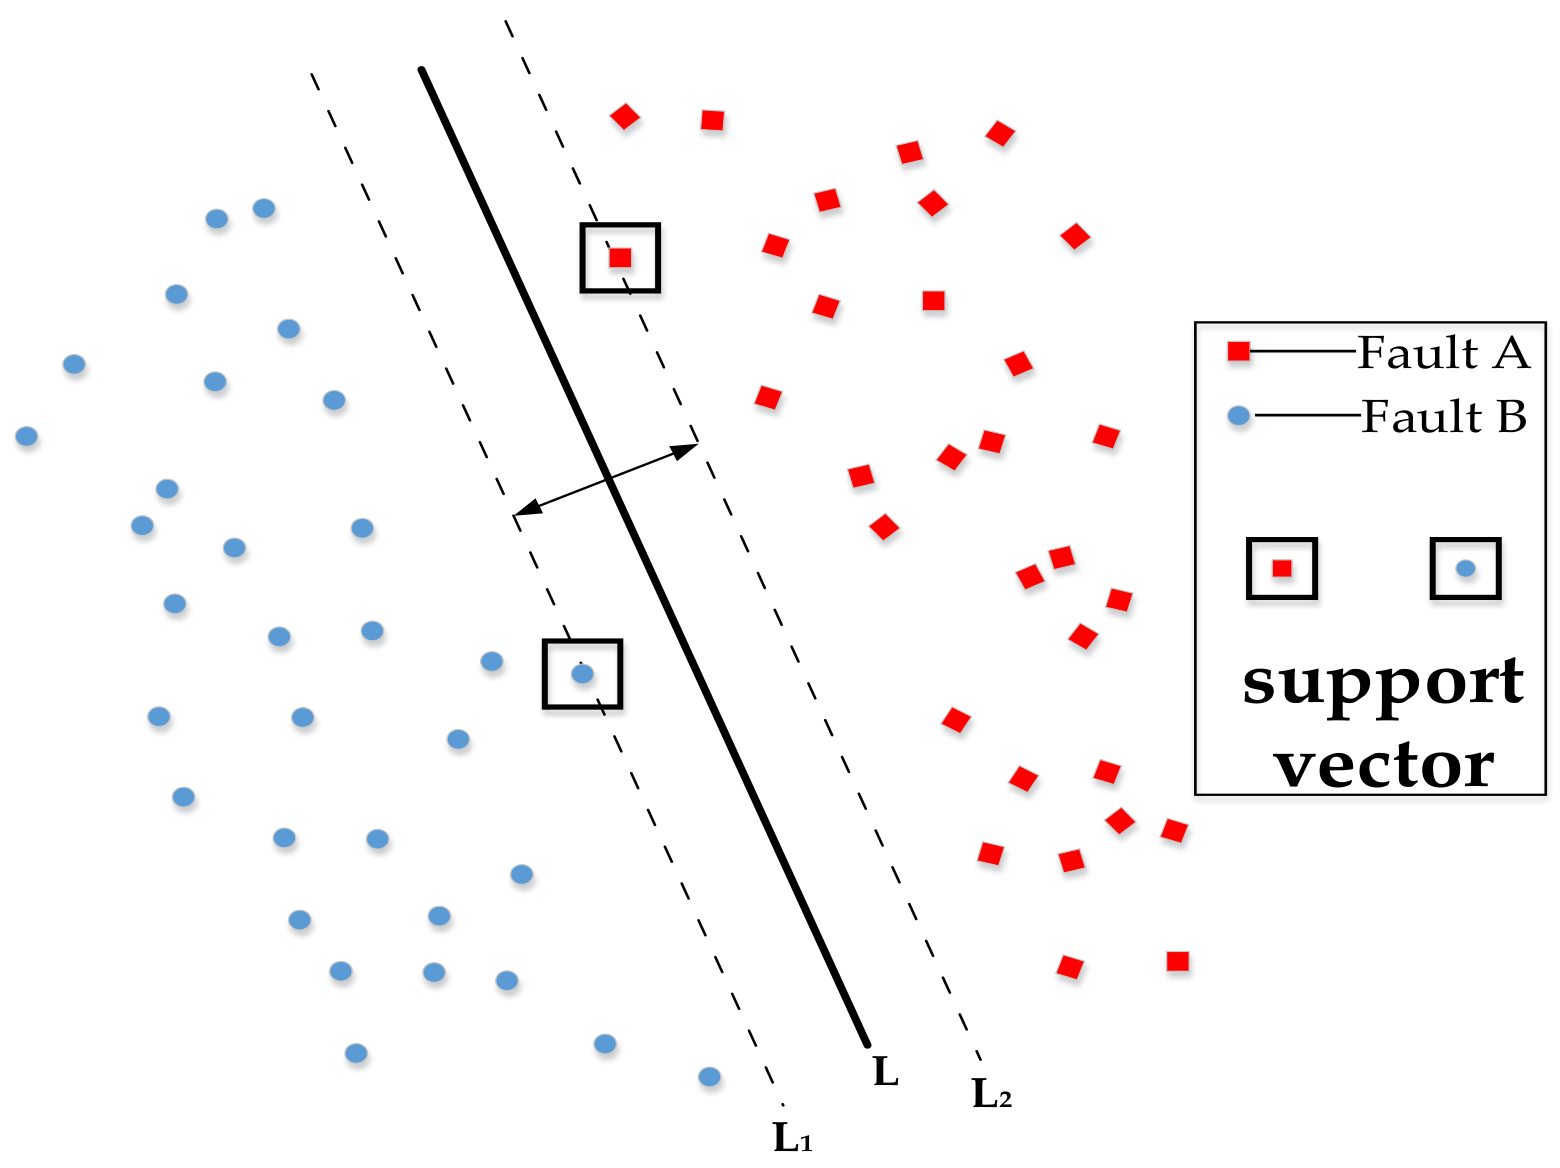
2.3. Classification and Diagnosis Method of Leakage Fault Based on SVM

After the fault features are obtained, it is necessary to interpret and classify the information they represent. In the process of classification by SVM, the fault feature vector obtained by decomposing the hydraulic cylinder pressure signal is represented as Xi, which includes six types of wavelet packet features: energy quantization value, entropy, and energy variance of the pressure on piston side of the hydraulic cylinder as well as the piston rod side. Each input feature vector is matched by setting the corresponding leakage fault mode output label Yi. When the input feature vector only corresponds to two states, these two states can be set as fault A and fault B, and the data label is Yi = 1 or Yi = −1 at this time. As shown in Figure 6, the best interface that can maximize the distance between the two types of samples is found in the samples to be identified, and the support vector is used to outline the best classification surface.
If the input vector set is L = {(Xi, Yi)}, Xi∈R, Yi = 1, the optimization equation for optimizing the classification hyperplane is
1 2 w 2 + C i = 1 n ξ i
Constrained by
Y i w T ϕ ( X i ) + b 1 ξ i , ξ i 0 ,   i = 1 , 2 , , n
where C represents the penalty parameter, ξi is a non-negative relaxation variable, w is the weight vector, b is the value of deviation.
The leakage fault diagnosis of the wing lifting and lowering hydraulic system is a multi-class problem, the C-SVC classifier is established to identify the leakage fault of the system. As the fault classification of the wing lifting and lowering hydraulic system is a nonlinear problem, it is necessary to use the kernel function to solve its classification problem. As a kernel function with strong local processing, the Gaussian radial kernel function (RBF) can map samples from low dimension to high dimensions [38,39]. The RBF-kernel-function-classified hyperplane is in Equation (20):
ω φ ( x ) + b = 0
This paper selects parameters by using the grid search method, and sets the optimal penalty parameter C and gamma parameter after cross-validation. Then, the SVM multi-classification recognition model is trained by the libsvmtrain function using a sample set. The model can be exported for subsequent fault diagnosis and classification after training.

3. Case Study

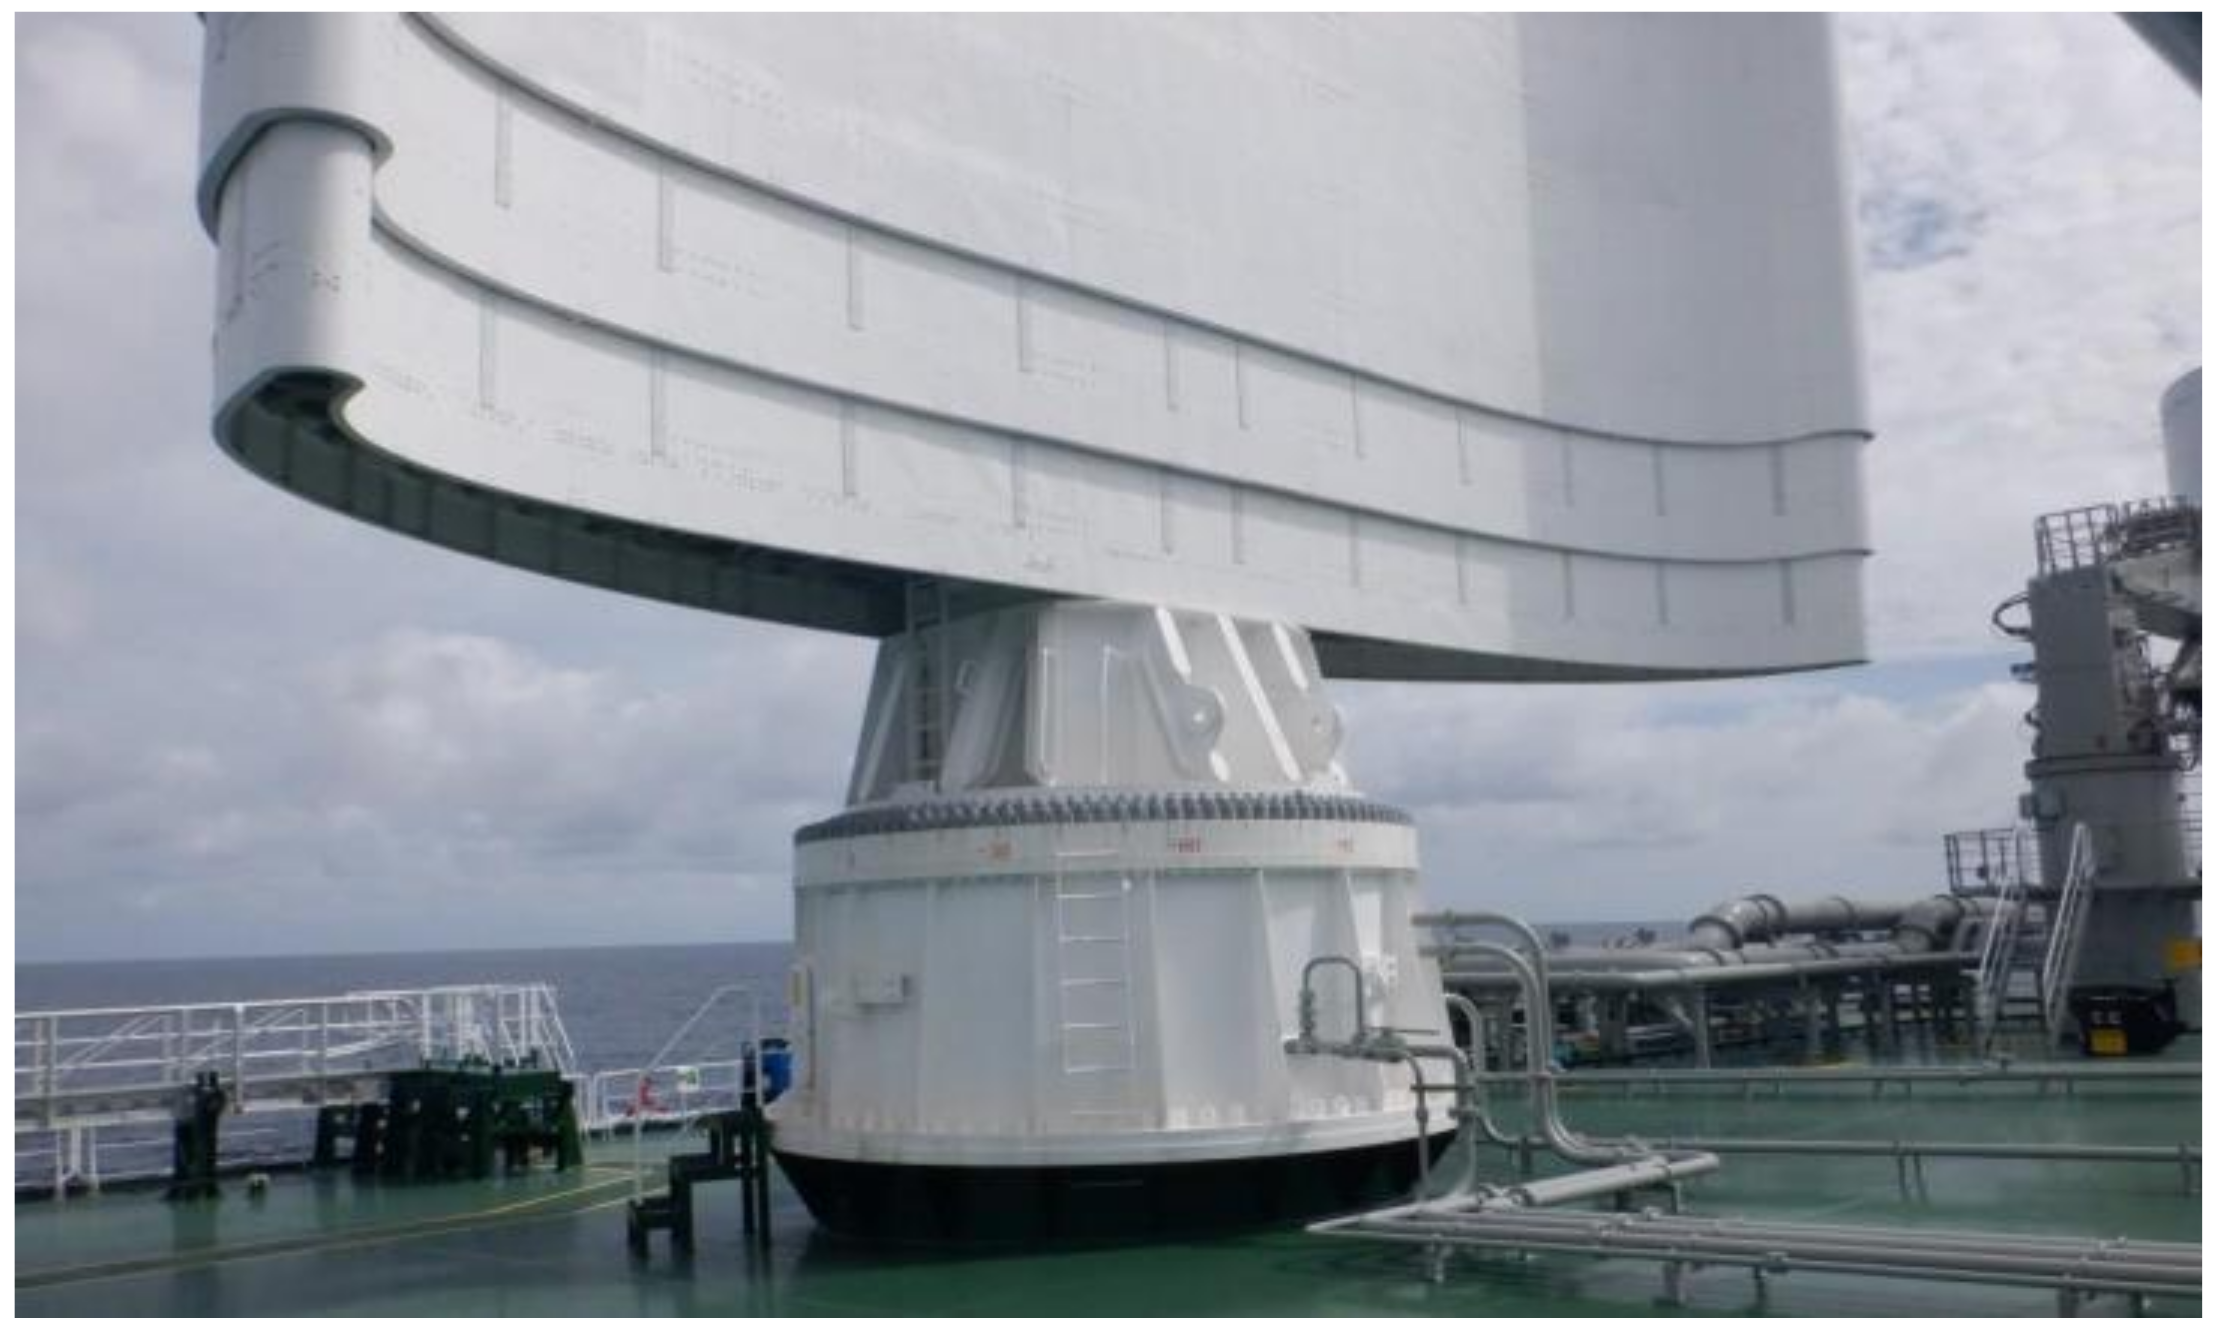
3.1. Research Objects

In this paper, the VLCC “NEW ADEN” is selected as the research object, as shown in Figure 7.
“NEW ADEN” is equipped with four sets of large-scale wings that can automatically lift, lower and rotate according to the wind direction. The wing is made of carbon brazing composite materials, and the masts are made of carbon steel. Its shape is shown in Figure 8 (retracted state), and the weight of a single wing is 170 tons. Table 1 shows the main parameters of the wing.
“NEW ADEN” uses a hydraulic system to drive the wings to lift and lower, and it shares the same hydraulic system with deck machinery such as the winch. There are four identical sets of wing lifting and lowering hydraulic systems assembled to realize the independent lifting/lowering control of each wing. The type of hydraulic oil in the hydraulic system is L-HV46 low pour point anti-wear hydraulic oil, which has a high viscosity index and is less affected by the ambient temperature. This study takes one set of hydraulic systems as research object; Figure 9 shows the layout of the system.
This paper sets the parameters of the established AMESim simulation model according to the existing system, as shown in Table 2.

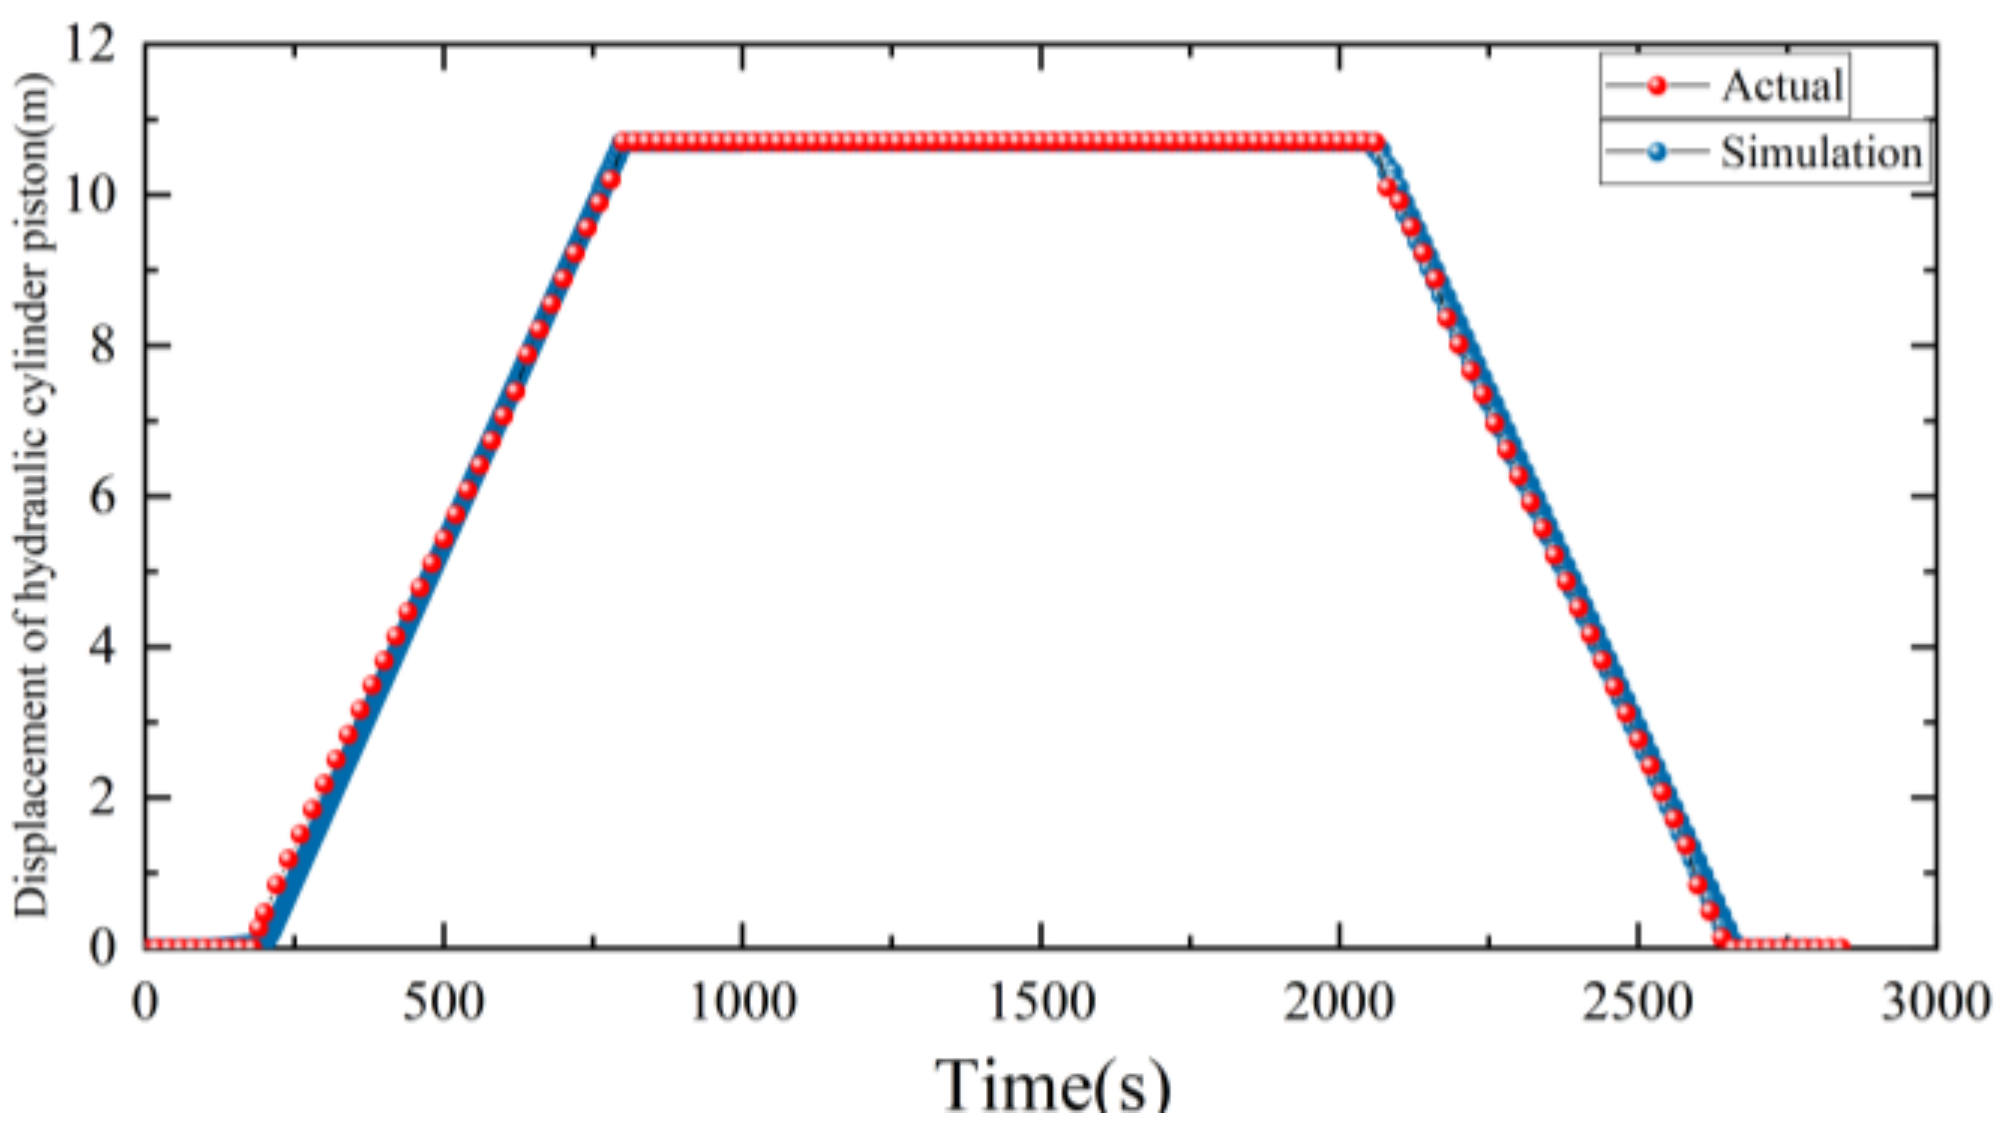
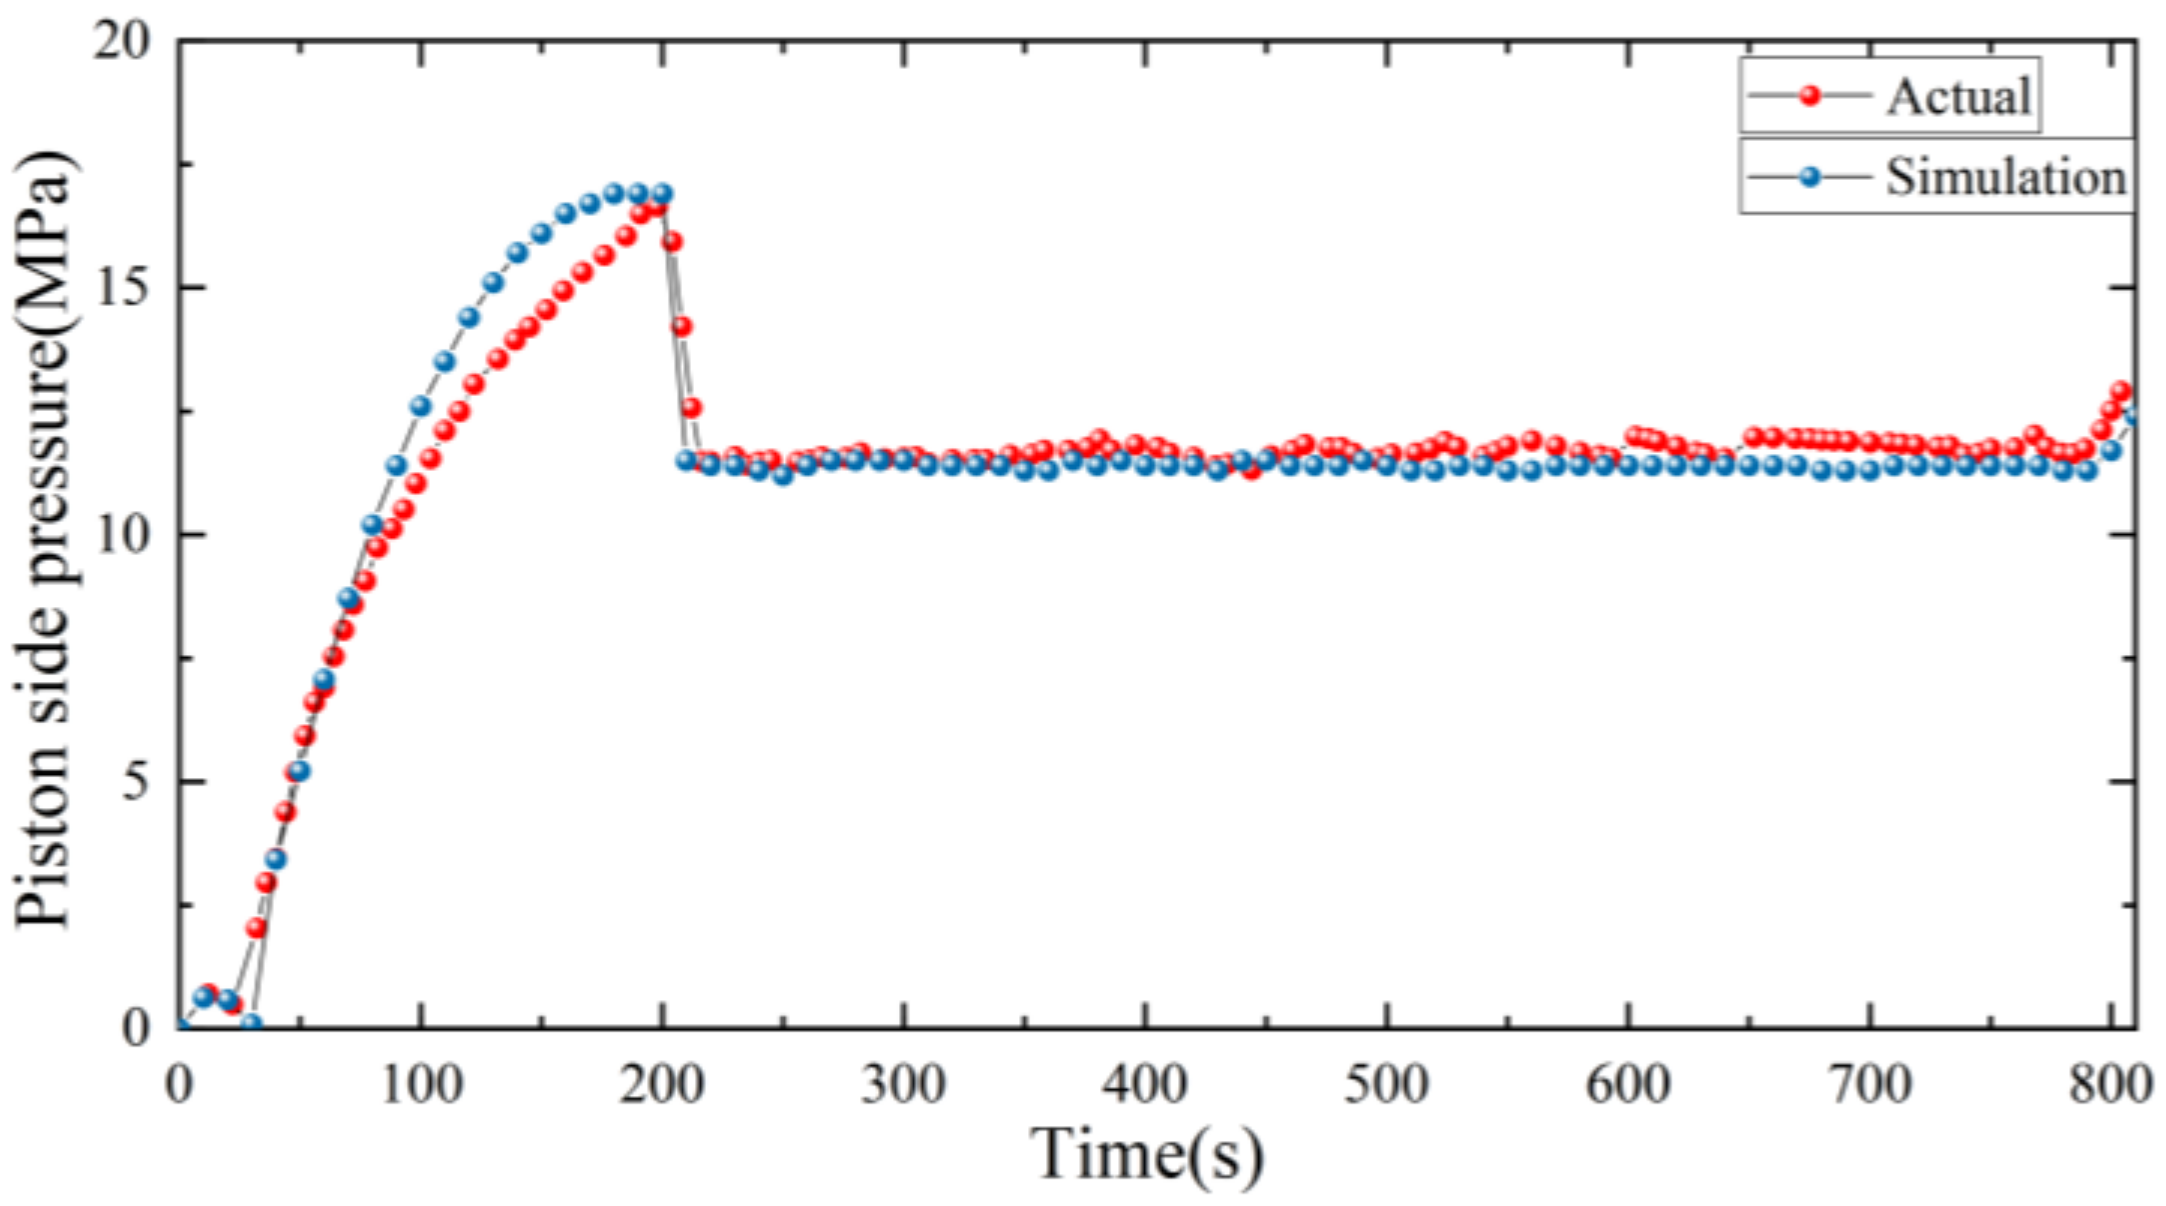
3.2. Effectiveness Analysis of the Model

Figure 10 shows the pressure sensor of the hydraulic system, there are two pressure sensors installed to measure the pressure on hydraulic cylinder piston side and piston rod side of the hydraulic system. An altimeter is set to monitor the real-time height of the piston.
The pressure and piston displacement of the hydraulic system during the lifting stroke are obtained through the pressure sensor and altimeter. As shown in Figure 11, in the actual system, the piston needs 608 s to reach the highest position after receiving the lifting signal, and then keep its height stable. When receiving the lowering signal, it needs 602 s to reach the initial height. For the model, the time required for the piston to rise to the highest position is 600 s, whereas the time needed for the piston to fall from the highest position to the zero position is also 600 s. As the response speed of the components in the flow process of the simulation model is faster than that of the actual system, there is an error of 8s between the model and the actual system in the process of lifting, so that the simulation model can complete the lifting action faster.
The pressure in the lifting process of the wing is extracted for analysis. Figure 12 and Figure 13 show the comparison between the model simulation and the actual system. For actual system, after receiving the lifting signal and carrying out the lifting, the initial pressure is not zero, but gradually increases with the charging pressure, and the maximum pressure is 16.6 MPa. When the lifting command is received at 200 s, the cartridge valve and oil return circuit are opened, and the discharge of oil from the piston rod chamber causes the pressure to plummet to the range of 11.3–11.5 MPa and causes the piston to move up. The pressure on the piston side decreases as the volume of the piston chamber increase, and its initial pressure is about 1.7 MPa. Then, the pressure gradually stabilizes in the range of 0.2–0.4 MPa under the action of oil supply from the hydraulic pump. For the simulation model, the same charging process is set for 200 s, and after that, the lifting signal is input into the system. During the charging process, the maximum pressure on the piston side is 16.9 MPa, and then drops to 11.2–11.5 MPa to gradually stabilize; the pressure then decreases to 0.2–0.5 MPa from 1.6 MPa.
Figure 14 and Figure 15 show the pressure comparison when lowering. For actual hydraulic system, when the lowering operation is carried out, the oil inlet and return circuits are opened, and the piston rod side pressure increases rapidly. As the piston moves down, the volume of the piston rod chamber expands, and the piston rod side pressure finally stabilizes at 3.9–4.1 MPa, in contrast, the piston side pressure decreases from 24.1 MPa under the action of oil unloading, and then the pressure finally stabilizes at 13.8–14.3 MPa due to the volume reduction. For the simulation model, it reaches stable state faster with the same setting of the actual hydraulic system.
Table 3 shows the comparison of results. It can be seen that the simulation has a high consistency with the actual hydraulic system, and can be used for fault feature analysis.

3.3. Leakage Fault Analysis Based on the Established Model

This paper sets different fault signals in the reversing valve and hydraulic cylinder module to simulate the leakage.
(1)
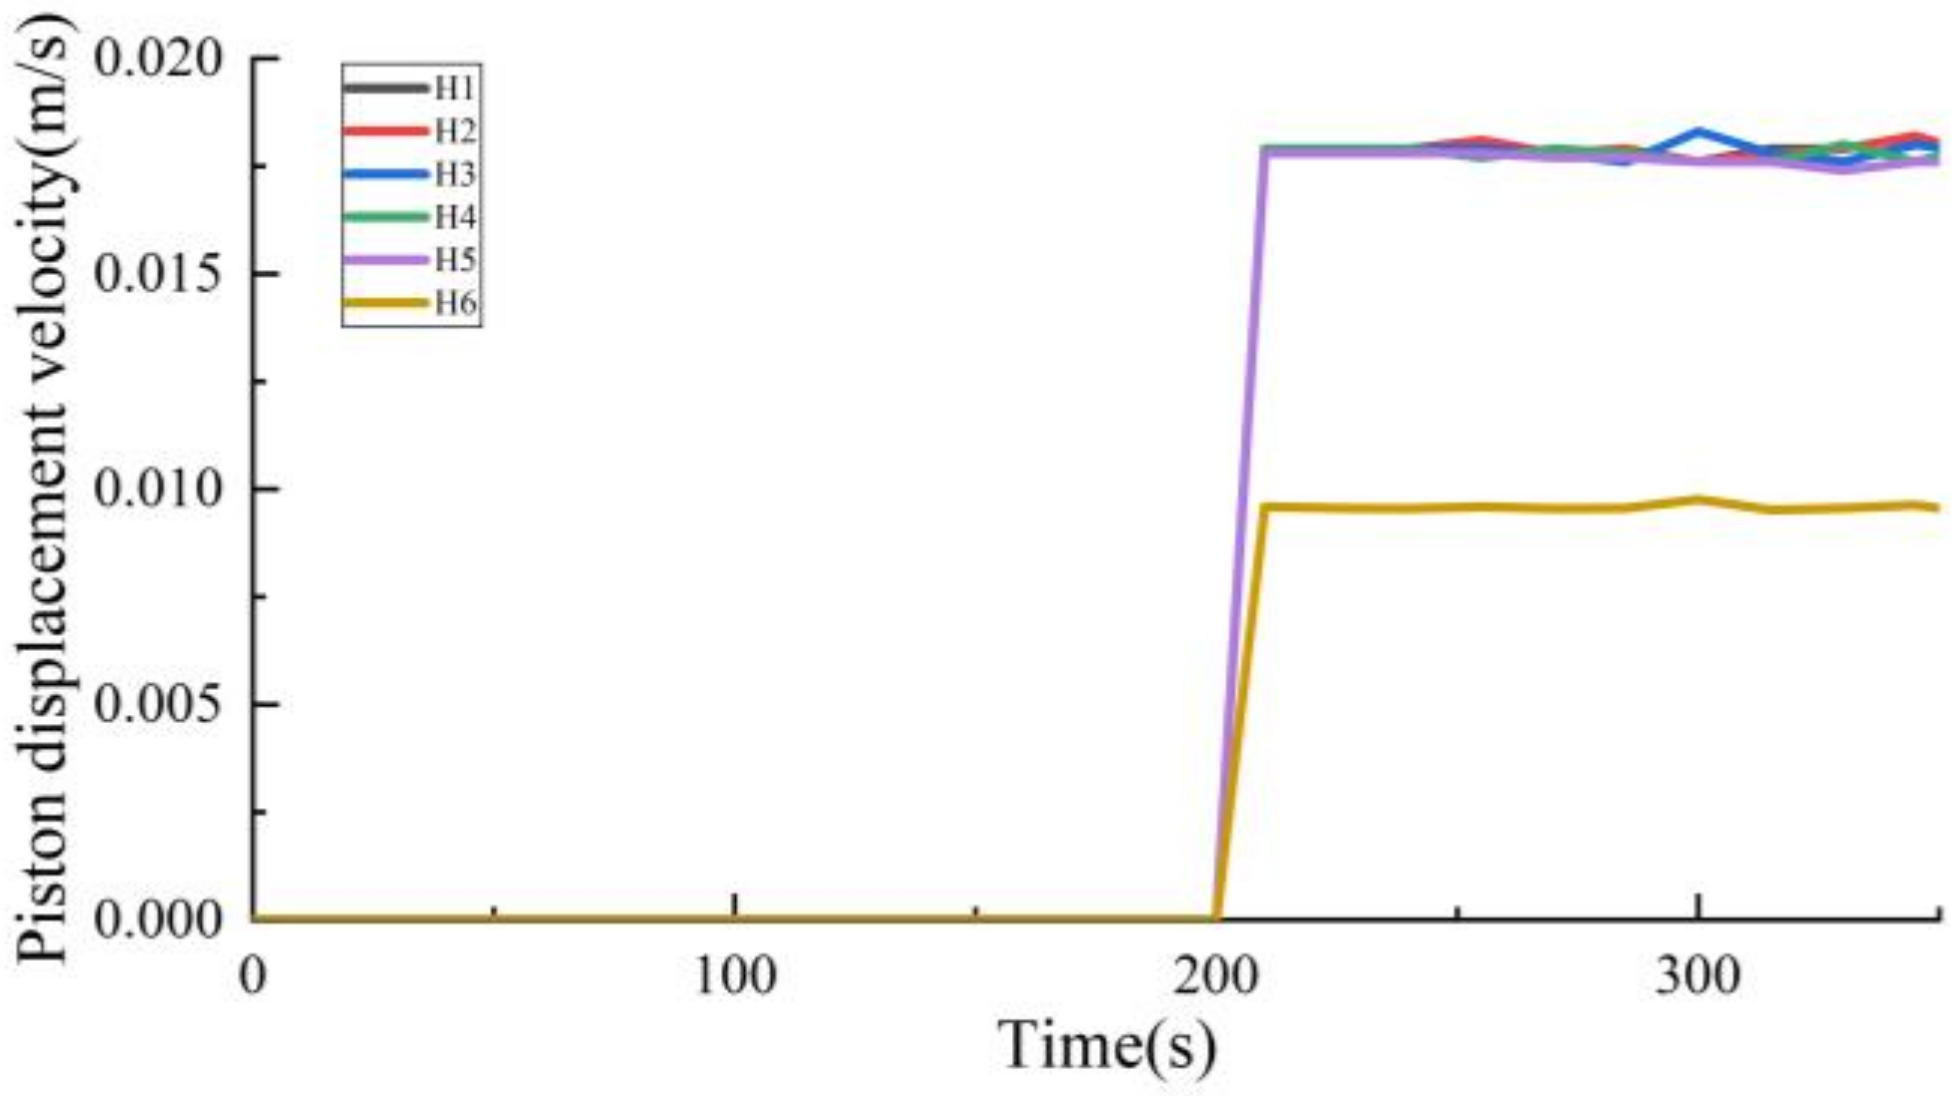
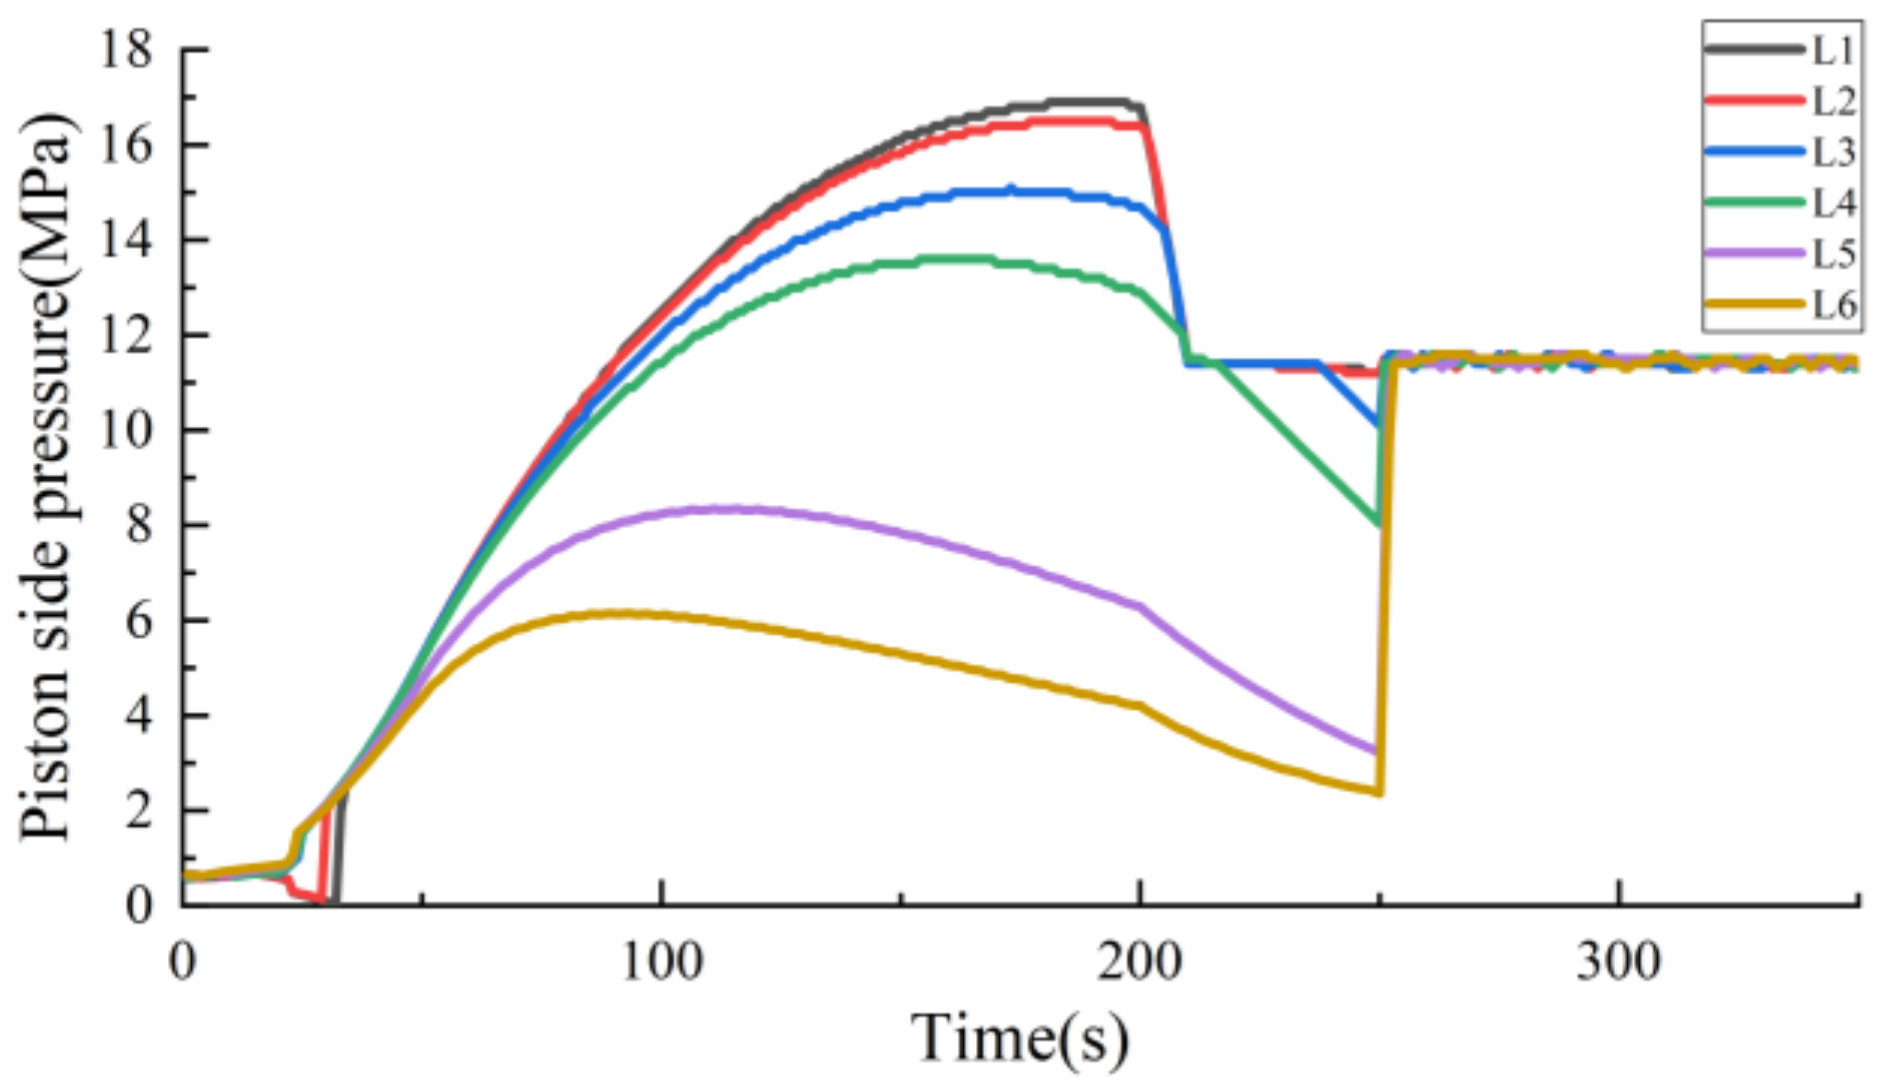
Simulation of leakage in reversing valve
Different radial leakage clearances are set for the leakage mode of the reversing valve system in the model to simulate different degrees of leakage in the reversing valve, and labeled them as shown in Table 4.
According to the simulation of the reversing valve under six different leakage clearances, Figure 16 and Figure 17 show the pressure changes of the hydraulic cylinder. When the radial clearance of the reversing valve is enlarged, the system is greatly affected in the charging stage, and it is hard to keep the pressure of rodless chamber stable, which will lead to the action lag. Regarding the piston rod chamber, the leakage of the reversing valve has no obvious influence on the pressure in it.
Figure 18 shows the piston speed of different leakage clearances of reversing valve, when the leakage clearance of reversing valve is small, it has little influence on the vertical piston speed. When its radial clearance is large, it not only causes the piston speed to clearly decrease, but also causes a particular lag effect on its action.
(2)
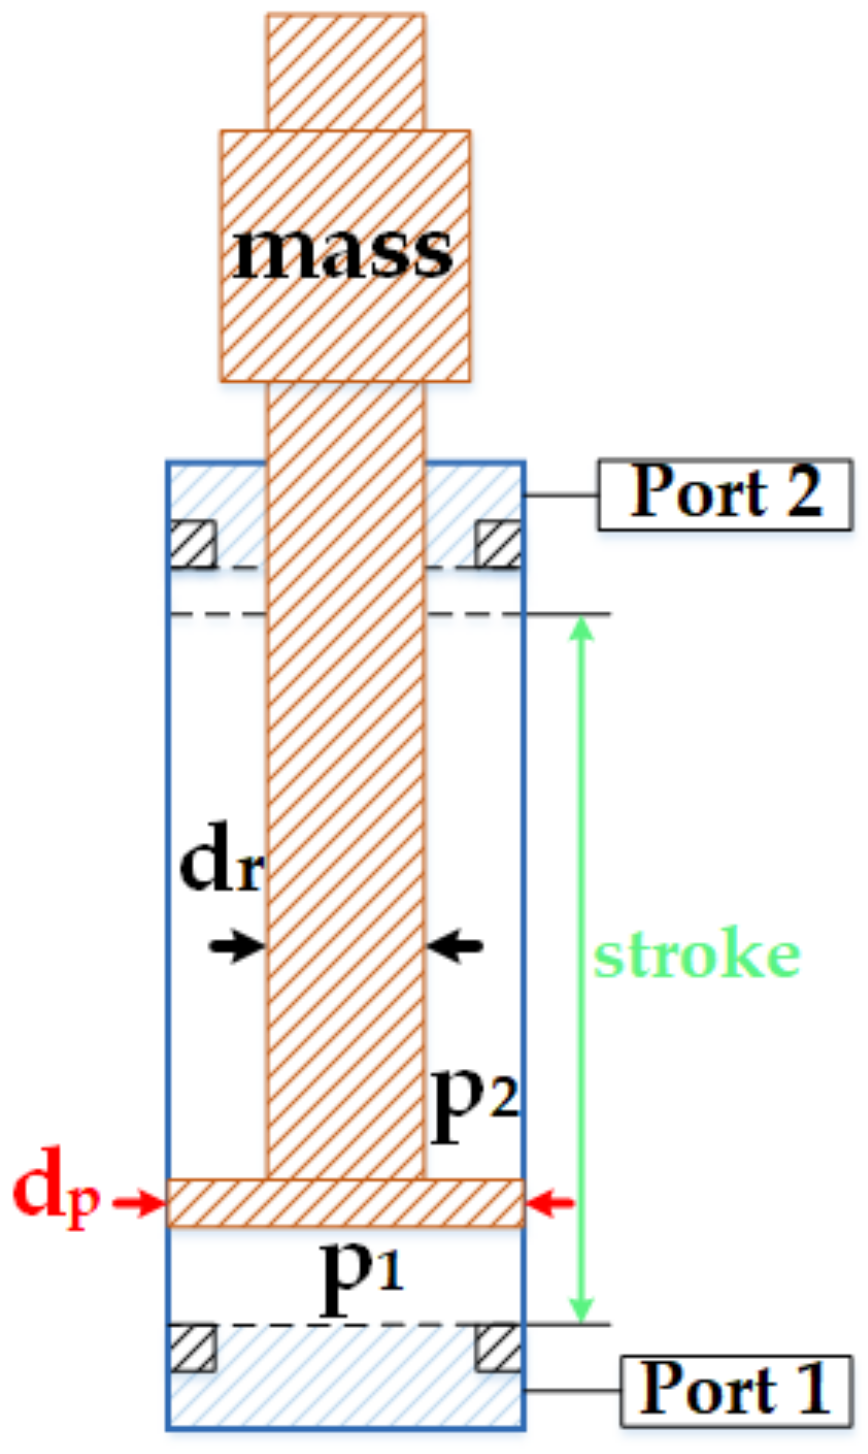
Simulation of leakage in hydraulic cylinder
The leakage in hydraulic cylinder can be considered as leakage in annular clearance, which can be divided into concentric annular clearance and eccentric annular clearance; its schematic diagram is shown in Figure 19.
The internal leakage flowrate caused by the clearance is as follows
Q = ( 1 + 1.5 ε 2 ) π d h 3 12 μ l Δ p
where ε is the eccentricity ratio, it is the ratio of e to h, e is the eccentric distance of the piston, h is the clearance height, d is the piston diameter, △p is the pressure difference between piston side and piston rod side, µ is the dynamic viscosity of hydraulic oil, and l is the clearance length.
When ε is zero, Equation (21) can be used to calculate the internal leakage flowrate caused by concentric annular clearance. Due to the alternating load acted on the wing by wind force, the piston in the hydraulic cylinder will bear radial force, which will aggravate the wear between the piston and sleeve of the hydraulic cylinder. Meanwhile, the wear leads to the decrease in the sealing performance of the piston seal, which will enlarge the clearance between the piston and sleeve, thus causing internal leakage. Therefore, the internal leakage in hydraulic cylinder is considered to be caused by concentric annular clearance in this paper.
Table 5 shows the different degrees of internal leakage of the hydraulic cylinder in this paper.
Figure 20 and Figure 21 show the pressure changes of six different leakage. The pressure on the piston side will be lower than the normal value in the charging stage with the increase of the internal leakage flow, whereas the pressure on the piston rod side will increase slowly. This is caused by the oil leakage from the rodless chamber to the rod chamber, which leads to pressure changes on both sides.
Figure 22 shows the change in the piston speed of different internal leakage flows. It can be seen that the lifting speed of the wing also decreases as the internal leakage flow increases. It is not apparent when the internal leakage flow is lower than 1.2 L/min; however, the piston speed clearly decreases when the leakage flow reaches 6 L/min.
When leakage occurs in the reversing valve and the hydraulic cylinder, the pressure on both sides will change correspondingly, and that will affect the energy flow in the pressure signal. Therefore, it is feasible to find the leakage fault-sensitive characteristics contained in the pressure signal by analyzing the pressure on both sides.

3.4. Leakage Fault Characteristics

Based on the WPT fault feature extraction method proposed in Section 2.2, Figure 23 and Figure 24 show each sub band’s energy distribution of the reversing valve with six different leakage clearances.
On the piston rod side, as the leakage clearance increasing in reversing valve, the S4,0 sub band energy of rod chamber decreases, while the energy of the other sub bands gradually increases and the flow process in the rod chamber becomes disordered. On the piston side, the wavelet packet energy of all sub bands decreases when the leakage clearance is small, as the leakage clearance increase, the energy of S4,0 sub band decreases rapidly, while the energy of other sub bands increases quickly.
Figure 25 and Figure 26 show each sub band energy distribution of the hydraulic cylinder with the six different leakage flows.
Since the percentage of S4,0 sub band energy is much higher than other sub bands, the amplitude of S4,0 energy change is much larger than other sub bands when the hydraulic cylinder is leaking, and the disorder of energy distribution changes at this time.
Table 6 shows the fault characteristics of wavelet packets with different leakage.
The leakage fault characteristic group X = [a, b, c, d, e, f] can be established, and the wavelet packet eigenvalues are obtained for the six groups of pressure signal collected under different clearances of the reversing valve, as shown in Table 7.
The wavelet packet eigenvalues were obtained for the six sets of pressure signal collected from hydraulic cylinders with different degrees of internal leakage, as shown in Table 8.
The results show that, when the leakage clearance of the reversing valve is small, the wavelet packet energy and energy variance show an increasing trend; in contrast, the entropy of the piston side wavelet packet shows a decreasing trend. However, when the leakage clearance of the reversing valve is enlarged, they all become smaller, which is particularly obvious in the wavelet packet energy characteristics of the piston side pressure. As for the hydraulic cylinder, with the increase of leakage in it, they all decrease in the piston side pressure, while they increase in the piston rod side pressure. This says that the oil flow at the piston rod side is more disorderly, and the energy distribution becomes complicated.
Therefore, the energy variance, quantized energy value, and energy entropy of the wavelet packet can be used as effective characteristics to reflect the leakage fault of the wing lifting and lowering hydraulic system.

3.5. Leakage Fault Diagnosis Results and Analysis

This paper set seven types of fault modes, as shown in Table 9.
To study the diagnostic recognition of the seven types of fault modes, the fault recognition feature group X by the piston side/piston rod side pressure corresponding wavelet packet energy quantization value, energy entropy, and energy variance is established. After that, ten groups fault states are randomly simulated in the range of each type of leakage degree, and the signal of the simulation result is subjected to feature extraction. In total, 80 groups of feature data sets are extracted, among which 20 groups are normal; the remaining 60 groups contain six types of fault modes. The training set is built based on these 80 groups of data, as shown in Table 10 and Table 11.
The fault diagnosis classification model is obtained based on the method in Section 2.3, and 120 sets of characteristic data sets are obtained by randomly simulating various types of fault situations. Table 12 shows the test sets of the leakage fault.
Figure 27 shows the classification results in this paper; only three fault samples are misclassified.
Figure 28 shows the classification accuracy of the kernel parameters, which is 97.5%. The fault diagnosis model established in this paper can realize high-precision diagnostic recognition.
The diagnostic results and the diagnosis accuracy for each type of fault are shown in Figure 29.
The accuracy of all fault modes is shown in Table 13.
The results show that the fault diagnosis model has a 93.3% and higher accuracy for different fault modes, and the average accuracy for the whole fault modes is 97.5%. Additionally, the good fault identification result only needs small sample of pressure signals.

4. Conclusions

In this paper, the WPT-SVM-based leakage fault diagnosis method of the wing lifting and lowering hydraulic system is proposed. The proposed method is capable of diagnosing reversing valve and hydraulic cylinder internal leakage faults with only a small sample of pressure signals. Firstly, the pressure signals of hydraulic cylinder piston side and piston rod side are obtained using an AMESim simulation model. The effectiveness of the model is verified by pressure and piston displacement comparisons between the simulation and the actual hydraulic systems of a VLCC. The pressure on cylinder and piston displacement comparation results between simulation model and actual hydraulic system show that the model has highly consistency with the actual hydraulic system. Then, leakage fault features of hydraulic cylinder pressure signal are extracted by WPT to establish the fault feature set. Lastly, an SVM-based classification fault diagnosis method is proposed to realize diagnosis on internal leakage of the reversing valve and hydraulic cylinder.
The case study results show that the proposed method can effectively achieve the diagnosis of different leakage faults with an accuracy of 97.5%. Meanwhile, the proposed method can achieve a high fault diagnostic accuracy even with small samples, and thus can be easily applied to the wing-assisted ships. In addition, the proposed method would play an important role to ensure the optimization effect of the energy efficiency of wing-assisted ships by improving the reliability of the lifting and lowering hydraulic system, and thus contributing to the development of green ships.
Although the proposed method can effectively achieve the diagnosis of different leakage faults, some influencing factors, such as the heat exchange with the environment, are not fully considered. Considering that the ship is sailing at different zones and in different seasons, more influencing factors, including the heat exchange with the environment, will be comprehensively considered in the further research in order to make the model and method more effective.

Author Contributions

Conceptualization, R.M., H.Z. and L.H.; methodology, R.M., H.Z. and K.W.; software, R.M., H.Z. and Z.R.; validation, R.M., K.W. and L.H.; investigation, K.W., Y.H., B.J. and L.H.; resources, R.M. and L.H.; data curation, R.M.; writing—original draft preparation, H.Z., Y.H. and F.T.; writing—review and editing, R.M., K.W., R.Z. and H.W.; visualization, R.M. and H.Z.; supervision, K.W. and L.H.; funding acquisition, K.W. and L.H. All authors have read and agreed to the published version of the manuscript.

Funding

This research was funded by National Key Research and Development Program of China (2022YFB4300800), National Natural Science Foundation of China (52071045, 52271305), High-tech Ship Research Project of China Ministry of Industry and Information Technology (2019360), China Postdoctoral Science Foundation (2020M670735, 2021T140080), Fundamental Research Funds for Universities (LJKQZ2021009), the Project from Key Lab. of Marine Power Engineering and Tech. authorized by MOT (KLMPET2020-06).

Institutional Review Board Statement

Not applicable.

Informed Consent Statement

Not applicable.

Data Availability Statement

All data are publicly available, and the sources of the data are provided in the paper.

Conflicts of Interest

The authors declare no conflict of interest.

References

  1. Czermański, E.; Oniszczuk-Jastrzabek, A.; Spangenberg, E.F.; Kozłowski, Ł.; Adamowicz, M.; Jankiewicz, J.; Cirella, G.T. Implementation of the Energy Efficiency Existing Ship Index: An important but costly step towards ocean protection. Mar. Policy 2022, 145, 105259. [Google Scholar] [CrossRef]
  2. Jimenez, V.J.; Kim, H.; Munim, Z.H. A review of ship energy efficiency research and directions towards emission reduction in the maritime industry. J. Clean. Prod. 2022, 366, 132888. [Google Scholar] [CrossRef]
  3. IMO. Prevention of Air Pollution from Ships (Third IMO GHG Study 2014); Marine Environment Protection Committee (MEPC): London, UK, 25 July 2014. [Google Scholar]
  4. Joung, T.H.; Kang, S.G.; Lee, J.K.; Ahn, J. The IMO initial strategy for reducing Greenhouse Gas (GHG) emissions, and its follow-up actions towards 2050. J. Int. Marit. Saf. Environ. Aff. Shipp. 2020, 4, 1–7. [Google Scholar] [CrossRef] [Green Version]
  5. Wang, K.; Guo, X.; Zhao, J.H.; Ma, R.Q.; Huang, L.Z.; Tian, F.; Dong, S.Y.; Zhang, P.; Liu, C.L.; Wang, Z. An integrated collaborative decision-making method for optimizing energy consumption of sail-assisted ships towards low-carbon shipping. Ocean. Eng. 2022, 266, 112810. [Google Scholar] [CrossRef]
  6. Yuan, Y.; Wang, J.; Yan, X.; Shen, B.; Long, T. A review of multi-energy hybrid power system for ships. Renew. Sustain. Energy Rev. 2020, 132, 110081. [Google Scholar] [CrossRef]
  7. Wang, K.; Xue, Y.; Xu, H.; Huang, L.; Ma, R.; Zhang, P.; Jiang, X.; Yuan, Y.; Negenborn, R.R.; Sun, P. Joint energy consumption optimization method for wing-diesel engine-powered hybrid ships towards a more energy-efficient shipping. Energy 2022, 245, 123155. [Google Scholar] [CrossRef]
  8. Gan, M.; Hou, H.; Wu, X.; Liu, B.; Yang, Y.; Xie, C. Machine learning algorithm selection for real-time energy management of hybrid energy ship. Energy Rep. 2022, 8, 1096–1102. [Google Scholar] [CrossRef]
  9. Tillig, F.; Ringsberg, J.W. Design, operation and analysis of wind-assisted cargo ships. Ocean. Eng. 2020, 211, 107603. [Google Scholar] [CrossRef]
  10. Silva, M.F.; Friebe, A.; Malheiro, B.; Guedes, P.; Ferreira, P.; Waller, M. Rigid wing sailboats: A state of the art survey. Ocean. Eng. 2019, 187, 106150. [Google Scholar] [CrossRef]
  11. Nyanya, M.N.; Vu, H.B.; Schönborn, A.; Ölçer, A.I. Wind and solar assisted ship propulsion optimisation and its application to a bulk carrier. Sustain. Energy Technol. Assess. 2021, 47, 101397. [Google Scholar] [CrossRef]
  12. He, J.; Hu, Y.; Tang, J.; Xue, S. Research on sail aerodynamics performance and sail-assisted ship stability. J. Wind. Eng. Ind. Aerodyn. 2015, 146, 81–89. [Google Scholar] [CrossRef]
  13. Talluri, L.; Nalianda, D.K.; Giuliani, E. Techno economic and environmental assessment of Flettner rotors for marine propulsion. Ocean. Eng. 2018, 154, 1–15. [Google Scholar] [CrossRef] [Green Version]
  14. Schönborn, A. Combination of propulsive thrust and rotational power for ships from a cyclic pitch Darrieus rotor sail. Sustain. Energy Technol. Assess. 2022, 52, 102008. [Google Scholar] [CrossRef]
  15. Kim, J.; Park, C. Wind power generation with a parawing on ships, a proposal. Energy 2010, 35, 1425–1432. [Google Scholar] [CrossRef]
  16. Ma, Y.; Bi, H.; Hu, M.; Zheng, Y.; Gan, L. Hard sail optimization and energy efficiency enhancement for sail-assisted vessel. Ocean. Eng. 2019, 173, 687–699. [Google Scholar] [CrossRef]
  17. Yu, H.; Li, H.; Li, Y. Vibration signal fusion using improved empirical wavelet transform and variance contribution rate for weak fault detection of hydraulic pumps. ISA Trans. 2020, 107, 385–401. [Google Scholar] [CrossRef]
  18. Ji, X.; Ren, Y.; Tang, H.; Shi, C.; Xiang, J. An intelligent fault diagnosis approach based on Dempster-Shafer theory for hydraulic valves. Measurement 2020, 165, 108129. [Google Scholar]
  19. Nie, S.; Guo, M.; Yin, F.; Ji, H.; Ma, Z.; Hu, Z.; Zhou, X. Research on fluid-structure interaction for piston/cylinder tribopair of seawater hydraulic axial piston pump in deep-sea environment. Ocean. Eng. 2021, 219, 108222. [Google Scholar] [CrossRef]
  20. Zhao, X.; Zhang, S.; Zhou, C.; Hu, Z.; Li, R.; Jiang, J. Experimental study of hydraulic cylinder leakage and fault feature extraction based on wavelet packet analysis. Comput. Fluids 2015, 106, 33–40. [Google Scholar] [CrossRef]
  21. Kumar, N.; Kumar, R.; Sarkar, B.K.; Maity, S. Condition monitoring of hydraulic transmission system with variable displacement axial piston pump and fixed displacement motor. Mater. Today Proc. 2021, 46, 9758–9765. [Google Scholar] [CrossRef]
  22. Shi, J.; Yi, J.; Ren, Y.; Li, Y.; Zhong, Q.; Tang, H.; Chen, L. Fault diagnosis in a hydraulic directional valve using a two-stage multi-sensor information fusion. Measurement 2021, 179, 109460. [Google Scholar] [CrossRef]
  23. Qiu, Z.; Min, R.; Wang, D.; Fan, S. Energy features fusion based hydraulic cylinder seal wear and internal leakage fault diagnosis method. Measurement 2022, 195, 111042. [Google Scholar] [CrossRef]
  24. Lei, Y.; Yang, B.; Jiang, X.; Jia, F.; Li, N.; Nandi, A.K. Applications of machine learning to machine fault diagnosis: A review and roadmap. Mech. Syst. Signal Process. 2020, 138, 106587. [Google Scholar] [CrossRef]
  25. Panda, A.K.; Rapur, J.S.; Tiwari, R. Prediction of flow blockages and impending cavitation in centrifugal pumps using Support Vector Machine (SVM) algorithms based on vibration measurements. Measurement 2018, 130, 44–56. [Google Scholar] [CrossRef]
  26. Jegadeeshwaran, R.; Sugumaran, V. Fault diagnosis of automobile hydraulic brake system using statistical features and support vector machines. Mech. Syst. Signal Process. 2015, 52–53, 436–446. [Google Scholar] [CrossRef]
  27. Zhang, J.; Zhang, J.; Zhong, M.; Zheng, J.; Yao, L. A GOA-MSVM based strategy to achieve high fault identification accuracy for rotating machinery under different load conditions. Measurement 2020, 163, 108067. [Google Scholar] [CrossRef]
  28. Zhang, X.; Zhang, M.; Xiang, Z.; Mo, J. Research on diagnosis algorithm of mechanical equipment brake friction fault based on MCNN-SVM. Measurement 2021, 186, 110065. [Google Scholar] [CrossRef]
  29. Tang, S.; Zhu, Y.; Yuan, S. An adaptive deep learning model towards fault diagnosis of hydraulic piston pump using pressure signal. Eng. Fail. Anal. 2022, 138, 106300. [Google Scholar] [CrossRef]
  30. Zhu, Y.; Li, G.; Wang, R.; Tang, S.; Su, H.; Cao, K. Intelligent fault diagnosis of hydraulic piston pump combining improved LeNet-5 and PSO hyperparameter optimization. Appl. Acoust. 2021, 183, 108336. [Google Scholar] [CrossRef]
  31. Wang, B.; Zhang, X.; Xing, S.; Sun, C.; Chen, X. Sparse representation theory for support vector machine kernel function selection and its application in high-speed bearing fault diagnosis. ISA Trans. 2021, 118, 207–218. [Google Scholar] [CrossRef]
  32. Lan, Y.; Hu, J.; Huang, J.; Niu, L.; Zeng, X.; Xiong, X.; Wu, B. Fault diagnosis on slipper abrasion of axial piston pump based on Extreme Learning Machine. Measurement 2018, 124, 378–385. [Google Scholar] [CrossRef]
  33. Rajeswari, C.; Sathiyabhama, B.; Devendiran, S.; Manivannan, K. Bearing Fault Diagnosis using Wavelet Packet Transform Hybrid PSO and Support Vector Machine. Procedia Eng. 2014, 97, 1772–1783. [Google Scholar] [CrossRef] [Green Version]
  34. Liu, Z.; Cao, H.; Chen, X.; He, Z.; Shen, Z. Multi-fault classification based on wavelet SVM with PSO algorithm to analyze vibration signals from rolling element bearings. Neurocomputing 2013, 99, 399–410. [Google Scholar] [CrossRef]
  35. Wei, H.; Zhang, Q.; Shang, M.; Gu, Y. Extreme learning Machine-based classifier for fault diagnosis of rotating Machinery using a residual network and continuous wavelet transform. Measurement 2021, 183, 109864. [Google Scholar] [CrossRef]
  36. Li, N.; Zhou, R.; Hu, Q.; Liu, X. Mechanical fault diagnosis based on redundant second generation wavelet packet transform, neighborhood rough set and support vector machine. Mech. Syst. Signal Process. 2012, 28, 608–621. [Google Scholar] [CrossRef]
  37. Qu, J.; Zhang, Z.; Gong, T. A novel intelligent method for mechanical fault diagnosis based on dual-tree complex wavelet packet transform and multiple classifier fusion. Neurocomputing 2016, 171, 837–853. [Google Scholar] [CrossRef]
  38. Liu, J.; Li, Y.F.; Zio, E. A SVM framework for fault detection of the braking system in a high speed train. Mech. Syst. Signal Process. 2017, 87, 401–409. [Google Scholar] [CrossRef]
  39. Mei, F.; Liu, N.; Miao, H.; Pan, Y.; Sha, H.; Zheng, J. On-line fault diagnosis model for locomotive traction inverter based on wavelet transform and support vector machine. Microelectron. Reliab. 2018, 88–90, 1274–1280. [Google Scholar]
Figure 1. Fault diagnosis process of the wing hydraulic lifting and lowering hydraulic system based on WPT-SVM.
Jmse 11 00027 g001
Figure 2. Schematic diagram of the wing lifting and lowering hydraulic system. 1. Hydraulic pump; 2. globe valve; 3. check valve; 4. cartridge valve; 5. electro-hydraulic re-versing valve; 6. balance valve group; 7. safety globe valve group; 8. hydraulic cylinder; 9. oil return filter.
Jmse 11 00027 g002
Figure 3. Simulation model of the wing lifting and lowering hydraulic system. 1. Hydraulic pump; 2. globe valve; 3. check valve; 4. cartridge valve; 5. electro-hydraulic re-versing valve; 6. balance valve group; 7. safety globe valve group; 8. hydraulic cylinder; 9. oil return filter.
Jmse 11 00027 g003
Figure 4. State analysis of hydraulic cylinder piston.
Jmse 11 00027 g004
Figure 5. Four-layer wavelet packet decomposition diagram.
Jmse 11 00027 g005
Figure 6. Optimal classification surface.
Jmse 11 00027 g006
Figure 7. VLCC “NEW ADEN”.
Jmse 11 00027 g007
Figure 8. The wing of “NEW ADEN”.
Jmse 11 00027 g008
Figure 9. The hydraulic system layout.
Jmse 11 00027 g009
Figure 10. Pressure sensor.
Jmse 11 00027 g010
Figure 11. Piston lifting displacement.
Jmse 11 00027 g011
Figure 12. Piston side pressure when lifting.
Jmse 11 00027 g012
Figure 13. Piston rod side pressure when lifting.
Jmse 11 00027 g013
Figure 14. Piston side pressure when lowering.
Jmse 11 00027 g014
Figure 15. Piston rod side pressure when lowering.
Jmse 11 00027 g015
Figure 16. Piston side pressure of different leakage clearance.
Jmse 11 00027 g016
Figure 17. Piston rod side pressure of different leakage clearance.
Jmse 11 00027 g017
Figure 18. Piston speed of different leakage clearance.
Jmse 11 00027 g018
Figure 19. Radial clearance of hydraulic cylinder.
Jmse 11 00027 g019
Figure 20. Piston side pressure of different leakage flow.
Jmse 11 00027 g020
Figure 21. Piston rod side pressure of different leakage flow.
Jmse 11 00027 g021
Figure 22. Piston speed of different leakage flow.
Jmse 11 00027 g022
Figure 23. Characteristic energy of piston side pressure wavelet packet when reversing valve leaks.
Jmse 11 00027 g023
Figure 24. Characteristic energy of piston rod side pressure wavelet packet when reversing valve leaks.
Jmse 11 00027 g024
Figure 25. Characteristic energy of wavelet packet of piston side pressure when hydraulic cylinder leaks.
Jmse 11 00027 g025
Figure 26. Characteristic energy of wavelet packet of piston rod side pressure when hydraulic cylinder leaks.
Jmse 11 00027 g026
Figure 27. Classification results.
Jmse 11 00027 g027
Figure 28. Accuracy of parameter classification.
Jmse 11 00027 g028
Figure 29. Distribution of diagnosis results.
Jmse 11 00027 g029
Table 1. Main parameters of the wing.
ItemParameter
Height39.68 m
Width14.80 m
Wing height35.60 m
Mast height37.40 m
Base height2.268 m
Section3
Numbers of the wing4
Table 2. Parameters of the hydraulic system.
EquipmentPicturesParameterValue
Hydraulic pumpJmse 11 00027 i001Rated speed
Displacement
Volumetric efficiency
Mechanical efficiency
1780 r/min
100 cc/rev
98%
98%
Cartridge valveJmse 11 00027 i002Diameter of poppet
Diameter of hole
Opening for maximum area
40 mm
30 mm
5 mm
Electro-hydraulic reversing valveJmse 11 00027 i003Piston diameter
Rod diameter
Spring rate
40 mm
20 mm
20 N/mm
Balance valve groupJmse 11 00027 i004Characteristic flow rate at maximum opening120 L/min
Safety globe valve groupJmse 11 00027 i005Relief valve cracking pressure
Diameter of poppet
Diameter of hole
25 MPa
40 mm
30 mm
Hydraulic
cylinder
Jmse 11 00027 i006Piston diameter
Rod diameter
Length of stroke
Total mass being moved
320 mm
280 mm
10.705 m
170,000 kg
Table 3. Comparison of results.
ItemActualSimulation
Lifting time608 s600 s
Lowering time602 s600 s
Piston side pressure before lifting16.6 MPa16.9 MPa
Piston rod side pressure before lifting1.7 MPa1.6 MPa
Piston side pressure when lifting11.3–11.5 MPa11.2–11.5 MPa
Piston rod side pressure when lifting0.2–0.4 MPa0.2–0.5 MPa
Piston side pressure before lowering24.1 MPa24 MPa
Piston rod side pressure before lowering2.5 MPa2.5 MPa
Piston side pressure when lowering13.8–14.3 MPa14.3 MPa
Piston rod side pressure when lowering3.9–4.1 MPa4.1 MPa
Table 4. Leakage clearance of reversing valve.
Leakage Clearance (mm)0.00010.0010.0050.010.050.2
LabelH1H2H3H4H5H6
Table 5. Leakage clearance of hydraulic cylinder.
Leakage Clearance (mm)0.0450.2080.3780.4760.8141.025
LabelL1L2L3L4L5L6
Table 6. Fault characteristics of wavelet packets.
Decomposition ObjectFeature NameLabel
Four-layer decomposition of db6 wavelet packet for piston side pressure dataWavelet packet energy quantization valuea
Wavelet packet entropyb
Wavelet packet energy variancec
Four-layer decomposition of db6 wavelet packet for piston rod lateral pressure dataWavelet packet energy quantization valued
Wavelet packet entropye
Wavelet packet energy variancef
Table 7. Characteristic value of wavelet packet of reversing valve leakage.
LabelLeakage Clearance (mm)a (×104)b (×10−9)c (×105)d (×104)e (×10−9)f (×104)
H10.00014.75397.06385.51771.09086.73472.9047
H20.0014.75407.06345.51791.09116.73512.9064
H30.0054.75417.06345.51801.09116.73532.9065
H40.014.75427.06305.51811.09116.73042.9066
H50.054.73707.06105.47851.07336.91912.8224
H60.203.291916.78142.64570.99639.38022.4944
Table 8. Characteristic value of hydraulic cylinder leakage wavelet packet.
LabelLeakage Speed (L/min)a (×104)b (×10−9)c (×105)d (×104)e (×10−9)f (×104)
L104.75407.06385.51771.09086.73312.9047
L20.14.75057.04935.50951.11046.97763.0107
L30.64.74197.01795.48971.15547.54763.2590
L41.24.73016.97445.46241.21948.28503.6300
L564.64936.72055.27741.704612.33147.0941
L6124.57816.58385.11702.222714.254612.0611
Table 9. Leakage fault of hydraulic system.
Leakage DegreeRadial Clearance of Reversing Valve (mm)SignHydraulic Cylinder Leakage (L/min)Sign
Normal<0.02A<0.5A
Slight leakage0.02~0.05B10.5~1C1
Medium leakage0.05~0.1B21~5C2
Severe leakage>0.1B3>5C3
Table 10. Partial data of reversing valve leakage training set.
NumberLeakage Clearance (mm)a (×104)b (×10−9)c (×105)d (×104)e (×10−9)f (×104)
10.0024.75407.06385.51871.09076.73312.9047
20.0044.75417.06335.51801.09106.73092.9063
30.0064.75417.06345.51801.09116.73152.9066
40.0084.75407.06395.51861.09006.73362.9043
50.014.75427.06305.51811.09116.73042.9066
390.183.543613.30033.46181.00349.18232.5103
400.203.291916.78142.64570.99639.38022.4944
Table 11. Partial data of hydraulic cylinder leakage training set.
NumberLeakage Speed (L/min)a (×104)b (×10−9)c (×105)d (×104)e (×10−9)f (×104)
4104.75407.06385.51771.09086.73312.9047
420.054.75177.05405.51231.10406.89632.9756
430.104.75057.04935.50951.11046.97763.0107
440.154.74927.04495.50651.11687.05943.0455
450.204.74807.04025.50381.12337.14013.0807
799.54.59536.60735.15542.088413.883110.6487
80104.59276.60335.14962.108113.930710.8501
Table 12. Test set of leakage fault.
Leakage ModeStatus LabelQuantity
Normal conditionsA30
Slight leakage of reversing valveB115
Moderate leakage of reversing valveB215
Serious leakage of reversing valveB315
Slight leakage of hydraulic cylinderC115
Moderate leakage of hydraulic cylinderC215
Serious leakage of hydraulic cylinderC315
Table 13. Diagnosis accuracy.
ModesAB1B2B3C1C2C3(Average)
Accuracy100%100%93.3%93.3%93.3%100%100%97.5%
Disclaimer/Publisher’s Note: The statements, opinions and data contained in all publications are solely those of the individual author(s) and contributor(s) and not of MDPI and/or the editor(s). MDPI and/or the editor(s) disclaim responsibility for any injury to people or property resulting from any ideas, methods, instructions or products referred to in the content.

