
An Investigation of the Effect of Utilizing Solidified Soil as Scour Protection for Offshore Wind Turbine Foundations via a Simplified Scour Resistance Test

Abstract
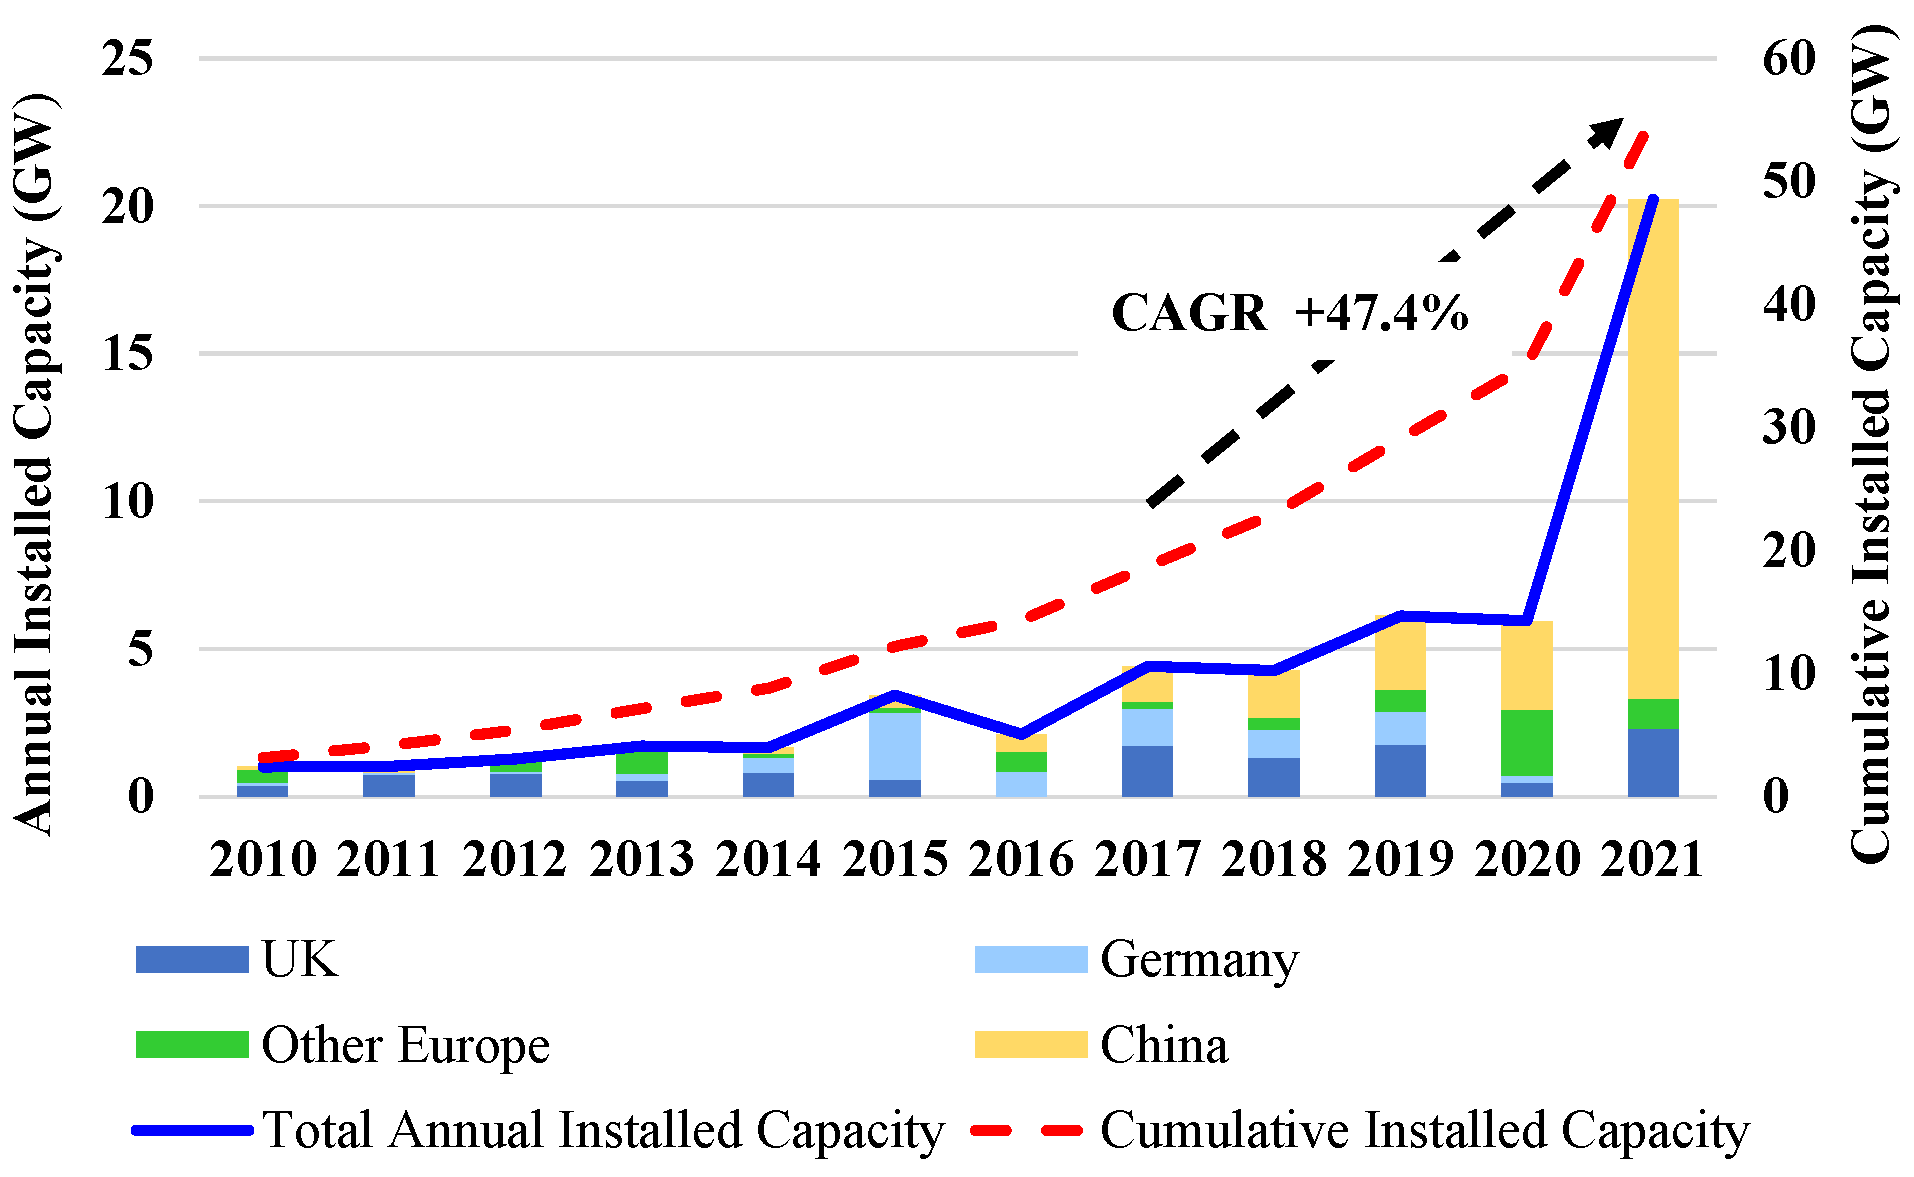
:1. Introduction
2. Mechanism of Scour and Scour Protection
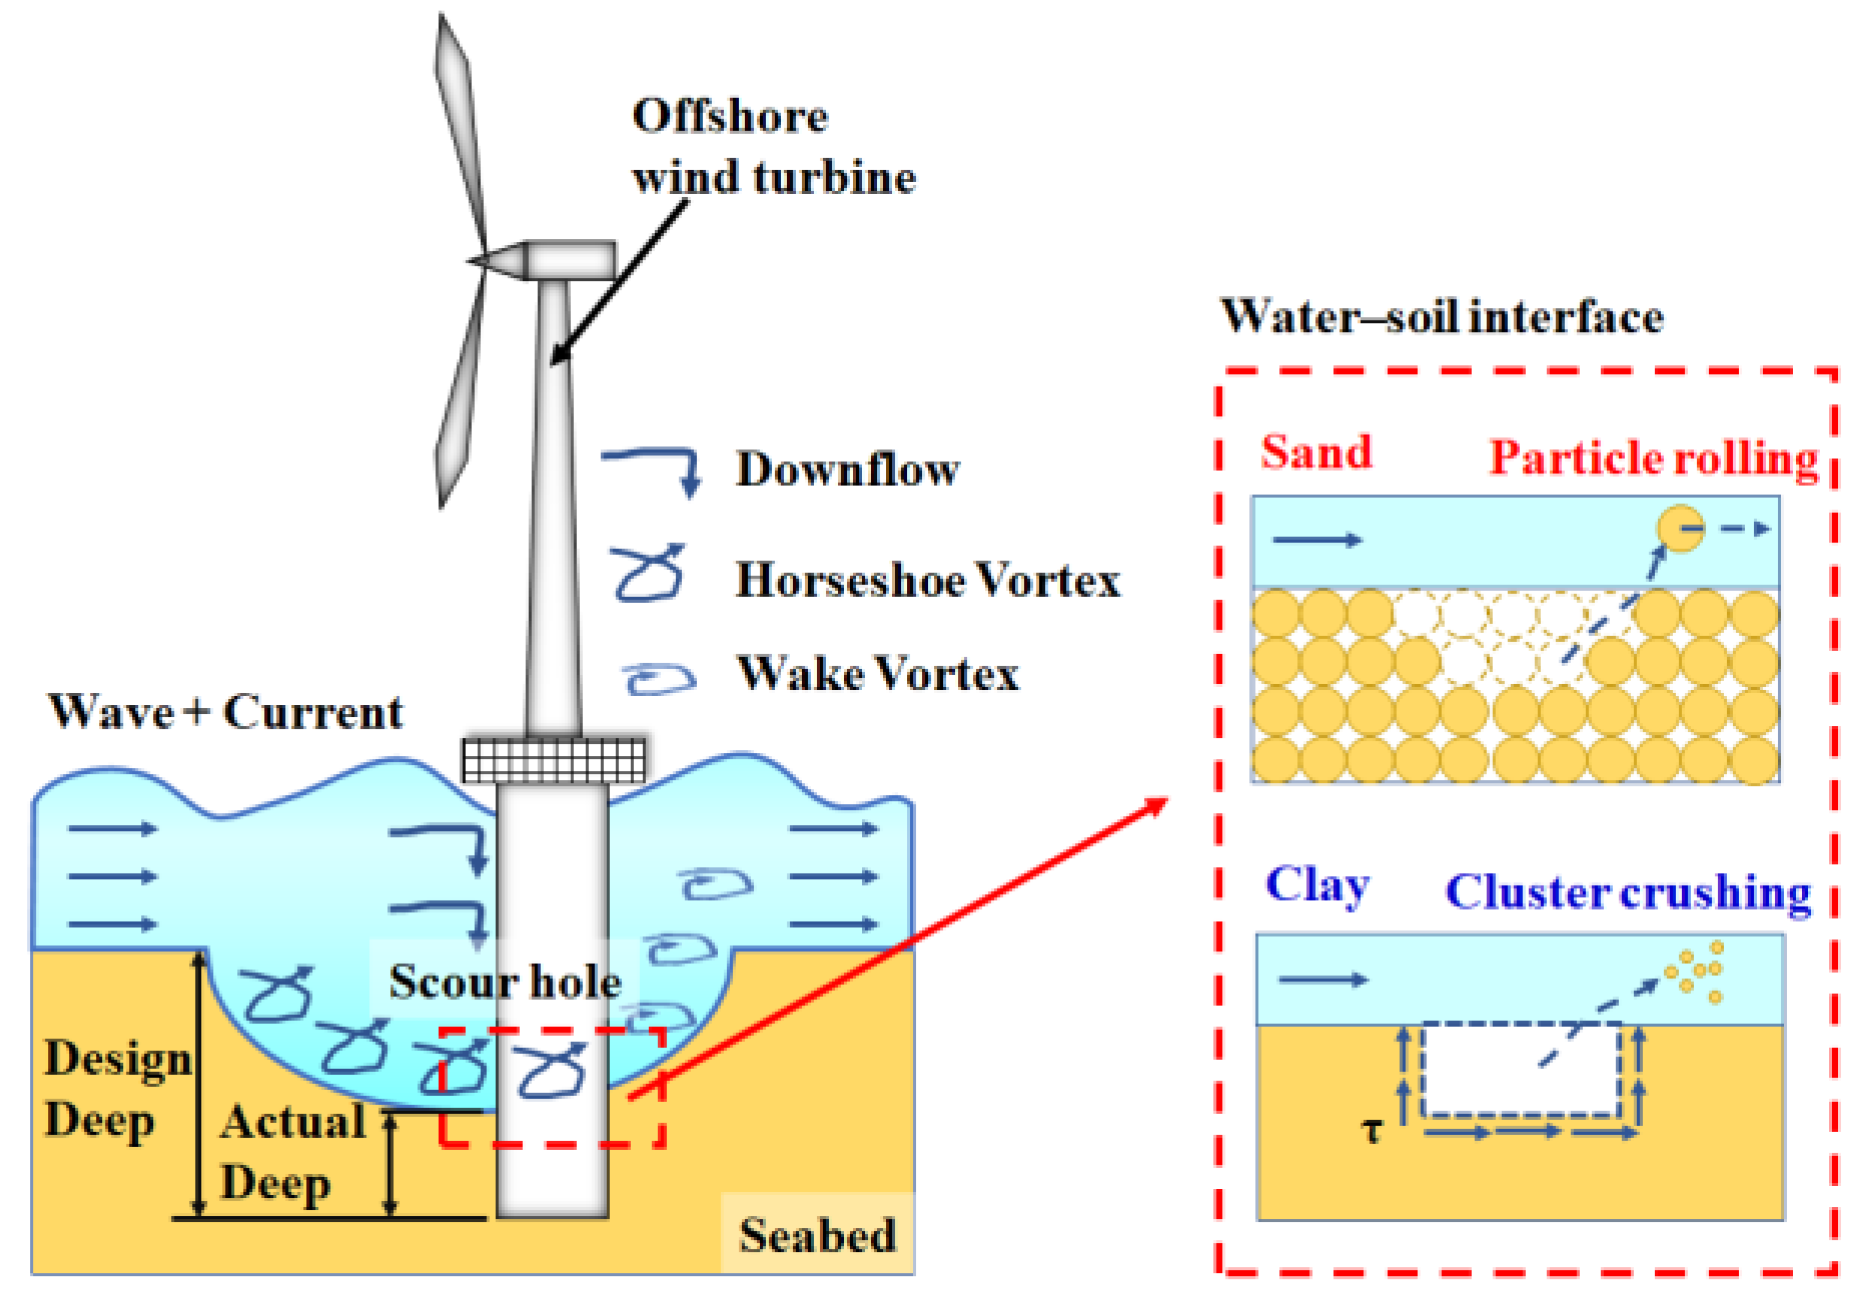
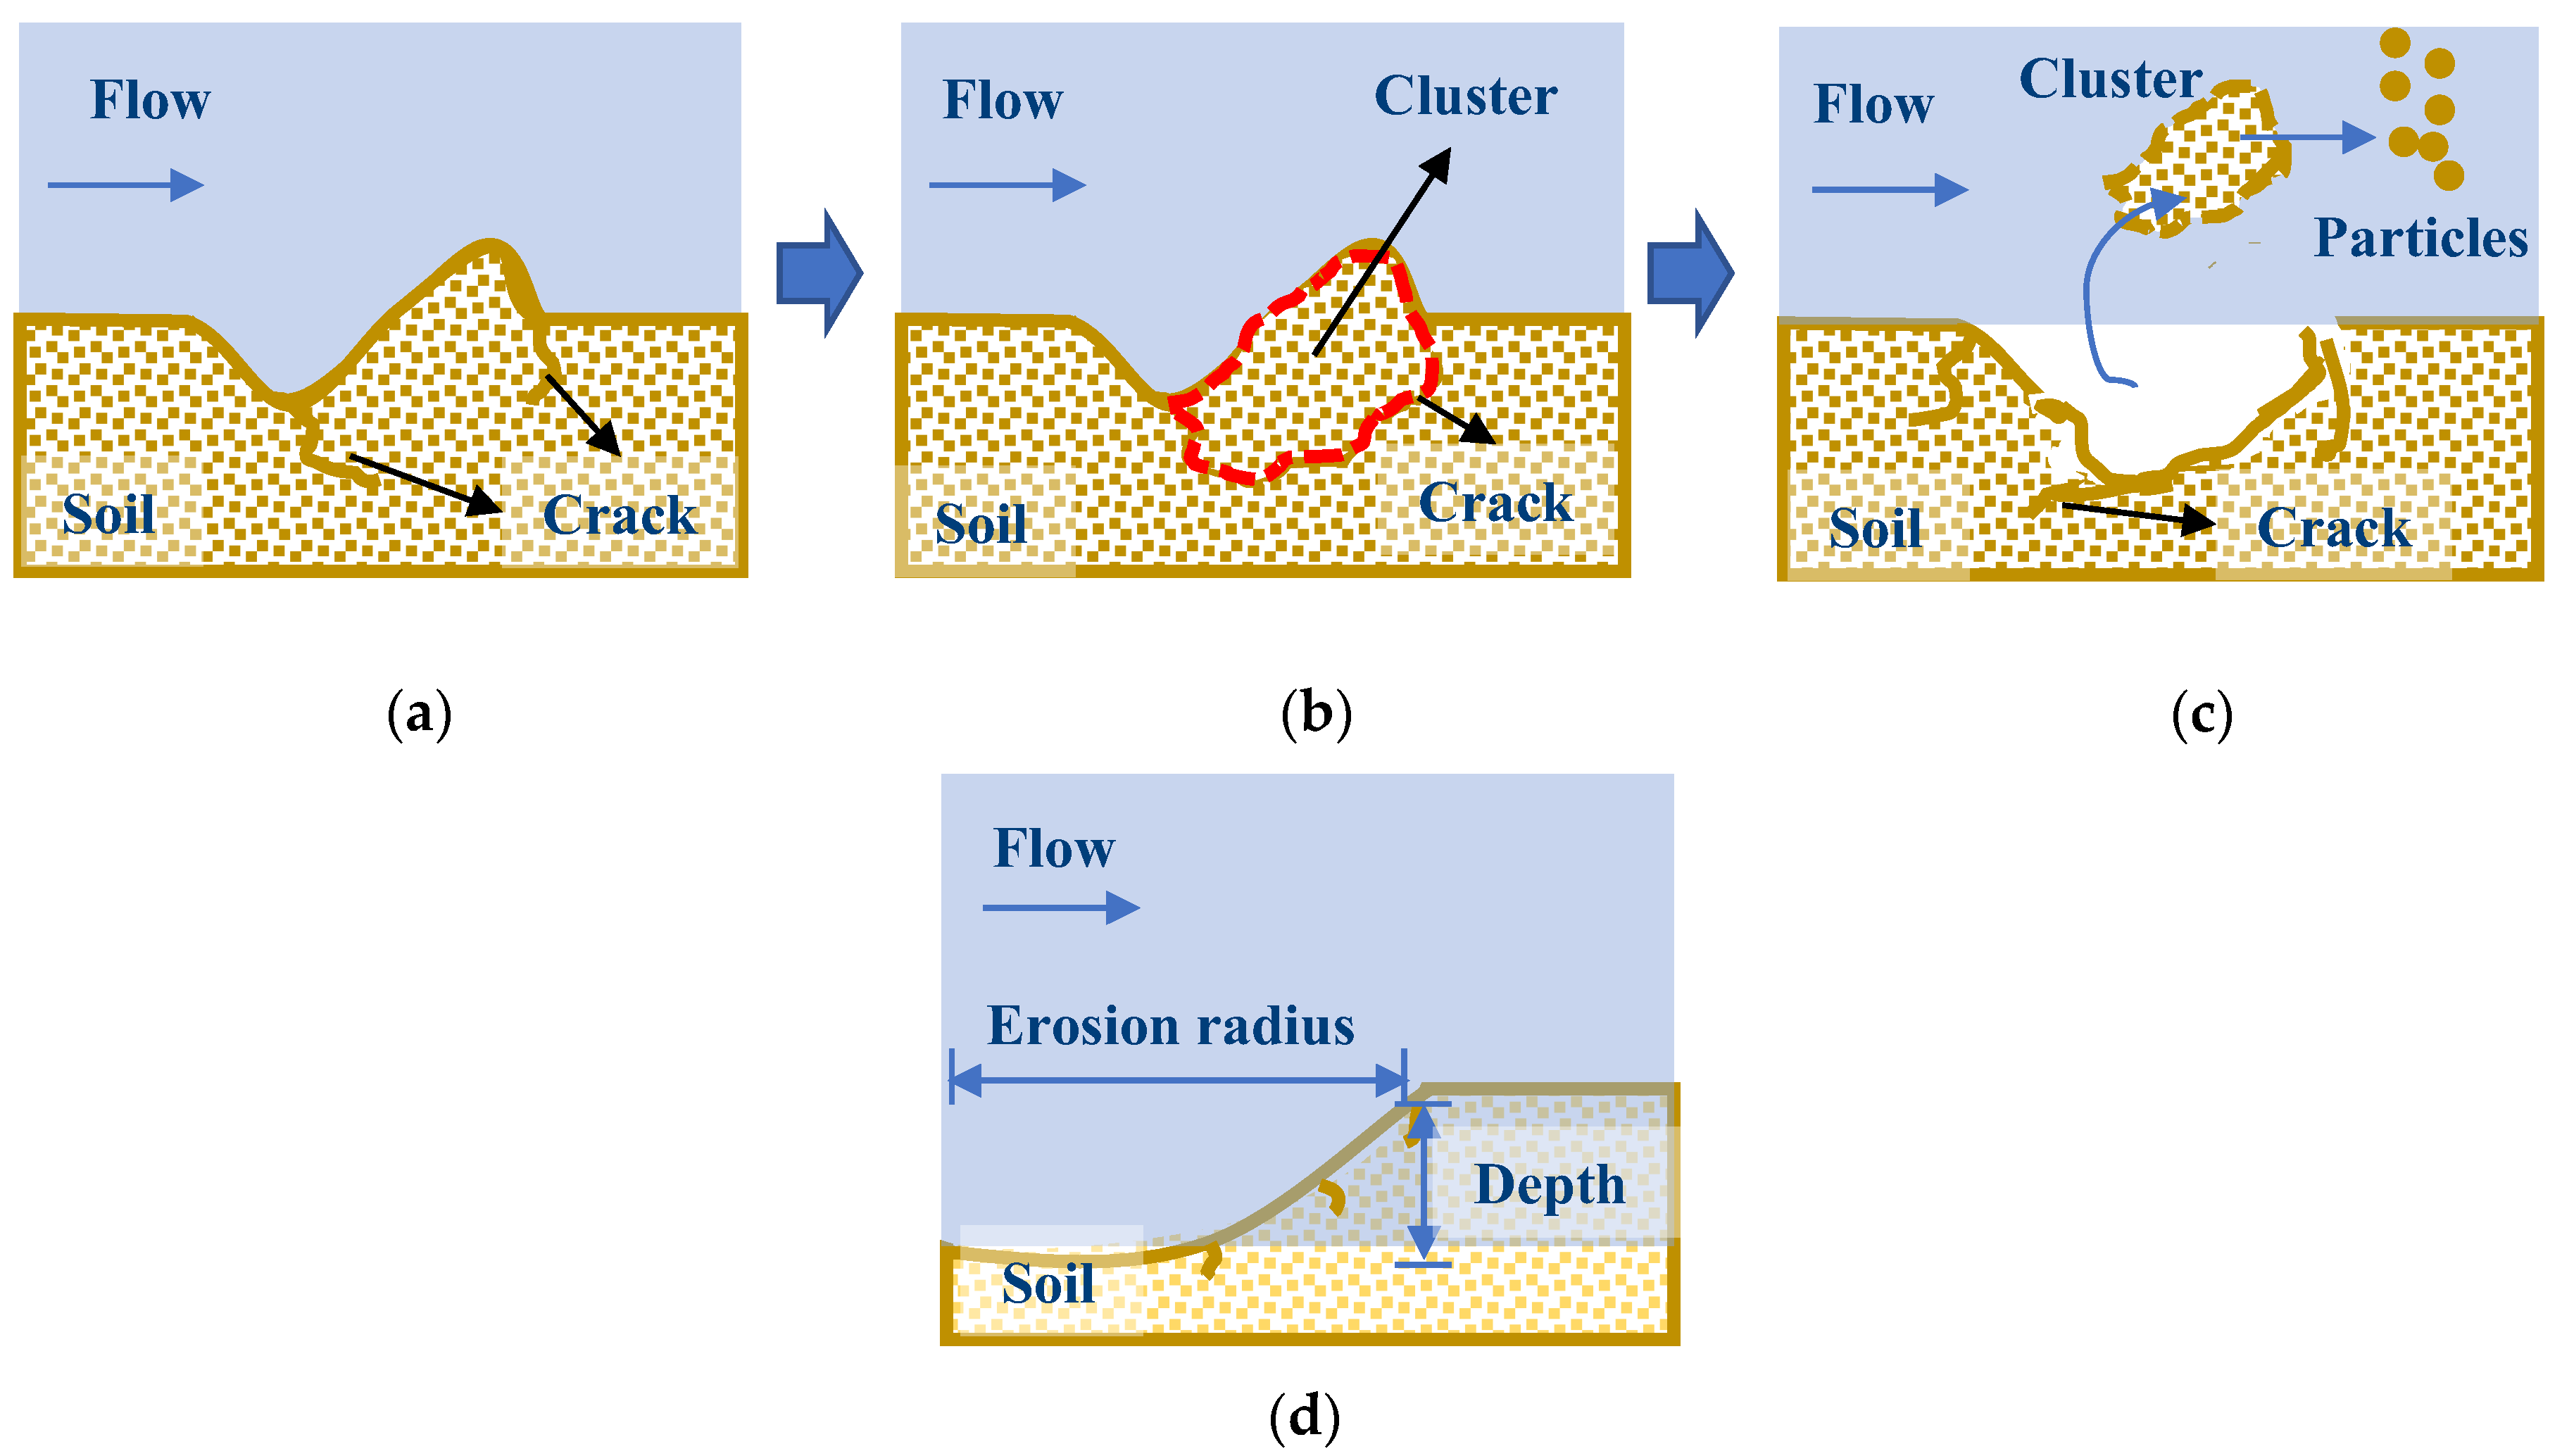
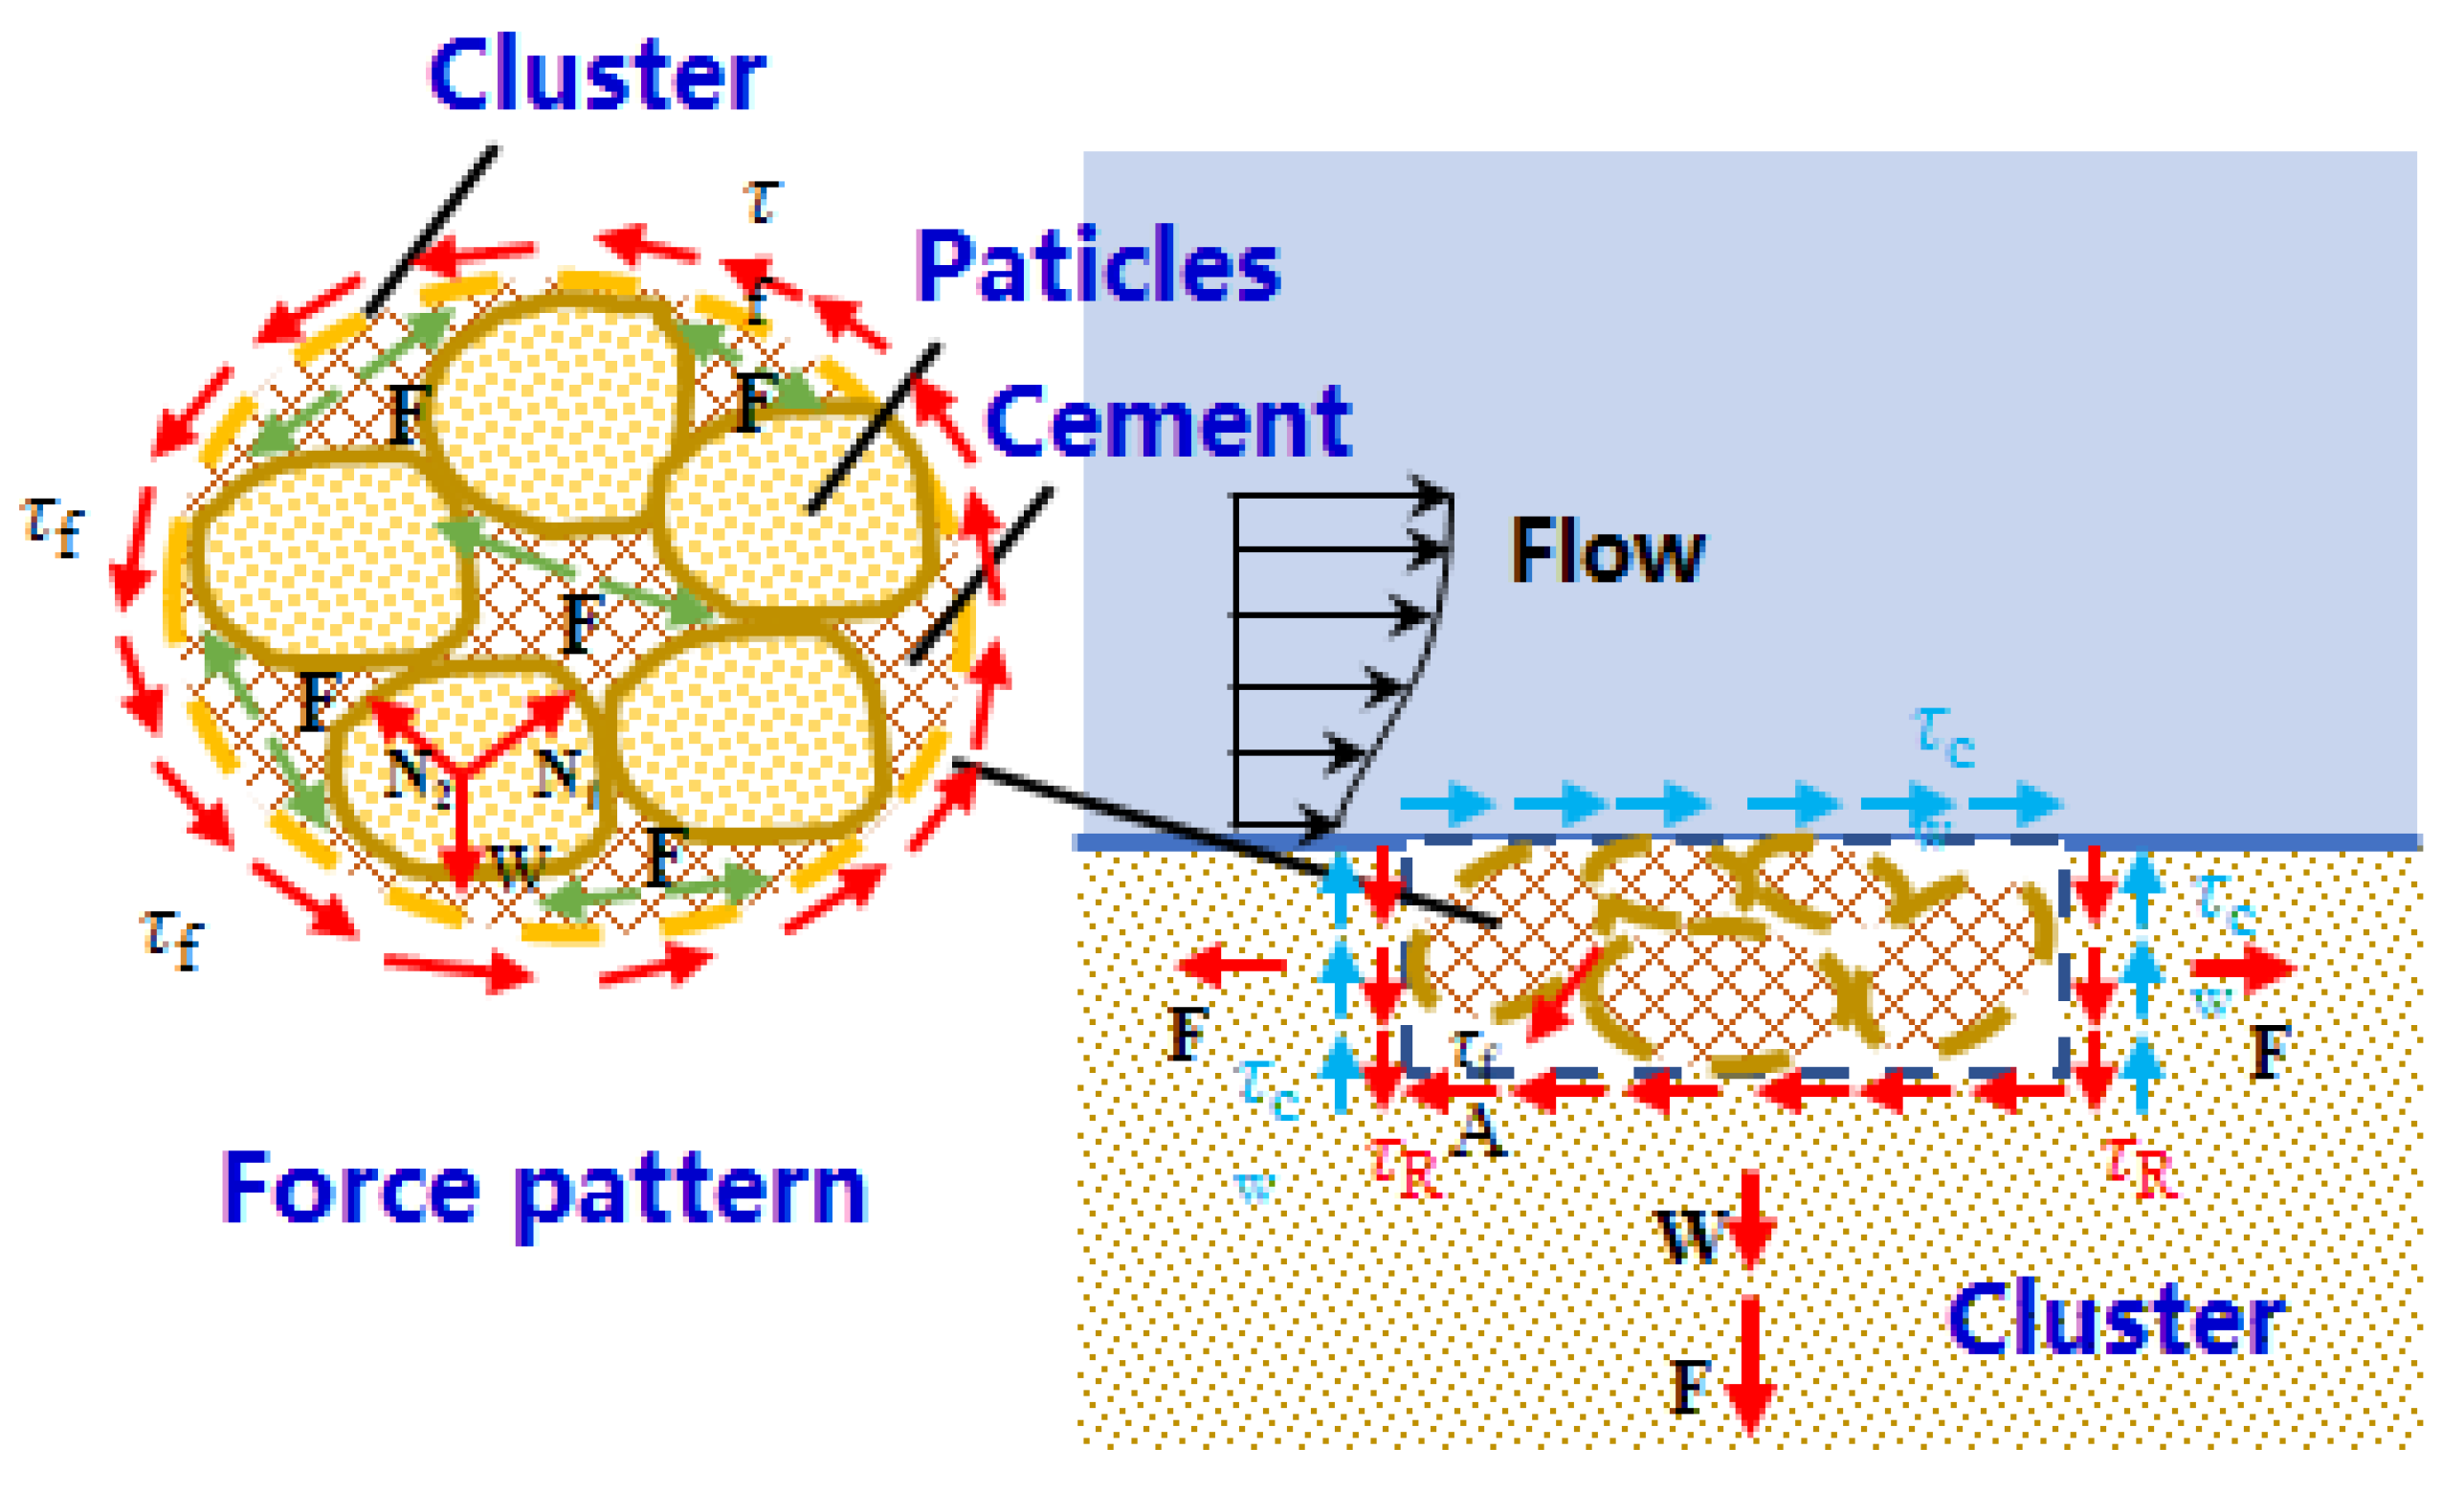
2.1. Scour around Underwater Foundations
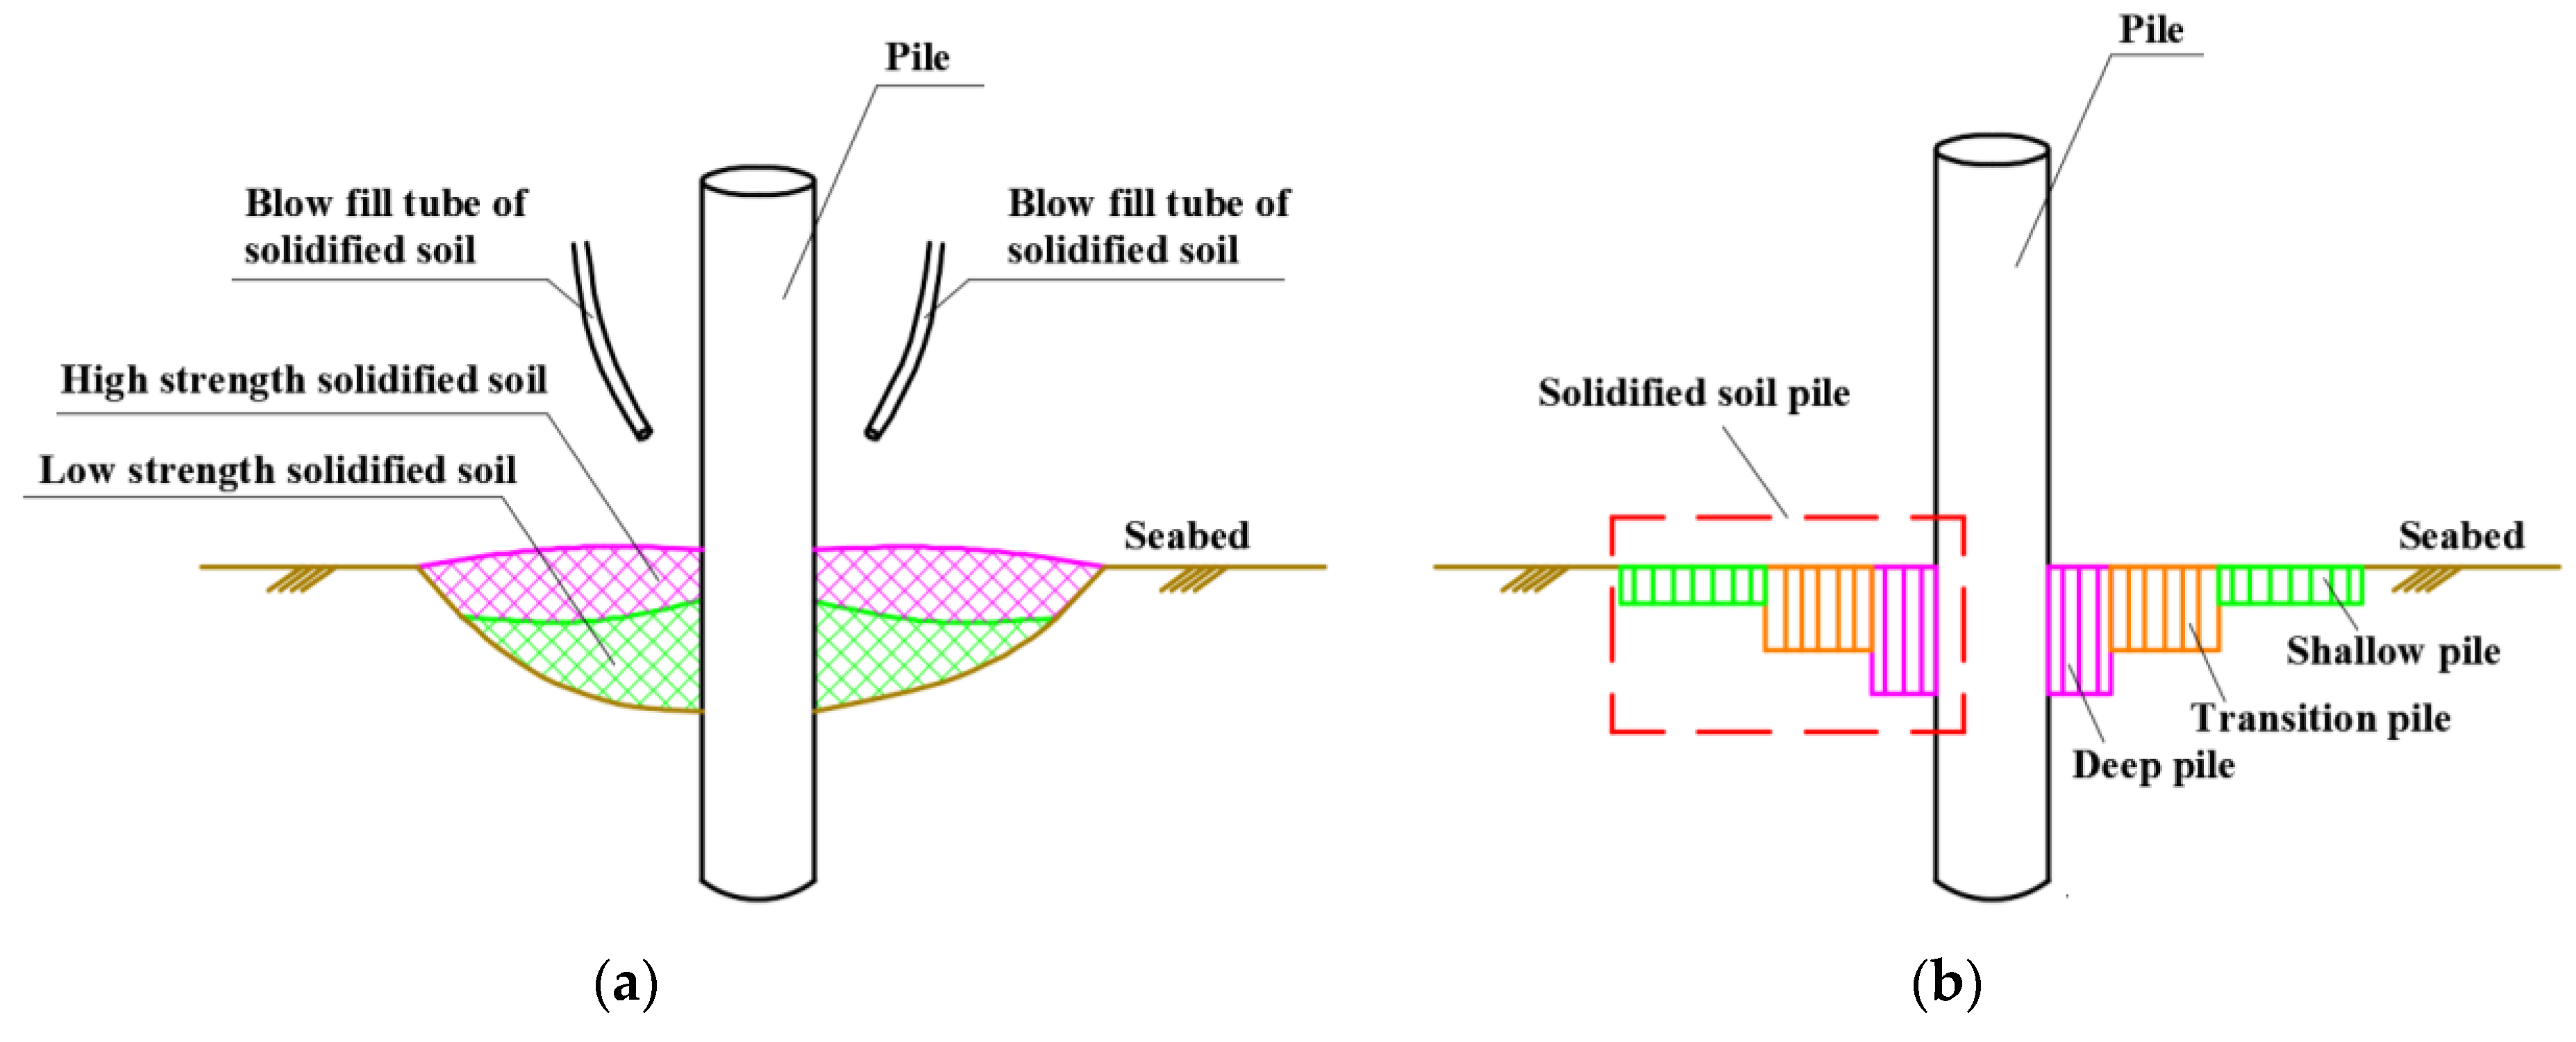
2.2. Use of Solidified Soils as Scour Countermeasure
3. Experimental Setup and Procedure
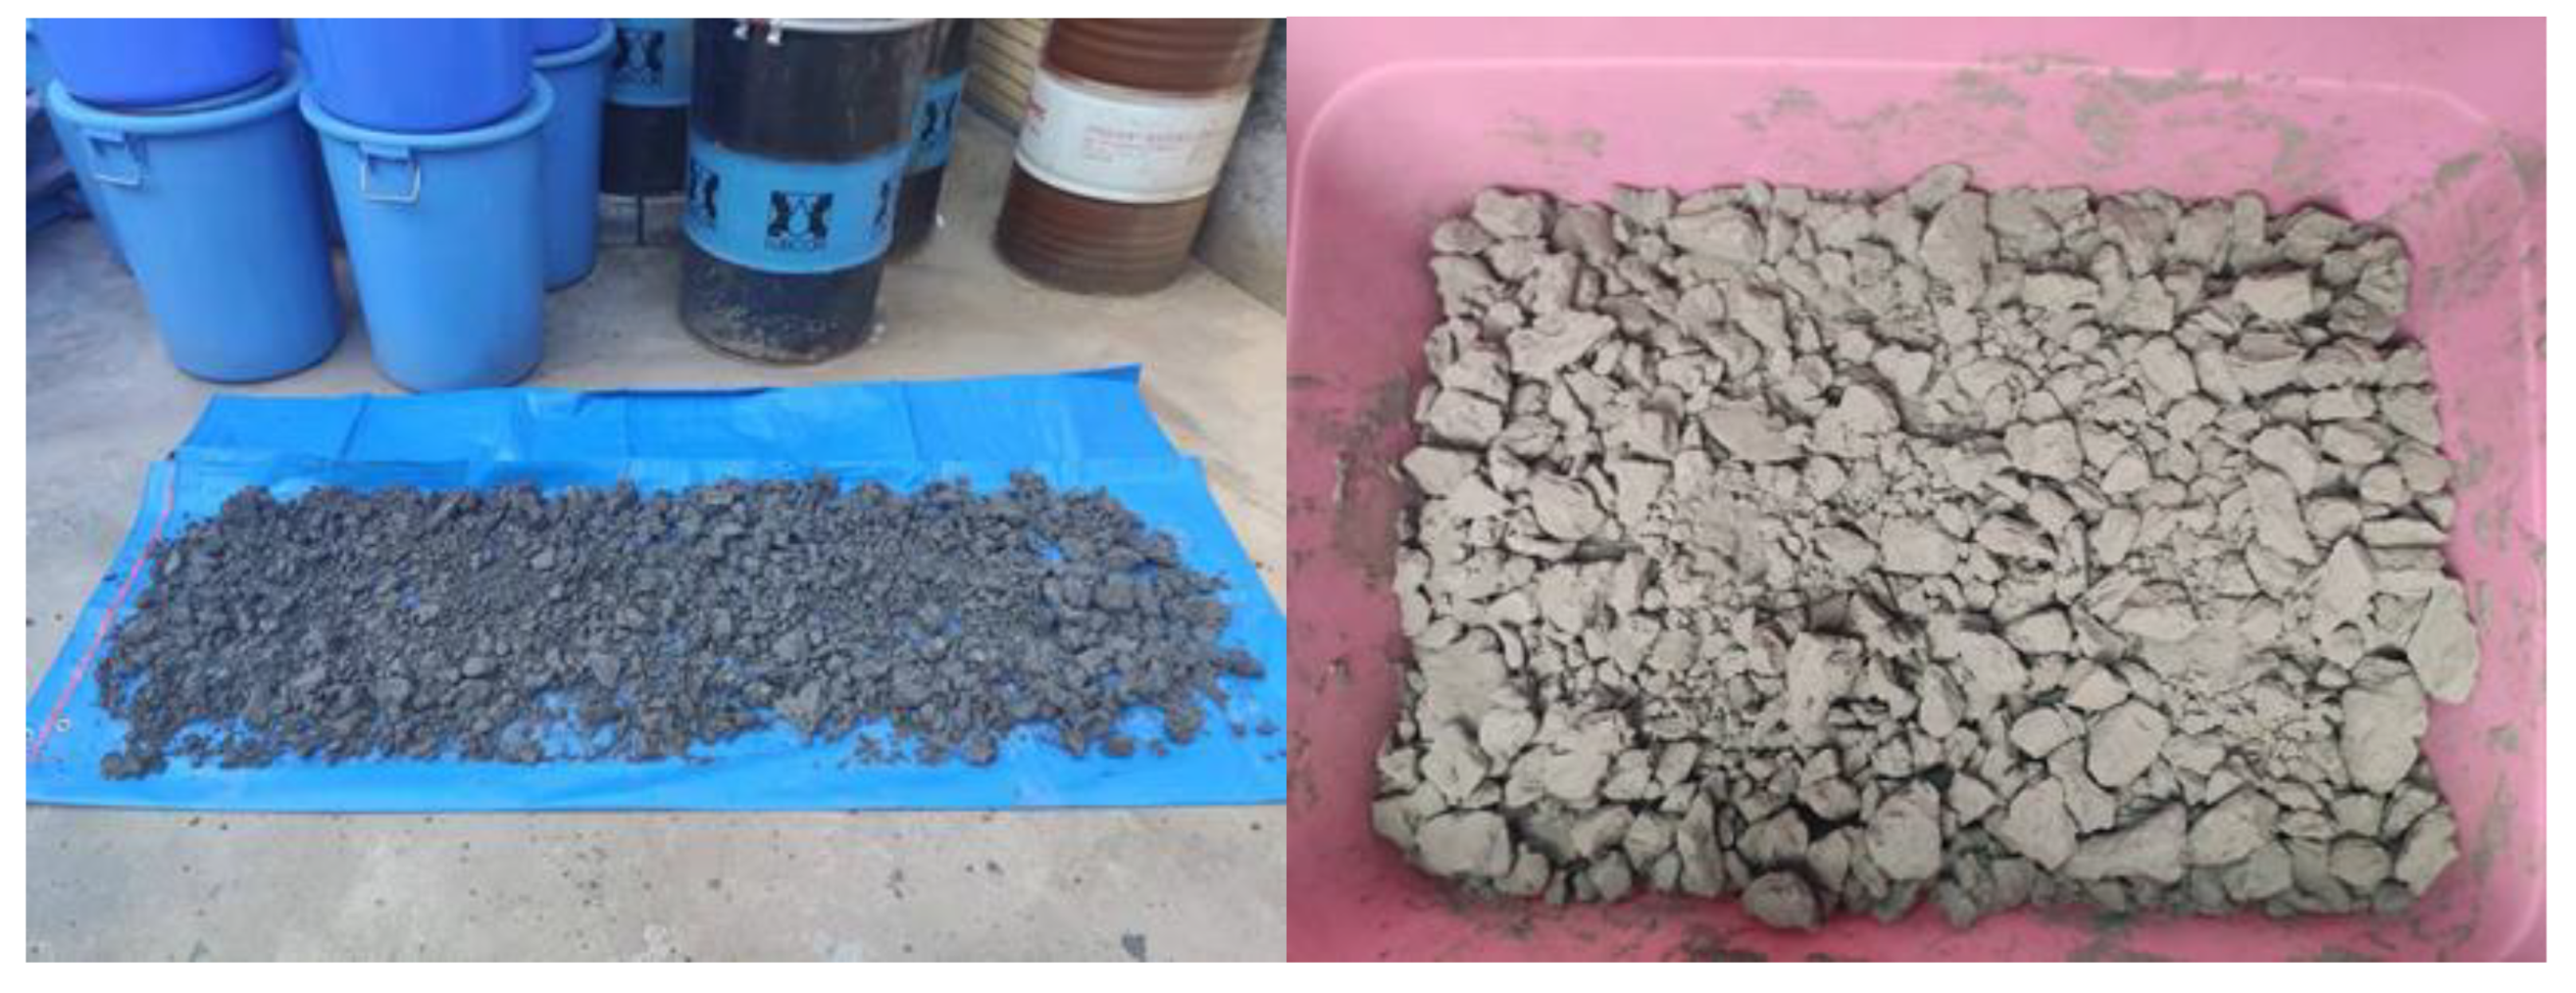
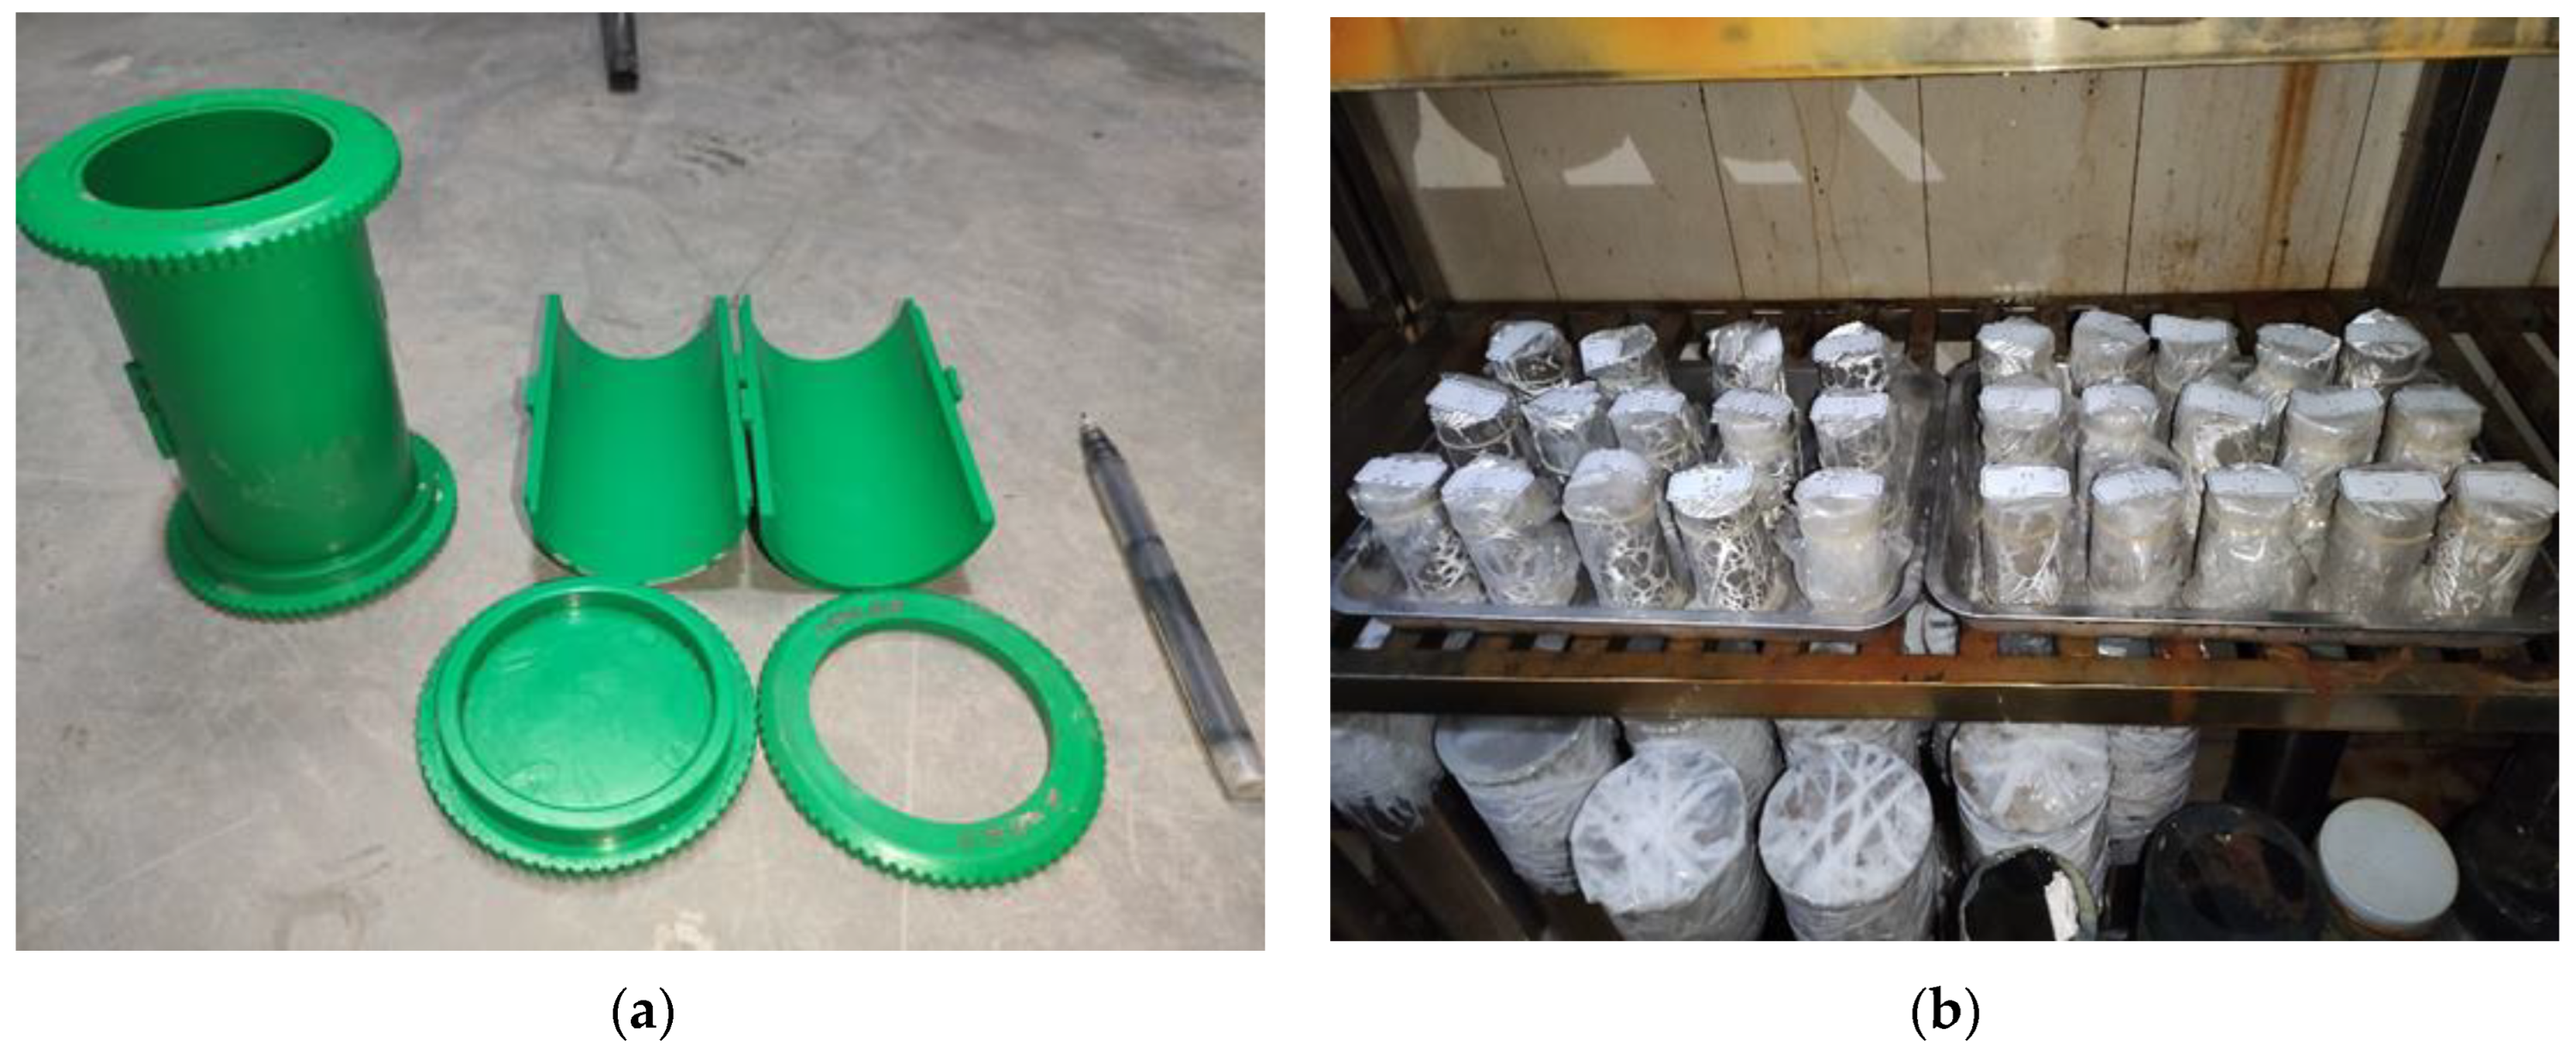
3.1. Soil Samples and Testing Groups
3.2. Unconfined Compression Test
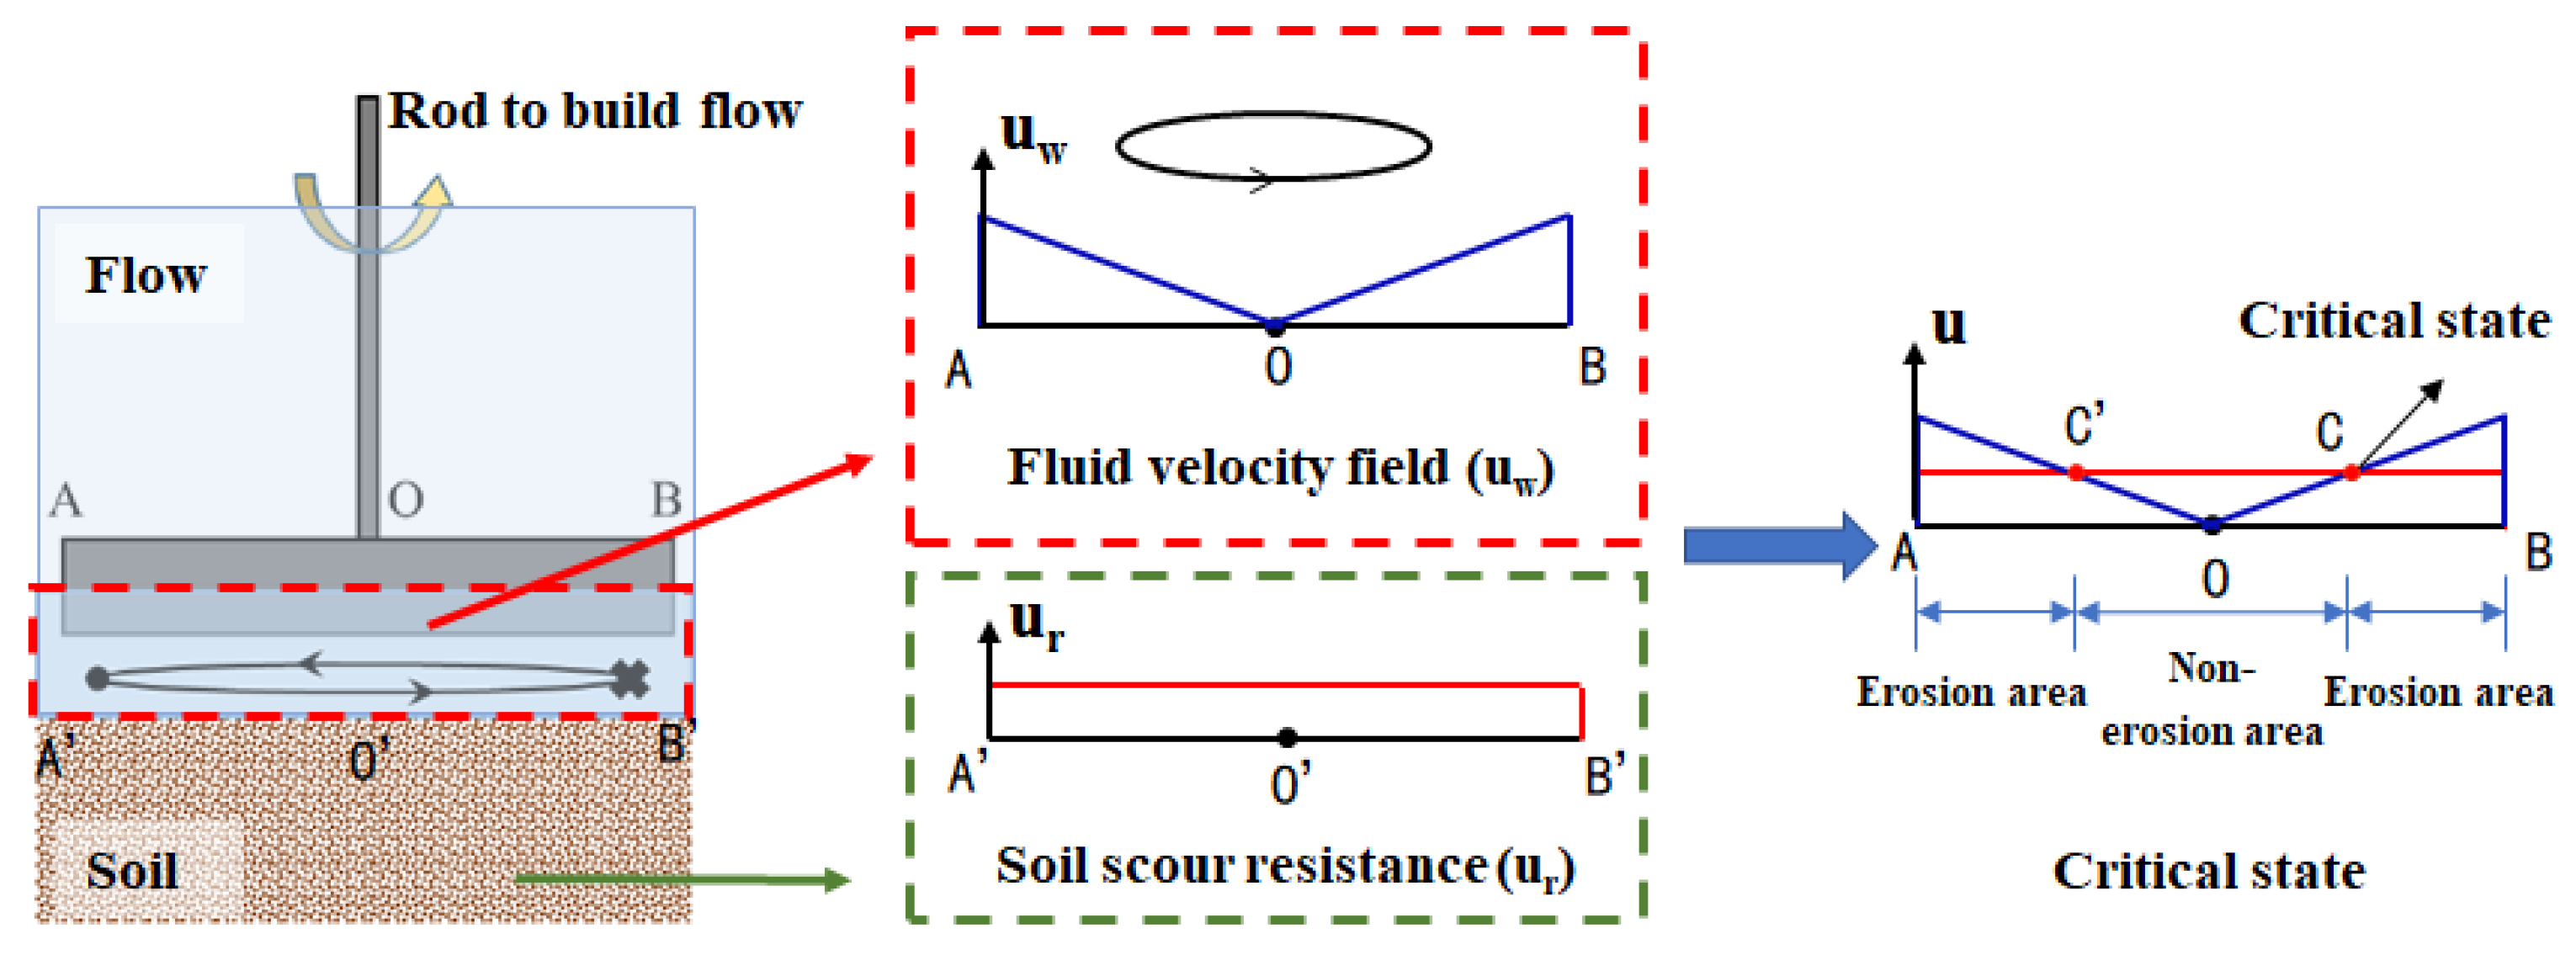
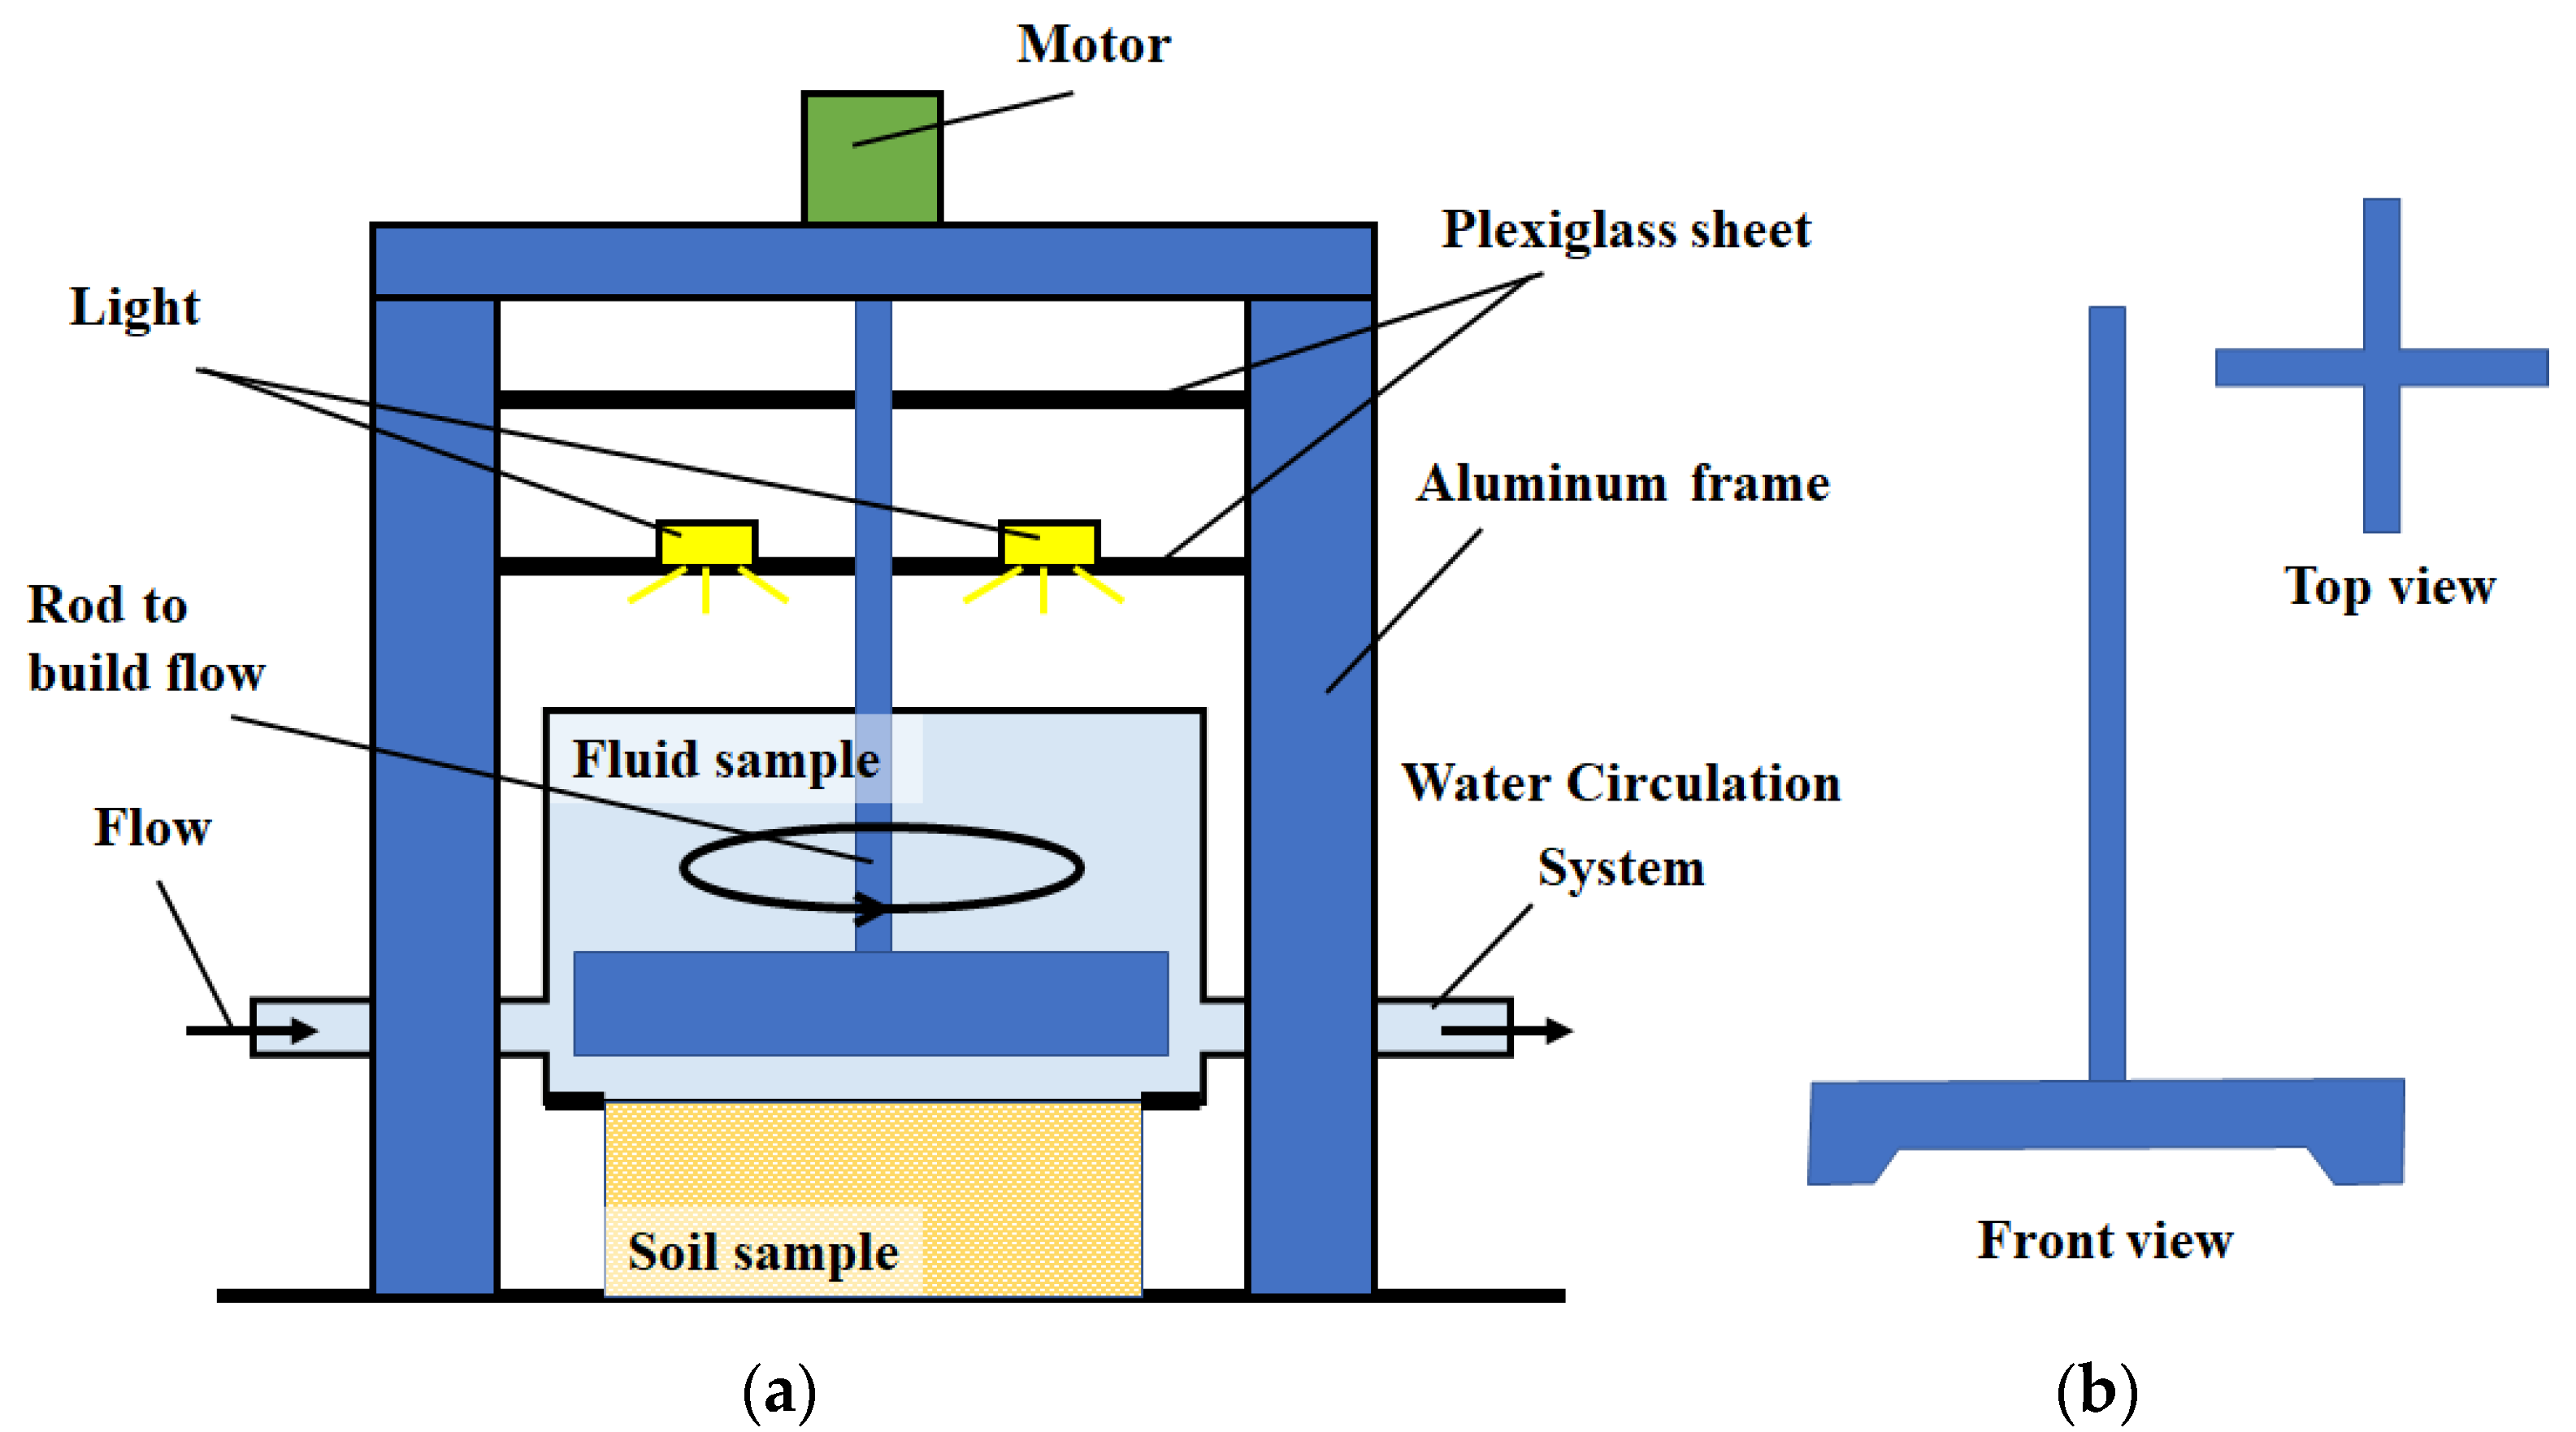
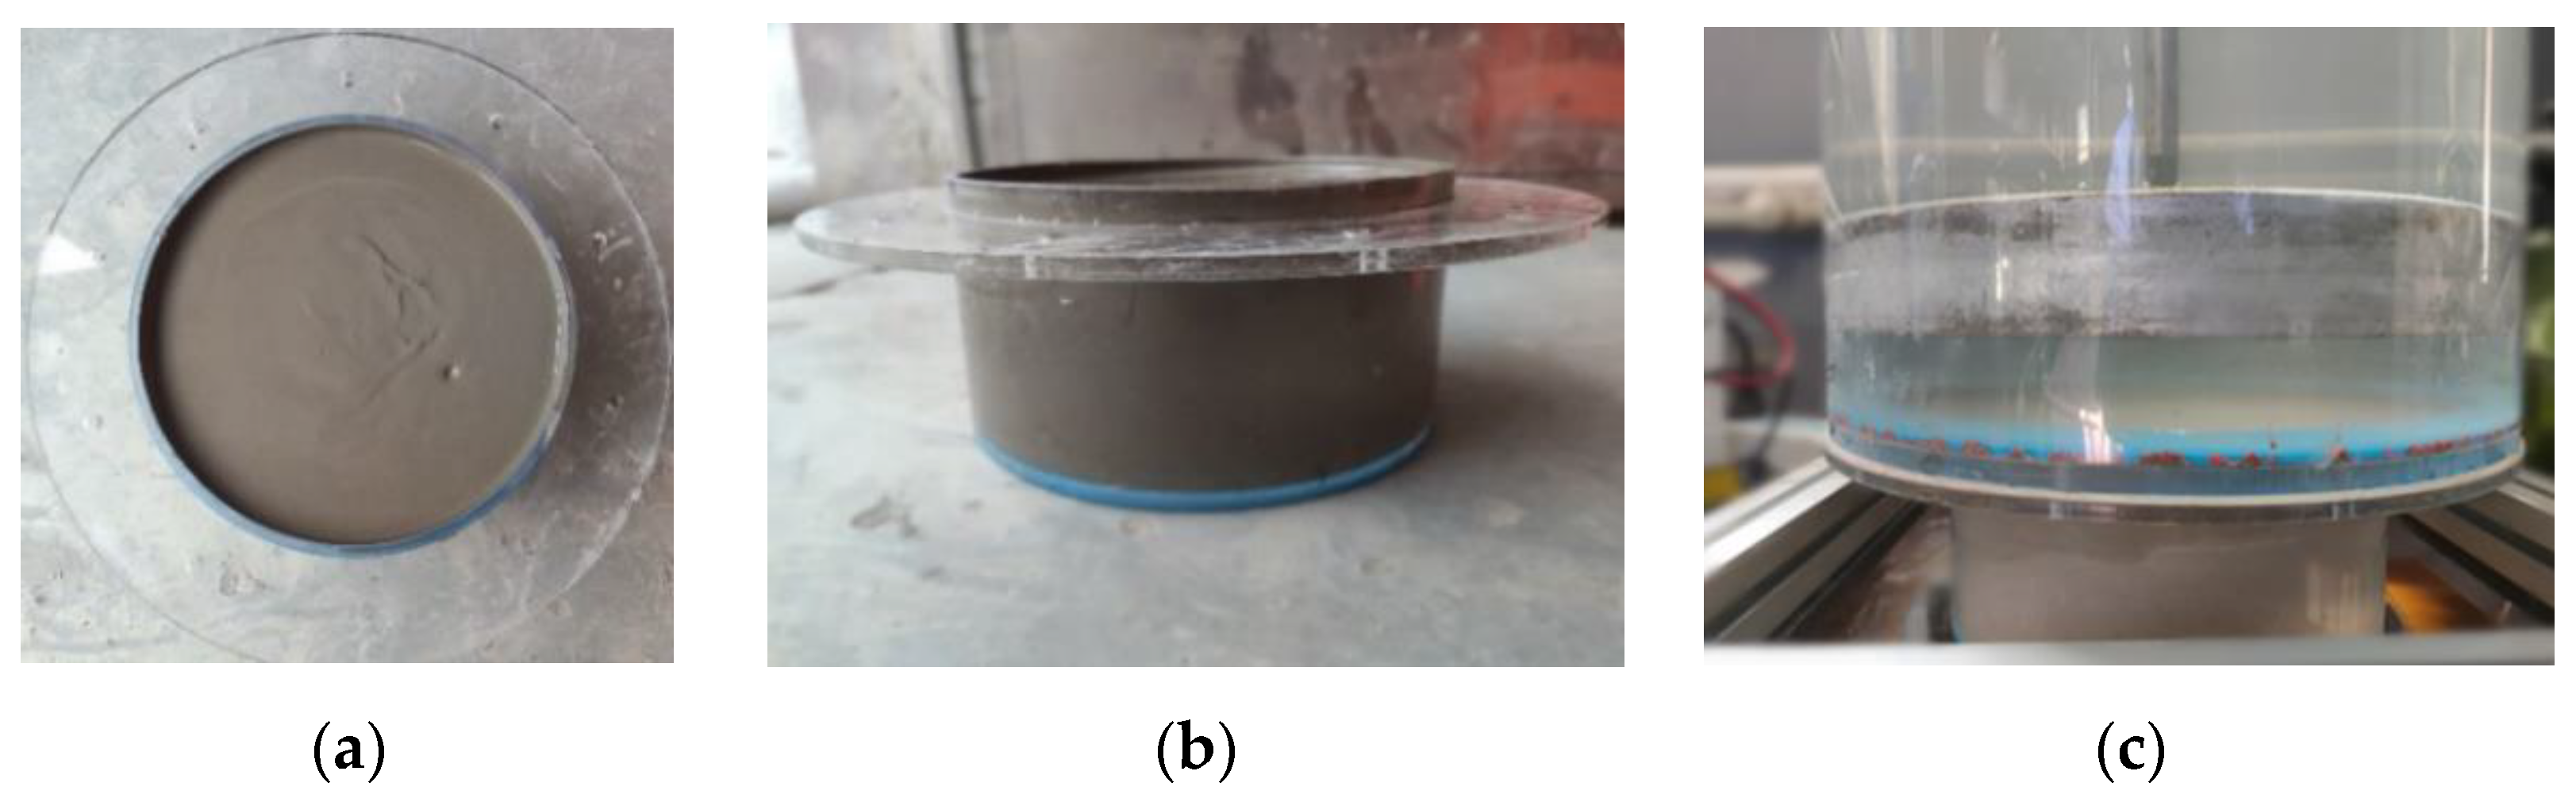
3.3. Simplified Scour Resistance Test
4. Results and Discussion
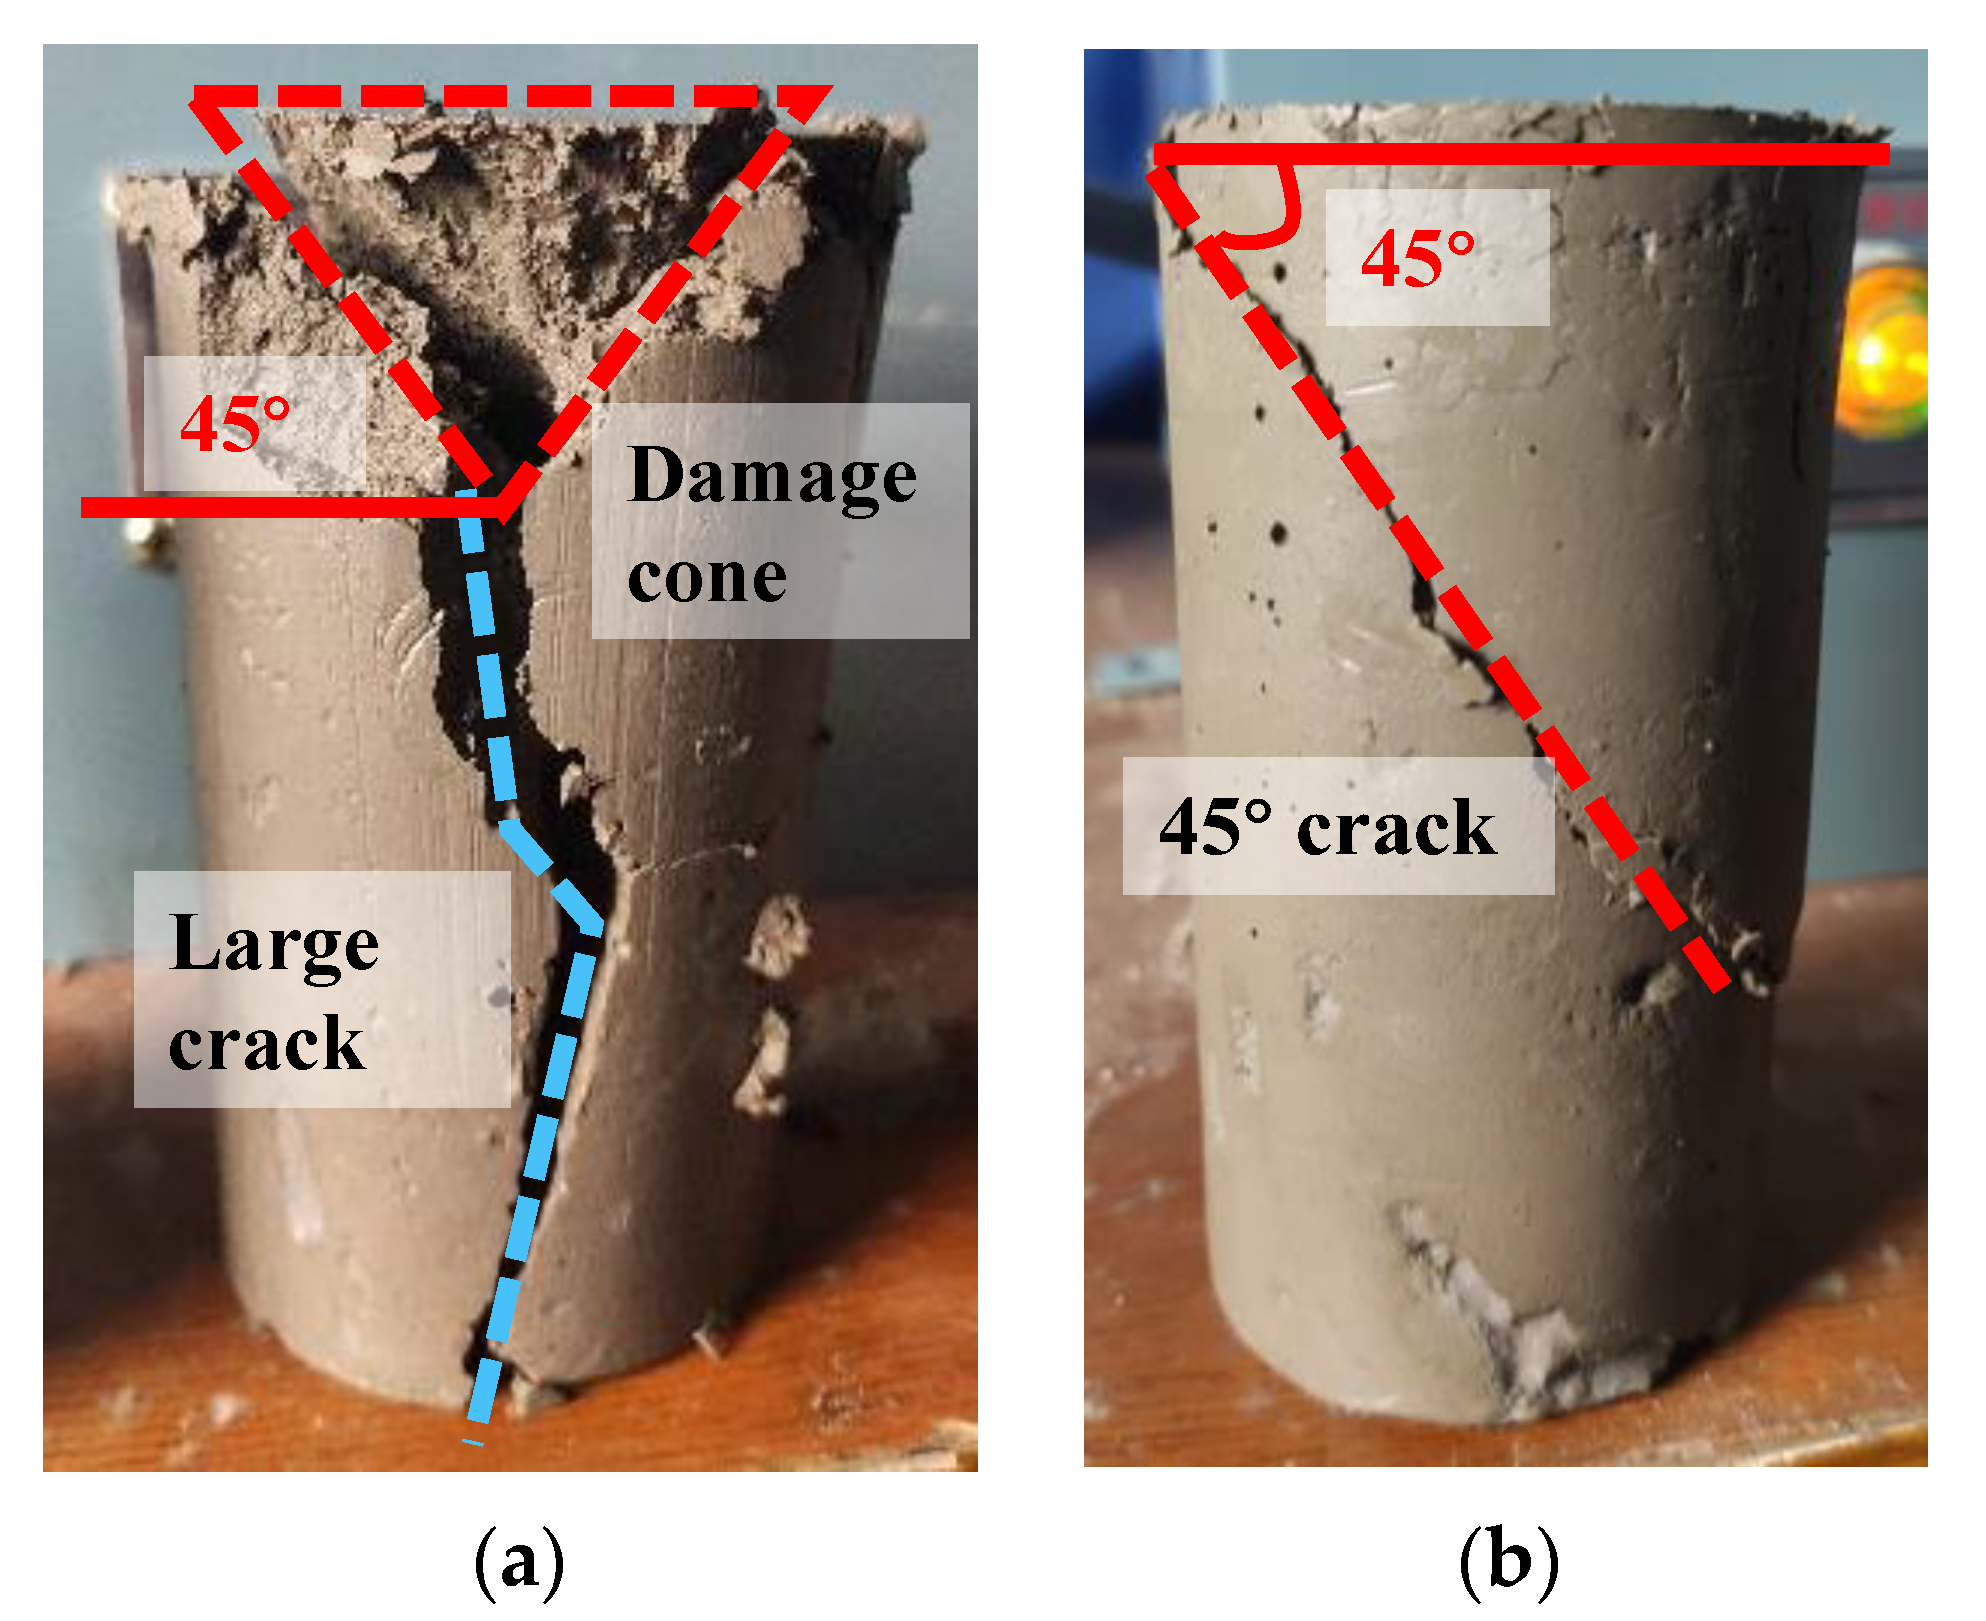
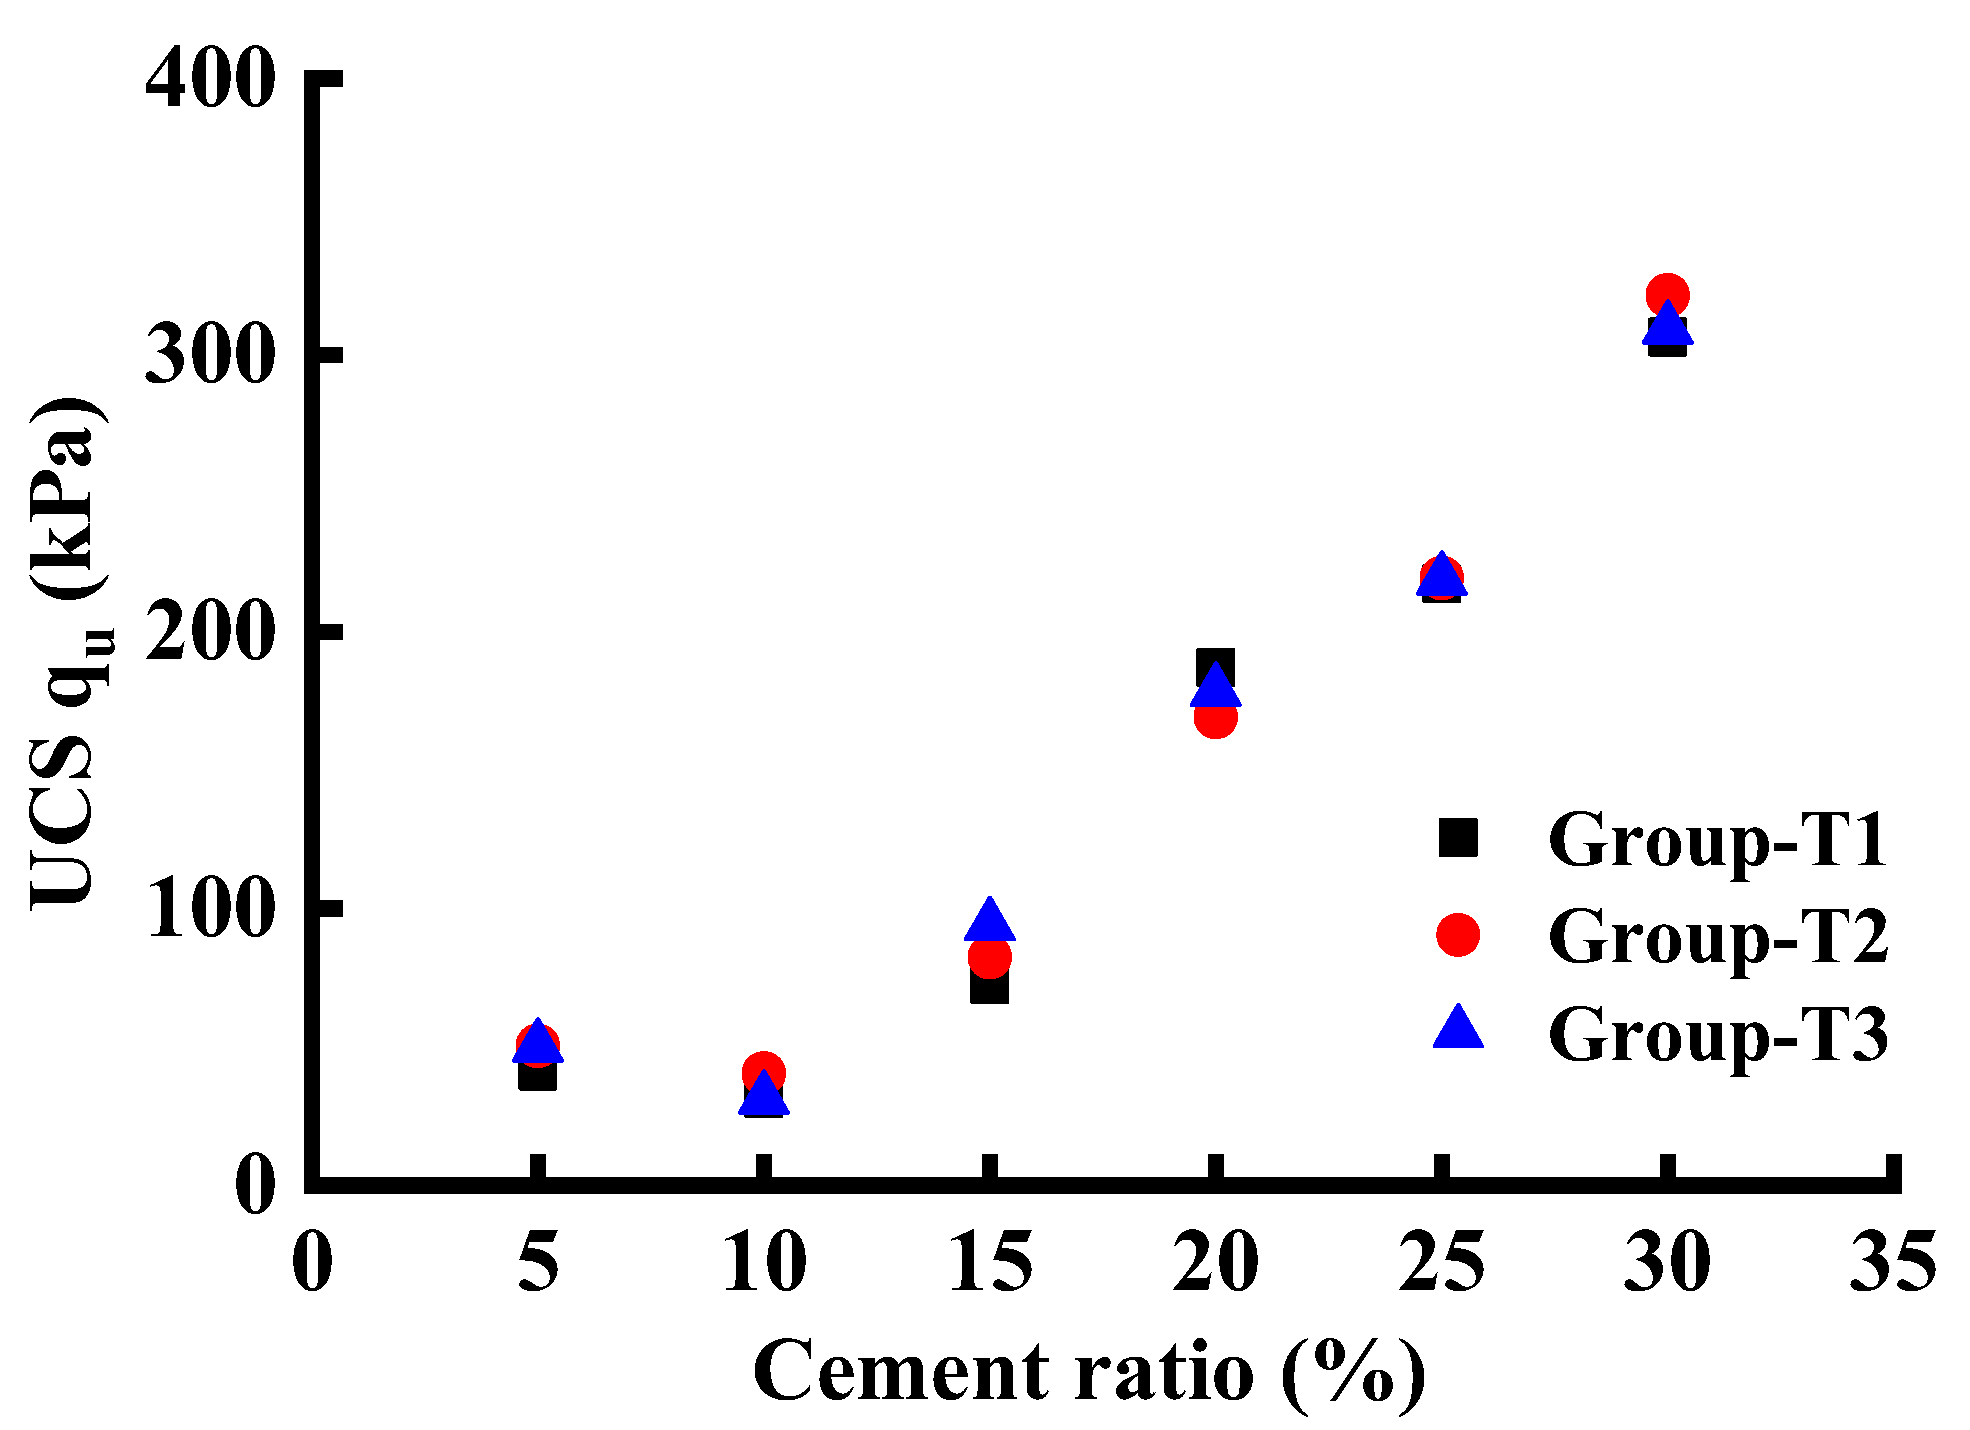
4.1. Unconfined Compression Test Results
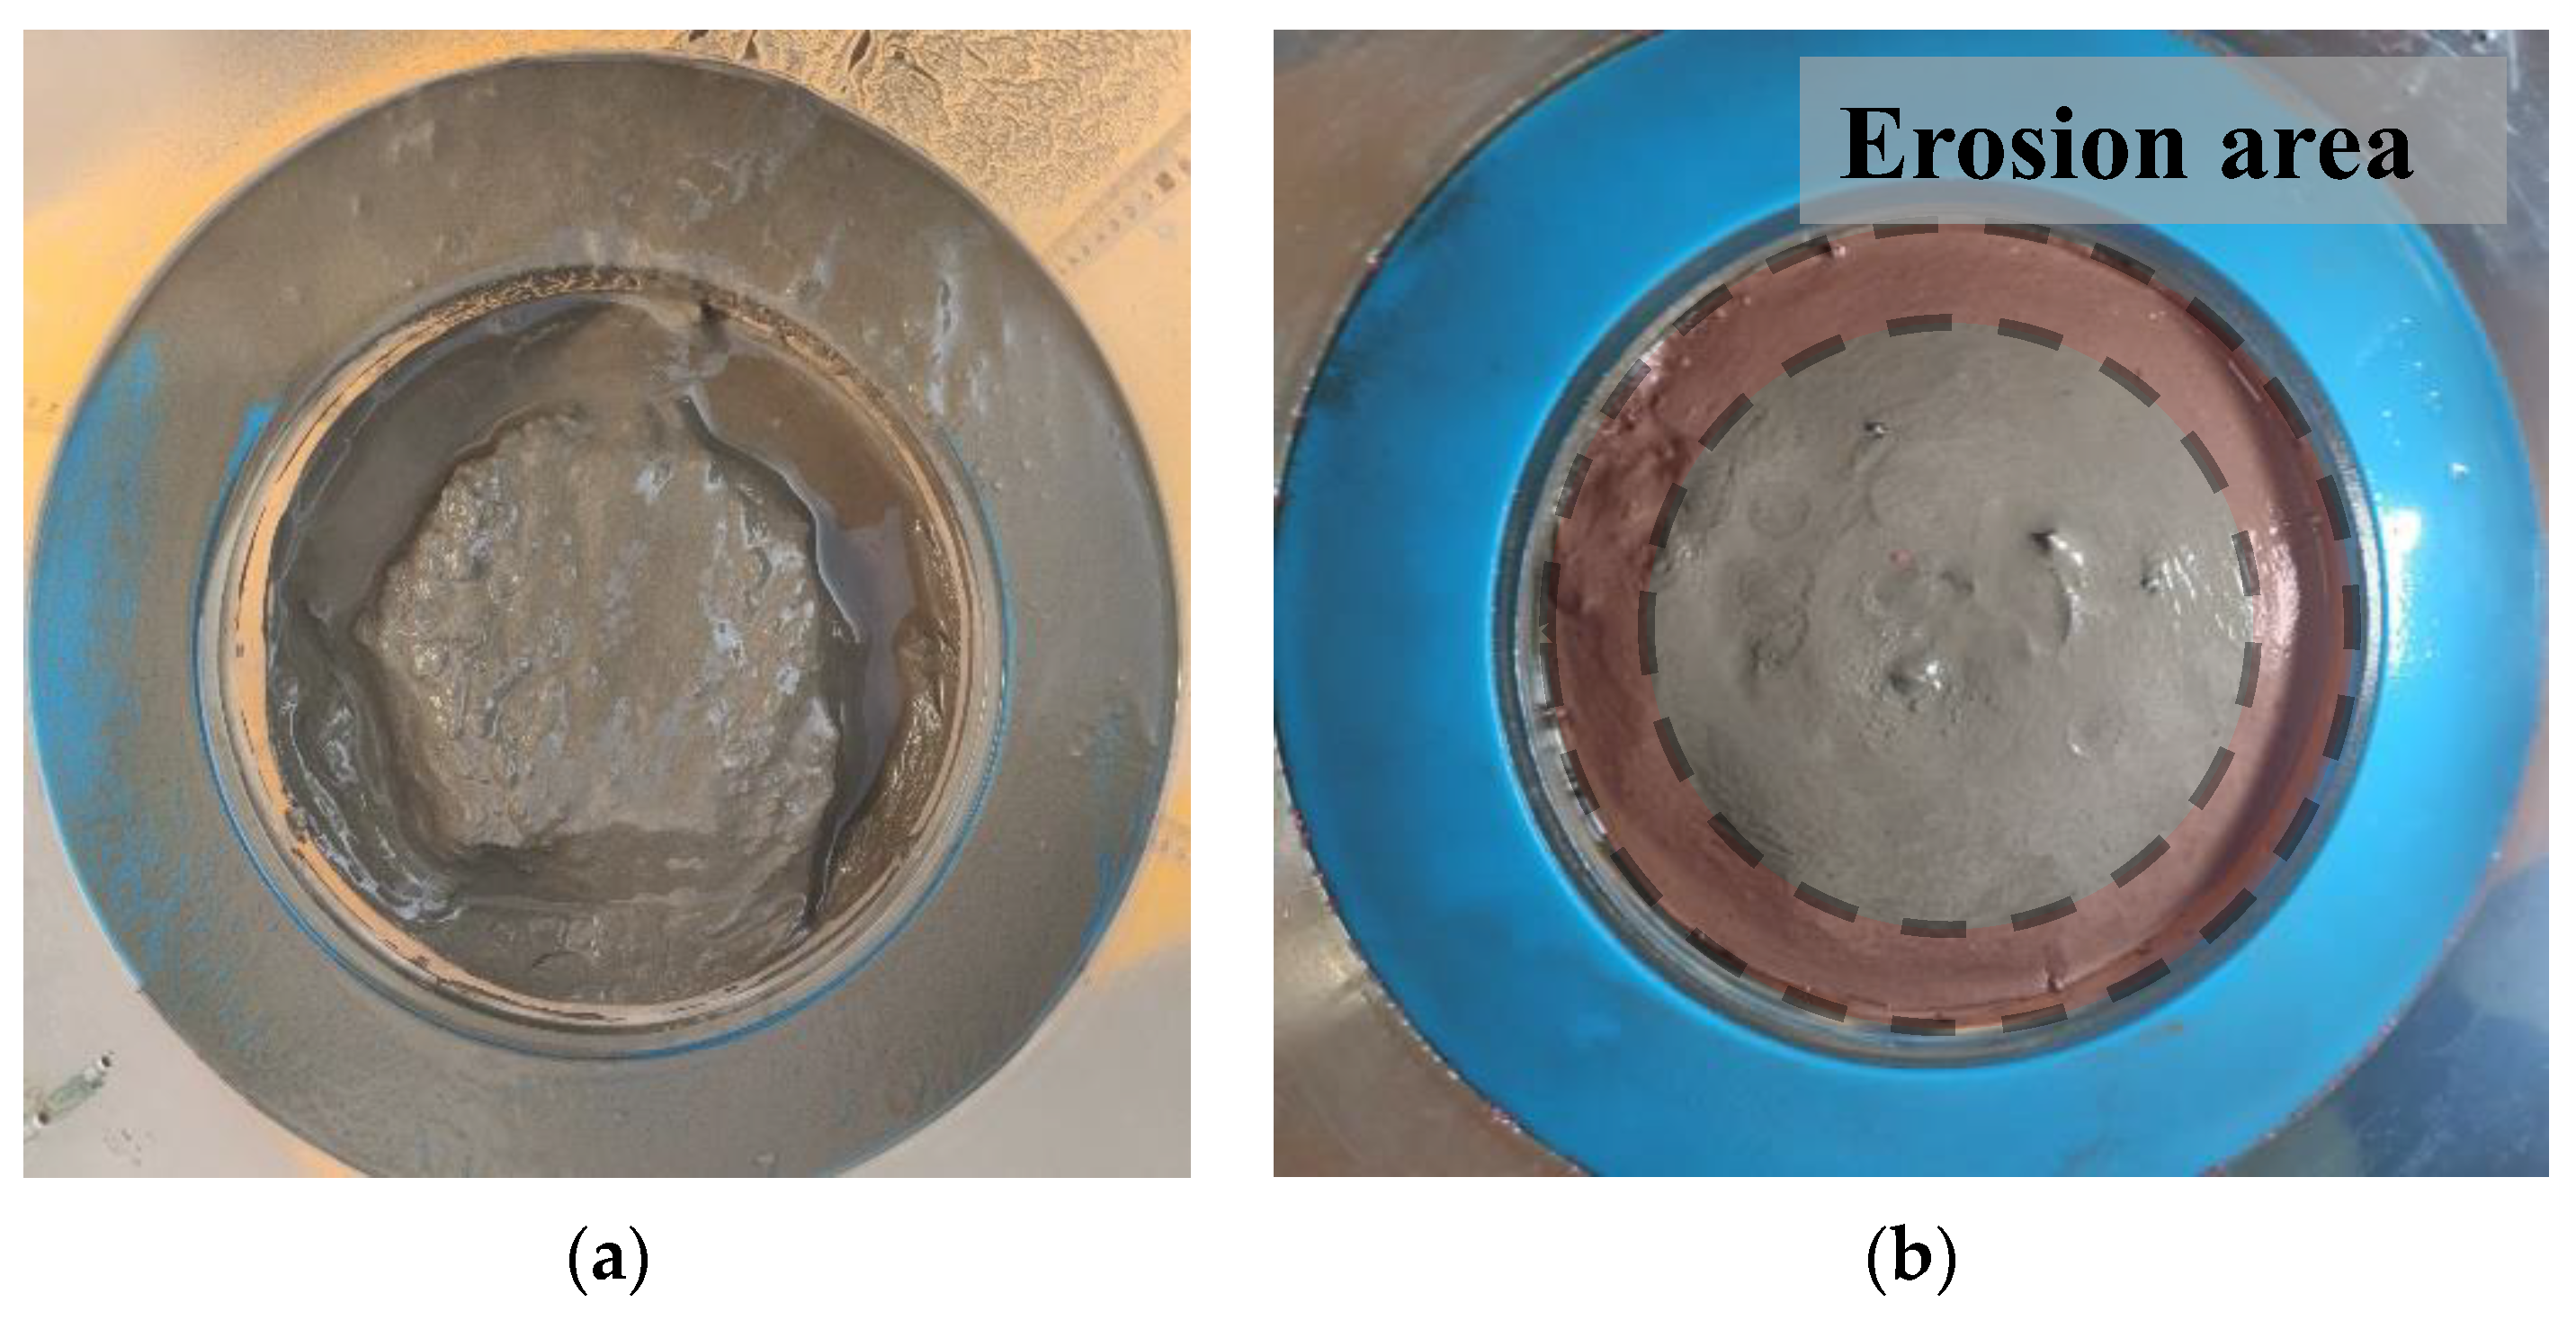
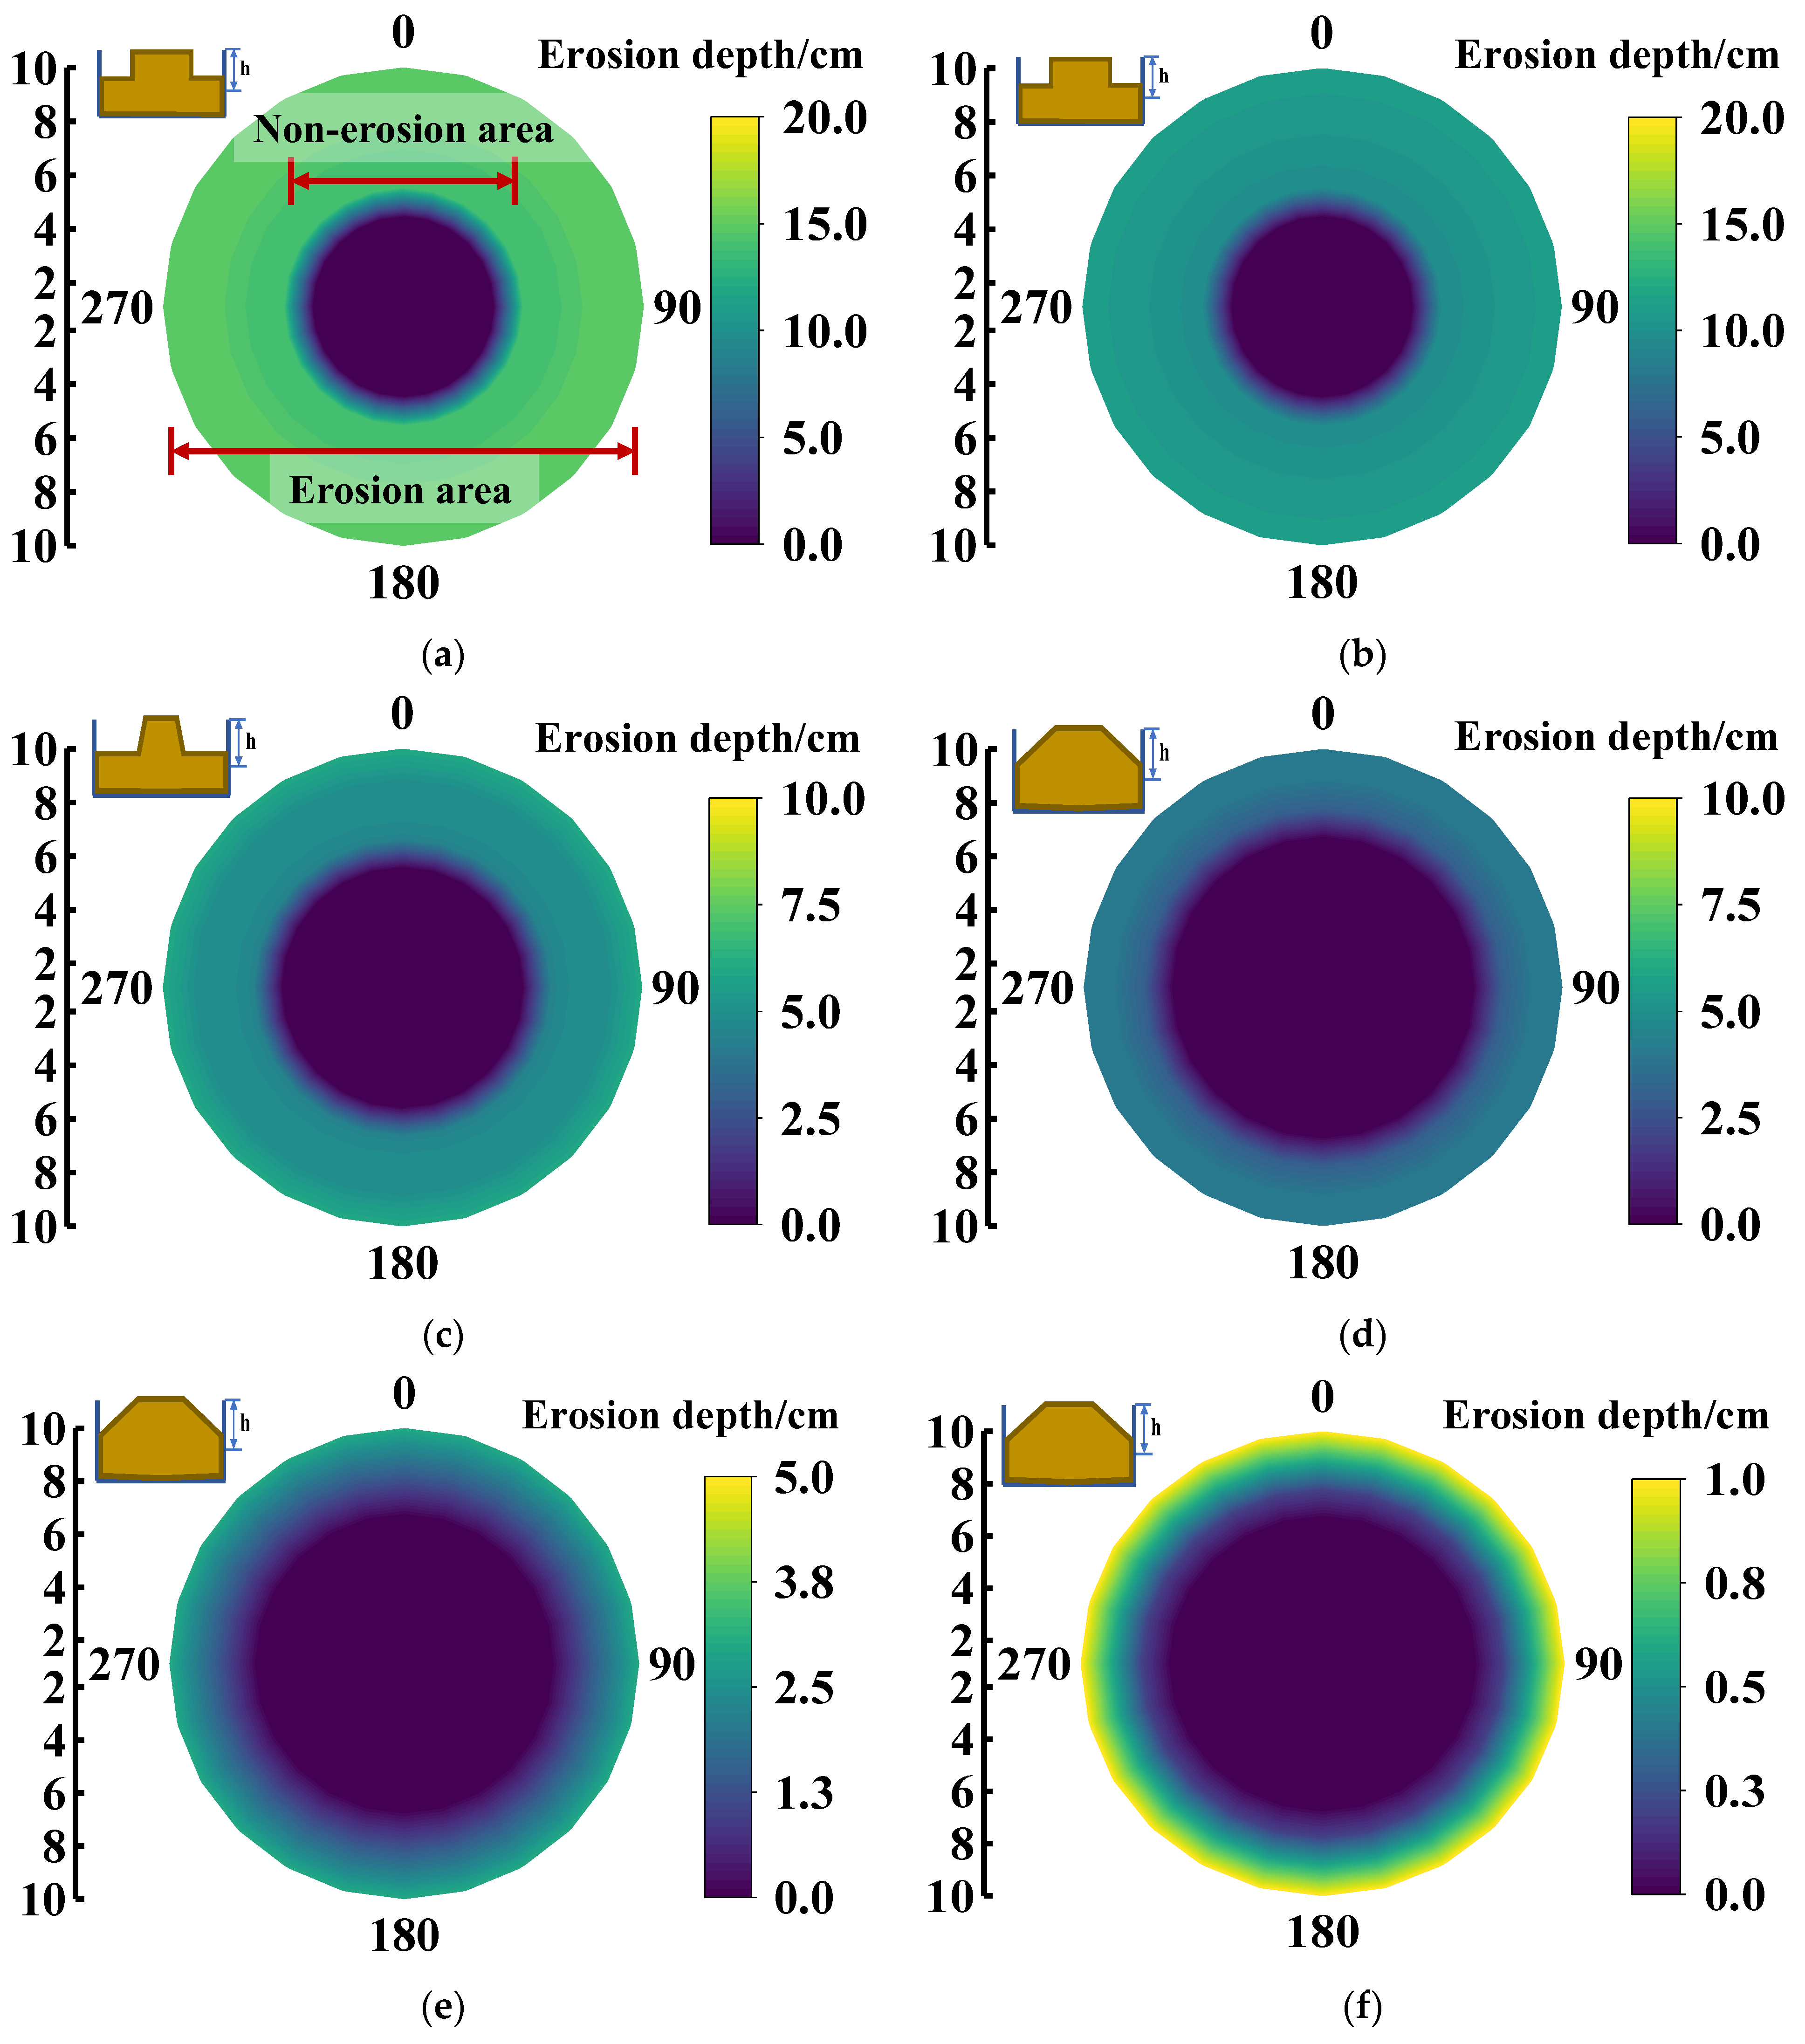
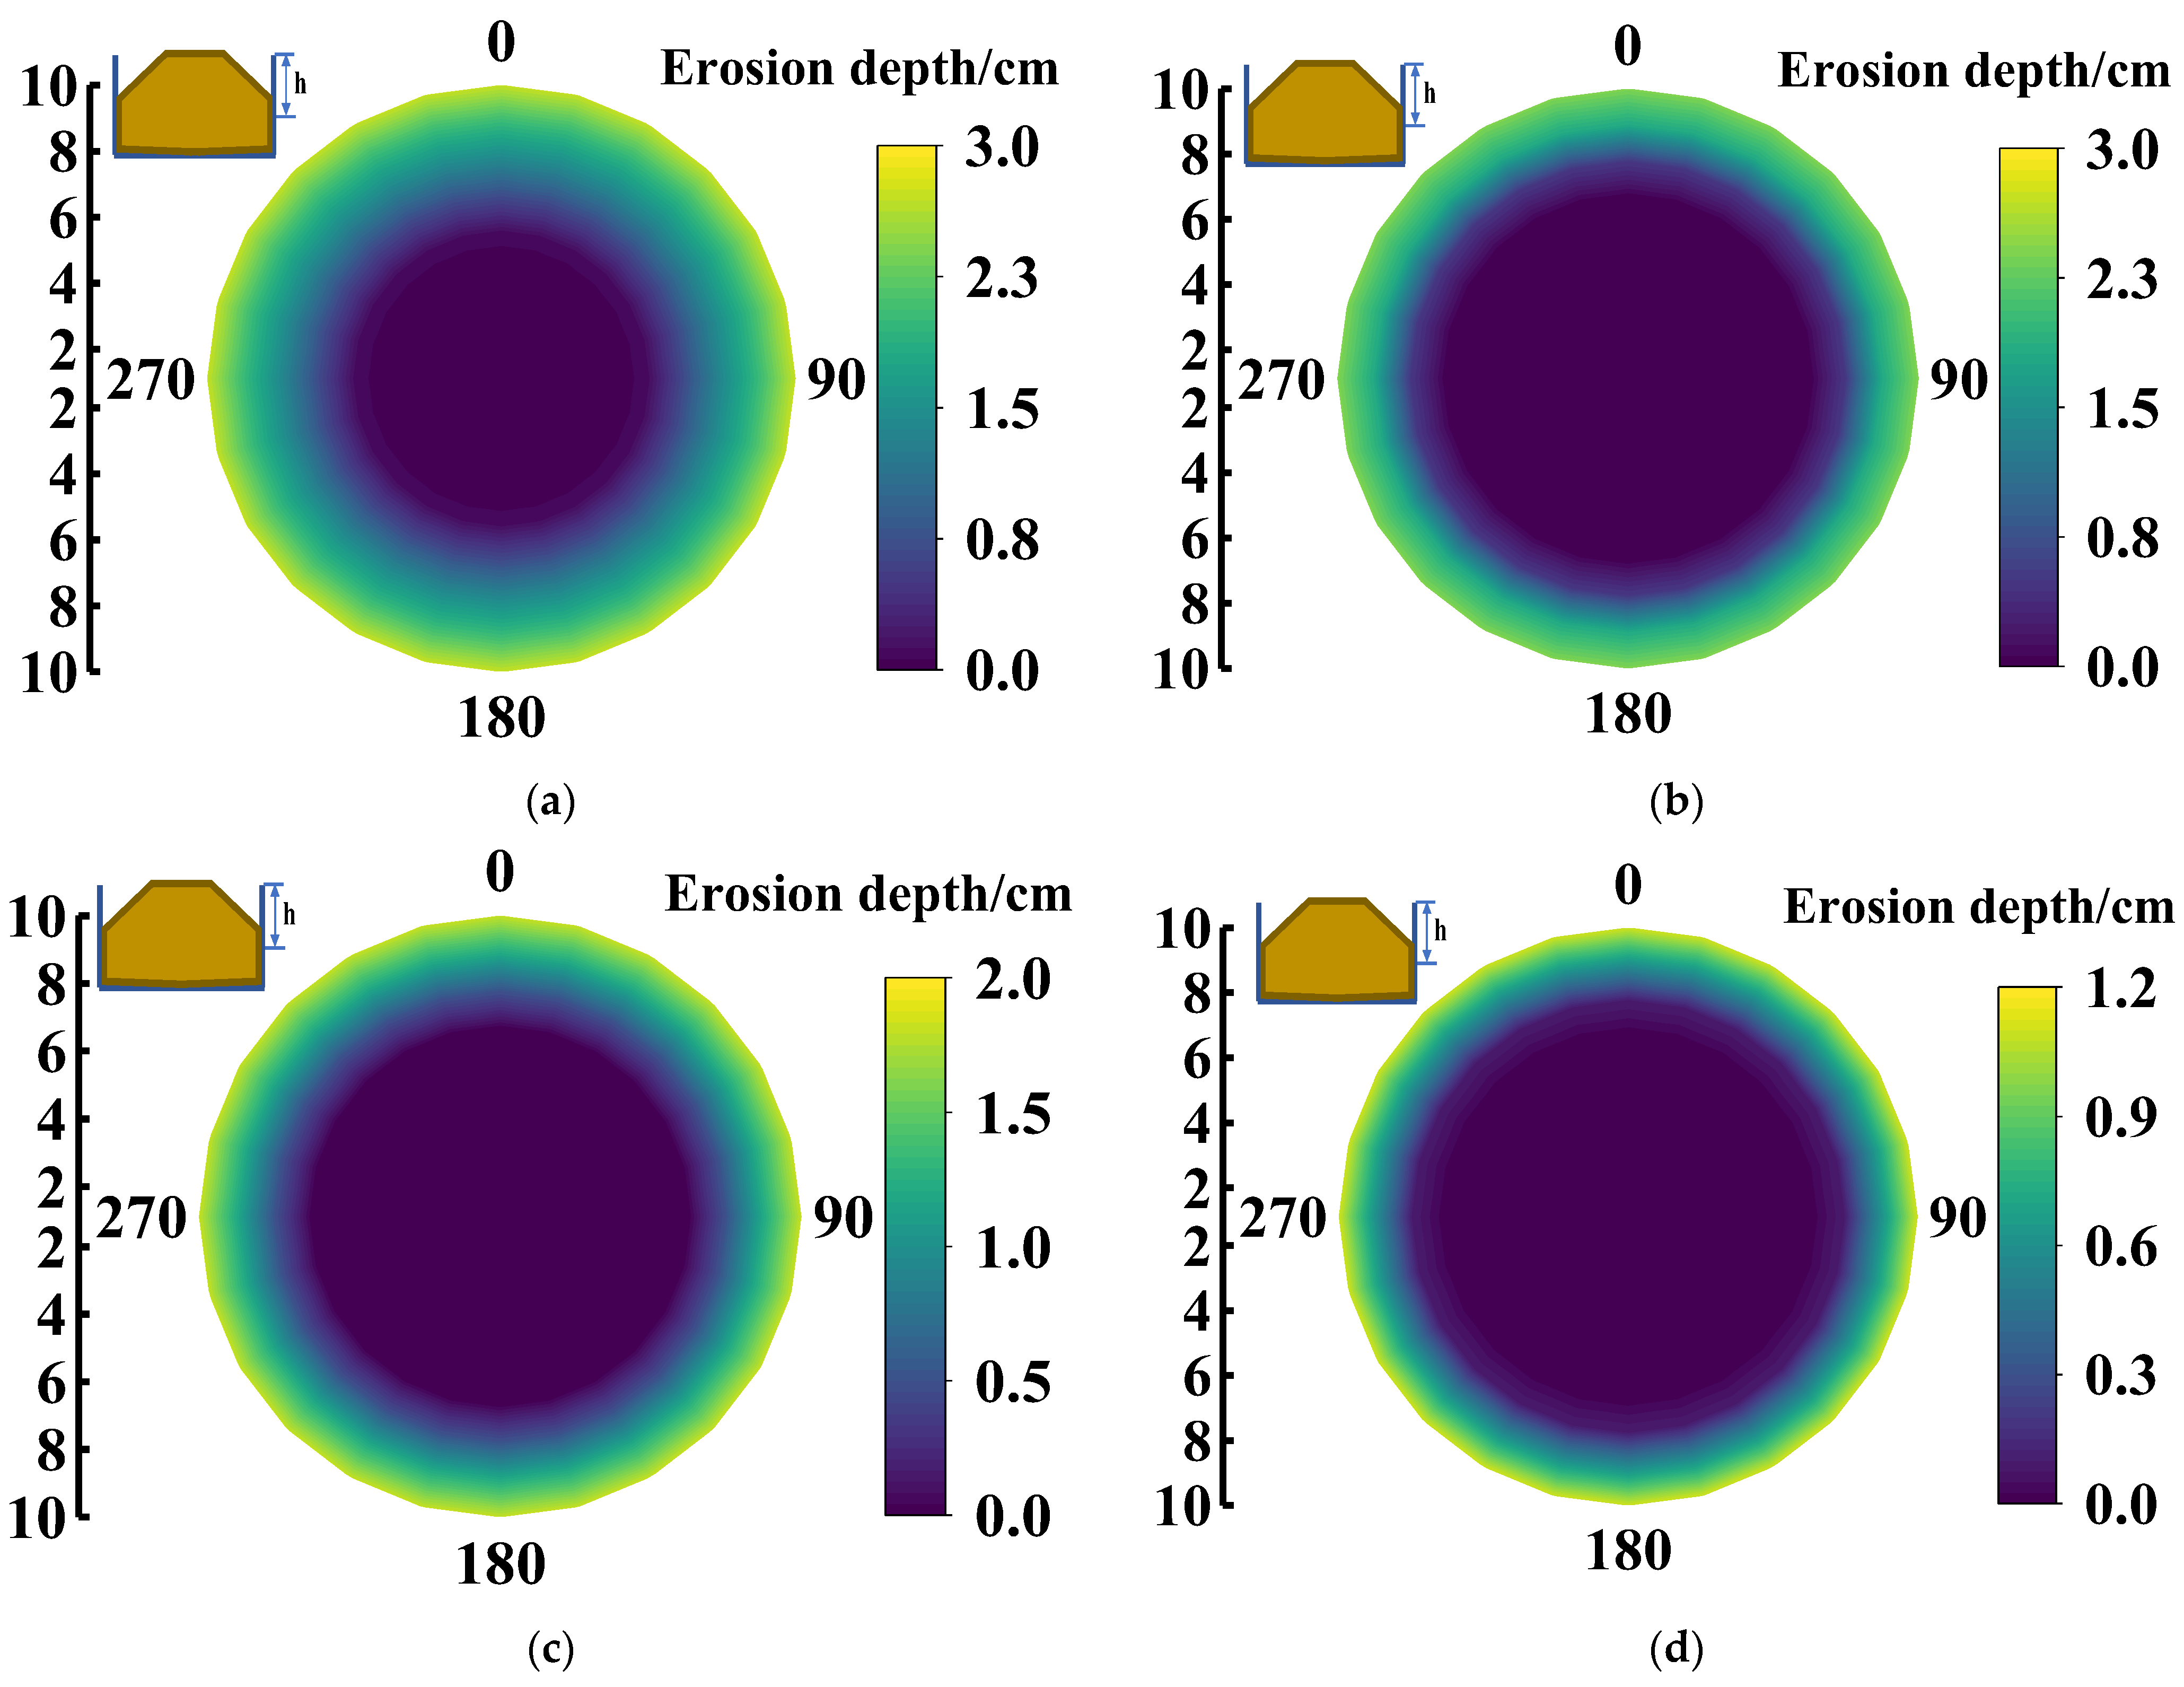
4.2. Simplified Scour Resistance Test Results
4.3. Relationship between Scour Resistance and Solidified Soil UCS
5. Conclusions
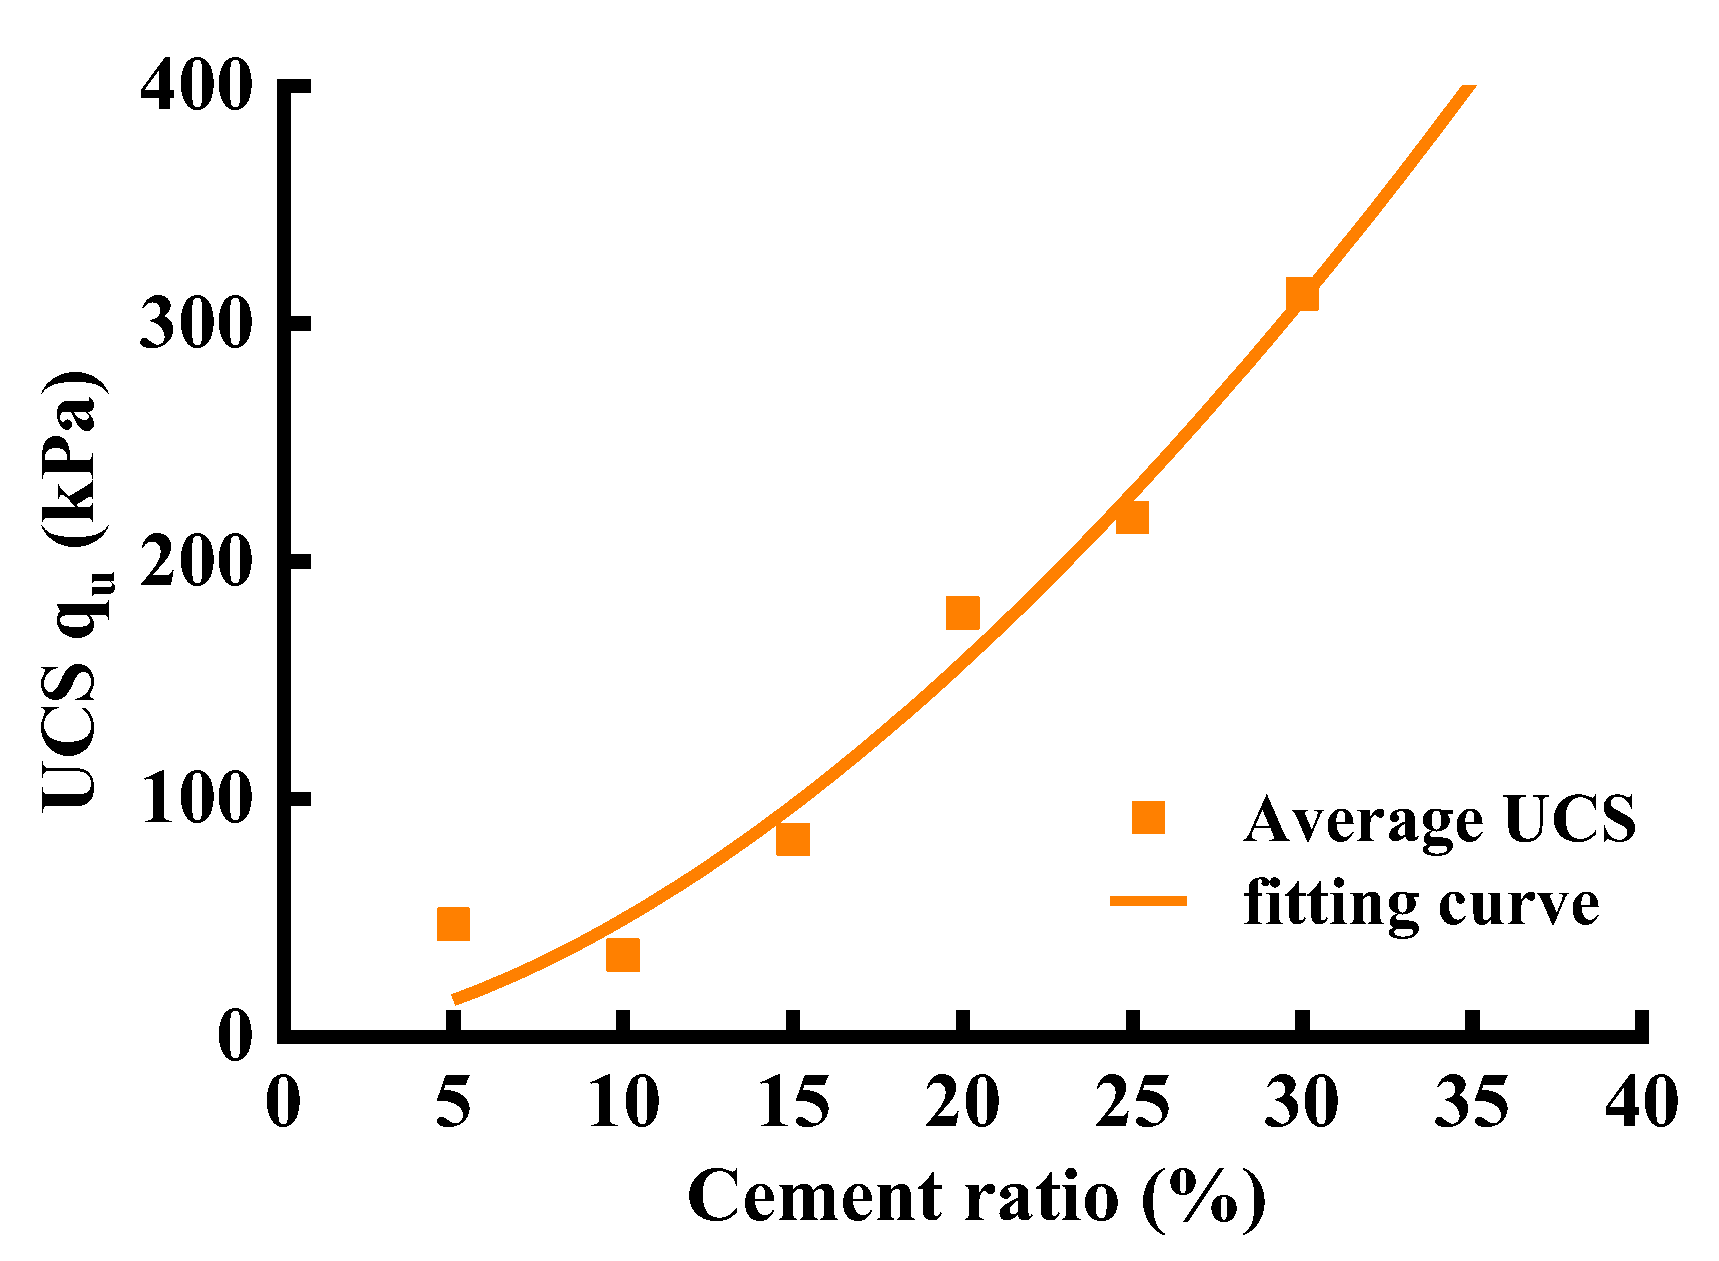
- The development pattern for the UCS of solidified soil containing a cement admixture can be approximated by fitting a power function. The fitted results can be used to estimate the UCS of solidified soils at the corresponding admixture levels;
- The direct solidification of natural soil with a high moisture content can ensure compatibility during construction, but the UCS is small. In engineering practice, for the solidification of silt with a high moisture content, water reduction measures should be considered to reduce the moisture content of the silt soil and to reduce the required amount of cement;
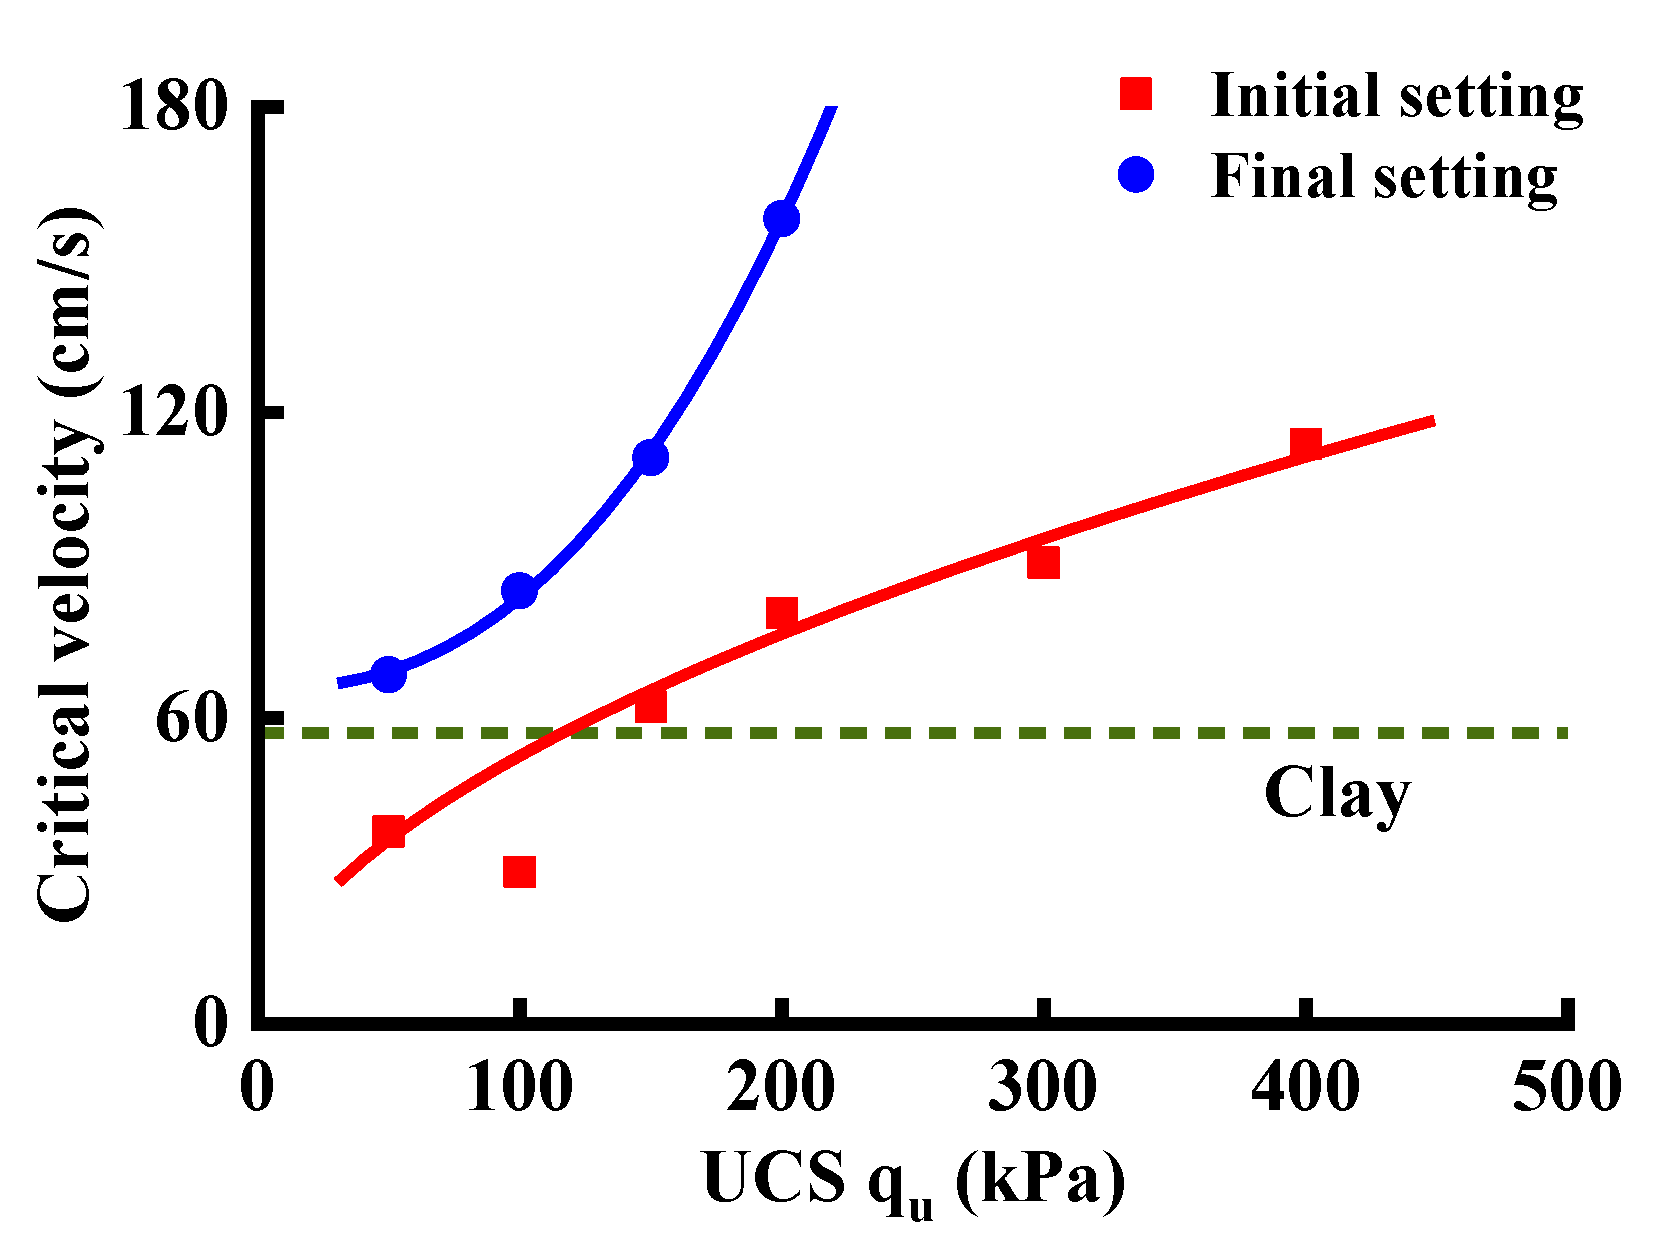
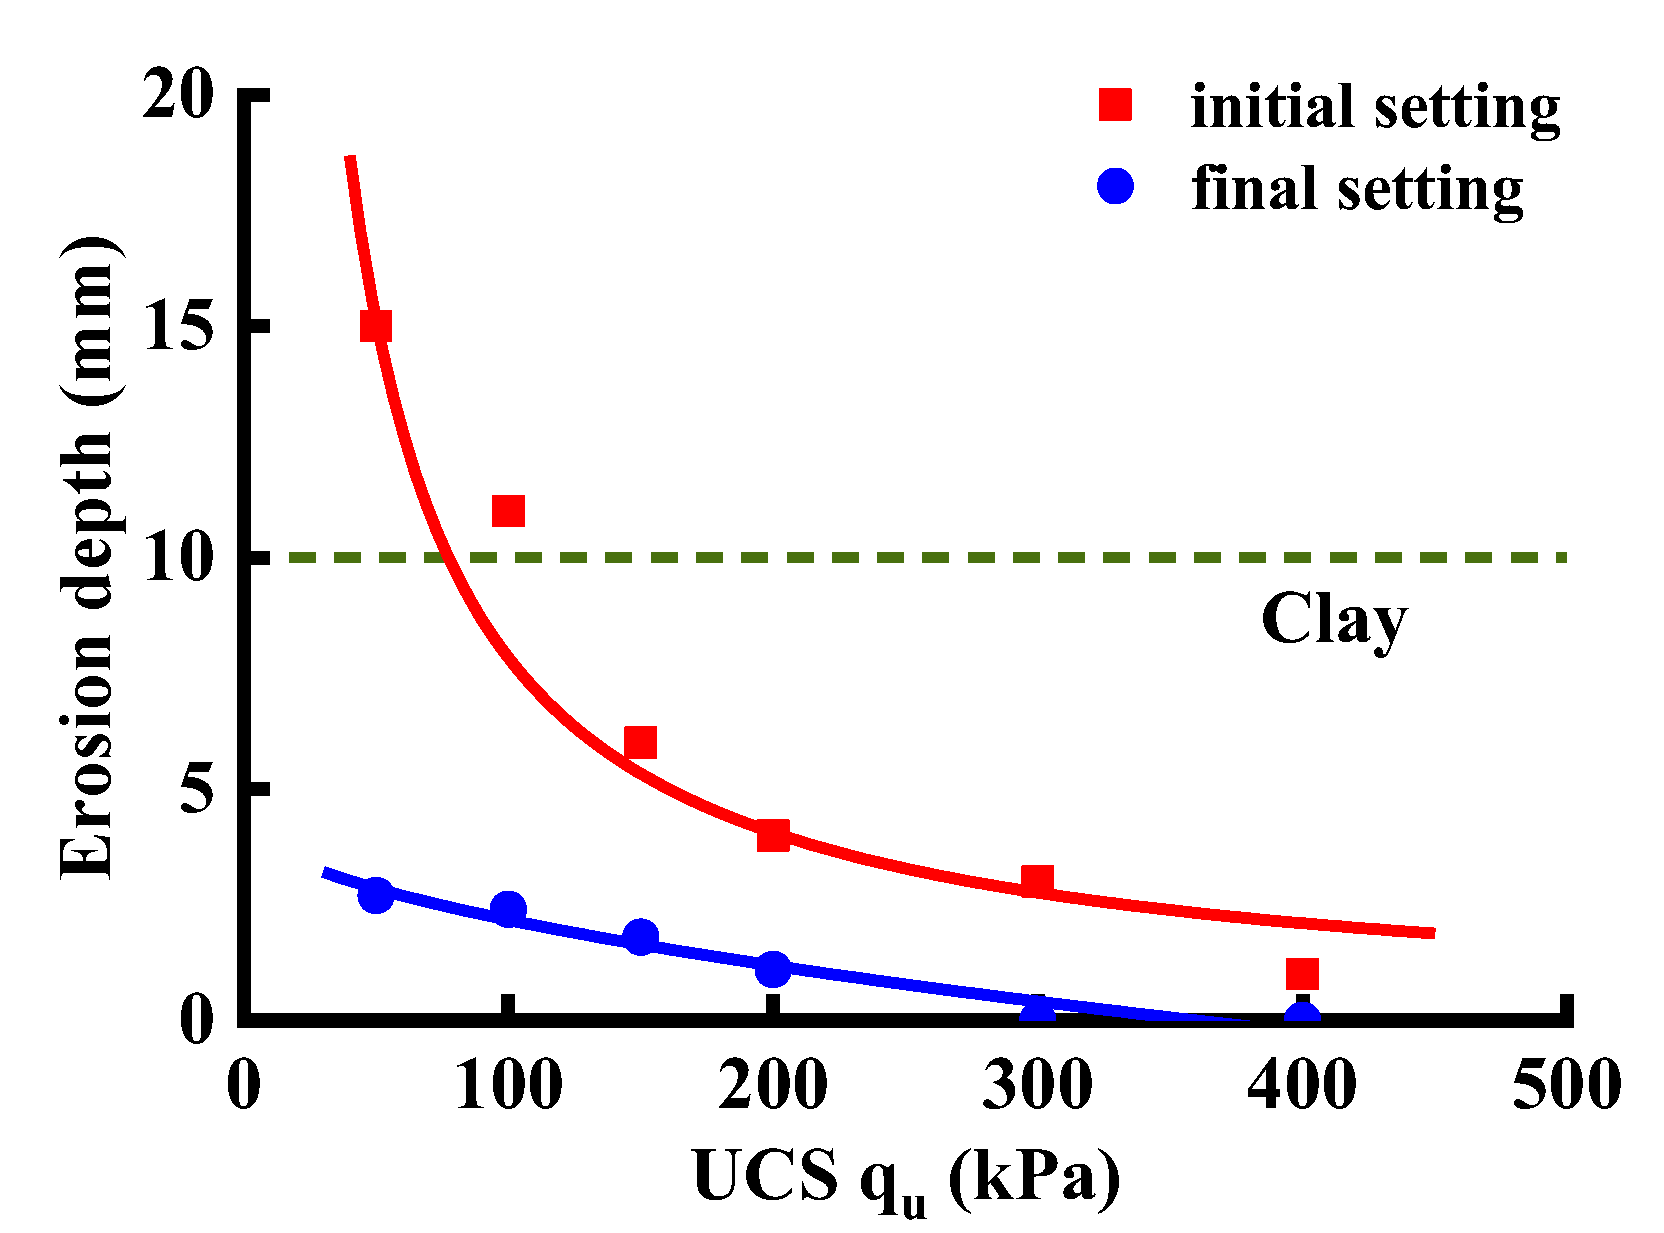
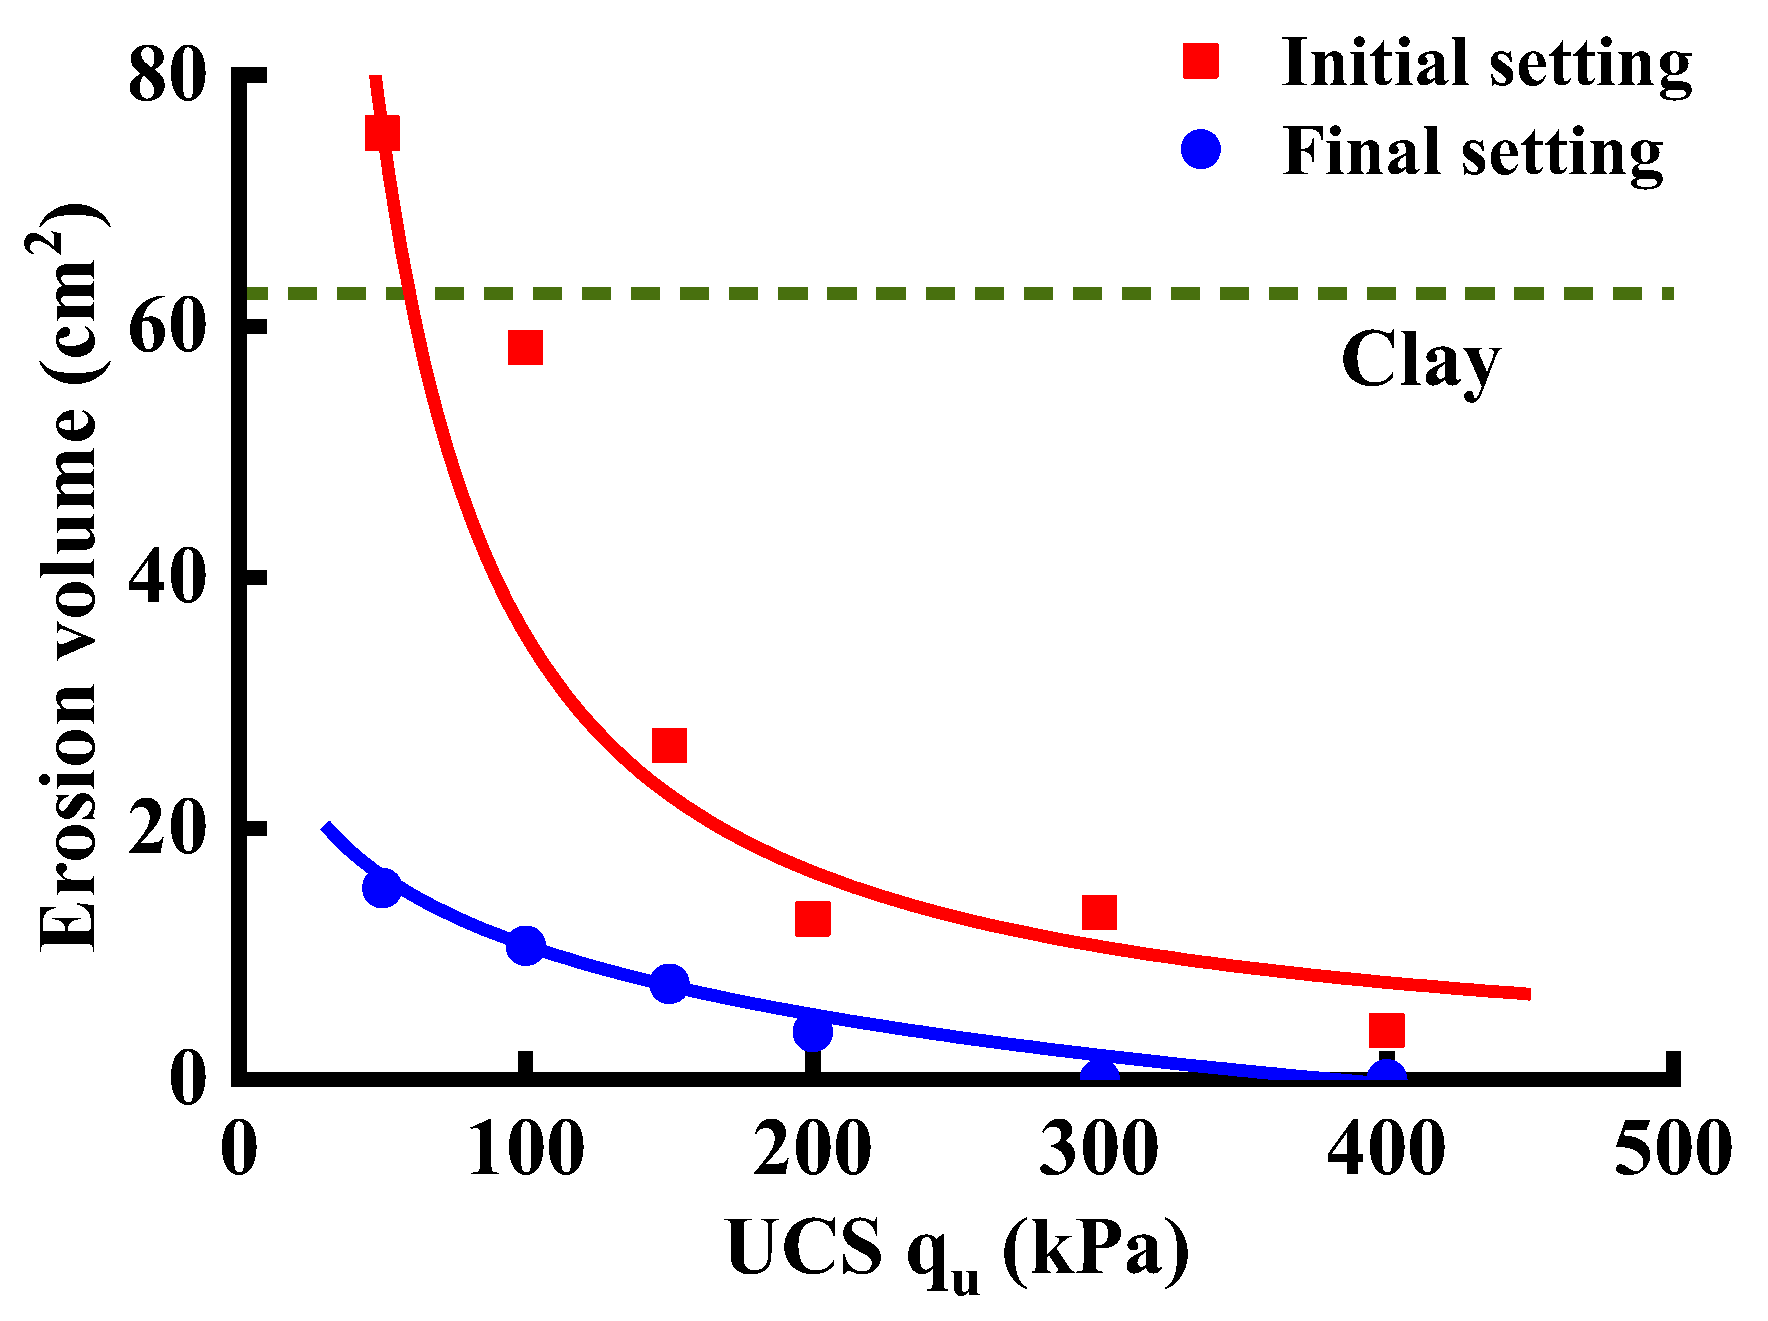
- The critical flow velocity, equilibrium erosion depth, and equilibrium erosion volume of the solidified soil are several parameters used to measure the scour resistance of the solidified soil, and these can be determined by conducting SSRTs. The fitted relationship between the parameters for scour resistance and the UCS can be obtained as shown in Table 5. In the initial setting state, the critical scour velocity of the solidified soil grows with the UCS, and the growth slows when the UCS is above 300 kPa. In the final setting state, the critical flow velocity of scouring of the solidified soil increases rapidly with the growth in UCS, and the critical flow velocity is above 3.14 m/s when the UCS is above 300 kPa;
- In the strength range of the test design, the critical scour velocity of the initial solidified soil tends to level off with increasing strength, while the critical scour velocity of the final solidified soil increases significantly with increasing strength. The test results show that the solidification state of the solidified soil has a great impact on its scour resistance, and the critical scour velocity of the final solidified soil increases by 80% to 150% as compared to the initial solidified soil at the same strength.
Author Contributions
Funding
Institutional Review Board Statement
Informed Consent Statement
Data Availability Statement
Acknowledgments
Conflicts of Interest
References
- Lee, J.; Zhao, F. GWEC Global Wind Report; Global Wind Energy Council: Brussels, Belgium, 2022; p. 75. [Google Scholar]
- Lizet, R.; Daniel, F.; Guy, B.; O’Sullivan, R. Offshore Wind in Europe—Key Trends and Statistics 2020. Wind Eur. 2021, 3, 14–17. [Google Scholar]
- Bhattacharya, S. Challenges in Design of Foundations for Offshore Wind Turbines. Eng. Technol. Ref. 2014, 1, 922. [Google Scholar] [CrossRef]
- Wang, C.; Yu, X.; Liang, F. A Review of Bridge Scour: Mechanism, Estimation, Monitoring and Countermeasures. Nat. Hazards 2017, 87, 1881–1906. [Google Scholar] [CrossRef]
- Melling, G.J. Hydrodynamic and Geotechnical Controls of Scour around Offshore Monopiles. Ph.D. Thesis, University of Southampton, Southampton, UK, 15 June 2015. [Google Scholar]
- Bennett, C.R.; Lin, C.; Parsons, R.; Han, J. Evaluation of Behavior of a Laterally Loaded Bridge Pile Group under Scour Conditions. In Proceedings of the Structures Congress 2009: Don’t Mess with Structural Engineers: Expanding Our Role, Austin, TX, USA, 30 April–2 May 2009; pp. 1–10. [Google Scholar]
- Lin, C.; Han, J.; Bennett, C.; Parsons, R.L. Behavior of Laterally Loaded Piles under Scour Conditions Considering the Stress History of Undrained Soft Clay. J. Geotech. Geoenviron. Eng. 2014, 140, 6014005. [Google Scholar] [CrossRef]
- Liang, S.; Zhang, Y.; Yang, J. An Experimental Study on Pile Scour Mitigating Measures under Waves and Currents. Sci. China Technol. Sci. 2015, 58, 1031–1045. [Google Scholar] [CrossRef]
- Liang, F.; Liang, X.; Zhang, H.; Wang, C. Seismic Response from Centrifuge Model Tests of a Scoured Bridge with a Pile-Group Foundation. J. Bridg. Eng. 2020, 25, 4020054. [Google Scholar] [CrossRef]
- Liang, F.; Yuan, Z.; Liang, X.; Zhang, H. Seismic Response of Monopile-Supported Offshore Wind Turbines under Combined Wind, Wave and Hydrodynamic Loads at Scoured Sites. Comput. Geotech. 2022, 144, 104640. [Google Scholar] [CrossRef]
- Chiew, Y.-M. Mechanics of Riprap Failure at Bridge Piers. J. Hydraul. Eng. 1995, 121, 635–643. [Google Scholar] [CrossRef]
- De Vos, L.; De Rouck, J.; Troch, P.; Frigaard, P. Empirical Design of Scour Protections around Monopile Foundations: Part 1: Static Approach. Coast. Eng. 2011, 58, 540–553. [Google Scholar] [CrossRef]
- Soulsby, R.L. Dynamics of Marine Sands: A Manual for Practical Applications. Oceanogr. Lit. Rev. 1997, 9, 947. [Google Scholar]
- Esteban, M.D.; López-Gutiérrez, J.-S.; Negro, V.; Sanz, L. Riprap Scour Protection for Monopiles in Offshore Wind Farms. J. Mar. Sci. Eng. 2019, 7, 440. [Google Scholar] [CrossRef]
- Isbash, S. Construction of Dams by Depositing Rock in Running Water. In Transactions of the Scientific Research Institute of Hydrotechnics; U.S. Engineering Office, War Department: Kansas City, MO, USA, 1935; pp. 66–76. [Google Scholar]
- DNV Offshore Standard DNV-OS-J101; Det Norske Veritas. Design of Offshore Wind Turbine Structures. DNV AS: Høvik, Norway, 2014.
- Sumer, B.M.; Fredsøe, J.; Christiansen, N. Scour around Vertical Pile in Waves. J. Waterw. Port Coast. Ocean Eng. 1992, 118, 15–31. [Google Scholar] [CrossRef]
- Myrhaug, D.; Chen Ong, M. Effects of Sand-Clay Mixtures on Scour around Vertical Piles Due to Long-Crested and Short-Crested Nonlinear Random Waves. J. Offshore Mech. Arct. Eng. 2013, 135, 034502. [Google Scholar] [CrossRef]
- Corvaro, S.; Marini, F.; Mancinelli, A.; Lorenzoni, C.; Brocchini, M. Hydro-and Morpho-Dynamics Induced by a Vertical Slender Pile under Regular and Random Waves. J. Waterw. Port Coast. Ocean Eng. 2018, 144, 4018018. [Google Scholar] [CrossRef]
- Sumer, B.M.; Fredsøe, J. Scour around Pile in Combined Waves and Current. J. Hydraul. Eng. 2001, 127, 403–411. [Google Scholar] [CrossRef]
- Chen, B.; Li, S. Experimental Study of Local Scour around a Vertical Cylinder under Wave-Only and Combined Wave-Current Conditions in a Large-Scale Flume. J. Hydraul. Eng. 2018, 144, 4018058. [Google Scholar] [CrossRef]
- Qi, W.-G.; Gao, F.-P. Physical Modeling of Local Scour Development around a Large-Diameter Monopile in Combined Waves and Current. Coast. Eng. 2014, 83, 72–81. [Google Scholar] [CrossRef]
- Dong, X.; Lian, J.; Wang, H.; Yu, T.; Zhao, Y. Structural Vibration Monitoring and Operational Modal Analysis of Offshore Wind Turbine Structure. Ocean Eng. 2018, 150, 280–297. [Google Scholar] [CrossRef]
- Zhang, R.; Zheng, S.; Zheng, J. Experimental Study on Strength Behavior of High Water Content Clay Stabilized by Low Amount of Cement. J. Huazhong Univ. Sci. Technol. Sci. Ed. 2015, 43, 101–106. [Google Scholar]
- Li, X. Theoretical Study on Stabilization of Marine Soft Clay in Hangzhou. Ph.D. Thesis, Zhejiang University, Hangzhou, China, 2013. [Google Scholar]
- Bell, F.G. An Assessment of Cement-PFA and Lime-PFA Used to Stabilize Clay-Size Materials. Bull. Int. Assoc. Eng. Geol. l’Association Int. Géologie L’ingénieur 1994, 49, 25–32. [Google Scholar] [CrossRef]
- Al-Amoudi, O.S.B. Characterization and Chemical Stabilization of Al-Qurayyah Sabkha Soil. J. Mater. Civ. Eng. 2002, 14, 478–484. [Google Scholar] [CrossRef]
- Horpibulsuk, S.; Rachan, R.; Chinkulkijniwat, A.; Raksachon, Y.; Suddeepong, A. Analysis of Strength Development in Cement-Stabilized Silty Clay from Microstructural Considerations. Constr. Build. Mater. 2010, 24, 2011–2021. [Google Scholar] [CrossRef]
- Wang, D.; Zentar, R.; Abriak, N.E. Durability and Swelling of Solidified/Stabilized Dredged Marine Soils with Class-F Fly Ash, Cement, and Lime. J. Mater. Civ. Eng. 2018, 30, 4018013. [Google Scholar] [CrossRef]
- Briaud, J.-L.; Ting, F.C.K.; Chen, H.C.; Gudavalli, R.; Perugu, S.; Wei, G. SRICOS: Prediction of Scour Rate in Cohesive Soils at Bridge Piers. J. Geotech. Geoenviron. Eng. 1999, 125, 237–246. [Google Scholar] [CrossRef]
- Wang, C.; Yuan, Y.; Liang, F.; Yu, X.B. Investigating the Effect of Grain Composition on the Erosion around Deepwater Foundations with a New Simplified Scour Resistance Test. Transp. Geotech. 2021, 28, 100527. [Google Scholar] [CrossRef]
- Maniatis, G.; Hoey, T.; Hodge, R.; Rickenmann, D.; Badoux, A. Inertial Drag and Lift Forces for Coarse Grains on Rough Alluvial Beds Measured Using In-Grain Accelerometers. Earth Surf. Dyn. 2020, 8, 1067–1099. [Google Scholar] [CrossRef]
- Li, J.; Tao, J. CFD-DEM Two-Way Coupled Numerical Simulation of Bridge Local Scour Behavior under Clear-Water Conditions. Transp. Res. Rec. 2018, 2672, 107–117. [Google Scholar] [CrossRef]
- Hong, D. The Experiment Study on the Scouring Characteristics of Cohesive Undisturbed Soil. Ph.D. Thesis, Hohai University, Nanjing, China, 2005. [Google Scholar]
- Briaud, J.-L. Case Histories in Soil and Rock Erosion: Woodrow Wilson Bridge, Brazos River Meander, Normandy Cliffs, and New Orleans Levees. J. Geotech. Geoenviron. Eng. 2008, 134, 1425–1447. [Google Scholar] [CrossRef]
- Briaud, J.-L.; Ting, F.C.K.; Chen, H.C.; Cao, Y.; Han, S.W.; Kwak, K.W. Erosion Function Apparatus for Scour Rate Predictions. J. Geotech. Geoenviron. Eng. 2001, 127, 105–113. [Google Scholar] [CrossRef]
- White, C.M. The Equilibrium of Grains on the Bed of a Stream. Proc. R. Soc. Lond. Ser. A Math. Phys. Sci. 1940, 174, 322–338. [Google Scholar]
- Vanoni, V.A. Sedimentation Engineering; American Society of Civil Engineers: Reston, VA, USA, 2006. [Google Scholar]
- Tang, Z.; Melville, B.; Singhal, N.; Shamseldin, A.; Zheng, J.; Guan, D.; Cheng, L. Countermeasures for Local Scour at Offshore Wind Turbine Monopile Foundations: A Review. Water Sci. Eng. 2022, 15, 15–28. [Google Scholar] [CrossRef]
- Kitazume, M.; Satoh, T. Development of a Pneumatic Flow Mixing Method and Its Application to Central Japan International Airport Construction. Proc. Inst. Civ. Eng.-Ground Improv. 2003, 7, 139–148. [Google Scholar] [CrossRef]
- Morohoshi, K.; Yoshinaga, K.; Miyata, M.; Sasaki, I.; Saitoh, H.; Tokoro, M.; Fukuda, N.; Fujii, T.; Yamada, K.; Ishikawa, M. Design and Long-Term Monitoring of Tokyo International Airport Extension Project Constructed on Super-Soft Ground. Geotech. Geol. Eng. 2010, 28, 223–232. [Google Scholar] [CrossRef]
- China Standard DGJ08-37-2018; Code for Investigation of Geotechnical Engineering. Shanghai Construction and Building Materials Industry Market Management Station: Shanghai, China, 2018.
- Wang, Y. Sulphoaluminate Cement; Beijing University of Technology Press: Beijing, China, 1999. [Google Scholar]
- China Standard JGJ/T 233-2011; Specification for Mix Proportion Design of Cement Soil. China Architecture Press: Beijing, China, 2011.
- China Standard GB/T 50123-2019; Standard for Geotechnical Testing Method. China Planning Press: Beijing, China, 2019.
- Jia, J. Research on Comprehensive Water Content of Cement Treated Soil. Chin. J. Undergr. Space Eng. 2006, 2, 132–136. [Google Scholar]


| Moisture Content (%) | Density (g/cm3) | Pore-Solid Ratio | Liquid Limit | Plastic Limit | UCS (kPa) |
|---|---|---|---|---|---|
| 36.0~49.7 | 1.64~1.79 | 1.12~1.67 | 34.4~50.2 | 19.0~26.0 | 42~77 |
| Main Components | Rank | Specific Surface Area (m2/kg) | UCS (MPa) | Solidified Age (min.) | ||
|---|---|---|---|---|---|---|
| 1-Day | 3-Day | Initial | Final | |||
| Sulphate, aluminate | 425 | ≥350 | 30 | 42.5 | 15 | 30 |
| Group * | Soil-to-Cement Ratio | Moisture Content of Solidified Soil | Solidified Age |
|---|---|---|---|
| U1 | 5% | 75% | 7 days |
| U2 | 10% | 75% | 7 days |
| U3 | 15% | 75% | 7 days |
| U4 | 20% | 75% | 7 days |
| U5 | 25% | 75% | 7 days |
| U6 | 30% | 75% | 7 days |
| Group | Targeted UCS (kPa) | Solidification States |
|---|---|---|
| S0 | control group | no curing |
| S1, S2 | 50 | initial setting, final setting |
| S3, S4 | 100 | initial setting, final setting |
| S5, S6 | 150 | initial setting, final setting |
| S7, S8 | 200 | initial setting, final setting |
| S9, S10 | 300 | initial setting, final setting |
| S11, S12 | 400 | initial setting, final setting |
| Relationship | Solidified State | Formula (Units) | R2 Value |
|---|---|---|---|
| UCS vs. critical flow velocity | Initial | 0.9822 | |
| Final | 0.9991 | ||
| UCS vs. equilibrium erosion depth | Initial | 0.9854 | |
| Final | 0.9504 | ||
| UCS vs. erosion volume | Initial | 0.9842 | |
| Final | 0.9770 |
Publisher’s Note: MDPI stays neutral with regard to jurisdictional claims in published maps and institutional affiliations. |
© 2022 by the authors. Licensee MDPI, Basel, Switzerland. This article is an open access article distributed under the terms and conditions of the Creative Commons Attribution (CC BY) license (https://creativecommons.org/licenses/by/4.0/).
Share and Cite
Wang, J.; Xie, J.; Wu, Y.; Wang, C.; Liang, F. An Investigation of the Effect of Utilizing Solidified Soil as Scour Protection for Offshore Wind Turbine Foundations via a Simplified Scour Resistance Test. J. Mar. Sci. Eng. 2022, 10, 1317. https://doi.org/10.3390/jmse10091317
Wang J, Xie J, Wu Y, Wang C, Liang F. An Investigation of the Effect of Utilizing Solidified Soil as Scour Protection for Offshore Wind Turbine Foundations via a Simplified Scour Resistance Test. Journal of Marine Science and Engineering. 2022; 10(9):1317. https://doi.org/10.3390/jmse10091317
Chicago/Turabian StyleWang, Jing, Jinbo Xie, Yingjie Wu, Chen Wang, and Fayun Liang. 2022. "An Investigation of the Effect of Utilizing Solidified Soil as Scour Protection for Offshore Wind Turbine Foundations via a Simplified Scour Resistance Test" Journal of Marine Science and Engineering 10, no. 9: 1317. https://doi.org/10.3390/jmse10091317