Article

Effect of the Torsion Box Dimensions on Local Stress Distribution and Fatigue Strength Assessment of a Container Ship

by
Arturo Silva-Campillo
and
Francisco Pérez-Arribas
*
Universidad Politécnica de Madrid, Avenida de la Memoria 4, 28040 Madrid, Spain
*
Author to whom correspondence should be addressed.
J. Mar. Sci. Eng. 2022, 10(9), 1172; https://doi.org/10.3390/jmse10091172
Submission received: 19 July 2022 / Revised: 14 August 2022 / Accepted: 16 August 2022 / Published: 23 August 2022
(This article belongs to the Special Issue Strength of Ship Structures)

Abstract

:
The aim of this paper is to estimate the influence of the dimensions of the torsion box (height and width), of a 2400 TEU feeder-class container ship, on local stress distribution and assessment of local fatigue strength by using a numerical approach based on the fatigue limit-state and ultimate limit-state in the midship region. In terms of the fatigue limit-state, the effect of the dimensions of the torsion box is obtained by geometrical modifications, in the connection between the side shell longitudinal stiffeners with the transverse web frame for nine structural details, referring to different arrangements of strengthening elements (brackets and flat bars). The process of comparing the different elements determines the most effective combination. This structural influence on the local stress distribution is assessed, along the longitudinal plates between ordinary stiffeners bounding the perimeter of the torsion box, by calculating the hull girder stresses, local buckling stresses and shear stress distribution induced by vertical and horizontal shear forces, Saint Venant and warping torques, and finally the shear stresses induced by a warping moment. Scantling criteria are obtained allowing for a better design of this very important region in container ships.

1. Introduction

Container ships are a fundamental link in the global transport logistics chain and for this reason they have a direct impact on the phenomenon of the global economy. This fact translates into the emergence of one of the vessels with the greatest presence in the world’s seas and oceans, which has been associated with an incessant growth, in terms of size, of these vessels as a consequence of the appearance of the socio-economic phenomenon known as economies of scale. This increase in the size of container ships means that ports must increase their facilities to be able to receive them, however, this possibility cannot be carried out in all ports due to limitations in their design, so that in order to receive container cargo, containers must be transported from larger cargo terminals through what are known as feeder container ships, which are responsible for providing service to secondary ports [1], and it is for this reason that this type of ship has been the subject of study on many occasions [2,3].
Container ships have a typical structure (thin-walled girder and large hatch openings) that allows them to be quicker in port stowage operations, but at the same time they are more sensitive to the stresses derived from the combination of global bending and torsional moments. Wang et al. [4] studied the failure mechanisms due to torsion of ships with large hatches from the establishment of numerical models and experimental tests in the collapse process of the structure, obtaining the main failure mode in the warping phenomenon, which also has a direct influence on the ultimate torsional strength, decreasing it significantly. Paik et al. [5] demonstrated the influence of torsion on the warping stresses of a 4300 TEU container ship and its implication for the existence of shear stresses and their reduction in the magnitude of the ultimate bending moment, while Sun and Guedes Soares [6] designed two different models to reflect and compare the failure modes due to torsional loads. The structural assessment of the ship’s strength is influenced by other variables; Senjanovic et al. [7] investigated the influence and torsional stiffness of the engine room by means of an energetic procedure, based on the modelling and simplification of the main deck as a beam under the influence of shear stress.
Iijima et al. [8] established a practical method of assessing the torsional strength of container ship structures (between 1500 and 8000 TEU capacity) by numerical analysis, obtaining the most damaging wave length at 120° with respect to the ship’s course. The interaction of loads in obtaining the ultimate strength is a fundamental concept used by Wang and Wang [9] in their research for application to a 10,000 TEU container ship from compartment model to global hull girder.
Due to the global loads on the container ship, there is a local structure called upper wing torsional box located on the port and starboard side at the height of the main deck. In this area, the highest concentration of stresses are located at midship section, and for this reason, several investigations have discussed the structural assessment near of this region. Silva-Campillo et al. [10] studied the influence on the optimum weight of the torsion box of combinations of different geometries derived from different cut-out geometries. Villavicencio et al. [11] focused the study on the variations of warping stresses near of the torsion box by comparing different formulations of the hydrodynamic torsion moment.
The concept of hydroelasticity, particularly in the permanent and transient springing and whipping phenomena, acquires a notable importance due to its influence on the fatigue phenomenon, which is increased in the torsion box area due to its high level of stresses. Han et al. [12] presented a design methodology for predicting wave-induced vibrations (springing and whipping) and their contribution to fatigue damage estimation applied to a 16,000 TEU container ship. Barhoumi and Storhaug [13] determined the contribution of the whipping effect on fatigue phenomenon in hogging and sagging conditions via in situ measurements of on-board stresses. Storhaug [14] also revealed the importance of whipping in fatigue assessment by means of experimental tests and numerical simulations on container ships with capacities ranging from 2800 to 8600 TEU. Kim and Choung [15] presented a methodology that considers multiple sea states, developing a procedure to estimate the vertical wave bending moment increased by the whipping effect by means of a hydroelastic fluid-structure interaction model in the time domain.
The influence of springing and whipping phenomena in fatigue determination is well known; Huilong et al. [16] investigated this event for two container ships of different capacities and under different loading conditions in the process of fatigue damage assessment under loads influenced by springing and by the joint action of whipping and springing, this assessment is 18.75% higher in the case of the joint combination. Other authors have worked on this issue in terms of obtaining the contribution of permanent and transient phenomena to fatigue damage; Mao et al. [17] estimated that whipping contributes about 30% of fatigue damage from the establishment of a 2800 TEU container ship operating in the Atlantic Ocean.
According to Hansen and Winterstein [18], more than 40% of the fatigue cracks found in ship structures are in the side shell plating and, more specifically, at the intersection of the primary and secondary elements. This structural detail has been a topic of study in container ships on many occasions, Li et al. [19] proposed a procedure for fatigue assessment of side-shell structures under the influence of wave non-linearity and service speed. Ringsberg et al. [20] carried out the difference of analysis in linear and non-linear regime in the determination of results, where the analysis is performed for two significant wave heights. Fricke et al. [21] investigated the hot spot locations at the intersection of primary and secondary elements by means of different structural configurations, particularly in the arrangement between a bulb type profile and a flat bar welded to it. Fricke and Paetzold [22] investigated the influence of different loading conditions on the structural detail by including different models. Silva Campillo et al. [23] propose a two-stage design methodology to aid designers in satisfying the structural requirements and contribute with to a better understanding of the transverse webs of a torsional box structure. Jagite et al. [24] presents a series of dynamic collapse analyses for a 16,000 TEU container ship subjected to various loading scenarios representative of the wave-induced stresses, and finally, Yang et al. [25] simulate vertical bending vibration, horizontal bending vibration and torsional vibration in model tests in a wave basin, for the vibration characteristics of a combined backbone model which were analysed by the three-dimensional finite element method.
The novelties of this research are related to the determination of the joint interaction of the torsion box dimensions (height and width) on local stress distribution, along the longitudinal plates that compose the perimeter of the torsion box, and fatigue strength assessment of the structural details, located in the side shell on a 2400 TEU container ship. This structural interaction is quantified in order to establish recommendations and design criteria. This paper is structured as follows. Section 2 gives a presentation of the mathematical basis, and the case study container ship that has been used in the numerical approach is presented in Section 3. The numerical simulation procedure is described in more detail in Section 4. In Section 5, the results derived from the previous section are obtained (fatigue check, global hull girder stresses, buckling strength, and shear and warping stress distribution). Finally, the conclusions from the study are presented in Section 6.

2. Mathematical Background

2.1. Global Design Loads

A simplified procedure based on the Bureau Veritas classification society formulae is used to determine the global and local loads, following the principles of Fricke et al. [26]. Hull girder loads (still water, wave and dynamic) are forces and moments, which result as effects of local loads acting on the ship. The design vertical still water bending moment amidships in hogging (MSW,H) and sagging condition (MSW,S), according to the vessel main particulars, where L is scantling length, B is breadth, CB is the block coefficient, and T is the scantling draught, are [27],
M S W , H = 1.687 · L 2 B C B + 0.7 10 3 1.831.6 · L 2 B C B 10 3 M S W , S = 1.687 · L 2 B C B + 0.7 10 3 + 1.061 · L 2 B C B + 0.7 10 3
The second term in the above formulae is the vertical wave bending moment (VWBM) component. The horizontal wave bending moment (MWH) amidships is,
M W H = 3.108 · L 2 T C B
The vertical wave shear force (QWV) at midship section is,
Q W V = 203.49 · L · B C B + 0.7 10 2
The values of wave torsional moment amidships is to be calculated under two loading conditions (ship direction forming an angle of 60° or 120° with the prevailing sea direction) based on the following consideration; The torsional moment MT is divided in two components: St. Venant torsional moment (MT,t) and warping torsional moment (MT,ω). The differential equation that describes this non-uniform torsion is given by,
M T = M T , t + M T , ω = G J t d θ d x E J ω d 3 θ d x 3
where x is the length coordinate, θ is the twist angle, G is the shear modulus, Jt is the torsional modulus of the section, E is the Young modulus and J(ω) is the sectorial moment of inertia (or warping constant) of the section. The solution of the previous differential equation, from the establishment of the corresponding boundary conditions and the integration constants (Ai), provides the twist angle θ,
θ = A 0 + A 1 x l + A 2 cosh β x + A 3 sinh β x + θ p
where l is the half-length, θ p is the particular solution, and β = G J t E J ω . The ultimate bending moment (MU) of the hull girder transverse section, in hogging and sagging condition, is defined as the maximum value of the curve of bending moment capacity versus the curvature of the transverse section considered and it’s represented by the following expression [23],
M U 1.051 M S W + 1.1 · M W V

2.2. Hull Girder Stresses

The normal stresses (σ1) induce by bending and warping moments are a linear combination of the contribution of the normal stresses corresponding to still water bending moment, vertical and horizontal wave bending moment, and absolute value of the normal warping stress (σω) induced by the warping bi-moment [28],
σ 1 = M S W Z + 0.4 M W V Z + M W H I Z y · 10 3 + σ ω
where y is the y-coordinate of the calculation point, Z denotes the section modulus, and Iz is the moment of inertia. The normal warping stress is defined by the following expression,
σ ω = ω · M ω J ω
where ω is the sectorial coordinate and M(ω) is the bi-moment applied on the structure. The shear stresses are the result of a linear coupling of the contribution of the shear stresses corresponding to hull girder shear stress induced by still water vertical shear force, vertical and horizontal wave shear force, and torque. Shear stress due to St. Venant torque τSV is given by,
τ S V = G J t d θ d x 2 A 0 t
where A0 denotes the area bounded by the cross section and t denotes the thickness of the considered segment. Shear stress due to warping torque is given by,
τ ω = M T , ω · S ω J ω t
where S(ω) is the sectorial static moment.

2.3. Plate Buckling

The governing equation of in-plane stressed thin rectangular isotropic plate is [27],
4 w x 4 + 2 4 w x 2 y 2 + 4 w y 4 = 12 1 ν 2 E h 3 N x 2 w x 2
where ν denotes the Poisson’s ratio, Nx is the in-plane loading, h denotes the plate thickness, and w is the vertical deflection in the z-direction of any point (x,y) and it can be assumed for a simply supported plate as,
w = m = 1 n = 1 A m n sin m π x a sin n π x b
where m and n are number of half waves in the x and y-direction, respectively, and a and b are the plate dimensions in x and y-direction. From the boundary conditions, the following non-trivial solution is established,
A m n π 4 m 2 a 2 + n 2 b 2 N x D m 2 π 2 a 2 = 0
Obtaining: N x = k π 2 D b 2 with D = E h 3 12 1 ν 2 plate stiffness, k = m α + α m 2 buckling factor, and α = a b aspect ratio. Finally, the Euler buckling stress (σE or Sig.Buck) is:
σ E = k π 2 E 12 ( 1 ν 2 ) h b 2
In a similar way, Euler shear buckling stress (τE or Tau.Buck) is:
τ E = k π 2 E 12 ( 1 ν 2 ) h b 2 with   k = 5.35 + 4 α 2 k = 5.35 α 2 + 4 for   α > 1 α 1
The buckling process does not always occur in its entirety in the elastic regime but sometimes it has to be corrected for plasticity in the elastic buckling stress under the Johnson-Ostenfeld approach [28],
σ c r = σ E σ y 1 σ y 4 σ E for   σ E < p r σ y σ E p r σ y
where σcr denotes the critical (elastic/plastic) buckling stress, σy denotes the yield stress, and pr is a coefficient that takes into account the sensitivity to plasticity which is around 0.5–0.6.

2.4. Fatigue Damage Assessment

Fatigue damage ratio is determined in the case of a single S-N curve segment by the following expression [23]:
D = N t A 1 Δ σ ln N R 1 / ξ m 1 · Γ m 1 ξ + 1
where A1 and m1 are S-N curve parameters, ∆σ is the stress range, NR is the total number of load cycles, Nt is the number of cycles for the expected design life, Γ is the gamma function, and ξ is the Weibull shape parameter [29], which as a first approximation may be taken as ξ = 1.1 0.35 L 100 300 , where L is the ship length in meters.

3. Case Study

3.1. Description

The general overview of the 2400 TEU container ship is shown in Figure 1:
A Panamax container ship is selected with main particulars similar to the ship analyzed by Soadamara et al. [30] as follows in Table 1.
Table 2 presents the midship section cross-sectional properties.
Figure 2 shows the midship section, with the torsion box detail, formed by two types of high-strength steel (206 GPa Young modulus and 0.3 Poisson’s ratio): 315 MPa yield strength steel (AH32) and 355 MPa yield strength steel (AH36), as shown in Table 3.
Figure 2 also depicts each of the regions that constitute the torsion box (side shell, strength deck, double hull, and second deck) and the nodes (1 to 4) along the longitudinal plates between ordinary stiffeners bounding its perimeter.
The analysis procedure consists of establishing the degree of influence of the geometric variables defining the dimensions of the torsion box on each of the structural elements (plates and structural details). The possible combinations of the torsion box geometry are calculated through seven different values of the torsion box width (y) and height (z) variables corresponding to their initial value (y0 = 14.225 m, z0 = 14.82 m), and six variations by ±1, 2, and 3% with respect to their initial value (Table 4 and Table 5).
The dimensions defined in Table 3 and Table 4 refer to the baseline and centreline, respectively, according to Figure 2. The process of modifying the dimensions of the torsion box, particularized in the height variable, is established by altering nodes 1 and 4 at the same time, while the width variable is arranged by changing nodes 3 and 4, and those corresponding to the rest of the double hull side to be parallel to the side shell. The calculation procedure keeps the main particulars of the container ship constant in all combinations, and the results on the perimeter of the torsion box are obtained in a counter clockwise path following the numbering of nodes 1–4, along arbitrary control points between nodes.

3.2. Structural Details

Different configurations of the structural intersection referring to the four longi-web (longitudinal stiffener with transverse web frame) connections located on the side shell (L1, L2, L3, and L4) are studied as a function of the arrangement of stiffening elements (brackets and flat bars), located at the midpoint of the distance defining the spacing of primary transverse elements. The procedure is established by the following nomenclature and description of the structural details under study: Det1 is defined by one flat bar on one side, Det2 is characterized by a separate flat bar on one side, Det3 is defined by a separate flat bar and a standard bracket, Det4 is characterized by a separate flat bar and a well-rounded bracket with soft toes on each side, Det6 is defined by a flat bar and standard bracket on the same side, Det8 is characterized by a flat bar and a well-rounded bracket with soft toes on the same side, Det10 is determined by a flat bar and a standard bracket on one side and a standard bracket on the other side, and Det12 is defined by a flat bar and a standard bracket on one side and a well-rounded bracket with soft toes on the other side. The scantling of the bracket is proportional to the scantling of the flat bar. Figure 3 shows the side view of two different structure details.

4. Methodology

A two-stage numerical analysis is carried out; the first stage focuses on obtaining the degree of influence on the fatigue strength assessment of different structural details using a finite element technique and ANSYS® Workbench 2021 software following the same principles of Li et al. [19]. Hot spot stress has been adopted following the same procedure by Kim et al. [31]. The determination of these stresses due to fatigue loading is obtained through a 3D unstructured tetrahedral fine mesh stress analysis beyond 3D coarse mesh structural analysis based on the recommendations of Niemi [32], and obtaining a valid correlation between the numerical and experimental domains by comparing the results of this paper with the research of Fricke and Paetzold [22]. Figure 4 depicts the meshing pattern used in the case of the Detail No. 3 (Det3).
The load condition corresponds to the typical arrangement of static and dynamic loads resulting from the contribution of global and local loads (static and wave pressure) that induce shear forces and bending moments in the side shell longitudinal stiffeners as single beams (between each web frame). The boundary conditions respond to fixed supports at the ends of the plate that refers to the side shell. The connection between the elements is produced by welding, which is simulated in the program by assuming a single element. The load condition corresponding to the external static and wave pressure contribution concerning the side shell longitudinals is produced in the inclined ship condition, which occurs when the ship encounters waves which produce ship motions in the X-Y and Y-Z planes (Figure 1); there is a relative motion of the sea waterline anti-symmetric on the ship sides which induces the hull girder loads mentioned in the previous section. On the other hand, the same previous case particularized on the main deck longitudinal stiffeners occurs in upright ship condition when the ship encounters waves which produce ship motions in the X-Z plane (Figure 1). The values for each of the described load conditions are shown in Figure 5.
The second stage establishes the relationship of influence of the dimensions of the torsion box specified in each of the plates (elementary plate panel, EPP), which is the unstiffened part of the rectangular plating between ordinary stiffeners and/or primary supporting members that constitute the perimeter of the torsion box. The determination of shear, warping, and buckling stresses obtained through the software of the classification society Bureau Veritas Mars2000® [33] following the same procedure developed by Im et al. [34] by means of a submodel consisting of three cargo holds with a length within 0.4 L amidships (Figure 6) under the same boundary conditions as Tanny et al. [35]. Ship behavior is always in hogging condition and the total contribution due to still water bending moment (SWBM) and vertical wave bending moment (VWBM) described in Section 2, is shown in Figure 6.
The mesh convergence process, in the analysis procedure of the structural details in terms of fatigue damage (Figure 4b), is obtained by successive increase in the solution number until the change between two values (von Mises stress, σVM) is closer than the smaller of the finite element accuracy criteria used by Patil and Jeyakarthikeyan [36]. Table 6 depicts the convergence process of the mesh as a function of the elements and nodes used, selecting the combination of 7065 nodes and 3586 elements that provides a valid solution (with a change of 0.65% at a lower computational cost) and an average element size of 78.102 mm.
The correct obtaining of results is completed through the process of comparison with the corresponding results of Fricke et al. [21] and Fricke and Paetzold [22].

5. Results and Discussion

5.1. Fatigue Check

252 models are studied for different combinations of side shell longitudinals, structural detail type and torsion box dimensions (width and height). Figure 7 shows the difference in fatigue strength, in terms of damage, for each of the combinations between structural details and longitudinals in the initial condition of torsion box width and height values.
A common trend is observed in the fatigue behavior in each of the longitudinals regardless of the value of the variables that define the torsion box, obtaining an improvement in longitudinal No. 2 of 94.37%, 61.73%, and 71.58% with respect to longitudinal No. 1, No. 3 and No. 4 of mean value for each of the nine structural details tested, being the Det12 the most effective, in terms of fatigue life. Figure 8 shows the evolution of the fatigue damage value in the longitudinal No. 1 (L1) under the modification of the height and width variables.
There is an improvement in fatigue life as the height of the second deck increases and the torsion box height is reduced, for all structural details and longitudinals calculated. Regarding the width variable, a decrease in fatigue life is noted as the double hull decreases in value. Table 6 represents the variation in fatigue life (increase or decrease), in percentage terms. There is a greater influence on the determination of fatigue life with modifications of the width variable compared to the height variable, in contrast to structural detail No. 12 where the influence of the height variable predominates for values close to initial values. When the dimensions of the torsion box change from their initial values, the most adequate structural detail is not constant.

5.2. Global Hull Girder Stresses

Figure 9 shows the evolution of the values of the normal hull girder stresses (σ1) induced by torque and bending moments along the perimeter of the torsion box for each of the possible geometrical combinations.
Figure 10 depicts the evolution of the values of the shear hull girder stresses (τ1) induced by shear forces and torque along the perimeter of the torsion box for each of the possible geometrical combinations.
The modification of the width variable does not affect the shear stress distribution and the increase of the height variable, translated in terms of the lower displacement of the second deck height, becomes a decrease in the value of the shear stress. A small difference is observed in the process of variation when improved (lower value of shear stress) than when worsened (higher value of shear stress). Table 7 compares the change (in percentage terms) of normal and shear hull girder stresses for different values of the height variable.
The modification of both stresses has the same order of magnitude for all possible values of the torsion box height, except for the first value of the height increase, which has a greater influence on the determination of the shear stress with respect to the normal stress.

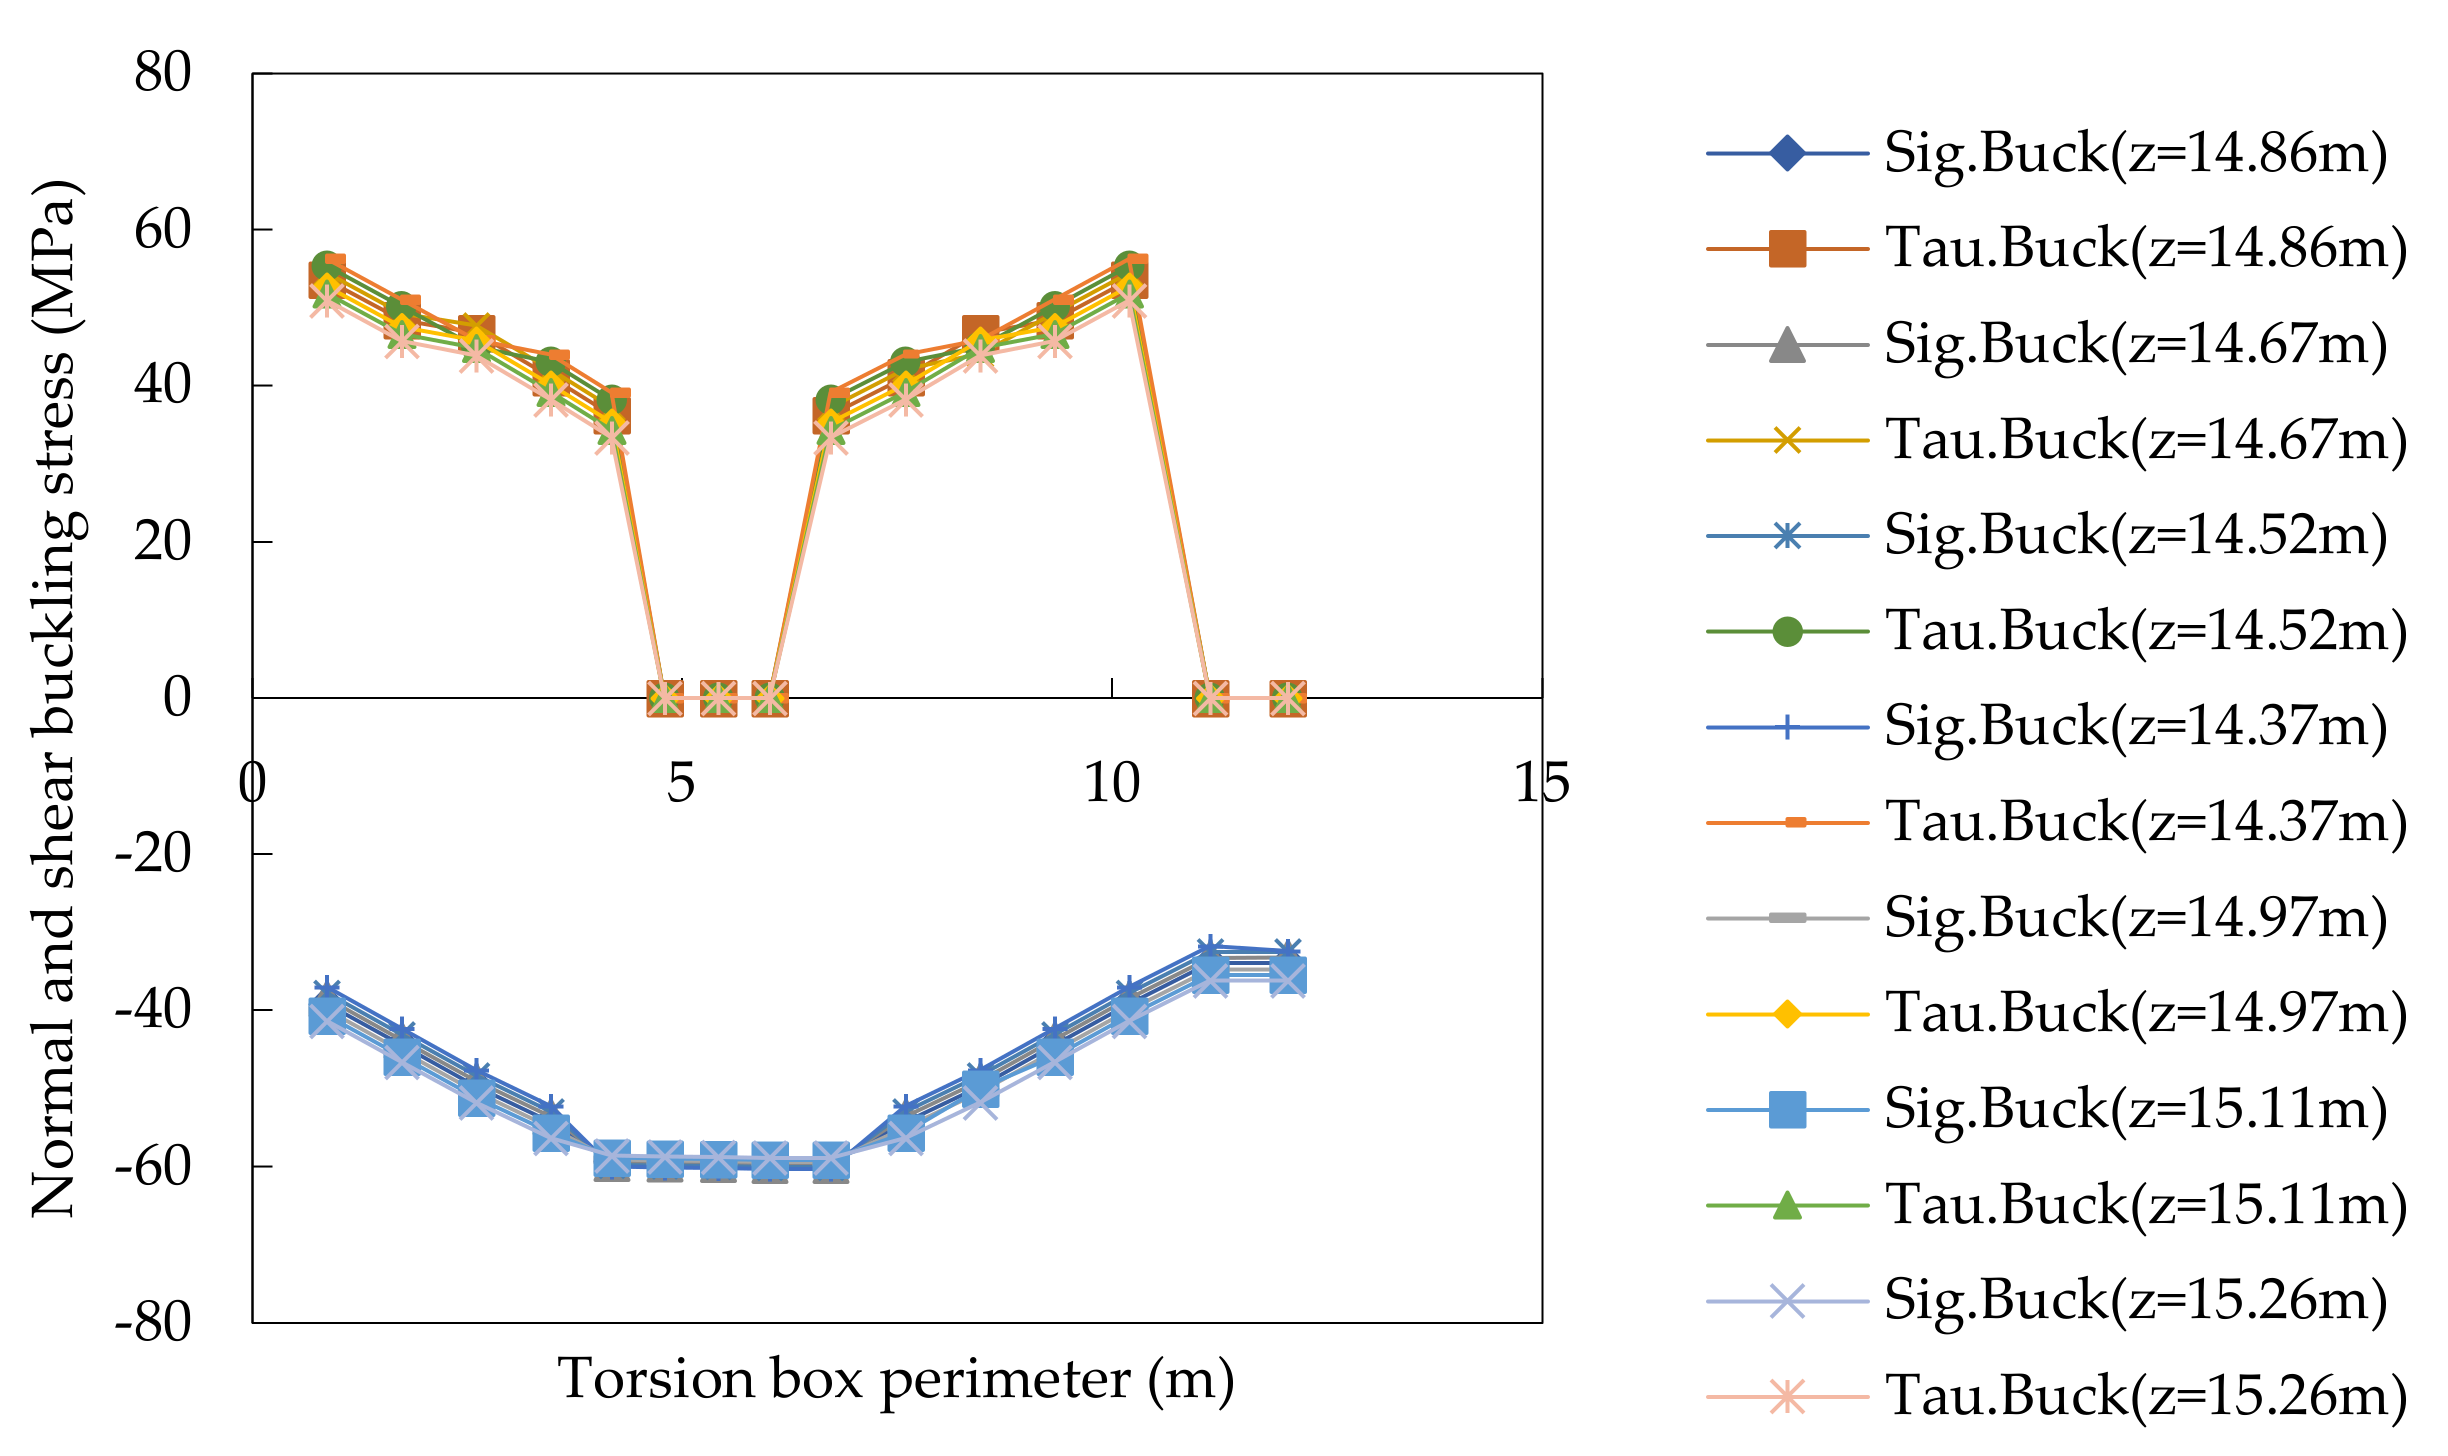
5.3. Buckling Strength

Figure 11 shows the evolution of the value of the elastic buckling stress (normal and shear) along each of the elementary plate panel (EPP), under the condition of simply supported on all four sides, that compose the perimeter of the torsion box for changes in the value of the width variable and an initial value of the height variable. Figure 12 depicts the same result under modification of height variable.
The elastic buckling shear stress remains constant with the modification of the width variable and it changes its value with the alteration of the height variable, while the elastic buckling normal stress undergoes modifications in its value with displacements of the width and height of the torsion box. In general, an increment in the value of the width results in reduction in the normal stress, while an increment in the height results in an increment in both the absolute values of shear stress and the normal stress. Table 8 shows the variation (in percentage terms) in the value of the elastic buckling stress against modifications of the variables defining the geometry of the torsion box.
A greater influence is observed in the results obtained in the case of changes in the width variable, except for the first value of the decrease (1%).

5.4. Shear and Warping Stress Distribution

Shear stress distribution induced by a standard value of 10,000 kN vertical and horizontal shear force, a standard value of 10,000 kN·m St. Venant torque and, the warping normal stress distribution induced by a 10,000 kN·m2 warping bi-moment is obtained (Figure 13).
The modification of values, shear and warping stress distribution, at the torsion box perimeter is assessed for geometrical modifications that define the dimensions of it. Figure 14 shows the shear and warping stress distribution for the initial case of the torsion box width and height.
The maximum stresses, in absolute value, mentioned above is the shear stress induced by vertical shear force (up to 42.1% and 56.3% when compared with the shear stress induced by horizontal shear force and that induced by St. Venant torque, respectively). For the initial case, the maximum of each of the stresses is located at the lower part of the inner hull side in contact with the second deck except for the warping stresses which is located at the same place but on the side shell.
For the width and height modifications of the torsion box, the location of the shear stresses induced by vertical, horizontal and St. Venant torque is at the lower part of the side shell in contact with the second deck, and the warping torque is located at the inner hull side in contact with the second deck, while the warping bi-moment is located at the top of the inner hull side in contact with the main deck. In the shear stresses induced by vertical and horizontal shear stress and St. Venant torque, there is a symmetry effect in the values between the side shell and inner hull side locations with a minor difference (1.3% and 4.1% in shear stress induced by vertical and horizontal shear forces, respectively) at the side shell location.
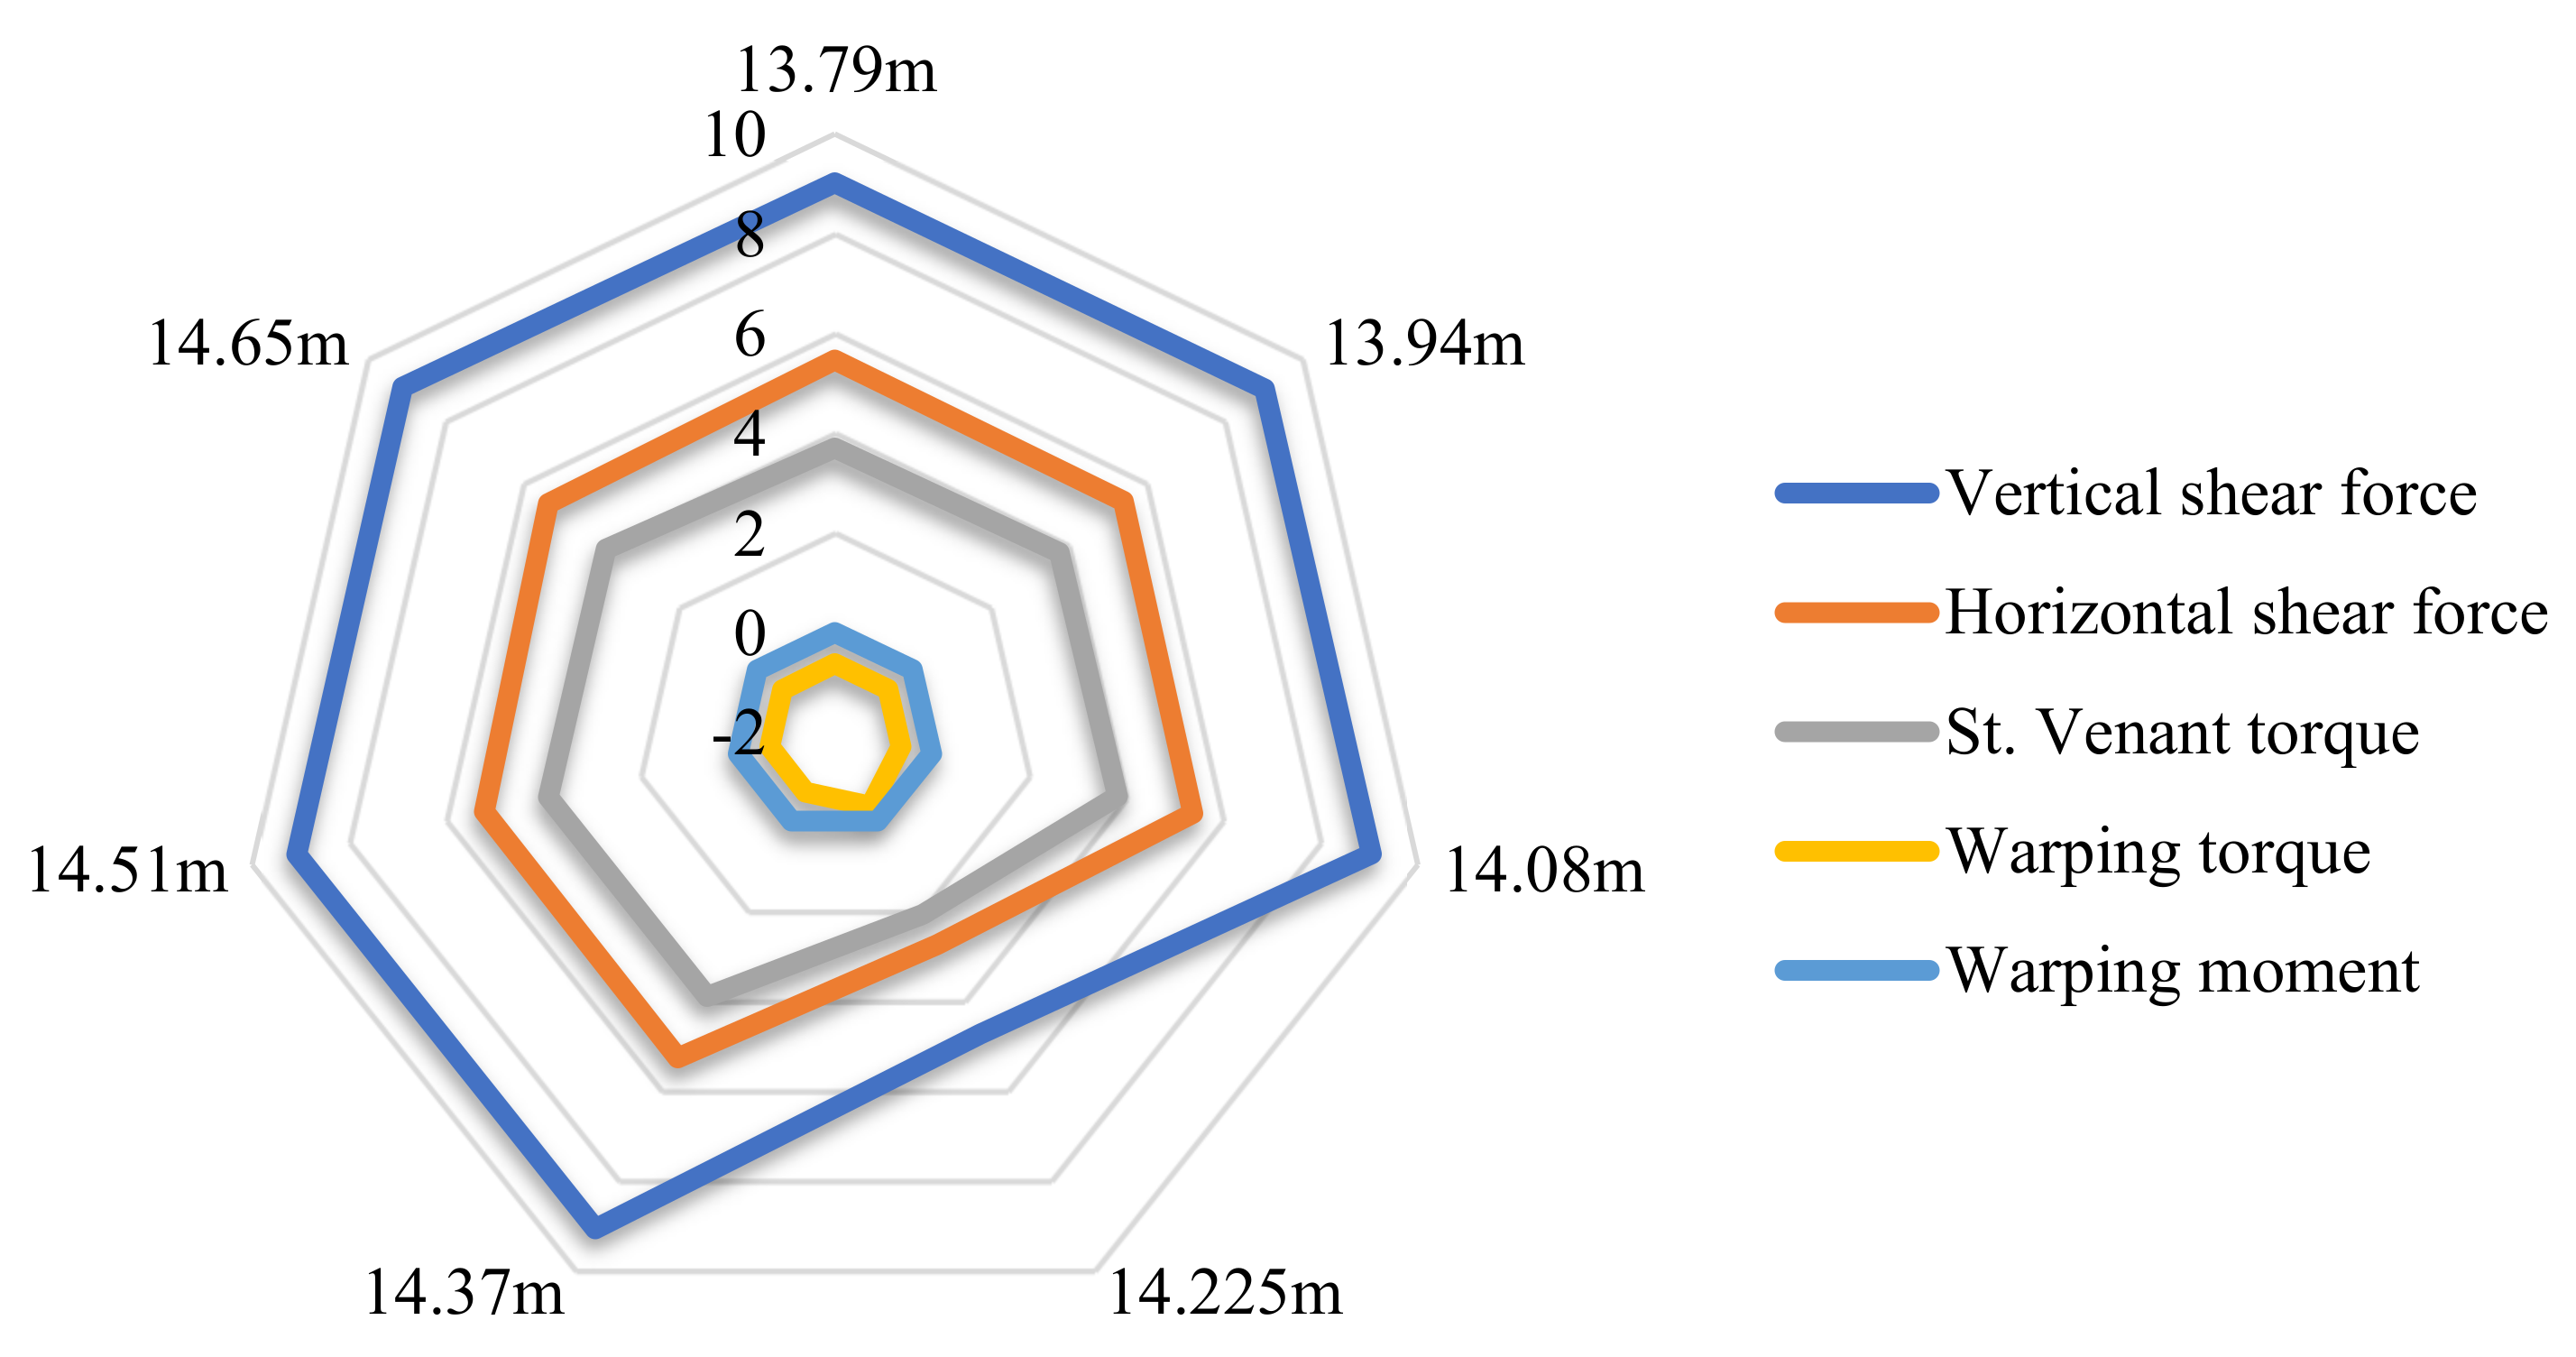
Figure 15 shows the variation in the value of the shear stresses induced by the vertical shear force and St. Venant torque, particularly at the lowest side shell location, in response to changes in the value of the torsion box height, in terms of the second deck height.
An increment of the torsion box height (by decreasing the second deck height) causes an elevation of the shear stresses induced by the vertical shear force, horizontal shear force, St. Venant torque, and warping torque. This phenomenon is of inverse character for the warping normal stresses induced by the warping bi-moment. However, the behavior of St. Venant torque has a specific characteristic and that is the downward trend for high values of the height with the same downward behavior for low values of the height, but with considerably lower values of the shear stresses for the latter case. A more notable change is observed in the lowering than in the increasing of the width. Figure 16 depicts the behavior of the shear and warping stresses under modifications of the torsion box width on the side shell in contact with the second deck.
The initial value acts as a turning point in all cases; in the shear stresses induced by the vertical and horizontal shear forces and in the St. Venant torque, this value is lower for any modification. For the case of the warping torque, any modification results in a decrease in the shear stresses, while for the warping normal stresses induced by the warping bi-moment has a rather constant behavior, producing a reduction in the shear stresses with increases of the torsion box width.

6. Conclusions

In this investigation, structural design criteria have been obtained for a container ship, and the degree of influence of the characteristics of the upper wing torsional box (height and width) has been demonstrated on the global and local structural assessment from the behavioural relationship between the geometrical variables, on-board stresses and fatigue strength assessment of different structural details located in the side shell.
Two different structural behaviours are distinguished depending on the field of study; in the ultimate fatigue state, it is of interest that the dimensions of the torsion box are as small as possible. For the evaluation of local stress distribution, the behaviour is assumed to be opposite, and larger dimensions are of interest. By means of different comparisons, a greater degree of influence of the width variable compared to the height variable in the reduction in local stresses has been demonstrated. Approximately, for a modification of 1%, the reduction in stresses in the height variable is 1.65%, while for the width variable it is 2.31%.
However, the modification of the width variable is associated with a higher economic cost in terms of ship construction since high values of the torsion box width (and therefore of the inner hull) can affect the load capacity of the ship. The improvements derived from the variation in the torsion box height are minor, but more feasible from a technical point of view as they do not affect the load capacity of the vessel and they have a minimal impact on the ballast capacity. In future stages of the research, more geometrical variables will be included and the concept will be generalised to any size of container ship.

Author Contributions

Conceptualization, A.S.-C. and F.P.-A.; methodology, A.S.-C. and F.P.-A.; software, A.S.-C.; validation, F.P.-A.; formal analysis, A.S.-C. and F.P.-A.; investigation, A.S.-C. and F.P.-A.; resources, A.S.-C.; data curation, F.P.-A.; writing—original draft preparation, A.S.-C.; writing—review and editing, F.P.-A.; visualization, A.S.-C. and F.P.-A.; supervision, F.P-A.; project administration, A.S.-C. and F.P.-A. All authors have read and agreed to the published version of the manuscript.

Funding

This research received no external funding.

Institutional Review Board Statement

Not applicable.

Informed Consent Statement

Not applicable.

Data Availability Statement

All data are presented in the paper.

Acknowledgments

The authors would like to acknowledge the support received by the Universidad Politécnica de Madrid.

Conflicts of Interest

The authors declare no conflict of interest.

References

  1. Drozhzhyn, O. Containership traffic optimization on feeder shipping line. Transp. Telecommun. 2016, 17, 314–317. [Google Scholar] [CrossRef]
  2. Paik, J.K.; Lee, D.H.; Noh, S.H.; Park, D.H.; Ringsberg, J.W. Full-scale collapse testing of a steel stiffened plate structure under cyclic axial-compressive loading. Structures 2020, 25, 996–1009. [Google Scholar] [CrossRef]
  3. Yi, M.S.; Lee, D.H.; Lee, H.H.; Paik, J.K. Direct measurements and numerical predictions of welding-induced initial deformations in a full-scale steel stiffened plate structure. Thin-Walled Struct. 2020, 153, 106786. [Google Scholar] [CrossRef]
  4. Wang, Q.; Wang, C.; Wu, J.; Wang, D. Investigations on the torsional failure characteristics of the global hull girder with large deck openings. Ocean Eng. 2020, 128, 107007. [Google Scholar] [CrossRef]
  5. Paik, J.K.; Thayamballi, A.K.; Pedersen, P.T.; Park, Y.I. Ultimate strength of ship hulls under torsion. Ocean Eng. 2001, 28, 1097–1133. [Google Scholar] [CrossRef]
  6. Sun, H.H.; Soares, C.G. An experimental study of ultimate torsional strength of a ship type hull girder with a large deck opening. Mar. Struct. 2003, 16, 51–67. [Google Scholar] [CrossRef]
  7. Senjanovic, I.; Vladimir, N.; Tomic, M. Investigation of torsion, warping and distortion of large container ships. Ocean Syst. Eng. 2011, 1, 73–93. [Google Scholar] [CrossRef]
  8. Iijima, K.; Shigemi, R.; Miyake, R.; Kumano, A. A practical method for torsional strength assessment of container ship structures. Mar. Struct. 2004, 17, 355–384. [Google Scholar] [CrossRef]
  9. Wang, Q.; Wang, D. Ultimate strength envelope of a 10,000 TEU large container ship subjected to combined loads: From compartment model to global hull girder. Ocean Eng. 2020, 213, 107767. [Google Scholar] [CrossRef]
  10. Silva-Campillo, A.; Herreros-Sierra, M.A.; Suárez-Bermejo, J.C. Optimum weight of the torsion box, in terms of fatigue life, of an ultra large container ship. In Trends in the Analysis and Design of Marine Structures; Taylor & Francis Group: Oxfordshire, UK, 2019; pp. 183–187. [Google Scholar] [CrossRef]
  11. Villavicencio, R.; Zhang, S.; Tong, J. A study of cross deck effects on warping stresses in large container ships. In Analysis and Design of Marine Structures V; CRC Press: Boca Raton, FL, USA, 2015; 385p. [Google Scholar] [CrossRef]
  12. Han, F.; Wang, C.; Hu, A. Numerical investigation of wave-induced vibrations and their effect on the fatigue damage of container ships. Ocean Eng. 2017, 142, 245–258. [Google Scholar] [CrossRef]
  13. Barhoumi, M.; Storhaug, G. Assessment of whipping and springing on a large container vessel. Int. J. Nav. Arch. Eng. 2014, 6, 442–458. [Google Scholar] [CrossRef]
  14. Storhaug, G. The measured contribution of whipping and springing on the fatigue and extreme loading of container vessels. Int. J. Nav. Arch. Eng. 2014, 6, 1096–1110. [Google Scholar] [CrossRef]
  15. Kim, B.; Choung, J. A study on prediction of whipping effect of very large container ship considering multiple sea states. Int. J. Nav. Arch. Eng. 2020, 12, 387–398. [Google Scholar] [CrossRef]
  16. Huilong, R.; Kaihong, Z.; Hui, L. Research of Springing and Whipping Influence on Ultra-Large Containerships. J. Shanghai Jiaotong Univ. Sci. 2018, 23, 429–437. [Google Scholar] [CrossRef]
  17. Mao, W.; Ringsberg, J.W.; Rychlik, I. The effect of whipping/springing on fatigue damage and extreme response of ship structures. In Proceedings of the ASME 2010 29th International Conference on Offshore Mechanics and Artic Engineering, Honolulu, HI, USA, 17 February 2010; Volume 20124, pp. 123–131. [Google Scholar] [CrossRef]
  18. Hansen, P.F.; Winterstein, S.R. Fatigue Damage in the Side Shells of Ships. Mar. Struct. 1995, 8, 631–655. [Google Scholar] [CrossRef]
  19. Li, Z.; Ringsberg, J.W.; Storhaug, G. Time-domain fatigue assessment of ship side-shell structures. Int. J. Fatigue 2013, 55, 276–290. [Google Scholar] [CrossRef]
  20. Ringsberg, J.W.; Li, Z.; Tesanovic, A.; Knifsund, C. Linear and nonlinear FE analyses of a container vessel in harsh sea state. Ships Offshore Struct. 2015, 10, 20–30. [Google Scholar] [CrossRef]
  21. Fricke, W.; Lilienfeld-Toal, A.V.; Paetzold, H. Fatigue strength investigations of welded details of stiffened plate structures in steel ships. Int. J. Fatigue 2012, 34, 17–26. [Google Scholar] [CrossRef]
  22. Fricke, W.; Paetzold, H. Full-scale fatigue tests of ship structures to validate the S-N approaches for fatigue strength assessment. Mar. Struct. 2010, 23, 115–130. [Google Scholar] [CrossRef]
  23. Silva-Campillo, A.; Suárez-Bermejo, J.C.; Herreros-Sierra, M.; de Vicente, M. Design methodology in transverse webs of the torsional box structure in an ultra large container ship. Int. J. Nav. Archit. Ocean Eng. 2021, 13, 772–785. [Google Scholar] [CrossRef]
  24. Jagite, G.; Bigot, F.; Malenica, S.; Derbanne, Q.; Le Sourne, H.; Cartraud, P. Dynamic ultimate strength of a ultra-large container ship subjected to realistic loading scenarios. Mar. Struct. 2022, 82, 103197. [Google Scholar] [CrossRef]
  25. Yang, P.; Feng, Q.; Chen, H.; Wen, L. Combined backbone application on numerical simulations and a model experiment of a 20,000 TEU container ship. Ocean Eng. 2021, 223, 108662. [Google Scholar] [CrossRef]
  26. Fricke, W.; Cui, W.; Kierkegaard, H.; Kihl, D.; Koval, M.; Mikkola, T.; Parmentier, G.; Toyosada, M.; Hoon, J.H. Comparative fatigue strength assessment of a structural detail in a containership using various approaches of classification societies. Mar. Struct. 2002, 15, 1–13. [Google Scholar] [CrossRef]
  27. NR467 Steel Ships, Part B Hull and Stability, Chapter 5 Design Loads, Section 2 Hull Girder Loads; Bureau Veritas Rules: Paris, France, 2021; pp. 141–145.
  28. Tenenbaum, J.; Eisenberger, M. Analytic solution for buckling of rectangular isotropic plates with internal points supports. Thin-Walled Struct. 2021, 163, 107640. [Google Scholar] [CrossRef]
  29. Galambos, T.V. Guide to Stability Design Criteria for Metal Structures, 4th ed.; John Wiley & Sons: Hoboken, NJ, USA, 2000. [Google Scholar]
  30. Soadamara, J.M.; Busse, W.; Wehner, K. Data-Based Modelling of Ship propulsion for A 2500 TEU Feeder Container Ship. Int. J. Mar. Eng. Innov. Res. 2020, 5, 198–205. [Google Scholar] [CrossRef]
  31. Kim, M.H.; Kim, S.M.; Kim, Y.N.; Kim, S.G.; Lee, K.E.; Kim, G.R. A comparative study for the fatigue assessment of a ship structure by use of hot-spot stress and structural stress approaches. Ocean Eng. 2009, 36, 1067–1072. [Google Scholar] [CrossRef]
  32. Niemi, E. Stress Determination for Fatigue Analysis of Welded Components; Woodhead Publishing: Sawston, UK, 1995. [Google Scholar]
  33. MARS2000. User’s Guide; Bureau Veritas: Paris, France, 2000.
  34. Im, H.; Vladimir, N.; Malenica, S.; Cho, D. Hydroelastic response of 19,000 TEU class ultra large container ship with novel mobile deckhouse for maximizing cargo capacity. Int. J. Nav. Arch. Ocean Eng. 2017, 9, 339–349. [Google Scholar] [CrossRef]
  35. Tanny, T.T.; Akter, N.; Amin, O.M. Finite element analysis of container ship’s cargo hold using ANSYS and POSEIDON software. AIP Conf. Proc. 2017, 1919, 020012. [Google Scholar] [CrossRef]
  36. Patil, H.; Jeyakarthikeyan, P.V. Mesh convergence study and estimation of discretization error of hub in clutch disc with integration of ANSYS. IOP Conf. Ser. Mater. Sci. Eng. 2018, 402, 012065. [Google Scholar] [CrossRef]
Figure 1. General overview of the 2400 TEU container ship.
Jmse 10 01172 g001
Figure 2. Midship section and torsion box detail (dimensions in mm).
Jmse 10 01172 g002
Figure 3. Schematic detail description: (a) Det3 (b) Det6.
Jmse 10 01172 g003
Figure 4. Meshing pattern Det3.
Jmse 10 01172 g004
Figure 5. Maximum wave pressure values.
Jmse 10 01172 g005
Figure 6. (a) 3D cargo hold torsion model, (b) bending moment distribution (hogging condition).
Jmse 10 01172 g006
Figure 7. Comparative fatigue damage in combinations between side shell longitudinals (L1 to L4) and structural details in the initial condition (y0 = 14.225 m and z0 = 14.82 m).
Jmse 10 01172 g007
Figure 8. Evolution in the fatigue damage for longitudinal No. 1 (L1) of the different structural details. (a) Modification in the second deck height from base line, (b) modification in the longitudinal bulkhead distance from centerline.
Jmse 10 01172 g008
Figure 9. Evolution of normal hull girder stresses along the perimeter of the torsion box.
Jmse 10 01172 g009
Figure 10. Evolution of shear hull girder stresses along the perimeter of the torsion box.
Jmse 10 01172 g010
Figure 11. Evolution of elastic buckling stress, normal (Sig.Buck) and shear (Tau.Buck), along the perimeter of the torsion box for the different values of the width variable.
Jmse 10 01172 g011
Figure 12. Evolution of elastic buckling stress, normal (Sig.Buck) and shear (Tau.Buck), along the perimeter of the torsion box for the different values of the height variable.
Jmse 10 01172 g012
Figure 13. Shear stress distribution induced by (a) vertical shear force (b) horizontal shear force (c) St. Venant torque (d) warping torque, and (e) warping normal stress induced by warping bi-moment.
Jmse 10 01172 g013
Figure 14. Evolution of the shear and normal stresses along control points that define torsion box perimeter in the initial condition (y = 14.225 m and z = 14.82 m).
Jmse 10 01172 g014
Figure 15. Shear stresses variation induced by vertical shear forces and St. Venant torque values of the torsion box height.
Jmse 10 01172 g015
Figure 16. Shear stresses variation induced by vertical and horizontal shear force, St. Venant and warping torque and warping normal stresses induced by a warping bi-moment for the different values of the torsion box width.
Jmse 10 01172 g016
Table 1. Main particulars.
DescriptionUnitValue
Scantling length (L)m196.4
Breadth moulded (B)m32.2
Block coefficient (CB)-0.68
Max. Service speed (V)kn15
Depth at strength deck (D)m19
Scantling draught (T)m12.8
Transverse structure spacing (S)m3.15
Table 2. Midship cross-sectional properties.
DescriptionUnitValue
Gross area of cross sectionm23.92
Effective area of cross sectionm23.89
Moment of inertia (y axis)m4225.72
Moment of inertia (z axis)m4657.51
Neutral axis (above base line)m8.78
Section modulus at deckm322.1
Section modulus at bottomm325.69
Table 3. Material properties.
DescriptionYield Strength (MPa)Young Modulus (GPa)Poisson’s Ratio
AH323152060.3
AH36355
Table 4. Torsion box height values (dimensions in m).
z 1 ( + ) = 14.67 z 1 ( ) = 14.97
z 2 ( + ) = 14.52 z 2 ( ) = 15.11
z 3 ( + ) = 14.37 z 3 ( ) = 15.26
Table 5. Torsion box width values (dimensions in m).
y 1 ( + ) = 14.08 y 1 ( ) = 14.37
y 2 ( + ) = 13.94 y 2 ( ) = 14.51
y 3 ( + ) = 13.79 y 3 ( ) = 14.65
Table 6. Mesh convergence process.
σ V M   ( MPa ) Change (%)NodesElements
176.4-820398
299.723.3727041342
3121.317.8170653586
4122.10.6592466049
Table 7. Modification (in %) in normal and shear hull girder stresses for different values of the torsion box height.
Valueσ1τ1
+1%1.652.31
+2%3.334.52
+3%56.64
−1%0.790.73
−2%3.335.43
−3%4.816.5
Table 8. Modification (increment or reduction in %) in buckling normal stress value between different values of height and width torsion box.
Valuezy
+1%1.812.67
+2%3.655.25
+3%5.517.78
−1%1.950.33
−2%3.646.22
−3%5.267.46
Publisher’s Note: MDPI stays neutral with regard to jurisdictional claims in published maps and institutional affiliations.

