
Radiation Hazard from Natural Radioactivity in the Marine Sediment of Jeddah Coast, Red Sea, Saudi Arabia


Abstract
:1. Introduction
2. Materials and Methods
2.1. The Study Area
2.2. Sampling and Sample Treatment
2.3. Sediment Granulometry and Mineralogy
2.4. Radiometric Analysis
2.5. Calculation of the Radiation Hazard Indices
2.6. Statistical Analyses
3. Results and Discussion
3.1. Textural Attributes
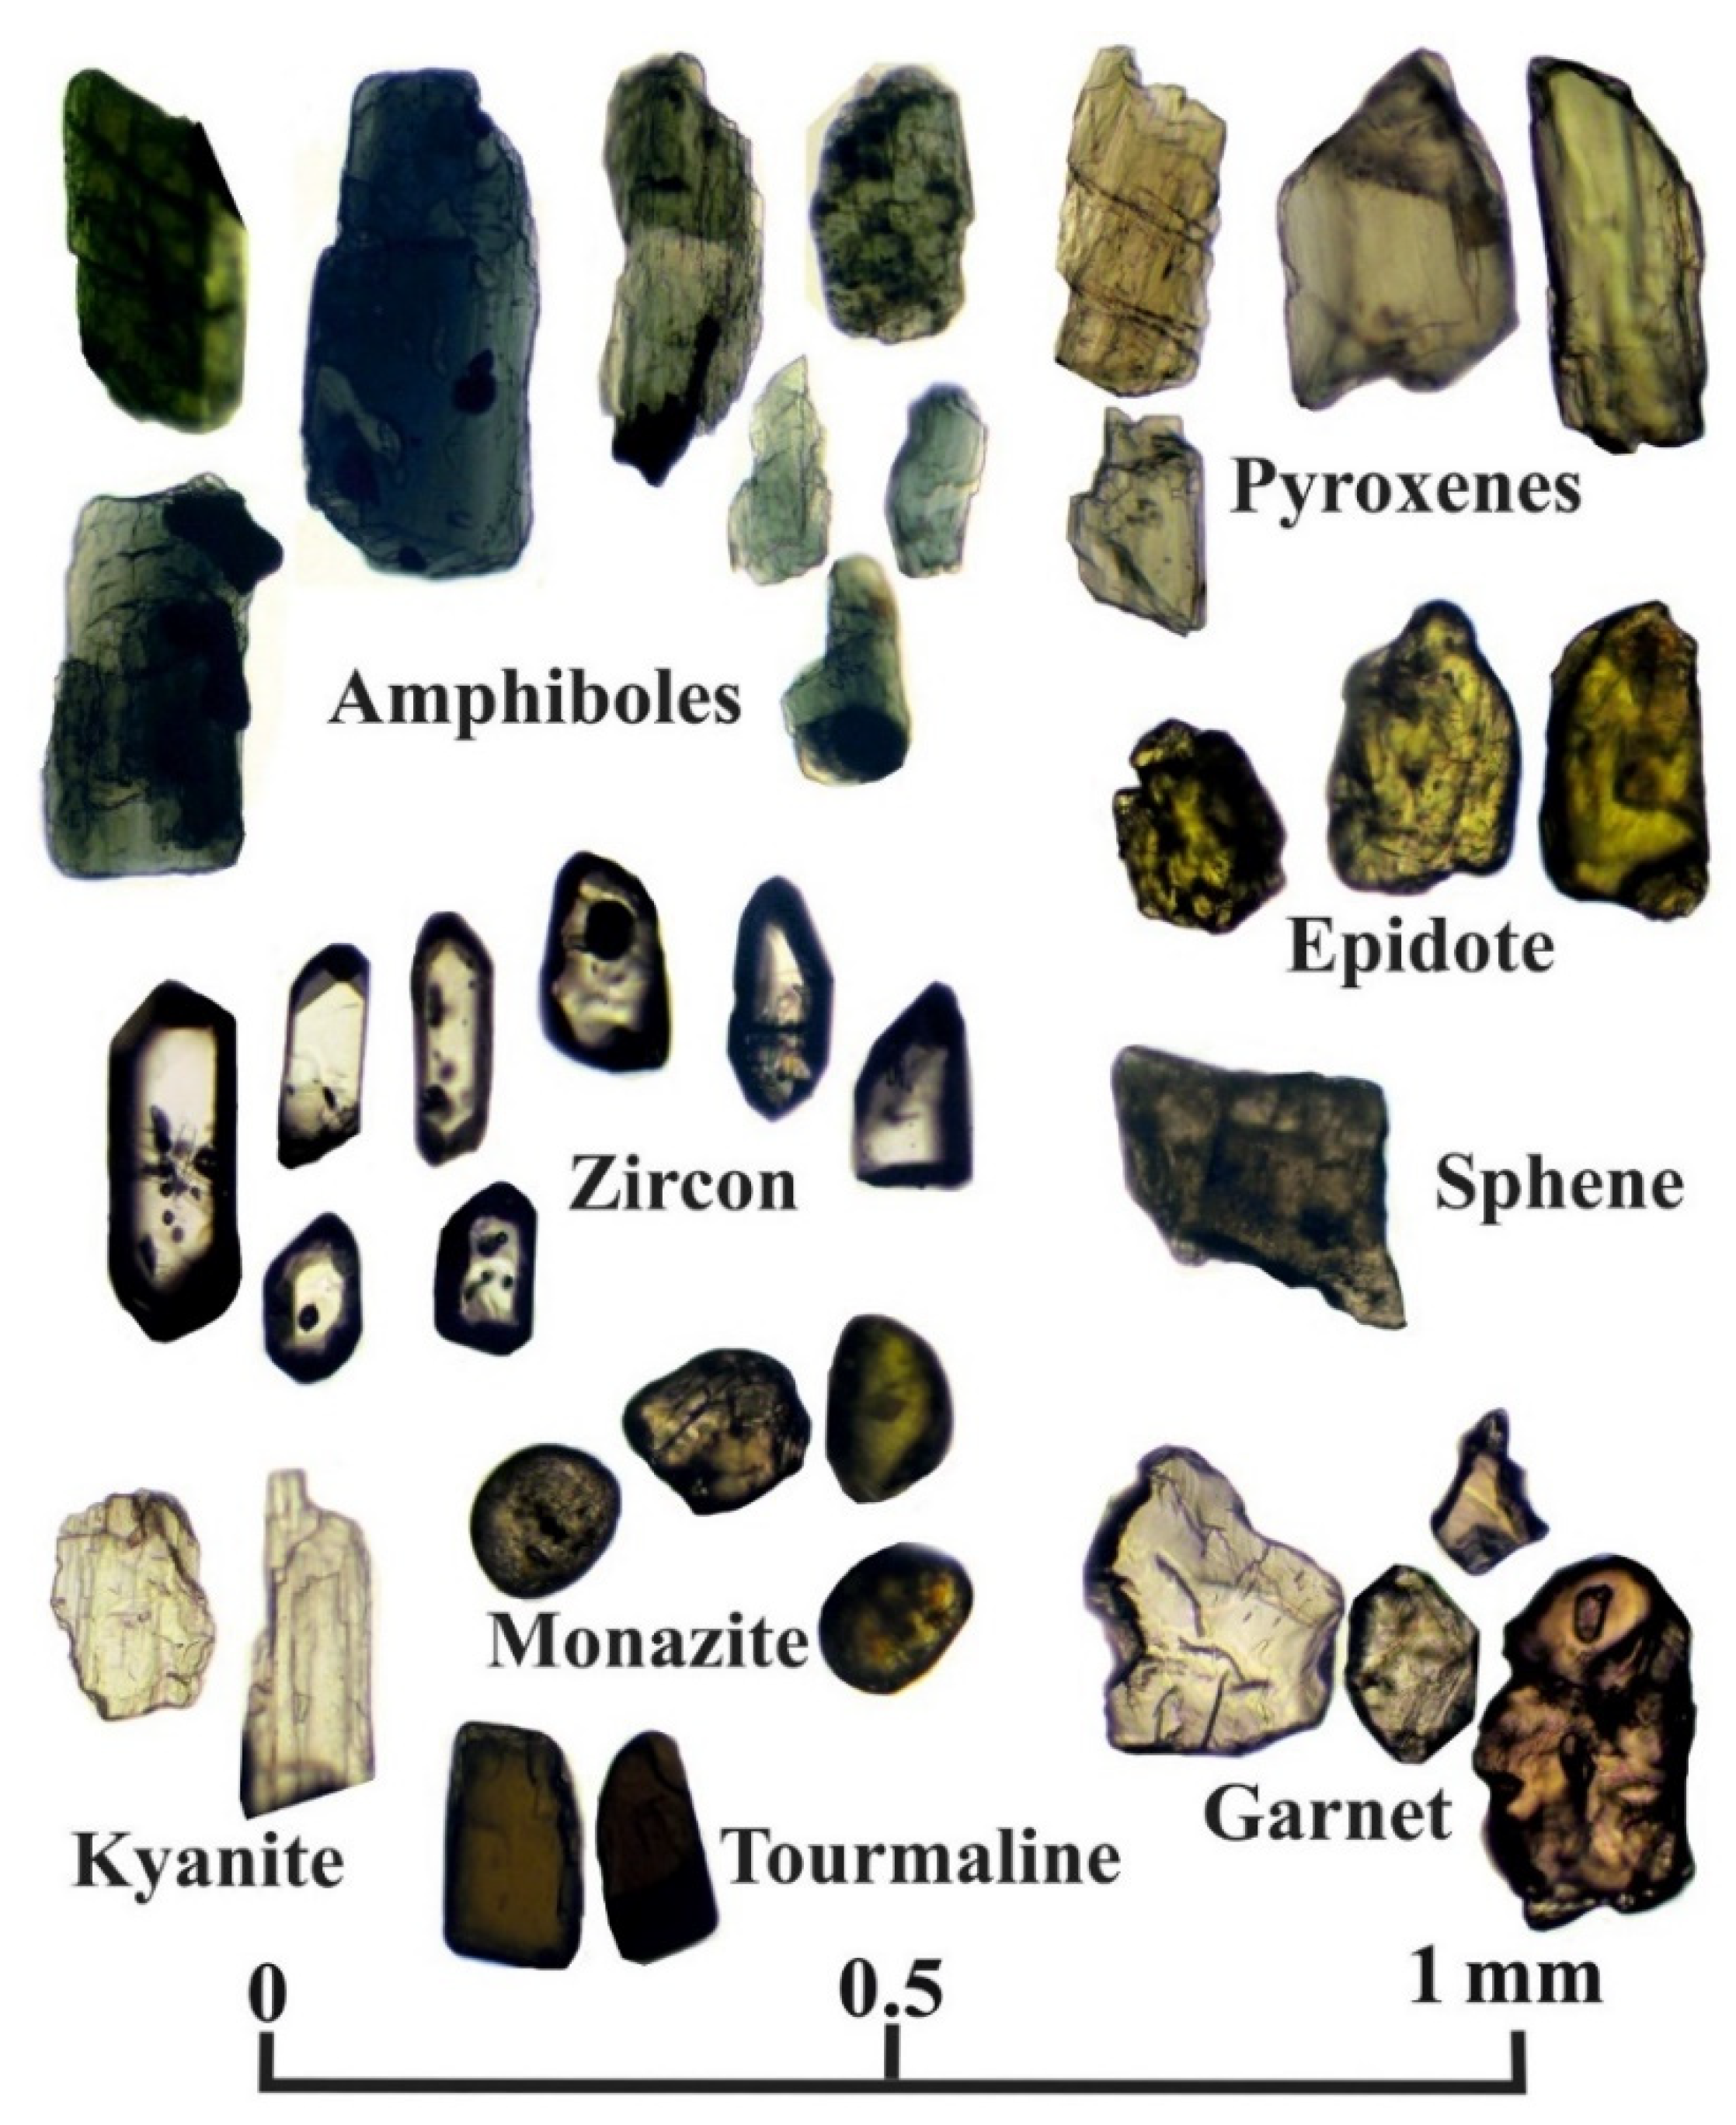
3.2. Mineralogy
3.3. Activity Concentrations

| Location | Samples | 238U Series * | 232Th Series ** | 40K | Reference |
|---|---|---|---|---|---|
| Saudi Arabia | |||||
| Jeddah | Marine Sediment (N = 18) | 19.50 | 9.38 | 403.31 | Present study |
| Arabian Gulf | Marine Sediment (N = 9) | 3.50 * | 5.90 ** | 113.50 | [48] |
| Arabian Gulf | Marine Sediment (N = 12) | 26.40 * | 16.30 | 351.00 | [47] |
| Arabian Gulf | Beach sand (N = 12) | 22.70 * | 14.80 | 392.00 | [47] |
| Farasan Island | Marine Sediment (N = 8) | 35.46 | 1.84 | 34.34 | [46] |
| Gulf of Aqaba (Addurrah beach) | Marine Sediment (N = 19) | 16.97 | 22.48 | 641.08 | [49] |
| Worldwide | |||||
| World average | 32 | 45 | 412 | [6] | |
| Egypt (Gulf of Suez) | Shore Sediment (N = 36) | 13.79 | 14.55 | 128.67 | [23] |
| Egypt (Red Sea) | Marine Sediment (N = 84) | 23.80 * | 19.60 | 374.90 | [84] |
| Egypt (Mediterranean Sea) | Beach sand (N = 12) | 8.80 * | 30.80 | 106.9 | [69] |
| Oman | Marine Sediment (N = 11) | 20.49 | 2.26 | 44.83 | [81] |
| Iran (Caspian Sea) | Marine Sediment (N = 8) | 34.40 * | 11.40 | 310.00 | [9] |
| Serbia (Boka Kotorska Bay) | Marine Sediment (N = 12) | 37.00 | 35.00 | 580.00 | [82] |
| Cyprus (East coast region) | Marine Sediment (N = 15) | 23.00 * | 19.00 | 628.10 | [4] |
| China (Beibu Gulf) | Marine Sediment (N = 50) | 25.90 | 37.6 | 263 | [85] |
| India (Tamilnadu) | Beach sand (N = 101) | 47.04 | 26.63 | 372.49 | [86] |
| Bangladesh (Bay of Bengal) | Offshore Sediment (N= 6) | 31.20 | 51.90 | 686.40 | [32] |
| Turkey (Kocaeli- black sea) | Beach sand (N = 20) | 8.85 | 8.93 | 219.41 | [80] |
| Ghana (Tema Harbour) | Marine Sediment (N = 21) | 34.00 | 30.00 | 320.00 | [31] |
| Nigeria (Akwa Ibom) | Beach Sediment (N = 15) | 23.00 | 36.00 | 145.00 | [2] |
3.4. Multivariate Statistical Analyses
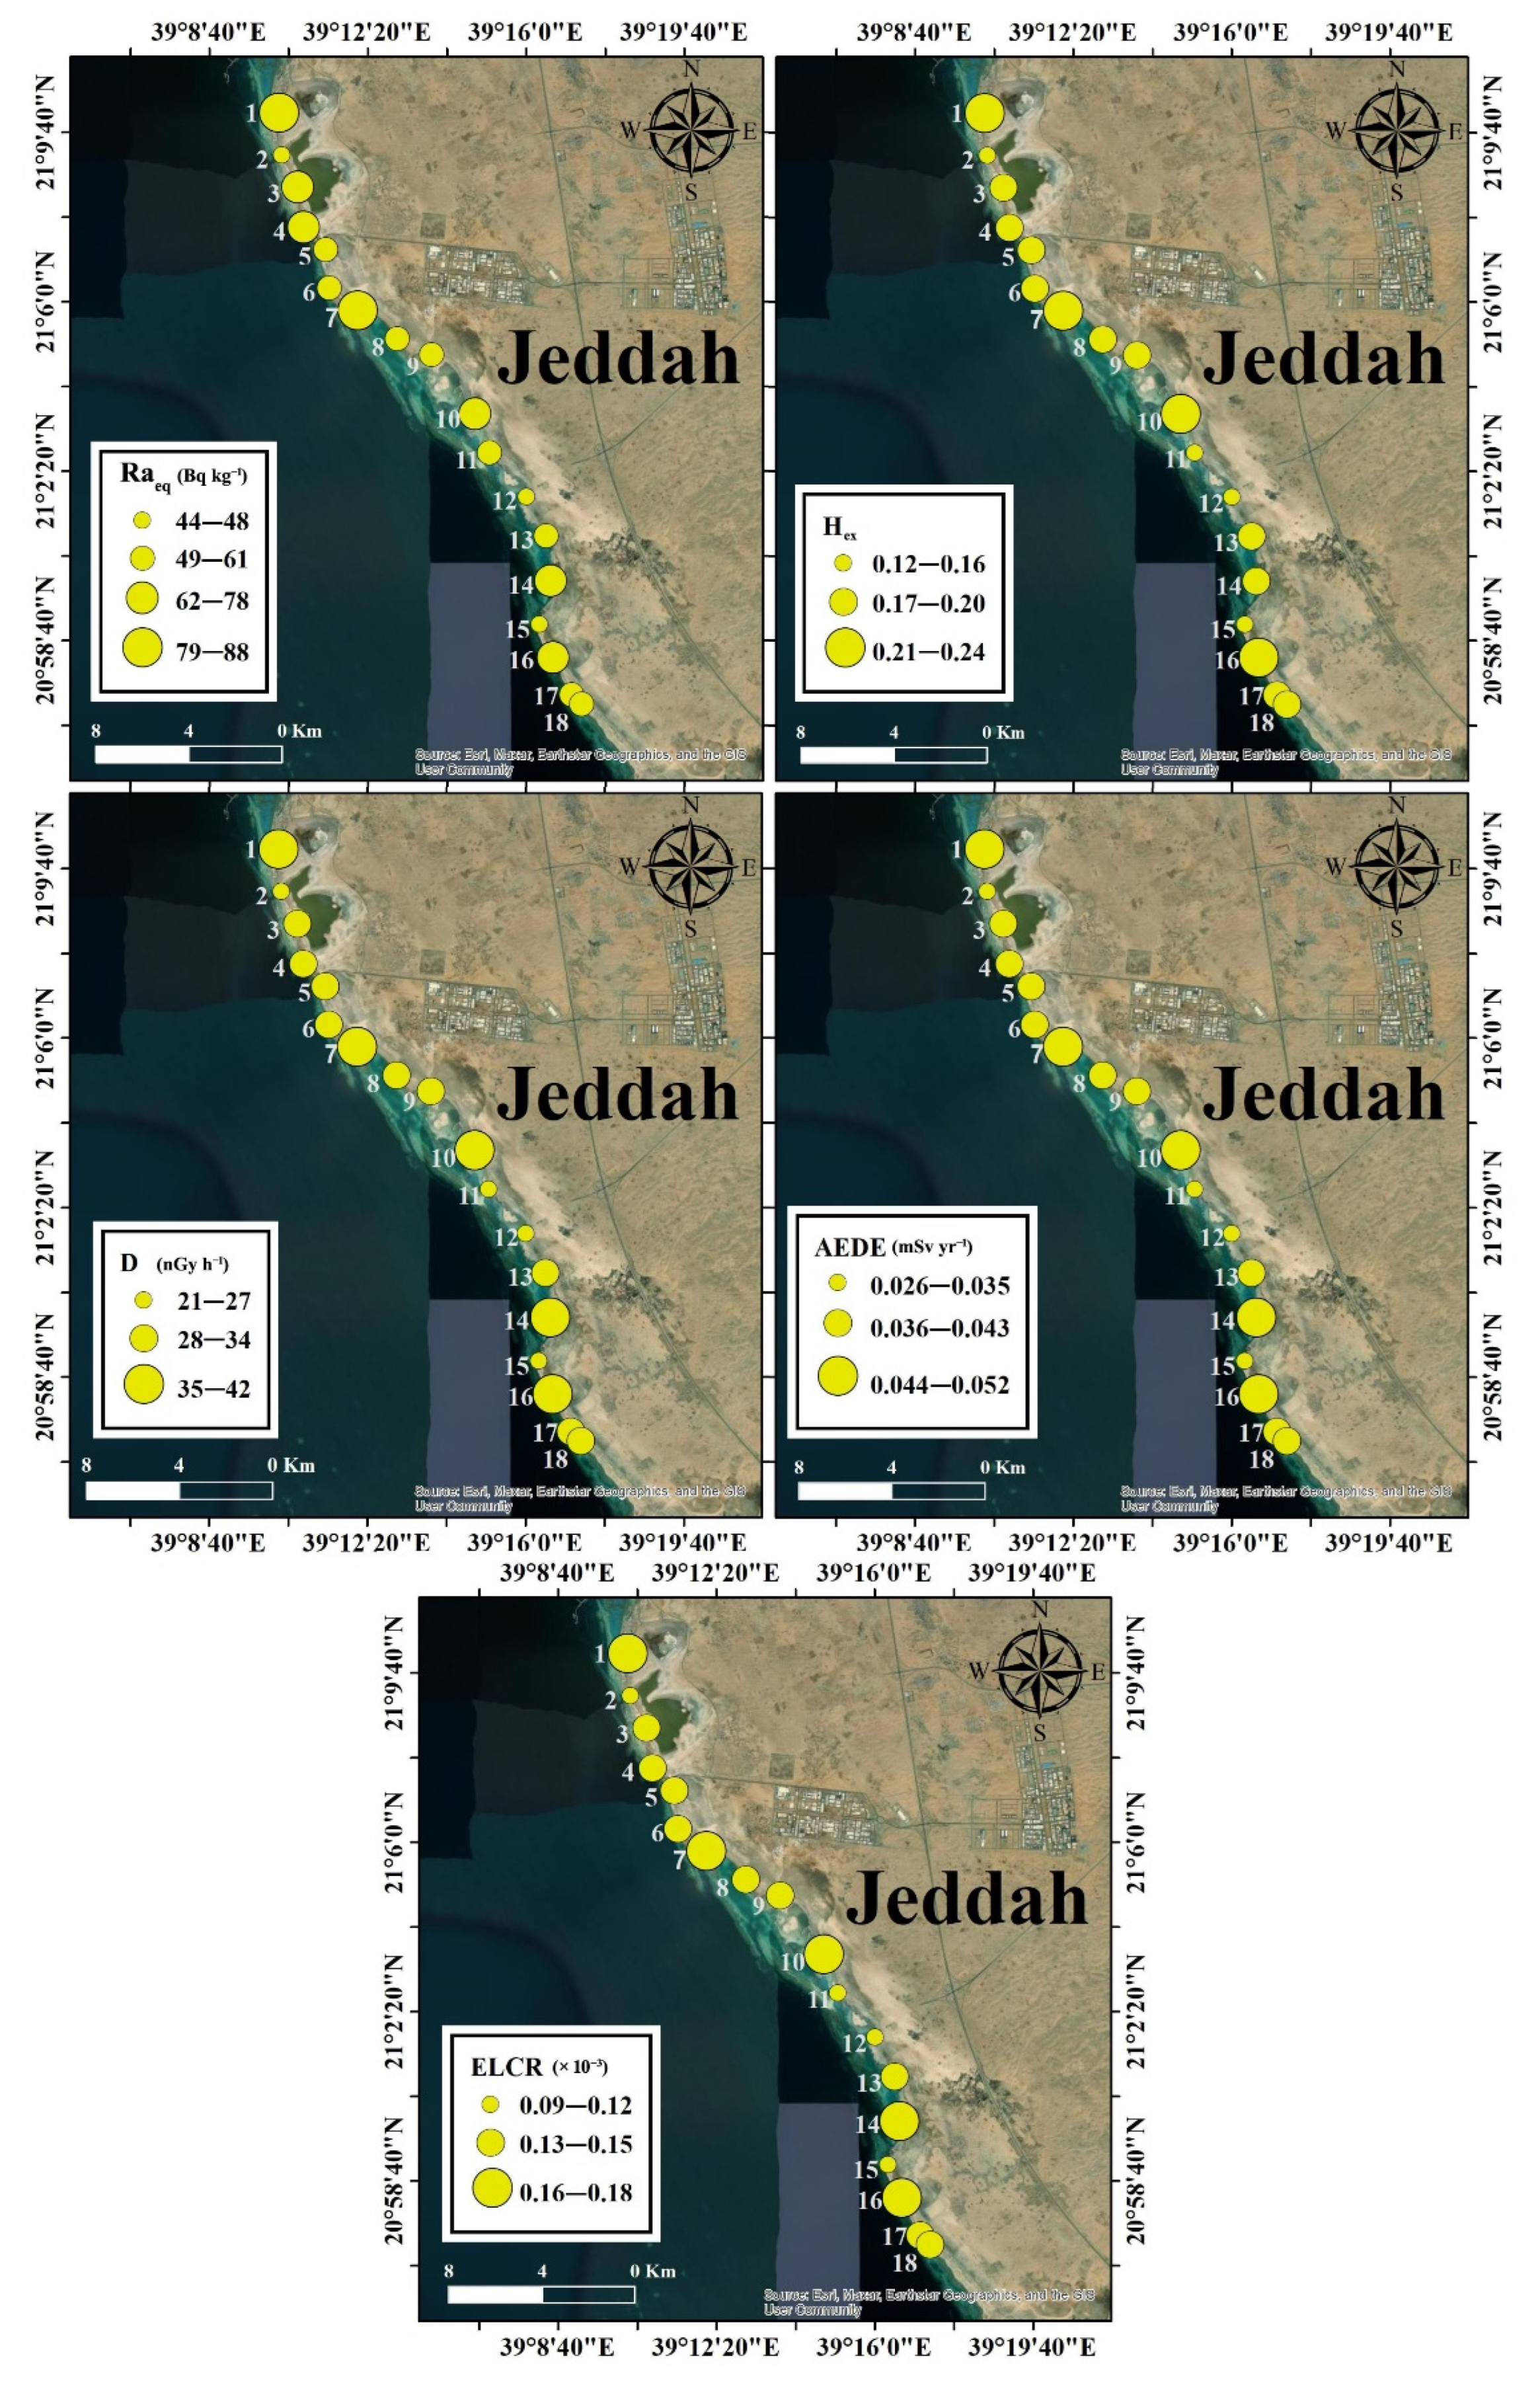
3.5. Radiation Hazard
3.5.1. Radiation Hazard for Humans
3.5.2. Radiation Hazard for Non-Human Biota
4. Conclusions
Supplementary Materials
Author Contributions
Funding
Institutional Review Board Statement
Informed Consent Statement
Data Availability Statement
Acknowledgments
Conflicts of Interest
References
- UNSCEAR. Sources and Effects of Ionizing Radiation, Report to the General Assembly with Scientific Annexes; United Nation: New York, NY, USA, 2000; Available online: https://www.unscear.org/unscear/en/publications/2000_1.html (accessed on 3 July 2022).
- Akpan, A.E.; Ebong, E.D.; Ekwok, S.E.; Eyo, J.O. Assessment of radionuclide distribution and associated radiological hazards for soils and beach sediments of Akwa Ibom Coastline, southern Nigeria. Arab. J. Geosci. 2020, 13, 753. [Google Scholar] [CrossRef]
- Gad, A.; Saleh, A.; Khalifa, M. Assessment of natural radionuclides and related occupational risk in agricultural soil, southeastern Nile Delta, Egypt. Arab. J. Geosci. 2019, 12, 188. [Google Scholar] [CrossRef]
- Abbasi, A.; Zakaly, H.M.H.; Mirekhtiary, F. Baseline levels of natural radionuclides concentration in sediments East coastline of North Cyprus. Mar. Pollut. Bull. 2020, 161, 111793. [Google Scholar] [CrossRef] [PubMed]
- Abed, N.S.; Monsif, M.A.; Zakaly, H.M.H.; Awad, H.A.; Hessien, M.M.; Yap, C.K. Assessing the Radiological Risks Associated with High Natural Radioactivity of Microgranitic Rocks: A Case Study in a Northeastern Desert of Egypt. Int. J. Environ. Res. Public Health 2022, 19, 473. [Google Scholar] [CrossRef] [PubMed]
- UNSCEAR. Sources and Effects of Ionizing Radiation, Report to the General Assembly with Scientific Annexes; United Nation: New York, NY, USA, 2008; Available online: https://www.unscear.org/unscear/en/publications/2008_1.html (accessed on 3 July 2022).
- Suliman, I.I.; Alsafi, K. Radiological Risk to Human and Non-Human Biota Due to Radioactivity in Coastal Sand andMarine Sediments, Gulf of Oman. Life 2021, 11, 549. [Google Scholar] [CrossRef] [PubMed]
- Osman, R.; Dawood, Y.H.; Melegy, A.; El-Bady, M.S.; Saleh, A.; Gad, A. Distributions and Risk Assessment of the Natural Radionuclides in the Soil of Shoubra El Kheima, South Nile Delta, Egypt. Atmosphere 2022, 13, 98. [Google Scholar] [CrossRef]
- Abbasi, A.; Algethami, M.; Bawazeer, O.; Zakaly, H.M.H. Distribution of natural and anthropogenic radionuclides and associated radiation indices in the Southwestern coastline of Caspian Sea. Mar. Pollut. Bull. 2022, 178, 113593. [Google Scholar] [CrossRef]
- Baghdady, A.; Awad, S.; Gad, A. Assessment of metal contamination and natural radiation hazards in different soil types near iron ore mines, Bahariya Oasis, Egypt. Arab. J. Geosci. 2018, 11, 506. [Google Scholar] [CrossRef]
- Yehia, M.; Baghdady, A.; Howari, F.M.; Awad, S.; Gad, A. Natural radioactivity and groundwater quality assessment in the northern area of the Western Desert of Egypt. J. Hydrol.-Reg. Stud. 2017, 12, 331–344. [Google Scholar] [CrossRef]
- Adikaram, M.; Pitawala, A.; Ishiga, H.; Jayawardana, D.; Eichler, C.M. An Ecological Risk Assessment of Sediments in a Developing Environment—Batticaloa Lagoon, Sri Lanka. J. Mar. Sci. Eng. 2021, 9, 73. [Google Scholar] [CrossRef]
- Biswas, K.P.; Hossain, S.; Deb, N.; Bhuian, A.K.M.S.I.; Gonçalves, S.C.; Hossain, S.; Hossen, M.B. Assessment of the Levels of Pollution and of Their Risks by Radioactivity and Trace Metals on Marine Edible Fish and Crustaceans at the Bay of Bengal (Chattogram, Bangladesh). Environments 2021, 8, 13. [Google Scholar] [CrossRef]
- Farhat, H.I. Impact of Drain Effluent on Surficial Sediments in the Mediterranean Coastal Wetland: Sedimentological Characteristics and Metal Pollution Status at Lake Manzala, Egypt. J. Ocean Univ. China 2019, 18, 834–848. [Google Scholar] [CrossRef]
- Bantan, R.A.; Khawfany, A.A.; Basaham, A.S.; Gheith, A.M. Geochemical Characterization of Al-Lith Coastal Sediments, Red Sea, Saudi Arabia. Arab. J. Sci. Eng. 2020, 45, 291–306. [Google Scholar] [CrossRef]
- Solomon, K. Sources of radioactivity in the ocean environment: From low level waste to nuclear powered submarines. J. Hazard. Mater. 1988, 18, 255–262. [Google Scholar] [CrossRef]
- IAEA (International Atomic Energy Agency). Sources of Radioactivity in the Marine Environment and Their Relative Contributions to Overall Dose Assessment from Marine Radioactivity; MARDOS: Vienna, Austria, 1995. [Google Scholar]
- Uddin, S.; Fowler, S.W.; Behbehani, M.; Al-Ghadban, A.N.; Swarzenski, P.W.; Al-Awadhi, N. A review of radioactivity in the Gulf region. Mar. Pollut. Bull. 2020, 159, 111481. [Google Scholar] [CrossRef]
- Lin, M.; Qiao, J.; Hou, X.; Dellwig, O.; Steier, P.; Hain, K.; Golser, R.; Zhu, L. 70-Year Anthropogenic Uranium Imprints of Nuclear Activities in Baltic Sea Sediments. Environ. Sci. Technol. 2021, 55, 8918–8927. [Google Scholar] [CrossRef] [PubMed]
- Al-Qasmi, H.; Law, G.T.; Fifield, L.K.; Howe, J.A.; Brand, T.; Cowie, G.L.; Law, K.A.; Livens, F.R. Deposition of artificial radionuclides in sediments of Loch Etive, Scotland. J. Environ. Radioact. 2018, 187, 45–52. [Google Scholar] [CrossRef]
- Pappa, K.F.; Tsabaris, C.; Ioannidou, A.; Patiris, L.D.; Kaberi, H. Radioactivity and metal concentrations in marine sediments associated with mining activities in Ierissos Gulf, North Aegean Sea, Greece. Appl. Radiat. Isot. 2016, 116, 22–33. [Google Scholar] [CrossRef]
- Aközcan, S.; Külahcı, F.; Mercan, Y. A suggestion to radiological hazards characterization of 226Ra, 232Th, 40K and 137Cs: Spatial distribution modelling. J. Hazard. Mater. 2018, 353, 476–489. [Google Scholar] [CrossRef]
- Diab, H.M.; Ramadan, A.; Monged, M.H.E.; Shahin, M. Environmental assessment of radionuclides levels and some heavy metals pollution along Gulf of Suez, Egypt. Environ. Sci. Pollut. Res. 2019, 26, 12346–12358. [Google Scholar] [CrossRef]
- Kotilainen, A.T.; Kotilainen, M.M.; Vartti, V.P.; Hutri, K.L.; Virtasalo, J.J. Chernobyl still with us: 137Caesium activity contents in seabed sediments from the Gulf of Bothnia, northern Baltic Sea. Mar. Pollut. Bull. 2021, 172, 112924. [Google Scholar] [CrossRef] [PubMed]
- Olszewski, G.; Andersson, P.; Lindahl, P.; Eriksson, M. On the distribution and inventories of radionuclides in dated sediments around the Swedish coast. J. Environ. Radioact. 2018, 186, 142–151. [Google Scholar] [CrossRef] [PubMed]
- Tsabaris, C.; Patiris, D.L.; Fillis-Tsirakis, E.; Kapsimalis, V.; Pilakouta, M.; Pappa, F.K.; Vlastou, R. Vertical distribution of 137Cs activity concentration in marine sediments at Amvrakikos Gulf, western of Greece. J. Environ. Radioact. 2015, 144, 1–8. [Google Scholar] [CrossRef]
- Heldal, H.E.; Helvik, L.; Appleby, P.; Haanes, H.; Volynkin, A.; Jensen, H.; Lepland, A. Geochronology of sediment cores from the Vefsnfjord, Norway. Mar. Pollut. Bull. 2021, 170, 112683. [Google Scholar] [CrossRef] [PubMed]
- Baltas, H.; Sirin, M.; Dalgic, G.; Cevik, U. An overview of the ecological half-life of the 137 Cs radioisotope and a determination of radioactivity levels in sediment samples after Chernobyl in the Eastern Black Sea, Turkey. J. Mar. Syst. 2018, 177, 21–27. [Google Scholar] [CrossRef]
- Ikenoue, T.; Takehara, M.; Morooka, K.; Kurihara, E.; Takami, R.; Ishii, N.; Kudo, N.; Utsunomiya, S. Occurrence of highly radioactive microparticles in the seafloor sediment from the pacific coast 35 km northeast of the Fukushima Daiichi nuclear power plant. Chemosphere 2021, 267, 128907. [Google Scholar] [CrossRef] [PubMed]
- Miura, H.; Ishimaru, T.; Ito, Y.; Kurihara, Y.; Otosaka, S.; Sakaguchi, A.; Misumi, K.; Tsumune, D.; Kubo, A.; Higaki, S.; et al. First isolation and analysis of caesium-bearing microparticles from marine samples in the Pacific coastal area near Fukushima Prefecture. Sci. Rep. 2021, 11, 5664. [Google Scholar] [CrossRef]
- Botwe, B.O.; Schirone, A.; Delbono, I.; Barsanti, M.; Delfanti, R.; Kelderman, B.; Nyarko, E.; Lens, P.L.N. Radioactivity concentrations and their radiological significance in sediments of the Tema Harbour (Greater Accra, Ghana). J. Radiat. Res. Appl. Sci. 2017, 10, 63–71. [Google Scholar] [CrossRef]
- Bhuiyan, M.A.; Siddique, M.A.; Zafar, M.; Kamal, A.M. Spatial distribution of radioisotope concentrations in the offshore water and sediment of the Bay of Bengal (Indian Ocean), Bangladesh. Isot. Environ. Health Stud. 2014, 50, 134–141. [Google Scholar] [CrossRef]
- Tsabaris, C.; Androulakaki, E.G.; Ballas, D.; Alexakis, S.; Perivoliotis, L.; Iona, A. Radioactivity Monitoring at North Aegean Sea Integrating In-Situ Sensor in an Ocean Observing Platform. J. Mar. Sci. Eng. 2021, 9, 77. [Google Scholar] [CrossRef]
- Caridi, F.; Paladini, G.; Venuti, V.; Crupi, V.; Procopio, S.; Belvedere, A.; D’Agostino, M.; Faggio, G.; Grillo, R.; Marguccio, S.; et al. Radioactivity, Metals Pollution and Mineralogy Assessment of a Beach Stretch from the Ionian Coast of Calabria (Southern Italy). Int. J. Environ. Res. Public Health 2021, 18, 12147. [Google Scholar] [CrossRef] [PubMed]
- IAEA (International Atomic Energy Agency). Nuclear Power Reactors in the World; Arab Atomic Energy Agency (AAEA): Vienna, Austria, 2021. [Google Scholar]
- Damoom, M.M.; Hashim, S.; Aljohani, M.S.; Saleh, M.A.; Xoubi, N. Potential areas for nuclear power plants siting in Saudi Arabia: GIS-based multi-criteria decision making analysis. Prog. Nucl. Energy 2019, 110, 110–120. [Google Scholar] [CrossRef]
- Ramadan, R.S.; Dawood, Y.H.; Yehia, M.M.; Gad, A. Environmental and health impact of current uranium mining activities in southwestern Sinai, Egypt. Environ. Earth Sci. 2022, 81, 213. [Google Scholar] [CrossRef]
- WNA (World Nuclear Association). Nuclear Power in Saudi Arabia; World Nuclear Association: London, UK, 2017; Available online: http://www.worldnuclear.org/information-library/country-profiles/countries-o-s/saudi-arabia.aspx. (accessed on 8 January 2022).
- Ahmad, A.; Ramana, M.V. Too costly to matter: Economics of nuclear power for Saudi Arabia. Energy 2014, 69, 682–694. [Google Scholar] [CrossRef]
- Al Osaimi, N.M.; Qoradi, M.D. Candidate site selection for nuclear power plants in Saudi Arabia using GIS. Arab. J. Geosci. 2020, 13, 1218. [Google Scholar] [CrossRef]
- Al-Mur, B.A.; Quicksall, A.N.; Kaste, J.M. Determination of sedimentation, diffusion, and mixing rates in coastal sediments of the eastern Red Sea via natural and anthropogenic fallout radionuclides. Mar. Pollut. Bull. 2017, 122, 456–463. [Google Scholar] [CrossRef] [PubMed]
- Gomaa, M.N.; Mulla, D.J.; Galzki, J.C.; Sheikho, K.M.; Alhazmi, N.M.; Mohamed, H.E.; Hannachi, I.; Abouwarda, A.M.; Hassan, E.A.; Carmichael, W.W. Red Sea MODIS Estimates of Chlorophyll A and Phytoplankton Biomass Risks to Saudi Arabian Coastal Desalination Plants. J. Mar. Sci. Eng. 2021, 9, 11. [Google Scholar] [CrossRef]
- El Zokm, G.M.; Al-Mur, B.A.; Okbah, M.A. Ecological risk indices for heavy metal pollution assessment in marine sediments of Jeddah Coast in the Red Sea. Int. J. Environ. Anal. Chem. 2020, 1–22. [Google Scholar] [CrossRef]
- Ghandour, I.M.; Basaham, S.; Al-Washmi, A.; Masuda, H. Natural and anthropogenic controls on sediment composition of an arid coastal environment: Sharm Obhur, Red Sea, Saudi Arabia. Environ. Monit. Assess. 2014, 186, 1465–1484. [Google Scholar] [CrossRef]
- Jamoussi, B.; Chakroun, R.; Al-Mur, B. Assessment of Total Petroleum Hydrocarbon Contamination of the Red Sea with Endemic Fish from Jeddah (Saudi Arabia) as Bioindicator of Aquatic Environmental Pollution. Water 2022, 14, 1706. [Google Scholar] [CrossRef]
- Al-Zahrany, A.A.; Farouk, M.A.; Al-Yousef, A.A. Distribution of naturally occurring radioactivity and 137Cs in the marine sediment of Farasan Island, Southern Red Sea, Saudi Arabia. Radiat. Prot. Dosim. 2012, 152, 135–139. [Google Scholar] [CrossRef] [PubMed]
- Alshahri, F. Radioactivity of 226Ra, 232Th, 40K and 137Cs in beach sand and sediment near to desalination plant in eastern Saudi Arabia: Assessment of radiological impacts. J. King Saud Univ. Sci. 2017, 29, 174–181. [Google Scholar] [CrossRef]
- Alzahrani, J.S.; Almuqrin, A.; Alghamdi, H.; Albarzan, B.; Khandaker, M.U.; Sayyed, M.I. Radiological monitoring in some coastal regions of the Saudi Arabian Gulf close to the Iranian Bushehr nuclear plant. Mar. Pollut. Bull. 2022, 175, 113146. [Google Scholar] [CrossRef]
- Al-Trabulsy, H.; Khater, A.; Habbani, F. Radioactivity levels and radiological hazard indices at the Saudi coastline of the Gulf of Aqaba. Radiat. Phys. Chem. 2011, 80, 343–348. [Google Scholar] [CrossRef]
- Rifaat, A.E.; Basaham, A.S.; El-Mamoney, M.H.M.; El-Sayed, A. Mineralogical and chemical composition of dry atmospheric deposition on Jeddah city eastern coast of the Red Sea. JKAU Mar. Sci. 2007, 19, 167–188. [Google Scholar] [CrossRef]
- Khawfany, A.A.; Aref, M.A.; Taj, R.J. Human-induced changes in sedimentary facies and depositional environments, Sarum area, Red Sea coast, Saudi Arabia. Environ. Earth Sci. 2017, 76, 61. [Google Scholar] [CrossRef]
- Gheith, A.M.; Al Washmi, H.A.; Nabhan, A.I. Mineralogy and provenance of Ash Shuqayq coastal sediments, Southern Red Sea, Kingdom of Saudi Arabia. JKAU Mar. Sci. 2005, 16, 25–44. [Google Scholar] [CrossRef]
- Luczak, C.; Janquin, M.A.; Kupka, A. Simple standard procedure for the routine determination of organic matter in marine sediment. Hydrobiologia 1997, 345, 87–94. [Google Scholar] [CrossRef]
- Gross, M.G. Carbon determination. In Procedures in Sedimentary Petrology; Carver, R.E., Ed.; Wiley-Interscience: New York, NY, USA; pp. 573–596. 1971. [Google Scholar]
- Lewis, D.W.; McConchie, D. Analytical Sedimentology; Springer: Amsterdam, The Netherlands, 1994. [Google Scholar]
- Galehouse, J.S. Point counting. In Procedures in Sedimentary Petrology; Carver, R.E., Ed.; Wiley-Interscience: New York, NY, USA, 1971; pp. 385–407. [Google Scholar]
- Mange, M.A.; Maurer, H.W. Heavy Minerals in Colour; Chapman Hall: London, UK, 1992; Volume 147. [Google Scholar]
- IAEA (International Atomic Energy Agency). Intercomparison Runs Reference Manuals; AQCS: Vienna, Austria, 1995. [Google Scholar]
- Beretka, J.; Mathew, P.J. Natural radioactivity of Australian building materials, industrial wastes and by-products. Health Phys. 1985, 48, 87–95. [Google Scholar] [CrossRef]
- ECRP (European Commission Radiation Protection). Radiological Protection Principles Concerning the Natural Radioactivity of Building Materials; European Comissision: Brussels, Belgium, 1999. [Google Scholar]
- Taskin, H.; Karavus, M.; Ay, P.; Topuzoglu, A.; Hindiroglu, S.; Karahan, G. Radionuclide concentrations in soil and lifetime cancer risk due to the gamma radioactivity in Kirklareli, Turkey. J. Environ. Radioact. 2009, 100, 49–53. [Google Scholar] [CrossRef]
- ICRP (International Commission on Radiological Protection). Recommendations of the International Commission on Radiological Protection. In ICRP Publication 60; Pergamon Press Ann ICRP: Oxford, UK, 1990. [Google Scholar]
- Brown, J.E.; Alfonso, B.; Avila, R.; Beresford, N.A.; Copplestone, D.; Pröhl, G.; Ulanovsky, A. The ERICA tool. J. Environ. Radioact. 2008, 99, 1371–1383. [Google Scholar] [CrossRef]
- Larsson, C.M. An overview of the ERICA Integrated Approach to the assessment and management of environmental risks from ionising contaminants. Journal of Environmental Radioactivity. J. Environ. Radioact. 2008, 99, 1364–1370. [Google Scholar] [CrossRef] [PubMed]
- Basaham, A.S. Mineralogical and chemical composition of the mud fraction from the surface sediments of Sharm Al-Kharrar, a Red Sea coastal lagoon. Oceanologia 2008, 50, 557–575. [Google Scholar]
- El Sabrouti, M.A. Texture and mineralogy of the surface sediments of Sharm Obhur, west Red Sea coast of Saudi Arabia. Mar. Geol. 1983, 53, 103–116. [Google Scholar] [CrossRef]
- Basaham, A.S.; El-Shater, A. Textural and Mineralogical Characteristics of the Surficial Sediments of Sharm Obhur, Red Sea Coast of Saudi Arabia. JKAU Mar. Sci. 1994, 5, 51–57l. [Google Scholar] [CrossRef]
- Dawood, Y.H.; Abd El-Naby, H.H. Mineral chemistry of monazite from the black sand deposits, northern Sinai, Egypt: A provenance perspective. Miner. Mag. 2007, 71, 389–406. [Google Scholar] [CrossRef]
- Awad, M.; El Mezayen, A.M.; El Azab, A.; Alfi, S.M.; Ali, H.H.; Hanfi, M.Y. Radioactive risk assessment of beach sand along the coastline of Mediterranean Sea at El-Arish area, North Sinai, Egypt. Mar. Pollut. Bull. 2022, 177, 113494. [Google Scholar] [CrossRef]
- Papadopoulos, A.; Koroneos, A.; Christofides, G.; Papadopoulou, L.; Tzifas, I.; Stoulos, S. Assessment of gamma radiation exposure of beach sands in highly touristic areas associated with plutonic rocks of the Atticocycladic zone (Greece). J. Environ. Radioact. 2016, 162, 235–243. [Google Scholar] [CrossRef]
- Shuaibu, H.K.; Khandaker, M.U.; Alrefae, T.; Bradley, D.A. Assessment of natural radioactivity and gamma-ray dose in monazite rich black Sand Beach of Penang Island, Malaysia. Mar. Pollut. Bull. 2017, 119, 423–428. [Google Scholar] [CrossRef]
- Bharath, K.M.; Natesan, U.; Chandrasekaran, S.; Srinivasalu, S. Determination of natural radionuclides and radioactive minerals in urban coastal zone of South India using Geospatial approach. J. Radioanal. Nucl. Chem. 2022, 331, 2005–2018. [Google Scholar] [CrossRef]
- Milner, H.B.; Ward, A.M.; Highan, F. Sedimentary Petrography, Principle and Application, 4th ed.; The Macmillan: New York, NY, USA, 1962; Volume 11. [Google Scholar]
- Sagga, A.M.S. The use of the textural parameters of sand in studying the characteristics and depositional processes of coastal sediments on Saudi Arabian beaches. Mar. Geol. 1992, 104, 179–186. [Google Scholar] [CrossRef]
- Papadopoulos, A.; Christofides, G.; Koroneos, A.; Papastefanou, C.; Stoulos, S. Distribution of 238U, 232Th and 40K in plutonic rocks of Greece. Chem. Erde Geochem. 2014, 74, 749–764. [Google Scholar] [CrossRef]
- Drzymała, T.; Łukaszek-Chmielewska, A.; Lewicka, S.; Stec, J.; Piotrowska, B.; Isajenko, K.; Lipiński, P. Assessment of the Natural Radioactivity of Polish and Foreign Granites Used for Road and Lapidary Constructions in Poland. Materials 2020, 13, 2824. [Google Scholar] [CrossRef] [PubMed]
- Ekpe, E.E.; Ben, U.C.; Ekwok, S.E.; Ebong, E.D.; Akpan, A.E.; Eldosouky, A.M.; Abdelrahman, K.; Gómez-Ortiz, D. Assessment of Natural Radionuclide Distribution Pattern and Radiological Risk from Rocks in Precambrian Oban Massif, Southeastern Nigeria. Minerals 2022, 12, 312. [Google Scholar] [CrossRef]
- Caridi, F.; Messina, M.; Faggio, G.; Santangelo, S.; Messina, G.; Belmusto, G. Radioactivity, radiological risk and metal pollution assessment in marine sediments from Calabrian selected areas, southern Italy. Eur. Phys. J. Plus 2018, 133, 65. [Google Scholar] [CrossRef]
- Khandaker, M.U.; Asaduzzaman, K.; Sulaiman, A.F.B.; Bradley, D.A.; Isinkaye, M.O. Elevated concentrations of naturally occurring radionuclides in heavy mineral-rich beach sands of Langkawi Island, Malaysia. Mar. Pollut. Bull. 2018, 127, 654–663. [Google Scholar] [CrossRef]
- Korkulu, Z.; Özkan, N. Determination of natural radioactivity levels of beach sand samples in the black sea coast of Kocaeli (Turkey). Radiat. Phys. Chem. 2013, 88, 27–31. [Google Scholar] [CrossRef]
- Al Shaaibi, M.; Ali, J.; Duraman, N.; Tsikouras, B.; Masri, Z. Assessment of radioactivity concentration in intertidal sediments from coastal provinces in Oman and estimation of hazard and radiation indices. Mar. Pollut. Bull. 2021, 168, 112442. [Google Scholar] [CrossRef]
- Radomirović, M.; Stanković, S.; Mandić, M.; Jović, M.; Mandić, L.J.; Dragović, S.; Onjia, A. Spatial distribution, radiological risk assessment and positive matrix factorization of gamma-emitting radionuclides in the sediment of the Boka Kotorska Bay. Mar. Pollut. Bull. 2021, 169, 112491. [Google Scholar] [CrossRef]
- Papadopoulos, A. 226Ra/238U and 228Th/228Ra disequilibrium as weathering indices in beach sand sediments associated with granitoids from Cyclades. Greece. Appl. Geochem. 2019, 100, 223–233. [Google Scholar] [CrossRef]
- Zakaly, H.M.H.; Uosif, M.A.M.; Issa, S.A.M.; Tekin, H.O.; Madkour, H.; Tammam, M.; El-Taher, A.; Alharshan, G.A.; Mostafa, M.Y.A. An extended assessment of natural radioactivity in the sediments of the mid-region of the Egyptian Red Sea coast. Mar. Pollut. Bull. 2021, 171, 112658. [Google Scholar] [CrossRef] [PubMed]
- Lin, W.; Feng, Y.; Yu, K.; Lan, W.; Wang, Y.; Mo, Z.; Ning, Q.; Feng, L.; He, X.; Huang, Y. Long-lived radionuclides in marine sediments from the Beibu Gulf, South China Sea: Spatial distribution, controlling factors, and proxy for transport pathway. Mar. Geol. 2020, 424, 106157. [Google Scholar] [CrossRef]
- Thangam, V.; Rajalakshmi, A.; Chandrasekaran, A.; Arun, A.; Viswanathan, S.; Venkatraman, B.; Bera, S. Determination of natural radioactivity in beach sands collected along the coastal area of Tamilnadu, India using gamma ray spectrometry. J. Radioanal. Nucl. Chem. 2022, 331, 1207–1223. [Google Scholar] [CrossRef]
- Evans, J.D. Straight Forward Statistics for the Behavioral Sciences; Brook/Cole Publishing: Pacific Grove, CA, USA, 1996. [Google Scholar]
- Papadopoulos, A.; Koroneos, A.; Christofides, G.; Stoulos, S. Natural radioactivity distribution and gamma radiation exposure of beach sands close to Kavala pluton, Greece. Open Geosci. 2015, 1, 407–422. [Google Scholar] [CrossRef]


| Sample No. | CaCO3 % | OM % | Sand% (2.00–0.063 mm) | Mud% (<0.063 mm) | Heavy Minerals% | 238U (Bq kg−1) | 232Th (Bq kg−1) | 40K (Bq kg−1) |
|---|---|---|---|---|---|---|---|---|
| 1 | 44.00 | 0.20 | 50.60 | 5.20 | 4.96 | 39.72 | 12.64 | 387.38 |
| 2 | 21.40 | 0.00 | 78.60 | 0.00 | 3.94 | 12.43 | 4.14 | 387.45 |
| 3 | 7.60 | 0.00 | 77.80 | 14.60 | 6.44 | 24.35 | 8.28 | 433.87 |
| 4 | 18.00 | 0.00 | 75.80 | 6.20 | 10.08 | 24.86 | 12.13 | 356.39 |
| 5 | 38.80 | 0.20 | 56.80 | 4.20 | 8.12 | 12.47 | 8.26 | 472.61 |
| 6 | 25.00 | 0.00 | 75.00 | 0.00 | 5.30 | 12.22 | 8.34 | 470.02 |
| 7 | 17.00 | 0.00 | 74.00 | 9.00 | 15.16 | 37.29 | 16.17 | 315.07 |
| 8 | 6.80 | 0.00 | 92.80 | 0.40 | 6.06 | 12.92 | 8.54 | 454.53 |
| 9 | 19.20 | 0.20 | 75.80 | 4.80 | 6.32 | 12.43 | 8.22 | 449.36 |
| 10 | 62.80 | 1.20 | 23.00 | 13.00 | 2.44 | 37.77 | 8.82 | 338.31 |
| 11 | 54.60 | 0.40 | 39.40 | 5.60 | 4.38 | 24.74 | 8.55 | 250.51 |
| 12 | 56.80 | 0.40 | 38.40 | 4.40 | 4.02 | 12.35 | 8.17 | 253.09 |
| 13 | 50.20 | 0.00 | 48.60 | 1.20 | 8.90 | 12.47 | 16.17 | 317.65 |
| 14 | 15.40 | 0.40 | 84.20 | 0.00 | 10.90 | 12.41 | 12.24 | 557.83 |
| 15 | 50.40 | 0.20 | 49.00 | 0.40 | 4.06 | 12.38 | 4.04 | 374.47 |
| 16 | 42.40 | 0.00 | 57.20 | 0.40 | 0.48 | 24.95 | 8.05 | 537.17 |
| 17 | 47.80 | 0.00 | 52.00 | 0.20 | 0.56 | 12.93 | 8.08 | 444.20 |
| 18 | 48.20 | 0.00 | 51.20 | 0.60 | 2.54 | 12.28 | 8.05 | 459.69 |
| Min. | 6.80 | 0.00 | 23.00 | 0.00 | 0.48 | 12.22 | 4.04 | 250.51 |
| Max. | 62.80 | 1.20 | 92.80 | 14.60 | 15.16 | 39.72 | 16.17 | 557.83 |
| Mean | 34.80 | 0.18 | 61.12 | 3.90 | 5.81 | 19.50 | 9.38 | 403.31 |
| CaCO3 | OM | Sand | Mud | HI | 238U | 232Th | 40K | |
|---|---|---|---|---|---|---|---|---|
| CaCO3 | 1 | 0.488 | −0.969 | −0.052 | −0.544 | 0.101 | −0.123 | −0.425 |
| OM | 1 | −0.597 | 0.437 | −0.172 | 0.357 | −0.073 | −0.278 | |
| Sand | 1 | −0.198 | 0.477 | −0.268 | 0.069 | 0.510 | ||
| Mud | 1 | 0.227 | 0.678 | 0.217 | −0.381 | |||
| HI | 1 | 0.154 | 0.696 | −0.114 | ||||
| 238U | 1 | 0.419 | −0.312 | |||||
| 232Th | 1 | −0.186 | ||||||
| 40K | 1 | |||||||
| Weak | Moderate | Strong | Very Strong | |||||
| Sample No. | Raeq | Hex | D | AEDE | ELCR × 10–3 |
|---|---|---|---|---|---|
| 1 | 87.620 | 0.237 | 42.137 | 0.052 | 0.181 |
| 2 | 48.176 | 0.130 | 24.397 | 0.030 | 0.105 |
| 3 | 69.589 | 0.188 | 34.339 | 0.042 | 0.147 |
| 4 | 69.639 | 0.188 | 33.670 | 0.041 | 0.145 |
| 5 | 60.678 | 0.164 | 30.460 | 0.037 | 0.131 |
| 6 | 60.335 | 0.163 | 30.282 | 0.037 | 0.130 |
| 7 | 84.667 | 0.229 | 40.130 | 0.049 | 0.172 |
| 8 | 60.132 | 0.162 | 30.081 | 0.037 | 0.129 |
| 9 | 58.778 | 0.159 | 29.443 | 0.036 | 0.126 |
| 10 | 76.434 | 0.206 | 36.885 | 0.045 | 0.158 |
| 11 | 56.253 | 0.152 | 27.039 | 0.033 | 0.116 |
| 12 | 43.526 | 0.118 | 21.196 | 0.026 | 0.091 |
| 13 | 60.058 | 0.162 | 28.776 | 0.035 | 0.124 |
| 14 | 72.869 | 0.197 | 36.389 | 0.045 | 0.156 |
| 15 | 46.991 | 0.127 | 23.775 | 0.029 | 0.102 |
| 16 | 77.830 | 0.210 | 38.792 | 0.048 | 0.167 |
| 17 | 58.688 | 0.158 | 29.377 | 0.036 | 0.126 |
| 18 | 59.182 | 0.160 | 29.702 | 0.036 | 0.127 |
| Min | 43.526 | 0.118 | 21.196 | 0.026 | 0.091 |
| Max | 87.620 | 0.237 | 42.137 | 0.052 | 0.181 |
| Mean | 63.969 | 0.173 | 31.493 | 0.039 | 0.135 |
| Sample No. | Benthic Fish | Crustacean | Macroalgae | Mollusca–Bivalve | Pelagic Fish | Phytoplankton | Polychaete Worm | Zooplankton |
|---|---|---|---|---|---|---|---|---|
| 1 | 2.84 × 10⁻³ | 3.14 × 10⁻³ | 2.85 × 10⁻² | 1.45 × 10⁻² | 1.72 × 10⁻³ | 1.08 × 10⁻¹ | 3.70 × 10⁻¹ | 1.23 × 10⁻³ |
| 2 | 8.90 × 10⁻⁴ | 9.90 × 10⁻⁴ | 8.92 × 10⁻³ | 4.55 × 10⁻³ | 5.40 × 10⁻⁴ | 3.43 × 10⁻² | 1.16 × 10⁻¹ | 3.90 × 10⁻⁴ |
| 3 | 1.75 × 10⁻³ | 1.93 × 10⁻³ | 1.75 × 10⁻² | 8.91 × 10⁻³ | 1.05 × 10⁻³ | 6.77 × 10⁻² | 2.27 × 10⁻¹ | 7.60 × 10⁻⁴ |
| 4 | 1.85 × 10⁻³ | 2.04 × 10⁻³ | 1.79 × 10⁻² | 9.17 × 10⁻³ | 1.08 × 10⁻³ | 7.73 × 10⁻² | 2.32 × 10⁻¹ | 8.60 × 10⁻⁴ |
| 5 | 9.60 × 10⁻⁴ | 1.06 × 10⁻³ | 9.05 × 10⁻³ | 4.64 × 10⁻³ | 5.40 × 10⁻⁴ | 4.37 × 10⁻² | 1.16 × 10⁻¹ | 4.80 × 10⁻⁴ |
| 6 | 9.50 × 10⁻⁴ | 1.04 × 10⁻³ | 8.88 × 10⁻³ | 4.55 × 10⁻³ | 5.30 × 10⁻⁴ | 4.33 × 10⁻² | 1.14 × 10⁻¹ | 4.70 × 10⁻⁴ |
| 7 | 2.74 × 10⁻³ | 3.02 × 10⁻³ | 2.69 × 10⁻² | 1.37 × 10⁻² | 1.61 × 10⁻³ | 1.11 × 10⁻¹ | 3.48 × 10⁻¹ | 1.25 × 10⁻³ |
| 8 | 1.00 × 10⁻³ | 1.10 × 10⁻³ | 9.38 × 10⁻³ | 4.81 × 10⁻³ | 5.60 × 10⁻⁴ | 4.52 × 10⁻² | 1.21 × 10⁻¹ | 5.00 × 10⁻⁴ |
| 9 | 9.60 × 10⁻⁴ | 1.06 × 10⁻³ | 9.02 × 10⁻³ | 4.62 × 10⁻³ | 5.40 × 10⁻⁴ | 4.35 × 10⁻² | 1.16 × 10⁻¹ | 4.80 × 10⁻⁴ |
| 10 | 2.65 × 10⁻³ | 2.93 × 10⁻³ | 2.70 × 10⁻² | 1.37 × 10⁻² | 1.63 × 10⁻³ | 9.60 × 10⁻² | 3.52 × 10⁻¹ | 1.10 × 10⁻³ |
| 11 | 1.78 × 10⁻³ | 1.97 × 10⁻³ | 1.78 × 10⁻² | 9.06 × 10⁻³ | 1.07 × 10⁻³ | 6.91 × 10⁻² | 2.31 × 10⁻¹ | 7.80 × 10⁻⁴ |
| 12 | 9.50 × 10⁻⁴ | 1.05 × 10⁻³ | 8.96 × 10⁻³ | 4.60 × 10⁻³ | 5.40 × 10⁻⁴ | 4.32 × 10⁻² | 1.15 × 10⁻¹ | 4.70 × 10⁻⁴ |
| 13 | 1.09 × 10⁻³ | 1.20 × 10⁻³ | 9.25 × 10⁻³ | 4.79 × 10⁻³ | 5.40 × 10⁻⁴ | 6.13 × 10⁻² | 1.17 × 10⁻¹ | 6.50 × 10⁻⁴ |
| 14 | 1.02 × 10⁻³ | 1.13 × 10⁻³ | 9.11 × 10⁻³ | 4.70 × 10⁻³ | 5.40 × 10⁻⁴ | 5.24 × 10⁻² | 1.16 × 10⁻¹ | 5.60 × 10⁻⁴ |
| 15 | 8.90 × 10⁻⁴ | 9.80 × 10⁻⁴ | 8.88 × 10⁻³ | 4.53 × 10⁻³ | 5.40 × 10⁻⁴ | 3.40 × 10⁻² | 1.15 × 10⁻¹ | 3.90 × 10⁻⁴ |
| 16 | 1.79 × 10⁻³ | 1.97 × 10⁻³ | 1.79 × 10⁻² | 9.12 × 10⁻³ | 1.08 × 10⁻³ | 6.84 × 10⁻² | 2.32 × 10⁻¹ | 7.70 × 10⁻⁴ |
| 17 | 9.90 × 10⁻⁴ | 1.09 × 10⁻³ | 9.37 × 10⁻³ | 4.80 × 10⁻³ | 5.60 × 10⁻⁴ | 4.42 × 10⁻² | 1.21 × 10⁻¹ | 4.90 × 10⁻⁴ |
| 18 | 9.50 × 10⁻⁴ | 1.04 × 10⁻³ | 8.91 × 10⁻³ | 4.57 × 10⁻³ | 5.30 × 10⁻⁴ | 4.28 × 10⁻² | 1.15 × 10⁻¹ | 4.70 × 10⁻⁴ |
| Min | 8.90 × 10⁻⁴ | 9.80 × 10⁻⁴ | 8.88 × 10⁻³ | 4.53 × 10⁻³ | 5.30 × 10⁻⁴ | 3.40 × 10⁻² | 1.14 × 10⁻¹ | 3.90 × 10⁻⁴ |
| Max | 2.84 × 10⁻³ | 3.14 × 10⁻³ | 2.85 × 10⁻² | 1.45 × 10⁻² | 1.72 × 10⁻³ | 1.11 × 10⁻¹ | 3.70 × 10⁻¹ | 1.25 × 10⁻³ |
| Mean | 1.45 × 10⁻³ | 1.60 × 10⁻³ | 1.41 × 10⁻² | 7.19 × 10⁻³ | 8.40 × 10⁻⁴ | 6.03 × 10⁻² | 1.82 × 10⁻¹ | 6.70 × 10⁻⁴ |
| Background Dose Rates | 0.58 | 0.59 | 0.87 | 2 | 0.42 | 0.38 | 1.6 | 0.94 |
Publisher’s Note: MDPI stays neutral with regard to jurisdictional claims in published maps and institutional affiliations. |
© 2022 by the authors. Licensee MDPI, Basel, Switzerland. This article is an open access article distributed under the terms and conditions of the Creative Commons Attribution (CC BY) license (https://creativecommons.org/licenses/by/4.0/).
Share and Cite
Al-Mur, B.A.; Gad, A. Radiation Hazard from Natural Radioactivity in the Marine Sediment of Jeddah Coast, Red Sea, Saudi Arabia. J. Mar. Sci. Eng. 2022, 10, 1145. https://doi.org/10.3390/jmse10081145
Al-Mur BA, Gad A. Radiation Hazard from Natural Radioactivity in the Marine Sediment of Jeddah Coast, Red Sea, Saudi Arabia. Journal of Marine Science and Engineering. 2022; 10(8):1145. https://doi.org/10.3390/jmse10081145
Chicago/Turabian StyleAl-Mur, Bandar A., and Ahmed Gad. 2022. "Radiation Hazard from Natural Radioactivity in the Marine Sediment of Jeddah Coast, Red Sea, Saudi Arabia" Journal of Marine Science and Engineering 10, no. 8: 1145. https://doi.org/10.3390/jmse10081145