Article

Estimation of Fracture Toughness of API 2W Gr.50 Steel in Ductile to Brittle Transition Behavior Using Master Curve Approach

1
Department of Naval Architecture and Ocean Engineering, Pusan National University, Busan 46241, Korea
2
Energy Component & Material R&DB Group, Korea Institute of Industrial Technology, Busan 46938, Korea
*
Author to whom correspondence should be addressed.
J. Mar. Sci. Eng. 2022, 10(8), 1066; https://doi.org/10.3390/jmse10081066
Submission received: 4 July 2022 / Revised: 25 July 2022 / Accepted: 27 July 2022 / Published: 3 August 2022
(This article belongs to the Special Issue Fatigue and Fracture Mechanics of Marine Structures)

Abstract

:
Welding is used as the main joining method in various industries, including the shipbuilding industry. In the case of welded structures, structural integrity assessment is essential to ensure the safety of the structure because many defects inevitably exist during the manufacturing process. The value of reliable fracture toughness is required for structural integrity assessment. It is obtained by the fracture toughness test, but the fracture toughness test requires a lot of time and effort. Therefore, many studies have been conducted on efficient methods to evaluate fracture toughness. Among the various studies that estimate fracture toughness, some have been conducted using the Charpy impact test, which is relatively simple compared to the fracture toughness test. This study conducted a series of experimental investigations on API 2W Gr.50 steel applied with different welding conditions. Based on the Charpy impact test results, the fracture behavior was well estimated in the ductile to brittle transition region according to the temperature. However, there was a difference in the accuracy of predicting fracture behavior depending on the welding process. Therefore, additional consideration reflecting the various welding conditions is required to ensure the safety of welded structures.

1. Introduction

As the size of ships and offshore structures gradually increases, careful verification of safety and integrity is required. In particular, as the structure becomes larger, the possibility of defects such as cracks increases during manufacturing. In the case of welded structures, this tendency increases and inevitably includes welded defects. Under this background, many studies have been conducted on the evaluation of the fracture toughness and structural integrity of members with cracks [1]. Fracture toughness is essential to assess the integrity of structures with cracks. It can be obtained by performing the fracture toughness tests using the standard test specimen [2,3,4,5]. However, the fracture toughness test requires a lot of time and cost, such as inserting fatigue pre-crack and manufacturing test specimens. Therefore, an efficient method to evaluate the fracture toughness is required, and there is a method using Charpy impact energy [6]. The Charpy impact test requires only a small impact specimen and an impact test machine. Using Charpy impact energy, BS 7910 provides a procedure for estimating fracture toughness values [7]. However, the procedure is very conservative because it is not based on the fracture mechanics theory but only on the correlation between the impact energy and the fracture toughness obtained through the experiment. For this reason, BS 7910, modified in 2019, seeks to achieve minimal conservatism through the yield strength of the material and Charpy upper shelf energy [8].
Pisarski and Bezensek reviewed the Charpy-fracture toughness correlations in Annex J of BS 7910: 2013 together with the 2019 revision of the standard [9]. As the results indicated, the use of an improved equation to determine T 0 , which applies the yield strength and Charpy upper shelf energy, provides a better prediction of the fracture toughness transition curve than the existing equation in BS 7910. In addition, it was found that T 27 J can be estimated from the Charpy impact data obtained at a single temperature in the absence of a Charpy transition curve. Lee et al. investigated the validity of the master curve approach considering the groove shapes and sample location of the impact test specimen. It was confirmed that the tendency of fracture toughness varies depending on the specimen sample location. In addition, these studies required additional analysis according to the welding conditions, such as heat input and welding method [6,10].
As an extension of previous studies, the target of this study is to evaluate the fracture toughness in the ductile–brittle transition region of API 2W Gr.50 steel using the master curve approach and to validate this approach. Therefore, a series of experimental investigations were conducted on API 2W Gr.50 steel by considering heat input and welding methods. To this end, this study compared the derived master curve and the crack tip opening displacement (CTOD) test results. From the results, it can provide a lower limit of fracture values when it is not available.

2. Fracture Toughness Estimation

2.1. Correlation between Charpy Impact Energy and Fracture Toughness

Over the years, many studies have been conducted to develop the empirical correlations between Charpy impact energy and fracture toughness [11,12,13]. Barsom and Rolfe developed a relationship between fracture toughness and Charpy impact energy [14]. This relationship describes the correlation between K Ic and Charpy impact energy in the transition range for several steels of different compositions and strengths. Wallin reanalyzed the existing relationship between Charpy impact energy and fracture toughness [15]. It was found that the relationship is influenced by the material yield strength and Charpy upper shelf energy. In addition, he suggested a revised equation for reference temperature, T 0 , and it is included in the proposal for revision BS 7910. Lucon et al. established a method to estimate T 27 J from incomplete transition curve or only single temperature data. When the Charpy transition curve is not available, and the results are given only at a single temperature, this method can be useful [16].
Although many empirical correlations are established and have simplicity and efficiency, there are significant differences between the Charpy impact test and fracture toughness test [17]. The Charpy impact test measures the energy of both fracture initiation and propagation for high-strain rate conditions in a short blunt notch as shown in Figure 1 [18]. On the other hand, fracture toughness test uses the standard fracture specimen having a deep sharp crack as shown in Figure 2 and measures the fracture resistance at cleavage instability under quasi-static conditions [4]. Moreover, the correlations are not based on the fracture mechanics but only established by the experimental results for some specific materials. As a result, the correlations do not explain the difference in the material contents and production process. Thus, the correlations are established very conservatively.

2.2. Master Curve Approach

BS 7910, which uses Charpy transition curve, proposes a method for estimating the fracture toughness in ductile to brittle transition behavior. If the specifications of the Charpy impact test specimen suggested in ASTM E23 are satisfied, the fracture toughness dependent on temperature is expressed as Equation (1) [8].
K mat = 20 + { 11 + 77 exp [ 0.019 ( T     T 0 ) ] } ( 25 B ) 0.25 [ ln ( 1 1     P f ) ] 0.25
In Equation (1), the B is the thickness of the specimen and the P f value of 0.05 (5%), which means the probability of K mat being less than the estimated value is recommended. In this equation, T 0 means the reference temperature with the fracture toughness of 100   MPa m for a 25 mm thickness specimen. It can be calculated by Equation (2) using the material yield strength, σ Y , and Charpy upper shelf energy, CV US [9]. Charpy upper shelf energy is the maximum amount of impact energy in the ductile fracture mode.
T 0 = T 27 J 87 + σ Y 12 + 1000 CV US
For the purpose of validating the master curve approach, fracture toughness in terms of J-integral or CTOD can be converted to the equivalent stress intensity factor, K J . At this time, the critical value of J is limited by the K J ( lim ) . This K J ( lim ) means the maximum fracture toughness at which fracture takes place under small-scale yielding conditions and is defined as a function of specimen geometry and mechanical property. Equation (3) represents the maximum fracture toughness where b 0 is the specimen ligament (W − a 0 ) [8].
K J ( lim ) = [ Eb 0 σ Y ( 1   v 2 ) ] 0.5

3. Experimental Details

In this study, the base metal used to manufacture the test specimen is API 2W Gr.50 steel for marine structures. The base metal has 345 MPa of yield strength and 448 MPa of tensile strength at room temperature. FCAW (Flux Cored Arc Welding) and SAW (Submerged Arc Welding) were applied with a X-groove configuration. FCAW was applied with two heat input conditions, overheat input and normal heat input, and SAW was applied with normal heat input conditions. Heat treatment was carried out for 48 h at 150   ° C to minimize the effects of hydrogen on the time difference between welding and testing. The weldment was cut to have a cross-sectional area of 45 × 90   mm 2 and polished using Labo System of Struers corporation. Then, etching was performed using a 3 % Nital solution. The main reason for observing macrostructures in this study is to examine the intervention of impurities in the section and the degree of uniformity of the weldment and weld defects. As a result of macrostructure observation, no impurity was found in the weldment. Table 1. lists the chemical composition of the test materials, and Figure 3 shows the macrostructure of the weldment.
The main weld parameters used for FCAW, overheat input conditions are: (1) average heat input > 45 kJ/cm, (2) welding current 380 A, and (3) welding voltage 40 V. The parameters used for FCAW, normal heat input conditions are: (1) average heat input 25~30 kJ/cm, (2) welding current 320 A, and (3) welding voltage 36 V. For the SAW process, the main parameters are (1) average heat input 30~45 kJ/cm, (2) welding current 660 A, and (3) welding voltage 32 V. Table 2 lists the main parameters used for the welding process.
The welded plate has sizes of 1000 mm, 500 mm, and 45 mm, respectively, in length, width, and thickness. Figure 4 shows the schematic diagram of the welded plate and sample location for test specimen.

3.1. Tensile Test

Mechanical tensile tests were performed using a standard test specimen with a diameter of 8 mm and a length of 40 mm in the center parallel section at room temperature [19]. The test equipment used in this study is a servo-hydraulic testing machine (IMT 8803 of Instron Corporation). The tensile test specimens for weldment were machined with their longitudinal axes parallel to the welding direction. The specimens were sampled from the top and bottom of the weldment, and the average values of yield strength and tensile strength were used in this study. When fracture toughness has been obtained in CTOD, the values are required to be converted to the critical stress intensity factor, K mat . In this procedure, yield strength and tensile strength determined at the fracture toughness test temperature are required. The following Equations (4) and (5) can be applied to obtain yield strength and tensile strength corresponding to the temperature [8,9].
σ Y = σ Y , R + 10 5 ( 491 + 1.8 T ) 189
σ U = σ U , R × [ 0.7857 + 0.2423 e x p ( T 170.646 ) ]
where, σ Y and σ U mean the yield strength and tensile strength at test temperature in MPa and σ Y , R and σ U , R mean the yield strength and tensile strength at room temperature in MPa. T means the test temperature in °C.
Table 3 provides the tensile characteristics of API 2W Gr.50 according to the welding conditions at room temperature.

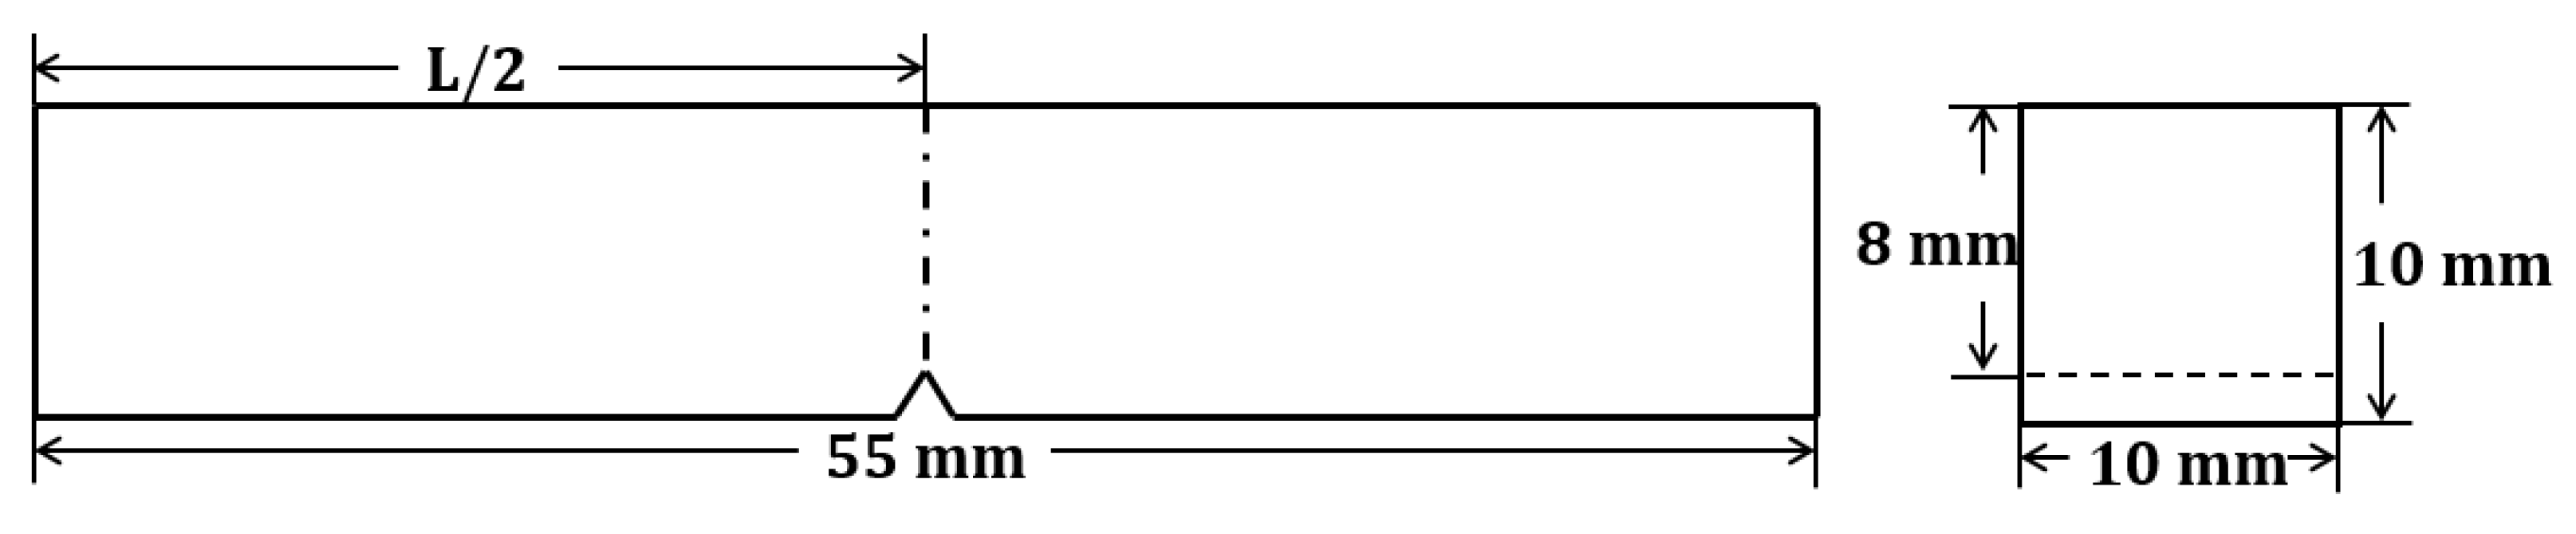
3.2. Charpy Impact Test

Charpy impact specimens were sampled from the weldment with their longitudinal axes perpendicular to the welding direction [17]. The thickness of welded plates is thicker than that of impact specimen. Thus, the sample locations are divided into three regions: First, Root and Second, according to the welding sequence, in areas 2 mm from the top and bottom. Figure 5 shows the schematic diagram of the sample location for the Charpy impact specimen.
A total of 111 impact specimens were tested using TM-CIMC of TEST MATE Corporation. The impact tests were performed between the temperatures −90 °C and 60 °C, and Figure 6 represents the test results of absorbed energy according to the temperature. Figure 6a represents the comparison of the test results between overheat input and normal heat input conditions with FCAW. As a result, it was confirmed that the transition temperature was low in the overheat input condition except for the root location. Additionally, Figure 6b represents the comparison of the test results between FCAW and SAW with normal heat input conditions. As shown in Figure 6b, for the same welding heat input, SAW showed lower transition temperature at all sample locations compared to FCAW. In Figure 6, the lines represent the hyperbolic tangent curve fitting expressed as Equation (6) [20].
C V E = A + B t a n h ( T T t C )
where, T , T t , and CVE mean assessment temperature, transition temperature, impact energy for assessment temperature, respectively. Using the function, the impact energy values according to temperature can be calculated, and the temperature corresponding to impact energy 27J used for reference temperature calculation can be obtained. Table 4 lists the coefficients of the hyperbolic tangent function and the temperature corresponding to impact energy 27J.

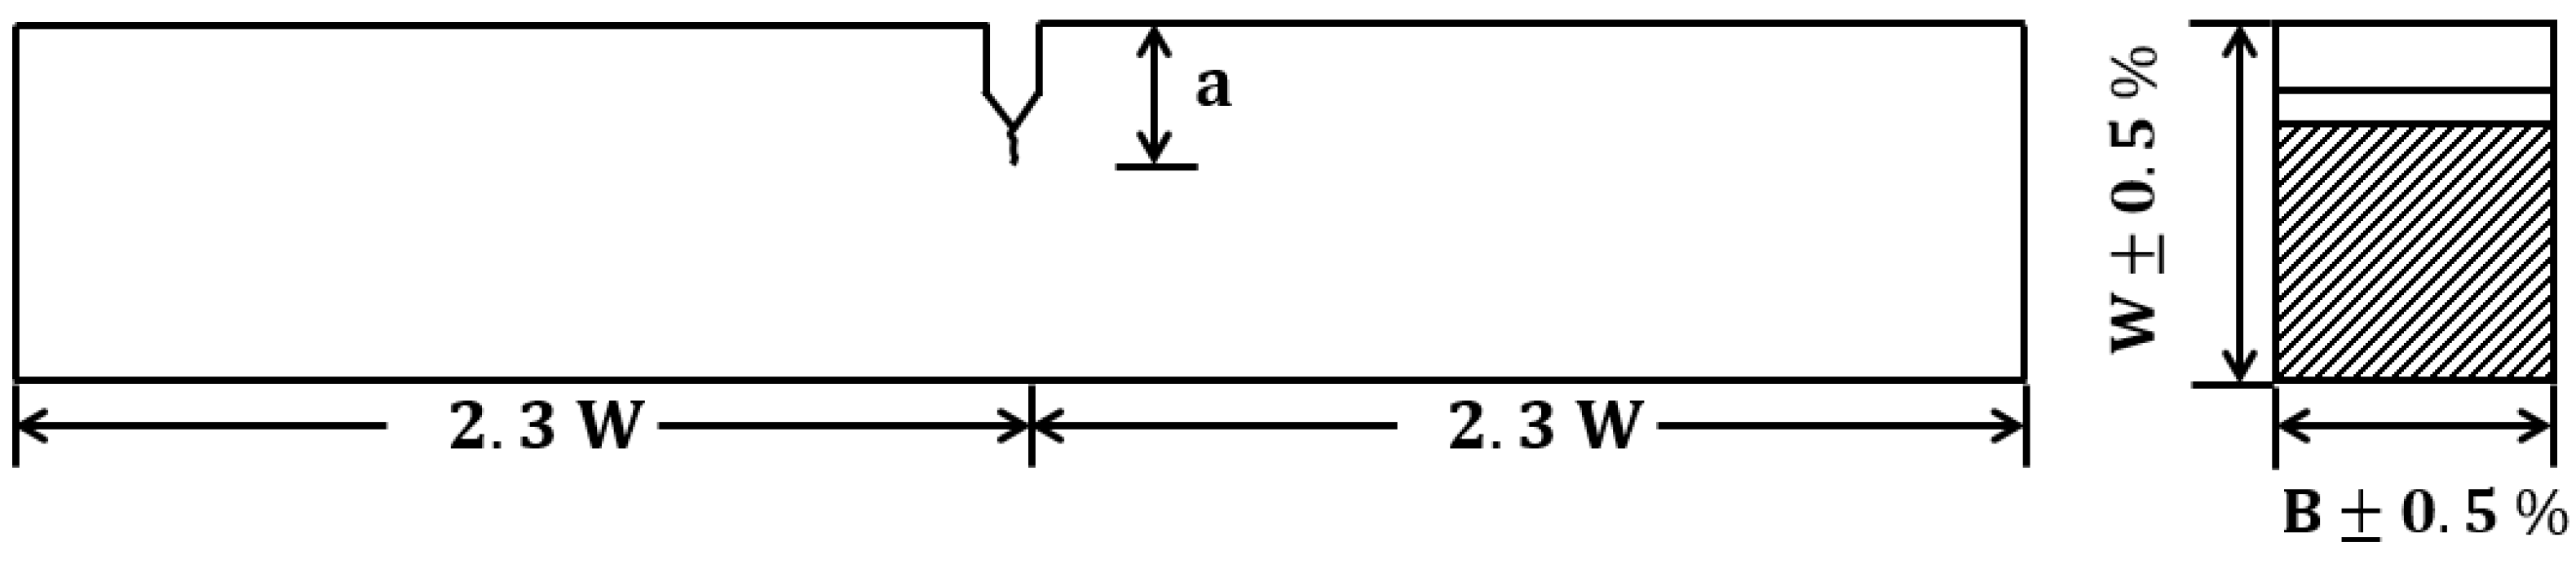
3.3. Fracture Toughness Test (CTOD)

The CTOD test specimens are manufactured in the shape of SENB with a rectangular cross section of B×2B in accordance with BS 7448 [2,3]. The approximate dimensions of the specimens are 42 mm thickness, 84 mm width, and 336 mm span length. For the purpose of evaluating the fracture toughness of weldment, the specimens are machined with their notch parallel to the welding direction. Furthermore, in order to reduce the influence of the notch shape, the radius of the notch was manufactured to be less than 0.1 mm, and fatigue pre-crack was generated so that the a/W became 0.5.
All CTOD test results and load types are included in Appendix A. Figure 7 represents the CTOD test results according to the temperature. Figure 7a represents the comparison of the test results between overheat input and normal heat input conditions with FCAW. Additionally, Figure 7b represents the comparison of the test results between FCAW and SAW with normal heat input conditions. In the comparison according to the heat input condition, the transition temperature of normal heat input is about −10 °C, which is lower than that of overheat input of 0 °C. Before the transition temperature, the fracture toughness of overheat input condition are higher than that of normal heat input condition. However, there was no difference in fracture toughness at temperatures lower than the transition region. In cases of the welding process, the fracture toughness of SAW is higher than that of FCAW. The difference in transition temperature between the two conditions was about 40 °C. Table 5 lists the coefficient and transition temperature of the CTOD test results.

3.4. Comparison between Charpy and CTOD Transition Curve

Although the test specimens are manufactured using the same material and welding conditions, the difference in transition temperature between the two tests is observed. This difference in transition temperature occurs due to the difference in conditions such as the specimen geometry, strain rate, and notch shape. Therefore, in this study, the transition temperature derived through the CTOD results and the Charpy impact test results of the root were compared.
In Figure 8, the solid symbols and lines represent the Charpy impact test results of weld root. Additionally, hollow symbols and dash lines represent the CTOD test results. Regardless of the welding conditions, the ductile to brittle transition temperature derived from the CTOD test is higher than the value derived from the Charpy impact test. A maximum difference in FCAW with overheat input condition is 27 °C. Based on the test results, Figure 9 shows the relationship between the ductile to brittle transition temperature derived from the two tests. The transition temperature derived from the two tests shows a linear relationship, and it is possible to predict the CTOD transition temperature based on the Charpy impact test results. The linear relationship of two transition temperatures can be expressed as Equation (7).
y = 1.495 x + 40.437

4. Master Curve Analysis

In this study, the thickness of the welded plate is 45 mm which is thicker than that of the Charpy impact specimen. Therefore, the tendency of master curves varies according to the sample location. Figure 10, Figure 11 and Figure 12 show the estimated median values of fracture toughness according to the sample location. In case of FCAW with overheat input condition, the estimated fracture toughness of the first location is the lowest. However, in case of other conditions, the second location represents the lowest fracture toughness. Based on the estimated fracture toughness at CTOD transition temperature, the difference according to the sample location is about 36 MPa m under FCAW with overheat input condition, and a maximum difference is approximately 140 MPa m under SAW with normal heat input condition. Therefore, consideration of the sample location is required if the welded plate is thicker than the Charpy impact specimen.
The CTOD test results are compared with the master curve to verify the validity of the master curve approach. When fracture toughness has been obtained in terms of CTOD, BS7910 suggests Equation (8) for converting CTOD values to the equivalent stress intensity factor. In the equation, σ Y , δ , E , and v are yield strength, CTOD value, elastic modulus and Poisson’s ratio, respectively. Additionally, m is the constant expressed as Equation (9) for steel [8].
K m a t = m σ Y δ E 1 v 2
m = 1.517 ( σ Y σ U ) 0.3188
Figure 13, Figure 14 and Figure 15 represent the master curve derived from the Charpy impact test results of weld root. In the figures, the solid lines are the median fracture toughness of the master curve, and dash lines are 5 % and 95 % tolerance bounds. The symbols are the equivalent stress intensity factor converted from the CTOD value, and the dash-dot lines represent the maximum fracture toughness value depending on temperature. In Figure 13 and Figure 14, it is confirmed that the fracture toughness values converted from CTOD were distributed above the median curve in the region above the fracture toughness transition temperature. In contrast, the fracture toughness values converted from CTOD are distributed below the median curve after transition temperature. Although there are some points in which the fracture toughness values deviated from the tolerance bound, the master curve by the Charpy impact test predicted fracture toughness relatively well in the region close to the transition temperature.
In Figure 15, the master curve derived from the Charpy impact test results conservatively evaluates the fracture toughness compared to the CTOD test results. In particular, the master curve has difficulties predicting the tendency of fracture toughness in the region above −60 °C. One of the reasons for the difficulty in predicting fracture toughness may be that the master curve is an empirical correlation based on experimental data. Therefore, additional considerations reflecting various welding conditions are required for accurate fracture toughness estimation.

5. Conclusions

This study used the master curve approach to estimate the fracture toughness of API 2W Gr.50 steel weldment in the ductile to brittle transition region. The test specimens were manufactured using various welding methods (FCAW, SAW) and heat input conditions (overheat input, normal heat input). The reference temperature was calculated using the Charpy impact test results, and the master curve was determined based on the impact energy. Finally, the determined master curve was validated by comparing the CTOD results obtained through the fracture toughness test. Based on this study, the following conclusions are drawn:
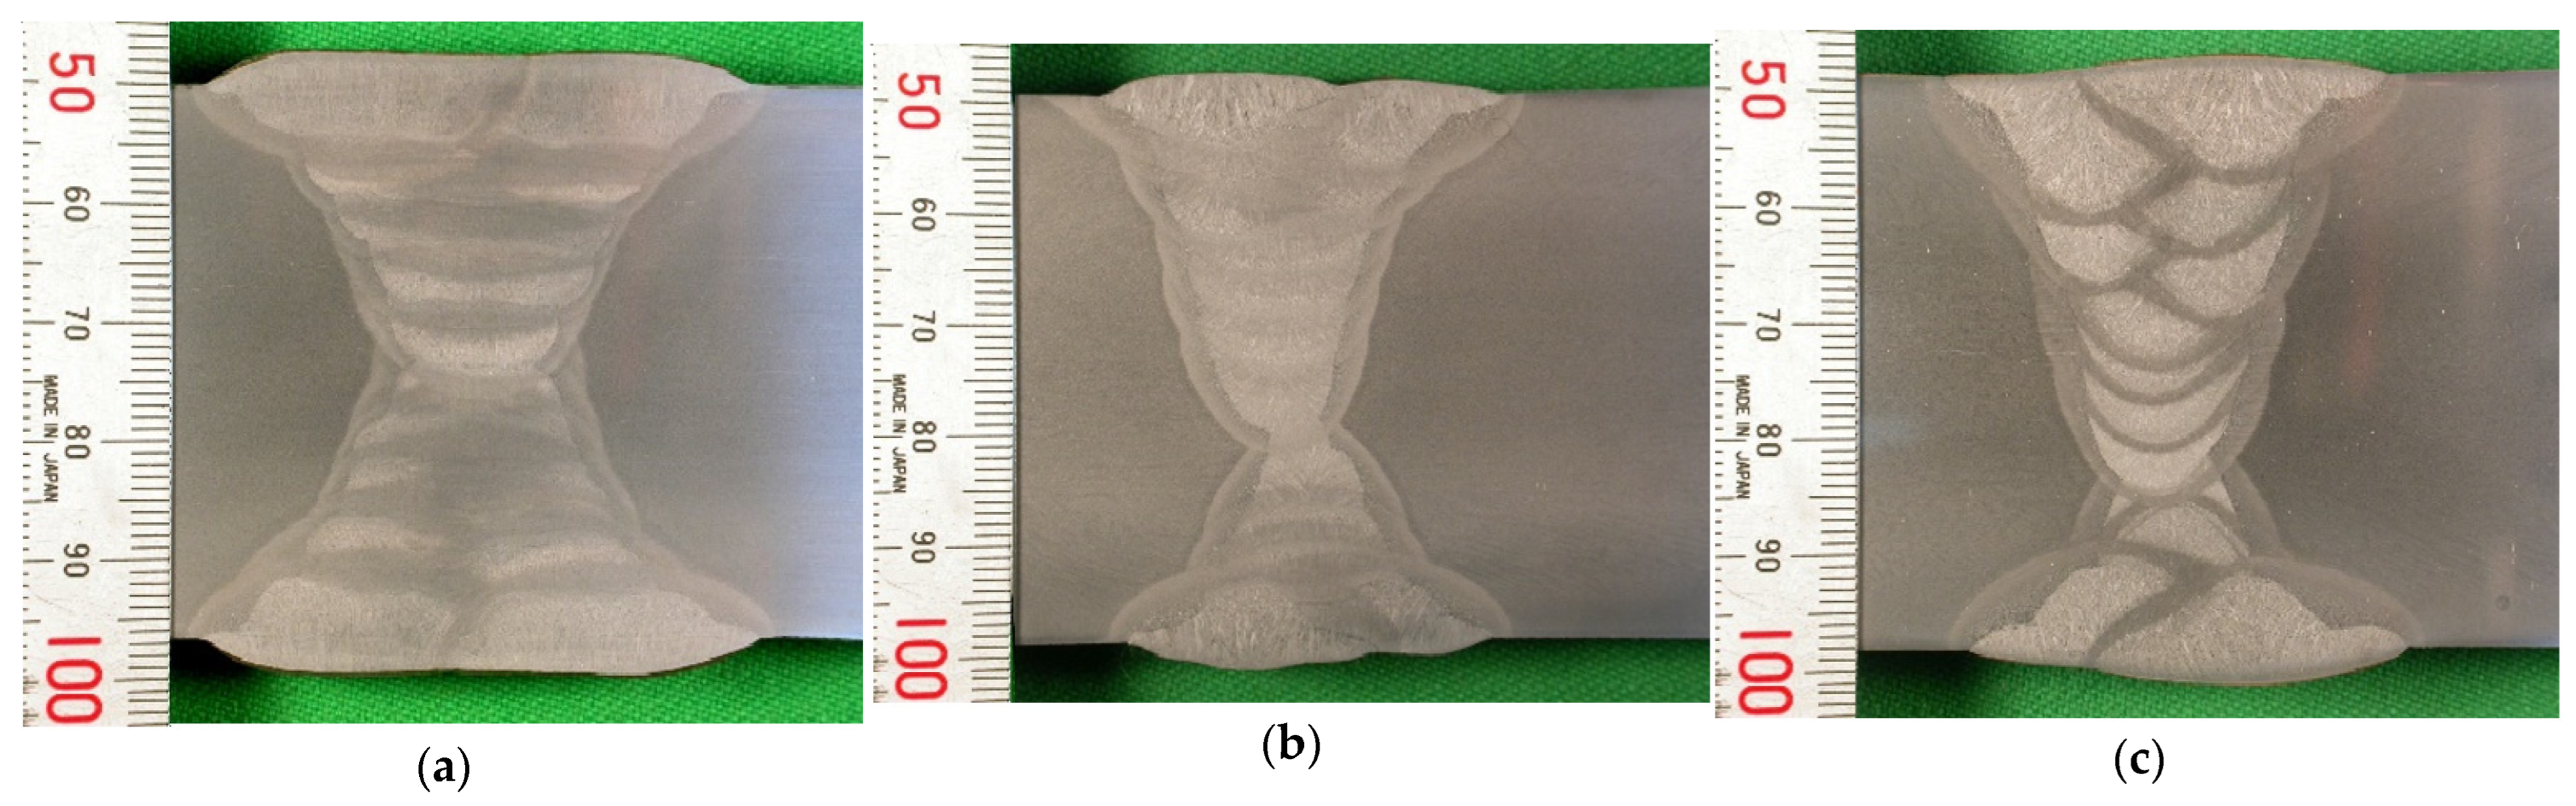
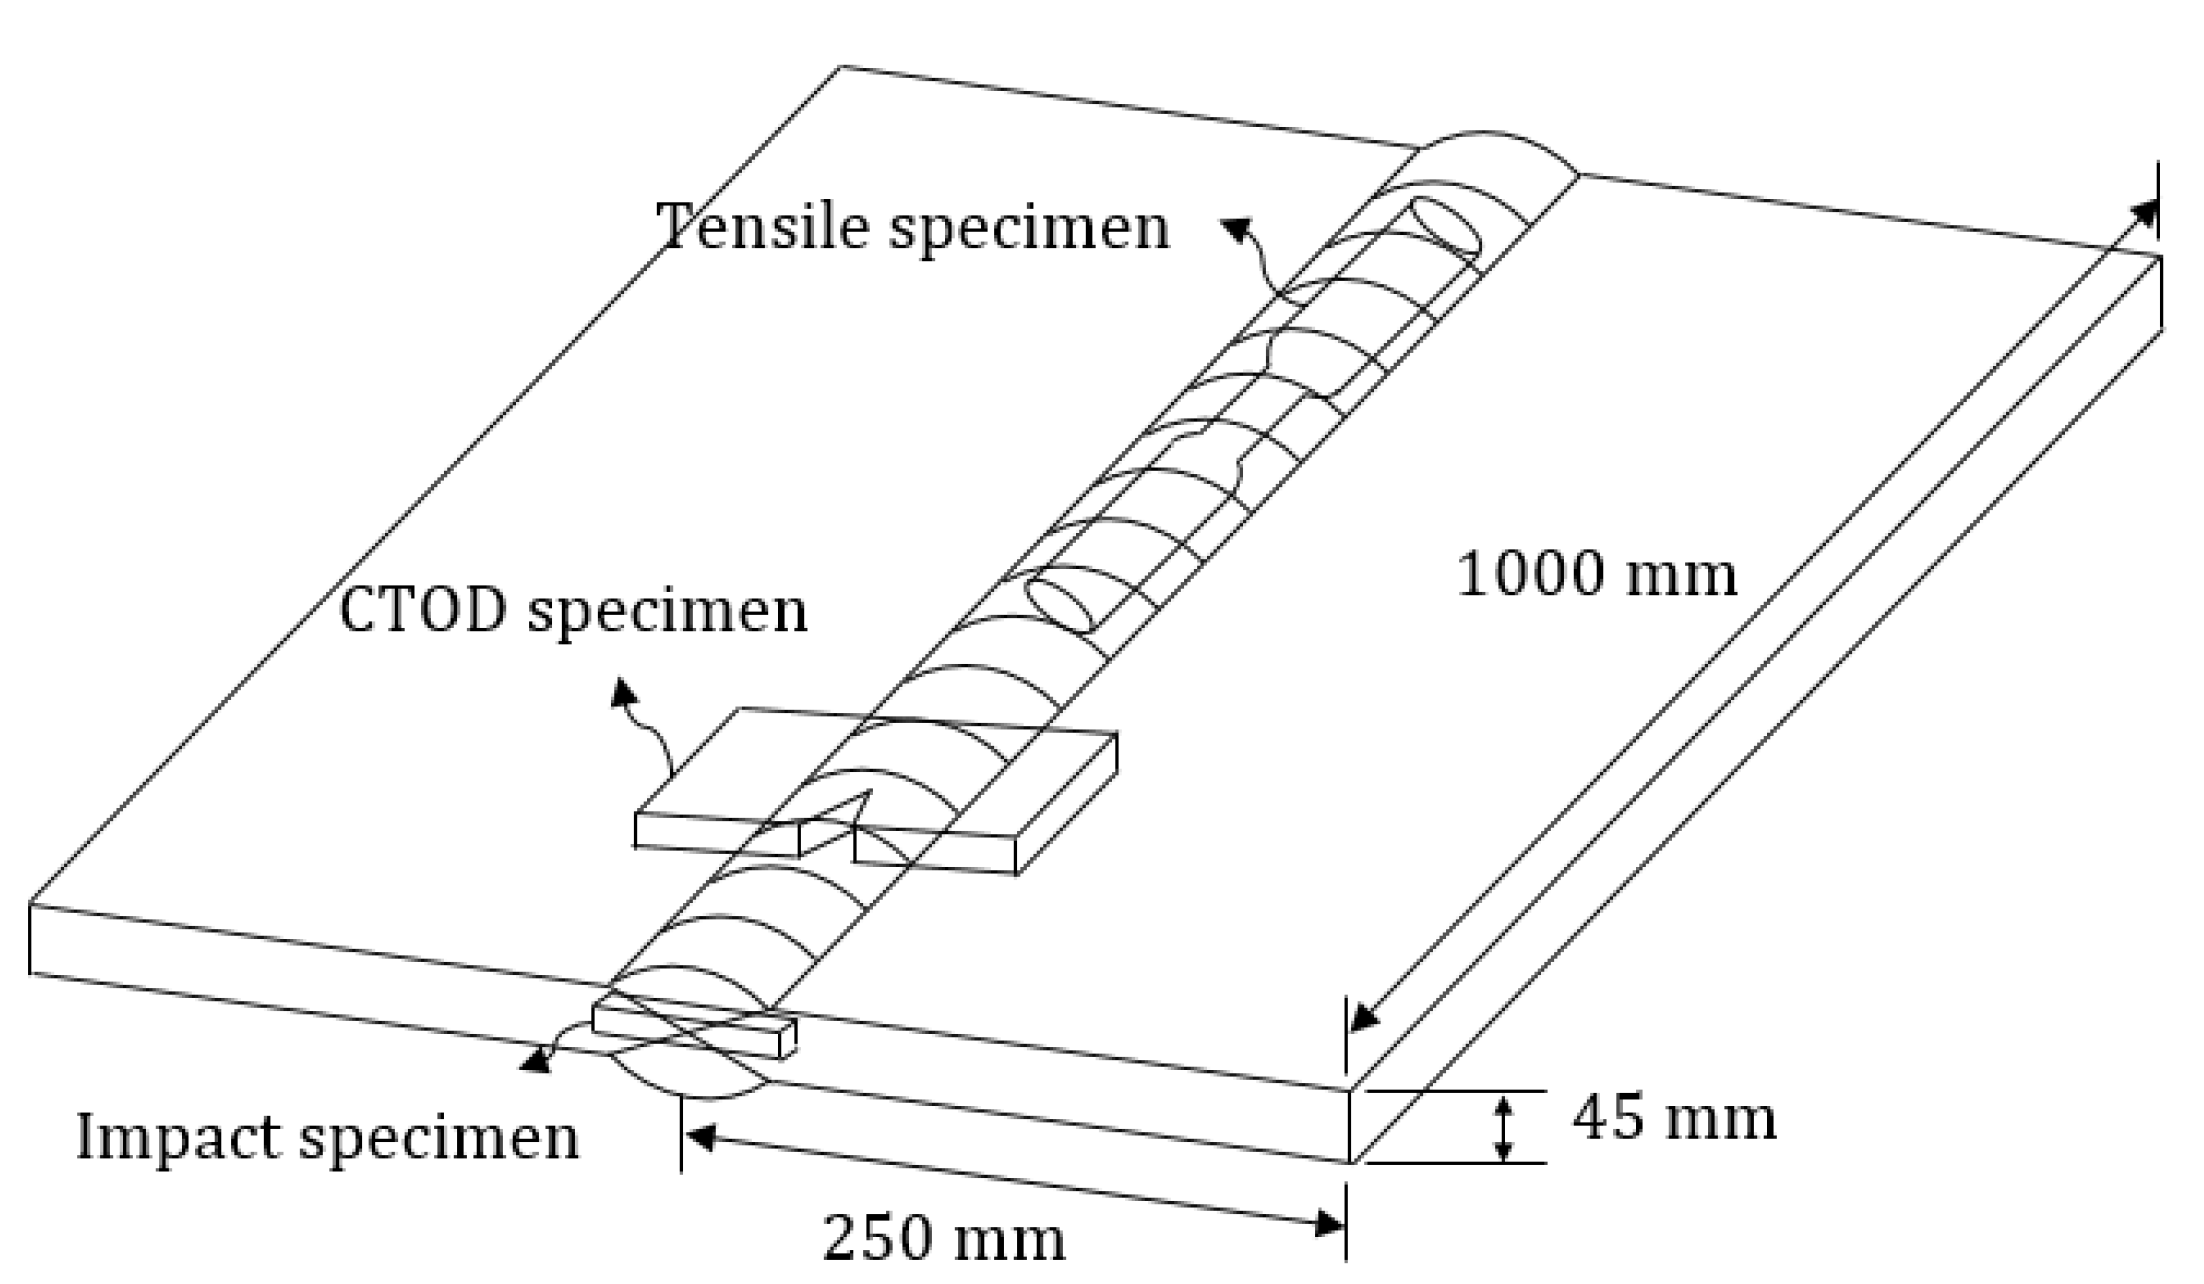
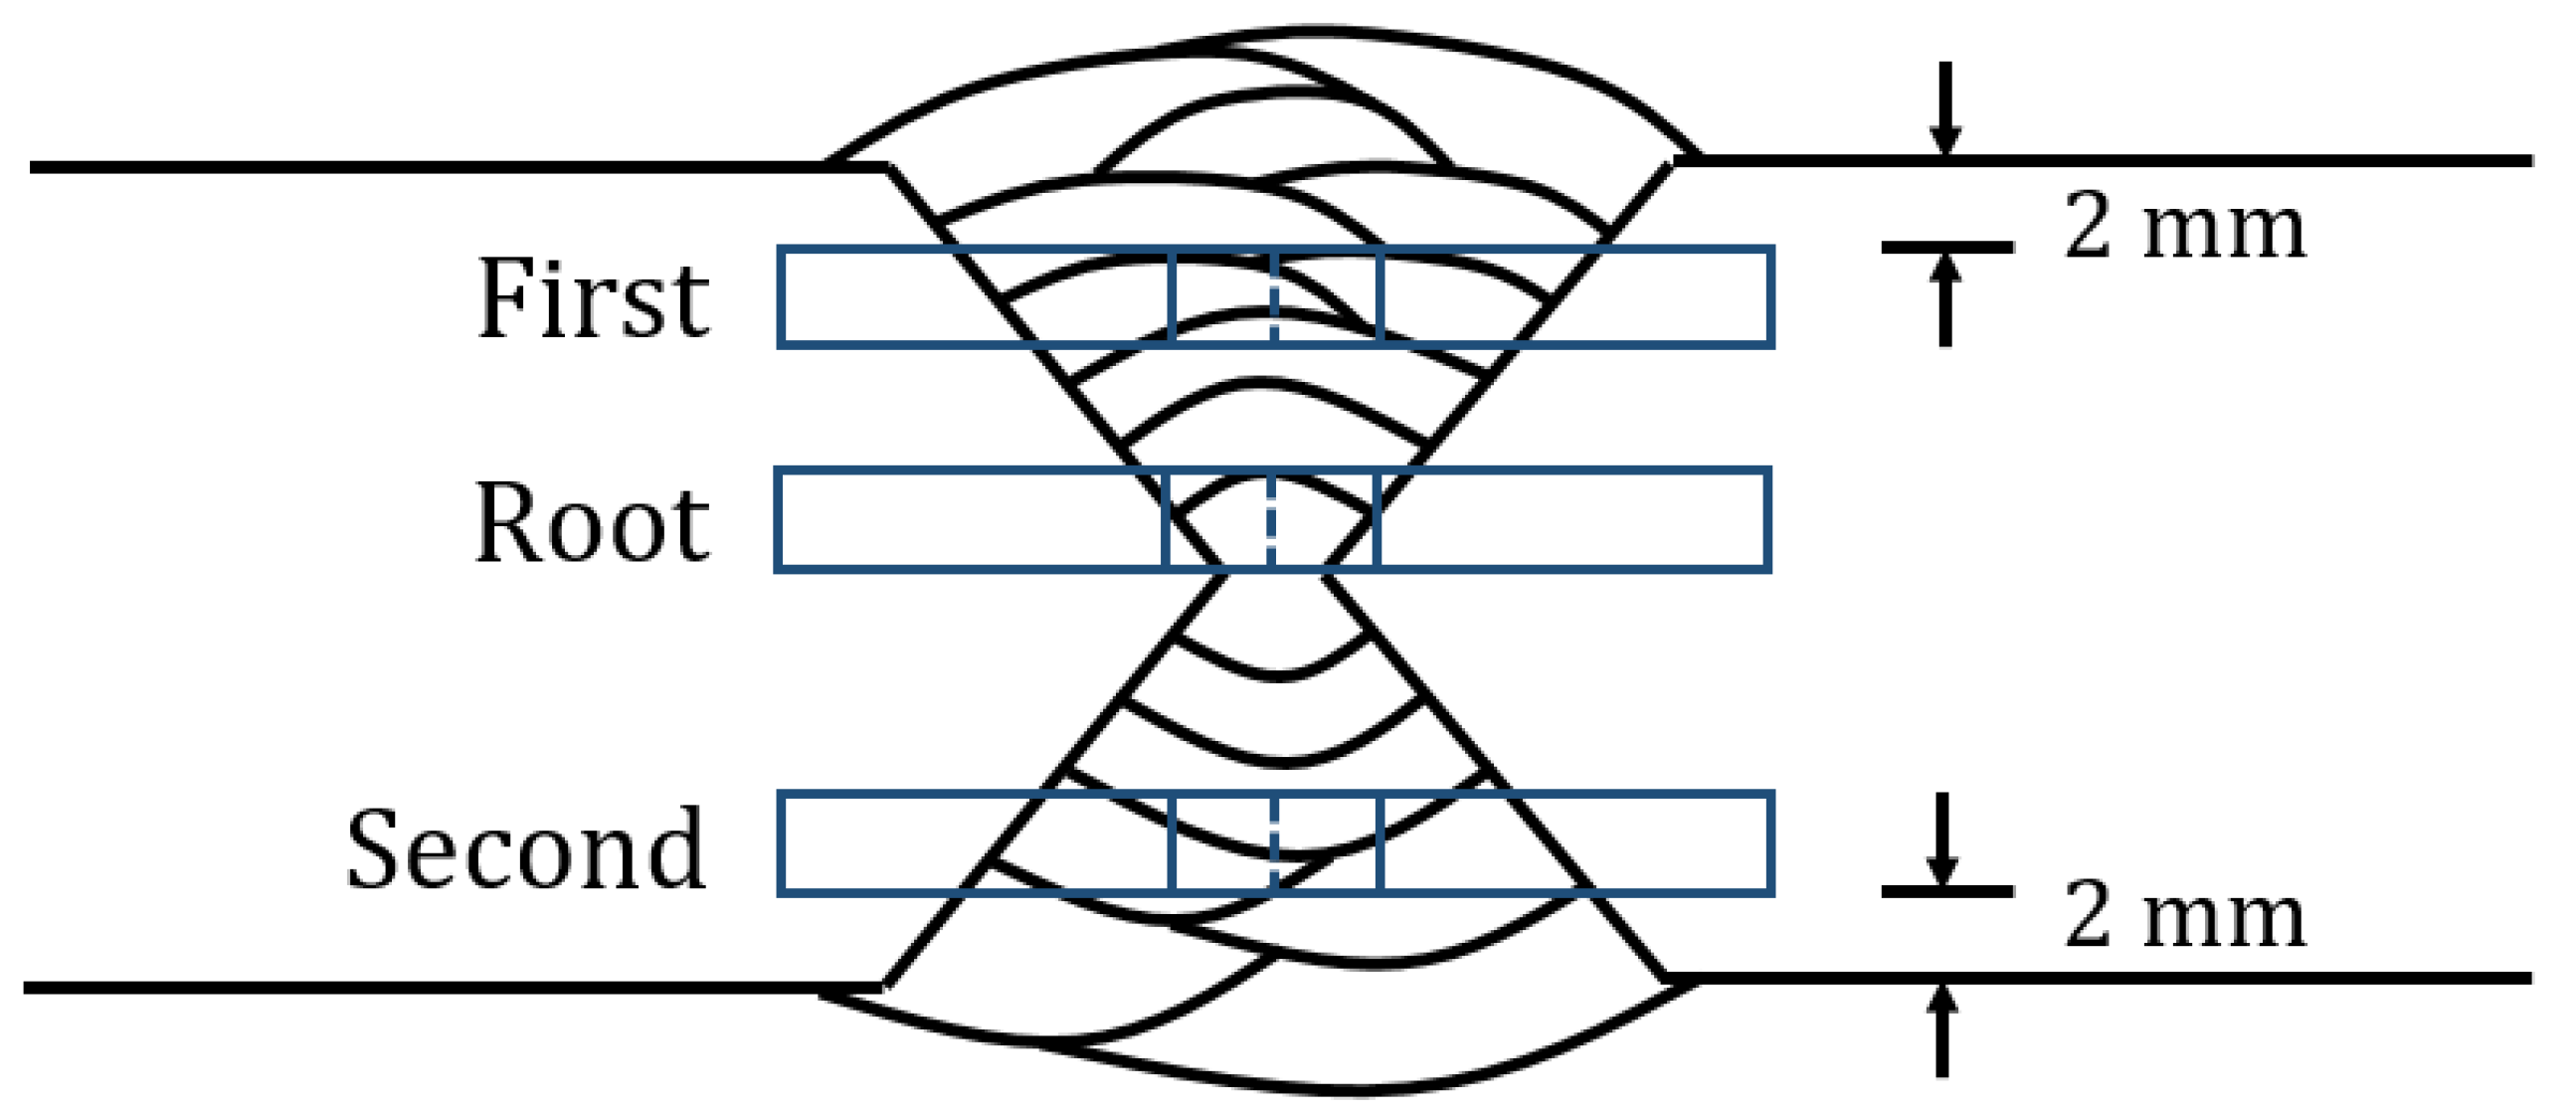
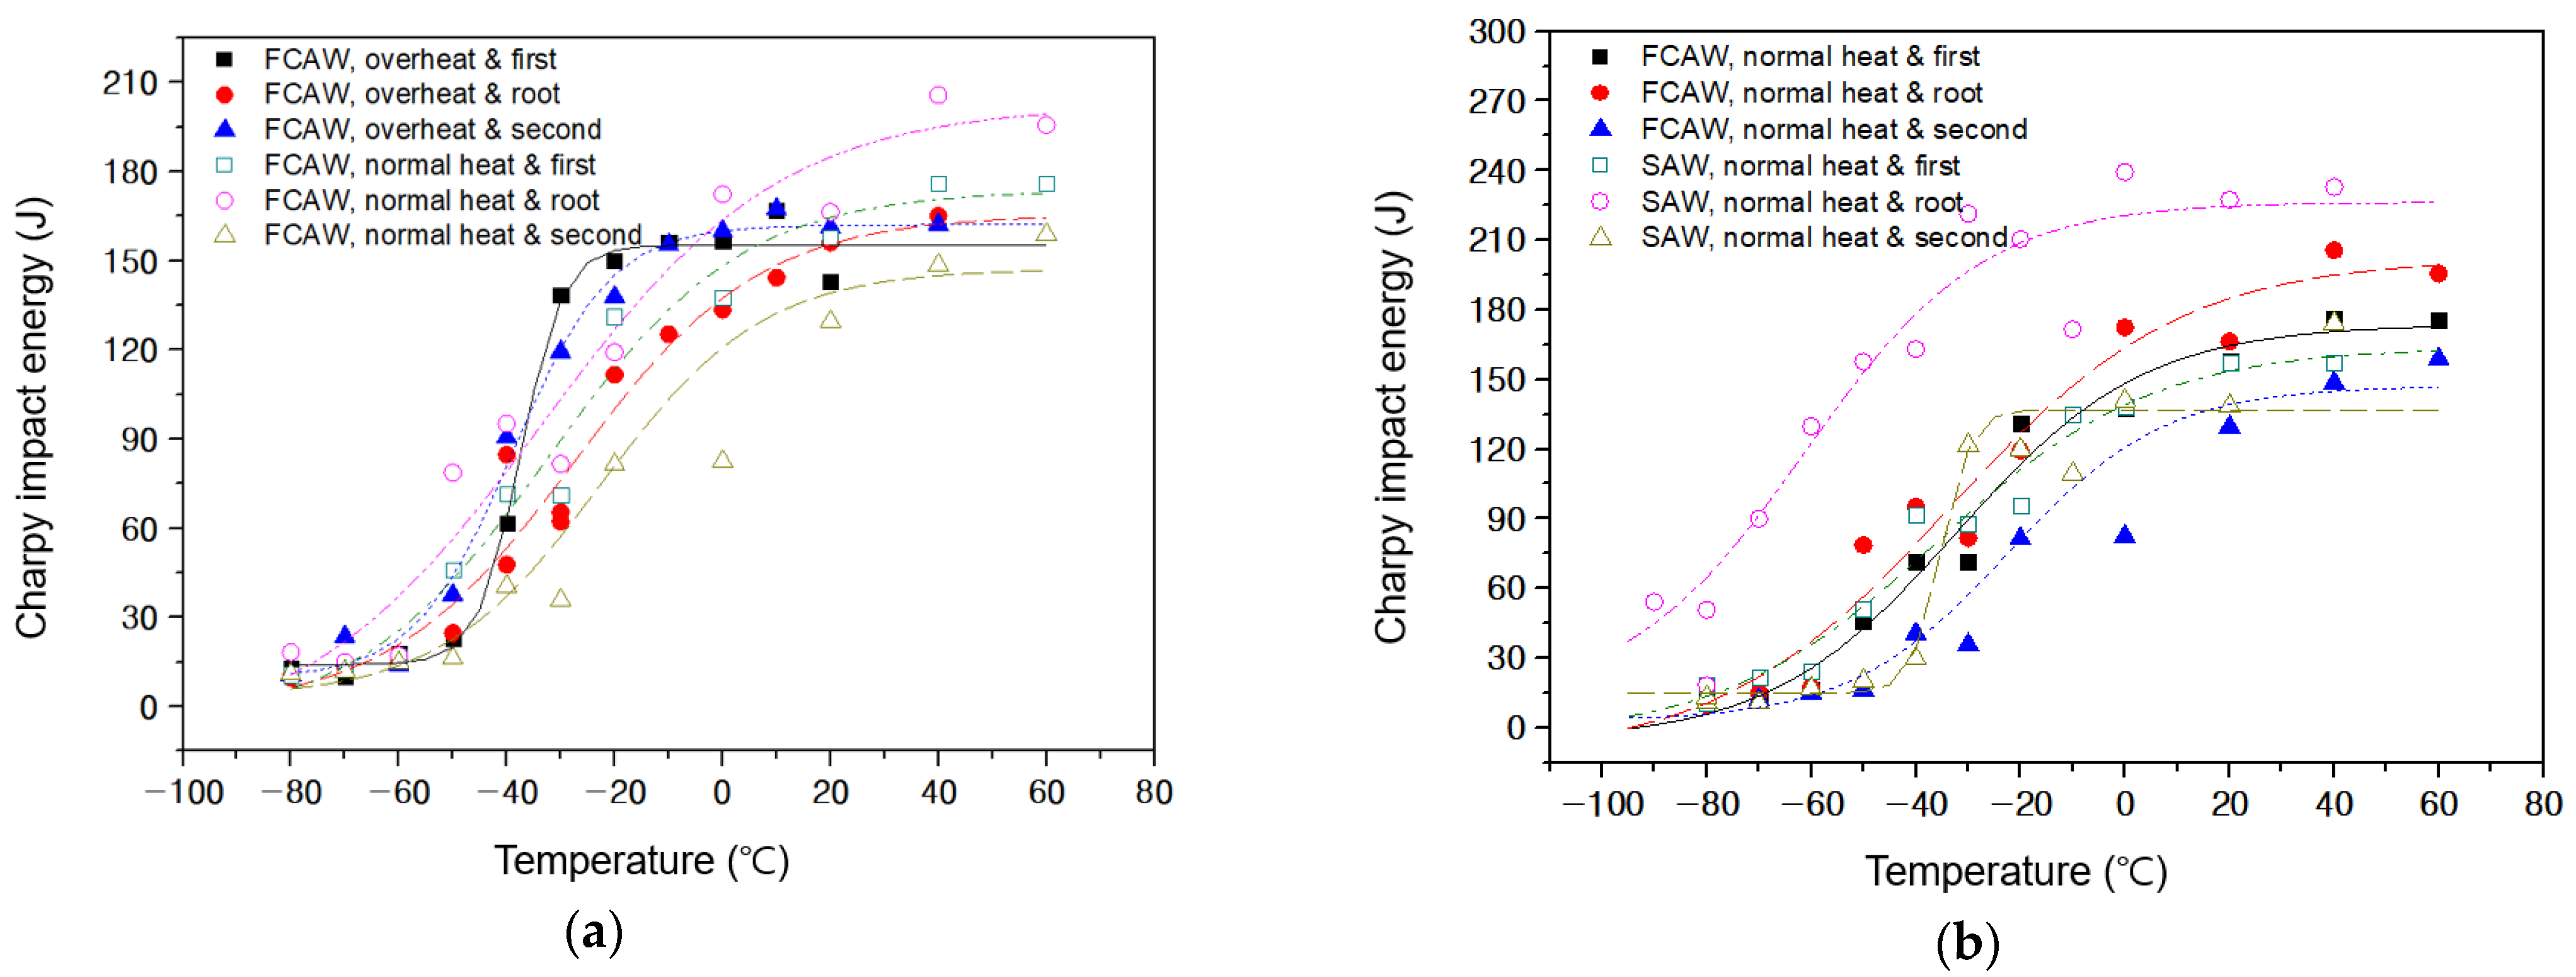
  • In this study, the thickness of the welded plate is thicker than that of the Charpy impact specimen. Therefore, the impact test specimens are manufactured in three locations, and the DBTT and master curve according to the sample location are different. Based on the master curve by the CTOD transition temperature, the difference in estimated fracture toughness is the largest when the SAW process is applied. As confirmed in this study, if the thickness of the plate is much thicker than that of the standard specimen of the Charpy impact test, it is essential to examine the effect of the sample location.
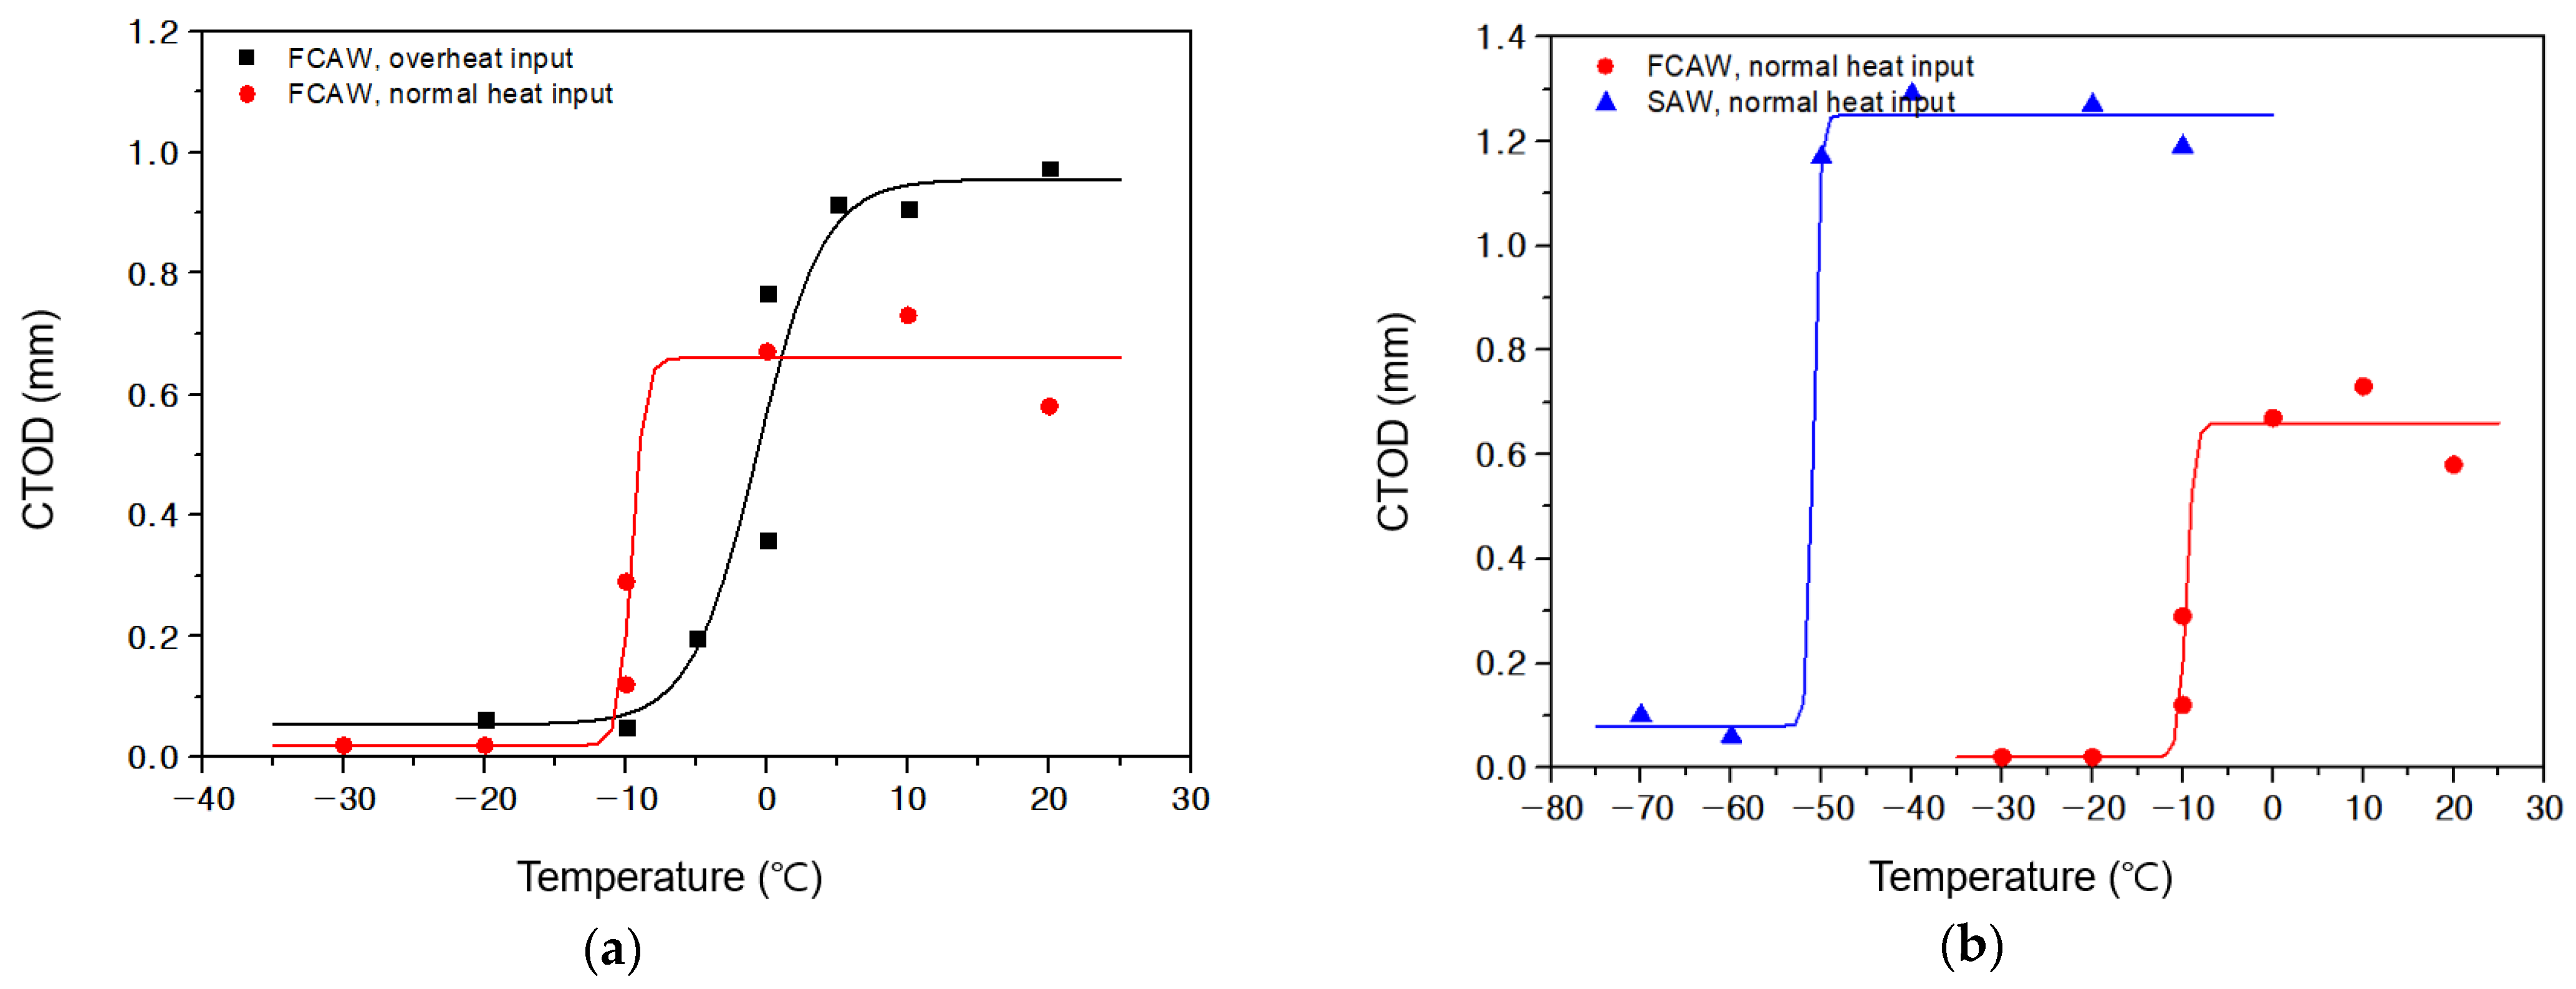
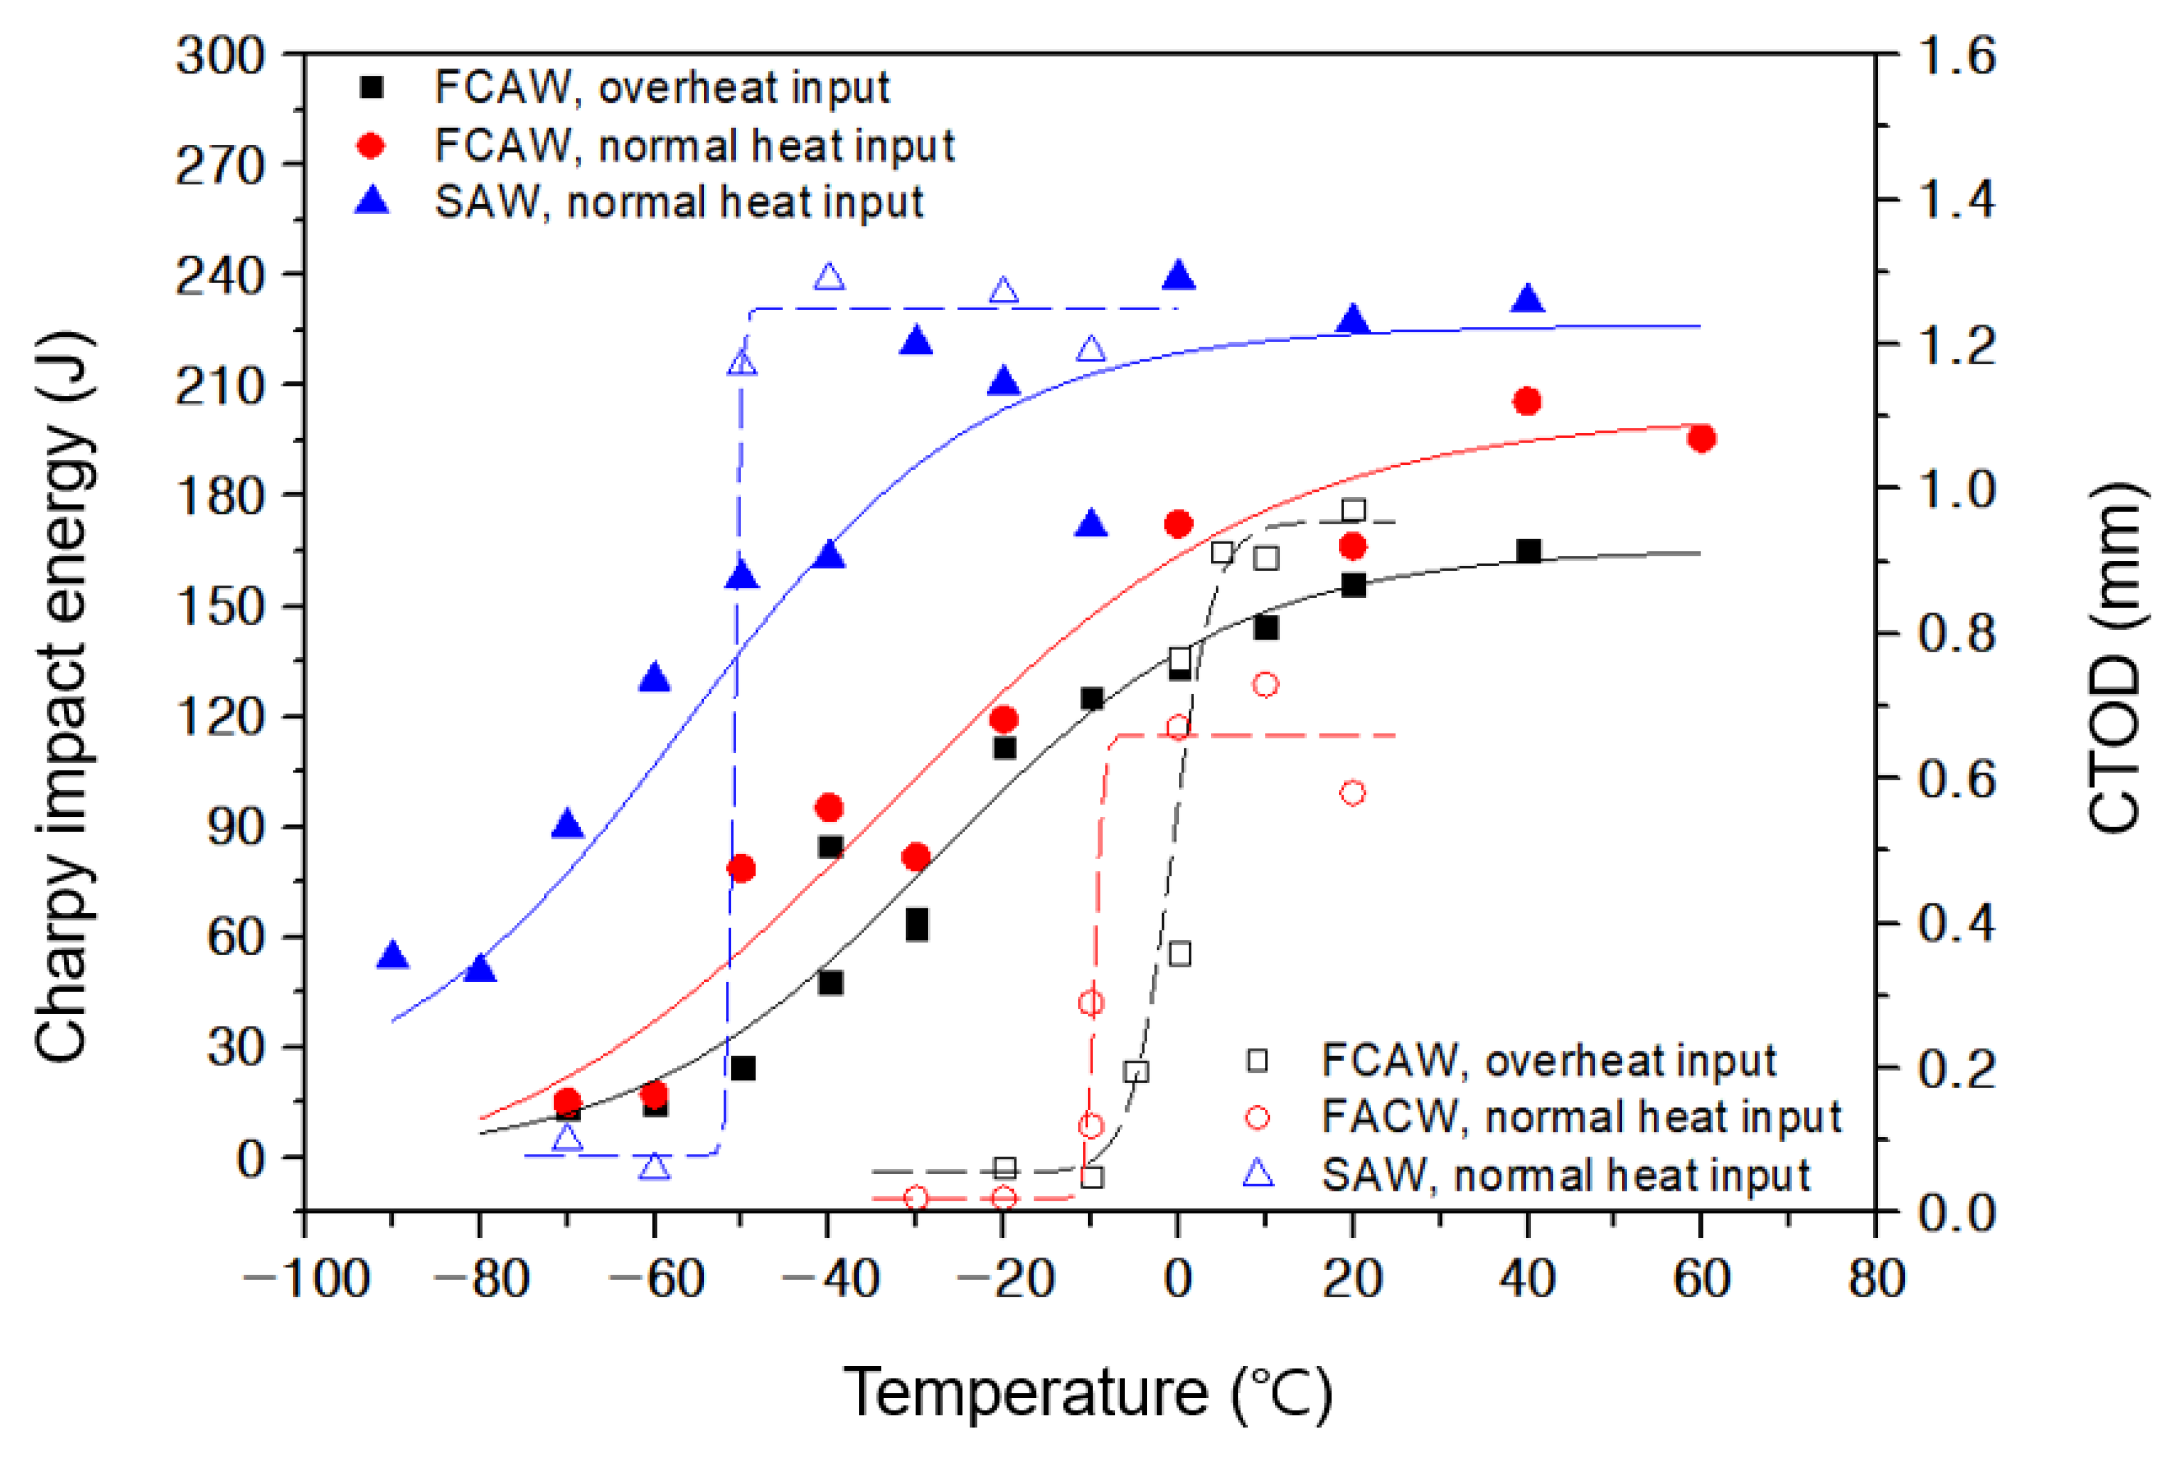
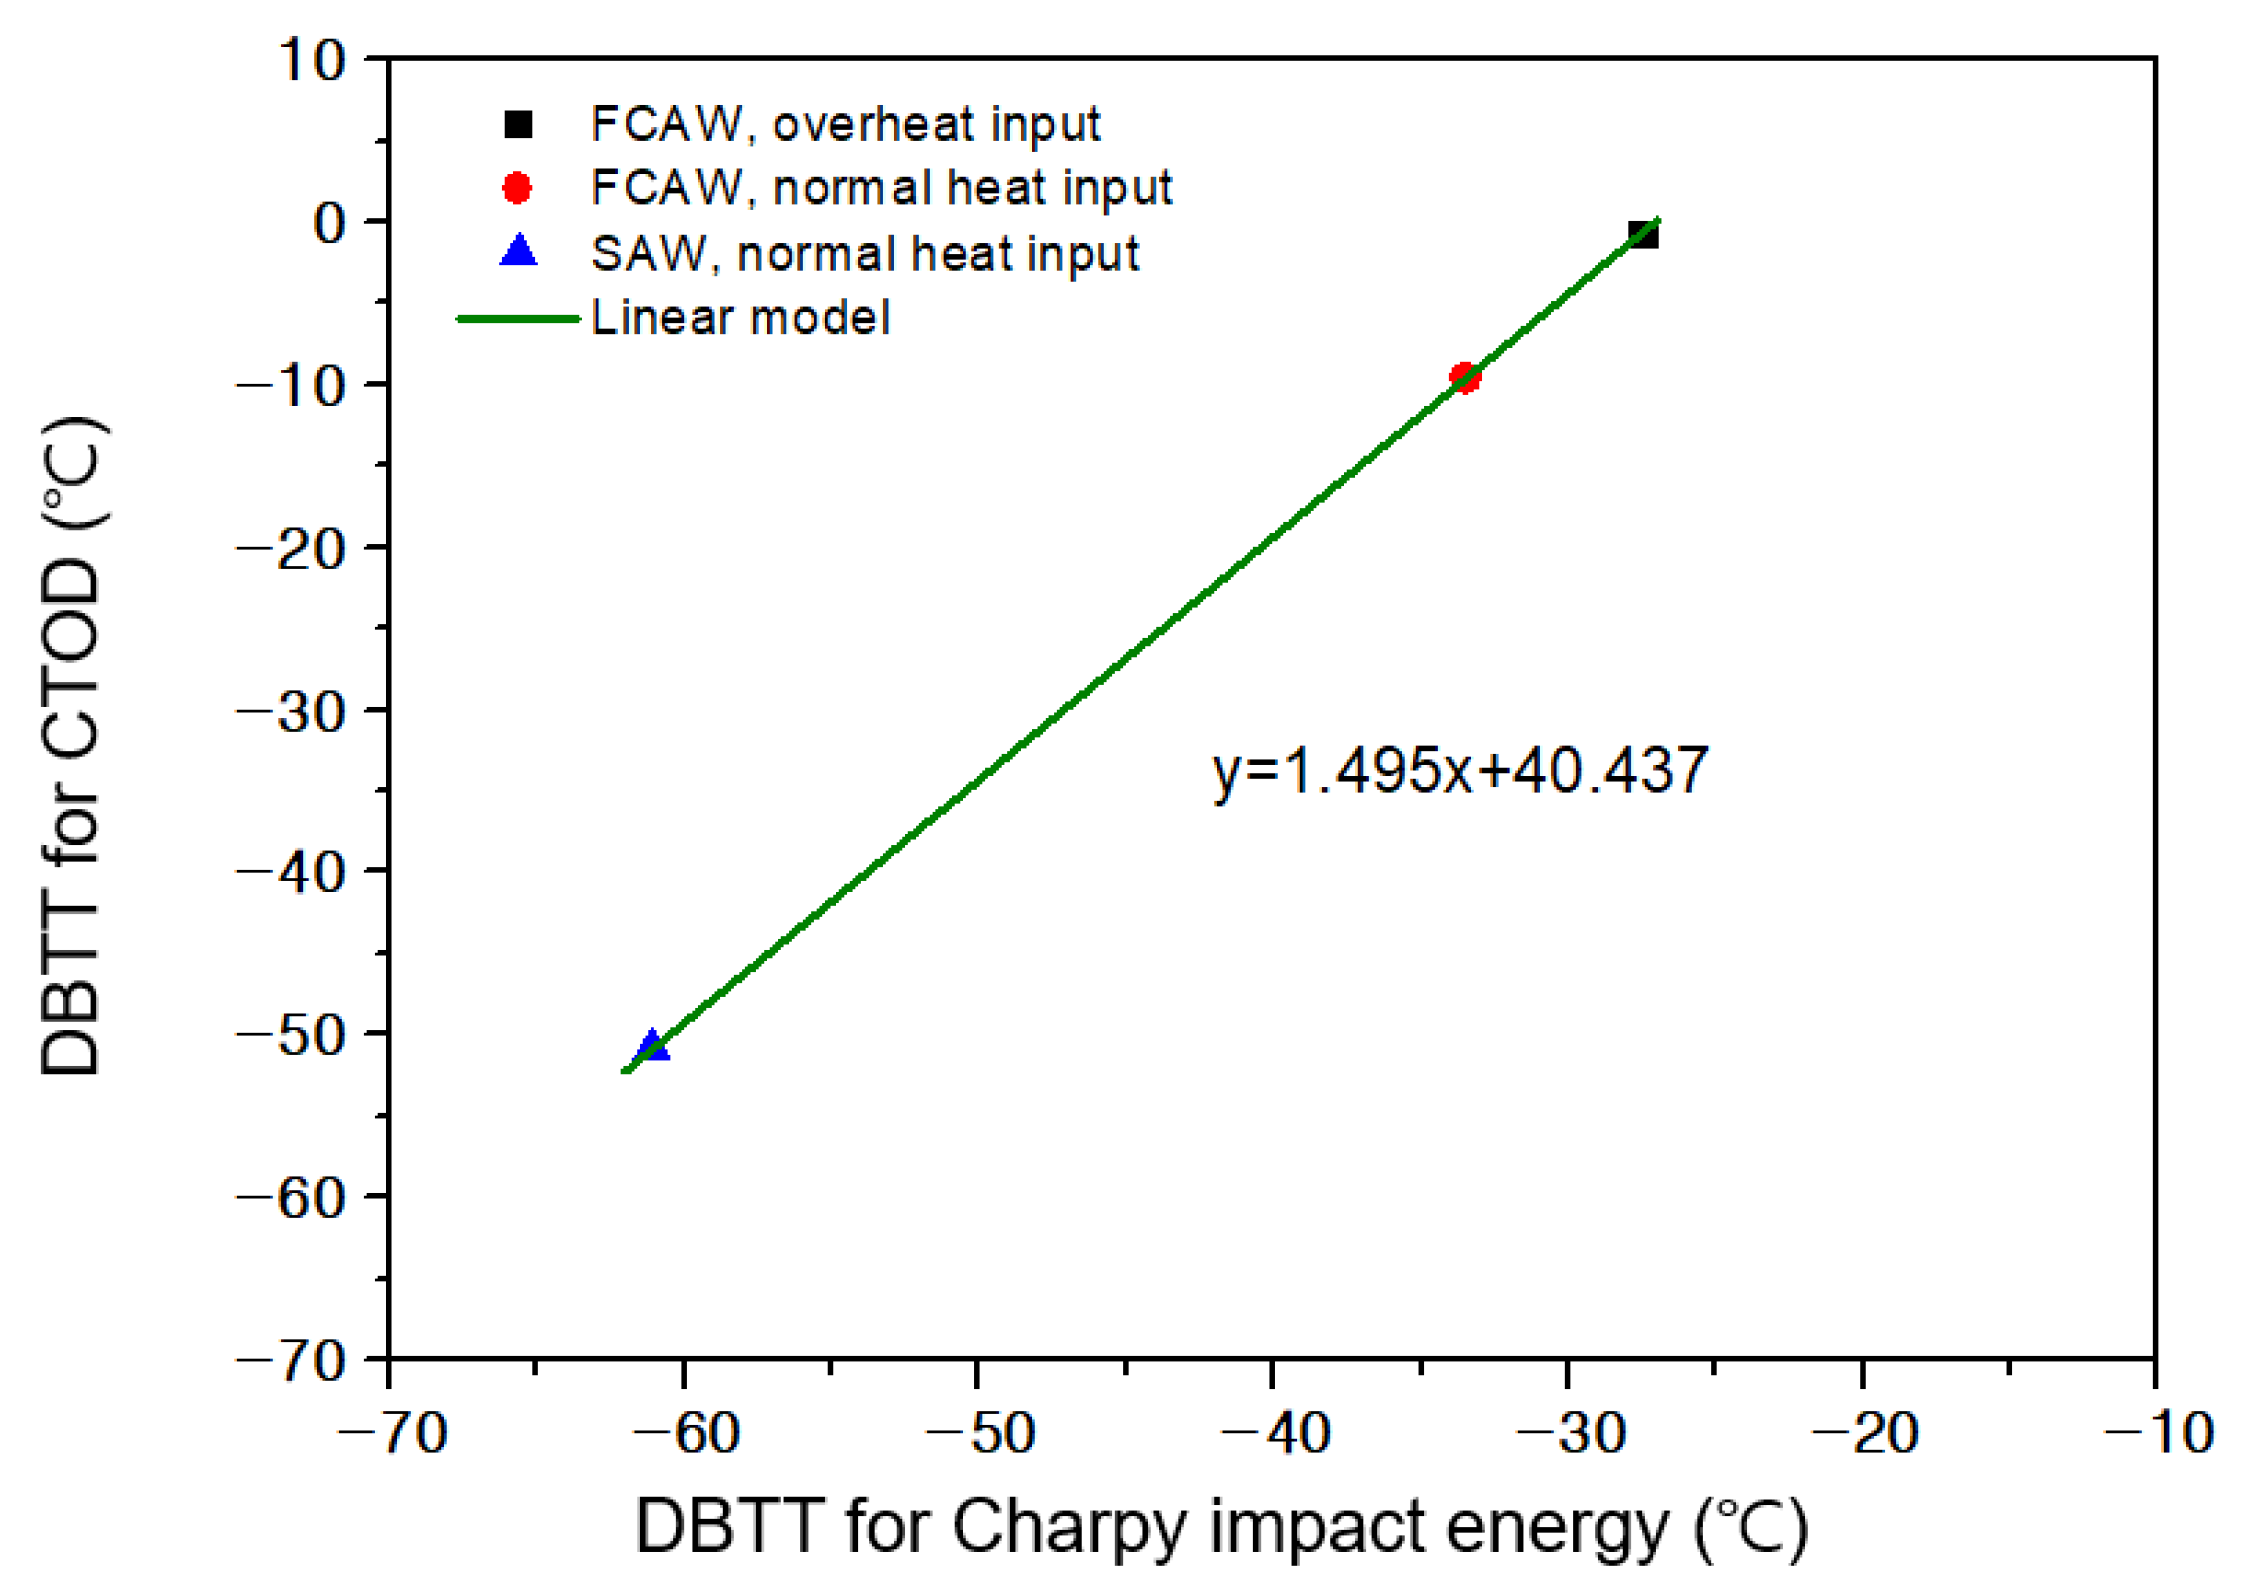
  • The DBTT derived from the CTOD test is higher than that derived from the Charpy impact test. In addition, the CTOD transition temperature was calculated using the Charpy impact transition temperature. In case of transition temperature, the relationship between CTOD and Charpy impact tests represents the linear line.
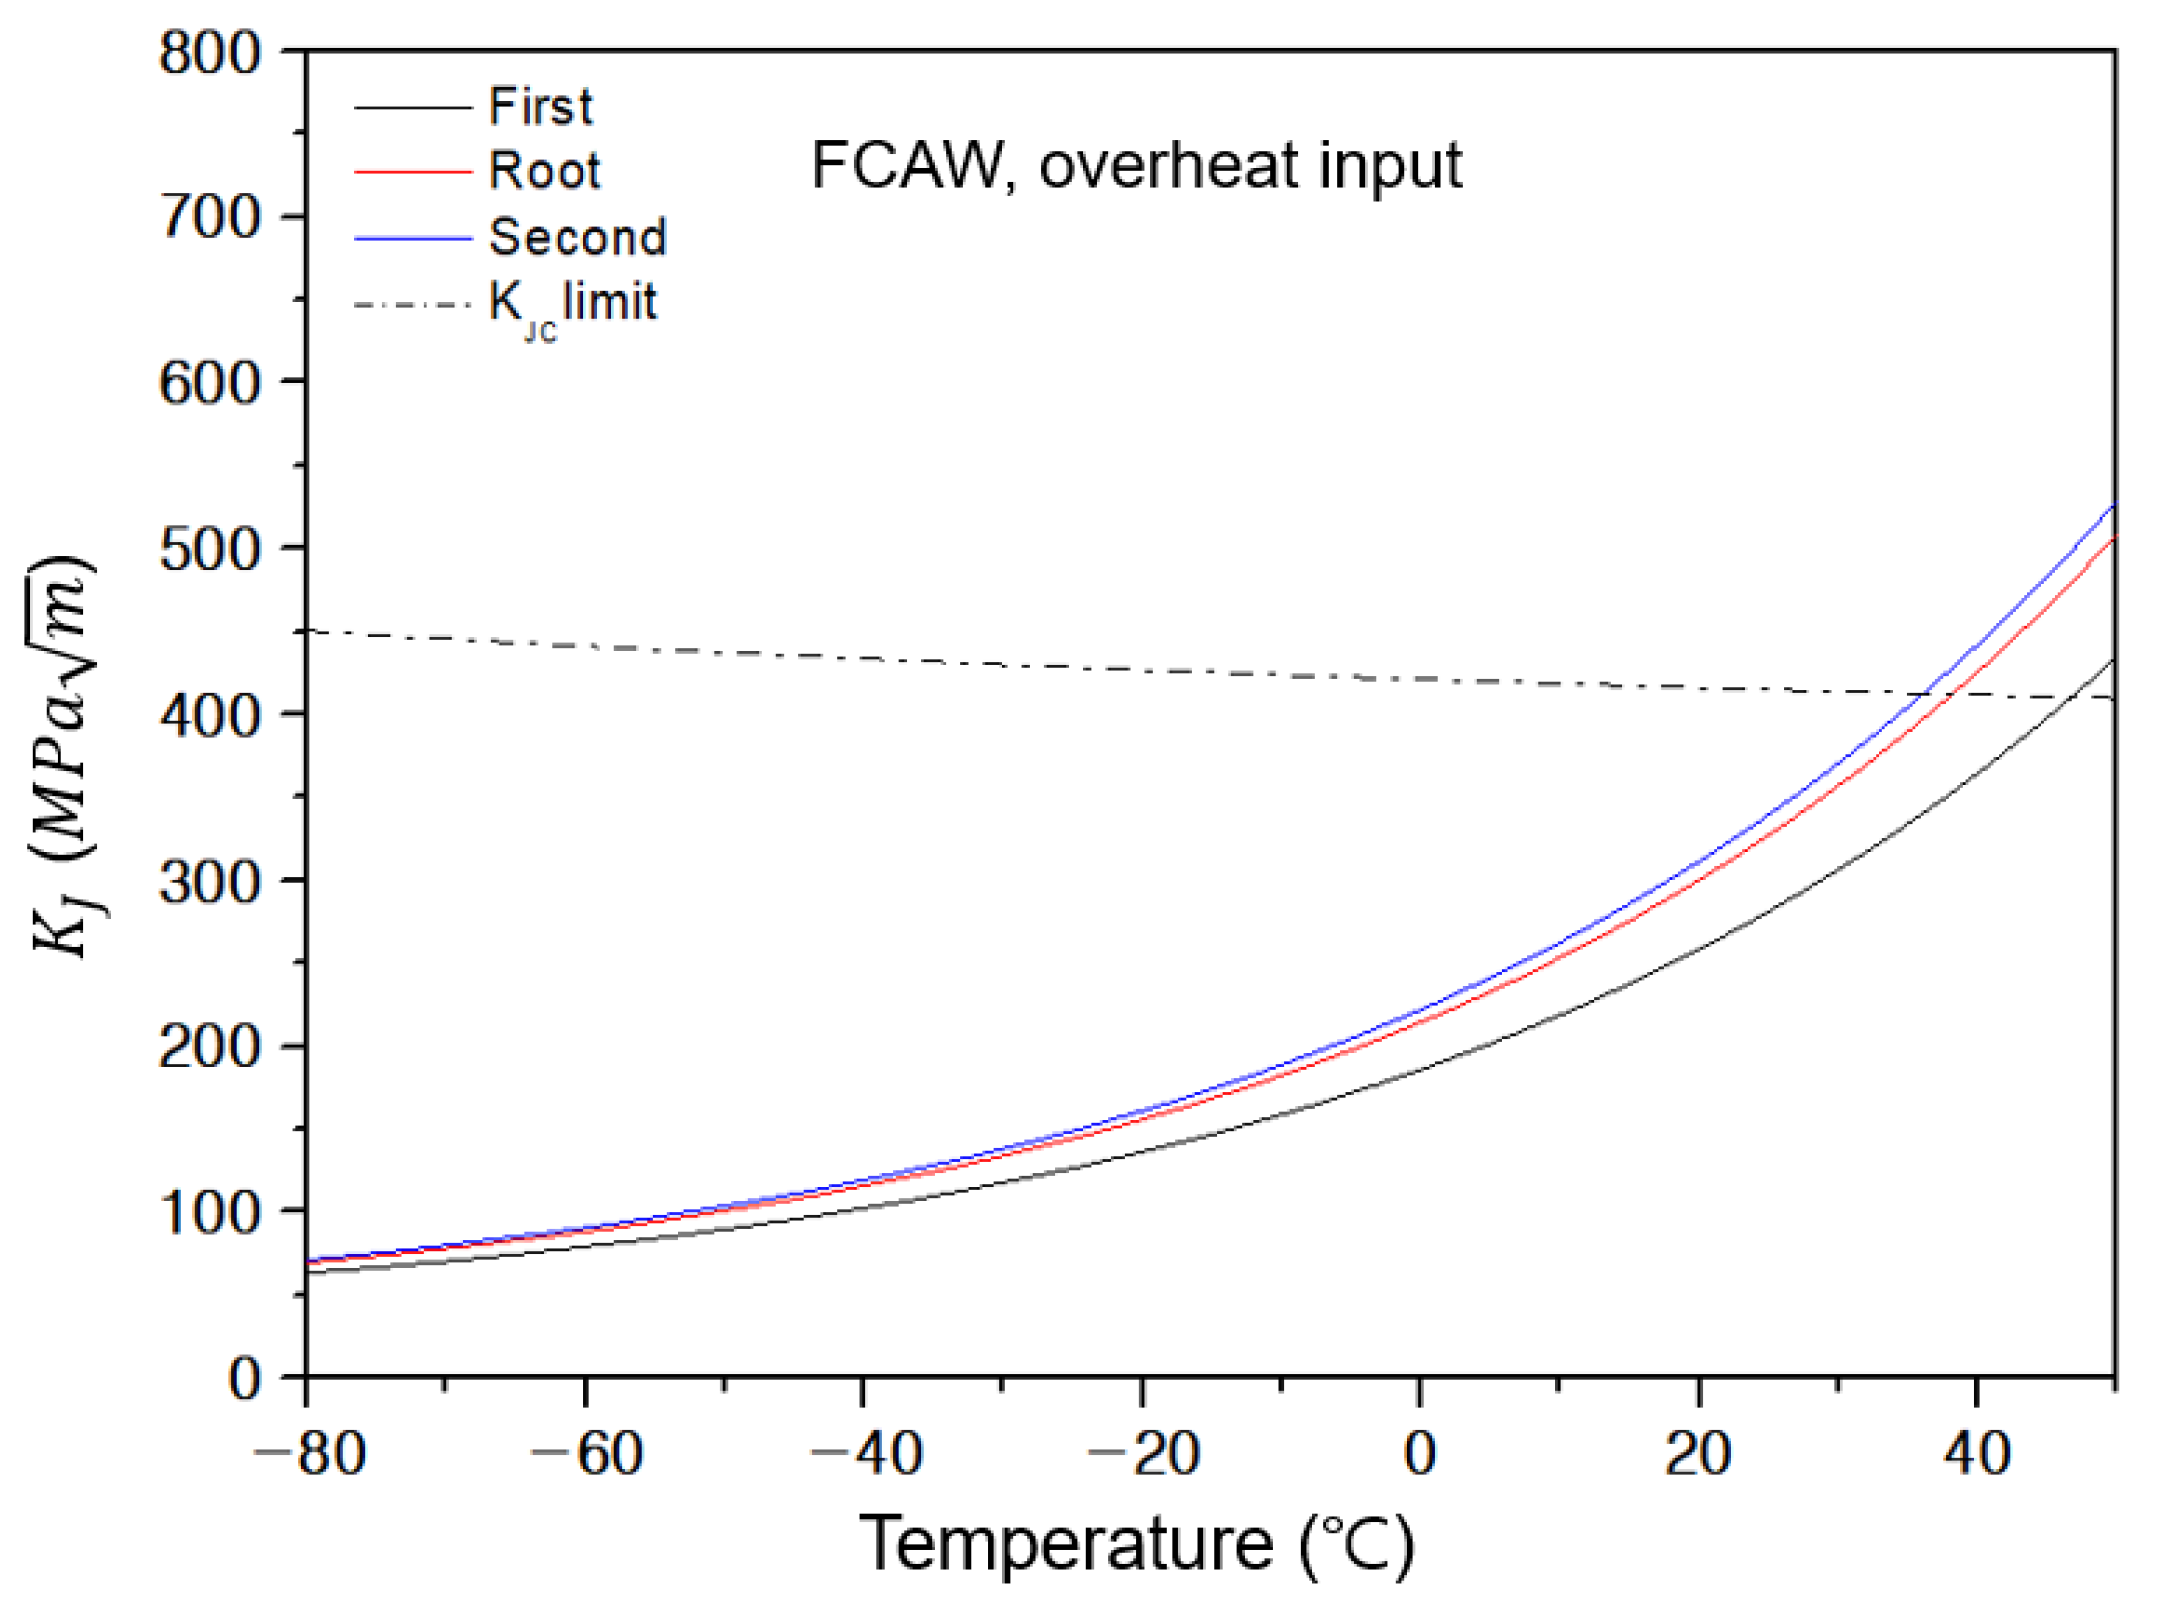
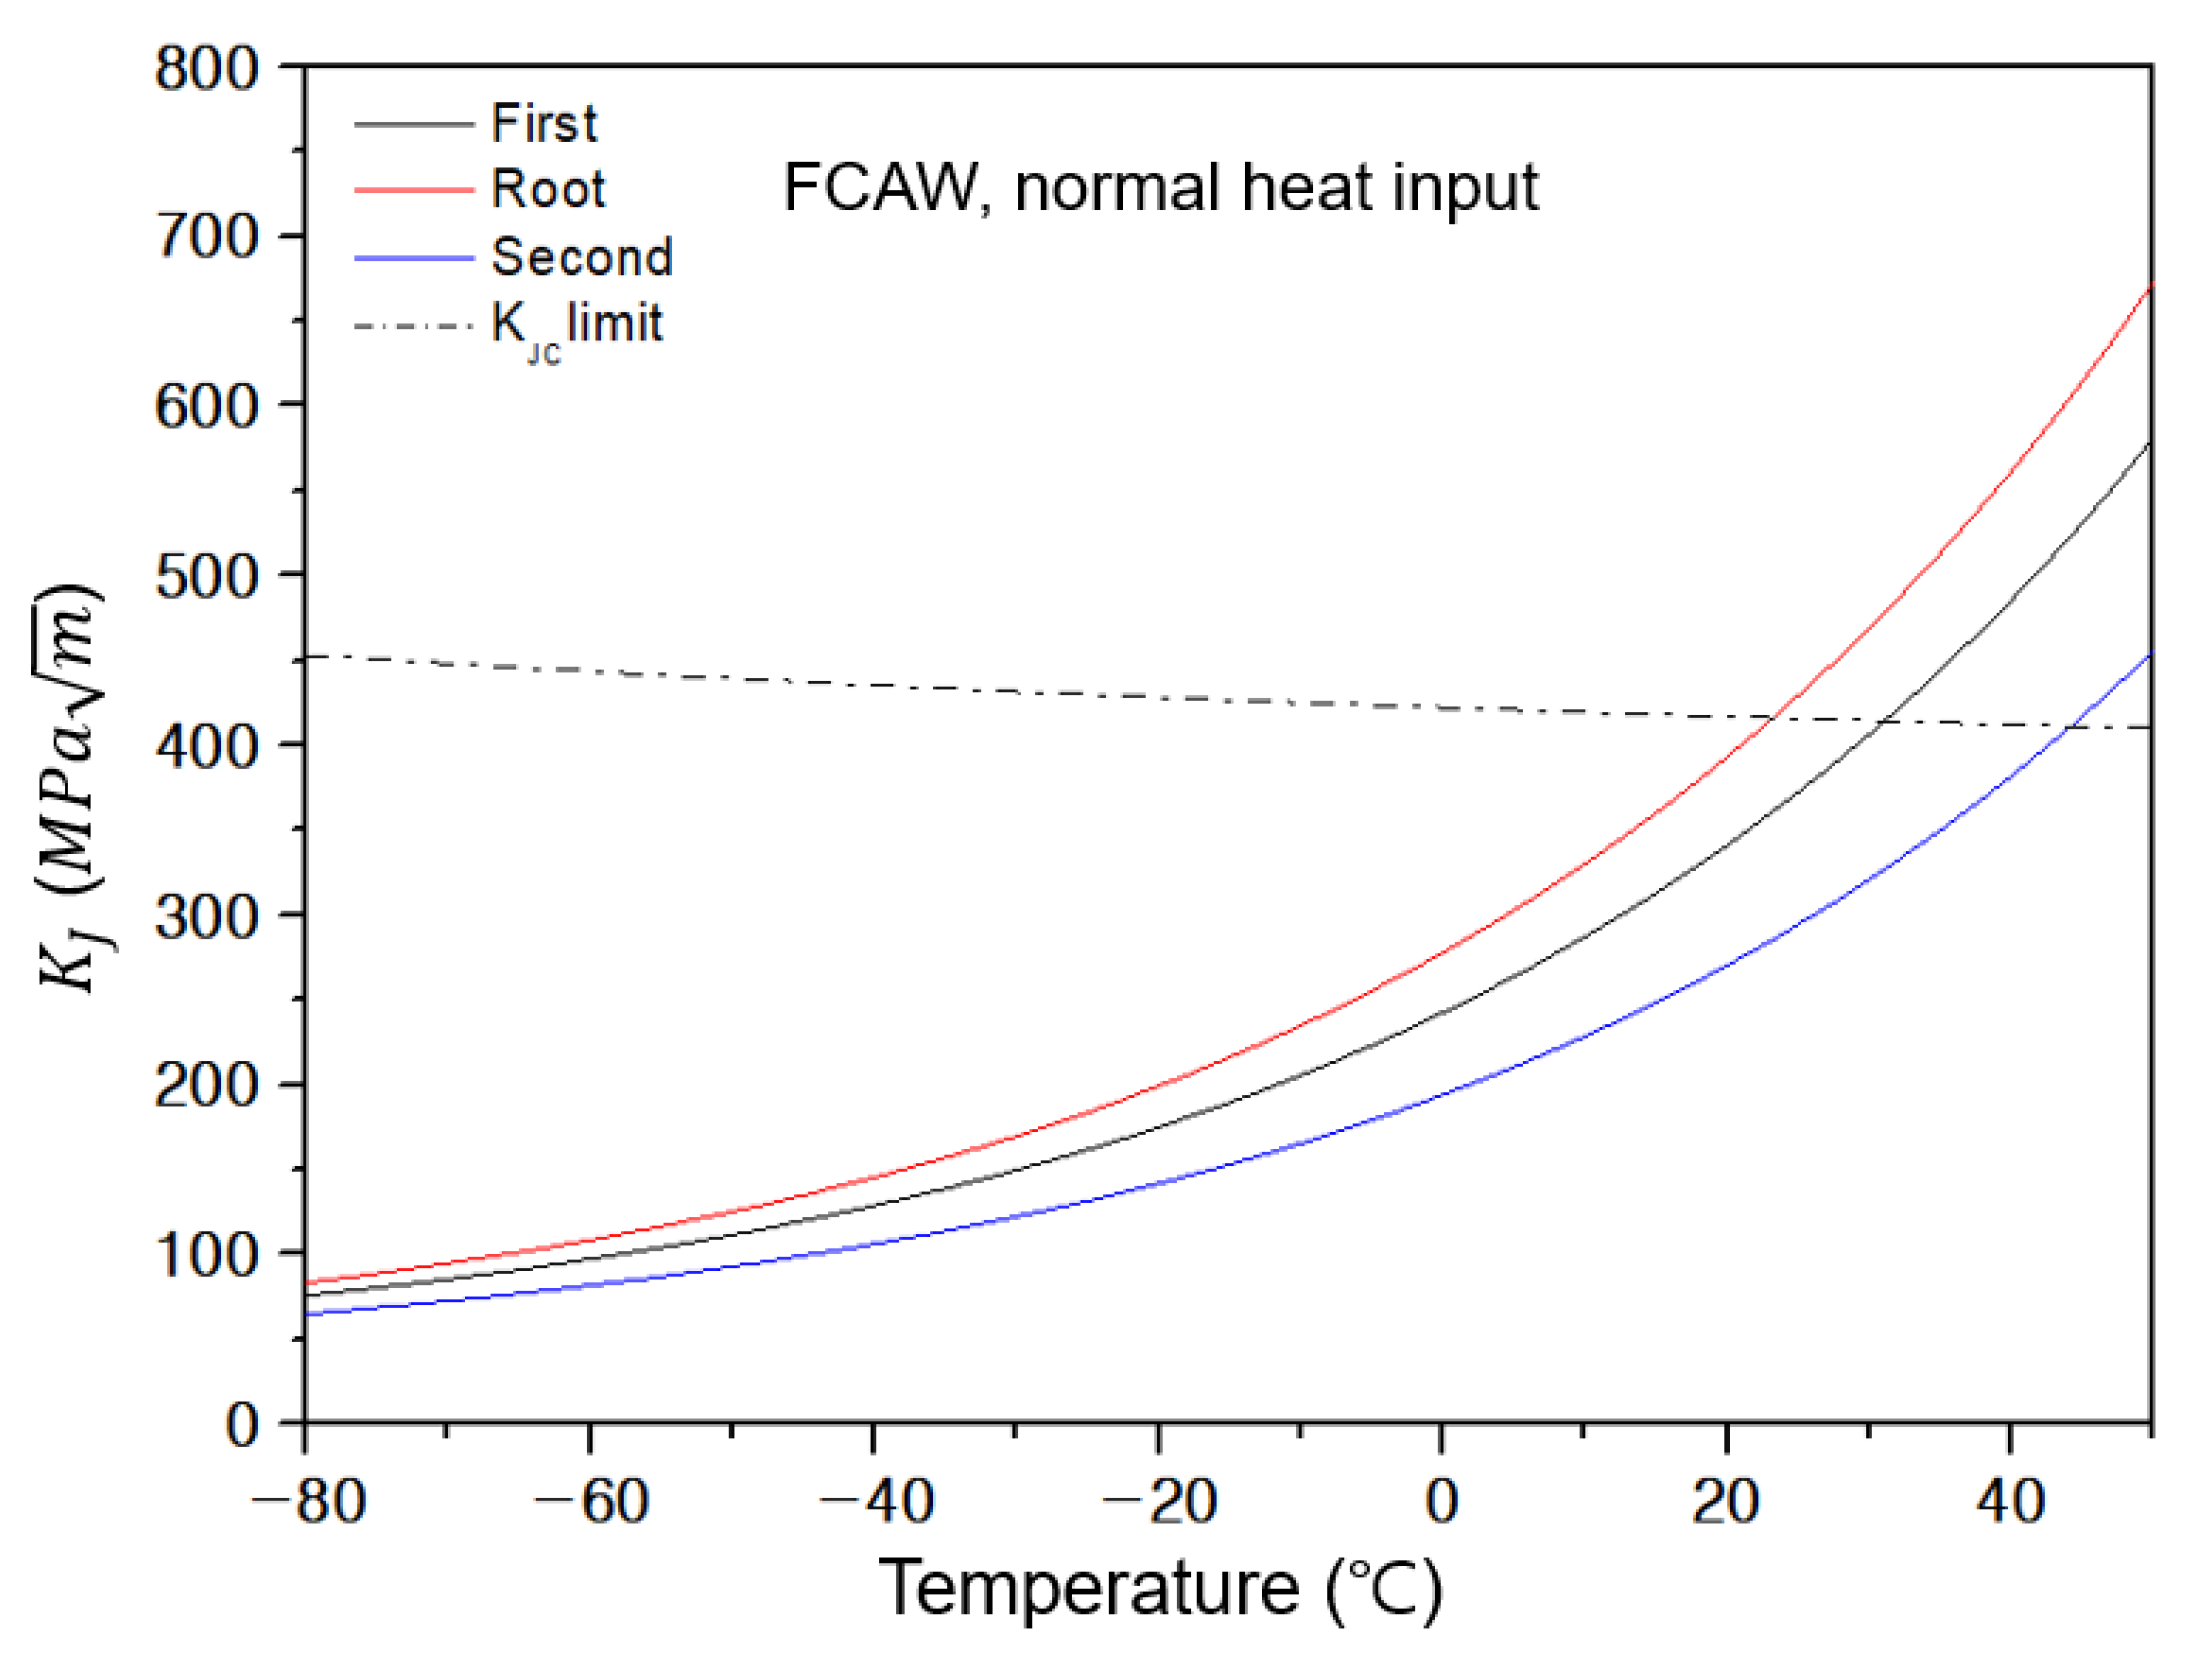
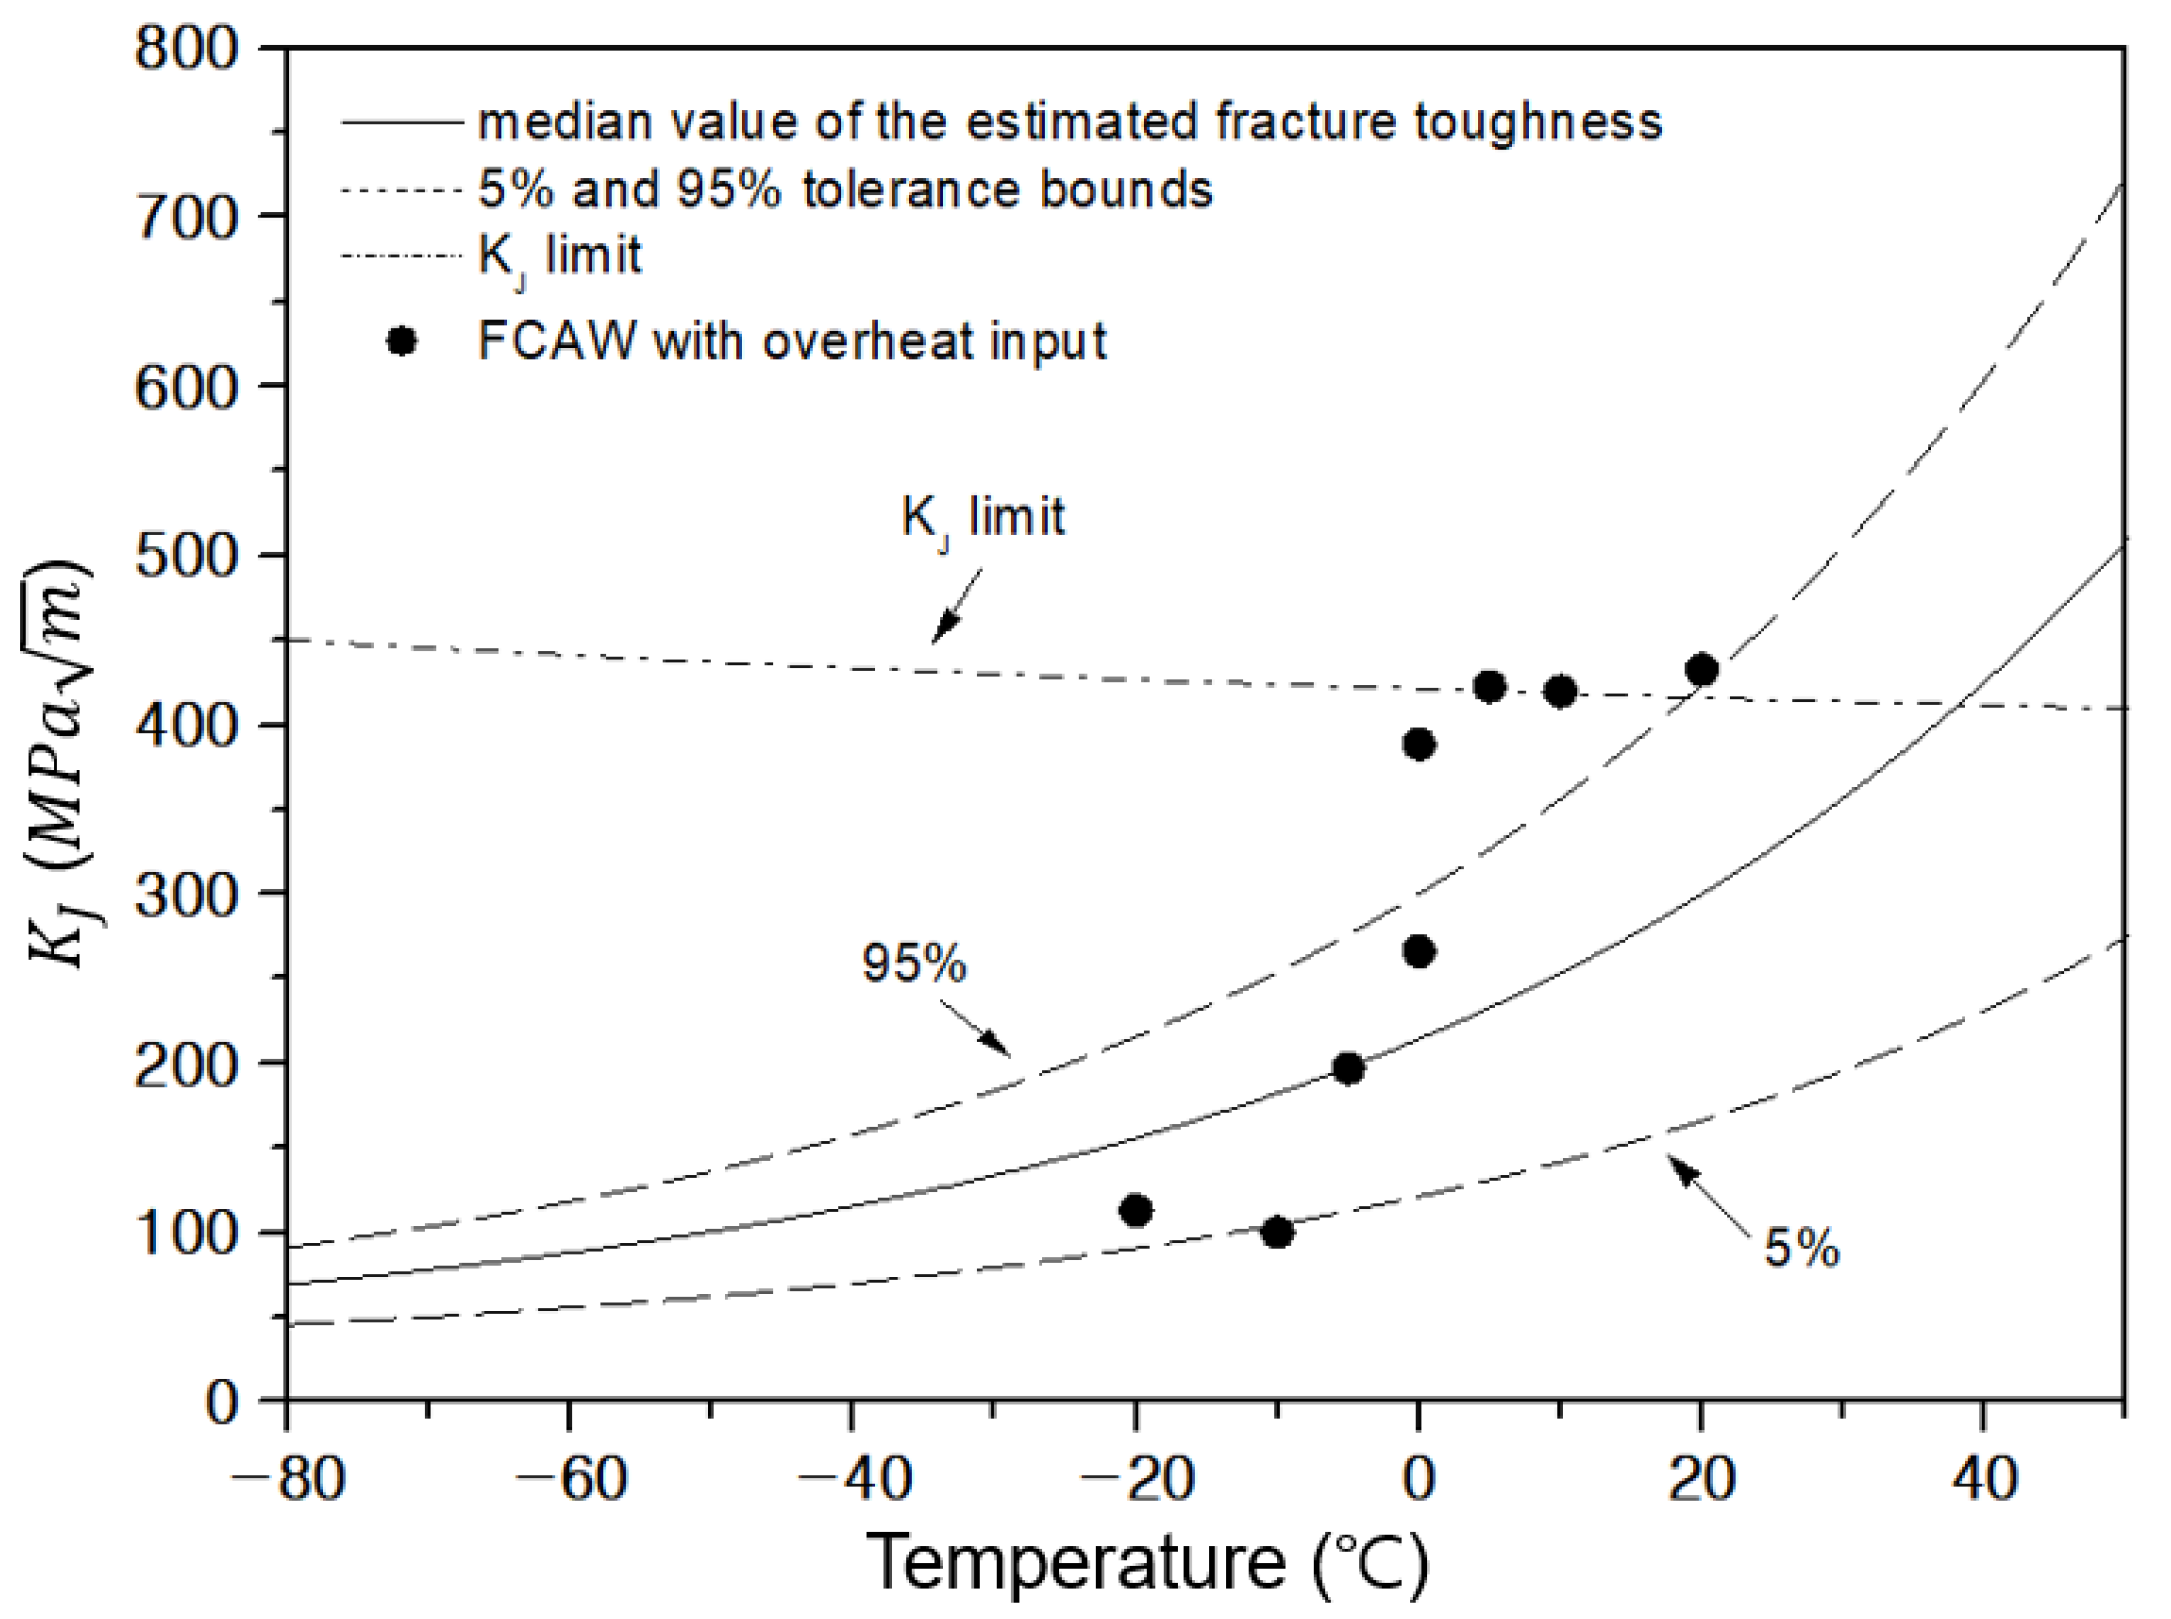
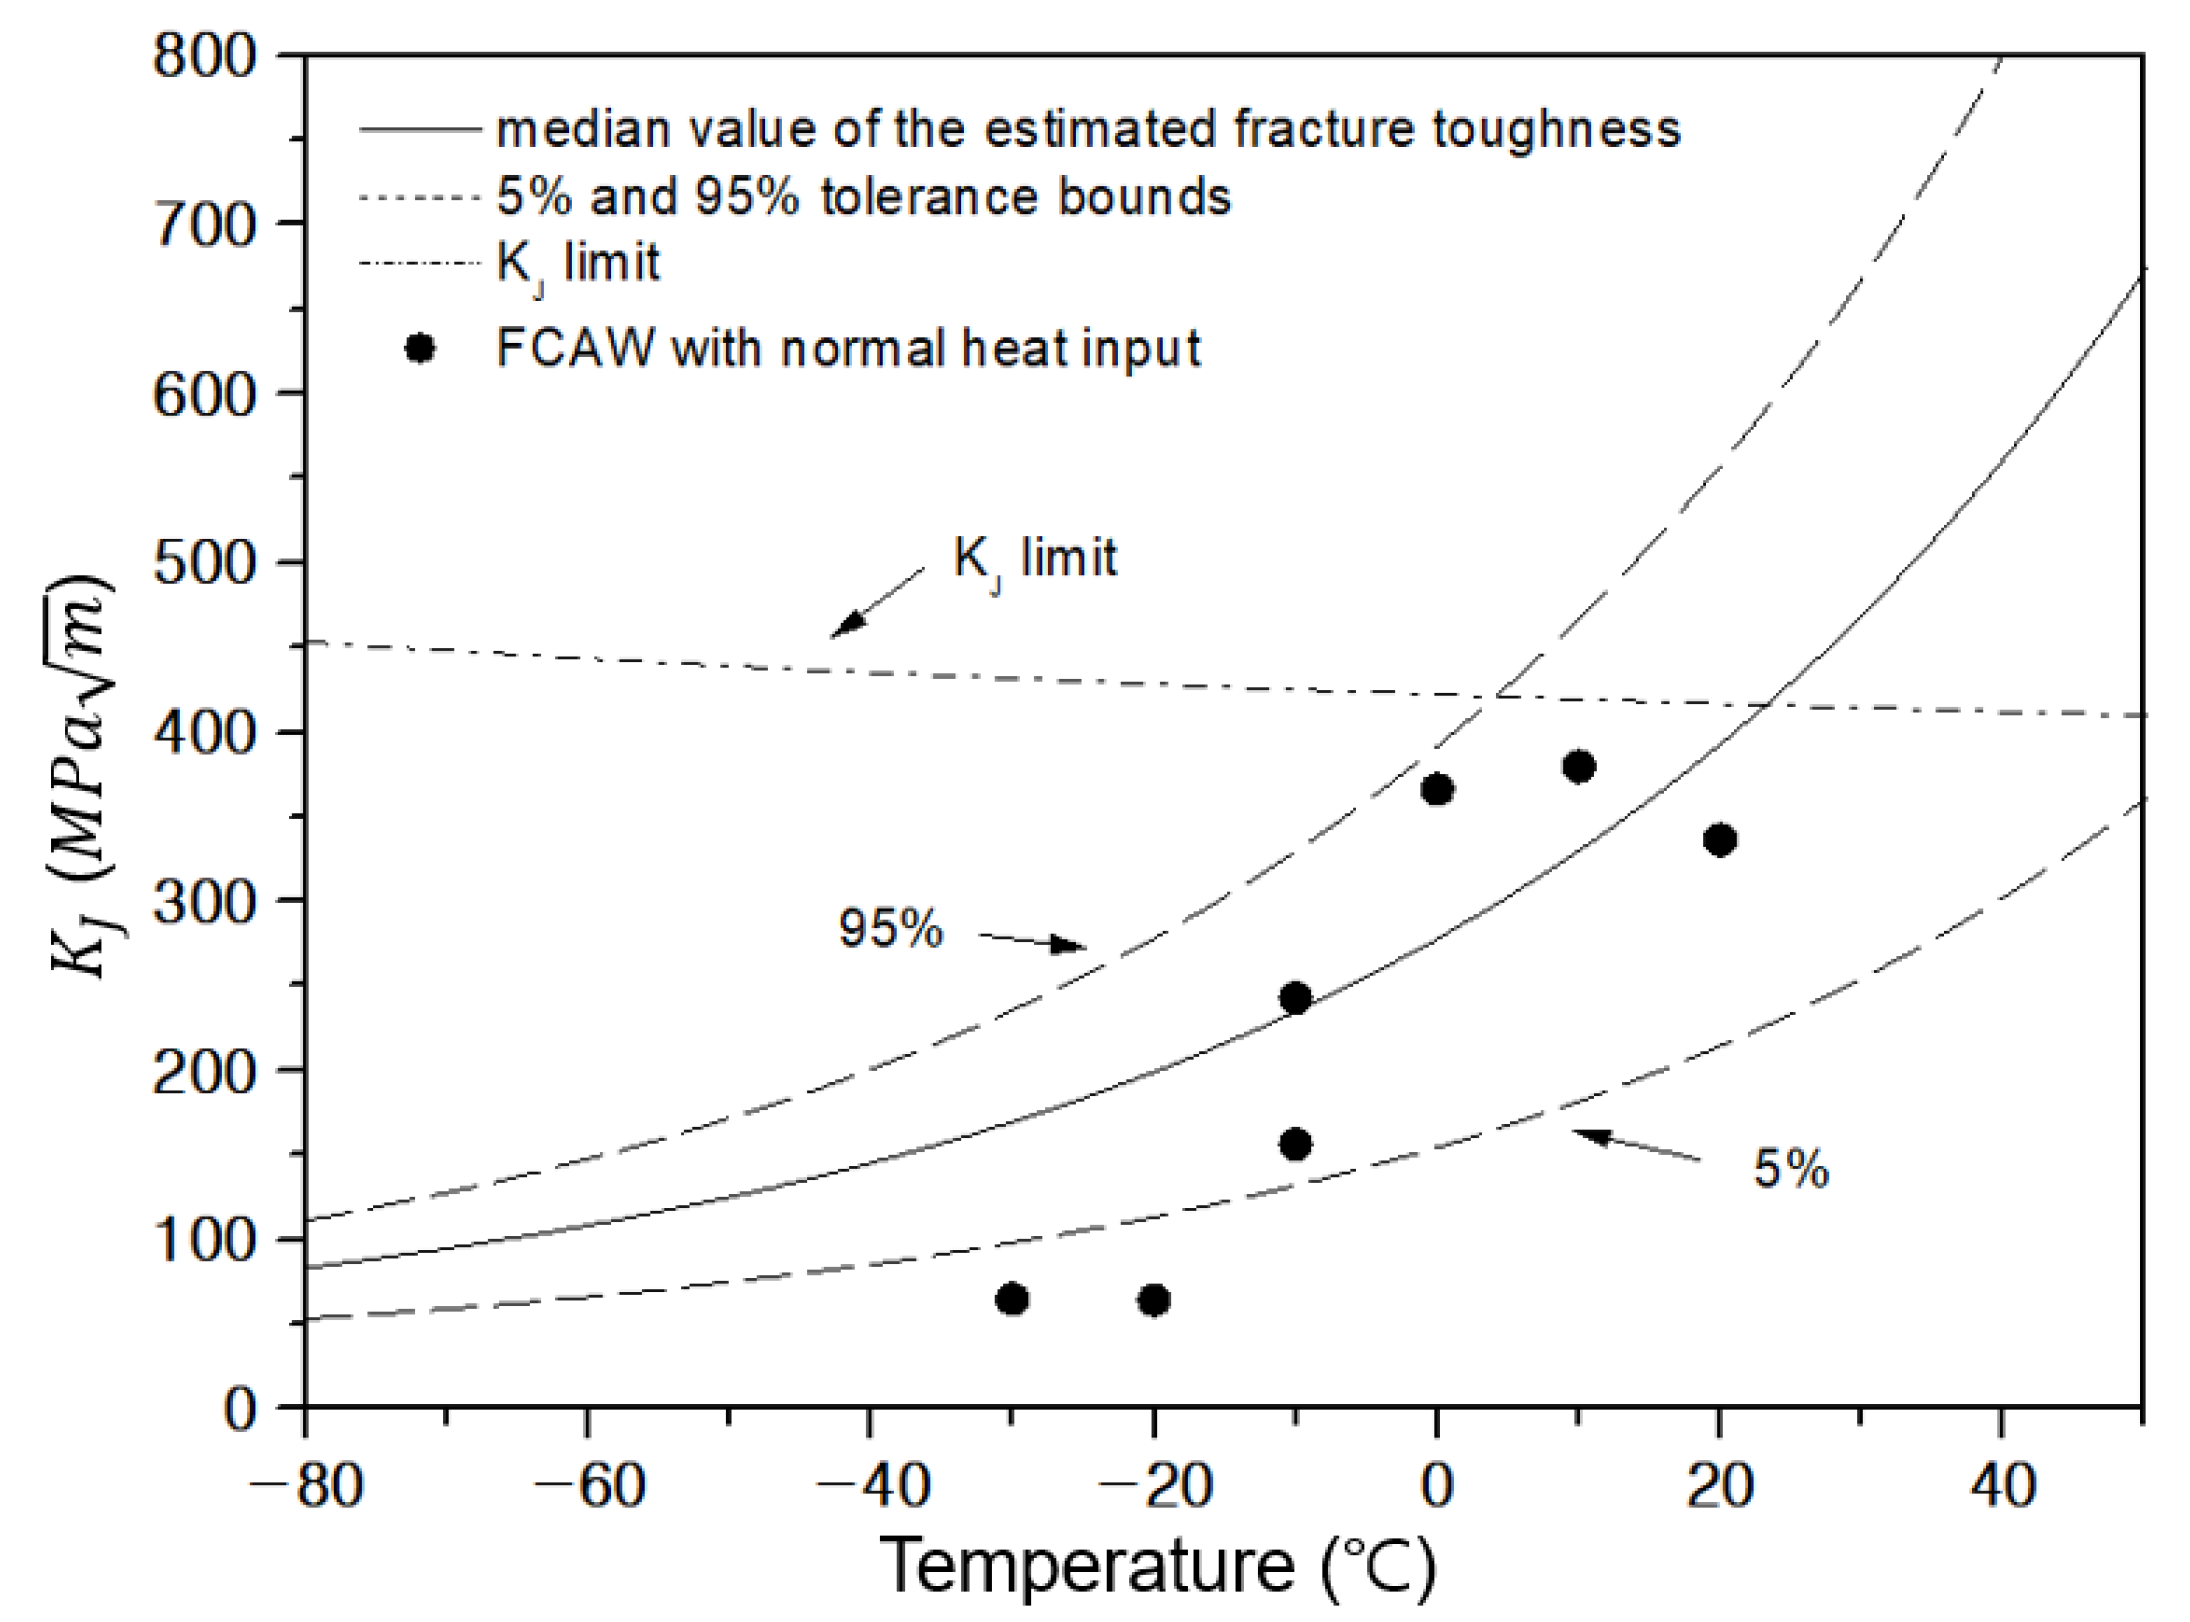
  • When the FCAW process is applied, master curves derived from the impact test results provide appropriate fracture toughness values in the transition region. Although there are some points outside the tolerance bounds, fracture toughness can be predicted simply from the impact test results, and the transition behavior can be efficiently evaluated.
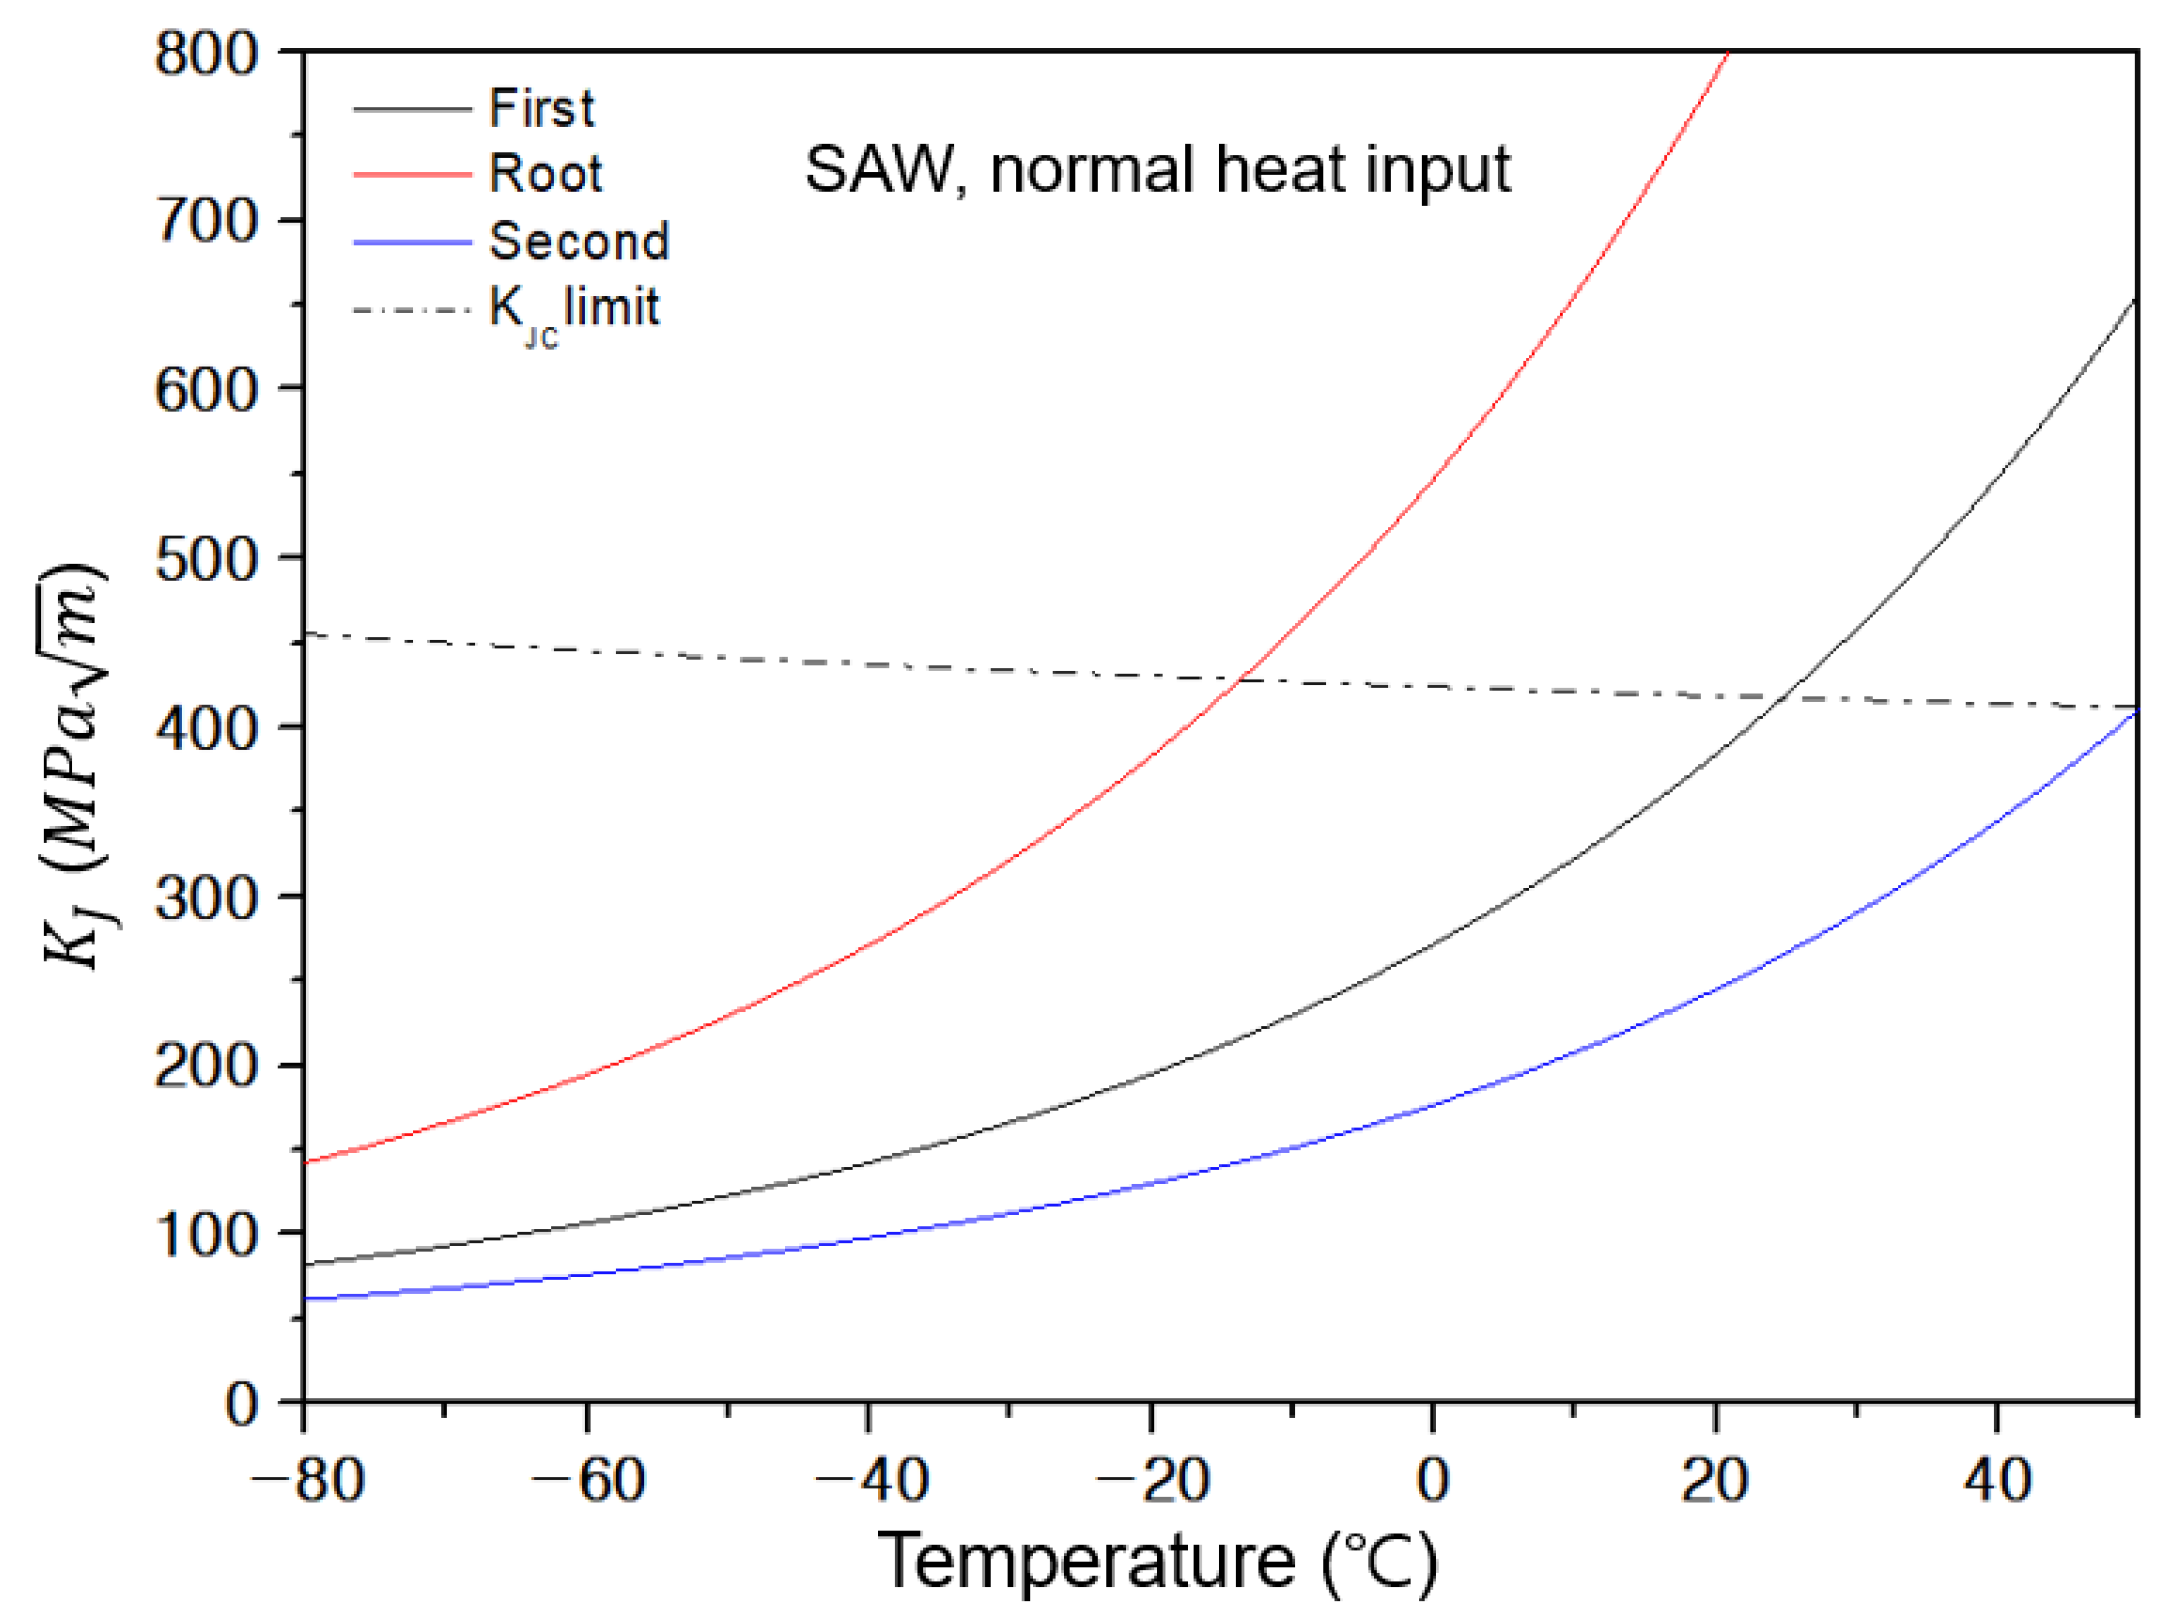
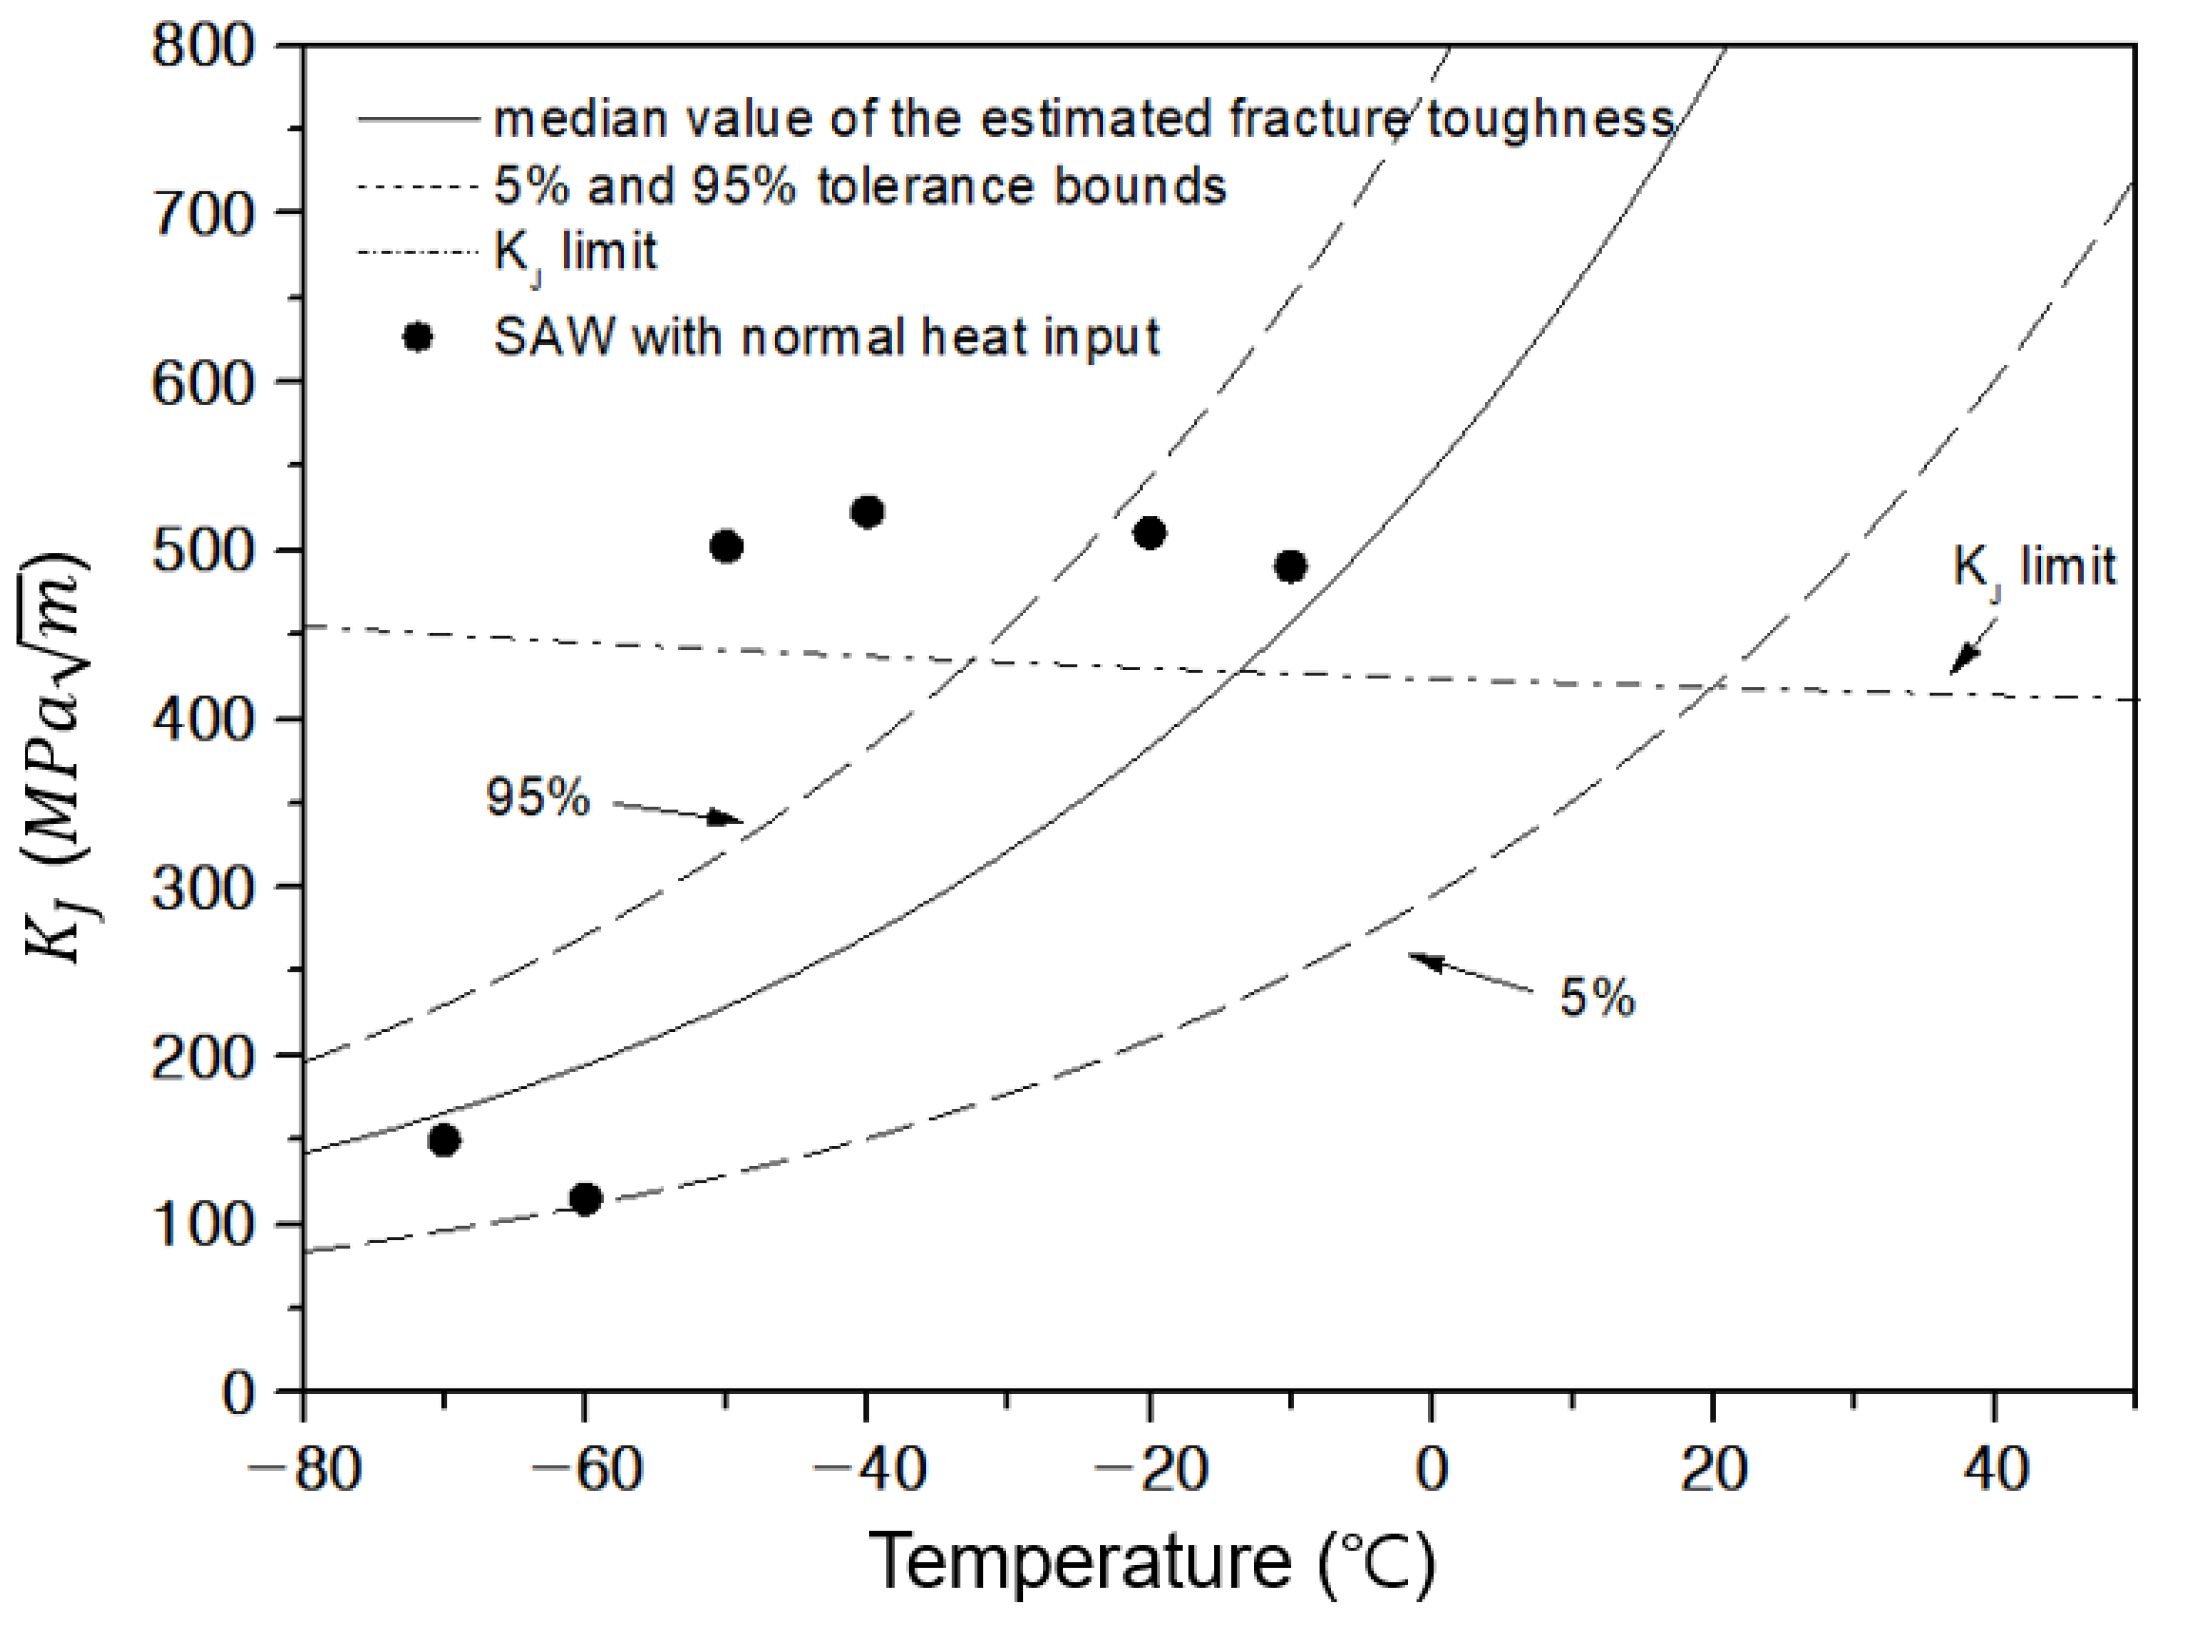
  • When the SAW process is applied, the master curve conservatively evaluates fracture toughness and shows a significant difference from the CTOD test result. Therefore, additional considerations reflecting various welding conditions are required for accurate fracture toughness estimation.

Author Contributions

Conceptualization, J.K. and M.K.; methodology, J.K. and J.P.; validation, J.P.; formal analysis, J.K.; investigation, J.P.; data curation, J.K.; writing—original draft preparation, J.K.; writing—review and editing, J.K. and M.K.; visualization, J.K.; supervision, M.K.; project administration, M.K. All authors have read and agreed to the published version of the manuscript.

Funding

This research received no external funding.

Institutional Review Board Statement

Not applicable.

Informed Consent Statement

Not applicable.

Data Availability Statement

The data presented in this study are available on request from the corresponding author.

Acknowledgments

This research was supported by Korea Institute for Advancement of Technology (KIAT) grant funded by the Korea Government(MOTIE) (P0017006, The Competency Development Program for Industry Specialist).

Conflicts of Interest

The authors declare no conflict of interest.

Nomenclature

B thickness (mm)
b 0 the size of uncracked ligament ( mm )
CV US the Charpy upper shelf energy (J)
δ crack tip opening displacement ( mm )
E elastic modulus ( MPa )
K J ( lim ) the maximum fracture toughness at which fracture takes place under small-scale yielding conditions ( MPa m )
K mat the estimate of the fracture toughness ( MPa m )
m constant expressed as the ratio of yield strength to tensile strength for steel
P f the probability of K mat being less than estimated value
σ U tensile strength
σ U , R tensile strength at room temperature
σ Y yield strength ( MPa )
σ Y , R yield stress at room temperature
T temperature ( ° C )
T 0 temperature for a median toughness of 100 MPa m in 25 mm thick specimen ( ° C )
T 27 J the temperature for 27 J measured in a standard Charpy impact specimen ( ° C )
T t transition temperature ( ° C )
ν Poisson’s ratio
CTODCrack Tip Opening Displacement
CVECharpy V-notch Energy
DBTTDuctile to Brittle Transition Temperature
FCAWFlux Cored Arc Welding
SAWSubmerged Arc Welding
SENBSingle Edge Notched Bend

Appendix A

Table A1. CTOD test results.
MaterialsForce TypeTemperature
(°C)
CTOD
(mm)
FCAW 1* F c −200.06
F c −100.05
F c −50.20
F c 00.36
F m 00.77
F m 50.91
F m 100.91
F m 200.97
FCAW 2* F c −300.02
F c −200.02
F c −100.12
F u −100.29
F m 00.67
F m 100.73
F m 200.58
SAW 2* F c −700.10
F c −600.06
F m −501.17
F m −401.29
F m −201.27
F m −101.19
1* overheat input, 2* normal heat input.

References

  1. Lee, J.S.; Kim, M.H. Strain-Based Failure Assessment Based on a Reference Strain Method for Welded Pipelines. J. OMAE 2020, 142, 041701. [Google Scholar] [CrossRef]
  2. BS 7448-1:1991; Fracture Mechanics Toughness Tests-Part1: Method for Determination of KIC, Critical CTOD and Critical J Values of Metallic Maeterials. British Standard Institution: London, UK, 1991.
  3. BS 7448-2:1997; Fracture Mechanics Toughness Tests-Part 2: Method for Determination of KIC, Critical CTOD and Critical J Values of Welds in Metallic Materials. British Standard Institution: London, UK, 1997.
  4. ASTM E1921-19A; Standard Test Method for Determination of Referece Temperature, T0, for Ferritic Steels in the Transition Range. ASTM International: West Conshohocken, PA, USA, 2019; T0.
  5. ISO 15653:2018; Metallic Materials—Method of Test for the Determination of Quasistatic Fracture Toughness of Welds. ISO: Geneva, Switzerland, 2018.
  6. Lee, J.H.; Shin, Y.T.; Kim, M.H. Validation of the Master Curve Approach Based on Charpy Impact Test with Groove Shapes. J. Weld. Join. 2019, 37, 539–546. [Google Scholar] [CrossRef] [Green Version]
  7. BS 7910: 2013; Guide to Methods for Assessing the Acceptability of Flaws in Metallic Structures. British Standard Institution: London, UK, 2013.
  8. BS 7910: 2019; Guide to Methods for Assessing the Acceptability of Flaws in Metallic Structures. British Standard Institution: London, UK, 2019.
  9. Pisarski, H.; Bezensek, B. Estimating Fracture Toughness from Charpy Data. In Proceedings of the ASME 2019 38th International Conference on Ocean, Offshore and Arctic Engineering, Glasgow, UK, 9–14 June 2019. [Google Scholar]
  10. Lee, J.H.; Kim, J.H.; Kim, M.H. Validation of the Master Curve Approach with Various Welding Conditions—Groove Shapes, Heat Inputs and Welding Processes. In Proceedings of the ASME 2020 39th International Conference on Ocean, Offshore and Arctic Engineering, Fort Lauderdale, FL, USA, 28 June–3 July 2020. [Google Scholar]
  11. Chao, Y.J.; Ward, J.J.D.; Sands, R.G. Charpy impact energy, fracture toughness and ductile-brittle transition temperature of dual-phase 590 Steel. Mater. Des. 2007, 28, 551–557. [Google Scholar] [CrossRef]
  12. Barbosa, V.S.; Ruggieri, C. Fracture toughness testing using non-standard bend specimens—Part II: Experiments and evaluation of T0 reference temperature for a low alloy structural steel. Eng. Fract. Mech. 2018, 195, 297–312. [Google Scholar] [CrossRef]
  13. Hadley, I.; Pisarski, H. Materials propertied for Engineering Critical Assessment: Background to the advice given BS 7910:2013. Int. J. PVP 2018, 168, 191–199. [Google Scholar]
  14. Barsom, J.M.; Rolfe, S.T. Correlation between KIC and Charpy V-Notch Test Results in the Transition-Temperature Range. In ASTM STP 466, 28, Impact Testing of Metals; American Society for Testing and Materials: Philadelphia, PA, USA, 1970; pp. 281–302. [Google Scholar]
  15. Wallin, K. A simple fracture mechanics based Charpy-V impact energy criterion for plastic collapse. Eng. Fract. Mech. 2020, 237, 107247. [Google Scholar] [CrossRef]
  16. Lucon, E.; Wallin, K.; Langenberg, P.; Pisarski, H. The Use of Charpy/Fracture Toughness Correlations in the Fitnet Procedure. In Proceedings of the OMAE2005 24th International Conference on Offshore Mechanics and Arctic Engineering, Halkidiki, Greece, 12–17 June 2005. [Google Scholar]
  17. Barbosa, V.S.; Godois, L.A.C.; Bianchi, K.E.; Ruggieri, C. Charpy impact energy correlation with fracture toughness for low alloy structural steel welds. Theor. Appl. Fract. Mech. 2021, 113, 102934. [Google Scholar] [CrossRef]
  18. ASTM E23-18; Standard Test Method for Notched Bar Impact Testing of Metallic Materials. ASTM International: West Conshohocken, PA, USA, 2018.
  19. ASTM E8/E8M-16a; Standard Test Methods for Tension Testing of Metallic Materials. ASTM International: West Conshohocken, PA, USA, 2016.
  20. Oldfield, W. Fitting curves to toughness data. J. Test. Eval. 1979, 7, 326–333. [Google Scholar]
Figure 1. Charpy impact test specimen. Reprinted with permission from Ref. [18]. 2018, ASTM International.
Jmse 10 01066 g001
Figure 2. CTOD test specimen. Reprinted with permission from Ref. [2]. 1991, BSI.
Jmse 10 01066 g002
Figure 3. Macrostructure of weldment: (a) FCAW with overheat input condition; (b) FCAW with normal heat input condition; (c) SAW with normal heat input condition.
Jmse 10 01066 g003
Figure 4. Schematic diagram of the welded panel and test specimen.
Jmse 10 01066 g004
Figure 5. Schematic diagram of sample location for Charpy impact specimen.
Jmse 10 01066 g005
Figure 6. Charpy impact test results: (a) Charpy transition curve according to heat input; (b) Charpy transition curve according to welding method.
Jmse 10 01066 g006
Figure 7. CTOD test results: (a) CTOD transition curve according to heat input; (b) CTOD transition curve according to welding method.
Jmse 10 01066 g007
Figure 8. Comparison of ductile to brittle transition behavior according to test method.
Jmse 10 01066 g008
Figure 9. Relationship of DBTT between CTOD and Charpy impact tests.
Jmse 10 01066 g009
Figure 10. Master curve for FCAW, overheat input condition according to sample location.
Jmse 10 01066 g010
Figure 11. Master curve for FCAW, normal heat input condition according to sample location.
Jmse 10 01066 g011
Figure 12. Master curve for SAW, normal heat input condition according to sample location.
Jmse 10 01066 g012
Figure 13. Master curve for FCAW, overheat input condition with CTOD test results.
Jmse 10 01066 g013
Figure 14. Master curve for FCAW, normal heat input condition with CTOD test results.
Jmse 10 01066 g014
Figure 15. Master curve for SAW, normal heat input condition with CTOD test results.
Jmse 10 01066 g015
Table 1. Chemical composition of the base metal and weld metal.
(wt.%)CSiMnpSCuNiMoTiAlCrCeV
B.M.0.160.331.380.030.010.350.750.080.020.012-0.41-
FCAW 1*0.0430.3711.3300.0120.0120.0381.3310.0080.043-0.038-0.017
FCAW 2*0.0470.3011.2180.0140.0170.0511.2040.0120.040-0.024-0.016
SAW 2*0.0770.3071.3620.0150.0110.1220.1510.0050.0140.0190.029-0.005
1* overheat input, 2* normal heat input.
Table 2. Welding parameters used for welding process.
Welding MethodGroove
Angle (°)
Root Face
(mm)
Root Gap
(mm)
Heat Input
(kJ/cm)
Welding
Current (A)
Welding
Voltage (V)
FCAW 1*600~36>4538040
FCAW 2*600~30~325~3032036
SAW 2*60Min. 60~230~4566032
1* overheat input, 2* normal heat input.
Table 3. Mechanical properties of API 2W Gr.50 steel at room temperature.
MaterialYield Strength
(MPa)
Tensile Strength
(MPa)
Elastic Modulus
(GPa)
B.M345448205
FCAW 1*576.4621.7195
FCAW 2*539.4601.3209
SAW 2*541.8583.8210
1* overheat input, 2* normal heat input.
Table 4. Hyperbolic tangent curve fit coefficient of impact test results according to sample location.
MaterialsSample LocationABC T t T 27 J
FCAW 1*First84.770.57.9−37.5−46.6
Root82.283.234.4−27.5−55.0
Second85.876.218.0−38.8−57.3
FCAW 2*First84.089.736.7−32.2−59.0
Root94.8107.544.1−33.5−66.3
Second75.072.129.9−22.5−46.5
SAW 2*First79.984.041.0−36.0−66.4
Root119.0107.433.9−61.1−104.6
Second75.961.15.7−35.2−41.4
1* overheat input, 2* normal heat input.
Table 5. Hyperbolic tangent curve fit coefficient of CTOD test results.
MaterialsABC T t
FCAW 1*0.510.454.68−0.7
FCAW 2*0.340.320.90−9.6
SAW 2*0.670.590.69−50.9
1* overheat input, 2* normal heat input.
Publisher’s Note: MDPI stays neutral with regard to jurisdictional claims in published maps and institutional affiliations.

