Article

A New Study on the Fatigue Properties of SA Weld Joints by Considering the Effects of Welded Bead Shape

1
Material & Coating Research, Samsung Heavy Industry Co., Ltd., Geoje 53261, Korea
2
Welding Research, Samsung Heavy Industry Co., Ltd., Geoje 53261, Korea
3
Steel Business Division, POSCO, Incheon 21985, Korea
4
Corporate Chief Engineer’s Office, ABS Class, Spring, TX 77389, USA
5
New Construction Team, BV Class, Busan 47351, Korea
6
Production Support Team, DNV Class, Busan 48120, Korea
7
Department of Naval Architecture and Ocean Engineering, Pusan National University, Busan 46241, Korea
*
Author to whom correspondence should be addressed.
J. Mar. Sci. Eng. 2022, 10(10), 1527; https://doi.org/10.3390/jmse10101527
Submission received: 29 September 2022 / Revised: 12 October 2022 / Accepted: 13 October 2022 / Published: 18 October 2022
(This article belongs to the Special Issue Fatigue and Fracture Mechanics of Marine Structures)

Abstract

:
Tandem SAW (Submerged Arc Welding) is one welding process that has been applied to maximize the welding productivity at the panel stage in ship building field. The weld bead profiles produced by Tandem SA welding exceed the acceptance criteria specified in some international regulations, such as AWS D1.1, ISO 5817 and NORSOK M-101. These regulations limit the applicable weld bead profiles, especially weld bead height, regardless of any consideration of design category. The fundamental reason for the limitation of weld bead profiles is related to the weldment fatigue properties. In this regard, we have investigated the effect of weld profiles on fatigue properties. The effect of weld bead profiles on fatigue properties has been experimentally verified and statistically analyzed, and new criteria for weld bead profiles which satisfy E curve as the design S-N curve are proposed for tandem SA welding.

1. Introduction

Arc welding processes are predominantly used to join two steel members together in the fabrication of ships and offshore structures. Two adjacent steels, which will be joined by welding, are generally beveled by machining or cutting to the appropriate configuration in preparation for arc welding, as shown in Figure 1.
As the size of ships and offshore structures has increased, the thickness of the steel used in the construction has consequently increased. As the use of heavy thickness plates increases, welding productivity for the heavy thickness plate became one of the most important factors in the overall work processes. To respond to this, the tandem SA welding process has been improved and applied to the panel stage for welding of plate to plate at the beginning phase of all construction operations.
The maximized welding productivity can be achieved by tandem SA welding because superior deep penetration with a high welding speed can be obtained utilizing high welding current and controlled heat input. Therefore, weld joint configuration with increased root face dimension than that of other welding processes can be applied without back gouging. Figure 2 shows the typical weld joint configurations for tandem SA welding and Figure 3 shows the Tandem SAW equipment at the panel stage.
Although tandem SA welding has many advantages, such as high productivity, high welding speed and high weld quality, its application is somewhat limited due to the regulation for weld bead profiles.
Some international regulations, such as AWS D1.1, ISO 5817, NORSOK M-101 and IACS Rec.47, limit the applicable maximum weld bead height and/or permissible weld profiles [1,2,3,4]. For example, AWS (American Welding Society) D1.1 specifies the maximum allowable bead reinforcement (height) of 3 mm for weld in base material thickness of 25 mm or less. However, the weld bead height of Tandem SAW generally exceeds 3 mm, especially at the second side welding.
It is well known that the fatigue behavior is influenced by the geometry of the welded joint, the mechanical properties of base material, the angular distortion by welding, the misalignment between members, and weld profiles, including weld toe angle and radius, weld bead height and so on. Numerous studies have been conducted to investigate the effect of each factor or multiple factors on fatigue behavior of the welded joints [5,6,7,8,9,10,11]. Based on the results of those studies, IIW (International Institute of Welding) recommends “Fatigue resistance S-N curve for steel, normal stress, standard application” as per Figure 4 [12]. The Class societies’, the owners and designers adopt the same S-N curve as recommended by IIW.
Each S-N curve in Figure 4 is basically classified by structural detail and includes the influence of stress concentration by notch effect, metallurgical conditions, fusion welding processes and so on. However, the S-N curve does not represent a specific welding process and weld bead profiles, etc. that can influence the fatigue behavior.
The weld bead produced by the tandem SA welding process is much more uniform than other welding processes such as FCAW, GMAW and SMAW, with nearly complete uniformity. And there is almost no valley between weld ripples on the bead surface, which can increase the stress concentration by the notch effect [13]. This means that the fatigue behavior of weldments by tandem SA welding may be different from the S-N curve proposed by IIW.
As a result of checking the previous papers, the stress concentration factor (SCF) was analyzed through FE analysis after measuring the bead shape for fillet joint [14,15,16,17], and some papers also verified the relationship between fatigue properties and bead shapes [18,19]. In addition, other paper researched the relationship between fatigue properties and bead shapes for butt welding joints of laser welding on thin plates [20]. There was a paper that that compared the SCF, in accordance with bead shapes, with FE analysis results [21].
Therefore, in this study, it has been experimentally investigated to verify the effect of weld bead profiles produced by Tandem SA welding on fatigue behavior. The experimental research and statistical analysis for the test results were carried out to assess the correlation between weld profiles and fatigue properties.
This study was carried out through joint research project (JRP) together with class societies, such as ABS (America), BV (France), DNV (Norway) and Total (one of the major oil companies).

2. Experimental Details

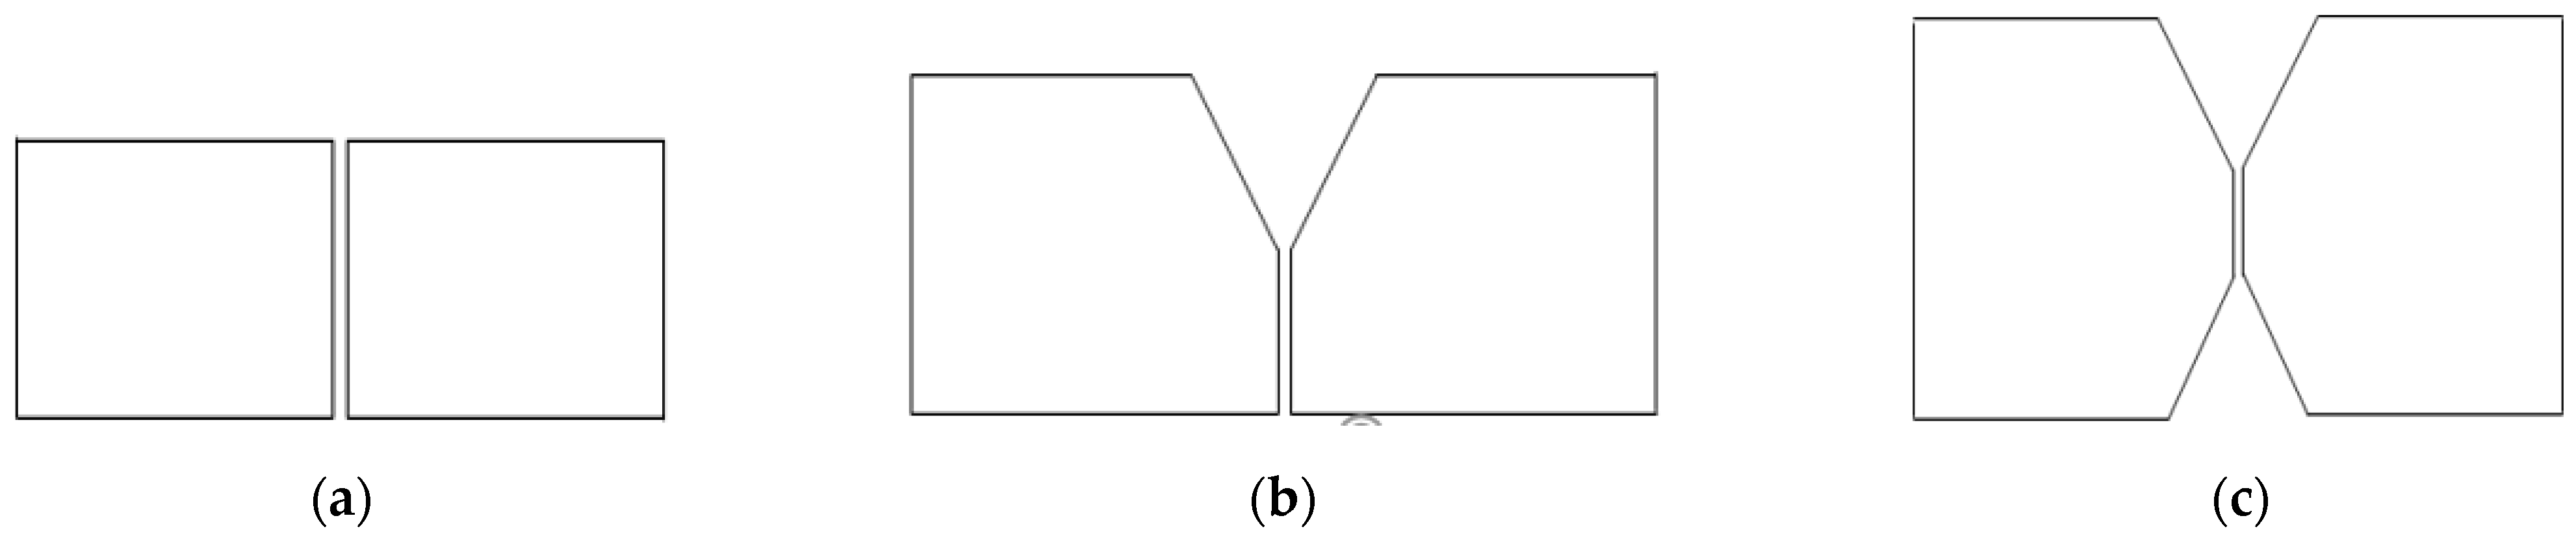
2.1. Test Coupons and Welding Parameters

D, DH36 and EH36 grade steels specified in class society rule were used and the thicknesses selected were 20, 25, 30 and 40 mm. Welding test coupons were prepared based on base material thickness as indicated in Figure 5. That is, I groove for 20 and 25 mm thickness, Y groove for 30 mm thickness and double Y groove for 40 mm thickness.
AWS classification of the welding consumables used in the study was F7A(P)8—EH14 of AWS A 5.17 and the welding wire diameter was 4.8 mm. Tandem SA welding with two welding wires was applied. A DC (+) power source for the leading wire and an AC power source for the trailing wire were used.
Twenty-three types of test coupons were prepared and welded with varying welding parameters to create the different weld bead profiles. The intention and the methods used for each test number are shown in Table 1.

2.2. Measurement of Weld Bead Profiles

The main purpose of this study is to verify the effect of weld bead profiles on fatigue properties of welded joints. The weld profiles include the weld bead height and width, toe angle, angular distortion, trough depth at the weld toe and the radius at the weld toe.
Various tools and methods may be used to measure the weld bead profiles. The weld bead height and width can be easily measured but it is impossible or very difficult to measure them other than these two at the production stage. Therefore, various measuring methods were applied, as shown in Table 2, to verify the effective methods in production.
The definition of each measuring item is shown in Figure 6.
There is no internationally recognized standard that covers measuring methods of the weld toe angle, trough depth and radius at the weld toe and angular distortion. Therefore, new measuring methods were designed and applied for the accurate measurement and comparison between the newly designed measuring methods. Three kinds of measuring methods of a 3D Scan, templates and a videometer were applied to measure toe angle.

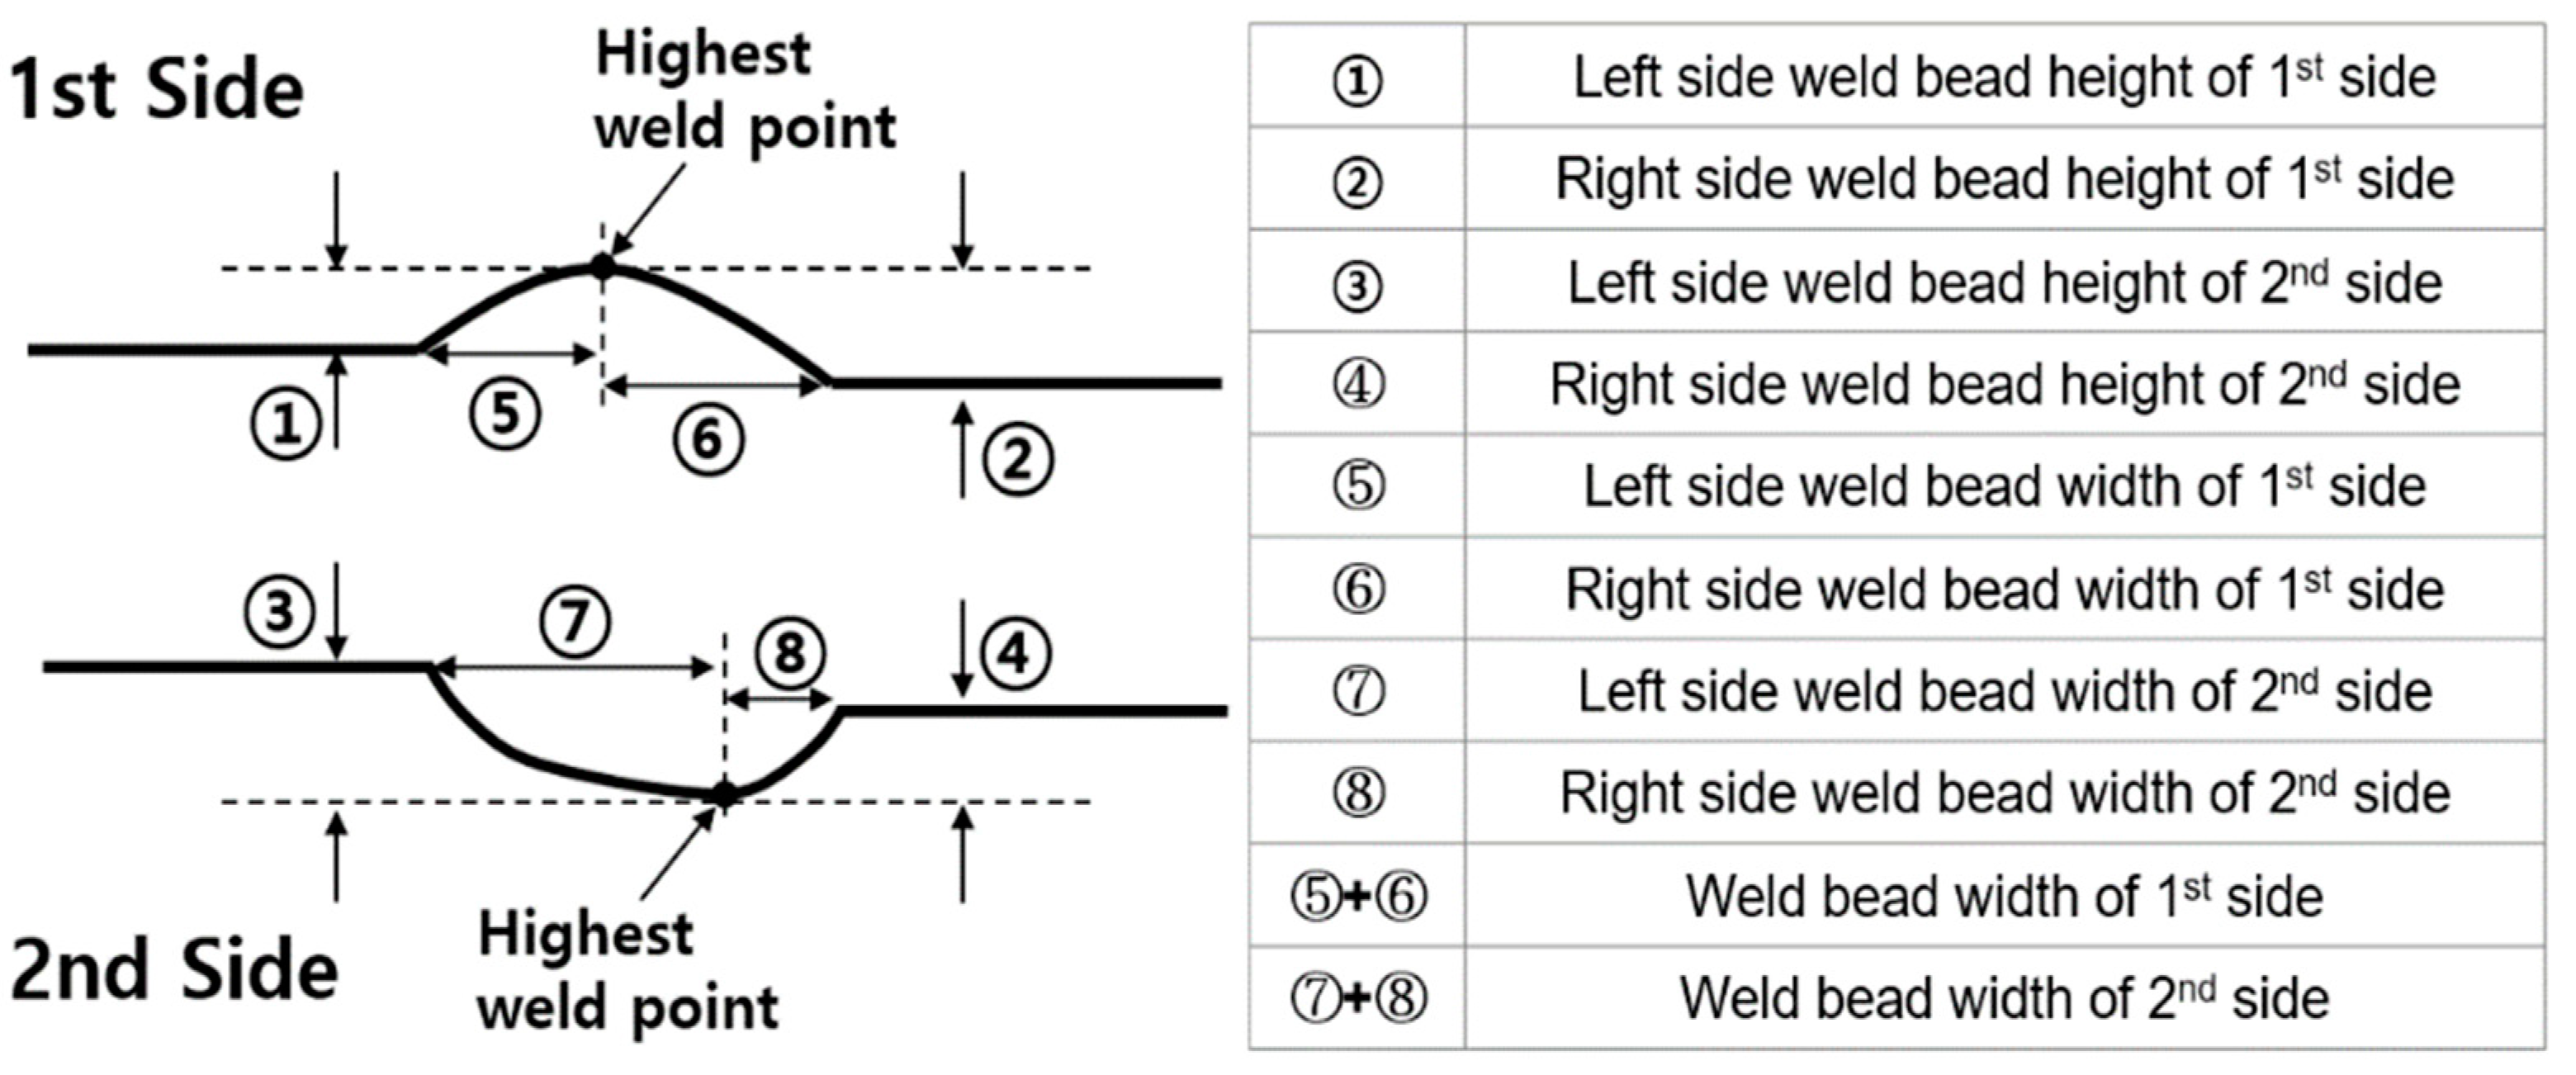
2.2.1. Measurement of Bead Height and Width on the Test Coupon

The weld bead height and width were measured on the test coupons, as shown in Figure 7.

2.2.2. Measurement of Toe Angle by Using the Template

New templates were designed to measure the toe angle at eight points of each fatigue specimen prior to the fatigue test, as shown in Figure 8.
Nine kinds of templates were designed and developed to measure the toe angles between 115° to 155° with 5° intervals. Figure 9 shows the shape of the templates and the measuring methods.
The toe angles were measured with each newly designed template. The toe angle could not be measured accurately because the template was designed with 5° intervals. Therefore, the average value between two templates (a lower angle template and a higher angle than the actual toe angle) was calculated and used for analysis.

2.2.3. Measurement of Toe Angle by Using a Videometer

A videometer (Accura III Model, manufactured by the Seven Ocean Company) was used to measure the toe angle of the fatigue specimen at eight points prior to the fatigue test, as shown in Figure 8. The videometer and its specification are shown in Figure 10.
Generally, it is impossible to predict the exact fatigue crack initiation point on the fatigue specimen prior to completing the actual fatigue test. In addition, the weld bead profiles at the fatigue crack initiation point cannot be confirmed after completing the fatigue test because the profiles are deformed during the fatigue test. Therefore, all fatigue test specimens were 3D scanned to record the overall weld bead profiles prior to the fatigue test.
The 3D scanner used for this study is the “EinScan-Pro+” model manufactured by SHINING 3D Company and the scanner is shown in Figure 11. The scanner has an accuracy of 0.05 mm.

2.2.4. Measurements by Using a 3D Scanner

The fatigue crack initiation point was determined by investigating the beach mark on the fractured surface, as shown in Figure 12.
The section profile at the fatigue crack initiation point was extracted from the data recorded using the 3D scanner and the weld profiles at the fatigue crack initiation point were then measured.

Establishment of a Reference Point for Measurements

The weld toe angle, trough depth and radius at the weld toe and angular distortion are known to influence the stress concentration [22]. On the other hand, the values of these parameters may differ according to the measuring methods applied which is further dependent on the reference point of each measuring item [1,23]. Therefore, determination of the reference point is very important.
Generally, it is difficult to determine an appropriate reference point on a weld cross-section because the transition area of the weld toe is quite complex and the inconsistent trough also exists at the toe area as shown in Figure 13. In addition, the surface of the base material is also uneven when enlarged.
Therefore, a “Plate factor” is defined as the arbitrarily straight line for base material surface calculated with the average tangent line and was drawn automatically by the software Geomagic Control-X for measuring and analyzing 3D scanned data. The intersection point between the “Plate factor” and the weld bead surface was determined as a reference point in this study as shown in Figure 13.

Weld Bead Height and Width

The weld bead heights and widths were measured from the reference point, as shown in Figure 14, because the extracted section profiles had some misalignment.

Toe Angle

A “Bead factor”, which is defined as an arbitrarily straight line for the weld metal surface and is calculated with the average tangent line, was drawn automatically by the Geomagic Control-X program to measure the weld toe angle. Six kinds of bead factors for each weld toe were drawn for a weld bead height ranging from 0.5 mm to 3.0 mm with 0.5 mm interval.
The weld toe angle for each specific range was determined by measuring the angle between the “Plate factor” and the “Bead factor” using the Geomagic Control-X program, as shown in Figure 15.

Angular Distortion

The angular distortion generated by the welding and the fit-up of the test coupon was also measured from the extracted section profile at the fatigue-crack initiation point. A “Parallel line”, which is the hypothetical line connecting two points on the base material, was drawn. These two points were 100 mm away from the reference point of each weld toe. The angular distortion for each point was determined by measuring the angle between the “Plate factor” and the “Parallel line”. The sum of the two angles at the left and right points was determined to be the angular distortion of the side, as shown in Figure 16.

Trough Depth at the Toe Area

Some troughs were found at the weld toe area when the extracted cross section considered as the fatigue crack initiation point was investigated with large magnification. However, these troughs had not been detected by a visual inspection and M.T. The trough depth at each weld toe was determined by measuring the vertical distance between the “Plate factor” and the deepest point of the trough, as shown in Figure 17.

Minimum Radius at the Toe Area

The radius at the weld toe influences the fatigue behavior of the welded joint, but it is impossible or very difficult to measure the exact radius [13]. Therefore, this study drew the optimized circle automatically by the method of least squares. The radius of the circle was measured using the Geomagic Control-X program, as shown in Figure 18.
The program automatically marks the point of a specifically designated distance to draw the optimized circle. For example, this study designated 0.5 mm and 1.0 mm distances along the base material surface and 0.5 mm and 1.0 mm heights along the weld metal surface from the reference point. The optimized circle was drawn automatically.

2.3. Fatigue Tests

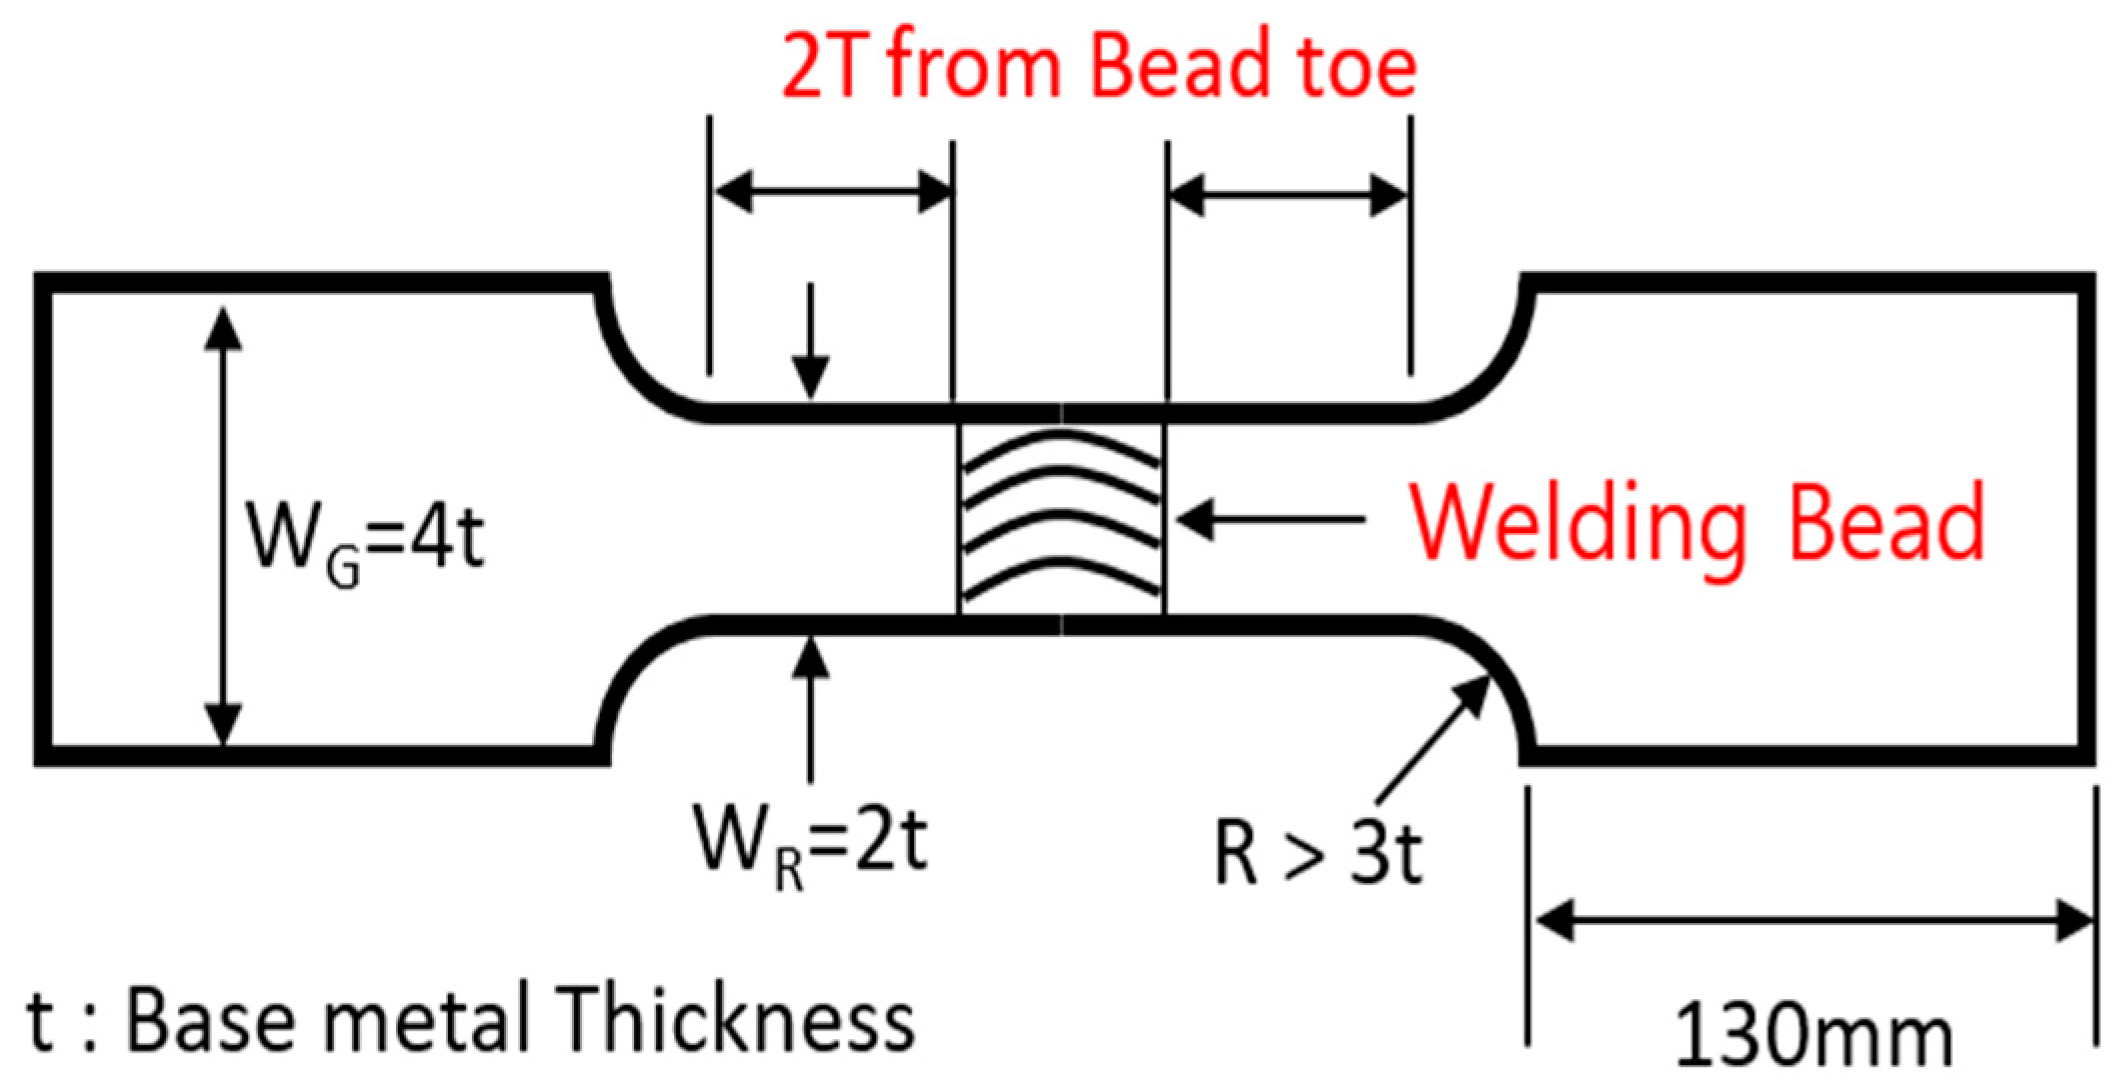
2.3.1. Specimens for Fatigue Test

All test coupons were inspected by UT and MT and the fatigue test specimens were prepared by machining to the dimensions shown in Figure 19.
In total, 246 fatigue test specimens were prepared and the fatigue tests were carried out to estimate the fatigue strength for all test specimens.

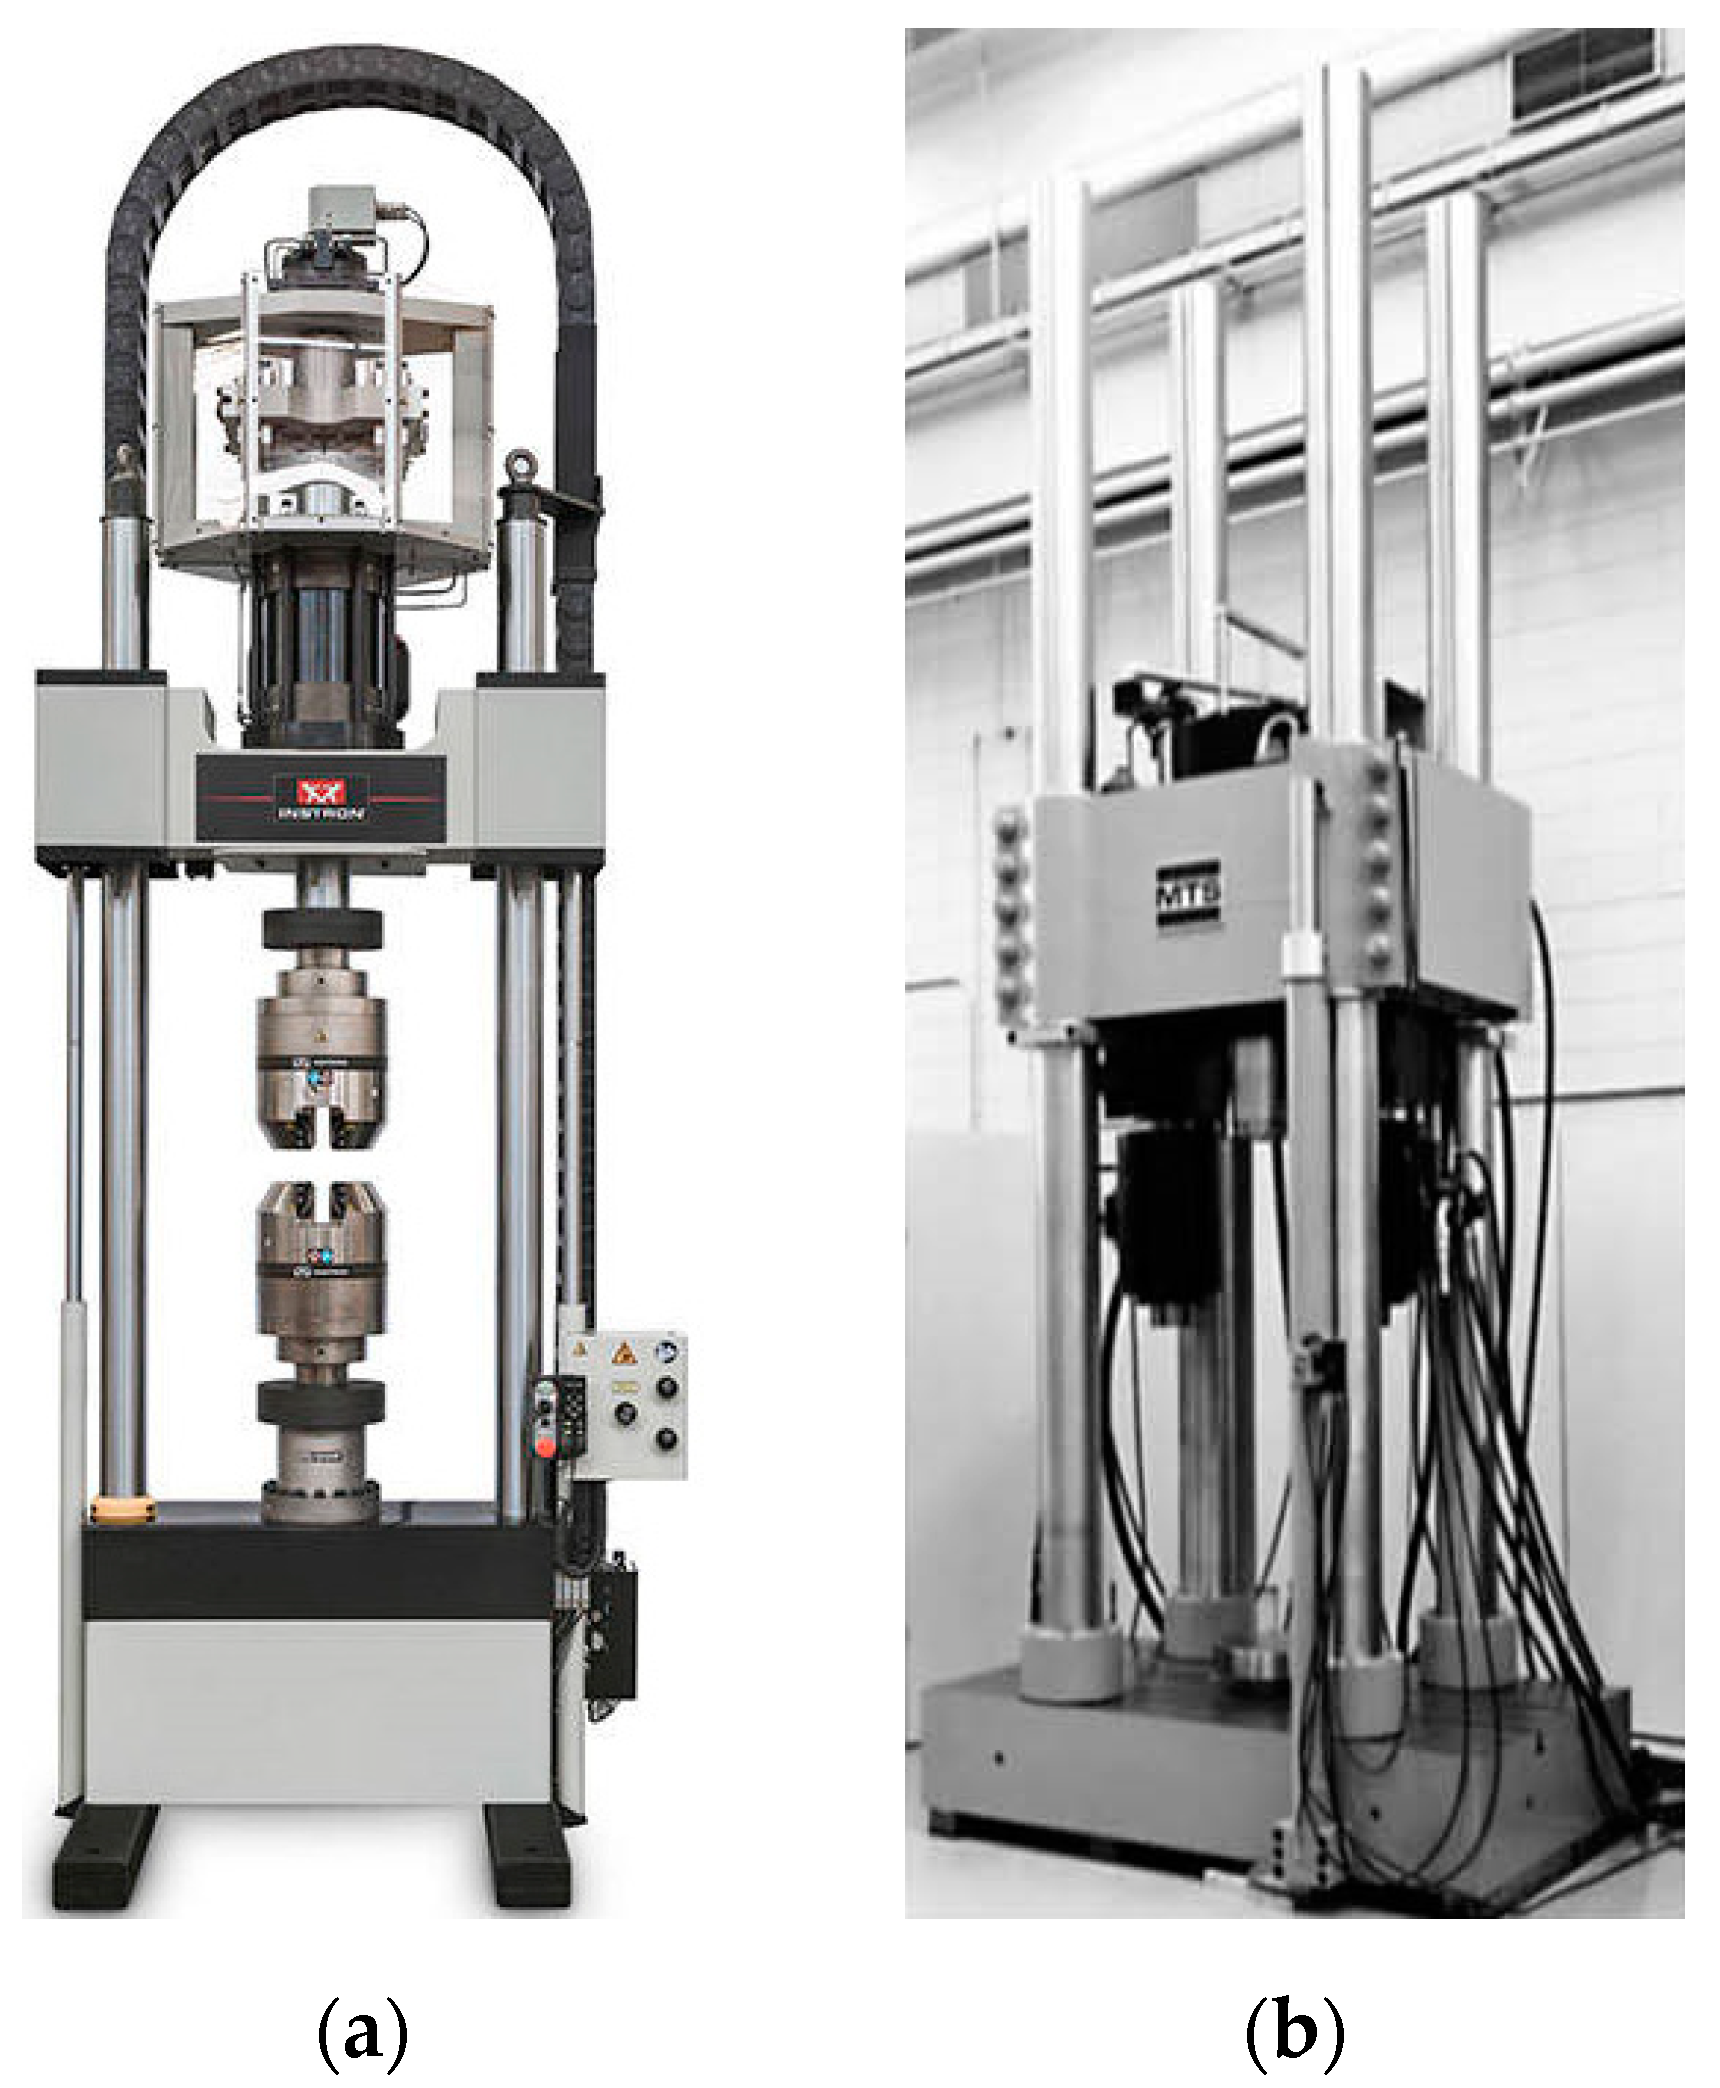
2.3.2. Fatigue Test Machines

Instron 8803 (Capacity: 500 kN) manufactured by Instron was used to fatigue test for 20 and 25 mm test specimens, and MTS 311.41 (Capacity: 2500 kN) manufactured by MTS was applied to fatigue test for test specimens of 30 and 40 mm. Figure 20 shows the fatigue test machines.

2.3.3. Fatigue Tests

The fatigue tests were performed according to the conditions given in Table 3.
The S-N curve was plotted in accordance with Equation (1) and by using the test results for the range of 10 5 10 6 cycles:
log N = log A mlog S t d o f , a se
where N , S , m , log A , t d o f and se are the number of cycles, stress range, slope, intercept of log N axis, student’s T-distribution value and standard deviation, respectively.

2.3.4. Criteria for Fatigue Test Results

Test results (fatigue limits: stress ranges at 10 7 cycles in air condition) were compared with the BV rule requirements, because the fatigue limit requirement of the BV rule is higher than that of the other five rules and codes as summarized in Table 4. The S-N curve required for a butt-welded joint of the plate-to-plate case is generally the E curve [12,24,25,26,27,28].

3. Test Results

3.1. Gage R&R (Repeatable and Reproducibility) for the Data Measured by Each Method

The correlation of data which were measured by the measuring methods of Table 2 for each weld profile was analyzed to verify the effectiveness of each measuring method statistically. Table 5 lists the results of this analysis.
As the results of gage R&R for the bead height and width, the following was confirmed. The bead height measured by the leg length gage and the 3D scan and the bead width measured by the ruler and the 3D scan did not have a significant difference for the variance from the F-test and the mean value from the t-test.
Therefore, the leg length gage for the bead height measurement and the ruler for the bead width measurement can be used in production. Figure 21 shows the correlation for each measuring method of bead height and width.
As the results of gage R&R for the toe angle, the following was confirmed. The toe angle measured by the template and the videometer showed a significant difference for the variance from the F-test and the mean value from the t-test. On the other hand, the toe angle, measured using the template and the 3D scan, did not show a significant difference for the variance from the F-test and the mean value from the t-test. Figure 22 shows the correlation for each measuring method of the toe angle.
Some of the toe angles measured by the videometer and the 3D scan were less than 115°. Therefore, the toe angle less than or equal to 115° was assigned to the template angle of 115° for the analysis because the minimum angle of the template was 115°. The templates were manufactured with a 5° interval and the toe angles were determined from the average value of the two templates. In addition, it was difficult to determine the accurate reference tangent line on the weld bead to measure the toe angle. Therefore, there was a significant difference in the variance and the mean value between the toe angles measured using the template and the videometer.
Nevertheless, it was confirmed that the correlation of the toe angles measured using the template and the 3D scan was valid according to the result of the statistical analysis. It means that the measurements of the toe angle using the templates designed by SHI can be effectively used in production.

3.2. Fatigue Test Results

3.2.1. Weld Profiles and Fatigue Limits
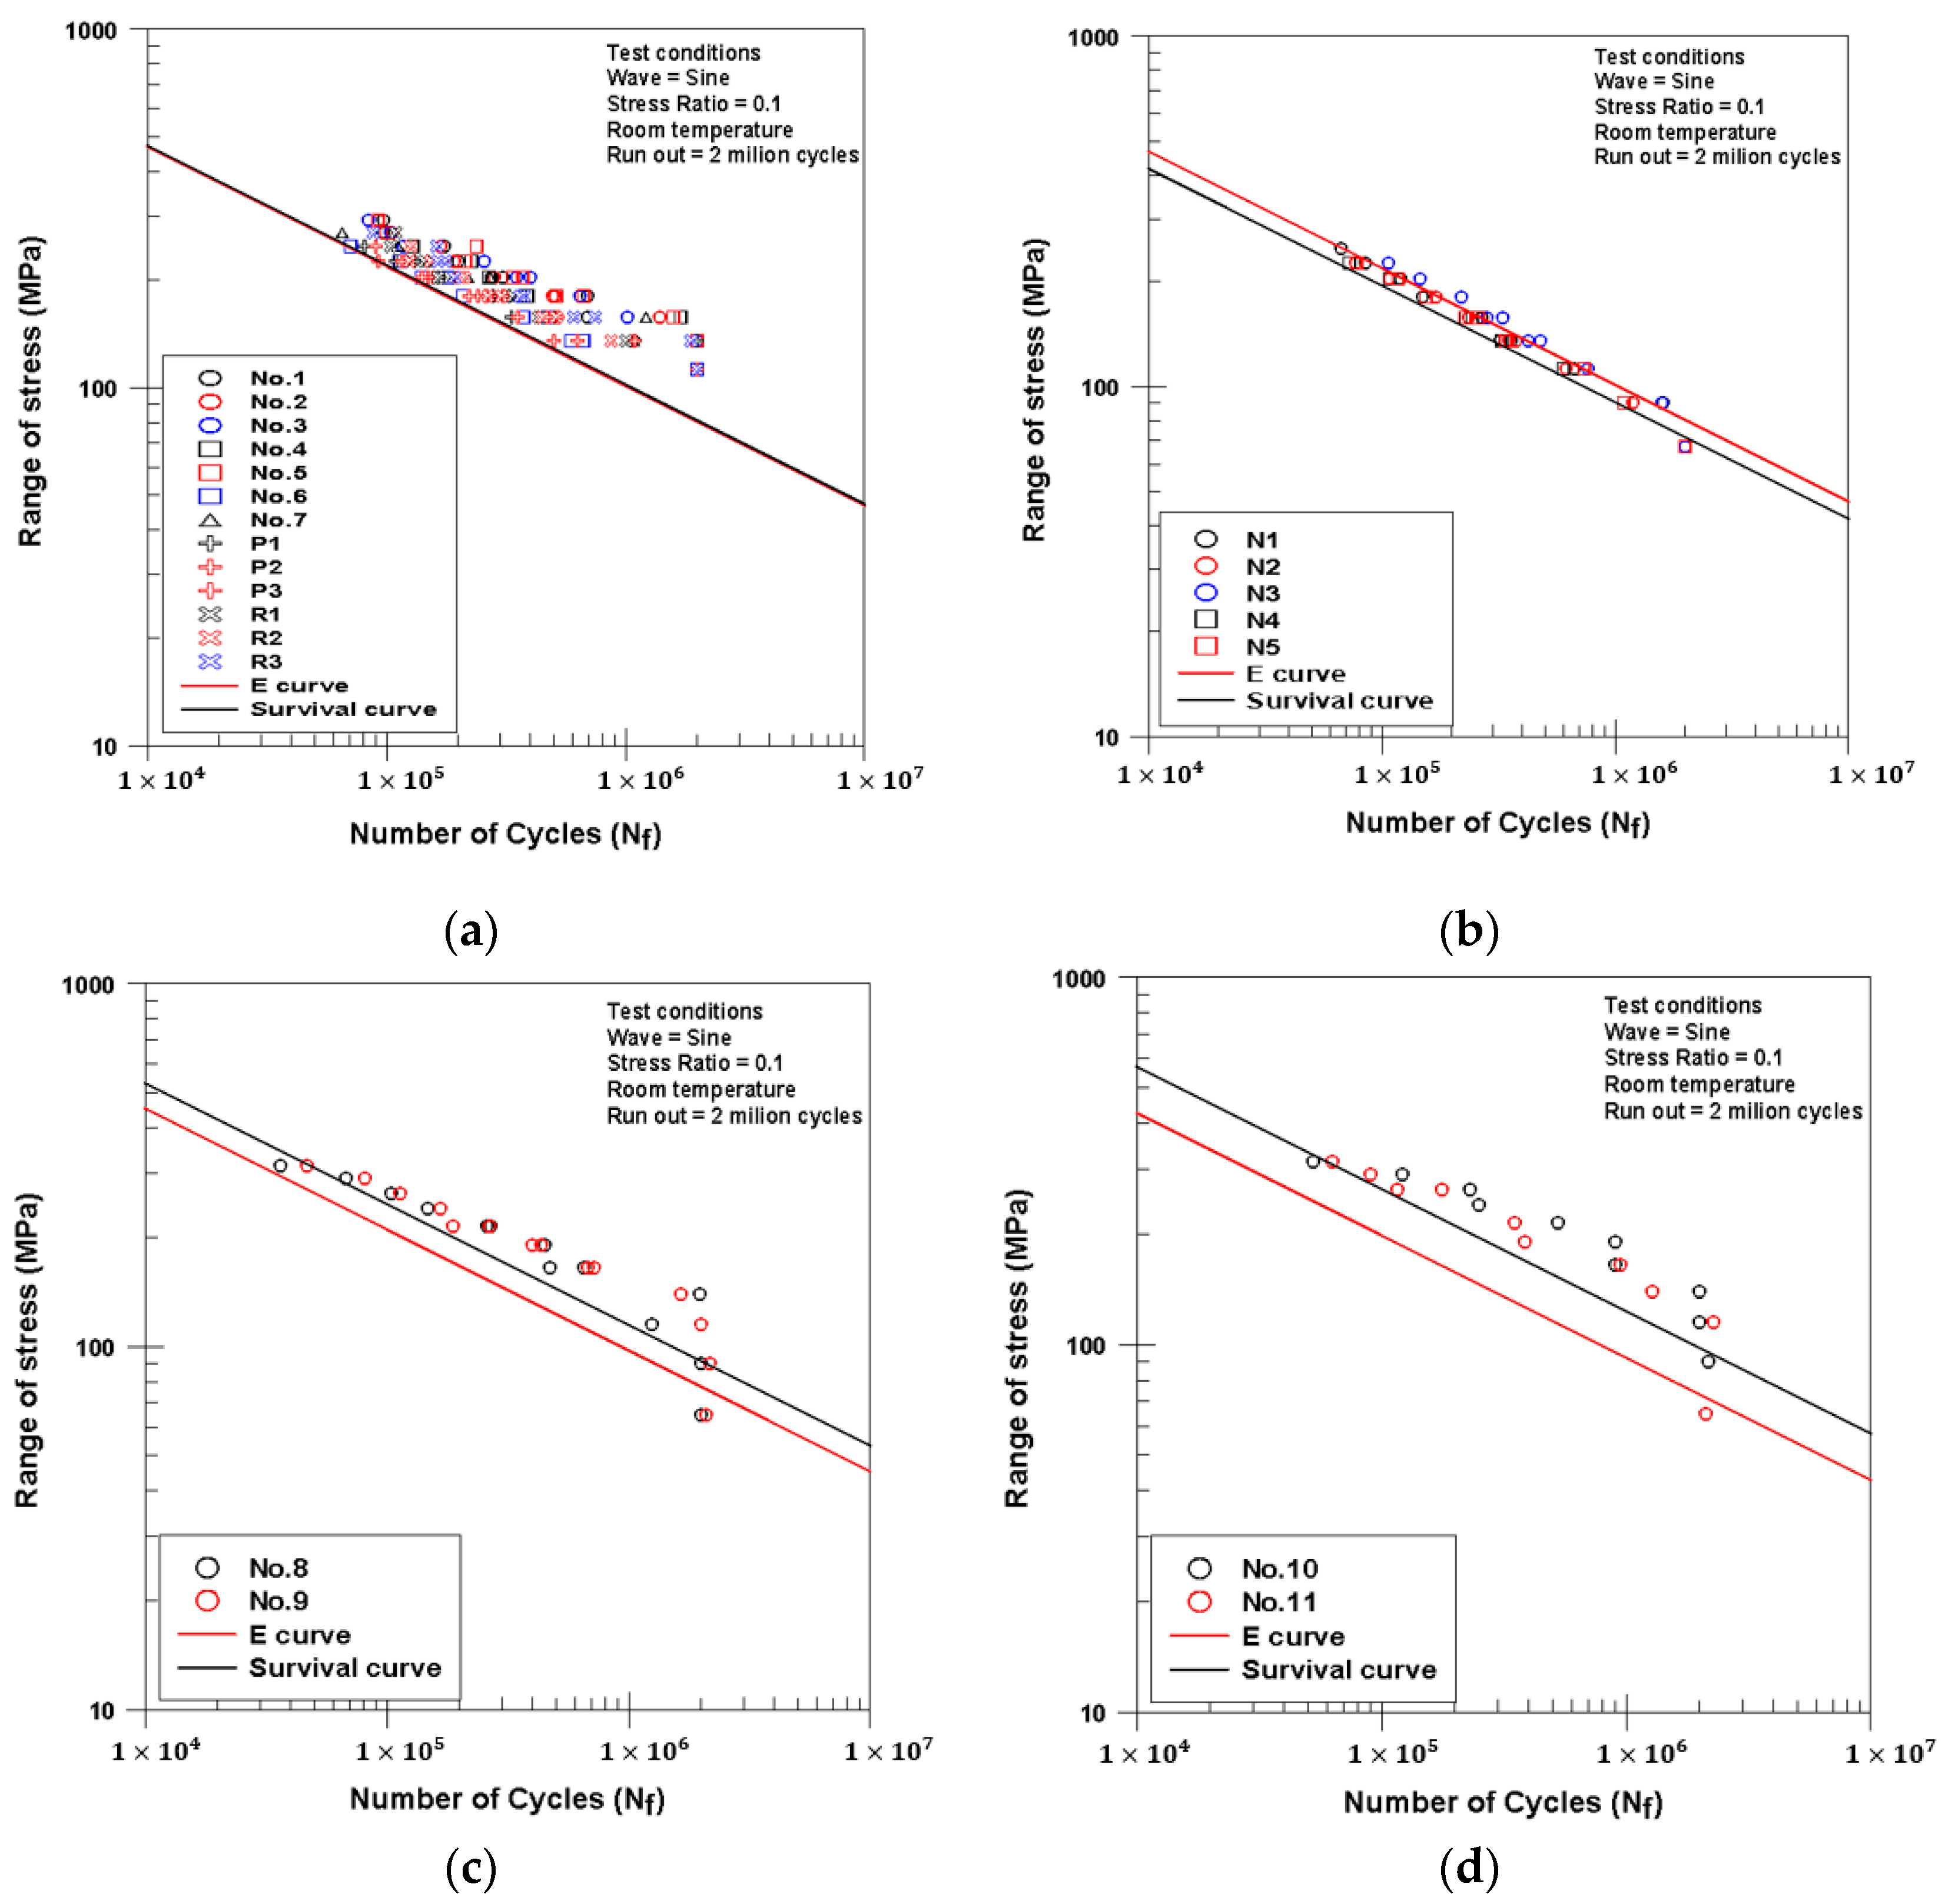
The fatigue limit of each test number from the fatigue tests and the weld profiles measured at the fatigue initiation location of all fatigue test specimens using the 3D scan are summarized in Table 6. The parameters for weld profiles are expressed in terms of the average values for each test number.

3.2.2. S-N Curve

S-N curves for each test number and base material thickness were drawn and the fatigue limits at 10 7 cycles were calculated according to the test results described in Section 2.3.2. Subsequently, the fatigue limits were compared with the E curve requirements of the BV rule [26].
Test numbers of 6, P1, P2, P3 and N1 to N5 did not meet the requirements, but the others met the requirements. The fatigue limits of test numbers 8, 9, 10 and 11 were much higher than the requirements when the notch effect due to the thickness factor is considered.
The fatigue limit of a 25 mm thick base material did not meet the requirements, but the fatigue limits of 20 mm, 30 mm and 40 mm thick base materials did meet the requirements. Table 7 presents the fatigue test results for each base material thickness.
Figure 23 presents the S-N curves obtained for each base material thickness. Extremely abnormal welding conditions were intended for the 25 mm thick base material to obtain the worse weld bead profiles, which may adversely affect the fatigue behavior of the welded joint.

3.2.3. Brief Review of All Fatigue Test Results

Direction and Amount of Angular Distortion

Angular distortion occurred towards the second side for the square groove and the first side for the Y and double Y grooves. The angular distortion for each test number is shown in Table 6. The angular distortions of the Y and double Y grooves and the square groove with a reverse pre-distortion are higher than that of the normal square groove.
However, it is thought that the large angular distortion, such as written in Table 6, hardly occurs in production because of the size effect and self-weight of the plates welded. As a result of measuring the angular distortion of the actual block in production, it was confirmed that the angular distortion is much less than 0.7°.

Effect of Angular Distortion on the Fatigue Behavior of the Welded Joints

All specimens of test numbers 6, P1 to P3, N1 to N5 and 8 to 11, were fractured at the acute angle side of the two sides (first and second sides). On the other hand, fatigue fracture did not always occur at the acute angle side for the other test numbers. Therefore, the concordance rate of the fatigue fractured side and the acute angle sides were investigated based on the level of angular distortion and the results are shown in Table 8.
The larger the angular distortion, the more fractures occurred at the acute angle side. Some researchers considered that the fatigue fracture at the acute angle side is related to the secondary bending stress [23].
The fatigue limits of test numbers 6, P1 to P3 and N1 to N5 did not meet the E curve requirements of the BV rule [26]. It is thought that the stress concentration due to the large angular distortion may affect the lower fatigue limits of these test numbers.
On the other hand, the fatigue limits of the Y and double Y grooves met the E curve requirements of the BV rule, even though the level of angular distortions was relatively high. The angular distortions of the Y and double Y grooves occurred towards the first side and all specimens fractured at the first side. The weld bead profiles of the first side of the Y and double Y grooves were much better than those of the other test numbers and the second side of the Y and double Y grooves. It is thought that the lower stress concentration due to better weld bead profiles may affect the higher fatigue limits of the Y and double Y grooves.

4. Analysis of Test Results

Fatigue properties of the welded joints were analyzed with the data measured by the 3D scan. Fatigue cracks were not always generated on the worse weld bead profile side, which has a high stress concentration (SCF, stress concentration factor), or the acute angle side of angular distortion (Km, stress magnification factor). Therefore, an additional investigation was carried out using all weld profile parameters, such as weld bead height and width, toe angle, radius and trough depth at weld toe and angular distortion. All data used for the investigations were measured at the fatigue-fractured points and the investigations were carried out using regression analysis.
Misalignment and angular distortion in axially loaded joints lead to an increase of the stress in the welded joint because of secondary shell bending stresses. This stress increase is expressed using the stress magnification factor (Km) and is considered an absolute value. On the other hand, fatigue fracture did not always occur at the acute angle side.
The secondary bending stress that developed during the fatigue test has a negative effect (tensile stress) on the acute angle side and a positive effect (compressive stress) on the obtuse angle side of the specimen. Therefore, this study assigned the sign of positive (+) or negative (−) to the measured angular distortion considering the direction of distortion. Therefore, a negative sign (−) was assigned to the angular distortion at the acute angle side and a positive (+) sign was assigned to the angular distortion at the obtuse angle side.

4.1. Effect of Weld Bead Profiles on the Fatigue Life of the Welded Joints

It is well known that the fatigue properties of the welded joints are affected by the applied stress, weld bead profiles and joint configuration [13]. Therefore, the effect of the applied stress and weld bead profiles on the fatigue life of the welded joints was investigated by regression analysis. The applied stress was always included as a basic variable.
As the results of regression analysis, it was confirmed that the main variables affecting the fatigue life of the welded joints are the toe angle, bead height and angular distortion. Therefore, two different regression equations can be proposed to predict the fatigue life, as shown Equations (2) and (3):
F . L = 5101.220 X 68379.070 X B . H + 51804.014 X A . D + 1671724.645
F . L = 5248.949 X 7046.702 X T . A + 76949.256 X A . D + 428025.683
where F.L, X, (B.H), (A.D) and (T.A) mean fatigue life, stress, bead height, angular distortion and toe angle, respectively.

4.2. Effect of the Bead Profile on the Fatigue Limit at 10 7 cycles

The fatigue limit for each test number was calculated based on the fatigue test results corresponding to 10 5 10 6 cycles of fatigue life. Subsequently, the effects of the weld bead profiles on the fatigue limit were investigated by regression analysis.
The regression analysis of Section 4.1 was carried out for the individual and the various combinations of variables of the weld bead profiles. These variables include the weld bead height and width, toe angle, angular distortion, trough depth at the weld toe, bead shape ratio (the ratio of the bead height to the bead width) and the radius at the weld toe, which are known to affect the fatigue properties of the welded joints. In total, 123 different regression analyses were carried out, and the regression results of 4 out of the 123 analyses showed a higher correlation. Table 9 lists the four different regression results from the analyses.
Four different regression equations can be proposed from the regression analysis results in Table 9, as follows:
F . L = 4.201 X A . D 51.330 B . H B . W + 62.430
F . L = 0.238 X T . A + 3.580 X A . D + 19.930
F . L = 2.096 X B . H + 2.695 X A . D + 61.974
F . L = 1.763 X B . H + 4.690 X A . D + 0.460 X B . W + 49.910
where F.L, X, (A.D), (B.H), (B.W) and (T.A) mean fatigue limit, stress, angular distortion, bead height, bead width and toe angle, respectively.
It is concluded that the four different regression equations can be used to predict the fatigue limit based on the weld bead profiles.
If only one variable of the weld profiles exclusively affects the fatigue properties, the fatigue test specimens would be fractured at the side adversely affected by the variable dominantly. However, the fractured sides from the tests did not coincide with the side unfavorably affected by certain one variable. Therefore, the fatigue properties were investigated with combining two or more variables of weld profiles.
The p-value of one or more variables exceeds 0.05 when the toe angle is regression analyzed with the weld bead height and width or bead shape ratio. Based on the result, we can concludes that a specific reciprocal action between variables exists, which is explained in Section 5.

4.3. New Criteria of Weld Profiles for the E Curve

The four regression equations for the fatigue limit have angular distortions in common. Hence, the fatigue limit is dominantly influenced by the angular distortion. On the other hand, it is impossible or very difficult to measure all the angular distortions of the actual weld joints in production within a certain period of time for working speed. Therefore, some angular distortions for the weld joints of the actual production block were measured, and it is confirmed that the measured angular distortions were much lower than 0.7°.
When the angular distortion is 0.7° and required S-N curve is E curve of BV rule, the regression Equations (4)–(7) can be summarized as in Table 10.
The weld bead ratio (bead height/bead width) meeting the E curve requirements of the BV rule is 0.244 according to regression Equation (4) when the angular distortion is 0.7° and the weld bead height and width are shown in Table 11 (a) when the weld bead ratio is 0.244. In addition, the bead height and width which meet the required fatigue limit according to regression Equation (7) are shown in Table 11 (b) when the angular distortion is 0.7°.
From the results of this study, it is concluded that the fatigue limit meeting the E curve requirements of the BV rule can be controlled by ① only the weld bead height and width, ② only the weld toe angle or ③ only the weld bead height, as shown in Table 10. In addition, it is thought that a more robust weld quality could be achieved in production if the weld bead height and weld toe angle are restricted together.
A toe angle of 123.9° or a weld bead height of 6.26 mm was required to meet the E curve requirements (for a fatigue limit of 46.96 MPa) of the BV rule according to regression Equations (5) or (6), respectively, when the angular distortion of 0.7°. The toe angle and weld bead height to meet the E curve of the BV rule are shown in Figure 24.
A graph like Figure 24 can be obtained according to the regression Equations (5) and (6) when the required fatigue limits are specified. The obtained toe angle and weld bead height can be used as new criteria for the weld profiles to meet the fatigue limits specified.

4.4. New Approach to Consider the Stress Concentration

It is known the fatigue failure initiation starts from the potential critical spots where geometric discontinuities and notches exist. The potential critical spots were explained by the K t (SCF: Stress Concentration Factor) related to the weld bead profiles and the K m (Stress Magnification Factor) related to the angular distortion or the misalignment of weld joints.
The K t , which is the elastic stress concentration factor at the butt weld toe, can be calculated using the Lawrence equation in Equation (8) [29]:
K t = 1 + 0.27 tan θ 0.25 t ρ 0.5
where θ , t and ρ are the toe angle in radius, thickness of the plate and toe radius, respectively.
The K m , the structural stress concentration caused by misalignment, can be calculated with Equation (9) [30]:
K m = 1 + β 4 a m S t
where β = 3 , a m , S and t are the maximum angular misalignment between the flat plates, length of the plate and thickness of the plate, respectively.
The K t and k m calculated by Equations (8) and (9) using data at the fracture location of this study are shown in Figure 25.
It was not possible to determine the border line for K t and K m , nor whether values of SCF or K m could meet the required fatigue limit or not. On the other hand, it can be concluded that the fatigue fracture will occur at the acute angle side when Km is equal to or exceeds 1.10 (angular distortion is equal to or exceed 0.4°).
The combined stress concentration is expressed as a multiplication of K t and K m [30]. The K t × K m calculated by data at the fracture location of this study are shown in Figure 26.
A value of 2.6 for K t × K m can be used as a borderline SCF to confirm whether the fatigue limit (stress at 10 7 cycles) can satisfy the E curve requirements of the BV rule or not. It can also be concluded that the K m × SCF may be used as a new index to decide whether the fatigue limit can meet a specific fatigue limit of the fatigue curve or not, especially the E curve requirements of the BV rule.
This research would like to name K t × K m as the S-SCF (Samsung-Stress Concentration Factor) when it is used as an index in the criteria for the fatigue limit.

5. Correlation between the Bead Height/Width and the Toe Angle

This study found that the weld bead shape of the SAW two-run method is similar to a circle, as shown in Figure 27.
Suppose the actual weld bead can be converted to a segment of a circle made from the weld bead with a certain height and width, as shown in Figure 27. In that case, the radius (r) and toe angle (T.A) can be mathematically calculated from the measured weld bead height and width by the Equations (10) and (11), respectively:
r = h 2 + w 2 8 h
T . A = 90 ° + tan 1 w 4 h h w × 180 π °
The radius was automatically measured using the Geomagic Control-X program. When the circle was drawn automatically, the radius was automatically calculated using the “Least squares method” by the Geomagic Control-X program depending on the actual weld bead profile. In addition, the toe angle was measured using the template according to the procedure in Section 2.2.2.
The theoretically calculated values were compared with the radius of the circle drawn automatically by the Geomagic Control-X program and the toe angle, measured using the template to verify the effectiveness of theoretical calculations were verified by reflecting the confidence level of 95%. In particular, the average value of the toe angles measured using the template was used for comparison. Figure 28 shows the regression analysis results.
The radius and toe angle of the weld bead can be calculated using regression Equations (12) and (13), respectively, based on the bead height and width measured in production:
Radius   of   the   weld   bead = 1.199 × Equation   10 2.675
T . A   of   the   weld   bead = 1.175 × Equation   11 27.508

6. Conclusions

This study experimentally verified the effects of weld bead profiles and angular distortion on the fatigue properties of the welded joint. The following are important conclusions from the study.
  • The fatigue limit of the SA welded joint can be predicted using the proposed regression equation based on the angular distortion, the weld bead height and the toe angle.
  • The new criteria for the weld bead profiles, which can achieve more robust fatigue properties for the E-curve of the SA welded joints, can be proposed as a minimum toe angle of 130° and a maximum bead height of 6 mm.
  • The weld bead of SA welding can be converted to a segment of a circle. Hence, the expected toe angle can also be obtained by measuring the bead height and width in production.
  • The new templates designed by SHI are effective tools to measure the toe angle of a welded joint.

Author Contributions

Conceptualization, D.C. and S.N.; methodology, S.N., C.C., D.L. and E.J.; validation, D.C., Y.J. and J.L.; formal analysis, D.C., Y.J. and J.L.; investigation, M.C., B.K. and K.K.; data curation, D.C.; writing—original draft preparation, D.C.; writing—review and editing, S.N., J.K. and M.K.; visualization, D.C.; supervision, S.N. and M.K.; project administration, D.C. and S.N. All authors have read and agreed to the published version of the manuscript.

Funding

This research received no external funding.

Institutional Review Board Statement

Not applicable.

Informed Consent Statement

Not applicable.

Data Availability Statement

The data presented in this study are available on request from the corresponding author.

Acknowledgments

This research was supported by Samsung Heavy Industry Co., Ltd.

Conflicts of Interest

The authors declare no conflict of interest.

References

  1. AWS D1.1/D1.1M; Structural Welding Code—Steel. American Welding Society: Miami, FL, USA, 2020.
  2. ISO 5817; Welding—Fusion-Welded Joints in Steel, Nickel, Titanium and Their Alloys (Beam Welding Excluded)—Quality Levels for Imperfections. International Organization for Standardization: Geneva, Switzerland, 2014.
  3. NORSOK M-101; Structural Steel Fabrication. Norwegian Petroleum Industry: Stavanger, Norway, 2011.
  4. IACS No.47; Shipbuilding and Repair Quality Standard. International Association of Classification Societies: London, UK, 1996.
  5. Pang, J.C.; Li, S.X.; Wang, Z.G.; Zhang, Z.F. Relations between fatigue strength and other mechanical properties of metallic materials. Fatigue Fract. Eng. Mater. Struct. 2014, 37, 958–976. [Google Scholar] [CrossRef]
  6. Han, J.W.; Han, D.K.; Han, S.H. Stress intensity factors for three-dimensional weld toe cracks using weld toe magnification factors. Fatigue Fract. Eng. Mater. Struct. 2014, 37, 146–156. [Google Scholar] [CrossRef]
  7. Livieri, P.; Tovo, R. Overview of the geometrical influence on the fatigue strength of steel butt welds by a nonlocal approach. Fatigue Fract. Eng. Mater. Struct. 2020, 43, 502–514. [Google Scholar] [CrossRef]
  8. Ohta, A.; Maeda, Y.; Suzuki, N. Effect of yield strength on the basic fatigue strength of welded joints. Fatigue Fract. Eng. Mater. Struct. 1993, 16, 473–479. [Google Scholar] [CrossRef]
  9. Ninh, N.T.; Wahab, M.A. The effect of residual stresses and weld geometry on the improvement of fatigue life. J. Mater. Process. Technol. 1995, 48, 581–588. [Google Scholar] [CrossRef]
  10. Cho, J.H.; Baek, S.J.; Shin, S.C.; Lee, G.H.; Kang, M.G.; Jo, Y.R. Effect of Aluminum Arc Butt Joint Weld Geometry on Fatigue Strength. J. Weld. Join. 2021, 39, 103–108. [Google Scholar] [CrossRef]
  11. Wang, Z.M.; Chang, K.H.; Muzaffer, S. Fatigue Analysis of the Effects of Incomplete Penetration Defects on Fatigue Crack Initiation Points in Butt-Welded Members. J. Weld. Join. 2020, 38, 543–550. [Google Scholar] [CrossRef]
  12. IIW-1823-07; Recommendations for Fatigue Design of Welded Joints and Components. International Institute of Welding: Paris, France, 2008.
  13. Schork, B.; Kucharczyk, P.; Madia, M.; Zerbst, M.; Hensel, J.; Bernhar, J.; Tchuindjang, D.; Kaffenberger, M.; Oechsner, M. The effect of the local and global weld geometry as well as material defects on crack initiation and fatigue strength. Eng. Fract. Mech. 2018, 198, 103–122. [Google Scholar] [CrossRef]
  14. Renken, F.; Polach, R.U.F.B.; Schibnell, J.; Jung, M.; Oswald, M.; Rother, K.; Ehlers, S.; Braun, M. An algorithm for statistical evaluation of weld toe geometries using laser triangulation. Int. J. Fatigue 2021, 149, 106293. [Google Scholar] [CrossRef]
  15. Stenberg, T.; Barsoum, Z.; Astrand, E.; Ericson Oberg, A.; Schneider, C.; Hedegard, J. Quality control and assurance in fabrication of welded structures subjected to fatigue loading. Weld. World 2017, 61, 1003–1015. [Google Scholar] [CrossRef]
  16. Hultgren, G.; Barsoum, Z. Fatigue assessment in welded joints based on geometrical variations measured by laser scanning. Weld. World 2020, 64, 1825–1831. [Google Scholar] [CrossRef]
  17. Hultgren, G.; Myren, L.; Barsoum, Z.; Mansour, R. Digital Scanning of Welds and Influence of Sampling Resolution on the Predicted Fatigue Performance: Modelling, Experiment and Simulation. Metals 2021, 11, 822. [Google Scholar] [CrossRef]
  18. Wang, Y.; Luo, Y.; Tsutsumi, S. Parametric Formula for Stress Concentration Factor of Fillet Weld Joints with Spline Bead Profile. Materials 2020, 13, 4639. [Google Scholar] [CrossRef] [PubMed]
  19. Niederwanger, A.; Warner, D.H.; Lener, G. The utility of laser scanning welds for improving fatigue assessment. Int. J. Fatigue 2020, 140, 105810. [Google Scholar] [CrossRef]
  20. Riofrio, P.G.; Ferreira, J.A.M.; Capela, C.A. Imperfections and Modelling of the Weld Bead Profile of Laser Butt Joints in HSLA Steel Thin Plate. Metals 2021, 11, 151. [Google Scholar] [CrossRef]
  21. Braun, M.; Neuhausler, J.; Denk, M.; Renken, F.; Kellner, L.; Schubnell, J.; Jung, M.; Rother, K.; Ehlers, S. Statistical Characterization of Stress Concentrations along Butt Joint Weld Seams Using Deep Neural Networks. Appl. Sci. 2022, 12, 6089. [Google Scholar] [CrossRef]
  22. Radaj, D.; Sonsino, C.M.; Frick, W. Fatigue Assessment of Welded Joints by Local Approaches, 2nd ed.; Woodhead Publishing: Cambridge, UK, 2006; p. 183. [Google Scholar]
  23. Fricke, W. Recent developments and future challenges in fatigue strength assessment of welded joints. J. Mech. Eng. Sci. 2015, 229, 1224–1239. [Google Scholar] [CrossRef] [Green Version]
  24. DNV-RP-C203; Fatigue Design of Offshore Steel Structures. Det Norske Veritas: Oslo, Norway, 2016.
  25. American Bureau of Shipping. Guide for Fatigue Assessment of Offshore Structures; ABS: New York, NY, USA, 2003. [Google Scholar]
  26. BV NI 611; Guidelines for Fatigue Assessment of Ships and Offshore Units. BV: Neuilly-sur Seine, France, 2020.
  27. ISO 19902; Petroleum and Natural Gas Industries—Fixed Steel Offshore Structures. ISO: Geneva, Switzerland, 2007.
  28. BS 7608; Guide to Fatigue Design and Assessment of Steel Products. British Standard Institution: London, UK, 2015.
  29. Maddox, S.J. Fatigue Strength of Welded Structures, 2nd ed.; Woodhead Publishing: Cambridge, UK, 1991. [Google Scholar]
  30. Yung, J.Y.; Lawrence, F.V. Analytical and graphical aids for the fatigue design of weldments. Fatigue Fract. Eng. Mater. Struct. 1985, 8, 223–241. [Google Scholar] [CrossRef]
Figure 1. Typical weld joint configurations for arc welding: (a) single bevel; (b) single vee.
Jmse 10 01527 g001
Figure 2. Typical weld joint configurations for Tandem SAW: (a) square groove; (b) Y (single V) groove; (c) double Y groove.
Jmse 10 01527 g002
Figure 3. Tandem SAW equipment at the panel stage: (a) tandem SAW equipment; (b) head of tandem SAW equipment.
Jmse 10 01527 g003
Figure 4. Fatigue resistance S-N curve proposed by IIW. The data was from Ref. [12].
Jmse 10 01527 g004
Figure 5. Joint configurations of the test coupons: (a) square groove for 20 and 25 mm; (b) Y (single V) groove for 30 mm; (c) double Y groove for 40 mm.
Jmse 10 01527 g005
Figure 6. Definition of measuring items.
Jmse 10 01527 g006
Figure 7. Measurement of the weld bead height and width: (a) measurement of width; (b) measurement of height.
Jmse 10 01527 g007
Figure 8. Locations for toe angle measurement using the template.
Jmse 10 01527 g008
Figure 9. New templates for measuring the toe angle: (a) for 115°; (b) for 155°; (c) example of measurement.
Jmse 10 01527 g009
Figure 10. Videometer for measuring the toe angle.
Jmse 10 01527 g010
Figure 11. 3D Scanner used for this study.
Jmse 10 01527 g011
Figure 12. Determination of the fatigue crack initiation point (the point marked by the red box denotes the initiation point of the fatigue crack).
Jmse 10 01527 g012
Figure 13. Changeable profile and the determination of the reference point.
Jmse 10 01527 g013
Figure 14. Schematic diagram of the weld bead height and width measurement.
Jmse 10 01527 g014
Figure 15. Schematic diagram of the toe angle measurement (toe ~ 3 mm).
Jmse 10 01527 g015
Figure 16. Schematic diagram of the angular distortion measurement.
Jmse 10 01527 g016
Figure 17. Schematic diagram of the trough depth measurement.
Jmse 10 01527 g017
Figure 18. Schematic diagram and an example of radius measurement: (a) range for measuring radius at the reference point; (b) example of measured radius for two ranges.
Jmse 10 01527 g018
Figure 19. Shape and dimensions of the fatigue test specimens.
Jmse 10 01527 g019
Figure 20. Fatigue test machine: (a) Instron 8803; (b) MTS 311.41.
Jmse 10 01527 g020
Figure 21. Correlation for each measuring method of the bead height and width: (a) bead height; (b) bead width.
Jmse 10 01527 g021
Figure 22. Correlation for each measuring method of the toe angle: (a) videometer; (b) 3D scan.
Jmse 10 01527 g022
Figure 23. S-N curve for each base material thickness: (a) for 20 mm; (b) for 25 mm; (c) for 30 mm; (d) for 40 mm.
Jmse 10 01527 g023
Figure 24. Toe angle and weld bead height satisfying the E curve requirements of the BV rule.
Jmse 10 01527 g024
Figure 25. K t and K m at the fracture location for each test number: (a) K t ; (b) K m .
Jmse 10 01527 g025
Figure 26. K t × K m at the fracture location for each test number.
Jmse 10 01527 g026
Figure 27. Weld bead shape of the SAW two-run method.
Jmse 10 01527 g027
Figure 28. Regression analysis results for the radius and toe angle of the weld bead: (a) radius; (b) toe angle.
Jmse 10 01527 g028
Table 1. Summary of each test number.
Test No.Base MaterialJoint Config.IntentionMethods for Intention
KindThick. (mm)
1EH3620IHigher bead heightLower voltage
2Normal beadStandard
3Lower bead heightHigher voltage
4Lower bead heightLower ampere
5Higher bead heightHigher ampere
6DH3620IEffect of base materialChange of material from EH36 to DH36 and D (same welding parameters as Test No. 2)
7D20I
8DH3630YHigher bead heightLower voltage
9Lower bead heightHigher voltage
1040DYLower bead heightHigher voltage
11Higher bead heightLower voltage
P120IHigher angular distortionReverse pre-distortion during fit-up (1)
P2
P3
P4
N125IExtremely higher beadHigher flux burden
N2Lower flux burden
N33 mm bead heightMachining (2)
N4Extremely higher beadAdditional weld pass
N5Preplaced filler wire
R1EH3620IReproducibility of the tests of the P seriesReverse pre-distortion and same welding parameters as test No. 2, No.6 and No.7
R2DH3620I
R3D20I
Note: First trial: Test nos. 1 to 11, second trial: Test nos. P1 to P4 (for the angular distortion), third trial: Test nos. N1 to N5 (for an extremely higher bead by abnormal welding conditions), fourth trial: R1 to R3 (for the angular distortion). (1) P1 and P2 have the same welding parameters as Test no. 2. P3 and P4 have the same welding parameters as Test nos. 1 and 3, respectively. (2) N3: involves the removal of weld reinforcement by machining.
Table 2. Measuring methods.
StageMeasuringMeasuring Method
For the weld on the test couponWeld bead heightLeg length gage
Weld bead widthRuler
For fatigue specimenWeld toe angleSHI designed Templates
Videometer
Weld bead height3D scan
Weld bead width
Angular distortion
Trough depth at the weld toe
Min. radius at the weld toe
Table 3. Conditions for the fatigue tests.
ParametersCondition
Stress ratio (R)0.1
Applied stressBelow the yield strength
Wave formSine wave
Frequency (Hz)10–40
Thick. (mm)20253040
Stress range (MPa)112.5–292.567.5–247.565.0–315.0112.5–292.5
Mean stress (MPa)68.8–178.841.3–151.339.7–192.539.7–192.5
Amplitude (MPa)56.3–146.333.8–123.832.5–175.532.5–157.5
Run-out (cycles) 2 × 10 6
Table 4. Fatigue limits required in the rules and codes.
Rule or CodeS-N CurveFatigue Limit in Air (MPa) Fatigue   Limit   at   10 7   Cycles   Considering   the   Thickness   Effect   ( MPa )
20 mm25 mm30 mm40 mm
DNVE curve46.7846.7846.7845.1142.59
ABS4747.0045.5243.4940.48
BV46.9646.9646.9645.2842.75
ISO47.1344.5842.1640.2837.48
BS4746.9646.9645.2842.75
IIWFAT 8046.846.8046.8045.1242.60
Table 5. Summary of gage R&R for each weld profile.
ItemComparing ObjectSignificance (p-Value) R 2   Value
F-Testt-Test
Bead heightLeg length gage3D scan0.7790.5990.947
Bead widthRuler3D scan0.9830.5320.961
Toe angleTemplateVideometer<0.05<0.050.759
Toe angleTemplate3D scan0.9350.3590.787
Table 6. Summary of the measured weld profiles and fatigue limit for each test number.
Test No.Min. Toe
Angle (°)
Angular
Distortion (°)
Bead Width
(mm)
Bead Height
(mm)
Toe Through
(mm)
Min. Radius
(mm)
Fatigue Limit (1)
(mm)
1138.530.1422.494.60−0.041.3254.04
2145.020.1421.273.690.111.6755.39
3144.030.1921.763.590.171.5550.93
4143.640.2224.113.860.001.5654.26
5143.420.1821.993.920.051.6555.03
6 (2)137.391.2326.514.48−0.061.3146.34
7140.460.2225.634.53−0.131.4451.04
8156.901.0332.253.27−0.085.1853.79
9155.090.9932.043.06−0.194.0654.67
10162.390.6928.311.91−0.195.9359.70
11159.760.8928.851.95−0.075.7453.03
P1 (2)137.801.4227.104.75−0.061.3245.96
P2 (2)138.141.5126.104.63−0.061.4846.50
P3 (2)133.651.1723.105.27−0.081.1943.41
P4142.611.6526.474.44−0.041.6148.53
N1 (2)110.431.4225.727.51−0.100.7541.39
N2 (2)113.751.4927.386.99−0.070.8743.09
N3 (2)116.241.2726.063.25−0.070.8546.01
N4 (2)117.431.5027.538.22−0.060.8042.35
N5 (2)105.491.2328.398.05−0.060.6642.00
R1142.531.2726.614.63−0.041.6849.68
R2143.061.0926.334.38−0.021.6951.72
R3143.070.9326.454.34−0.031.7851.93
Note: 1 to 5: different welding parameters, 6 and 7: different base materials, 8 to 11: different welding parameters for the Y and double Y grooves, P1 to P4: Reverse pre-distortion, N1 to N5: Extremely higher bead, R1 to R3: Reproducibility of test nos. P1 to P4 (Refer to Table 1 for details). (1) Fatigue limit at 10 7 cycles. Table 7 lists the required fatigue limit of E curve for different base material thicknesses. (2) Failed to meet the E curve requirements of the BV rule [26].
Table 7. Fatigue test results for different base material thicknesses.
Base Material
Thickness (mm)
Fatigue   Limit   at   10 7   Cycles   ( MPa ) The Ratio of the Test Result to the Requirement (%)
BV Rule Requirement [26]Test Results
2046.9647.36101
2546.9641.9089
3045.2755.21122
4042.7457.21134
Table 8. Concordance rate of the fractured and acute angle sides.
Angular Distortion (°)No. of Specimen (EA)No. of Specimen with the Accordance SideConcordance Rate (%)
exceed 1°13813396
exceed 0.5°16916095
exceed 0.2°19617087
Table 9. Regression results for the weld bead profiles and the fatigue limit.
Factor XResult of the Statistical Analysis
X1X2X3 Adjust   R 2 The p-Value for Each Factor
X1X2X3
Angular distortionBead shape ratio-0.87<0.05<0.05-
Toe angleAngular distortion-0.87<0.05<0.05-
Bead heightAngular distortion-0.84<0.05<0.05-
Bead heightAngular distortionBead width0.87<0.05<0.05<0.05
Table 10. The regression equations for the conditions that the angular distortion is 0.7° and the required S-N curve is the E curve of the BV rule. The data was from Ref. [26].
Regression
Equation
Weld Bead Profiles
Weld Bead Height
(mm)
Weld Bead Width
(mm)
Weld Toe Angle
(°)
(4)Refer to Table 11Refer to Table 11No restriction
(5)No restrictionNo restrictionMin. 124
(6)Max. 6.2No restrictionNo restriction
(7)Refer to Table 11Refer to Table 11No restriction
Table 11. Bead height and width meeting the E curve requirements of the BV rule when the angular distortion is 0.7°: (a) by Equation (4); (b) by Equation (7).
(a)(b)
Bead Width (mm)Bead Height (mm)Bead Width (mm)Bead Height (mm)
204.9205.0
215.1215.3
225.4225.6
235.6235.8
245.9246.1
256.1256.3
266.3266.6
276.6276.9
286.8287.1
Publisher’s Note: MDPI stays neutral with regard to jurisdictional claims in published maps and institutional affiliations.

