Article

Assessment of Quality of Fishery Resources in the Northeastern South China Sea

1
South China Sea Fisheries Research Institute, Chinese Academy of Fishery Sciences, Guangzhou 510300, China
2
Key Laboratory of Marine Ranching, Ministry of Agriculture and Rural Affairs, Guangzhou 510300, China
3
National Digital Fisheries (Marine Ranching) Innovation Sub-Center, Guangzhou 510300, China
4
Scientific Observing and Experimental Station of South China Sea Fishery Resources and Environments, Ministry of Agriculture and Rural Affairs, Guangzhou 510300, China
*
Author to whom correspondence should be addressed.
J. Mar. Sci. Eng. 2022, 10(7), 930; https://doi.org/10.3390/jmse10070930
Submission received: 7 June 2022 / Revised: 2 July 2022 / Accepted: 5 July 2022 / Published: 6 July 2022
(This article belongs to the Special Issue Marine Wild Fish Stocks Conservation)

Abstract

:
The quality of fishery resources and its assessment is critical and a key to the sustainable development and management of fisheries. In this paper, the quality of fishery resources in the northeastern South China Sea was assessed by analyzing the survey data of fishery resources obtained through bottom trawling in 1964–1965, 1997–1999, 2006–2007, and 2017. The results show that fishery resources in the study region have declined significantly. In 2017, the density of fishery resources in the region was only 19.53% of that in 1964–1965. Overall, the quality of fishery resources in the region showed a downward trend with a quality grade index ranging from 0.30 to 0.42. It was in a critical condition from 1997 to 2007, and in poor condition from 2007 to 2017. In the 53 years from 1964 to 2017, the quality index of fishery resources in the region has decreased by 0.70, with an average decline of 0.13 every 10 years. In the past 20 years, the decline rate of the quality of fishery resources in the northeastern South China Sea has slowed.

1. Introduction

Located at the interface between the world’s largest continent and the ocean, the north of the South China Sea is rich in marine resources. Meanwhile, the northeastern South China Sea is important for the production, consumption, and export of aquatic products, which play important roles in China [1]. According to the 2020 Guangdong Rural Statistical Yearbook, Guangdong, a province in the northeastern South China Sea, relies on marine fisheries, with a total of 943,000 fishermen and fisheries employees [2]. Fishery resources are the premise of fisheries production; the basic resources for the survival of people working in the fisheries industry; the food to ensure regional social stability; an important component of the marine ecosystem; and the material basis for sustainable marine development [3,4]. The quality and rational utilization of fishery resources have a direct impact on the sustainable development of the region’s society, economy, and environment.
One of the keys to assessing the sustainable development and utilization of marine fishery resources is quality [5]. At present, scholars at home and abroad have carried out some research on the assessment of the quality of fishery resources [6,7,8,9,10,11,12,13,14,15,16,17,18,19,20,21]. Most of these evaluation index systems have higher or more requirements for data, and only a few are based on survey data. The sustainable utilization of fishery resources in northwest Pacific Ocean was evaluated based on catch statistics [22]. Based on the field investigation and research on fishery resources and the statistical data of fishery production in China, a quality evaluation index system of offshore fishery resources was constructed, and the quality of fishery resources in the Beibu Gulf was assessed [5]. However, there is no report on the assessment of the quality of marine fishery resources in the northeastern South China Sea. Most simple evaluations based on fishery production statistics are insufficient to reflect the state of marine fishery resources and cannot provide an effective data support for the sustainable development of marine fisheries.
The main fishing method for marine fisheries in the northeastern South China Sea is bottom trawling [23], of which the fishes caught consist of a variety of species. In the past five years, bottom-trawled marine fisheries accounted for approximately 50% of the total marine fisheries of Guangdong, a province adjoining the northeastern South China Sea [2]. This study was based on the bottom trawling survey data of fishery resources in the region. Combined with the statistical data of the fishery production, this study used a proven and feasible fishery resources quality evaluation system to assess the quality of fishery resources in the study region in order to provide references for the scientific management, sustainable development, and utilization of fisheries.

2. Materials and Methods

2.1. Study Area and Fishery Data

The study area is located in the northern South China Sea, 107°–120° E, 17°–24° N. From 1964 to 1965, the study area of fishery resources in the northeastern South China Sea covered the coastal waters with a depth of less than 120-m in the 200-m exclusive economic zone of Guangdong, where 55 survey stations were arranged in a checkerboard manner (Figure 1).
From 1997 to 1999, the survey of fishery resources in the northeastern South China Sea covered the shallow waters below the 100-m isobath in the northern South China Sea, where 87 survey stations were arranged in a checkerboard manner (Figure 1).
From 2006 to 2007, the survey of fishery resources in the northeastern South China Sea covered the shallow waters below the 200-m isobath in the northern South China Sea, where five sections were arranged roughly orthogonal to the isobath with a total of 45 survey stations (Figure 1).
In 2017, the survey of fishery resources in the northeastern South China Sea covered the coastal waters with a depth of less than 100 m in the 200-M exclusive economic zone of Guangdong, where 45 survey stations were arranged in a checkerboard manner (Figure 1).
The data used in this assessment are mainly derived from the survey of the fishery resources obtained through bottom trawling in the northeastern South China Sea in 1964–1965, 1997–1999, 2006–2007, and 2017. In addition, the total output of marine fishing and the output and power of trawlers in Guangdong from 2007 to 2017 in the Guangdong Rural Statistical Yearbook were also used.

2.2. Evaluation Indicators

In this study, seven indicators [5] were selected concerning the quantity of fishery resources, structure of fishery resources, and development of fishery resources (Table 1). The indicator data were obtained mainly from the survey results of bottom trawling in the northeastern South China Sea and relevant data from the Guangdong Rural Statistical Yearbook. In view of the relative stability of the fishery ecosystem in the northern South China Sea in the 1960s and the decline in marine fishery resources [24,25], this study assumed that the index of fishery resources status was 1 at that time.

2.2.1. Total Resource Density Index (D)

This indicator reflects the total stock of fishery resources, which is calculated as follows:
D = D k D 0  
where Dk represents the total average resource density in the k-th year, D0 represents the total average resource density of fishery resources in the northeastern South China Sea from 1964 to 1965.

2.2.2. Resource Density of Main Economically Important Species (d)

This indicator reflects the resources of economically important species, which is calculated as follows:
d = i = 0 n d i d i 0 n
where di represents the resource density of the i-th species, di0 represents the resource density of the i-th species from 1964 to 1965, and n represents the number of main economically important species, that is, 14.
We selected 14 species with large catches and high economic value over the years as the main economically important species in the northeastern South China Sea, including Saurida tumbil, Saurida undosquamis, Muraenesox cinereus, Priacanthus macracanthus, Decapterus maruadsi, Parargyrops edita, Sparus latus, Nemipterus japonicus, Nemipterus bathybius, Therapon theraps, Upeneus sulphureus, Upeneus japonicus, Trichiurus lepturus, and Psenopsis anomala.

2.2.3. Average Body Length of Main Economically Important Species (L)

This indicator reflects the measurement of main economically important species, which is calculated as follows:
L = i = 0 n l i l i 0 n
where li represents the average body length or fork length or anal length of the i-th species, and li0 represents the average body length or fork length or anal length of the i-th species from 1964 to 1965, and n represents the number of main economically important species, that is, 14.

2.2.4. Proportion of Resources of Main Economically Important Species (P)

This indicator is the proportion of total catch of the 14 main economically important species in the survey of total catch of the trawl, reflecting the quality of fishing catch species, which is calculated as follows:
P = d k · D 0 D k · d 0
where dk represents the total average resource density of 14 main economically important species (groups) in the k-th year, Dk represents the total average resource density of fishery resources in the k-th year, d0 represents the total average resource density of 14 main economically important species (groups) from 1964 to 1965, and D0 represents the total average resource density of fishery resources from 1964 to 1965.

2.2.5. Ratio of Fish Resources to Crustacean and Cephalopod Resources (R)

Cephalopods and crustaceans have short life cycles, and the ratio of fish resources to their resources, to a certain extent, reflects the stability of fishery resource structure. The formula for calculation is as follows:
R = F k · C 0 C k · F 0
where Fk represents fish resources in the k-th year, F0 represents fish resources from 1964 to 1965, Ck represents the total resources of cephalopods and crustaceans in the k-th year, and C0 represents the total resources of cephalopods and crustaceans from 1964 to 1965.

2.2.6. Ratio of Total Resources to Total Output (T)

This indicator reflects the fishing intensity, which is calculated as follows:
T = T R k · T O 0 T O k · T R 0
where TRk represents the total fishery resources in the northeastern South China Sea in the k-th year, TR0 represents the total fishery resources in the northeastern South China Sea from 1964 to 1965, TOk represents the total output of fishery resources in the northeastern South China Sea in the k-th year, and TO0 represents the total output of fishery resources in the northeastern South China Sea from 1964 to 1965.

2.2.7. Catch per Unit Effort of Trawler (E)

Catch per unit effort of the trawler reflects the input and output of trawl fishery, which is calculated as follows:
E = T P k · T K 0 T K k · T P 0
where TPk represents the total output of trawling fishery in the northeastern South China Sea in the k-th year, TP0 represents the total output of trawling fishery in the northeastern South China Sea from 1964 to 1965, TKk represents the total power of trawlers in the northeastern South China Sea in the k-th year, and TK0 represents the total power of trawlers in the northeastern South China Sea from 1964 to 1965.

2.2.8. Grade Index

The grade index of fishery resources quality (I) is obtained according to the weighting of 7 indicators selected for the evaluation [5]. The weight of each indicator is determined by the expert assignment method, which is calculated as follows:
I = 0.214D + 0.179d + 0.130L + 0.117P + 0.104R + 0.131T + 0.125E
The grade index of fishery resources quality (I) has a value between 0 and 1; the higher the value, the better the quality of fishery resources. It can also be divided into 5 levels [5] (Table 2).

3. Results

3.1. Changes in Indicators of Fishery Resources Quality

3.1.1. Total Resource Density Index (D)

From March 1964 to May 1965, the South China Sea Fisheries Research Institute of the Chinese Academy of Fishery Sciences conducted monthly trawl surveys in the northeastern South China Sea; each station trawled for 2 h at a towing speed of 3 kn and with a 16-m sleeve net. According to the surveyed average catch, the coastal fishery resource density of Guangdong from March 1964 to May 1965 was calculated by the swept area method [26], and the total average resource density is 2156.30 kg/km2, while that in 1997–1999, 2006–2007, and 2017 were 658.80 kg/km2, 1084.39 kg/km2, and 421.03 kg/km2, respectively (Table 3). Therefore, the total resource density index (D) of fishery resources in the northeastern South China Sea in 1997–1999, 2006–2007, and 2017 were 0.33, 0.50, and 0.20, respectively.

3.1.2. Resource Density of Main Economically Important Species (d)

The resource density of 14 main economic types in the northeastern of the South China Sea from 1964 to 195, 1997 to 1999, 2006 to 2007 and 2017 are listed in Table 4. The resource density index of main fishery economic categories in each period is 0.12, 0.13 and 0.06 respectively. Compared with 1964–1965, the resource density of main economic types in the northeastern of the South China Sea decreased seriously.

3.1.3. Average Body Length of Main Economically Important Species (L)

The fishery resources surveys conducted in the northeastern South China Sea from 1964 to 1965 and 2017 only recorded the average body weight of fish. Therefore, the average body length or anal length of fish was estimated according to the power function of fish body weight and body length. Based on this calculation, the body length index (L) of main economically important fish species in the northeastern South China Sea from 1997 to 1999, 2006 to 2007, and 2017 are 1.11, 1.03, and 0.88, respectively (Table 5).

3.1.4. Proportion of Resources of Main Economically Important Species (P)

From 1964 to 1954, the total average resource density of fishery resources in the northeastern South China Sea was 2156.30 kg/km2, and the average resource density of 14 main economically important species was 77.76 kg/km2. In 1997–1999, 2006–2007, and 2017, the total average resource density of fishery resources in the northeastern South China Sea was 718.36 kg/km2, 1084.39 kg/km2, and 421.03 kg/km2, respectively, while the average resource density of 14 main economically important species was 95.47 kg/km2, 117.94 kg/km2, and 56.52 kg/km2, respectively. Therefore, the proportion of resources of main economically important species (P) in the northeastern South China Sea in 1997–1999, 2006–2007, and 2017 was 0.26, 0.23, and 0.27, respectively.

3.1.5. Ratio of Fish Resources to Crustacean and Cephalopod Resources (R)

The density of fish, crustaceans, and cephalopods resources in the northeastern South China Sea in 1964–1965, 1997–1999, 2006–2007, and 2017 are shown in Table 6. The ratio of fish resources to crustacean and cephalopod resources in each period was 0.75, 0.27, and 0.12, respectively.

3.1.6. Ratio of Total Resources to Total Output (T)

According to the 2018 Guangdong Rural Statistical Yearbook, the Investigation Report on Bottom Trawling Fish Resources in the Northern South China Sea (East of Hainan), and the statistics of fishery production in Guangdong, the marine capture in the northeastern South China Sea was calculated, as shown in Table 7. Based on this calculation and fishery resources density of each period, the ratio of total resources to total output (T) in the northeastern South China Sea in 1997–1999, 2006–2007, and 2017 was 0.06, 0.11, and 0.04, respectively.

3.1.7. Catch per Unit Effort of Trawler (E)

According to the 2018 Guangdong Rural Statistical Yearbook, the Investigation Report on Bottom Trawling Fish Resources in the Northern South China Sea (East of Hainan), and the statistics of fishery production in Guangdong, the trawl output and the total power of trawlers in the northeastern South China Sea in each period were calculated, as shown in Table 8. Based on this calculation, the CPUE of trawl fishery in the northeastern South China Sea from 1997 to 1999, 2006 to 2007, and 2017 were 0.57, 0.50, and 0.56, respectively.

3.1.8. Change Trend of Seven Indicators

Figure 2 shows the changes in the seven indicators of fishery resources quality grade index in the northeastern South China Sea. On the whole, the seven indicators show a downward trend, among which the total resource density index (D), resource density of 14 main economically important species (d), proportion of resources of 14 main economically important species (P), ratio of fish resources to crustacean and cephalopod resources (R), and ratio of total resources to total output (T) show a significant decline in 1997–1999, 2006–2007, and 2017. In contrast, the average body length of 14 main economically important species (L) increased first then decreased, and the catch per unit effort of trawler (E) decreased first then increased.

3.2. Quality of Fishery Resources in the Northeastern South China Sea

The evaluation index of fishery resources quality in the northeastern South China Sea for 1964–1965, 1997–1999, 2006–2007, and 2017 was 1.00, 0.42, 0.41, and 0.30, respectively, showing a downward trend, as shown in Figure 3. According to the grade index of fishery resources quality evaluation index (Table 2), the quality of fishery resources in the northeastern South China Sea was in a critical condition from 1997 to 1999 and from 2006 to 2007, and in a poor condition in 2017. In the 53 years from 1964 to 2017, the quality status index of fishery resources in the northeastern South China Sea has decreased by 0.70, with an average decline of 0.13 every 10 years. The period from 1964 to 1997 saw the most significant decline, with a decrease of 0.58 in the evaluation level index and a decline rate of about 0.18 every 10 years. From 1997 to 2007, it decreased by 0.01, and the decline rate was 0.01 every 10 years, and from 2007 to 2017, it decreased by 0.11, with a decline rate of 0.11 every 10 years. It shows that the decline rate of fishery resources quality in the northeastern South China Sea has slowed in the past 20 years.

4. Discussion

At present, scholars and managers are paying more attention to the sustainable use of fishery resources [33,34,35,36], making it the essence and core of the sustainable development of fisheries, and one of the most important issues in China’s fisheries management [37,38,39]. The evaluation index system of fishery resources quality based on survey data used in this study comprehensively considered the density, quality, and fishing pressure of fishery resources, which can reflect the usage and development potential of fishery resources. In this assessment, the northeastern South China Sea also includes the coastal waters of Guangdong, while the calculation of the output and power of trawlers mainly relies on data of the coastal waters of Guangdong.
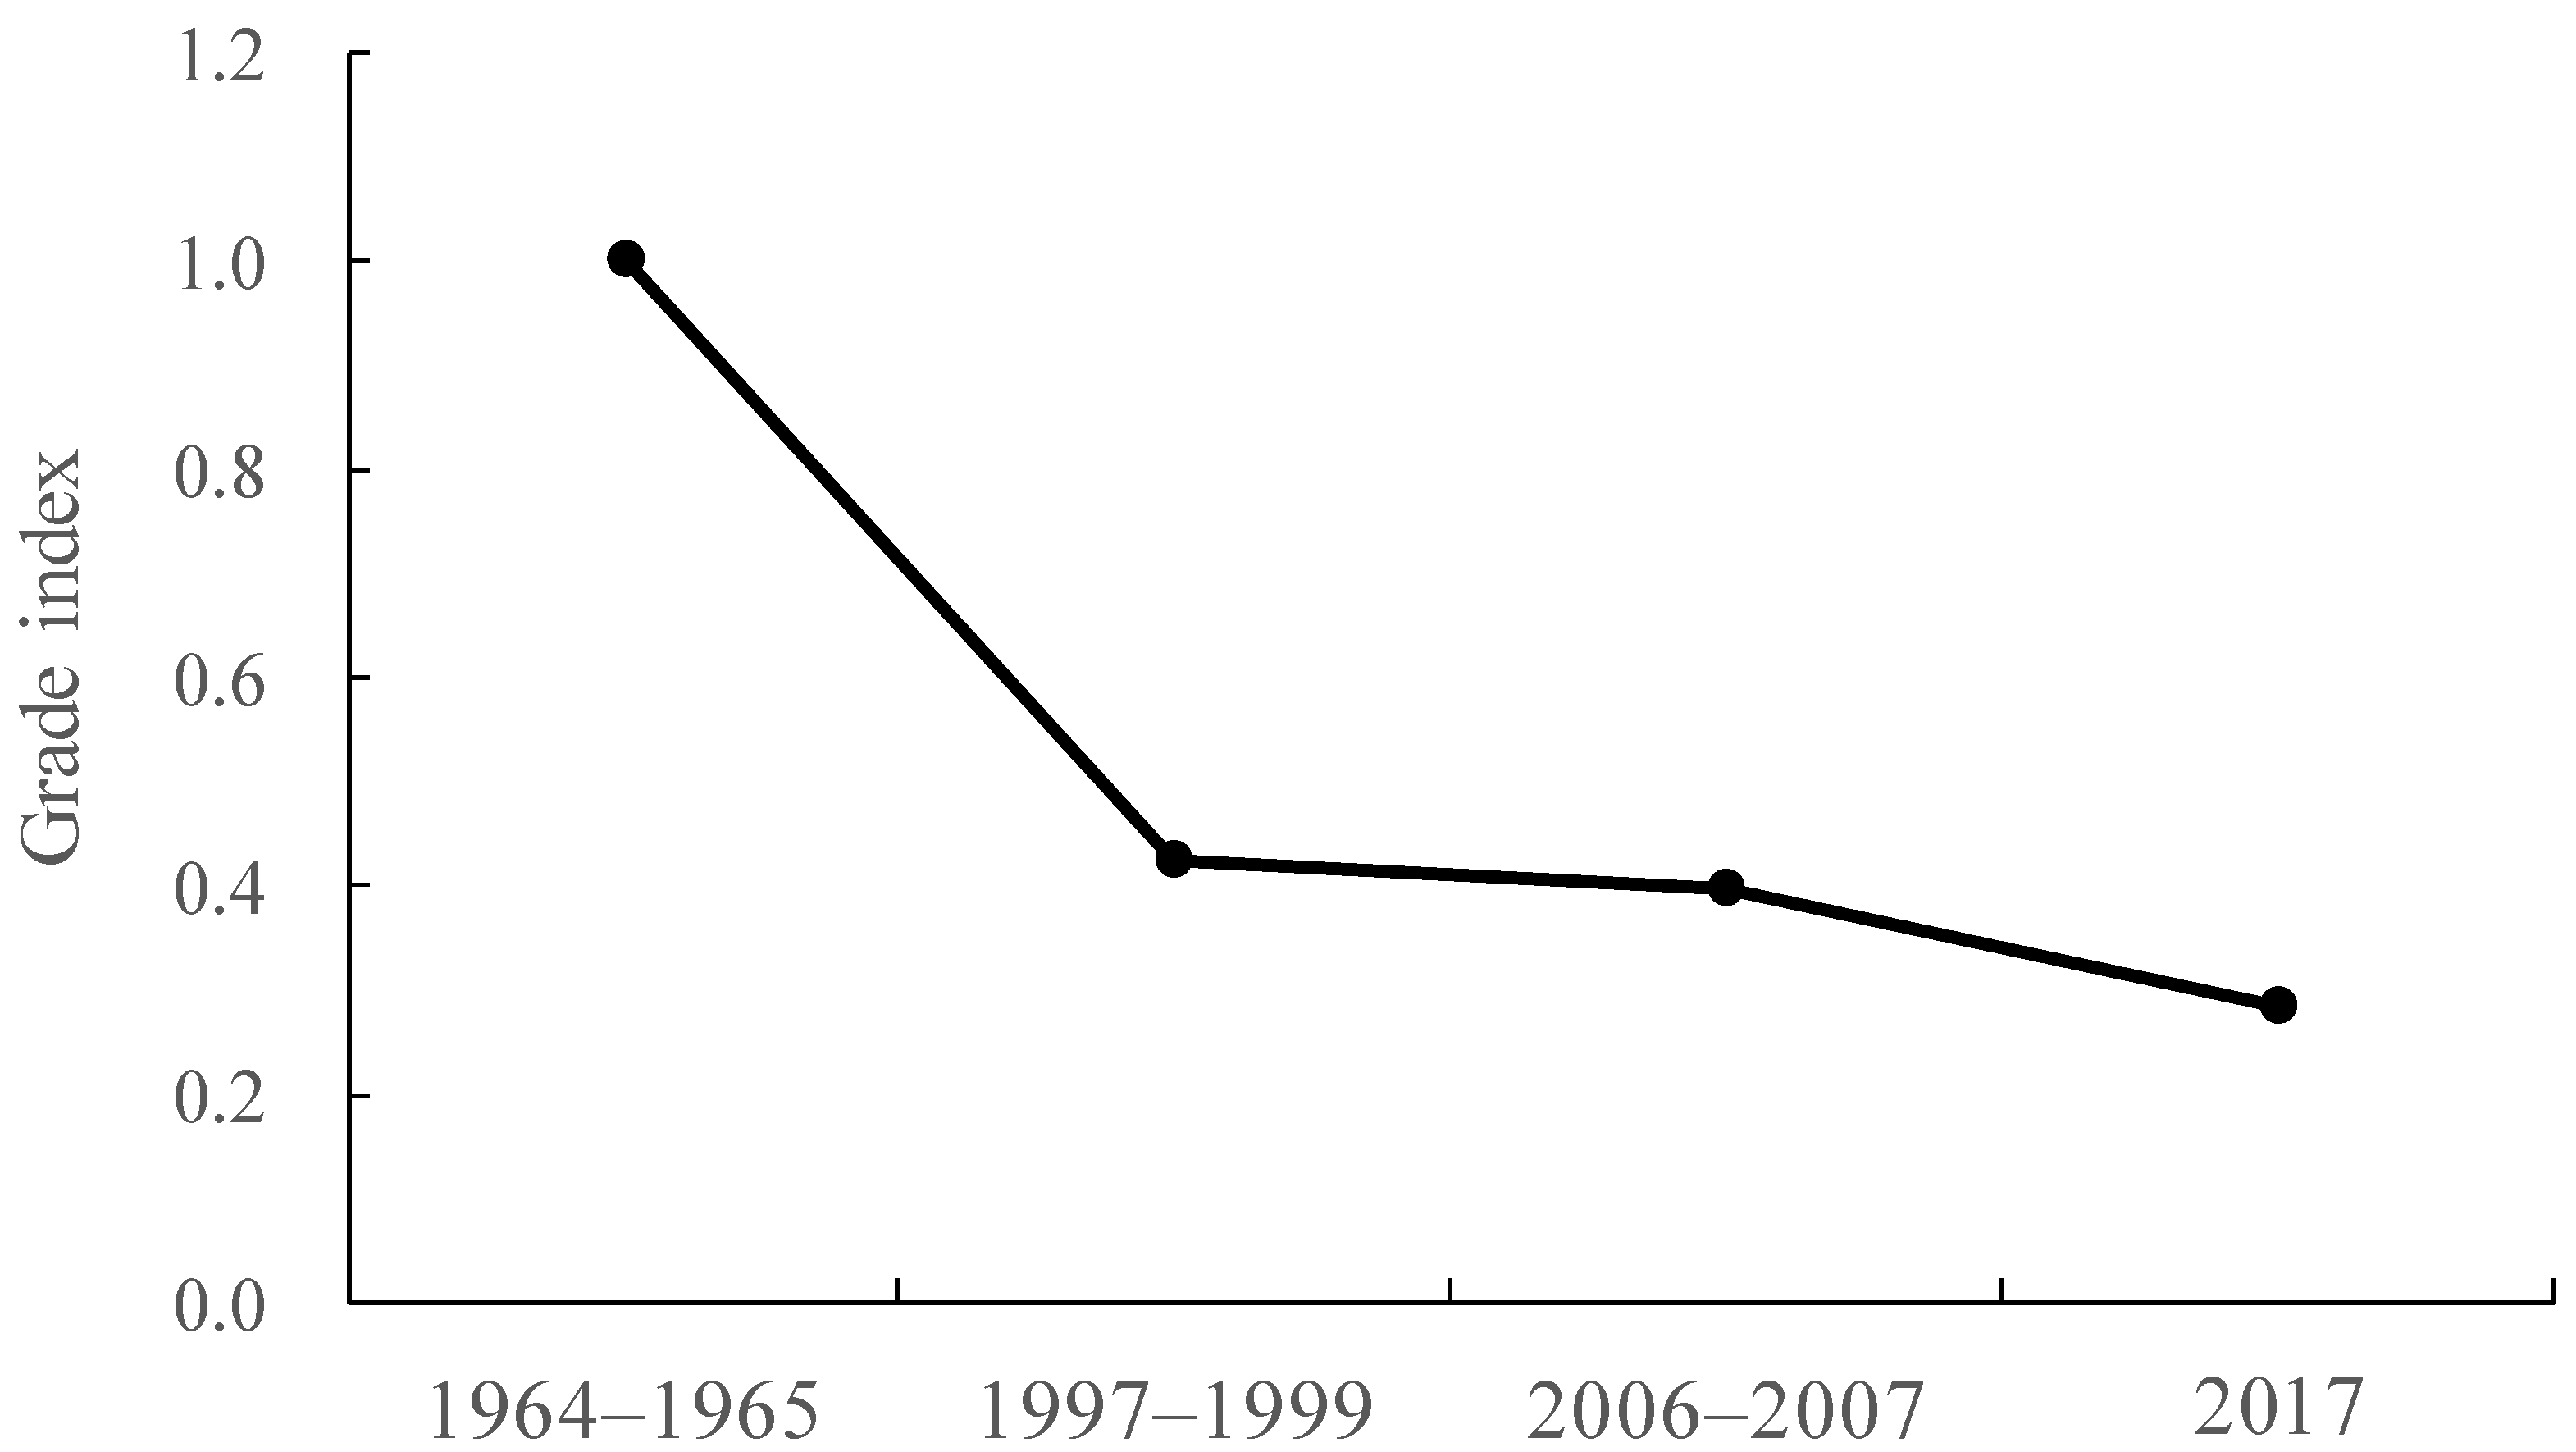
The results show that in the past 53 years, the quality of fishery resources in the northeastern South China Sea has generally shown a downward trend, the quality of fishery resources is in a critical and poor condition, and the development quality of fishery resources is getting worse, which are consistent with the hierarchical grey comprehensive evaluation model applied by Chen Zuozhi to assess the sustainable use of fishery resources in Guangdong, which is located at the northeastern South China Sea from 1978 to 2007 [4], and the carrying capacity of marine fishery resources in Guangdong from 1991 to 2017 assessed by Feng Fei [3].
In 1999, the South China Sea began implementing the summer fishing moratorium policy [40]. From 2004 to 2007, Guangdong implemented the fishery resources multiplication project. From 2002 to 2011, Guangdong carried out large-scale artificial reef construction [41], and 50 ecotypes artificial reef area were built in the coastal waters of Guangdong. Through follow-up investigations and effect evaluation, the construction and proliferation and release of artificial reefs have a significant impact on resource conservation and proliferation [42,43,44,45,46]. We presume that through these fishery resource conservation measures, the downward trend of fishery resource quality in the northeastern South China Sea has been slowed down, with a decrease of 0.01 in the 10 years from 1997 to 2007 and 0.11 in the 10 years from 2007 to 2017. From 2007 to 2017, the decline rate of the quality of fishery resources in the northeastern South China Sea increased compared with that in 1997–2007, which was possibly due to the seemingly decreased but in reality, increased, number of marine fisheries workers [47]. This led to the emergence of large numbers of illegal fishing vessels and exacerbated the overexploitation of fishery resources, resulting in a continuous increase in the total fishing volume [48] exceeding the carrying capacity of natural resources.
Among the evaluation indicators, the body length structure index (L) of 14 main economically important species showed a trend of first rising and then falling. The average body length of Saurida tumbil, Saurida undosquamis, Muraenesox cinereus, Priacanthus macracanthus, Nemipterus bathybius, Therapon theraps, Upeneus japonicus, and Psenopsis anomala decreased compared with 1964–1965, indicating that these species had experienced miniaturization. These findings were consistent with the conclusion on the evolution of biological characteristics of Nemipterus bathybius and Saurida undosquamis in the Beibu Gulf of the South China Sea studied by Chen Zuozhi et al. [49,50].
The proportion of the 14 main economically important species (groups) in the total catch showed a downward trend, indicating that the decline of economically important species resources was more prominent during the decline in fishery resources in the northeastern South China Sea. There was a slight increase between 2006 and 2017, which was mainly due to the relative decrease of bottom fish resources and the relative increase of pelagic fish resources in the northern South China Sea. Wang Xuehui et al. [51] reported that after the 1970s, the proportion of pelagic fish resources in the Beibu Gulf of the South China Sea has increased significantly.
The research results show that the ratio of fish resources to crustacean and cephalopod resources showed a continuous downward trend, and the proportion of cephalopod resources and crustacean resources gradually increased. It can be seen that the decline of fish resources was faster than that of cephalopod and crustacean resources, the structure of fishery resources had gradually changed, and the resources of cephalopods and crustaceans in fishery resources had relatively increased. Cephalopods and crustaceans have short life spans, can grow fast, and are more adaptable to environmental changes [52].
On the whole, the ratio of total resources to total output showed a downward trend, and slightly increased between 2006 and 2017. However, the CPUE of trawl fishery did not increase significantly, indicating that although the fishing effort of fishery resources increased, the fishery output did not significantly increase. This also indicates that the fishery resources in the northeastern South China Sea had declined. In 2017, the fishery resource density in the northeastern South China Sea was only 19.53% of that in 1964–1965.
The quality of fishery resources in the northeastern South China Sea has been in poor condition with a downward trend. This is mainly due to the decline in fishery resources, the proportion of fish, the reduction of resources of main economically important species, the miniaturization and short aging of fishery structure composition, and the increase of fishing pressure, where changes in the fishery structure in the northern South China Sea are mainly due to overfishing [53]. Through analysis, it can be concluded that relevant fishery management and conservation measures such as the summer fishing moratorium, artificial reef construction and proliferation and release, and “double reduction policy” have played a certain role in slowing down the decline of fishery resources, but they have not yet been able to reverse the continued decline. Many coastal countries in the world are actively seeking scientific sustainable fishery management measures [54,55,56]. Therefore it is suggested that the conservation measures of relevant fishery resources should continue to be strengthened, and fishery resources management strategies should be strictly implemented to slow down or even improve the quality of current fishery resources in the northeastern South China Sea [57,58,59].

5. Conclusions

This study evaluated for the first time the quality of fishery resources in the Northeastern South China Sea by evaluation indicators based on survey data. In the 53 years from 1964 to 2017, the quality index of fishery resources in the northeastern South China Sea has decreased by 0.70, with an average decline of 0.13 every 10 years. In 2017, the density of fishery resources in the northeastern South China Sea was only 19.53% of that in 1964–1965. The quality of fishery resources in the northeastern South China Sea was in poor condition in 2017. With the implementation of fishery conservation policies and measures in the South China Sea, such as the construction of artificial reefs, the fishery enhancement and the summer fishing moratorium policy, the decline of fishery resources in the South China Sea has been slowed down in the past 20 years. However, it still has not recovered to a good or very good state, the situation of low-quality fish and miniaturization is still relatively serious, and the fishing of economic species is still in an overfishing state – attention should be paid to this problem. Fisheries resource conservation policies and measures should be continuously implemented and managed, while raising the awareness of the population on resource conservation and protection.

Author Contributions

H.Y. designed this study. H.Y. and P.C. collected the fishery data from 1964 to 1965 and from 1997 to 1999. X.L. carried out survey of fishery resources in the northeastern South China Sea from 2006 to 2007 and in 2017. H.Y. analyzed the date. J.Y. and P.C. helped with data analysis. H.Y. wrote the article. All authors have read and agreed to the published version of the manuscript.

Funding

This research was funded by (1) R&D Projects in Key Areas of Guangdong Province, China (2020B1111030002); (2) Central Public-interest Scientific Institution Basal Research Fund, CAFS, China (2021SD02, 2020TD06).

Institutional Review Board Statement

Not applicable.

Informed Consent Statement

Not applicable.

Data Availability Statement

The raw data supporting this article are available on request from the authors. The data are not publicly available due to privacy policy.

Conflicts of Interest

The authors declare no conflict of interest.

References

  1. Wu, J.H. The present situation and predicament analysis of Guangdong modern fishery. J. Agric. Technol. 2021, 41, 171–174. [Google Scholar]
  2. 2020 Guangdong Rural Statistical Yearbook; China Statistical Publishing House: Beijing, China, 2020.
  3. Feng, F.; Chen, S.; Zhou, Y.B.; Xie, E.G.; Zhou, W.L.; Wu, Q.E. Analysis on carrying capacity of marine fishery resources in Guangdong Province. J. Fish. Inf. Strategy 2019, 34, 250–256. [Google Scholar]
  4. Chen, Z.Z.; Lin, Z.J.; Qiu, Y.S. Evaluation of sustainable utilization of fishery resources in Guangdong Province. J. Chin. J. Appl. Ecol. 2010, 21, 221–226. [Google Scholar]
  5. Su, L.; Chen, Z.Z.; Zhang, K.; Xu, Y.W.; Qiu, Y.S. Establishment of Quality Status Evaluation System of Fishery Resources in Beibu Gulf Based on Bottom Trawl Survey Data. J. Guangdong Ocean Univ. 2021, 41, 10–16. [Google Scholar]
  6. Chen, Z.Z.; Qiu, Y.S. Status and Sustainable Utilization of Fishery Resources of South China Sea. J. Hubei Agric. Coll. 2002, 22, 507–510. [Google Scholar]
  7. Chen, X.J.; Zhou, Y.Q. Study on the application of the systematic assessment of sustainable utilization to fisheries resources. J. J. Shanghai Fish. Univ. 2003, 12, 29–34. [Google Scholar]
  8. Chen, X.J.; Zhou, Y.Q. Study on the Early-warning system of sustainable use of fisheries resources based on BP model. J. Chin. Fish. Econ. 2003, 21, 23–25. [Google Scholar]
  9. Ye, S.Z.; Luo, D.L.; Yang, F.; Ma, C.; Chen, H.M. Constructing and evaluating an assessment indices system for fishery resources carrying capacity in Dongshan bay. J. Mar. Environ. Sci. 2018, 37, 493–498. [Google Scholar]
  10. Ni, H.E.; Lu, H.J. Construction and evaluation of indicator system for sustainable use of fishery resources in Zhoushan Fishing Ground. J. Chin. J. Appl. Ecol. 2003, 14, 985–988. [Google Scholar]
  11. Ni, H.E.; Lu, H.J. Grey evaluation and forecast of sustainable use of fisheries resources in Zhoushan fisheries ground. J. Oceanol. Limnol. Sinca 2009, 40, 319–324. [Google Scholar]
  12. Jin, G.H.; Yu, X.; Yang, P.M. Construction, Evaluation and Research on Indicator Methods Fishery Sustainable Development in Dengta City. J. Agric. 2014, 4, 120–124. [Google Scholar]
  13. Ting, K.H.; Lin, K.L.; Jhan, H.T.; Huang, T.J.; Wang, C.M.; Liu, W.H. Application of a sustainable fisheries development indicator system for Taiwan’s aquaculture industry. J. Aquac. 2015, 437, 398–407. [Google Scholar] [CrossRef]
  14. Elizabeth, T.M.; Jason, S.L. Evaluation of quantitative indicators for marine fish communities. J. Ecol. Indic. 2006, 6, 575–588. [Google Scholar]
  15. Ou, C.H.; Liu, W.H. Developing a sustainable indicator system based on the pressure-state-response framework for local fisheries: A case study of Gungliau, Taiwan. J. Ocean Coast. Manag. 2010, 53, 289–300. [Google Scholar] [CrossRef]
  16. Hernandez, S.A.; Segado, I.S.; Pitcher, T.J. Towards sustainable fisheries: A multi-criteria participatory approach to assessing indicators of sustainable fishing communities: A case study from Cartagena (Spain). J. Mar. Policy 2016, 65, 97–106. [Google Scholar] [CrossRef]
  17. Aguado, S.H.; Segado, I.S.; Vidal, M.; Pithcher, T.J.; Lam, M.E. The quality of fisheries governance assessed using a participatory, multi-criteria framework: A case study from Murcia, Spain. J. Mar. Policy 2021, 124, 104280. [Google Scholar] [CrossRef]
  18. Liu, S.X.; Cui, J.Y. Evaluation indictors system of carrying capacity of biological resources in Changshan archipelago sea area. J. Chin. Fish. Econ. 2010, 28, 86–91. [Google Scholar]
  19. Mora, C.; Myers, R.A.; Coll, M.; Libralato, S.; Pithcher, T.J.; Sumaila, R.U.; Zeller, D.; Watson, R.; Gaston, K.J.; Worm, B. Management effectiveness of the world’s marine fisheries. J. PLoS Biol. 2009, 6, e1000131. [Google Scholar] [CrossRef] [Green Version]
  20. Benaka, L.R.; Chan, A.N.; Kennelly, S.J.; Olsen, N.A. Using a tier classification system to evaluate the quality of bycatch estimates from fisheries. J. Rev. Fish Biol. Fish. 2021, 31, 737–752. [Google Scholar] [CrossRef]
  21. Farrell, O.H.; Grnaud, A.; Sagarese, S.R.; Babcock, E.A.; Rose, K.A. Ecosystem modeling in the Gulf of Mexico: Current status and future needs to address ecosystem-based fisheries management and restoration activities. J. Rev. Fish Biol. Fish. 2017, 27, 587–614. [Google Scholar] [CrossRef]
  22. Ding, Q.; Chen, X.J.; Li, G.; Fang, Z. Catch Statistics and the Sustainable Utilization of Northwest Pacific Ocean Fishery Resources. J. Resour. Sci. 2013, 35, 2032–2040. [Google Scholar]
  23. Yang, L. Impact of Fishing Gear and Fishing Method on Fisheries Resources in the North of South China Sea and Marine Environment. J. Mod. Fish. Inf. 1998, 13, 5–9. [Google Scholar]
  24. Chen, Z.Z.; Qiu, Y.S.; Xu, S.N. Changes in trophic flows and ecosystem properties of the Beibu Gulf ecosystem before and after the collapse of fish stocks. J. Ocean Coast Manag. 2011, 54, 601–611. [Google Scholar] [CrossRef]
  25. Wang, Y.Z.; Yuan, W.W. Changes of demersal trawl fishery resources in northern South China Sea as revealed by demersal trawling. J. South China Fish. Sci. 2008, 4, 26–33. [Google Scholar]
  26. Wilhm, J.L. Use of biomass units in Shannon’s formula. J. Ecol. 1968, 49, 153–156. [Google Scholar] [CrossRef]
  27. Li, Y.Z.; Shu, L.M.; Chen, G.B.; Yu, J.; Huang, Z.R. Numerical Biology of Important Fish Populations in the Northern South China Sea; Maritime Press: Beijing, China, 2019. [Google Scholar]
  28. Li, Q.; Zhang, C.; Ye, Z.J.; Tian, Y.J.; Liu, Y.; Li, J.C. A Comparative study on growth and mortality of Muraenesox cinereus and M. bagio in East China Sea and Yellow Sea. J. Period. Ocean Univ. China 2019, 49 (Suppl. II), 46–52. [Google Scholar]
  29. Li, J.E.; Zhou, H.T.; Xu, B.T.; Zhen, J.M. A Preliminary study on the growth of Sparus latus (Houttuyn). J. South China Norm. Univ. (Nat. Sci. Ed.) 1985, 1, 114–121. [Google Scholar]
  30. Wang, X.H.; Du, F.Y.; Qiu, Y.S. Length-Weight relationships of important commercial fishes in northern South China Sea. J. Oceanogr. Taiwan Strait 2006, 25, 262–266. [Google Scholar]
  31. Zhang, J.D.; Song, P.L.; Chen, G. Study on the age and growth of Therapon jarbua. J. Mar. Sci. 2002, 26, 62–66. [Google Scholar]
  32. Lu, Z.B.; Du, J.G. Variational characteristics of ecological parameters of Upeneus bensasi in southern Taiwan Strait. J. Fish. China 2008, 32, 362–368. [Google Scholar]
  33. Chen, X.J.; Zhou, Y.Q. Sustainable development of fishery resources. J. Resour. Sci. 2001, 23, 70–74. [Google Scholar]
  34. Zhen, S.S. Sustainable Utilization of Fisheries Resources in the Game Theory and Empirical Research. Master’s Thesis, Shanghai Ocean University, Shanghai, China, November 2011. [Google Scholar]
  35. Jiang, S.; Guan, X.M. A study of sustainable marine fisheries in Zhoushan city. J. Chin. Fish. Econ. 2015, 3, 15–20. [Google Scholar]
  36. Xu, L.Z.; Duan, Y.Y. Sustainable development path of marine fishery. J. Chin. Fish. Econ. 2008, 4, 16–20. [Google Scholar]
  37. Chen, X.J.; Zhou, Y.Q. Development and tendency of international marine fisheries management. J. Shanghai Fish. Univ. 2000, 9, 348–354. [Google Scholar]
  38. Lu, X.R. Study on Sustainable Utilization And Eeffetive Management Of Marine Fishery Resourees in China. Master’s Thesis, Huazhong Agricultural University, Wuhan, China, May 2005. [Google Scholar]
  39. Han, Y. Marine Fishery Resources Management and Policy Adjustment in China Since 1949. J. Chin. Rural Econ. 2018, 9, 14–28. [Google Scholar]
  40. Zhou, H.Y.; Dong, Z.J. Fishing ban in summer for the first time in South China Sea. J. Fish. Res. 2017, 34, 149–151. [Google Scholar]
  41. Wang, Q.; Yan, H.L.; Xu, F. Overview of artificial reef construction. J. Agricultural Technology Service. 2017, 3, 149–151. [Google Scholar]
  42. Wang, W.J. Evaluation of Effect of Five Artificial Reefs Area in Coastal Area of Guangdong. Master’s Thesis, Shanghai Ocean University, Shanghai, China, June 2018. [Google Scholar]
  43. Chen, P.M.; Qin, C.X.; Yu, J.; Shu, L.M.; Li, X.G.; Zhou, Y.B.; Yuan, H.R. Evaluation of the effect of stock enhancement in the coastal waters of Guangdong, China. J. Fish. Manag. Ecol. 2015, 22, 172–180. [Google Scholar] [CrossRef]
  44. Chen, P.M.; Yuan, H.R.; Jia, X.P.; Qin, C.X.; Cai, W.G.; Yu, J.; Shu, L.M.; Li, X.G.; Zhou, Y.B. Changes in fishery resources of Yangmeikeng artificial reef area in Daya Bay. J. South China Fish. Sci. 2013, 9, 100–108. [Google Scholar]
  45. Wang, H.; Chen, P.M.; Zhang, S.Y. Effect on fishery resources multiplication of artificial reefs. J. Guangdong Agric. Sci. 2009, 8, 18–21. [Google Scholar]
  46. Yuan, H.R.; Chen, P.M.; Li, H.Q.; Li, X.G.; Tang, Z.Z.; Qin, C.X.; Yu, J.; Shu, L.M. Preliminary evaluation on resources multiplication of artificial reef in Wushi Leizhou. J. Shanghai Ocean Univ. 2011, 20, 883–889. [Google Scholar]
  47. Xu, C.C.; Song, W.L.; Li, S.J. Research of Guangdong province ocean industry competitiveness evaluation basing on Boston matrix. J. Spec. Zone Econ. 2011, 2, 35–37. [Google Scholar]
  48. Liu, J.K.; Luo, H.S. Problems and Countermeasures on Sustainable Development of Marine Fisheries of China. J. Hebei Fish. 2005, 6, 3–5. [Google Scholar]
  49. Chen, Z.Z.; Kong, X.L.; Xu, S.N.; Qiu, Y.S.; Huang, Z.R. Dynamic changes of population parameters of Nemipterus bathybius in the Beibu Gulf. J. Fish. China 2012, 56, 584–591. [Google Scholar] [CrossRef]
  50. Chen, Z.Z.; Qiu, Y.S.; Xu, S.N.; Huang, Z.R. Evolution of biological characteristics of Saurida undosquamis (Richardson) in the Beibu Gulf, South China Sea. J. Fish. Sci. China 2012, 19, 321–328. [Google Scholar] [CrossRef]
  51. Wang, X.H.; Qiu, Y.S.; Du, F.Y.; Liu, W.D.; Sun, D.R.; Chen, X.; Yuan, W.W.; Chen, Y. Roles of fishing and climate change in long-term fish species succession and population dynamics in the outer Beibu Gulf, South China Sea. J. Acta Oceanol. Sin. 2019, 38, 1–8. [Google Scholar] [CrossRef]
  52. Doubleday, Z.A.; Prowse, T.A.A.; Arkhipkin, A.; Pierce, G.J.; Semmens, J.; Steer, M.; Leporati, S.C.; Lourenco, S.; Quetglas, A.; Sauer, W.; et al. Global proliferation of cephalopods. J. Curr. Biol. 2016, 26, R406–R407. [Google Scholar] [CrossRef] [Green Version]
  53. Zhang, K.; Liao, B.C.; Xu, Y.W.; Zhang, J.; Sun, M.S.; Qiu, Y.S.; Chen, Z.Z. Assessment for allowable catch of fishery resources in the South China Sea based on statistical data. J. Acta Oceanol. Sin. 2017, 39, 25–33. [Google Scholar]
  54. Zondervan, F.Z.; Zondervan, N.A. Sustainable fishery management trends in Philippine fisheries. J. Ocean Coast. Manag. 2022, 223, 106–149. [Google Scholar]
  55. Akbari, N.; Bjornadl, T.; Failler, P.; Forse, A.; Taylor, M.H.; Drakeford, B. A Multi-Criteria Framework for the Sustainable Management of Fisheries: A Case Study of UK’s North Sea Scottish Fisheries. J. Environ. Manag. 2022, 70, 79–96. [Google Scholar] [CrossRef]
  56. Ziegler, F.; Groen, E.A.; Hornborg, S.; Bokkers, E.A.; Karlsen, K.M.; Boer, I.J.M. Assessing broad life cycle impacts of daily onboard decision-making, annual strategic planning, and fisheries management in a northeast Atlantic trawl fishery. J. Int. J. Life Cycle Assess. 2018, 23, 1357–1367. [Google Scholar] [CrossRef]
  57. Gun, W.L.; Huang, S.L. Comparative analysis of different implementary manners of the total allowable catch measure. J. Trans. Oceanol. Limnol. 2001, 4, 61–69. [Google Scholar]
  58. Mu, Y.T. Fishery Management: Focusing on Right-Based Regime; Publishing House of Ocean University of China: Qingdao, China, 2006. [Google Scholar]
  59. Yi, C.J.; Zhou, M.F.; Yu, C.G. Study on theory and application of government regulation to fisheries management in offshore China. J. Fish. China 2012, 36, 787–793. [Google Scholar] [CrossRef]
Figure 1. Survey stations in the northeastern South China Sea in different periods.
Jmse 10 00930 g001
Figure 2. Trends of changes in indicators for the assessment of fishery resources quality in the northeastern South China Sea.
Jmse 10 00930 g002
Figure 3. Trend of changes in the grade index of fishery resources quality in the northeastern South China Sea.
Jmse 10 00930 g003
Table 1. Evaluation index system of marine fishery resources quality.
ObjectiveCriterionIndicator
Grade index of marine fishery resources quality (I)Quantity of fishery resources (C1)Total resource density (D)
Resource density of 14 main economically important species (d)
Structure of fishery resources (C2)Average body length of 14 main economically important species (L)
Proportion of resources of 14 main economically important species (P)
Ratio of fish resources to crustacean and cephalopod resources (R)
Development status of fishery resources (C3)Ratio of total resources to total output (T)
Catch per unit effort of trawler
Table 2. Evaluation index system of marine fishery resources quality.
Range of Grade IndexFishery Resources Quality
0 ≤ I ≤ 0.19Very poor
0.20 ≤ I ≤ 0.39Poor
0.40 ≤ I ≤ 0.59Critical
0.60 ≤ I ≤ 0.79Good
0.80 ≤ I ≤ 1.00Very good
Table 3. Estimation of fishery resource density in the northeastern South China Sea from March 1964 to May 1965.
Survey TimeAverage Catch (kg/h)Trawling Time (h)Trawling Speed (kn)Sleeve Net Length (m)Fishery Resources Density (kg/km2)
March 196458.9823161990.42
April 196465.952225.63
May 196469.002328.56
June 196453.391801.77
July 196481.032734.54
August 196472.892459.84
October 196456.301899.97
November 196449.001653.62
December 196462.002092.33
January 196558.361969.49
February 196575.952563.11
Notes: In September 1964, affected by the typhoon weather, the survey could not be conducted as scheduled.
Table 4. Resource density of main economically important fish species in the northeastern South China Sea in different periods.
SpeciesFishery Resources Density (kg/km2)
1964–19651997–19992006–20072017
Saurida tumbil100.4818.268.258.23
Saurida undosquamis46.2318.377.928.16
Muraenesox cinereus77.623.6613.366.64
Priacanthus macracanthus74.032.892.490.25
Decapterus maruadsi40.837.194.563.32
Parargyrops edita64.291.6210.111.55
Sparus latus66.480.104.094.72
Nemipterus japonicus81.294.475.214.52
Nemipterus bathybius302.502.1625.018.86
Therapon theraps48.930.12/0.46
Upeneus sulphureus38.301.411.651.76
Upeneus japonicus42.771.4816.823.34
Trichiurus lepturus53.8732.666.953.89
Psenopsis anomala50.961.0711.510.83
Notes: No data on Therapon theraps was recorded in the trawling survey in 2006–2007.
Table 5. Body length index of main economically important fish species in the northeastern South China Sea in different periods.
SpeciesPower Function of Body Weight and Body LengthAverage Body Length (mm)
1964–19651997–19992006–20072017
Saurida tumbilW = 4.085 × 10⁻⁶ × L3.169 [27]247.0164165155.0
Saurida undosquamisW = 2.733 × 10⁻⁵ × L2.8103 [27]178.4149134130.2
Muraenesox cinereusW = 2.577 × 10⁻³ × L2.849 [28]92.988.4242.268.5
Priacanthus macracanthusW = 5.034 × 10⁻⁵ × L2.8524 [27]197.3151105135.2
Decapterus maruadsiW = 2.651 × 10⁻⁵ × L2.88995 [27]125.8165145161.0
Parargyrops editaW = 1.209 × 10⁻⁵ × L3.62 [27]55.412410370.3
Sparus latusW = 3.3925 × 10⁻⁵ × L2.9862 [29]140.771.3203.1217.5
Nemipterus japonicusW = 3.906 × 10⁻⁵ × L2.936 [30]124.1110111106.8
Nemipterus bathybiusW = 2.016 × 10⁻⁵ × L3.0487 [27]118.2115112113.5
Therapon therapsW = 3.8891 × 10⁻² × L2.8761 [31]12.031.3/11.3
Upeneus sulphureusW = 6.119 × 10⁻⁵ × L2.816 [27]112.212195115.8
Upeneus japonicusW = 2.2633 × 10⁻⁵ × L2.9905 [32]100.510092100.0
Trichiurus lepturusW = 6.732 × 10⁻⁵ × L2.718 [30]178.8186198184.8
Psenopsis anomalaW = 3.210 × 10⁻⁶ × L3.404 [27]156.4138128148.6
Table 6. Density of fishes, crustaceans, and cephalopods resources in the northeastern South China Sea in different periods.
SpeciesFishery Resources Density (kg/km2)
1964–19651997–19992006–20072017
Fishes2019.95658.80870.09272.939
Crustaceans36.2815.1387.2070.409
Cephalopods100.0744.44127.1077.642
Table 7. Marine capture and fishery resources density in the northeastern South China Sea in different periods.
Survey TimeMarine Capture (×104 t)Fishery Resources Density (kg/km2)
196533.232156.30
1997–1999194.06718.36
2006–2007159.361084.39
2017148.91421.03
Table 8. Trawl output and total power of trawlers in the northeastern South China Sea in different periods.
Survey TimeTrawl Output (×104 t)Total Power of Trawlers (kW)
196511.8874,709.94
1997–1999112.721,250,016.7
2006–200784.071,050,311
201773.69831,901
Publisher’s Note: MDPI stays neutral with regard to jurisdictional claims in published maps and institutional affiliations.

