Article

Is China’s Fishing Capacity Management Sufficient? Quantitative Assessment of China’s Efforts toward Fishing Capacity Management and Proposals for Improvement

1
Key Laboratory of Mariculture (Ministry of Education), Fisheries College, Ocean University of China, Qingdao 266003, China
2
Department of Marine & Fisheries Business and Economics, Pukyong National University, Busan 48513, Republic of Korea
*
Authors to whom correspondence should be addressed.
J. Mar. Sci. Eng. 2022, 10(12), 1998; https://doi.org/10.3390/jmse10121998
Submission received: 27 September 2022 / Revised: 4 December 2022 / Accepted: 7 December 2022 / Published: 15 December 2022
(This article belongs to the Special Issue Marine Wild Fish Stocks Conservation)

Abstract

:
As the country with the world’s largest fishing capacity, China suffers from the depletion of living marine resources, mainly caused by overexploitation, the effects of which also distinctly influence global sustainable utilization of marine resources and maritime order. The country has implemented a series of measures to control its national fishing capacity, notably since the late 1980s, and strongly expressed its responsibility and commitment to sustainable resource utilization in the 13th Five-Year Plan (2016–2020). This study quantitatively assesses the effect of China’s fishing capacity management efforts by examining changes in the fishing capacity of marine capture fisheries by region from 1979 to 2019 in Chinese waters, based on window data envelopment analysis (DEA), and further proposes directions for policy adjustment. The results suggest that China’s coastal and offshore fisheries are still subject to overcapacity of approximately 20%, despite major corrective efforts invested in past decades. This implies that China needs to further improve its fishing capacity management and set clear objectives, as determined by the availability of resources and regional features. Global fisheries management’s focus is shifting from input to output control, but overcapacity still threatens the sustainable use of fisheries resources in China and poses obstacles to other systems.

1. Introduction

On 12 January 2017, the Ministry of Agriculture of China (hereafter referred to as the MOA) proclaimed the country’s fisheries management objectives in the 13th Five-Year Plan (2016–2020). These include (1) reducing 20,000 fishing vessels and 1.5 million kW of fishing vessel engine power by strengthening the dual-control system (which was adopted in 1987 and controls both the number of marine motorized fishing vessels and their engine power), and (2) cutting catches from waters under its jurisdiction by approximately 24%—from 13.14 million tons in 2015 to 10.00 million tons by 2020. These factors represent a strong action plan to realize the 13th Five-Year Plan’s vision of constructing an “ecological civilization” in seas under MOA jurisdiction and protecting the marine ecosystem [1,2]. This indicates a serious commitment from China, as the world’s largest fish producer, to shoulder its responsibility regarding sustainable resource utilization [3].
Article 22 of the Fisheries Law of the People’s Republic of China stipulates that the total allowable catch should be set below the growth rate of aquatic resources [4]. According to a preliminary survey by the MOA, marine biological resources in China’s waters amount to approximately 16 million tons, of which the catch should not exceed 50–60%. Thus, the total allowable catch is estimated at 8–10 million tons [1,5,6].
Overcapacity control is the most challenging task in fisheries management. Under the government’s management, fishing efforts have decreased. However, it is difficult to find a clear rationale for the target level of fishing efforts. The Chinese fisheries management system should assess whether it sufficiently controls fishing efforts and set an appropriate target based on the results.
China’s fisheries management has prioritized the reduction of overcapacity by enforcing the dual-control system since 1987 [2,7]. Managing overcapacity has been a global issue, and for practical implementation, the 23rd Food and Agriculture Organization’s (FAO) Fisheries Committee adopted ‘the International Plan of Action for the Management of Fishing Capacity’ in 1999 [8]. Fishing capacity refers to a fishing vessel’s maximum production for a certain period if there are no restrictions on fishing activities under the given market, fishing resources, and technical conditions, based on production maximization. This concept is consistent with the measurement of production efficiency [9]. The FAO expert group meeting held in 2000 proposed data envelopment analysis (DEA)—a production efficiency analysis method—as a tool for measuring fishing capacity. Subsequently, DEA has been widely applied in fisheries [10].
Vestergaard et al. used DEA to measure the fishing capacity of each target fish species in the Danish gill net fishery. Consequently, overcapacities of 14.9% and 7.7–17.0% were observed for cod and other species, respectively [11]. Van Hoof and De Wilde evaluated the fishing capacity of the Dutch beam trawler fishery using DEA and found that 35.0% of decision-making units (DMUs) had an overcapacity of 5.0–20.0% [12]. Seo and Kim analyzed the dynamic fishing capacity of a large purse seine fishery in Korea, using window-DEA. They found that the change in overcapacity is consistent with business performance trends [13]. Castilla-Espino et al. analyzed the fishing capacity of anchovy fisheries in the southeastern Black Sea using DEA. They suggested appropriate measures in response to their findings that overcapacity trended upwards [14]. Cao et al. used DEA to assess the fishing capacity of a Vietnamese purse seine fishery, and the results sufficiently explained the business performance of fishing vessels [15].
As the need for fishing capacity assessment and management emerges globally, research on the use of DEA to evaluate Chinese fishing capacity is continuously being conducted. In China, DEA is used by many researchers as an assessment tool of fisheries management policies when there is a lack of data and quantitative evaluation methods. Zheng et al. measured the fishing capacity of 11 coastal regions using DEA during 1994–2005. They assessed the effect of the fisheries management measures and suggested using fishing capacity evaluation values as a comprehensive index for the quantitative appraisal of fishery management policies [16]. Sun and Lu also used DEA to analyze trends in the fishing capacity (2008–2014) of coastal regions and evaluate the effect of the dual-control system. By 2014, only a slight decrease (34–30%) was observed in the level of overcapacity of 2006, indicating that the system was rather ineffective [17]. Rao et al. also analyzed changes in fishing capacity during 2009–2014, per sea. Although there were differences between sea areas, the overall overcapacity level had gradually expanded, implying that fishing capacity management in recent years had little effect [18].
In China’s coastal and offshore fisheries, resources are depleted while fishing efforts steadily increase. Accordingly, fishing capacity management has been implemented, but fishing efforts and intensity are still extending. For sustainable fishery, an appropriate assessment should appraise whether overcapacity has been sufficiently managed, and an improvement plan must be proposed. Most previous studies in China were conducted by simply comparing static analysis results, using relatively short-term data. However, China’s fisheries management process has been enforced continuously since the 1980s, and relevant policy has been formed and adjusted in terms of the flow of China’s Five-Year Plans. Thus, existing studies have limitations in reflecting the characteristics of China’s policies, and fishing capacity analysis should adopt a longer-term perspective.
One purpose of this article was to evaluate the fishing capacity of China’s coastal and offshore fisheries using a dynamic approach. We utilized output-oriented window-DEA, which can measure fishing capacity trends over time, and the principle of the moving average method. Second, the change in fishing capacity, according to the implementation of relevant management policy, was analyzed to propose policy alterations for more effective management of fisheries based on the results.

2. China’s Coastal and Offshore Fisheries

2.1. Catch

As the world’s largest producer, China has achieved rapid development in marine capture fisheries, producing 40% of the world’s fish [19]. Production has increased 125 times, from 520,000 tons in 1949 to 64.8 million tons in 2019 [20,21]; this growth has solved food security problems and contributed to economic development [5]. However, marine capture fisheries in Chinese waters have faced the dilemma of overexploitation [22,23,24,25,26,27]. Accordingly, from the mid-to-late 1980s, fishery policy’s focus shifted from “wild fishing” to “farming” [28]. Since the 1990s, the aquaculture industry has grown explosively and continues to accelerate (Figure 1a). The proportion of catch in coastal waters, compared to total aquatic products, declined from 67.6% in 1978 to 18.8% in 2019, indicating that the development of Chinese fisheries during this period is attributable to aquaculture.
To manage China’s fisheries, various institutional systems have been implemented, including the Fisheries Law (1986), fishing license management (1986), a fishing vessel control system (1987), artificial reef fish multiplication and release programs (1989), a summer fishing moratorium (1995), zero-growth (1999) and negative growth (2000) targets, a fishing vessel buyback program (2002), a fisher exit and relocation system (2003), a marine protection zone installation (2011), and a total allowable catch (TAC) pilot program (2017) [29,30,31,32,33,34,35,36]. This series of input–output technology control measures and governance supports is aimed at facilitating sustainable utilization of fisheries resources [5].
Among these, the introduction of a zero-growth target in 1999 was the first step towards sustainable development of China’s coastal and offshore fisheries [37]. It was a turning point from policies focused on growth and development to those highlighting resource protection and sustainable use, serving as an opportunity to improve the perception of a need for resource protection and effective management of fisheries authorities, managers, and fishermen [7,37,38]. Resultingly, the long-term growth of China’s coastal fishery ended in 1999 [38], and catch has remained stagnant since then. More recently, catch was reduced by 25%—from 13,282,650 tons in 2016 to 10,001,515 tons in 2019—following the imposition of total catch control by the 13th Five-Year Plan in 2016.

2.2. Fishing Efforts

Chinese fishery management has primarily focused on fishing capacity control [7,39]. Despite these actions, the imbalance between the “output factor” and “input factor” is worsening [5]. In terms of catch expansion, Figure 1b shows that the engine power of fishing vessels (measured in kW) increased sharply, by more than 10% annually, until the late 1990s. Hence, it experienced a more-than-five-fold expansion, from 2,149,581 kW in 1979 to 11,517,164 kW in 1999. Thereafter, the number of fishing vessels decreased because of the dual-control system and fishing vessel reduction program, which reduced offshore fishing vessels from 222,000 in 2002 to 160,000 by 2020 to control fishing capacity. Moreover, fishing effort growth trends have become more moderate, starting with a zero-growth target in 1999 and progressing to negative growth in 2000. Accordingly, in 2019, the number of offshore fishing vessels decreased to 158,105. The increase in engine power also slowed down, though it continues its upward trend, indicating that the actual fishing effort per unit per vessel (kW/vessel) has been steadily expanding. This is because fishing intensity has increased—mainly by expanding engine power—subsequent to the introduction of the fishing vessel reduction program, along with fishing technology development. The catch per unit effort (catch/vessel) also increased gradually with control of the number of fishing vessels (Figure 1c).
During the fishery growth period (1980s~1990s), many rural laborers had “open access” to coastal and offshore fisheries, giving rise to a total of 1.15 million laborers in 1999. This expansion continued until the early 2000s, despite the growing restrictive policies on marine capture fisheries. Accordingly, the labor force contributed relatively extensively to fishing capacity before the 2000s. With the implementation of the fishermen relocation policy, the labor force decreased by 29%—from 1,143,318 in 2002 to 807,393 in 2019—and it is still maintained as a significant fisheries management measure (Figure 1d).
China’s fishing capacity management policy has had some effect, but most studies purport that it has failed to control practical fishing capacity [17,40]. With the adoption of marine ecosystem protection as the main agenda of the 13th Five-Year Plan, the fisheries management system has been further strengthened and supplemented [2]. A plan for managing fishing efforts and catch was presented, with the goal of achieving negative growth of marine capture fisheries in Chinese waters [1]. These elements have gradually decreased according to the target values.

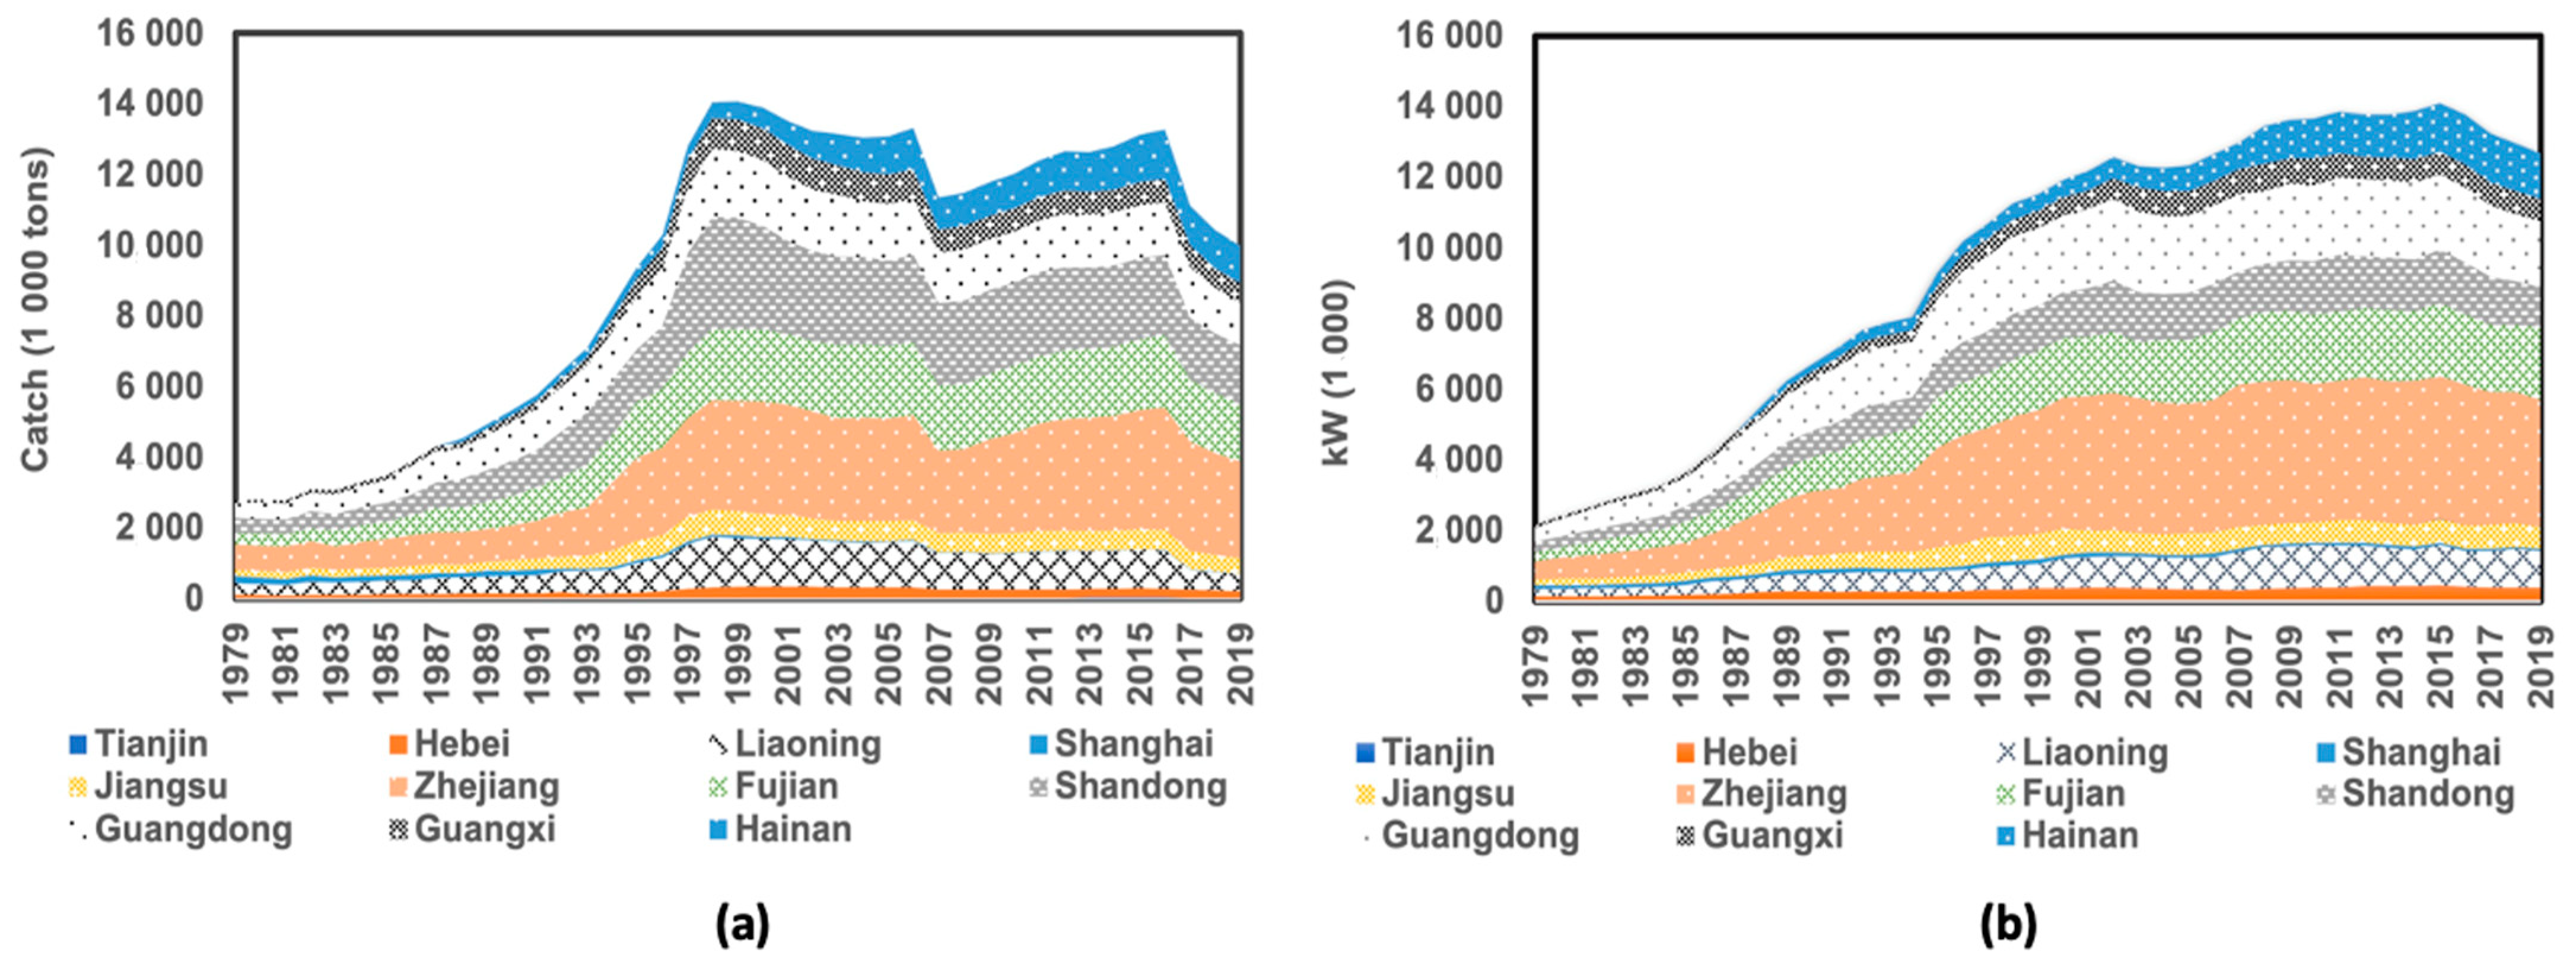
2.3. Catch per Region

China has 11 coastal regions—Tianjin, Hebei, Liaoning, Shanghai, Jiangsu, Zhejiang, Fujian, Shandong, Guangdong, Guangxi, and Hainan—along a coastline of approximately 18,000 km, bordering the Bohai Sea, Yellow Sea, East China Sea, and South China Sea. Each sea has different fishing industry structures and characteristics, depending on the standard of economic development and biological characteristics of adjacent areas [18,25]. Regions producing more than 1 million tons in 2019, with their proportional contributions, included Zhejiang (27.2% (Percentages quoted indicate each region’s proportion of total production)—2,723,652 tons), Shandong (16.8%—1,677,385 tons), Fujian (16.1%—1,611,613 tons), Guangdong (12%—1,195,747 tons), and Hainan (10.8%—1,079,148 tons) [20]. Most of these regions have long coastlines and wide sea areas, and catch is especially concentrated in the Yellow Sea and East China Sea. Other regions and their production levels were as follows: Guangxi (5.5%—550,819 tons), Liaoning (4.9%—487,098 tons), Jiangsu (4.5%—445,577 tons), Hebei (1.9%—190,132 tons), Tianjin 0.3%—26,952 tons), and Shanghai (0.1%—12,592 tons) [20] (Figure 2a). Except for Tianjin and Hainan, catch decreased in most regions after the introduction of the zero-growth policy.
Catch per sea in 2019 was as follows: the East China Sea contributed 40.8% (4,075,847 tons), the South China Sea 30% (3,003,791 tons), the Yellow Sea 22.9% (2,292,305 tons), and the Bohai Sea 6.3% (629,572 tons). Naturally, each sea has different characteristics. The East China Sea is relatively open and acts as a global fishing ground where commercially valuable fish species such as Trichiurus lepturus, Scomber japonicus, Portunus trituberculatus, and Larimichthys polyactis, among others, are caught [41]. In addition, it is the most developed area in coastal and offshore fisheries, due to its high productivity [42]. The South China Sea is the deepest and largest sea in China. Located at low latitude, it is an area characterized by a rich distribution of tropical ecosystems (coral, mangrove, etc.) and biodiversity [23,43]. However, the development of fisheries is slow, compared to that of other regions [44], and difficult to manage, as the region has the largest number of small-scale fisheries [45].
The Yellow Sea, a semi-enclosed sea located between China and the Korean Peninsula, is subject to major differences in water temperature and salinity, depending on the season. Various species of fish inhabit the Yellow Sea [46]. Moreover, as this sea offers spawning and feeding grounds for several major migratory fish species, fisheries of many species such as Engraulis japonicus, Scomber japonicus, and Scomberomorus niphonius, among others, have developed here [47,48]. Finally, the Bohai Sea—another semi-enclosed inland sea, surrounded by land on three sides—has a flat seabed with abundant food due to sediment flowing into it from rivers such as the Yellow River. Therefore, it is suitable for the breeding and growth of various species, such as crabs, shrimps, and shellfish [49]. However, the Bohai Sea was degraded due to the development of secondary industry in the coastal regions, excessive aquaculture, and overfishing [50]. Consequently, it shows low productivity in terms of coastal and offshore fisheries [49].

2.4. Fishing Efforts per Region

As shown in Figure 1a,b, China’s fishing efforts in coastal and offshore fisheries have been expanding through increased engine power rather than number of fishing vessels. Therefore, differences in vessels’ engine power per region correlate with fishing efforts in coastal and offshore fisheries (Figure 2b). In 2019, the engine power of fishing vessels per region was as follows: Zhejiang: 28.3% (3,586,000 kW), Fujian: 16.2% (2,054,137 kW), Guangdong: 14.6% (1,857,439 kW), Hainan: 10.1% (1,281,479 kW), Shandong: 9.0% (1,137,787 kW), Liaoning: 8.2% (1,044,408 kW), Guangxi: 5.1% (651,588 kW), Jiangsu: 5.0% (633,403 kW), Hebei: 2.7% (340,363 kW), Tianjin: 0.4% (55,616 kW), and Shanghai: 0.4% (43,332 kW). Among the regions with more than 1 million kW of engine power, all except Liaoning recorded catch in excess of 1 million tons in 2019. Most regions showed steady growth of fishing vessels’ engine power. Guangxi (804%), Fujian (785%), and Zhejiang (706%) demonstrated substantial growth compared to 1979. Conversely, Shanghai’s fishing vessel power decreased by approximately 34% compared to 1979, whereas Tianjin (106%) maintained its level.
In the 2000s, engine power growth slowed down due to stagnant growth of the fishing industry and the effects of the fishery management system (dual-control system, and so forth). Regionally, steady growth was observed, except in Jiangsu, Shanghai, and Tianjin. However, some regions (Liaoning, Fujian) still showed a slight increase or remained constant (Guangxi).
Actual fishing effort input is examined by evaluating the fishing effort input per fishing vessel (kW/vessel). In 2019, the average amount of fishing effort input per fishing vessel in China’s coastal and offshore fisheries was 80.210 kW. Per region, Zhejiang had the highest input (196.43 kW), followed by Shanghai (145.19 kW), Jiangsu (124.25 kW), Tianjin (124.25 kW), Fujian (87.04 kW), Hebei (79.36 kW), Guangxi (74.61 kW), Liaoning (64.12 kW), Shandong (60.26 kW), Hainan (52.43 kW), and Guangdong (49.00 kW). Regions with a large amount of actual fishing effort input per vessel are expected to exhibit large-scale production. However, among regions with an annual catch exceeding 1 million tons in 2019, most (including Shandong, Hainan, and Guangdong, but excluding Zhejiang and Fujian) exhibited lower fishing effort input per vessel than the overall Chinese average. Conversely, Shanghai and Tianjin showed a different trend. Shanghai’s production initially declined, before rising sharply from the mid-2000s to 2015, and then decreased again. Tianjin’s level fell from 102.597 kW in 1979 to 35.646 kW in 1997 (i.e., to 34.2% of its 1979 level) before rising again to 122.23 kW in 2019. Zhejiang is the largest producer in China, and its fishing effort input per vessel grew approximately tenfold from its low of 19.789 kW in 1985 to 199.788 kW in 2019.

3. Materials and Methods

3.1. Data and Variables

The data used in this study are from coastal and offshore fisheries in 11 coastal regions in China, obtained from the China Fishery Statistical Yearbook (1979–2019) [20]. The analysis completely utilizes all periodic data, and certain missing data are accounted for using the nearest neighbor method.
In this study, 11 coastal areas were set as the study subjects (DMU): Tianjin, Hebei, Liaoning, Shandong, Jiangsu, Zhejiang, Fujian, Shanghai, Guangdong, Guangxi, and Hainan. Many previous studies have evaluated the fishing capacity of marine capture fisheries in Chinese waters per sea area and region [18,25]. Given the varying economic development levels, geography, and ecological factors of different areas, regional fisheries also differ compared to each other. Generally, China takes charge of fisheries management under each local government, and public data, via the China Fishery Statistical Yearbook, also provide regional data; thus, this study was also conducted per sea area and region.
The sea area boundaries in each study varied according to the study objective and purpose, considering that the sea area is not clearly classified and that fishing activities do not occur in fixed locations. Moreover, the scope of conducting fishing activities is expanding with technological advancement. Herein, the boundaries are demarcated based on the main production areas, with reference to the production data per sea area and region, given in the fishery yearbook. Thus, we divide the 11 coastal regions into the Bohai Sea (Tianjin, Hebei), Yellow Sea (Liaoning, Shandong, Jiangsu), East China Sea (Zhejiang, Fujian, Shanghai), and South China Sea (Guangdong, Guangxi, Hainan) areas.
In this paper, the catches of coastal and offshore fisheries in 11 coastal regions are selected as an output variable. The labor force (number of fishermen), fishing effort (kW), and catch per unit effort (CPUE) (in fishery and conservation biology, catch per unit effort (CPUE) is an indirect estimate of the abundance of a target species; the figure mainly analyzes changes in the actual abundance of the target species; decreasing CPUE indicates overexploitation, and a constant CPUE indicates a sustainable resource state) [51] (catch/vessel)—a proxy variable for the number of resources—are chosen as input variables. In China, the only available public data on fishing efforts are the number of fishing vessels, engine power, and fishermen per region, included in the fishery yearbook. Consequently, these factors have been employed as input variables in a majority of previous studies [16,17,18,25]. In these analyses, kW was set as an input factor for fishing effort, considering that: (1) China’s fisheries management system targets fishing vessels and their engine power; and (2) fishing intensity has been rising due to increasing engine power. CPUE was set as a proxy variable of resources due to data limitations. To date, most of the assessments have not considered the stock status. However, the resource quantity is an important factor that affects fishing activities and should therefore be considered in the fishing capacity analysis [13,52].
In the China Fishery Statistical Yearbook, labor force data of coastal and offshore fisheries are classified in the “Marine capture fisheries” sector, along with high-seas fisheries. To obtain appropriate data, high-seas fisheries’ data should be subtracted from marine capture fisheries’ data. In previous studies, the labor force of high-seas fishing (L) was estimated using ordinary least squares (OLS) with vessel engine power (K). In general, a certain proportional relationship is assumed between the two variables because larger fishing vessels require more workers [17,53]. The regression equation, L = 0.0442 K 738.1   ( R 2 = 0.7955 ) was estimated and applied to measure the magnitude of high-seas fisheries’ labor force.

3.2. Data Envelopment Analysis (DEA)

DEA is an efficiency measurement method based on linear mathematical programs. It evaluates the empirical efficiency frontier—the relative technical efficiency of production activities—by using data between the inputs and outputs of the evaluation target, subject to several criteria applied to the production possibilities set. The basic principle of DEA is that it maximizes the efficiency of the decision-making unit (DMU) to be evaluated, under the constraint that the efficiency of all comparative DMUs is less than or equal to 1, as stated by Equation (1) [54].
M A X   m = 0 M Z m U j m n = 1 N Z n X j n s . t .   m = 0 M Z m U j m n = 1 N Z n X j n   1 Z m , Z n 0 ,   j = 1 ,   2 ,   , p J p
First, it is assumed that there are J DMUs, each of which uses N inputs to produce M outputs, and all inputs and outputs are non-negative. U j m and X j n represent actual observations of inputs and outputs of DMUs, respectively, whereas Z m and Z n refer to the calculating factors and weights of DMUs, respectively. The ratio of inputs to outputs becomes an index that measures efficiency.
However, because this ratio has countless solutions, a multiplier model has been proposed to avoid errors. The multiplier model is converted into a dual theory based on the duality problem, for convenient calculation. Färe et al. (1989) presented the following model by dividing input factors into both variable and fixed input factors and applying a constraint formula [54].
M A X   Θ 1  
Θ 1 , U j m j = 0 J Z j U j , m ,   m
j = 0 J Z j X j , m ,   X j , n ,   n F χ
j = 0 J Z j X j , m ,   λ j , n ,   X j , n ,   n V
Z j 0 ,   j
λ j , n 0 , n V χ
Here, Θ 1 is a scalar of the value of the objective function for increasing production, and the maximum output is derived by multiplying the actual output. In addition, F χ and V represent fixed input and variable input, respectively, Z j is the weight of the inputs, and λ j n is the input utilization rate of the variable inputs. Equation (3) is a conditional expression of the output of a DMU, Equation (4) is a constraint condition for fixed inputs, and Equation (5) is a constraint condition for variable inputs.
The output vector of the jth DMU must exist in the linear combination of the output vectors of all J DMUs. Moreover, by placing the input vector of the jth DMU outside the linear combination of all DMUs, the ratio of the input vector’s distance from the boundary represents the efficiency of each DMU. Therefore, the obtained Θ 1 becomes the efficiency index of the jth DMU and has a value of less than or equal to 1. If Θ 1 is 1, it is on the frontier and becomes a technically efficient DMU, according to Farrell’s efficiency definition. If the linear problem is calculated J times for each DMU, the Θ 1 value for each DMU can be obtained [55].

3.3. Window-DEA

The window-DEA used in this study is a dynamic method to analyze the gradual change in efficiency. Most previous studies reported the limitation of measuring efficiency from cross-sectional data at a specific time and then estimated dynamic changes in efficiency from this data. Accordingly, window-DEA was proposed [56], as it analyzes the efficiency trend of each DMU by estimating DEA, using the principle of the moving average method for multiple periods [57,58,59].
In window-DEA, the width of the window, which should be determined as between 1 and the entire period, needs to be set first. In each window, even the same DMU is regarded as a different DMU if the period differs in width. The window width is assumed to be p using data for k periods; for n DMUs, the number of windows is w = k p + 1 , and the number of DMUs of each window is p n . In window-DEA, efficiency is estimated for p n DMUs from period 1 (the first window) to p , and then backward by one period by estimating p n DMUs from period 2 (the second window) to p + 1 . It is a method of moving and evaluating until the last window. Based on the results, the trends, stability, and fluctuations in the efficiency of each DMU are analyzed.
Previously, the window width was set according to the intent and characteristics of existing studies [60,61,62,63]. If the window width is too narrow, the results are not very different from those of cross-sectional analysis. Conversely, if the width is too wide, it is difficult to grasp the trend per period [60]. Therefore, in this study, the width is set to 3 years to obtain the best balance between information and stability of the efficiency measurement [56].

4. Results

4.1. Fishing Capacity Trends in China’s Waters

We derived the trends of catch capacity of China’s coastal and offshore fisheries from 1979 to 2019, using the three-year moving average (Figure 3a). The fishing capacity of marine capture fisheries in Chinese waters improved from the start of the observation period (1979–1981), though it decreased after the peak period (1987–1989) (86.6%), reaching its lowest level in the 1996–1998 period (73.7%). Fishing capacity showed a rising trend again until the early 2000s. Since then, it has fluctuated in the range of 76.5–82.0%. Thus, the analysis establishes that China’s coastal and offshore fisheries are in a state of long-term overcapacity.
We compare the results with the development trend of China’s coastal and offshore fisheries. Input and output factors reflect double-digit growth from the early 1980s to 1994. Accordingly, fishing capacity rose, up to the 1987–1989 period, but decreased as the increase in input factors exceeded the increase in output, indicating that overcapacity expanded. Thereafter, fishing capacity rose from the 1996–1998 period to the early 2000s. This establishes that growth was affected by the rapid increase in fishing capacity in Tianjin (from 38.6% to 62.5%), Hebei (from 45.1% to 79.0%), and Hainan (from 37.3% to 82.0%), all of which originally had low fishing capacities.
Since the 2000s, overcapacity has fluctuated at a level of 18.0–23.5%. Although fishing efforts were managed early through policies such as the dual-control system (1987), the effect was rather insufficient. While catch stagnated and decreased due to resource depletion and catch control, the actual amount of fishing effort (kW) increased, further accelerating resource reduction and causing additional overcapacity. The period of expansion of overcapacity overlapped with the period of a sharp decline in catch. Overcapacity has thus been hindering the implementation of an effective management system.
Finally, coastal regions are divided into groups, according to which the regions with annual production exceeding 1 million tons in 2019 are classified as the upper group (Zhejiang, Shandong, Fujian, Guangdong, Hainan), and those producing less than 1 million tons are classified as the subgroup (Guangxi, Liaoning, Jiangsu, Hebei, Tianjin). Fishing capacity is compared per group (Table 1). The overcapacity of the upper group is largely stable at a low level during the observation. However, overcapacity in Hainan changed from 67.3% (1987–1989) to 9.2% (2017–2019), showing significant improvement. The subgroups generally show a downward trend in fishing capacity and large variability after the growth period in fisheries.

4.2. Fishing Capacity Trends in China’s Waters, Per Sea

Fishing capacity trends are also compared per sea, as shown in Table 2. Different trends are observed for each sea, which are related to their features (Figure 3b). The East China Sea showed a stable fishing capacity level exceeding 90% until the 2000–2002 period, after which it declined to 75% (2007–2009 period) before resuming an upward trend during the 2015–2017 period. At the beginning of the observation, the South China Sea demonstrated a medium fishing capacity level of approximately 60–80%. This gradually increased in the 2000s and peaked during the 2004–2006 period. The Yellow Sea displayed a relatively stable, high-level trend during the early stages, followed by a downward trend from the 1990s. The overcapacity of the Bohai Sea maintained the highest level throughout the observation period. Per region, Shandong (11.9%), Guangdong (12.7%), Zhejiang (13.4%), and Fujian (13.6%) had the lowest average overcapacity levels, in that order. These areas have a wide range of coasts and fishing grounds in their respective waters.

4.2.1. The Bohai Sea

The Bohai Sea displays the lowest level of fishing capacity, with great variability because of the area’s low fishery productivity, based on its features that include a semi-enclosed sea, narrow sea area, and coastal desertification [50]. Per region, Tianjin and Hebei display different results starting from the mid-2000s.
Tianjin had a low fishing capacity level until the early 1990s, which began to improve in the mid-1990s. This increase was presumably influenced by the high mobility of fishing vessels [16] and the heightened production of anchovies in the Yellow Sea [20], which increased from 1115 tons in 2012 to 38,063 tons in 2013. The fishing capacity in Tianjin was 100% in the 2014–2016 period. In Hebei, more than 50% of the sea area is cultivated, and dependence on coastal and offshore fisheries is low. Fishing capacity in Hebei has been steadily falling after reaching its highest level (76.3%) in the 2006–2008 period.

4.2.2. The Yellow Sea

As a fishing ground for various commercial fish species, the Yellow Sea has shown high productivity and fishing capacity, but a gradual increase in overcapacity, along with decreasing resources, has been observed [48]. Liaoning is most actively engaged in mariculture in China. Geographically, it borders the inner part of the Yellow Sea, resulting in a relatively narrow sea area. Consequently, the proportion of coastal and offshore fisheries is gradually diminishing. Catch mainly comprises squid, anchovies, and mackerel, but production has recently declined sharply, causing overcapacity to increase. Inland aquaculture is active in Jiangsu, and the proportion of coastal fisheries is relatively low in this area. With the recent gradual decrease in production, overcapacity has increased significantly.
Shandong borders the middle part of the Yellow Sea and the Bohai Sea, and fishing activities are actively conducted in both seas [64]. Shandong’s waters contain abundant fishery resources because of the southern Bohai Bay, Laizhou Bay, Yanwei, and Qingdao Marine fishing grounds, among others, where spawning and feeding of many major economic fish species occur [48]. Thus, the CPUE, which indicates the abundance of resources, has been highest in this region. Moreover, it has had a low level (below 10%) of overcapacity during all periods.

4.2.3. The East China Sea

Fishing capacity in the East China Sea was stably close to 100% until the early 2000s, when a downward trend emerged, but it increased again in the 2014–2016 period. The decrease is presumably attributable to fluctuations in Shanghai, as the fishing capacities of Zhejiang and Fujian were stable during all periods. Shanghai’s fishing capacity falls sharply (to 28.6%) in the 1995–1997 period and increases in the 2013–2015 period. Shanghai has a short coastline, and serious damage was caused to the ecosystem due to the rapid development of secondary industry and overfishing [65,66]. Resultingly, catch declined sharply, and coastal fisheries gradually shifted to high-seas fisheries [65].
Zhejiang and Fujian display stable fishing capacities during the observation period. Zhejiang, located along the center of the East China Sea, has a vast sea area, the longest coastline, and the largest number of islands, aiding the early development of the fishing industry [42]. It has almost no overcapacity due to the extensive production of various commercial fish species (Trichiurus lepturus, Scomber japonicus, Portunus trituberculatus, Larimichthys polyactis, and squid, among others). Fujian is an area where both aquaculture and marine capture fisheries are actively maintained, and it has shown a stable catch of mainly Trichiurus japonicus, Decapterus maruadsi, and squid. Although catch has decreased since 2016, the fishing capacity generally has a steady trend.

4.2.4. The South China Sea

The South China Sea region shows a relatively stable fishing capacity trend since the 1990s, after initial fluctuations. In Guangdong, production by coastal and offshore fisheries is comparably large, and the level of fishing capacity has changed stably, despite the recent decline in catch. Conversely, Guangxi is characterized by low catch from coastal and offshore fisheries. Its overcapacity is gradually expanding due to the recent decrease in production. Hainan previously formed part of Guangdong Province but became independent in 1988. Compared to other regions, Hainan has continued to grow as a region with a high proportion of coastal and offshore fisheries, in which overcapacity is also steadily decreasing.

5. Discussion

China, with the world’s largest fishing capacity, faces the dilemma of marine resource depletion due to overexploitation [22,24,49,50,67,68,69,70]. In addition, overcapacity in China has a distinct influence on the global maritime order and the sustainability of fisheries [71,72,73]. Chinese public policy has responded to this dilemma in various ways for decades, emphasizing fishing capacity control. Moreover, China has shown its responsibility and commitment to sustainable resource utilization by setting intense goals. However, our results suggest that China’s coastal and offshore fisheries remain in a long-term overcapacity state, despite fishing capacity management. Current measures are insufficient and should be improved and adjusted. The implications for rational fishing capacity management are, therefore, as follows:
First, fishing capacity needs to be managed at a higher level, considering the reduction in fished stocks and catch control [23,49,50,74,75,76]. Due to overexploitation, China’s coastal and offshore fisheries experience ecological, social, and economic problems, especially the destruction of marine ecosystems, degradation of coastal waters [49,50], decreased resource density [24,67] and abundance [22], and miniaturized fish species [67,68,69,70]. These changes result in catch reduction, lower incomes for fishermen [76], and further excess fishing capacity.
Additionally, overcapacity impedes effective fisheries management [5,67,77]. The summer fishing moratorium significantly affected resource conservation in Chinese waters [78,79]. However, recovered resources are frequently exhausted in a short time because of intensive fishing in the following fishing season [5]. Therefore, in an overcapacity state, management measures are hard to achieve [5,77]; thus, Chinese fisheries still require fishing capacity controls [5,80].
In 2017, China proposed a more stringent plan to reduce catch and fishing intensity. As of 2019, both aspects have been well-controlled in line with the targets, but overcapacity still exists. The policy was successful, but its target level was comparatively insufficient, considering the decrease in the catch. Such output control and resource depletion will continuously intensify. Moreover, this effect of reduced overcapacity from the policy, observed in our results, is temporary. Based on previous patterns, generally, implemented policies typically improve overcapacity slightly in the short-term, but fishing efforts will expand again. In this respect, to achieve a long-term effect, fishing capacity should be regularly assessed under a clear objective with constantly readjusting measures.
Second, fishing capacity appraisal needs to account for the characteristics of, and changes in, regions and fisheries. In the case of Tianjin, the highest overcapacity (68.9%) occurred at the beginning of the investigation, whereafter it improved from the 2000s and disappeared during the 2014–2016 period. This substantial improvement arose from an increase in catch [20], which was mostly attributed to increased anchovy catch in the Yellow Sea, not the Bohai Sea, to which Tianjin is adjacent. Tianjin has relatively strong fishing power, though the scale of its fishing industry is small. Therefore, its high surplus causes idle fishing capacity and further operating costs. To survive, the fishermen expand their fishing grounds. Theoretically, its result shows that overcapacity has been removed and productivity increased. However, in practice, the coastal waters adjacent to Tianjin still suffer from overcapacity. This phenomenon is not limited to Tianjin [20,68].
Therefore, disputes often arise not only between domestic regions [75], but also with neighboring countries [71,73], such as the Philippines, Malaysia, Vietnam, and Korea [81]. First, removing the actual excess fishing capacity and preparing measures to prevent excessive fishing competition are required. Catch management systems, such as total allowable catch (TAC) (TAC is a fisheries resource management system for output management that limits the number of individual fish species that can be caught annually in a specific water area and allows fishing only within that limit) [82], can improve issue of fishing competition and intensive fishing activities for commercially valuable fish species [83] and be flexibly applied according to regional, industrial, and ecological characteristics for species and regions. Countries with advanced fishery, such as the United States (U.S.) [84] and Europe [82], introduced this system early, and Korea [85] and Japan [86] have implemented it since the late 1990s, expanding the scope of the target species. China has been conducting a TAC pilot program since 2017 [80]. In 2017, three pilot areas were designated in China. These relate to blue crabs in the northern fishing grounds of Zhejiang, jellyfish in Laizhou Bay in Shandong, and the Pearl River Estuary in Guangdong. Since its inception, three more regions have been added. However, its implementation is limited due to the complexity of fisheries, such as multispecies fisheries, and lack of assessment of fish stocks. The program has not reached the practical execution stage, and the target scope remains rather limited [5,28].
The United States has a stable TAC system, comprising catch share programs (a catch share program is a fishery management system that allocates secure privilege to harvest a specific area or percentage of a fishery’s total catch to individuals, communities, or associations; examples of catch shares are individual transferable quotas (ITQs), individual fishing quotas (IFQs), etc.) introduced in the 1990s, to manage fishery resources based on output control [87]. In this system, the acceptable biological catch (ABC) relevant to each species is suggested through scientific research. The TAC must be set at a lower level than the ABC and considered bycatch [88]. Because the catch quota is allocated within the TAC, resource management is stably implemented [89] and has been clearly effective in assuring resource conservation [89,90]. As quotas are distributed among individuals, cooperatives, and regions, fishing competition has decreased [91,92]. In addition, the United States applies a regional quota system (the Community Development Quota (CDQ) program was introduced in 1992 and provided rural communities in western Alaska with access to important resources in the Bering Sea fishery; the program allocates a set quota to participating communities and requires those communities to use the proceeds for further economic development of the community through investments in fisheries-related industries, infrastructure, and education) based on TAC to allocate a certain percentage of catch to the Alaska/Western Pacific region [93], or an integrated TAC system comprising multiple fish species such as benthic species [88] and others.
Considering the cases of neighboring countries, Korea and Japan might be significant for China’s fisheries management. These countries have similar environments to China—in particular, Korea and China border the Yellow Sea—and have considerable relevance in fisheries regarding matters such as ecosystems and target fish species. Korea introduced a TAC system in 1999, but there are still many obstacles such as the cognition and participation of fishers, small-scale fisheries, limitations in resource assessment, complex interests relating to neighboring countries, and fishing competition. China should find a way forward through Korea’s experience.
China is facing difficulties in enforcing a TAC system due to various limitations—including data limits and fisheries characteristics (complexity, bycatch) [5,28]. China should actively imitate the successful case of the United States and replicate approaches followed by Korea and Japan, which have similar environments. Thereby, policymakers could design China’s TAC system to sufficiently reflect the country’s environments. For example, national maritime research institutes—like the Yellow Sea Fisheries Research Institute (which mainly conducts research related to the Yellow Sea and Bohai Sea), East China Sea Fishery Research Institute, and South China Sea Institute of Oceanology—can establish and operate TAC pilot bases. Based on this, China should develop a Chinese fisheries management system that reflects the features of, and differences between, each region, such as multi-species TAC and integrated TAC, as in the U.S. case. Specifically, Tianjin’s fishing vessels’ increased catch in Shandong inevitably affects Shandong’s fisheries resources. In response to this problem, a competent organization may conduct a regional joint TAC program or designate specific fishing areas for major competing species. Such an approach can lead to the execution of systematic fisheries resources management and correct the fisheries order.
Evaluating China’s fishing effort management system using DEA is useful for analyzing the fisheries as a whole in the context of limited data. However, regardless of these advantages, the reality of individual regions, fisheries, and fish species and results may differ, and follow-up studies should address these limitations.

6. Conclusions and Future Work

Overexploitation is the oldest and biggest problem facing Chinese coastal and offshore fisheries; thus, China’s fisheries management system has concentrated on controlling overcapacity. This study appraises the effectiveness of fisheries management by evaluating changes in fishing capacity. Globally, the paradigm of fisheries management is shifting from input to output control. Our findings demonstrate that management of fishing capacity remains essential. According to the fishing capacity management system, fishing activities have undergone many changes, which affect fishing competition and maritime order and are not limited to China. To achieve sustainable use of fisheries resources, fishing capacity assessment should be conducted regularly, and input–output control measures should be continuously adjusted according to these assessments’ outcomes.
This study has limitations in terms of both data and methods. Due to constraints on available data, we analyzed (1) fishing capacity using only basic production factors (fishing vessel size, engine power, and labor force) as input variables. Although these factors explain fishing effort, they are limited in reflecting realities. Therefore, future research should use factors reflecting actual fishing activities, such as the number of days and hours spent fishing. We also analyzed (2) fishing capacity per region only. In the future, data per species and fishery should be evaluated, which will have useful policy implications for fisheries management.
Moreover, DEA—a non-parametric mathematical programming technique—is used in this study to measure fishing capacity. Because DEA is a deterministic model, it is subject to the limitation that all measurement errors beyond the control of the estimated output are included as inefficient factors, which could exaggerate the degree of inefficiency [94]. To overcome this challenge, the method can be supplemented by the parametric stochastic frontier analysis (SFA) method [94]. Due to the characteristics of parametric methods, it is possible to obtain statistical verification of input variables and estimate probabilistic errors and inefficiencies separately. To utilize parametric methods, various data such as production factors and ecological data are required. Therefore, data should be collected using several channels, such as improving scientific resource investigations, introducing an electronic log system [95], and strengthening the catch report system.

Author Contributions

Conceptualization, H.-J.Y., Y.M. and D.-H.K.; data curation, D.P. and H.L.; formal analysis, H.-J.Y. and D.P.; methodology, H.-J.Y., H.L. and D.-H.K.; visualization, H.-J.Y. and H.L.; writing—original draft, H.-J.Y.; writing—review and editing, Y.M. and D.-H.K. All authors have read and agreed to the published version of the manuscript.

Funding

This study was supported by the China Agriculture Research System of MOF and MARA.

Conflicts of Interest

The authors declare no conflict of interest.

References

  1. MOA. The Notice of the MOA on Further Strengthening Domestic Fishing Vessel Management and Implementing the System for Managing Total Marine Fisheries Resources. 20 February 2017. Available online: http://www.moa.gov.cn/nybgb/2017/derq/201712/t20171227_6130861.htm. (accessed on 20 November 2022).
  2. Su, M.; Wang, L.; Xiang, J.; Ma, Y. Adjustment trend of China’s marine fishery policy since 2011. Mar. Policy 2021, 124, 104–322. [Google Scholar] [CrossRef]
  3. Cao, L.; Chen, Y.; Dong, S.; Hanson, A.; Huang, B.; Leadbitter, D.; Little, D.C.; Pikitch, E.K.; Qiu, Y.; de Mitcheson, Y.S. Opportunity for marine fisheries reform in China. Proc. Natl. Acad. Sci. USA 2017, 114, 435–442. [Google Scholar] [CrossRef] [PubMed] [Green Version]
  4. MOA. Revised Draft of the Fisheries Law of the People’s Republic of China. 2019. Available online: https://npcobserver.files.wordpress.com/2019/08/fisheries-law-2019-draft.pdf (accessed on 20 November 2022).
  5. Han, Y. Marine fishery resources management and policy adjustment in China since 1949. China Rural Econ. 2018, 9, 14–28. [Google Scholar]
  6. MOA. Accelerate the Transformation and Structural Adjustment to Promote the Transformation and Upgrading of Fisheries. 2016. Available online: http://www.moa.gov.cn/govpublic/YYJ/201604/t20160426_5107394.htm (accessed on 20 November 2022).
  7. Yu, H.; Yu, Y. Fishing capacity management in China: Theoretic and practical perspectives. Mar. Policy 2008, 32, 351–359. [Google Scholar] [CrossRef]
  8. FAO. International Plan of Action on the Measurement of Fishing Capacity; FAO: Rome, Italy, 1999. [Google Scholar]
  9. Ward, J. Measuring and Assessing Capacity in Fisheries; FAO: Rome, Italy, 2003; Volume 433. [Google Scholar]
  10. FAO. Report of the Technical Working Group on the Management of Fishing Capacity; FAO: Rome, Italy, 2000. [Google Scholar]
  11. Vestergaard, N.; Squires, D.; Kirkley, J. Measuring capacity and capacity utilization in fisheries: The case of the Danish Gill-net fleet. Fish. Res. 2003, 60, 357–368. [Google Scholar] [CrossRef]
  12. Van Hoof, L.; De Wilde, J.W. Capacity assessment of the Dutch beam-trawler fleet using data envelopment analysis (DEA). Mar. Resour. Econ. 2005, 20, 327–345. [Google Scholar] [CrossRef]
  13. Seo, J.; Kim, D. Analyzing the dynamic productive efficiency of large purse seine fishery in Korea. J. Fish. Bus. Adm. 2012, 43, 11–18. [Google Scholar] [CrossRef] [Green Version]
  14. Castilla-Espino, D.; García-del-Hoyo, J.; Metreveli, M.; Bilashvili, K. Fishing capacity of the southeastern Black Sea anchovy fishery. J. Mar. Syst. 2014, 135, 160–169. [Google Scholar] [CrossRef]
  15. Cao, N.T.H.; Eide, A.; Armstrong, C.W.; Le, L.K. Measuring capacity utilization in fisheries using physical or economic variables: A data envelope analysis of a Vietnamese purse seine fishery. Fish. Res. 2021, 243, 106087. [Google Scholar] [CrossRef]
  16. Zheng, Y.; Zhou, Y.; Fang, S. Measuring and Applying of Fishing Capacity and Capacity Utilizationg for Chinese Inshore Fleets. J. Zhejiang Ocean Univ. (Nat. Sci.) 2008, 4, 415–424. [Google Scholar] [CrossRef]
  17. Sun, J.; Lu, K. Evaluation of the effects of the “dual control” system of China’s marine fishing vessels and its implementation adjustments. Fujian Trib. (Humanit. Soc. Sci. Mon.) 2016, 11, 49–55. [Google Scholar]
  18. Rao, X.; Huang, H.; Chen, X.; Wu, Y.; Yang, J.; Liu, J.; Li, L. Measurement and comparison of capacity utilization in Chinese waters. Mar. Fish. 2016, 38, 680–688. [Google Scholar] [CrossRef]
  19. FAO. The State of World Fisheries and Aquaculture 2020: Sustainability in Action; FAO: Rome, Italy, 2020. [Google Scholar]
  20. MOA. China Fishery Statistical Yearbook; China Agriculture Press: Beijing, China, 1979–2019. [Google Scholar]
  21. MOA. 40 Years of China’s Fisheries Statistics (1949–1988); China Agriculture Press: Beijing, China, 1991. [Google Scholar]
  22. Bian, X.; Wan, R.; Jin, X.; Shan, X.; Guan, L. Ichthyoplankton succession and assemblage structure in the Bohai Sea during the past 30 years since the 1980s. Prog. Fish. Sci. 2018, 39, 1–15. [Google Scholar]
  23. Wang, L.; Yu, K.; Zhao, H.; Zhang, Q. Economic valuation of the coral reefs in South China Sea. Trop. Geogr. 2014, 34, 44–49. [Google Scholar]
  24. Wang, Y.; Yuan, W. Changes of demersal trawl fishery resources in northern South China Sea as revealed by demersal trawling. South China Fish. Sci. 2008, 4, 26–33. [Google Scholar]
  25. Zhang, T. Dynamic production efficiency analysis based on the DEA method of China marine fishery. Chin. Fish. Econ. 2007, 04, 6–10. [Google Scholar]
  26. Pang, Y.; Tian, Y.; Ju, P.; Sun, P.; Ye, Z.; Liu, Y.; Ren, Y.; Wan, R. Change in cephalopod species composition in the overexploited coastal China seas with a closer look on Haizhou Bay, Yellow Sea. Reg. Stud. Mar. Sci. 2022, 53, 102419. [Google Scholar] [CrossRef]
  27. Cheng, S.; Sun, P.; Liu, Y.; Chen, Q.; Shi, Z.; Sun, R. Age, Growth and Maturation of Largehead Hairtail (Trichiurus japonicus) in the East China Sea. J. Ocean Univ. China 2022, 21, 1244–1250. [Google Scholar] [CrossRef]
  28. Su, S.; Tang, Y.; Chang, B.; Zhu, W.; Chen, Y. Evolution of marine fisheries management in China from 1949 to 2019: How did China get here and where does China go next? Fish Fish. 2020, 21, 435–452. [Google Scholar] [CrossRef]
  29. Shen, G.; Heino, M. An overview of marine fisheries management in China. Mar. Policy 2014, 44, 265–272. [Google Scholar] [CrossRef] [Green Version]
  30. The National People’s Congress. Fisheries Law of the People’s Republic of China; The National People’s Congress: Beijing, China, 1986.
  31. MOA. The State Council Opinions on Control Index of Offshore Fishing Vessels. 1987. [Google Scholar]
  32. Ministry of Finance. Ministry of Agriculture State Price Bureau Measures for Collection and Use of Fishery Resources Proliferation and Protection Fees. 1988. [Google Scholar]
  33. MOA. Notice on Revising the Provisions on the Arrangement and Management of Fishing Season Production in the Main Fishing Grounds of East China Sea, Yellow Sea and Bohai Sea. 1995. [Google Scholar]
  34. MOA. China Fishery Yearbook 2001; China Agriculture Press: Beijing, China, 2002; p. 5. [Google Scholar]
  35. Ministry of Finance; Ministry of Agriculture. Interim Provisions on the Management of Special Funds Using for Marine Fishermen to Change Their Jobs. 2002. [Google Scholar]
  36. Ministry of Finance, Ministry of Agriculture. Regulations on the Management of Special Funds Using for Marine Fishermen to Change Their Jobs. 2003. [Google Scholar]
  37. Chen, X.; Zhou, Y. On the measurement of ‘zero increasing rate’ of fishing catch in China coastal waters. Chin. Fish. Econ. 1999, 6, 27–29. [Google Scholar]
  38. Xu, H. The growth of the production of China’s marine fishing industry under the condition of resource recession—An empirical analysis based on the 1956–2011 fisheries data. J. Shandong Univ. (Phil. Soc. Sci.) 2013, 5, 86–93. [Google Scholar]
  39. Mu, Y.; Yu, H.; Chen, J.; Zhu, Y. A qualitative appraisal of China’s efforts in fishing capacity management. J. Ocean Univ. China 2007, 6, 1–11. [Google Scholar] [CrossRef]
  40. Zhang, Z.; Wu, S.; Li, S.; Cao, J.; Ge, S. Evaluation of the effectiveness of the implementation of the “dual control system” for fishing vessels in China and policy recommendations. China Fish. 2018, 4, 34–40. [Google Scholar]
  41. Jin, X.; Chen, J.; Qiu, S. Comprehensive Research and Evaluation of Fisheries Resources in Yellow Sea and Bohai Sea; Ocean Press: Beijing, China, 2006; pp. 389–398. [Google Scholar]
  42. Lin, Q. A comparative study on the efficiency of marine fishery industry in Zhejiang and coastal provinces. Spec. Zone Econ. 2016, 12, 45–47. [Google Scholar]
  43. Research on China’s Coral Reef Geomorphology; Guangdong People’s Publishing House: Guangdong, China, 1997.
  44. Chen, Z.; Qiu, Y. Status and Sustainable Utilization of Fishery Resources of South China Sea. J. Hubei Agric. Coll. 2002, 22, 507–510. [Google Scholar]
  45. Zheng, T.; Tang, Y. Analysis of current status of Chinese marine fishing fleet of South China Sea area. J. Shanghai Ocean Univ. 2016, 25, 620–627. [Google Scholar]
  46. Jin, X.; Xu, B.; Tang, Q. Fish assemblage structure in the East China Sea and southern Yellow Sea during autumn and spring. J. Fish Biol. 2010, 62, 1194–1205. [Google Scholar] [CrossRef]
  47. Yang, H.B. Zooplankton functional groups on the continental shelf of the yellow sea. Deep Sea Res. Part II Top. Stud. Oceanogr. 2010, 57, 1006–1016. [Google Scholar]
  48. Shandong Provincial Oceanic and Fishery Department. Investigation and Evaluation of Economic Resources in Shandong Costal Waters; China Ocean Press: Beijing, China, 2010. [Google Scholar]
  49. Zhang, Y.; Guan, W.; Li, C.; Dong, L. A study on the explosion and the sustainable utilization of marine resources in the bohai sea. J. Nat. Resour. 2002, 17, 768–775. [Google Scholar]
  50. Gao, X.; Zhou, F.; Chen, C. Pollution status of the Bohai Sea: An overview of the environmental quality assessment related trace metals. Environ. Int. 2014, 62, 12–30. [Google Scholar] [CrossRef] [PubMed]
  51. Puertas, P.E.; Bodmer, R.E. 8. Hunting Effort as a Tool for Community-Based Wildlife Management in Amazonia. In People in Nature: Wildlife Conservation in South and Central America; Kirsten, M.S., Richard, E.B., José, M.V.F., Eds.; Columbia University Press: New York, NY, USA, 2004; pp. 123–136. [Google Scholar]
  52. Kirkley, J.E.; Squires, D.; Alam, M.F.; Ishak, H.O. Excess capacity and asymmetric information in developing country fisheries: The Malaysian purse seine fishery. Am. J. Agric. Econ. 2003, 85, 647–662. [Google Scholar] [CrossRef]
  53. Kun, L.; Ping, H. Analysis of China’s high sea fishery production efficiency based on SFA. J. Agrotech. Econ. 2016, 9, 84–91. [Google Scholar] [CrossRef]
  54. Fare, R.; Grosskopf, S.; Kokkelenberg, E.C. Measuring plant capacity, utilization and technical change: A nonparametric approach. Int. Econ. Rev. 1989, 655–666. [Google Scholar] [CrossRef]
  55. Farrell, M.J. The measurement of productive efficiency. J. R. Stat. Soc. Ser. A 1957, 120, 253–281. [Google Scholar] [CrossRef]
  56. Charnes, A.; Clark, C.; Cooper, W.; Golany, B. A developmental study of data envelopment analysis in measuring the efficiency of maintenance units in the US air forces. Ann. Oper. Res. 1984, 2, 95–112. [Google Scholar] [CrossRef]
  57. Banker, R.D.; Charnes, A.; Cooper, W.W. Some models for estimating technical and scale inefficiencies in data envelopment analysis. Manag. Sci. 1984, 30, 1078–1092. [Google Scholar] [CrossRef] [Green Version]
  58. Thompson, R.G.; Lee, E.; Thrall, R.M. DEA/AR-efficiency of US independent oil/gas producers over time. Comput. Oper. Res. 1992, 19, 377–391. [Google Scholar] [CrossRef]
  59. Charnes, A.; Cooper, W.; Lewin, A.Y.; Seiford, L.M. Data envelopment analysis theory, methodology and applications. J. Oper. Res. Soc. 1997, 48, 332–333. [Google Scholar] [CrossRef]
  60. Asmild, M.; Paradi, J.C.; Aggarwall, V.; Schaffnit, C. Combining DEA window analysis with the Malmquist index approach in a study of the Canadian banking industry. J. Product. Anal. 2004, 21, 67–89. [Google Scholar] [CrossRef]
  61. Abbas, A.-R.; Mohammad, H.; Li, M.-H. DEA window analysis and Malmquist index to assess energy efficiency and productivity in Jordanian industrial sector. Energy Effic. 2016, 9, 1299–1313. [Google Scholar] [CrossRef]
  62. Park, S.H.; Pham, T.Y.; Yeo, G.T. The impact of ferry disasters on operational efficiency of the South Korean coastal ferry industry: A DEA-window analysis. Asian J. Shipp. Logist. 2018, 34, 248–255. [Google Scholar] [CrossRef]
  63. Halkos, G.E.; Polemis, M.L. The impact of economic growth on environmental efficiency of the electricity sector: A hybrid window DEA methodology for the USA. J. Environ. Manag. 2018, 211, 334–346. [Google Scholar] [CrossRef] [PubMed]
  64. Cheng, J. Ecological Environment and Community in the Offshore Waters of the Yellow and Bohai Seas; Ocean University of China Press: Qingdao, China, 2004. [Google Scholar]
  65. Wang, X. On the direction of fisheries economy in Shanghai. Chin. Fish. Econ. 2007, 2, 65–67. [Google Scholar]
  66. Man, H. Analysis of the evolution and status of the aquaculture industry in Shanghai. China Econ. 2011, 1, 219–220. [Google Scholar]
  67. Zhao, G.; Qiu, S.; Qu, H.; Li, R. Analysis on Present Structure Situation of Marine Fishery Resources in Shandong Offshore. J. Yantai Univ. (Nat. Sci. Eng. Ed.) 2018, 31, 239–247. [Google Scholar]
  68. Liang, C.; Pauly, D. Fisheries impacts on China’s coastal ecosystems: Unmasking a pervasive ‘fishing down’effect. PLoS ONE 2017, 12, e0173296. [Google Scholar] [CrossRef]
  69. Wang, J.; Zhang, Y.; Huang, L.; Li, J.; Xie, Y. Fishery biology of main economic fishes in Fujian coastal waters. J. Jimei Univ. (Nat. Sci.) 2011, 16, 161–166. [Google Scholar]
  70. Lin, L.; Chen, J.; Li, H. The fishery biology of Trichiurus japonicus and Larimichthys polyactis in the East China Sea region. Mar. Fish. 2008, 30, 126–134. [Google Scholar]
  71. Zhang, H. Fisheries cooperation in the South China Sea: Evaluating the options. Mar. Policy 2018, 89, 67–76. [Google Scholar] [CrossRef]
  72. Dobo, A. Illegal Chinese Fishing in West African Waters: A Study on Chinese IUU Activities and Its Consequences to Socio-Ecological Systems. Master Program’s Thesis, Stockholm University, Stockholm, Sweden, 2009. [Google Scholar]
  73. Dupont, A.; Baker, C.G. East Asia’s maritime disputes: Fishing in troubled waters. Wash. Q. 2014, 37, 79–98. [Google Scholar] [CrossRef]
  74. Ding, Q.; Shan, X.; Jin, X.; Gorfine, H. Research on utilization conflicts of fishery resources and catch allocation methods in the Bohai Sea, China. Fish. Res. 2020, 225, 105477. [Google Scholar] [CrossRef]
  75. Li, X. Investigation of the “Homicide” Incident in the Bohai Sea’s Ship Crash: Fishermen were Fighting due to Land Grabbing. Bejing Youth Daily. Available online: http://district.ce.cn/newarea//roll/201609/12/t20160912_15806323.shtml (accessed on 12 September 2016).
  76. Song, L.; Huang, S. The analysis of the income issues of marine fishermen in China. J. Shanghai Ocean Univ. 2015, 24, 287–292. [Google Scholar]
  77. Zhu, Y. Research on the Effects of China’s Summer Fishing Moratorium—A Perspective of Institutional Analysis. China Ocean Univ. 2009, 89, 20–100. [Google Scholar]
  78. Yan, L.; Liu, Z.; Jin, Y.; Cheng, J. Effects of prolonging the trawl net summer fishing moratorium period in the East China Sea on the conservation of fishery resources. J. Fish. Sci. China 2019, 26, 118–123. [Google Scholar] [CrossRef]
  79. Su, Y.; Chen, G.; Zhou, Y.; Ma, S.; Wu, Q.E. Assessment of impact of summer fishing moratorium in South China Sea during 2015− 2017. South China Fish. Sci. 2019, 15, 20–28. [Google Scholar]
  80. Su, X.; Chen, X. Comparative study for input control output control in fishery management. Trans. Oceanol. Limnol. 2021, 3, 136–144. [Google Scholar] [CrossRef]
  81. Qiu, C. Fishery disputes between China and neighboring countries and their impact on China’s diplomacy. Social. Stud. 2013, 6, 147–154. [Google Scholar]
  82. Karagiannakos, A. Total Allowable Catch (TAC) and quota management system in the European Union. Mar. Policy 1996, 20, 235–248. [Google Scholar] [CrossRef]
  83. Villasante, S.; do Carme García-Negro, M.; González-Laxe, F.; Rodríguez, G.R. Overfishing and the Common Fisheries Policy:(un) successful results from TAC regulation? Fish Fish. 2011, 12, 34–50. [Google Scholar] [CrossRef]
  84. An Ocean Blueprint for the 21st Century; U.S. Commission on Ocean Policy: Washington, DC, USA, 2004.
  85. Fisheries Innovation 2030; Ministry of Oceans and Fisheries: Sejong, Republic of Korea, 2019.
  86. White Paper on the Oceans and Ocean Policy in Japan 2021; Ocean Policy Research Institute, Sasakawa Peace Foundation: Tokyo, Japan, 2021.
  87. NOAA. Catch Share Policy; National Oceanic and Atmospheric Administration: Silver Spring, MD, USA, 2010.
  88. Jim, S.; Council, S.; Abigail, H. West Coast Groundfish Trawl Catch Share Program: Five-Year Review; Pacific Fishery Management Council and NOAA’s National Marine Fisheries Service: Costa Mesa, CA, USA, 2017.
  89. Essington, T.E. Ecological indicators display reduced variation in North American catch share fisheries. Proc. Natl. Acad. Sci. USA 2010, 107, 754–759. [Google Scholar] [CrossRef] [PubMed] [Green Version]
  90. Grimm, D.; Barkhorn, I.; Festa, D.; Bonzon, K.; Boomhower, J.; Hovland, V.; Blau, J. Assessing catch shares’ effects evidence from Federal United States and associated British Columbian fisheries. Mar. Policy 2012, 36, 644–657. [Google Scholar] [CrossRef]
  91. Birkenbach, A.M.; Kaczan, D.J.; Smith, M.D. Catch shares slow the race to fish. Nature 2017, 544, 223–226. [Google Scholar] [CrossRef]
  92. Costello, C.; Gaines, S.D.; Lynham, J. Can catch shares prevent fisheries collapse? Science 2008, 321, 1678–1681. [Google Scholar] [CrossRef] [Green Version]
  93. Board, O.S.; Council, N.R. The Community Development Quota Program in Alaska; National Academies Press: Washington, DC, USA, 1999. [Google Scholar]
  94. Kirkley, J.; Paul, C.J.M.; Squires, D. Deterministic and stochastic capacity estimation for fishery capacity reduction. Mar. Resour. Econ. 2004, 19, 271–294. [Google Scholar] [CrossRef]
  95. Zhu, W.; Lu, Z.; Dai, Q.; Lu, K.; Li, Z.; Zhou, Y.; Zhang, Y.; Sun, M.; Li, Y.; Li, W. Transition to timely and accurate reporting: An evaluation of monitoring programs for China’s first Total Allowable Catch (TAC) pilot fishery. Mar. Policy 2021, 129, 104503. [Google Scholar] [CrossRef]
Figure 1. Trends of fisheries in China, from 1979 to 2019. (a) Production status per fishery; (b) Main fishing vessel engine power in coastal and offshore fisheries; (c) The average main fishing vessel engine power and catch-per-unit effort (CPUE) per vessel in coastal and offshore fisheries; (d) CPUE per labor and number of laborers in coastal and offshore fisheries [20,21].
Jmse 10 01998 g001
Figure 2. Regional representations. (a) Production status per region; (b) Trends in fishing capacity per region [20,21].
Jmse 10 01998 g002
Figure 3. Results of window-DEA. (a) Averages for all of China; (b) Averages for different seas.
Jmse 10 01998 g003
Table 1. Results of window-DEA, per region. [Tianjin (TJ), Hebei (HB), Liaoning (LN), Shanghai (SH), Jiangsu (JS), Zhejiang (ZJ), Fujian (FJ), Shandong (SD), Guangdong (GD), Guangxi (GX), Hainan (HN)].
WindowTJHBLNSHJSZJFJSDGDGXHNAverage
1979–19810.310.530.980.990.680.990.801.000.810.530.000.76
1980–19820.350.550.950.970.730.990.860.970.850.630.000.79
1981–19830.380.520.950.950.691.000.900.980.910.690.000.80
1982–19840.420.530.980.960.680.980.950.990.970.720.000.82
1983–19850.460.591.000.990.710.990.980.990.990.760.000.84
1984–19860.470.581.000.980.740.980.931.000.940.730.000.84
1985–19870.510.590.970.970.770.950.910.950.960.760.000.83
1986–19880.580.590.960.990.780.970.950.961.000.860.160.86
1987–19890.580.550.970.960.740.970.981.000.990.920.330.87
1988–19900.600.530.930.950.710.940.980.960.980.950.470.82
1989–19910.540.530.940.970.720.930.970.980.990.950.470.82
1990–19920.470.510.800.930.650.880.980.951.000.870.440.77
1991–19930.420.470.770.860.600.830.980.921.000.840.440.74
1992–19940.380.440.780.980.570.890.980.971.000.780.480.75
1993–19950.350.420.850.960.600.920.981.000.970.840.510.76
1994–19960.370.480.860.980.600.980.971.000.940.950.540.79
1995–19970.410.440.710.980.470.900.990.960.970.940.380.74
1996–19980.390.450.760.900.470.890.990.970.980.940.370.74
1997–19990.390.490.800.870.460.930.991.000.990.960.390.75
1998–20000.350.540.780.900.440.970.990.990.970.930.430.75
1999–20010.400.570.760.850.431.001.000.980.970.960.480.76
2000–20020.450.570.750.730.450.990.990.950.990.980.570.77
2001–20030.510.610.790.750.510.990.940.990.981.000.710.80
2002–20040.520.640.780.740.490.990.921.000.970.990.730.80
2003–20050.570.700.780.750.501.001.001.001.000.980.760.82
2004–20060.630.690.780.690.510.990.991.001.000.980.760.82
2005–20070.620.790.780.460.520.970.970.990.990.940.760.80
2006–20080.580.760.790.430.530.950.960.980.960.880.750.78
2007–20090.700.750.790.290.560.991.000.990.980.930.750.79
2008–20100.870.680.760.360.600.990.990.990.980.950.790.81
2009–20110.840.580.760.300.581.000.990.991.000.840.800.79
2010–20120.680.570.790.310.571.000.991.001.000.850.820.78
2011–20130.660.500.800.310.541.000.991.001.000.840.840.77
2012–20140.790.440.820.310.541.001.001.000.990.820.850.78
2013–20150.960.410.820.320.541.001.001.001.000.800.860.79
2014–20161.000.430.810.400.541.001.001.000.990.790.900.81
2015–20170.900.440.730.640.520.990.970.950.990.780.900.80
2016–20180.800.440.630.700.510.980.910.920.970.740.870.77
2017–20190.830.460.580.830.550.990.941.000.970.760.910.80
Average0.560.550.830.750.580.970.960.980.970.860.660.79
Table 2. Results of window-DEA, per sea. (The Bohai Sea (BS), Yellow Sea (YS), East China Sea (ECS), and South China Sea (SCS)).
WindowBSYSECSSCS
1979–19810.4200.8840.9280.673
1980–19820.4470.8820.9420.744
1981–19830.4520.8730.9510.801
1982–19840.4730.8820.9600.845
1983–19850.5200.9000.9840.874
1984–19860.5260.9130.9640.832
1985–19870.5520.8960.9430.857
1986–19880.5870.9000.9700.928
1987–19890.5660.9020.9710.745
1988–19900.5680.8690.9550.800
1989–19910.5320.8810.9540.802
1990–19920.4910.7980.9310.769
1991–19930.4460.7610.8900.759
1992–19940.4090.7740.9500.751
1993–19950.3850.8140.9540.773
1994–19960.4240.8200.9800.809
1995–19970.4250.7130.9560.764
1996–19980.4190.7330.9240.765
1997–19990.4380.7500.9310.780
1998–20000.4450.7380.9550.776
1999–20010.4810.7230.9470.802
2000–20020.5140.7150.9040.845
2001–20030.5570.7640.8910.897
2002–20040.5800.7570.8800.897
2003–20050.6350.7600.9130.912
2004–20060.6560.7600.8880.916
2005–20070.7040.7660.7990.897
2006–20080.6720.7680.7790.858
2007–20090.7230.7800.7570.885
2008–20100.7720.7800.7770.906
2009–20110.7090.7760.7620.879
2010–20120.6240.7840.7670.890
2011–20130.5770.7820.7660.892
2012–20140.6100.7890.7680.886
2013–20150.6850.7880.7710.887
2014–20160.7140.7820.7990.893
2015–20170.6700.7330.8650.888
2016–20180.6180.6860.8650.858
2017–20190.6440.7070.9220.879
Average0.5560.7970.8930.836
Publisher’s Note: MDPI stays neutral with regard to jurisdictional claims in published maps and institutional affiliations.

