Article

Improvement of Regasification Process Efficiency for Floating Storage Regasification Unit

by
Vigaile Semaskaite
1,
Marijonas Bogdevicius
1,
Tatjana Paulauskiene
2,*,
Jochen Uebe
2 and
Ludmila Filina-Dawidowicz
3
1
Mobile Machinery and Railway Transport Department, Faculty of Transport Engineering, Vilnius Gediminas Technical University, Plytines St. 27, 10105 Vilnius, Lithuania
2
Engineering Department, Faculty of Marine Technology and Natural Sciences, Klaipeda University, H. Manto 84, 92294 Klaipeda, Lithuania
3
Logistics and Transportation Economics Department, Faculty of Maritime Technology and Transport, West Pomeranian University of Technology, Ave. Piastów 41, 71065 Szczecin, Poland
*
Author to whom correspondence should be addressed.
J. Mar. Sci. Eng. 2022, 10(7), 897; https://doi.org/10.3390/jmse10070897
Submission received: 31 May 2022 / Revised: 24 June 2022 / Accepted: 25 June 2022 / Published: 28 June 2022
(This article belongs to the Special Issue Energy Optimization of Ship and Maritime Structures)

Abstract

:
Natural gas plays a vital role in the economically and environmentally sustainable future of energy. Its reliable deliveries are required, especially nowadays, when the energy market is so volatile and unstable. The conversion of natural gas to its liquefied form (LNG) allows its transport in greater quantities. Affordability and reliability of clean energy is a key issue even for developed markets. Therefore, natural gas usage enables to implement green solutions into countries’ economies. However, the LNG-production process consumes a considerable amount of energy. This energy is stored in LNG as cold energy. After LNG unloading into storage tanks at receiving terminals, it is vaporised and compressed for transmission to a natural gas pipeline system. During the regasification process, the large part of the energy stored in LNG may be recovered and used for electricity generation, seawater desalination, cryogenic air separation, hydrogen liquefaction, material freezing, carbon dioxide capture, as well as for combined LNG cold energy utilization systems. Moreover, increased efficiency of LNG terminals may attract potential clients. In the presented paper, a mathematical model is performed to determine the influence of LNG composition and regasification process parameters on the quantity of released LNG cold energy in a large-scale floating storage and regasification units (FSRU)-type terminal “Independence” (Lithuania). Flow rate of LNG regasification, pressure, and boil-off gas recondensation have been considered. Possibilities to reduce the energy losses were investigated to find the ways to improve the regasification process efficiency for real FSRU. The results analysis revealed that potential of LNG cold energy at FSRU could vary from 20 to 25 MW. A utilisation of industrial and urban waste heat for the heat sink FSRU is recommended to increase the energy efficiency of the whole regasification process.

1. Introduction

Natural gas delivered in liquefied form (LNG) plays a significant role for the economy of developed and developing countries that do not have enough of their own deposits of this raw material. Its implementation allows to replace coal and liquid fuel power generation, allowing to reduce the emissions level [1]. Natural gas usage has several advantages. It produces fewer than 10% of the particulates [2], and compared to coal, its usage allows to achieve 50% less greenhouse gas emission for power generation [3]. In maritime transport, it is possible to reduce emissions up to 21% by using engines fuelled by gas rather than heavy fuel oil [4]. It is assumed that its efficiency is about 95% when it is applied for heating houses [5]. Natural gas imported in LNG form can also help to balance the fluctuations in electricity produced from renewable energy sources as well as meet peak electricity needs.
The floating storage and regasification unit (FSRU) allows to store LNG and convert it to gaseous form. These units have become popular over the last two decades and now account for 6.3% of the global LNG fleet [1]. FSRUs offer better flexibility, lower capital costs, and faster conversion of LNG procured gas compared to onshore regasification terminals [1]. Large offshore terminals are used for LNG transfer and enable effective onshore gas supplies for land-limited regions or areas with difficult access to special infrastructure. Thirty-four FSRUs are currently in operation within the global LNG fleet. These special ships are expected to remain popular storage and regasification solutions in near future. In the European Union (EU), FSRUs have become important equipment for natural gas trade and diversification of its deliveries. Lithuania is one of the first European countries that, in 2014, started operation of an LNG carrier designed as a floating LNG storage and regasification unit used as LNG import terminal.
Regasification of LNG is a final process in the LNG supply chain, where efficiency of the supply could be increased, and some of the wasted energy could be recovered. Wasted energy is described as the energy consumed in the liquefaction of natural gas and generated as LNG cold energy in LNG vaporisers during the regasification process [6].
Considering the thermophysical properties of natural gas, the amount of usable recoverable LNG cold energy may reach around 830 kJ/kg [7,8]. From an environmental point of view, LNG cold energy causes energy waste and pollution [9]. It also leads to higher natural gas prices and reduces the efficiency of the primary energy source [10]. In addition, LNG cold energy is a unique form of energy because it is cryogenic. It can be used to provide the thermal energy needed for low-temperature applications [6,10,11]. More attention is being paid to LNG cold energy systems that use this energy for electricity generation [8,12], seawater desalination [13], cryogenic air separation [14,15], freezing of material [16], carbon capture [17,18], as well as for combined LNG cold energy utilization systems [19], storage for liquid air energy [20], pumped thermal energy storage [21], etc. However, it should be noted that application of these systems needs their installation on the FSRU deck. In the case that the FSRU is in operation and is connected to a special onshore small-scale LNG terminal, installation of these systems is challenging or even impossible. Such a terminal is operated in Klaipeda port (Lithuania) and forms a modified LNG carrier with very limited space on board [22,23]. The alternative transport of LNG, from the FSRU to potential consumers in an above-mentioned onshore facility, is very costly. The operator of the FSRU in Klaipeda port implements this approach on a small scale in order to supply with gas the off-grid users of Lithuania, which, for historical reasons, are not connected to the national gas distribution network, or to provide fuel for vessels, buses, cars, etc. [24]. Therefore, it could be very problematic to modify FSRU according to the suggestions of the literature mentioned above. It was estimated that 2.7 EJ (7500 TWh) of industrial waste heat is available in Europe per year [25]. Furthermore, 1.2 EJ/y are available as low-temperature waste heat from urban heat sources in Europe (e.g., heat from infrastructure such as wastewater and metro systems, service sector buildings, and data centres) [26], so it could be stated that sufficient technical sources are available to deal with these challenges.
It should be noted that regardless of existing advantages and disadvantages of FSRU, operation of large-scale regasification plants should be continuously improved. It is particularly important to find ways to reduce energy losses and to make LNG terminals more energy efficient.
Many scientists and engineers are focusing on various projects to improve energy efficiency of onshore regasification systems in order to use LNG cold energy and make them more flexible. In theoretical studies, most scientists consider implementation of innovative technologies in LNG terminals model but not in the existing one. Exergy analysis is often used as a method to investigate the flow of the energy in systems allowing for LNG cold energy utilization. A number of studies has been performed to verify exergy [7,27,28,29] and evaluate the maximum available work potential of investigated energy systems [30]. Therefore, based on the available literature analysis, the research gap was identified that deals with the lack of studies on exergetic analysis for real-life offshore LNG terminal facilities.
The aim of this article is to investigate the possibilities to reduce the energy losses and to find the ways to improve the regasification process efficiency for real-life FSRU. To this end, the influence of LNG composition and regasification process parameters on possibility to use LNG cold energy was investigated and discussed. Thermodynamic and exergetic analysis was carried out to determine the release of LNG cold energy in large-scale FSRU-type terminals. The case study was considered, covering five real cases of the operation of the FSRU “Independence” (Lithuania). Different compositions of LNG and regasification process parameters were considered. Conducted analysis and discussion allowed to broaden the knowledge of community researchers and industry experts related to realised LNG cold energy utilisation options in a large-scale FSRU terminal, which is an important node of the natural gas supply chains. Moreover, a solution to extend the limits of FSRU “Independence” is also proposed.

2. Research Methodology

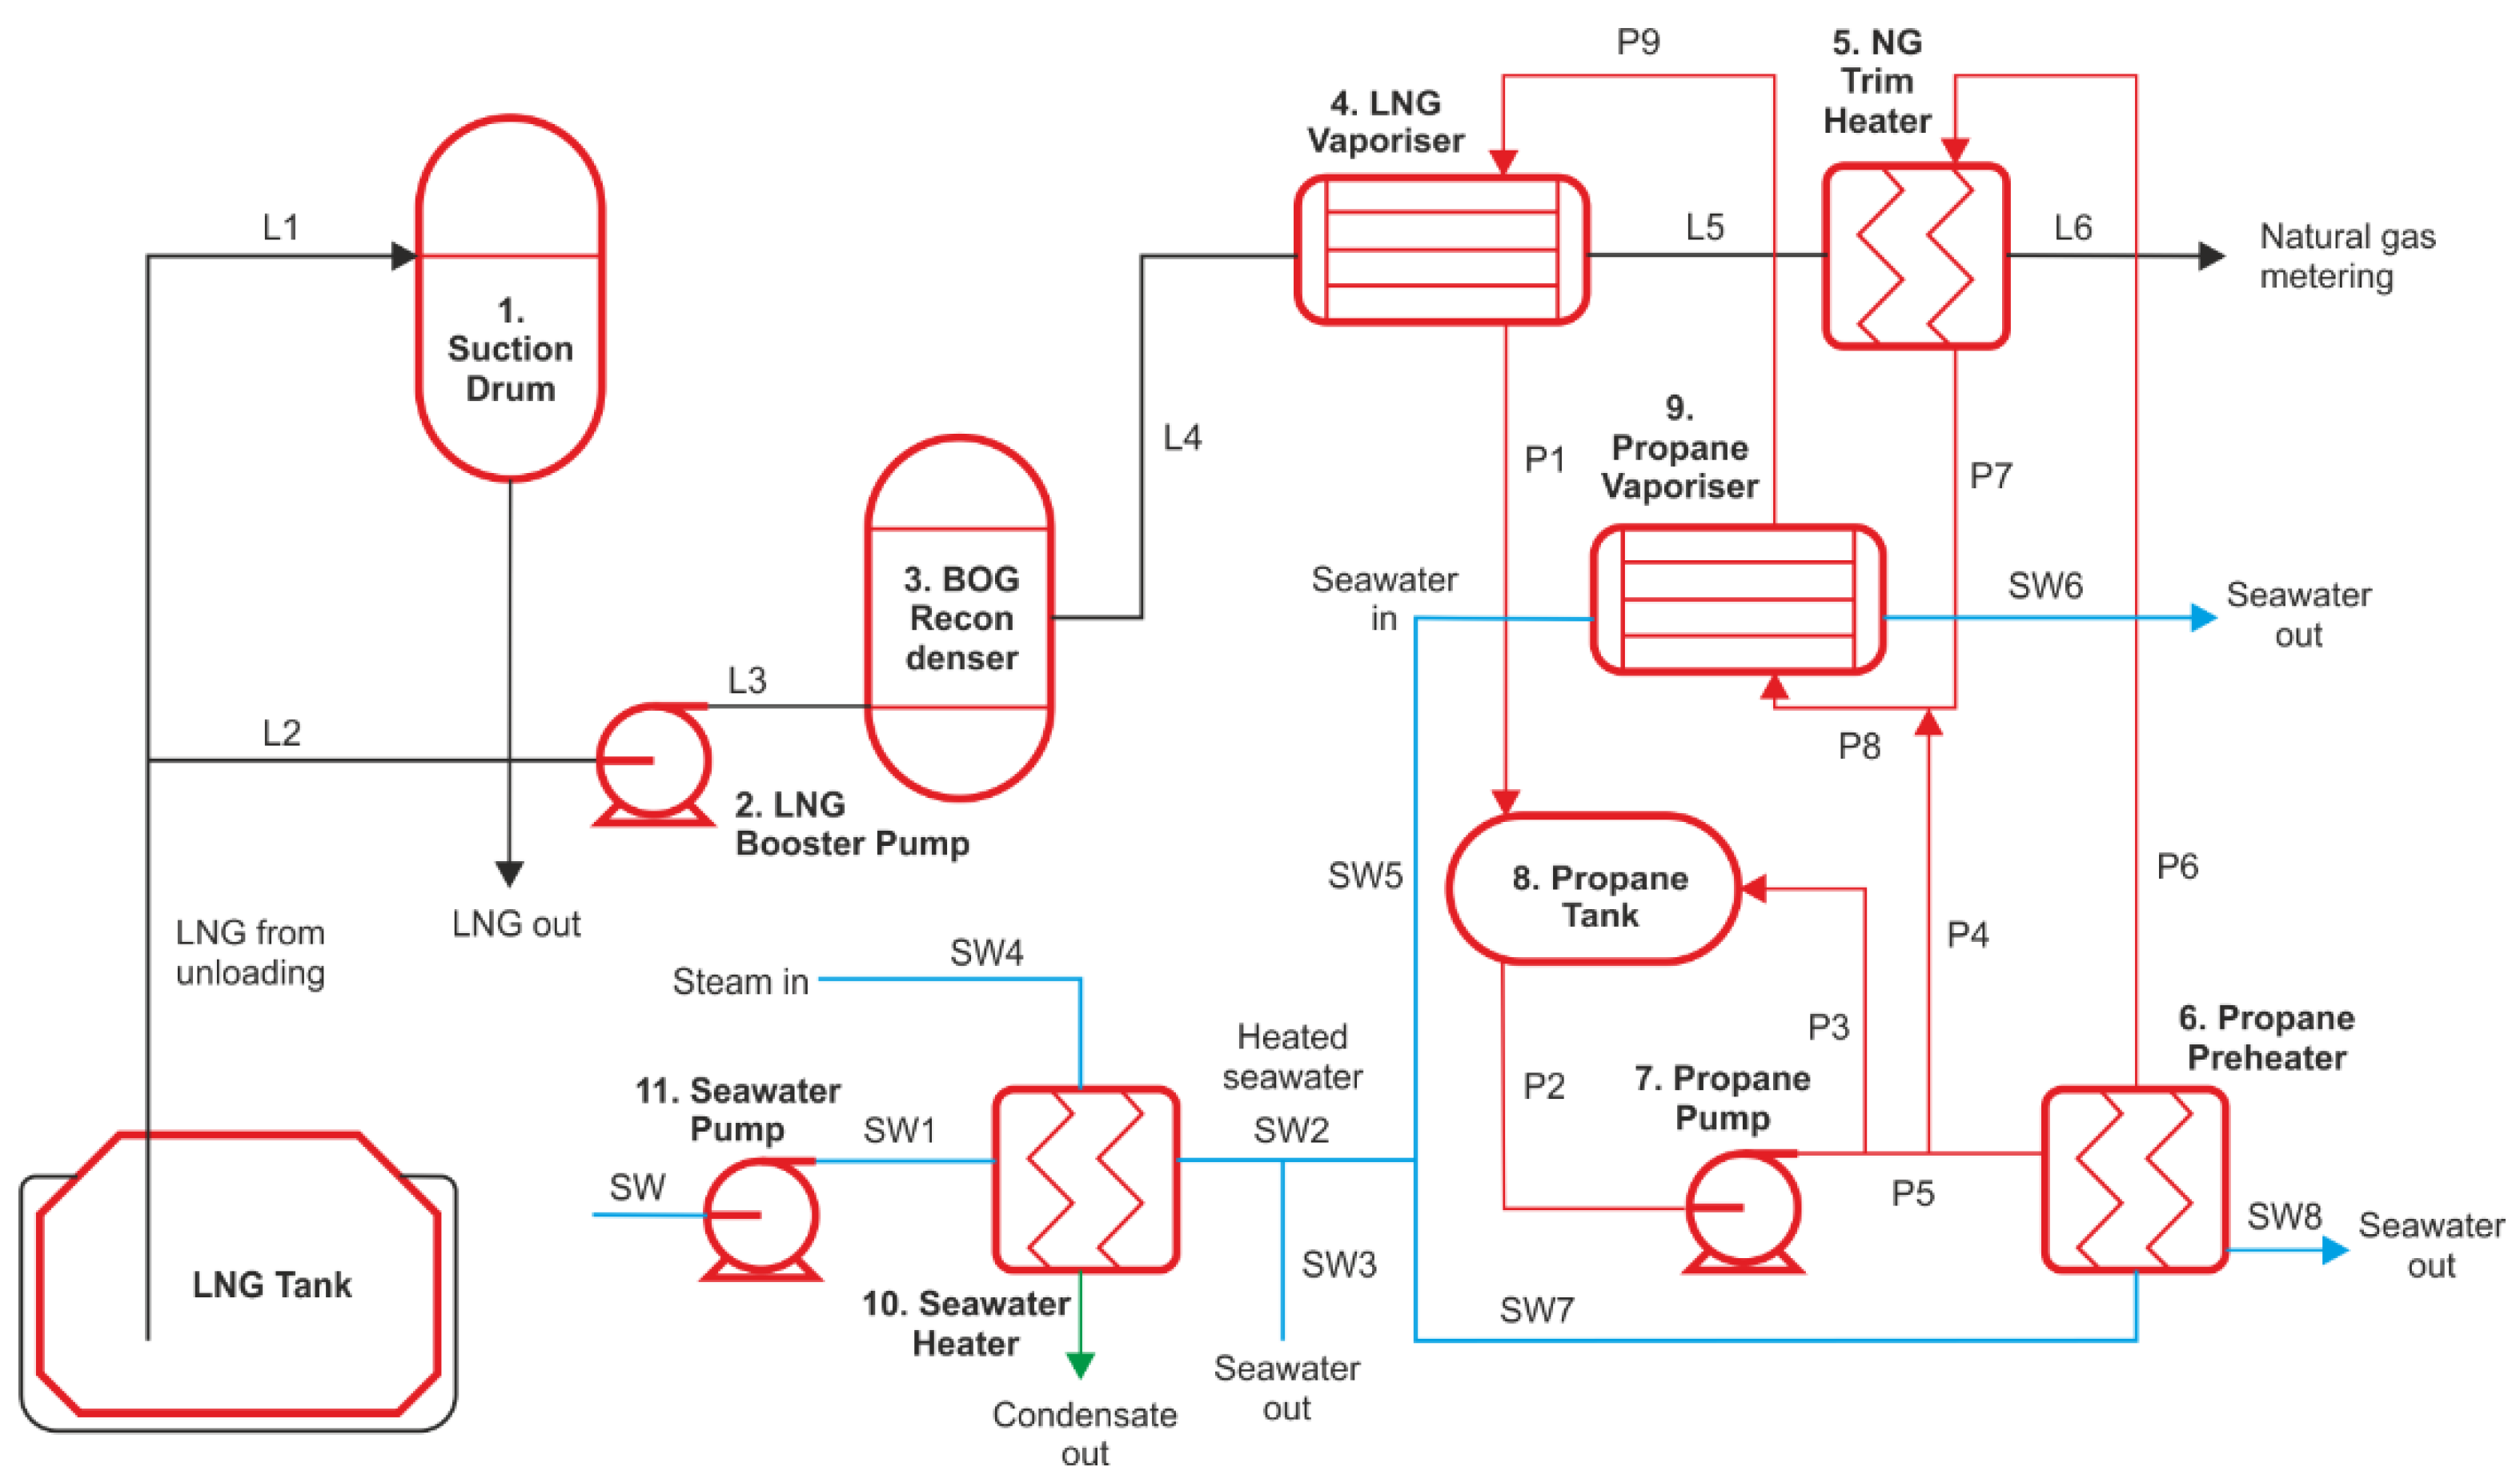
2.1. Description of Regasification Process on the FSRU

The typical scheme of regasification process in FSRU is presented in Figure 1. Pumps transport the LNG at high pressure to a vapour–liquid separator (suction drum) (1) on deck. From there, the booster pump (2) delivers the LNG with approx. 10 MPa at −160 °C to the boil-off gas (BOG) recondenser (3).
The LNG regasification process takes place in an LNG vaporiser (4), where there is a heat exchange between propane, and the LNG temperature during this process increases up to −10 °C. Hereinafter, the LNG evaporates, while the initially 0 °C warm propane gas cools down to about −5 °C and condenses. Evaporated natural gas (NG) is then supplied to the NG trim heater (5). Therein, the NG is brought to a final temperature of +5 °C and a pressure of 3.4–6.5 MPa by preheated propane. Propane runs in a closed circuit. After LNG evaporation into a gas, the condensed propane is collected in the propane buffer tank (8). The propane circulation pump (7) increases the pressure of the propane from about 0.2 MPa to 1.1 MPa at a constant speed. Propane then enters the propane preheater (6), where it extracts heat from the seawater and raises its temperature from about −15 °C to 11 °C. Preheated propane is supplied to natural gas trim heater (5), is mixed with cold propane from the propane pump (7), and is transferred to the propane vaporiser (9). Repeatedly, heat is exchanged between seawater and propane, and then, the last bit evaporates. The propane vapor is sent to the LNG vaporiser (4) for the heat exchange with LNG. This closes the propane cycle.
The heat required for the evaporation of LNG is extracted from the seawater. The minimum seawater inlet temperature into the heat exchanger must be 13 °C; therefore, seawater extraction without additional temperature control is worthwhile [31]. If the seawater is colder than 13 °C, it must be heated and circulated in a closed circuit, and such a situation may occur in the winter period. In summer, seawater is directly supplied to the propane closed loop.
In the analysed terminal, four trains are working within the same LNG regasification flow. A train is a group of the regasification equipment that is working in parallel. In this study, one train was selected for detailed investigation.

2.2. Mathematical Modelling of LNG Regasification Process

For mathematical modelling of the thermodynamic properties of LNG, the Klosek–McKinley method and the standard ISO 6976:1995 “Natural Gas—Calculation of Values, Density, Relative Density and Wobbe Index from Composition” was used [32,33]. The values were calculated using Maple software. The mathematical model was introduced and applied to analyse five different real-life regasification cases at FSRU. Based on selected cases analysis, it was possible to compare achieved results and identify the most suitable case for exergy analysis (Table 1). Criteria for regasification cases analysis were selected according to technological procedures and physical parameters to verify LNG cold energy release.
Analysed cases consider different LNG flow rates. The maximum LNG flow of 120,000 kg·h−1 was observed in Case 5 and Case 1, and the minimum was 50,000 kg·h−1 in Case 4. The methane content of LNG was an important parameter for regasification cases selection. Three cases (Case 1, Case 4, Case 5) were selected with 86% methane in LNG as well as two other cases that had more than 90% of methane (Case 2, 99.6%; Case 3, 96% methane).
The LNG vaporisation pressure is extremely important parameter that could influence LNG cryogenic exergy [14,34]. Li et al. analysed variations of LNG cold energy released with different regasification pressure [35]. The results showed that with increasing regasification pressure by 1.0 MPa(g), the cold LNG energy decreases. The pressure drops increase in the LNG vaporisers or propane preheater, so more work has to be consumed by pumps or compressors. Therefore, Case 1 (3.5 MPa(g)) Case 5 (5.5 MPa(g)) consider different regasification pressure when natural gas is sent to the gas transmission station. In turn, regasification pressure reaches 6.5 MPa(g) in Case 2, Case 3, and Case 4.
In this study, the propane short-circuits flows (presented in Figure 1: P3—pressurised propane is sent back to a propane tank; P4—propane mixing with P7 flow after NG trim heater) were not analysed for all cases. In Cases 1–3 and 5, after the propane pressurization by a propane pump, a part of propane flow is sent back to the propane tank (P3), another part is directed to the propane vaporiser for mixing (P4), and the rest flow (P5) is sent to the propane preheater. In Case 4, because of the low LNG flow, the circulating propane flow rate is also low and, therefore, is directly transferred by propane pump to propane preheater, ignoring P3 and P4. Precooling could be done to decrease the work of the pump and the propane temperature after NG heating in the NG trim heater. This process decreases the maximum work, which is of interest in this study.
Boil-off gas recondensation is an important operation, which requires electric power for pumps and compressors to work [36]. Hereby, Case 2, Case 4, and Case 5 were selected with BOG recondensation to observe technological changes in the regasification system at FSRU. The physical parameters of LNG (volume, density, individual gas constant) were calculated by combination of Klosek–McKinley and ISO 6976:1995 methods to verify initial conditions in every case.
Table 2 shows the calculation results of LNG physical properties for selected cases. In Case 3, LNG with high methane (96%) and nitrogen amount (4%) was considered. Nitrogen is an inert component that reduces gross heating value [37]. A high amount of nitrogen impacts BOG generation, and it could make LNG unmarketable [32]. Furthermore, the density is the indicator of LNG composition, which determines the quality of LNG stored in FSRU. The density calculation of gas mixture includes other variables, which are estimated according to Klosek–McKinley method.
The estimated physical properties of LNG were used for energy and exergy calculations. The reference state for exergy calculations was set T0 = 15 °C and p0 = 0.101 MPa(g). According to technical sheets of equipment, variables such as pressure (p), temperature (T), and flow rate of LNG were selected as similar true values. These values were used to estimate energy and exergy values. The flow rate of propane was selected as the nominal value of the equipment’s technical working parameters.
The thermodynamic parameters of working fluids (propane, methane, and seawater) and exergy of flows were calculated for analysed cases using the database program REFPROP version 9.0. The higher aliphatic components, such as ethane, propane, and i- or n-butane, were neglected because of their small quantities. In addition, the current literature [38] states that influence of ethane on the exergy is lower than 1%. Therefore, it can be assumed that the influence of the other working fluids’ compounds with lower content is even less and will not be considered in further analyses.
The Peng–Robinson equation was used to calculate properties of fluids and estimated parameters needed for exergy analyses. Modelling was carried out under assumptions that were discussed in [39,40], including:
-
The heat transfer between the environment and the system is not feasible;
-
Heat exchangers are the counter-flow type and adiabatic;
-
The isentropic efficiency of pumps, turbines, and compressors is equal to 0.9.

2.3. Thermodynamic Calculation of LNG Regasification System

The determination of energetic and exergetic analysis was conducted using the following methodology.
According to [14,41,42], modelling of different regasification pressure of LNG vaporiser and NG trim heater should be analysed to observe LNG cold energy changes. The complete change in enthalpies in heat exchangers could be calculated as follows (Equation (1)):
Q = mc p Δ T = mc p ( T out T in ) ,  
where: Δ T —change in temperature (K); c p —specific heat capacity (kJ·(kg·K)−1); m—mass flow rate (kg·h−1); T out —working fluid output temperature (K); T in —working fluid input temperature (K).
LNG cold energy changes may be determined as follows (Equation (2)):
Q = UA · LMTD = m hot · ( h in h out ) = m cold · ( h in h out ) ,          
where: Q—amount of heat transferred (kW); UA—result of the multiplication between the convective heat transfer coefficient and heat transfer area (kJ·(K · s)−1); LMTD—logarithm mean temperature difference (K); m hot —flow rate of hot fluid (kg·h−1); m cold —flow rate of cold fluid (kg·h−1); h in —specific enthalpy of inlet fluid (kJ·kg−1); h out —specific enthalpy of outlet fluid (kJ·kg−1).
The logarithm mean temperature difference (LMTD) is a parameter allowing to determine the amount of heat transfer in heat exchangers and shows the temperature’s driving force. It was assumed that hot and cold flows of fluids are counter flows in heat exchanger. Therefore, the LMTD may be estimated using Equation (3):
LMTD = ( T hot , out T cold , inlet ) ( T hot , inlet T cold , outlet ) ln ( T hot , out T cold , inlet ) ( T hot , inlet T cold , outlet ) ,
where: T out —working fluid output temperature (K); T in —working fluid input temperature (K).
The central component of the LNG regasification process is the LNG flow from L4 to L8 via L5, L6, and L7 (Figure 1). LNG regasification starts when LNG is transferred by booster pump to BOG recondenser from L5 to L6. The booster pump power consumption could be calculated applying Equation (4) [7,14]:
W L   pump = m ( h L 5 h L 4 ) η is L pump = V ( P L 5 P L 4 ) η is L pump     ,      
where: WLpump—booster pump power consumption (kW); η is L pump —thermal efficiency; m LNG —LNG flow (kg·h−1) ;   h L 5 —specific LNG enthalpy after booster pump work (kJ·kg−1); h L 4 —specific LNG enthalpy before booster pump transfer (kJ·kg−1); V—LNG volume (m3); PL5—LNG pressure in point L5 after booster pump transfer (MPa(g)); PL4—LNG pressure in point L4 before booster pump transfer (MPa(g)).
BOG recondensation process may be assessed as follows (Equation (5)):
Q LNG ( 3 ) = m LNG ( h L 6 h L 5 ) = Q BOG ( 3 ) ,      
where: QLNG(3)—heat absorbed by LNG from BOG in BOG recondenser (kW); m LNG —LNG flow (kg·h−1); h L 6 —specific LNG enthalpy after BOG recondensation (kJ·kg−1); h L 5 —specific LNG enthalpy before BOG recondensation (kJ·kg−1); QBOG(3)—heat released from BOG (kW).
After BOG recondensation, LNG is sent to LNG vaporiser, flowing from L6 to L7 (Figure 1). The heat absorbed by LNG from propane (P) in the LNG vaporiser (4) may be determined using Equation (6) [10,13,14]:
Q LNG ( 4 ) = m LNG ( h L 7 h L 6 ) = Q P ( 4 ) ,  
where: QLNG(4)—heat absorbed by LNG from propane in LNG vaporiser (kW); mLNG—LNG flow (kg·h−1); h L 7 —specific LNG enthalpy after NG production (kJ·kg1); h L 6 —specific LNG enthalpy before NG production (kJ·kg−1); QP(4)—heat released from propane (kW).
The heat released to LNG in LNG vaporiser could be calculated as follows (Equation (7)):
Q P ( 4 ) = m P ( h P 9 h P 1 ) ,          
where: QP(4)—heat released from propane (kW); mP—propane mass flow in LNG vaporiser (kg·h1); h P 1 —specific propane enthalpy after NG production (kJ·kg1); h P 9 —specific propane enthalpy after propane vaporisation (kJ·kg−1).
After LNG regasification, NG is sent to NG trim heater (flowing from state L7 to L8) to reach send-out conditions of the high-pressure gas pipeline that is connected to the gas-metering station. The heat absorbed by NG from propane in the NG trim heater (5) may be assessed as follows (Equation (8)):
Q LNG ( 5 ) = m LNG ( h L 8 h L 7 ) = Q P ( 5 )   ,    
where: QLNG(5)—heat absorbed by NG from propane in NG trim heater (kW); mLNG—NG flow in NG trim heater (kg·h−1); h L 7 —specific NG enthalpy before NG heating (kJ·kg−1); h L 8 —specific NG enthalpy after NG heating (kJ·kg1); QP(5)—the heat released from propane (kW).
The heat released to NG in NG trim heater may be determined using Equation (9):
Q P ( 5 ) =   m P ( h P 7 h P 6 )   ,        
where: QP(5)—heat released from propane (kW); mP—propane mass flow in NG trim heater (kg·h1); h P 7 —specific propane enthalpy after NG heating (kJ·kg1); h P 6 —specific propane enthalpy after propane preheating (kJ·kg1).
The closed propane loop supplies the LNG regasification process with heat. The heat absorbed by propane from seawater in the propane preheater (plate heat exchanger) may be assessed using Equation (10):
Q P   ( 6 ) = m P ( h P 6 h P 5 ) = Q SW ( 6 ) ,          
where: QP(6)—heat absorbed by propane (kW); mP—propane flow (kg·h−1); h P 6 —specific propane enthalpy after propane preheating (kJ·kg−1); h P 5 —specific propane enthalpy after propane pump work (kJ·kg−1); Q SW(6)—heat released from seawater (kW).
The heat released from seawater to propane in propane preheater could be calculated as follows (Equation (11)):
Q P ( 7 ) =   m SW ( h SW 7 h SW 8 )   ,        
where: QP(7)—heat absorbed by propane (kW); mSW—seawater mass flow (kg·h1); h sw 7 —specific seawater enthalpy before propane preheating (kJ·kg−1); h SW 8 —specific seawater enthalpy after propane preheating (kJ·kg−1).
The heat absorbed by propane from seawater in the propane vaporiser (plate and frame heat exchanger) that is marked number 9 in Figure 1 and may be assessed as follows (Equation (12)):
Q P ( 8 ) =   m p ( h p 8 h p 9 ) = Q SW ( 9 ) ,
where: QP(8)—heat absorbed by propane (kW); mP—propane flow (kg·h−1); h P 9 —specific propane enthalpy after propane vaporisation (kJ·kg−1); h P 8 —specific propane enthalpy before propane vaporisation (kJ·kg−1); QSW(9)—heat released from seawater (kW).
The heat released to propane in propane vaporiser may be determined using Equation (13):
Q P ( 9 ) =   m SW ( h SW 5 h SW 6 ) ,          
where: QP(9)—heat absorbed by propane (kW); mSW—seawater mass flow (kg·h−1); h sw 5 —specific seawater enthalpy before propane vaporisation (kJ·kg−1); h SW 6 —specific seawater enthalpy after propane vaporisation (kJ·kg−1).
The propane throttle valve, which controls the level in the propane tank, could be calculated as follows (Equation (14)):
H P   in = h Pout ,          
where: h Pin —specific propane enthalpy inlet (kJ·kg−1) in throttle valve; h Pout —specific propane enthalpy outlet (kJ·kg−1) in throttle valve.
The propane pump power consumption may be determined as follows (Equation (15)) [7,32,41]:
  W P   pump = m ( h P 5 h P 2 ) η is Px pump = V ( P P 5 P P 2 ) η is Px pump   ,        
where: WPpump—propane pump power consumption (kW); η is L pump —thermal efficiency; mP—propane flow (kg·h−1);   h P 5   —specific propane enthalpy after propane pump work (kJ·kg−1); h P 2   —specific propane enthalpy before propane pump transfer (kJ·kg1); Vp—propane volume (m3); PP5—propane pressure in point P5 (Figure 1) after propane pump transfer (MPa(g)); PP2—propane pressure in point P2 before propane pump transfer (Mpa(g)).
The exergy analysis of the regasification system includes calculation of input, output exergy losses, and efficiency under the mentioned conditions.
The exergy consists of physical and chemical exergy; however, in the regasification process, there is no chemical reaction, so chemical exergy is not considered in this research. Only physical parts of the exergy occur [26]. Rejecting kinetic and potential energy changes, the flow exergy of natural gas at any state may be calculated as follows (Equation (16)) [42,43]:
E ex = m ( h h 0 ) T 0 ( s s 0 )   = Δ h T 0 Δ s + R g T 0 ln p p 0     .    
The exergy analysis conditions may be set considering reference conditions (T0 = 15 °C (288.15 K) and (p0 = 0.101 MPa(g)), considering Equations (17) and (18):
H h 0 =   c p · ( T T 0 ) ,
S s 0 =   c p · ln T T 0   R g · ln p p 0     .      
Then, the temperature exergy ( e x ( T ) )   and pressure exergy ( e x ( p ) ) could be expressed applying Equations (19) and (20) [32]:
  e x ( T ) = c p · [ T ( T 0 · ( 1 + ln T T 0 ) ]   ,
e x ( p ) = R g · T 0 · ln p p 0 ,          
where: m —mass flow rate (kg·h1); h —specific enthalpy at reference pressure p and temperature T (kJ·kg1); s —specific entropy at reference pressure p and temperature T (kJ·K1·mol−1); h 0 —enthalpy at ambient temperature T 0   and   pressure   p 0 (kJ·kg−1); s 0 —entropy at ambient temperature T 0   and   pressure   p 0   (kJ·K1·mol1); c p   —specific heat capacity (kJ·kg1·K1); Rg—individual gas constant ( kJ · ( kmol · K )1); T 0 —ambient temperature (K); T—reference temperature (K); p 0 —ambient pressure (MPa(g)); p—reference pressure (MPa(g)).
The main aim of exergy analysis is to calculate and determine the values of exergy losses of system’s equipment [39,43]. In addition, the results of exergy losses calculation could provide information about the overall performance of the thermodynamic system. Exergy losses could be calculated on the basis of exergy balance described in [44,45,46,47].
Moreover, the exergy efficiency should be assessed as an important parameter that allows to determine improvement possibility of the regasification system. Exergy efficiencies could be combined with flow diagrams, which make it possible to identify thermodynamic performance of single equipment of regasification process or whole regasification process [32]. When exergy losses are calculated, the exergy efficiency of the equipment could be determined using Equation (21) [7,14]:
η ex = ex gain ex pain =   Exergy   output   Exergy   input = 1   Exergy   loss   rate   in   each   device   Exergy   input
where: ηex—exergy efficiency (%); exgain—sum of exergy outputs (kW); expain—sum of exergy inputs (kW).

3. Results and Discussions

Based on proposed methodology, the calculations were carried out, and results were analysed in detail.
At the beginning, the attention was paid to the differences in the set of parameters of the analysed five cases (Section 2.2), which influenced research outcomes. For instance, Case 1 was characterised by the highest regasification flow (120,000 kg h−1) compared to Case 4 with the lowest flow of 50,000 kg·h−1 (ratio of 2.4). It was concluded that the regasification flow of LNG cold energy of Case 1 is higher than in Case 4.
Although Case 2 and Case 3 had similar pressure conditions at every flow point of regasification, the boiling temperature was different. The higher amount of nitrogen in LNG was observed in Case 3, while the fluid boiled at minus 196 °C (boiling temperature of methane is minus 162 °C). This resulted in slightly lower LNG cold energy (L8 in Figure 1) in Case 3 (131.17 MWh·kg−1) compared to Case 2 (136.52 MWh·kg−1).

3.1. Results of Energy Analysis and Yield of Cold Energy

The next step of investigation covered the analysis of processes performed within propane closed loop as the main part of the regasification plant influenced by the LNG and the seawater side-cycles. This loop includes many thermodynamic processes (vaporisation, heating, condensation, expansion) that influence propane flow. Therefore, the detailed analysis of LNG regasification process, conducted using equipment (pumps, vaporisers, heaters, etc.), was carried out. According to Equations (10)–(15), the energy values were calculated to verify thermodynamic process changes and analyse the energy input and output values in all propane closed loops. Estimated energy balance values are presented in Table 3.
It should be noted that the maximum flow rate of propane (287,212 kg·h−1) occurred in Case 1. It was 2.8 times higher than in Case 4 with the minimum propane flow (100,000 kg·h−1). Initial flow of propane (from LNG vaporiser into propane tank) was 220,000 kg·h1 in Case 2, 250,000 kg·h1 in Case 3, and 270,000 kg·h1 in Case 5. Comparing the achieved results, small differences between flows were determined that induce different energy input and output values (Table 3). These values depend on pressure and temperatures changes.
During the propane vaporisation process, it was noticed that the energy output was 2.8 times higher in Case 1 than in Case 4 (Table 3). In other cases, the energy output was similar comparing with Case 1. These energy changes showed the amount of absorbed heat by propane from seawater.
It was determined that regasification with simultaneous BOG recondensation (Case 2, Case 4, Case 5) requires only a small amount of energy for the regasification of LNG. The reason is that the recondensation process warms up cold LNG. If, for example, Case 1 and Case 5 are compared with the same LNG regasification stream (120,000 kg·h1), a higher energy demand can be observed in Case 1 than in Case 5. It could be caused by partly BOG recondensation in Case 5.
Furthermore, released LNG cold energy was determined by comparing LNG energy input and output values of the whole regasification system (starting with the LNG transfer using booster pump and finishing with the NG heating process). The maximum value of released energy was estimated in Case 5 (24.78 MW). However, Case 3 was characterised by higher amount of LNG cold energy than Case 2 due to higher nitrogen content in LNG. The difference between these two cases was estimated as 1.15 MW.
The minimum amount of released LNG cold energy was observed in Case 4. The difference between minimum and maximum values of released energy was determined (2.15 MW). The average value of LNG cold energy for all analysed cases reached 22.34 MW.

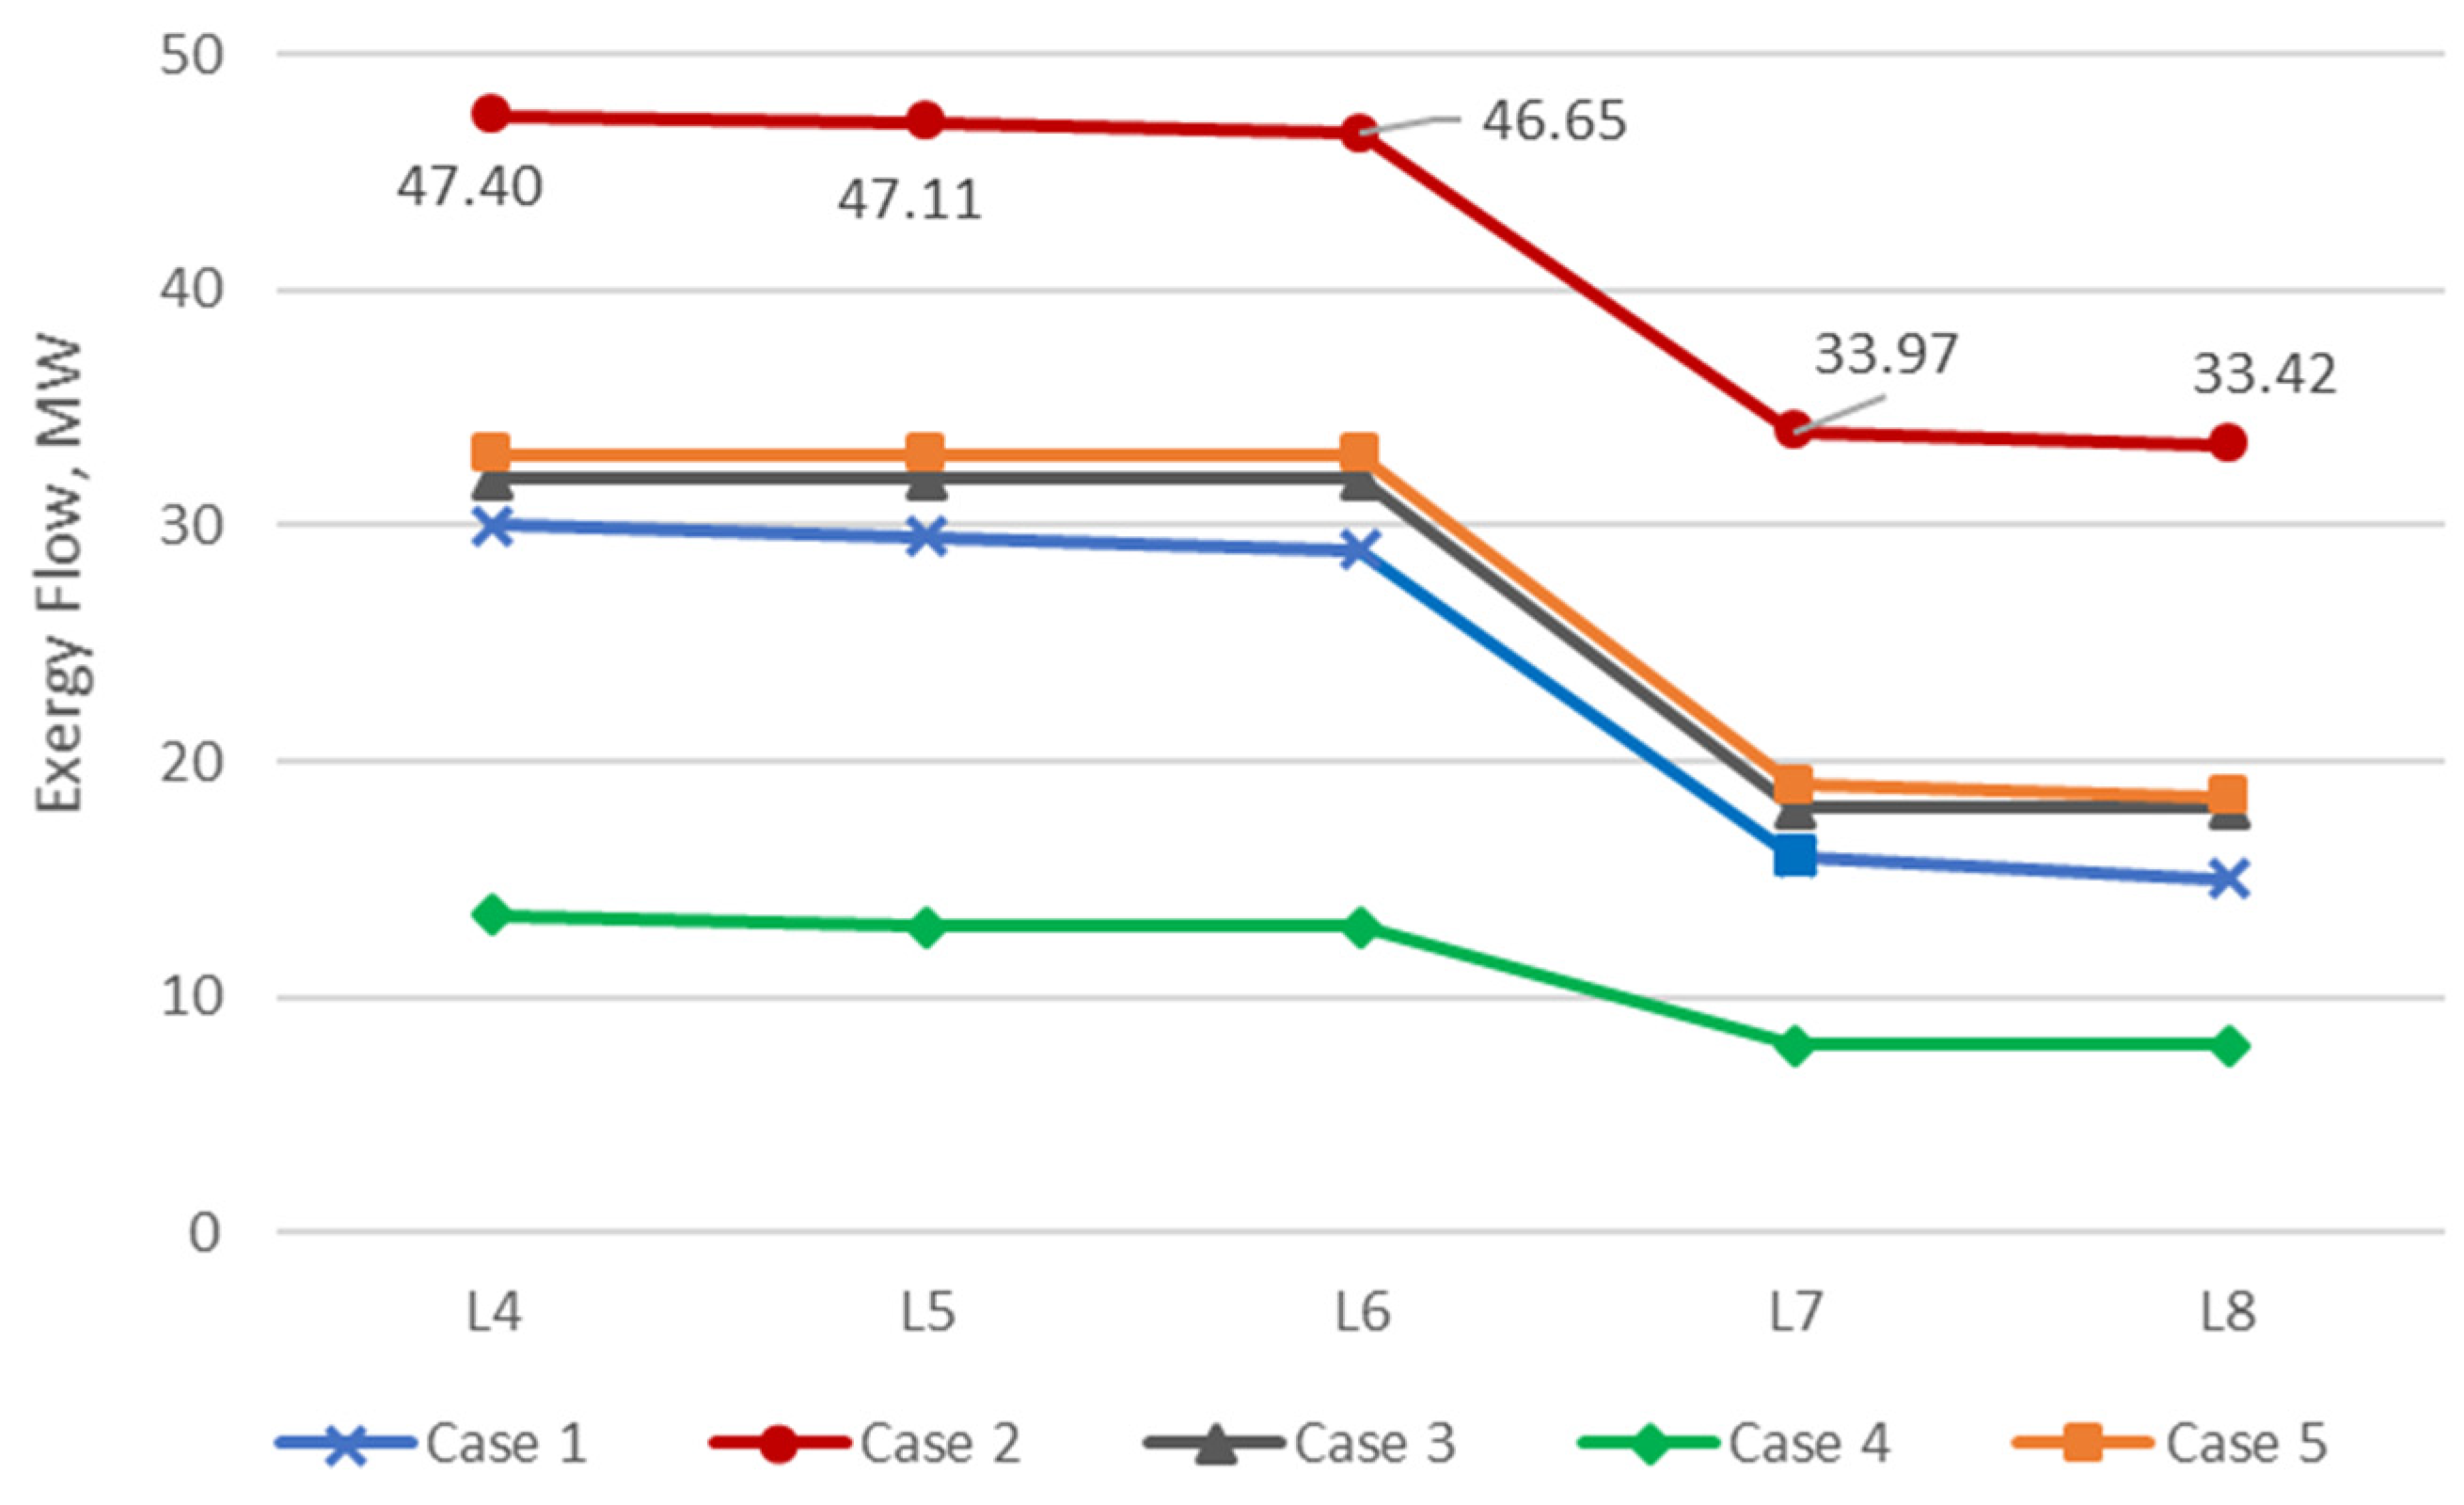
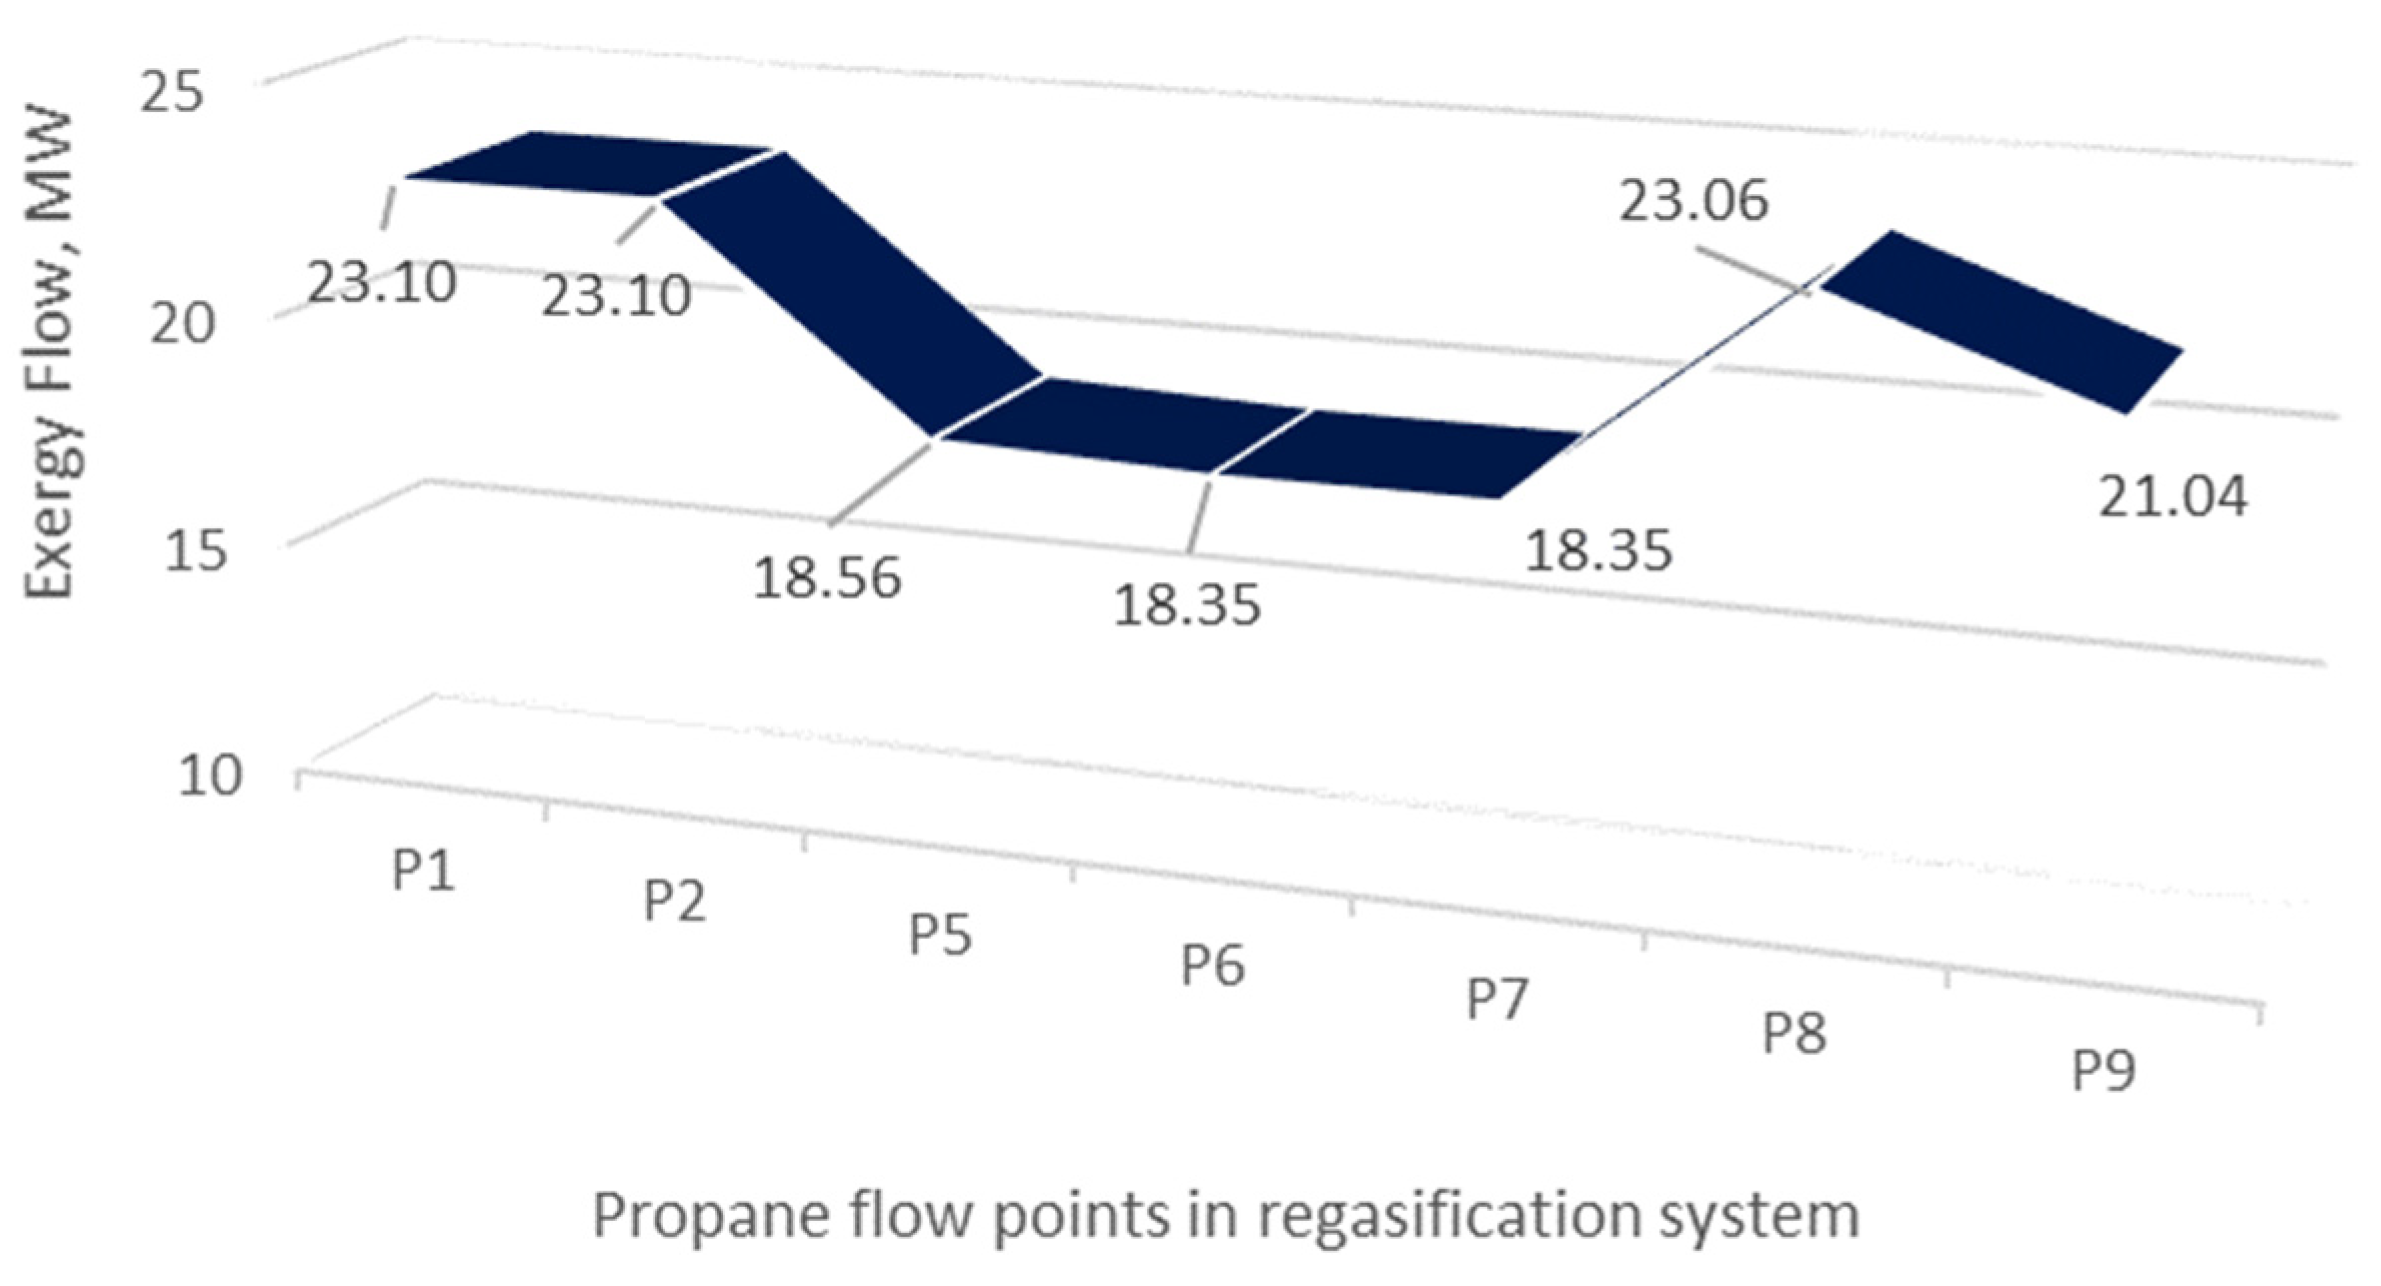
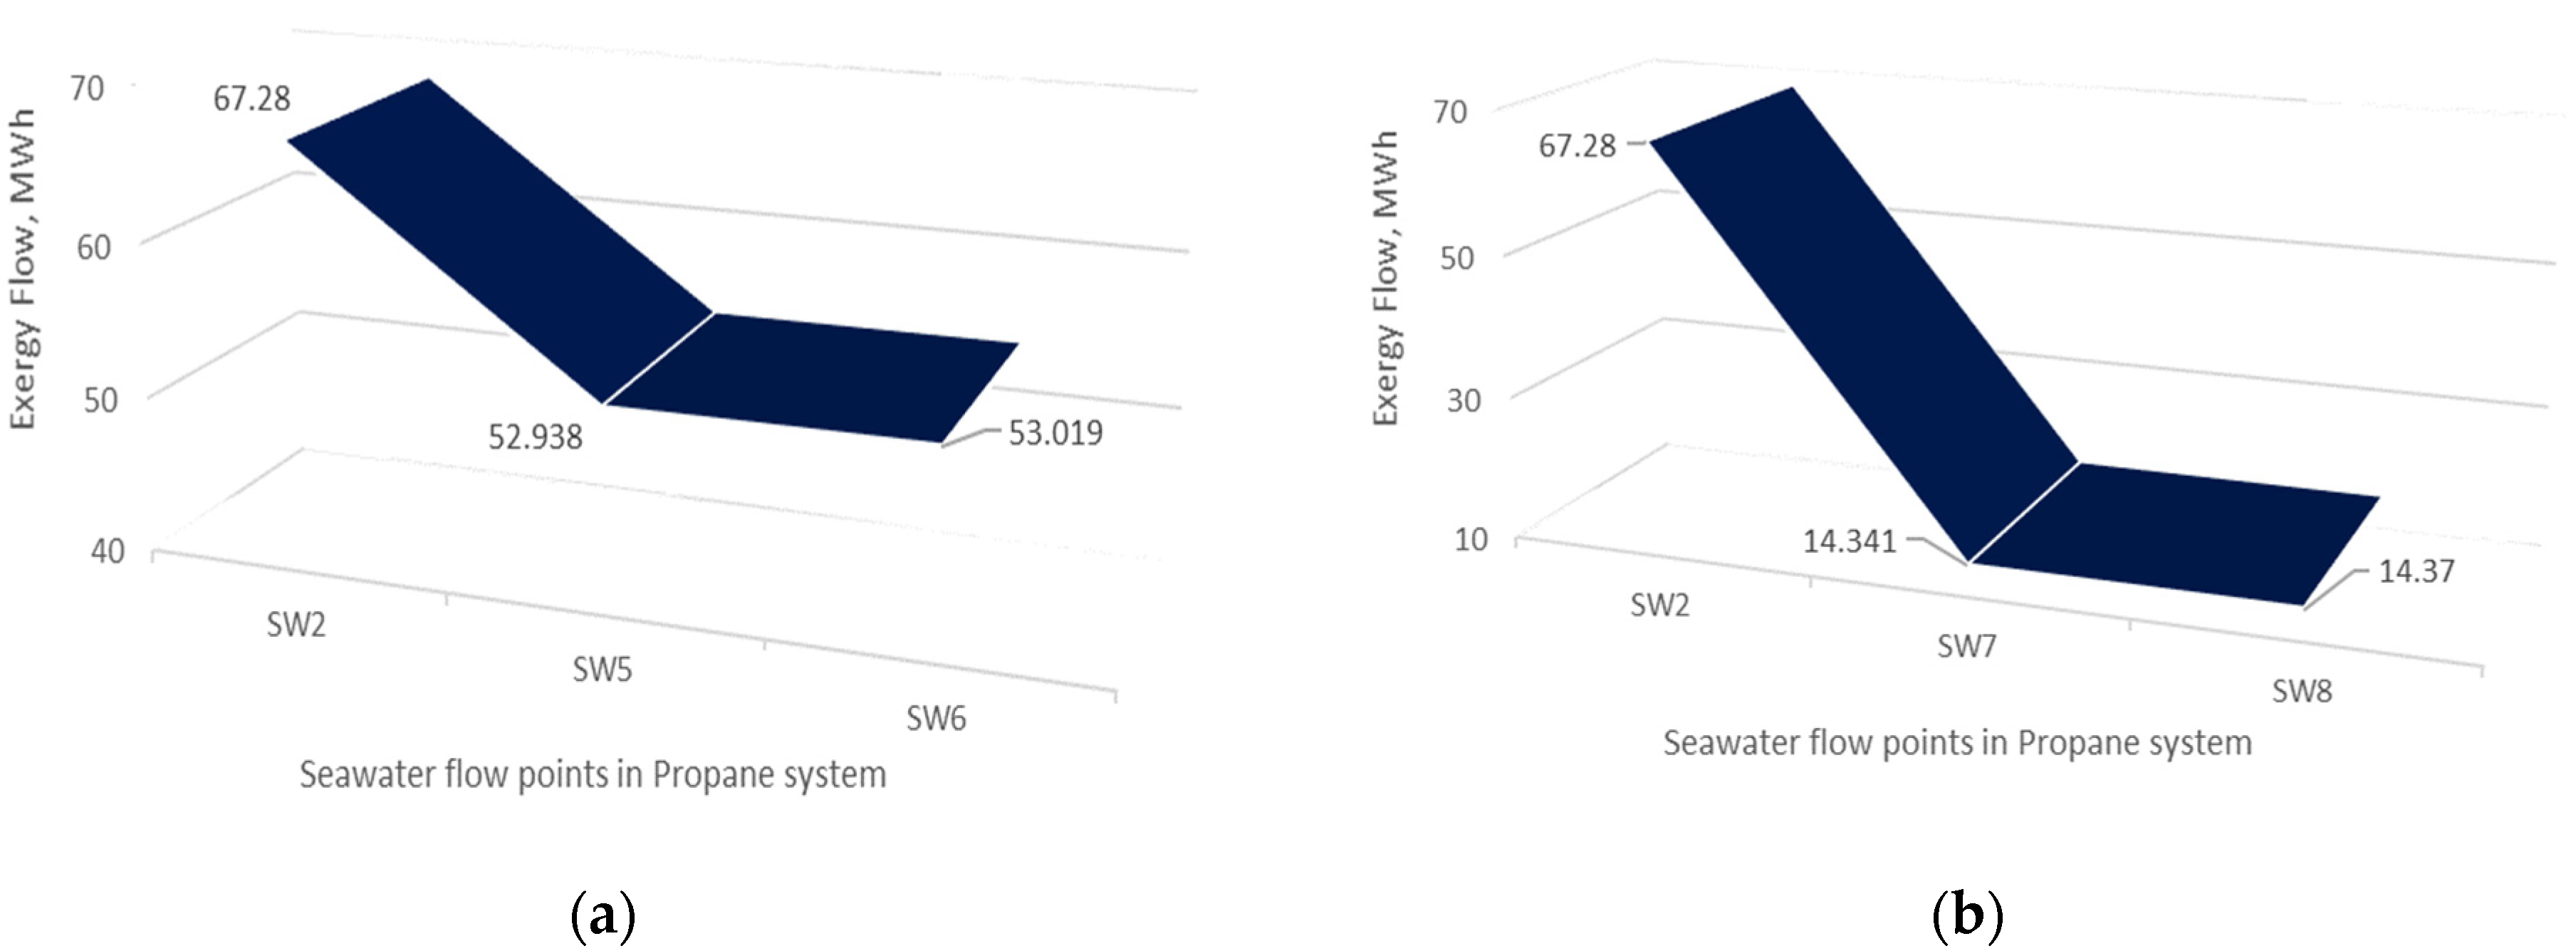
3.2. Results of Exergy Analysis

To evaluate drawbacks of the regasification system at FSRU, the exergy analysis was performed. The estimated values of exergy were calculated for every flow indicated in the regasification system (Figure 2) in order to determine the losses in the regasification system in exergy balance. The Case 2 was selected for further detailed analysis because it showed the highest values of exergy flow. The other cases had similar exergy progression at a lower level, as it can be observed in Figure 2, showing the exergy flow values of Case 2.
While transferring LNG by booster pump to the BOG recondensation unit, the exergy decreased from 47.40 MW to 47.11 MW (Figure 2). The exergy change in the BOG recondensation unit reached the value of 291 kW. The highest exergy flow changes were observed between LNG input flow from BOG recondenser to LNG vaporiser as well as during natural gas flow from LNG vaporiser to NG trim heater. These changes were found to affect the production of natural gas from LNG. These processes consumed about 12.68 MW. It was also found that the further natural gas heating needs up to 0.54 MW. This was estimated as a difference between natural gas flow from the LNG vaporiser to the NG trim heater as well as natural gas flow from the NG trim heater to the natural metering system.
Figure 3 illustrates propane exergy flows indicated for the Case 2. The flow difference between P2 and P5 resulted from a decrease of exergy value from 23.10 MW to 18.56 MW. The attention should be paid to fact that increase in pressure at the propane pump did not lead to an increase in exergy but even to its reduction. During the propane preheating process observed in exergy flows (P5 and P6), the changes were not visible. The increase in exergy flow took place between P7 and P8 (4.70 MW) and resulted from the mixing of the propane from the NG trim heater with fresh propane from the propane buffer tank. The exergy changes could be seen during the propane vaporisation process, which is represented by P8 and P9 flows. For these flows, the exergy decreased by 9% from 23.06 MW and 21.04 MW, achieving a difference of 2.02 MW. This value is justified because the exergy is transmitted from propane to LNG.
Calculation results of the seawater exergy are illustrated in Figure 4. Exergy flow was divided into two sections. The first dealt with the seawater flow to the propane preheater (Figure 4a) and the second with the seawater flow to the propane evaporator (Figure 4b). The exergy flow was observed in propane vaporiser due to the heat transfer. It was found that in all analysed sections (propane vaporiser, propane preheater), exergy decreased because the energy was taken up by propane.
Table 4 shows the exergy input and output of the regasification process for Case 2. It was found that the exergy input reached 47.40 MW and the exergy output 47.11 MW, taking into account the operation of the booster pump. That part of the thermal exergy is transferred into pressure exergy in the booster pump when LNG is pressurised, and its temperature drops. For the BOG recondenser, the smallest exergy was calculated for the input (47.11 MW) and the output (46.65 MW). This is due to the small impact of the BOG’s condensation on the temperature and pressure of LNG.
It could be also observed that the highest exergy input (142.43 MW) and exergy output (140.73 MW) were in the propane vaporiser, but the exergy losses (1.70 MW) reached smaller values compared to the LNG vaporiser (9.61 MW). The effect of high exergy demand could be caused by high seawater flow and propane precooling before the propane vaporisation process. The precooling is presumably performed to decrease system work and propane temperature after NG heating in the NG trim heater. Furthermore, the large exergy input (68.51 MW) and exergy output (58.90 MW) were indicated in the LNG vaporiser, where high heat transfer between LNG and propane flows were observed.
The exergy losses in the FRSU regasification process were verified. In contradiction to the high exergy losses at evaporators suggested in the literature [48,49,50], the estimated value of the exergy loss in the propane evaporator of the FSRU “Independence” is only about 1%. Exergy losses in other regasification equipment (different than the LNG evaporator) also did not exceed 1%. Energy demand of analysed LNG regasification cases at FSRU is shown in Table 5.
On the basis of conducted research, it can be concluded that within the analysis of the regasification process, the heat flow starts when the heat is taken from the seawater and is transferred from the propane to the LNG or NG via the LNG evaporator and the trim heater. The exergy efficiency of the regasification plant’s equipment was estimated (Table 4). It should be noted that it was influenced by the interfaces of heat transfer from propane to LNG or NG, where the greatest exergy losses occur. The calculated values correspond roughly to research results shown in the available literature. However, it is influenced by interfaces of heat transfer from propane to LNG or NG, where the greatest losses of exergy occur [48,49,50]. The thermal energy must be supplied continuously in addition to the thermal energy for evaporation and heating of the NG. Furthermore, it can be concluded that considering the location of the FSRU “Independence”, in the colder seasons, energy must be used to keep the evaporation process running. Due to the continuous demand for thermal energy, especially in winter, it would be reasonable to use the FSRU regasification plant as an economical and environmentally friendly heat sink for industrial and urban waste heat [25], as the EU has the target of climate neutrality by using waste heat. Therefore, major structural changes in FSRU are not necessary, in contrast to the proposals for its usage presented in the literature [6,8,10,11,12,13,14,15,16,17,18,19].

4. Conclusions

In order to conclude, it could be stated that a high amount of heat is required to heat the LNG unit considering its flow process and set requirements. The specified cases’ analyses allow to draw the conclusion that the highest thermal energy quantity of 24.78 MW was required in Case 5, which has an NG send-out flow of 120,000 kg·h−1 and a regasification pressure of 5.5 MPa (g), a methane content of LNG of 86%, and partial BOG recondensation. Although the examined technical parameters of the regasification process differed significantly in analysed cases, the energy demands, however, did not differ in the same way. This shows that the influence is rather small. The thermal energy demand decreased by only 18%, when NG send-out flow dropped by 41% from 120,000 kg·h−1 (Case 5) to 50,000 kg·h−1 (Case 4). The demand for thermal energy decreased even less (by 9%) when a partial BOG recondensation was added (as calculated in Case 1). The heat energy demand decreased even less in the case where the LNG mixture of 96% methane and 4% nitrogen was applied as calculated in Case 3, and therefore, the heat energy demand was 2.3% higher than for pure methane (Case 2).
Based on Case 4 analysis, it could be noted that the minimum thermal energy demand reached 20.429 MW, but the average value was 22.34 MW, while Cases 1, 2, and 3 had similar results. In particular, it has been shown that the influence on the thermal energy of the pump’s work is relatively small. For example, the flow rate of the emitted gas depends mainly on the energy input by the propane cycle but to a lesser extent on the booster pump.
The maximum exergy input of the regasification system at FSRU was determined at a level of 75.99 MW in the propane vaporiser and 37.44 MW in the propane preheater. The last-mentioned value in the propane preheater was the lowest calculated exergy input value. Meanwhile, the exergy input was estimated to be 47.40 MW in the booster pump, 47.11 MW in the BOG recondenser, 52.32 MW in the NG trimming water heater, and 65.00 MW in the LNG evaporator.
The analysed regasification plant is essentially efficient; however, in view of climate neutrality and the EU’s objectives in this respect, it is recommended to obtain the heat necessary for the heating of LNG not only from the seawater of the Baltic Sea, but it should be combined with industrial and urban waste heat. For example, connection via pipelines to the seawater input of the FSRU, in accordance with the technology used for district heating or remote cooling, would be cheaper than constructing of additional installation on the deck of the FSRU, as often is proposed in the literature. Further investigation of FSRU efficiency will form the direction of our further research.

Author Contributions

Conceptualization, V.S., T.P. and J.U.; methodology, T.P. and V.S.; software, V.S. and T.P.; validation, V.S., T.P, J.U. and L.F.-D.; formal analysis, V.S. and J.U.; investigation, V.S., T.P., J.U. and L.F.-D.; resources, L.F.-D.; data curation, T.P. and L.F.-D.; writing—original draft preparation, V.S. and J.U.; writing—review and editing, T.P., L.F.-D. and M.B.; visualization, V.S., T.P. and J.U.; supervision, T.P. and L.F.-D.; project administration, T.P.; funding acquisition, T.P. and L.F.-D. All authors have read and agreed to the published version of the manuscript.

Funding

This research received no external funding.

Institutional Review Board Statement

Not applicable.

Informed Consent Statement

Not applicable.

Data Availability Statement

All data generated or analyzed during this study are included in this published article.

Conflicts of Interest

The authors declare no conflict of interest.

References

  1. IGU 2020. World LNG Report. International Gas Union. Available online: https://www.igu.org/app/uploads-wp/2020/04/2020-World-LNG-Report.pdf (accessed on 1 October 2020).
  2. Zoelle, A.; Keairns, D.; Pinkerton, L.L.; Turner, M.J.; Woods, M.; Kuehn, N.; Shah, V.; Chou, V. Cost and Performance Baseline for Fossil Energy Plants Volume 1a: Bituminous Coal (PC) and Natural Gas to Electricity Revision 3; U.S. Department of Energy, Office of Scientific and Technical Information: Washington, DC, USA, 2015. [CrossRef] [Green Version]
  3. IEA, The Role of Gas in Today’s Energy Transitions. World Energy Outlook Special Report 2019. Available online: https://www.iea.org/reports/the-role-of-gas-in-todays-energy-transitions (accessed on 1 October 2020).
  4. Thinkstep, Life Cycle GHG Emission Study on the Use of LNG as Marine Fuel. Final Report 2020. Available online: https://sphera.com/de/reports/life-cycle-ghg-emission-study-on-the-use-of-lng-as-marine-fuel/ (accessed on 1 October 2020).
  5. Abergel, T.; Delmastro, C. IEA, Tracking Buildings 2020—Heat Pumps. 2020. Available online: https://www.iea.org/reports/tracking-buildings-2020/heat-pumps#abstract (accessed on 1 October 2020).
  6. He, T.; Chong, Z.R.; Zheng, J.; Ju, Y.; Linga, P. LNG Cold Energy Utilization: Prospects and Challenges. Energy 2018, 170, 557–568. [Google Scholar] [CrossRef]
  7. Choi, I.-H.; Lee, S.; Seo, Y.; Chang, D. Analysis and optimization of cascade Rankine cycle for liquefied natural gas cold energy recovery. Energy 2013, 61, 179–195. [Google Scholar] [CrossRef]
  8. Franco, A.; Casarosa, C. Thermodynamic analysis of direct expansion configurations for electricity production by LNG cold energy recovery. Appl. Therm. Eng. 2015, 78, 649–657. [Google Scholar] [CrossRef]
  9. Bao, J.; Yuan, T.; Zhang, L.; Zhang, N.; Zhang, X.; He, G. Comparative study of liquefied natural gas (LNG) cold energy power generation systems in series and parallel. Energy Convers. Manag. 2019, 184, 107–126. [Google Scholar] [CrossRef]
  10. Pospíšil, J.; Charvát, P.; Arsenyeva, O.; Klimes, L.; Špiláček, M.; Klemeš, J.J. Energy demand of liquefaction and regasification of natural gas and the potential of LNG for operative thermal energy storage. Renew. Sustain. Energy Rev. 2019, 99, 1–15. [Google Scholar] [CrossRef]
  11. Messineo, A.; Panno, D. Potential applications using LNG cold energy in Sicily. Int. J. Energy Res. 2008, 32, 1058–1064. [Google Scholar] [CrossRef] [Green Version]
  12. Dhameliya, H.; Agrawal, P. LNG Cryogenic Energy Utilization. Energy Procedia 2016, 90, 660–665. [Google Scholar] [CrossRef]
  13. Lin, W.; Huang, M.; Gu, A. A seawater freeze desalination prototype system utilizing LNG cold energy. Int. J. Hydrogen Energy 2017, 42, 18691–18698. [Google Scholar] [CrossRef]
  14. Mehrpooya, M.; Sharifzadeh, M.M.M.; Zonouz, M.J.; Rosen, M.A. Cost and economic potential analysis of a cascading power cycle with liquefied natural gas regasification. Energy Convers. Manag. 2018, 156, 68–83. [Google Scholar] [CrossRef]
  15. Ebrahimi, A.; Ziabasharhagh, M. Optimal design and integration of a cryogenic Air Separation Unit (ASU) with Liquefied Natural Gas (LNG) as heat sink, thermodynamic and economic analyses. Energy 2017, 126, 868–885. [Google Scholar] [CrossRef]
  16. Lian, J.; Xia, B.; Yin, Y.; Yang, G.; Gou, X. Research on High Efficient Utilization on LNG Cold Energy. In Proceedings of the 4th International Conference on Computer, Mechatronics, Control and Electronics Engineering, Hangzhou, China, 28–29 September 2015. [Google Scholar] [CrossRef] [Green Version]
  17. Angelino, G.; Invernizzi, C.M. Carbon dioxide power cycles using liquid natural gas as heat sink. Appl. Therm. Eng. 2009, 29, 2935–2941. [Google Scholar] [CrossRef] [Green Version]
  18. Atienza-Márquez, A.; Bruno, J.C.; Coronas, A. Cold recovery from LNG-regasification for polygeneration applications. Appl. Therm. Eng. 2019, 132, 463–478. [Google Scholar] [CrossRef]
  19. Shi, X.; Che, D. A combined power cycle utilizing low-temperature waste heat and LNG cold energy. Energy Convers. Manag. 2009, 50, 567–575. [Google Scholar] [CrossRef]
  20. Qi, M.; Park, J.; Kim, J.; Lee, I.; Moon, I. Advanced integration of LNG regasification power plant with liquid air energy storage: Enhancements in flexibility, safety, and power generation. Appl. Energy 2020, 269, 115049. [Google Scholar] [CrossRef]
  21. Wang, G.-B.; Zhang, X.-R. Thermodynamic analysis of a novel pumped thermal energy storage system utilizing ambient thermal energy and LNG cold energy. Energy Convers. Manag. 2017, 148, 1248–1264. [Google Scholar] [CrossRef]
  22. Klaipeda Terminal—Characteristics of the Terminal. Available online: https://www.kn.lt/en/our-activities/lng-terminals/klaipeda-lng-terminal/559 (accessed on 1 October 2020).
  23. Egashira, S. LNG Vaporizer for LNG Re-gasification Terminal. KOBELCO Technol. Rev. 2013, 32, 64–69. Available online: https://www.kobelco.co.jp/english/ktr/pdf/ktr_32/064-069.pdf (accessed on 1 October 2020).
  24. Klaipeda LNG Reloading Station. Available online: https://www.kn.lt/en/our-activities/lng-terminals/lng-reloading-station/2761 (accessed on 1 October 2020).
  25. Wheatcroft, E.; Wynn, H.; Lygnerud, K.; Bonvicini, G.; Leonte, D. The Role of Low Temperature Waste Heat Recovery in Achieving 2050 Goals: A Policy Positioning Paper. Energies 2020, 13, 2107. [Google Scholar] [CrossRef] [Green Version]
  26. Lygnerud, K.; Wheatcroft, E.; Wynn, H. Contracts, Business Models and Barriers to Investing in Low Temperature District Heating Projects. Appl. Sci. 2019, 9, 3142. [Google Scholar] [CrossRef] [Green Version]
  27. Tahmasebi, S.; Abbasabadi, A.B.; Ghasemi, N.; Javadian, H.; Mashhadi, S.; Fattahi, M.; Arian, Y.R.; Maddah, H. Investigation of various feed conditions on NGL recovery plant energy and exergy performance: A case study. J. Nat. Gas Sci. Eng. 2015, 22, 83–89. [Google Scholar] [CrossRef]
  28. Chang, H.-M.; Kim, B.H.; Choi, B. Hydrogen liquefaction process with Brayton refrigeration cycle to utilize the cold energy of LNG. Cryogenics 2020, 108, 103093. [Google Scholar] [CrossRef]
  29. He, T.; Nair, S.K.; Babu, P.; Linga, P.; Karimi, I. A novel conceptual design of hydrate based desalination (HyDesal) process by utilizing LNG cold energy. Appl. Energy 2018, 222, 13–24. [Google Scholar] [CrossRef]
  30. Kanbur, B.B.; Xiang, L.; Dubey, S.; Choo, F.H.; Duan, F. Cold utilization systems of LNG: A review. Renew. Sustain. Energy Rev. 2017, 79, 1171–1188. [Google Scholar] [CrossRef]
  31. Agarwal, R.; Rainey, T.J.; Rahman, S.M.A.; Steinberg, T.; Perrons, R.K.; Brown, R.J. LNG Regasification Terminals: The Role of Geography and Meteorology on Technology Choices. Energies 2017, 10, 2152. [Google Scholar] [CrossRef] [Green Version]
  32. Migliore, C.; Tubilleja, C.; Vesovic, V. Weathering prediction model for stored liquefied natural gas (LNG). J. Nat. Gas Sci. Eng. 2015, 26, 570–580. [Google Scholar] [CrossRef] [Green Version]
  33. GIIGNL. Custody Transfer Handbook, 5th ed.; International Group of Liquefied Natural Gas Importers; 2017; pp. 1–179. Available online: https://giignl.org/system/files/giignl_cthb_5.0.web_.pdf (accessed on 1 October 2020).
  34. Dong, H.; Zhao, L.; Zhang, S.; Wang, A.; Cai, J. Using cryogenic exergy of liquefied natural gas for electricity production with the Stirling cycle. Energy 2013, 63, 10–18. [Google Scholar] [CrossRef]
  35. Li, S.; Wang, B.; Dong, J.; Jiang, Y. Thermodynamic analysis on the process of regasification of LNG and its application in the cold warehouse. Therm. Sci. Eng. Prog. 2017, 4, 1–10. [Google Scholar] [CrossRef]
  36. Noh, Y.; Kim, J.; Kim, J.; Chang, D. Economic evaluation of BOG management systems with LNG cold energy recovery in LNG import terminals considering quantitative assessment of equipment failures. Appl. Therm. Eng. 2018, 143, 1034–1045. [Google Scholar] [CrossRef]
  37. Miana, M.; del Hoyo, R.; Rodrigálvarez, V. Comparison of evaporation rate and heat flow models for prediction of Liquefied Natural Gas (LNG) ageing during ship transportation. Fuel 2016, 177, 87–106. [Google Scholar] [CrossRef]
  38. Sun, X.; Yao, S.; Xu, J.; Feng, G.; Yan, L. Design and Optimization of a Full-Generation System for Marine LNG Cold Energy Cascade Utilization. J. Therm. Sci. 2020, 29, 587–596. [Google Scholar] [CrossRef]
  39. Zhao, L.; Dong, H.; Tang, J.; Cai, J. Cold energy utilization of liquefied natural gas for capturing carbon dioxide in the flue gas from the magnesite processing industry. Energy 2016, 105, 45–56. [Google Scholar] [CrossRef]
  40. Brown, J.S.; Brignoli, R.; Daubman, S. Methodology for estimating thermodynamic parameters and performance of working fluids for organic Rankine cycles. Energy 2014, 73, 818–828. [Google Scholar] [CrossRef]
  41. Fahmy, M.; Nabih, H.; El-Rasoul, T. Optimization and comparative analysis of LNG regasification processes. Energy 2015, 91, 371–385. [Google Scholar] [CrossRef]
  42. Ahmadi, M.H.; Mehrpooya, M.; Pourfayaz, F. Thermodynamic and exergy analysis and optimization of a transcritical CO2 power cycle driven by geothermal energy with liquefied natural gas as its heat sink. Appl. Therm. Eng. 2016, 109, 640–652. [Google Scholar] [CrossRef]
  43. Lee, D.-H.; Ha, M.-K.; Kim, S.-Y.; Shin, S.-C. Research of design challenges and new technologies for floating LNG. Int. J. Nav. Arch. Ocean Eng. 2014, 6, 307–322. [Google Scholar] [CrossRef] [Green Version]
  44. Terehovics, E.; Veidenbergs, I.; Blumberga, D. Energy and exergy balance methodology. Wood chip dryer. Energy Procedia 2017, 128, 551–557. [Google Scholar] [CrossRef]
  45. Labidi, J.; Boulet, E.; Paris, J. On Intrinsic Exergy Efficiency and Heat Pumps. Chem. Eng. Res. Des. 2000, 78, 180–183. [Google Scholar] [CrossRef]
  46. Dincer, I.; Rosen, M.A. Energy, environment and sustainable development. Appl. Energy 1999, 64, 427–440. [Google Scholar] [CrossRef] [Green Version]
  47. Winterbone, D.E.; Turan, A. Chapter 15—Combustion and Flames. In Advanced Thermodynamics for Engineers, 2nd ed.; Elsevier: Amsterdam, The Netherlands, 2015. [Google Scholar] [CrossRef]
  48. Akpinar, E.K.; Bicer, Y. Investigation of heat transfer and exergy loss in a concentric double pipe exchanger equipped with swirl generators. Int. J. Therm. Sci. 2005, 44, 598–607. [Google Scholar] [CrossRef]
  49. Paniagua, I.L.; Martín, J.R.; Fernández, C.G.; Alvaro, Á.J.; Carlier, R.N. A New Simple Method for Estimating Exergy Destruction in Heat Exchangers. Entropy 2013, 15, 474–489. [Google Scholar] [CrossRef]
  50. Galovic, A.; Zivic, M.; Kokanovic, M. Analysis of Exergy Destruction of an Evaporator or/an a Condenser. Strojarstvo 2009, 51, 73–78. [Google Scholar]
Figure 1. Simplified scheme of regasification process in FSRU. Note: the suction drum, including in- and outputs L1, L2, L3, and B1, is presented to illustrate the completeness of regasification process scheme; however, in the presented study these elements will not be analysed in detail.
Jmse 10 00897 g001
Figure 2. Composition of the LNG exergy flow in regasification system: L4, LNG flow transfer to LNG booster pump; L5, LNG input to BOG recondenser; L6, LNG output from BOG recondenser and input to LNG vaporiser; L7, NG flow from LNG vaporiser and input to NG trim heater; L8, NG flow from NG trim heater to natural metering system.
Jmse 10 00897 g002
Figure 3. The values of propane exergy flow in the regasification system: P1, propane flow from LNG vaporiser to propane tank; P2, propane flow transfer by propane pump; P5, propane flow to propane preheater; P6, propane flow from propane preheater to NG trim heater; P7, propane flow from NG trim heater to propane evaporator; P8, propane flow to propane evaporator; P9, propane (liquid and vapours) flow from propane evaporator to LNG vaporiser.
Jmse 10 00897 g003
Figure 4. The Case 2 of seawater exergy flow in the regasification system. (a) The values of seawater exergy flow in regasification system: SW2, seawater inlet to the regasification system from heaters; SW5, seawater flow to propane evaporator; SW6, seawater output flow from propane evaporator. (b) The values of seawater exergy flow in the regasification system: SW2, seawater inlet to the regasification system from heaters; SW7, seawater flow to propane preheater; SW8, seawater flow output flow from propane preheater.
Jmse 10 00897 g004
Table 1. Criteria of analysed LNG regasification cases at FSRU.
CaseComposition of LNG, %Flow Rate of LNG, kg·h−1Pressure, MPa (g)BOG Recondensation
Case 1Methane—86; ethane—8; propane—4;
i-butane—1; n-butane—1
120,0003.5No recondensation
Case 2Methane—99.6; nitrogen—0.4102,6666.5With BOG circulation
Case 3Methane—96; nitrogen—4105,6666.5No recondensation
Case 4Methane—86; ethane—8; propane—4;
i-butane—1; n-butane—1
50,0006.5Partly recondensation
Case 5Methane—86; ethane—8; propane—4;
i-butane—1; n-butane—1
120,0005.5Partly recondensation
Table 2. Results of calculated physical properties of LNG for selected regasification cases.
Regasification CaseM V
(Without Correction)
VmixK1K2ρLNGRg
Unitskg·kmol−1L·mol−1L·mol−1L·mol−1L·mol−1kg·m−3kJ·(kmol·K)−1
Case 1 *19.12900.04000.03980.007180.00129480.260.435
Case 216.00000.04000.03800.000010.00032423.420.520
Case 316.42200.03600.0352−2.66·10−61.07·10−5432.400.506
* The composition of LNG is the same as in Case 4 and Case 5; M, molecular mass of mixture (kg·kmol−1); V (without correction), molar volume of LNG at the reference temperature (L·mol−1); Vmix, molar volume of mixture (L·mol−1); K1, K2, volume correction factors (L·mol−1); ρLNG, density of LNG by reference temperature (L·mol−1); Rg, individual gas constant kJ·(kmol·K)−1.
Table 3. Energy input at the propane tank in reference conditions: 257.95 K and 0.2 MPa and energy output in reference conditions: propane vaporiser at 271.75 K and 0.4 MPa.
CaseEnergy Input, MWEnergy Output, MW
1224.98201.21
2183.78164.36
3198.51177.53
479.9671.58
5214.78192.09
Table 4. Exergy balance of the regasification process in Case 2.
EquipmentExergy Input, MWExergy Output, MWLosses, %
Booster pump47.4047.111
BOG recondenser47.1146.651
LNG vaporiser68.5158.9014
NG trim heater53.6653.151
Propane preheater51.9551.82>1
Propane vaporiser142.43140.731
Table 5. Energy demand of the analysed LNG regasification cases at FSRU.
CasesLNG SubsystemPropane Closed LoopTotal Amount of LNG Cold Energy Verifying Initial and Final Conditions, kW
Power Consumption by Booster Pump, kWAbsorbed Heat by BOG Recondenser, kWAbsorbed Heat by LNG Vaporiser, kWAbsorbed Heat by NG Trim Heater, kWPower Consumption by Propane Pump, kWReleased Heat by
Propane Preheater, kW
Released Heat by Propane Vaporiser, kW
Case 1: LNG flow—120,000 kg·h1, regasification pressure 3.5 MPa(g), no BOG recondensation, methane content of LNG—86%160023,8041343160402120,50422,630
Case 2: LNG flow—102,666 kg·h1, regasification pressure 6.5 MPa(g), with BOG recondensation, methane content of LNG—99.6%13034219,450941130328516,87921,360
Case 3: LNG flow—105,666 kg·h1, regasification pressure 6.5 MPa(g), no BOG recondensation, methane content of LNG—96%141020,419799141354818,09122,513
Case 4: LNG flow—50,000 kg·h−1, regasification pressure 6.5 MPa(g), partly BOG recondensation, methane content of LNG—86%11423683894721141563716120,429
Case 5: LNG flow—120,000 kg·h−1, regasification pressure 5.5 MPa(g), partly BOG recondensation, methane content of LNG—86%1523422,6961309152383919,95524,777
Publisher’s Note: MDPI stays neutral with regard to jurisdictional claims in published maps and institutional affiliations.

