Article

Numerical Study on the Influence of Tropical Cyclone Characteristics on the Sea State and Sea Surface Roughness inside the Tropical Cyclones

1
Key Laboratory of Ocean Circulation and Waves, Institute of Oceanology, Chinese Academy of Sciences, Nanhai Road, 7, Qingdao 266071, China
2
Laboratory for Ocean and Climate Dynamics, Qingdao National Laboratory for Marine Science and Technology, Wenhai Road, 1, Qingdao 266237, China
3
Centre for Ocean Mega-Science, Chinese Academy of Sciences, Nanhai Road, 7, Qingdao 266071, China
4
Waves and Weather Forecast Department, North China Sea Marine Forecasting Center of State Oceanic Administration, Yunling Road, 27, Qingdao 266000, China
5
Shandong Provincial Key Laboratory of Marine Ecology and Environment & Disaster Prevention and Mitigation, North China Sea Branch, Ministry of Natural Resources of China, Yunling Road, 27, Qingdao 266061, China
6
Department of Marine Science Data Center, Center for Ocean Mega-Science, Institute of Oceanology, Chinese Academy of Sciences, Nanhai Road, 7, Qingdao 266071, China
7
Center for High Performance Computing and System Simulation, Pilot National Laboratory for Marine Science, Technology Laboratory for Ocean and Climate Dynamics, Qingdao National Laboratory for Marine Science and Technology, Qingdao 266237, China
*
Authors to whom correspondence should be addressed.
J. Mar. Sci. Eng. 2022, 10(5), 609; https://doi.org/10.3390/jmse10050609
Submission received: 31 March 2022 / Accepted: 26 April 2022 / Published: 29 April 2022
(This article belongs to the Special Issue Data Modelling for Coastal-Ocean Environments and Disasters)

Abstract

:
The development of wind wave (i.e., sea state) inside an intense tropical cyclone (TC) is the dominant contributor to the sea surface roughness and thus significantly impacts the air–sea interaction. The sea state is known to vary with TC characteristics (intensity, size, and translation speed); however, comprehensive knowledge of the influence of TC characteristics on the sea state and sea surface roughness is quite limited, largely because of the lack of observations. In this study, numerical experiments are performed to investigate the influence of TC characteristics on the sea state and the sea surface roughness under a range of idealized TCs. The numerical results indicate that the sea states are systematically younger for a more intense or smaller TC, and their azimuthal variation is predominantly determined by the TC translation. The dependence of the sea surface roughness on wind speed shows systematic variations with the TC characteristics, which are most significant for a moderately moving TC.

1. Introduction

Extreme sea states generated by the intense wind forces of tropical cyclones (TCs) are of wide interest in both scientific research on the dynamics of wind–wave interactions and practical applications for their destructive threats to navigation and coastal safety. With the increase in experimental, observational and modelling studies, an increasing number of works have suggested that the sea state in a TC is closely correlated with the sea surface roughness and thus controls the air–sea momentum and heat exchange across the air–sea interface [1,2,3,4], which subsequently has an important influence on the development of the TC intensity [5,6] and upper ocean responses, i.e., ocean currents and mixing [7], and storm surges in nearshore regions [8].
The sea state inside the TC is complicated due to the fast-changing wind field in space and time as a result of the moving TC vortex. The sea state depends on the wind fetch, and because the wind fetch is strongly limited by the curvature of the wind field, waves that propagate forward in the direction of the TC remain in the intense wind forcing longer and thus gain an “extended” fetch [9,10,11,12]. As a result, the wave fields are more asymmetric than the wind field, which has been well confirmed by observational and numerical results [13,14,15,16,17].
Directional wave measurements obtained from in situ buoys and airborne radar greatly enrich the knowledge of the spatial structure of the wave field inside the TC [12,18,19,20,21,22,23,24,25,26]. Those studies showed that directional multimodal spectra prevail inside the TC, indicating that the waves are mixed with locally generated sea waves and remotely generated waves. The directional wave spectra and sea state show distinctive characteristics associated with the storm-relative quadrant, as the directional wave spectra range from trimodal in the right-rear quadrant to bimodal in the right-front quadrant to unimodal in the left-front quadrant (TCs in the Northern Hemisphere); furthermore, the waves are young, steep, and short in the right-rear quadrant and older, flatter and longer in the front-right and front-left quadrants [21].
Considering that the growth of wind waves inside TCs follows self-similar laws derived from fetch-limited conditions, Hwang and his coauthors [27,28] proposed the effective fetch and duration for wave development inside TCs, which show a quasi-linear radial dependence and a quasi-sinusoidal azimuthal dependence compared with hurricane hunter wave observations, and models were developed to describe the effective fetch and duration. The data they used come from a small number of TCs with a limited parameter range, and the effect of “extended” fetches was not included.
Though these observations provide valuable information on the wave distribution inside a TC, a comprehensive knowledge on the wave field inside TCs is still not very clear because the observations cover a quite limited TC parameter range, which also limits the understanding on the impact of TC characteristics on the sea surface roughness. As an alternative, numerical modelling can overcome the shortage of observations, modelling studies of the wave fields under TC conditions have been put forward in recent decades. The third-generation spectral wave model has shown its capacity to simulate the wave spectra and wave height distribution [13,29,30,31].
The study is devoted to the influence of TC characteristics on the spatial variation of wave field and the related wind drag. Instead of studying the significant wave height, we focused on the sea state parameters, the dimensional wave height and wave period, as they are more closely related to the sea surface roughness. Idealized numerical experiments on TC waves are designed to cover various TC parameters. The model configurations are described in Section 2; the numerical results are presented in Section 3; physical formations of the sea state are discussed in Section 4; and finally, the results are summarized in Section 5.

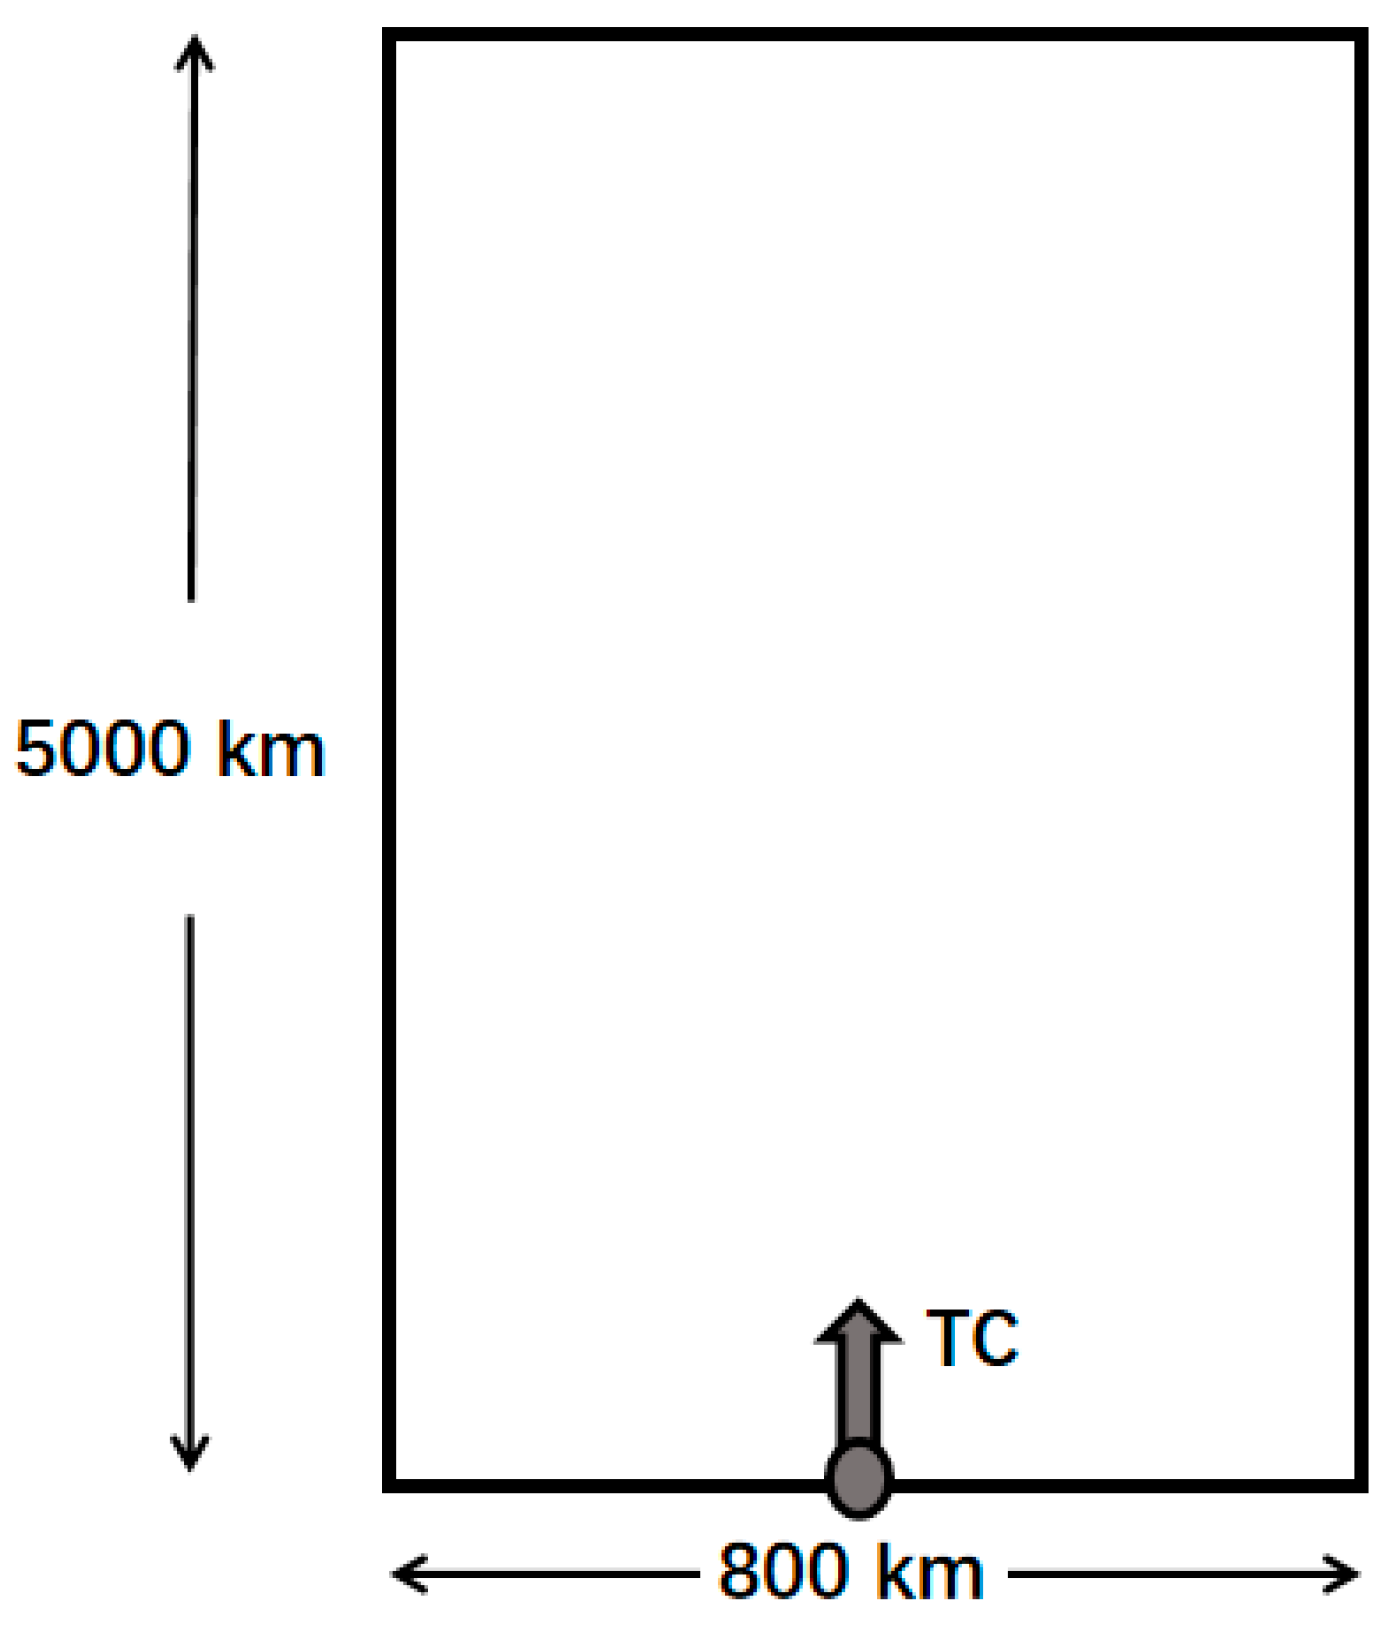
2. Model Configurations

The wave model is based on the WaveWatch III model (latest version of 6.07), which is a third-generation spectral wave model that solves the radiative transfer equation for simulations. In deep water, the source is balanced between the terms of wind input, nonlinear wave–wave interaction and whitecap dissipation. The source term package ST4 [32] is used for the parameterization of wind input and whitecap dissipation, and the cost-effective discrete interaction approximate (DIA) is used for the nonlinear wave–wave interaction.
An idealized domain and bathymetry are assumed, which are 800 km in the x-direction and 5000 km in the y-direction (as shown in Figure 1). Deep water conditions are considered by setting the water depth to be a constant of 5000 m. The computational timestep is set at 600 s, the time interval of wind input is 3600 s, and the grid resolution is 5 km in both directions. To alleviate the GSE effect, the tuning factors are set at 8 [33]. The wave spectrum is resolved into frequency bins logarithmically spaced from 0.04118 to 0.7186 at intervals of Δf/f = 0.1 and 36 regular azimuth direction bins.
Idealized stationary and moving TCs are formulated, which start with the center located at the point (x = 400 km, y = 0), and they move across the domain towards the north. The wave model is initiated from a quiescent wave state, and the simulation duration length is taken to be 90 h. The data after 60 h are analyzed when the maximum wave heights reach a saturation value.
The driving wind force is constructed using the parametric cyclone wind model by Jelesnianski [34] superimposed with a weighted TC translation speed [35]. The characteristic TC parameters are selected by the maximum wind speed (Vm), radius of the maximum wind (Rm) and translation speed (Vt). The TC parameters can cover a quite wide range as illustrated by Tamiz and Young [26] in their statistical results. The Vm of TC intensity can reach 60 m/s, for instance, the historical TCs Ivan and Katrina hit the coast with a Vm approximating 60 m/s. Here, the maximum wind speeds Vm range from 30 to 60 m/s with an interval of 10 m/s. The TC sizes range from small size (Rm = ~10 km, TC Ivan) to large size (Rm = ~80 km, TC Bonnie). Here, we consider only two cases, as Rm is set to 25 and 50 km, because its influence on the sea state is systematic. The translation speed is frequently observed in the low and moderate range of 2–9 m/s, such as in the famous TC Megi (Vt = 8 m/s) and TC Bonnine (Vt = 3 m/s), and some very fast-moving TCs (Vt > 10 m/s) have been statistically reported in the literature [26]. Since the TC translation has a dominant and complex influence on the wave field distribution [14], we would apply a relative wide distribution of Vt from slow to fast cases in terms of 2, 5, 8, 11 and 14 m/s. Finally, a total of 30 experiments are formed with the combined parameters.

3. Results

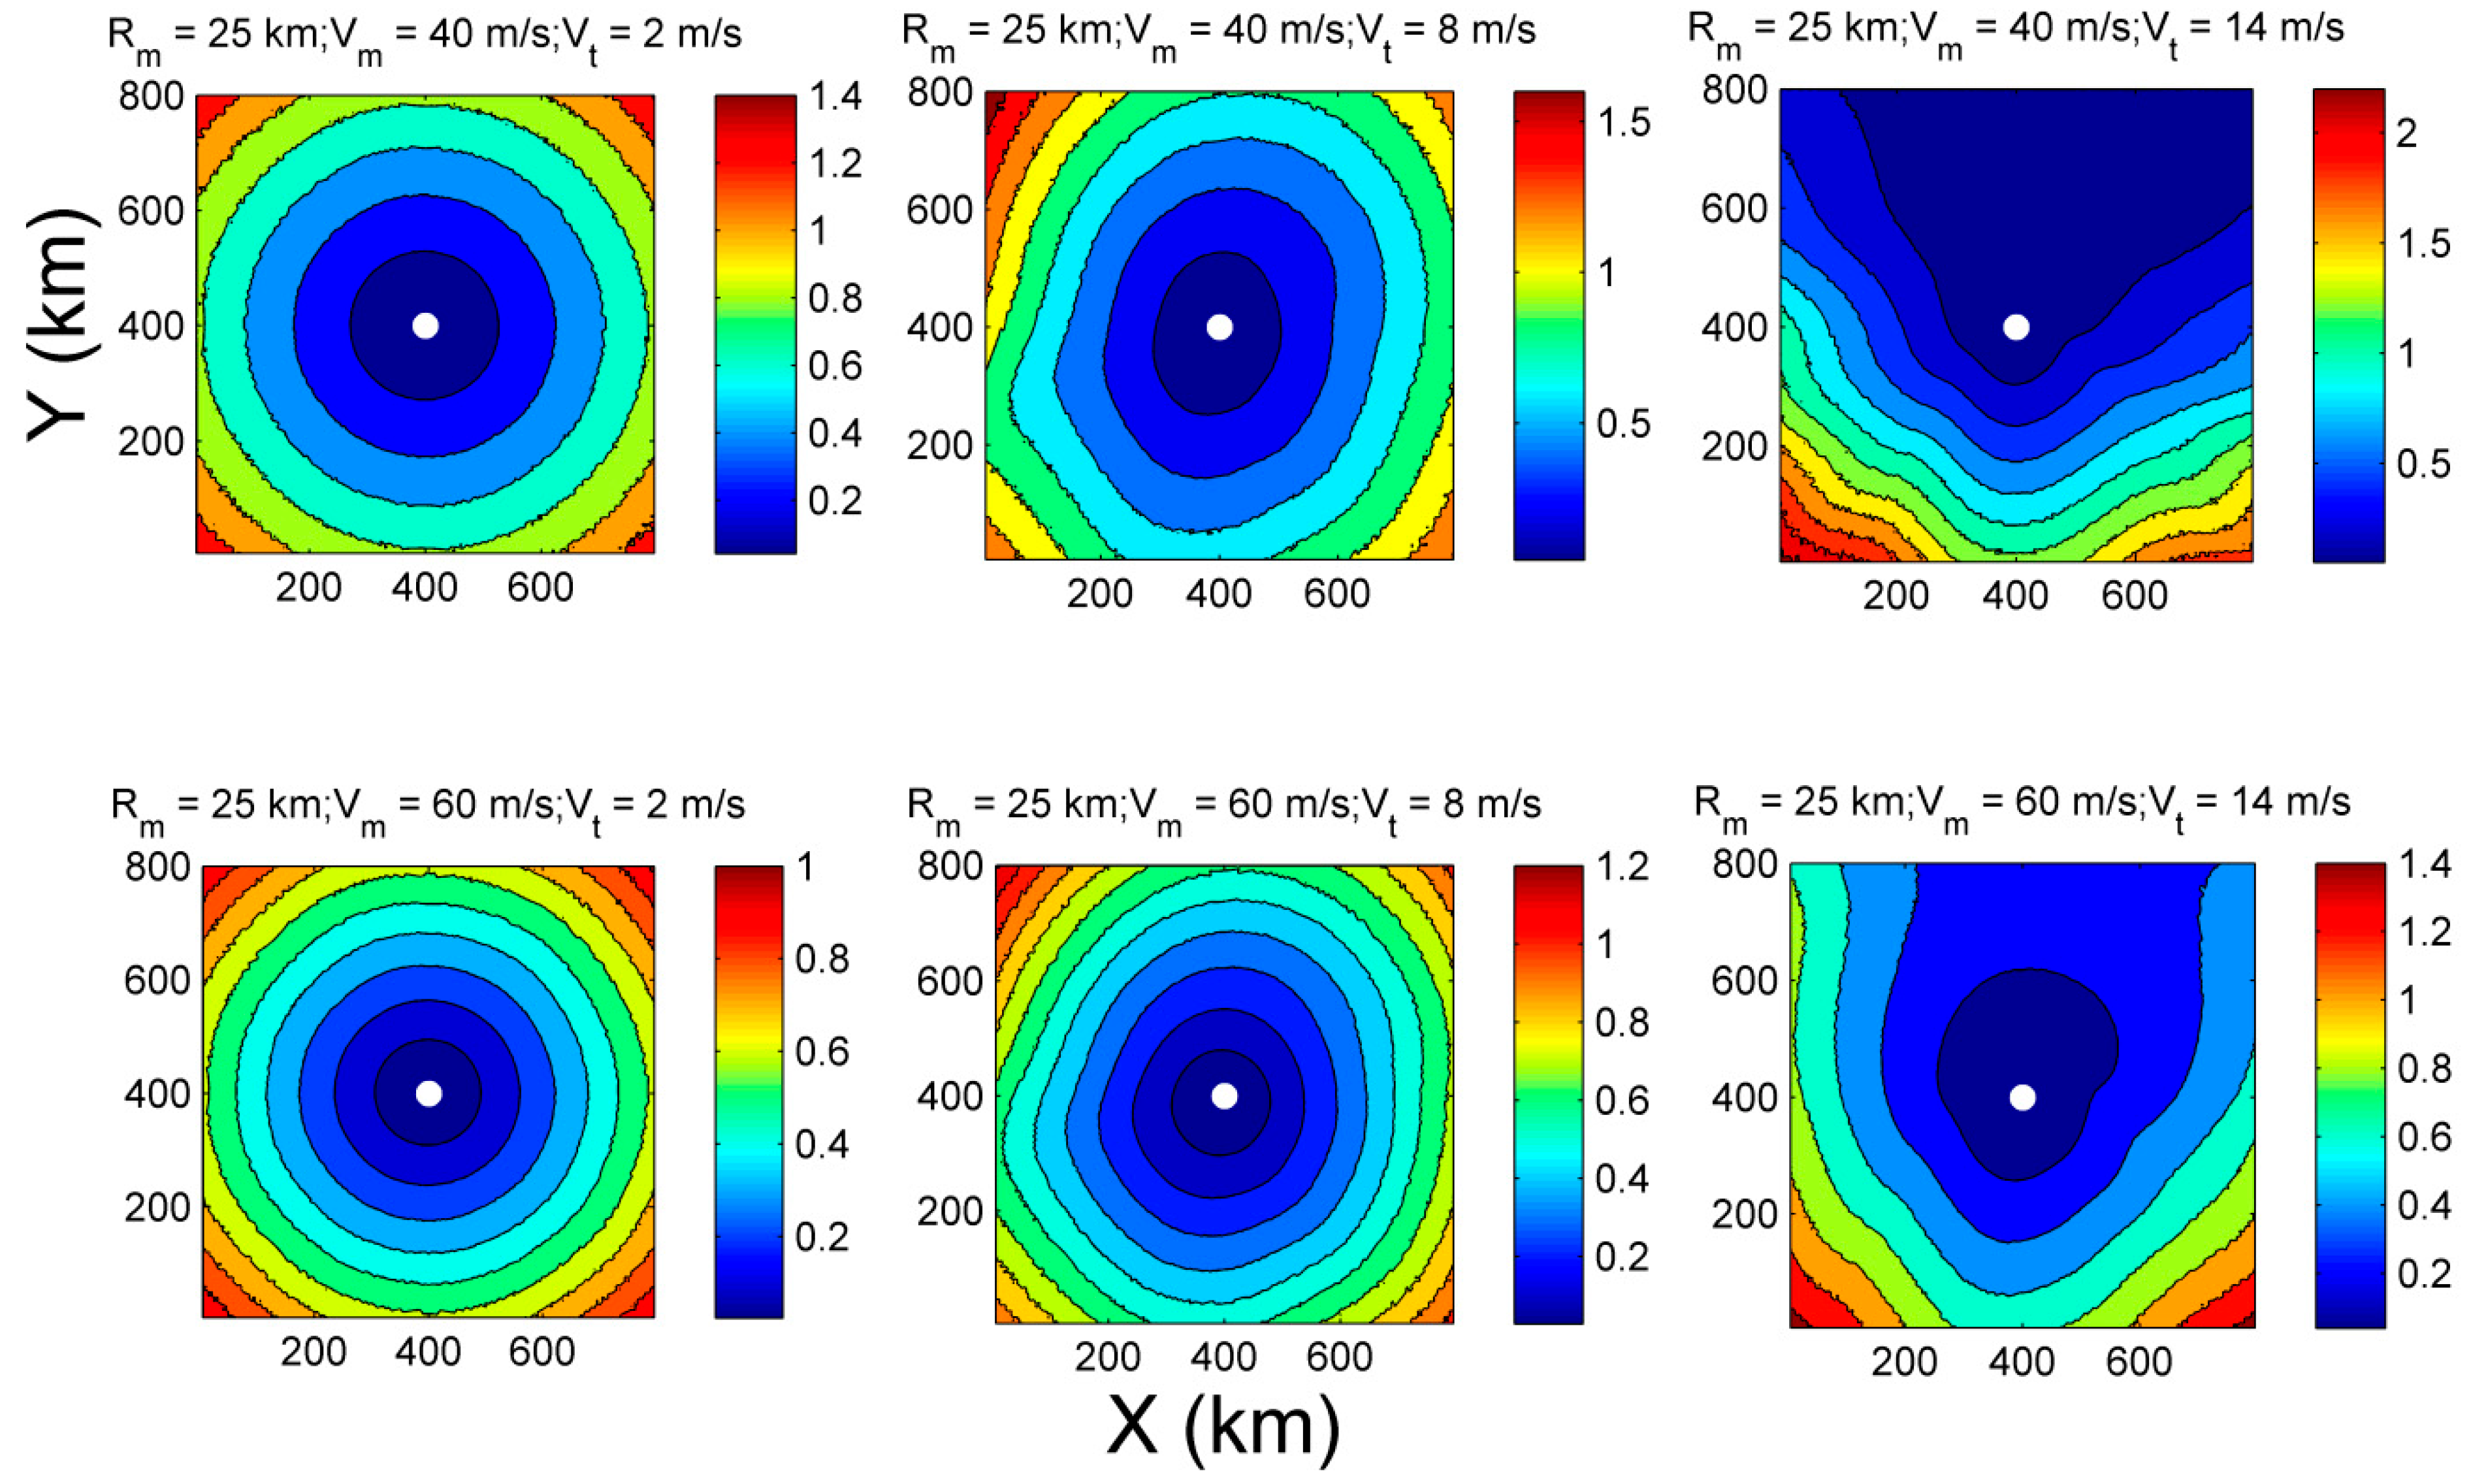
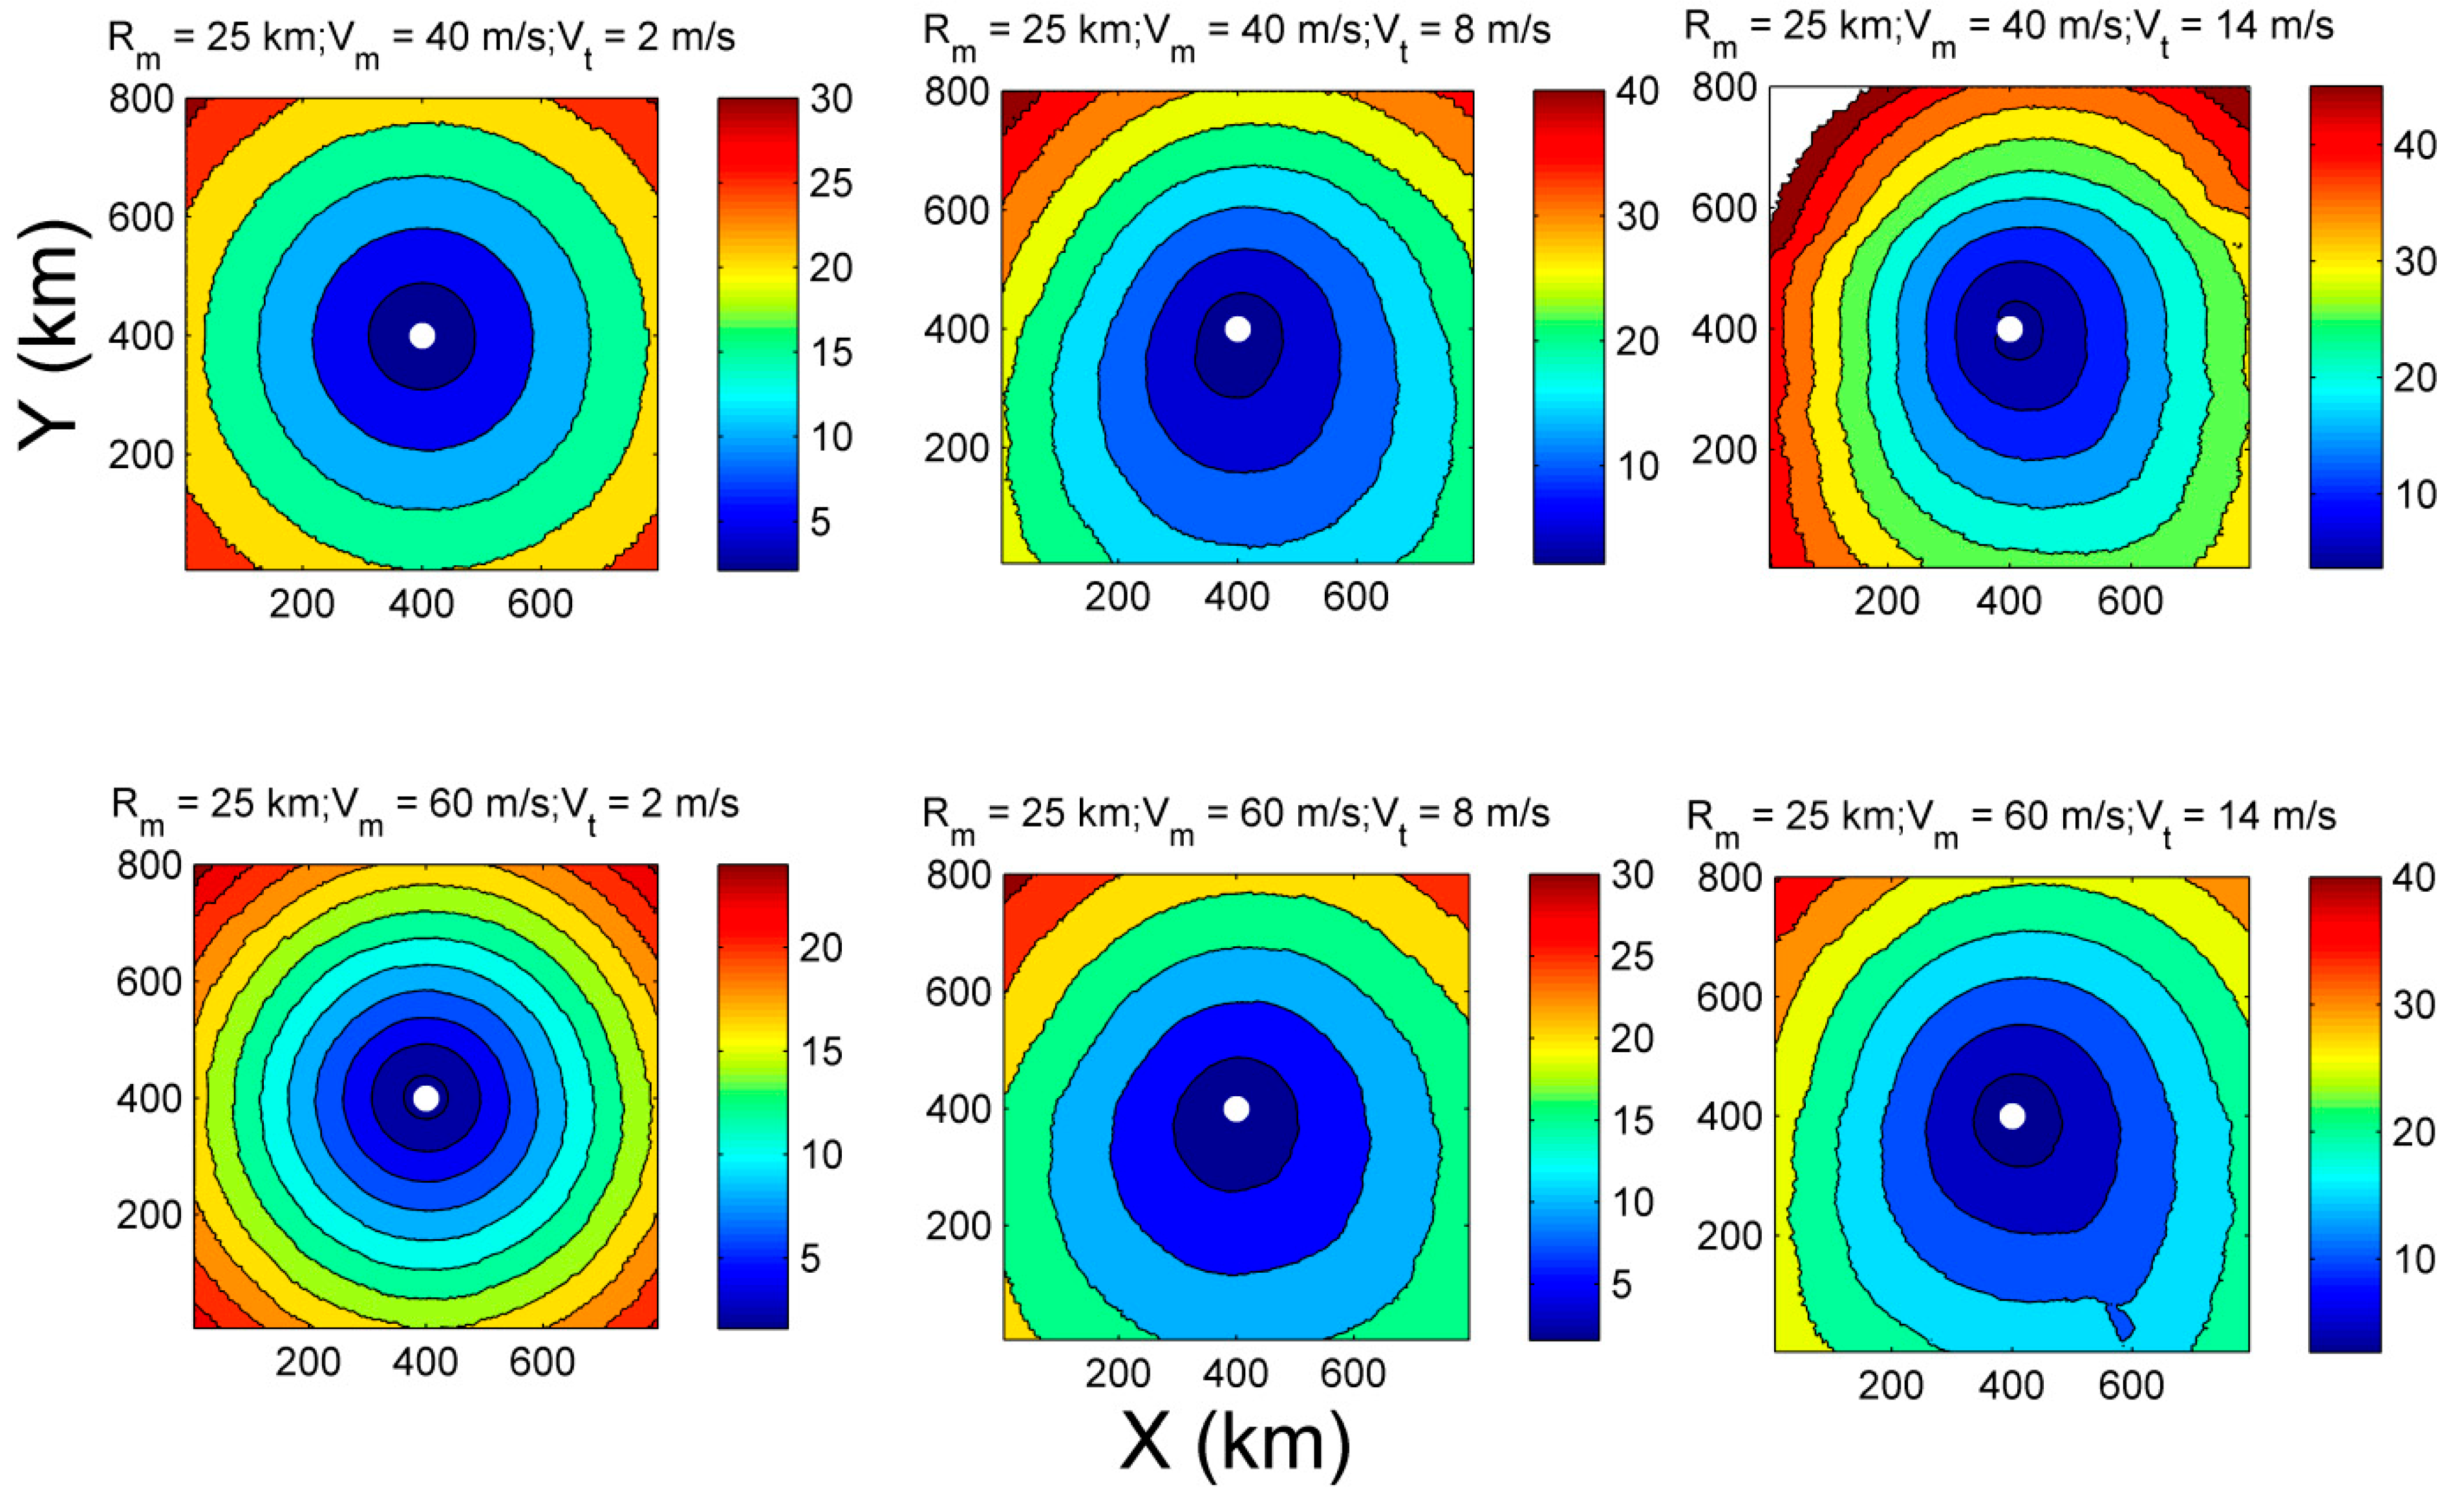
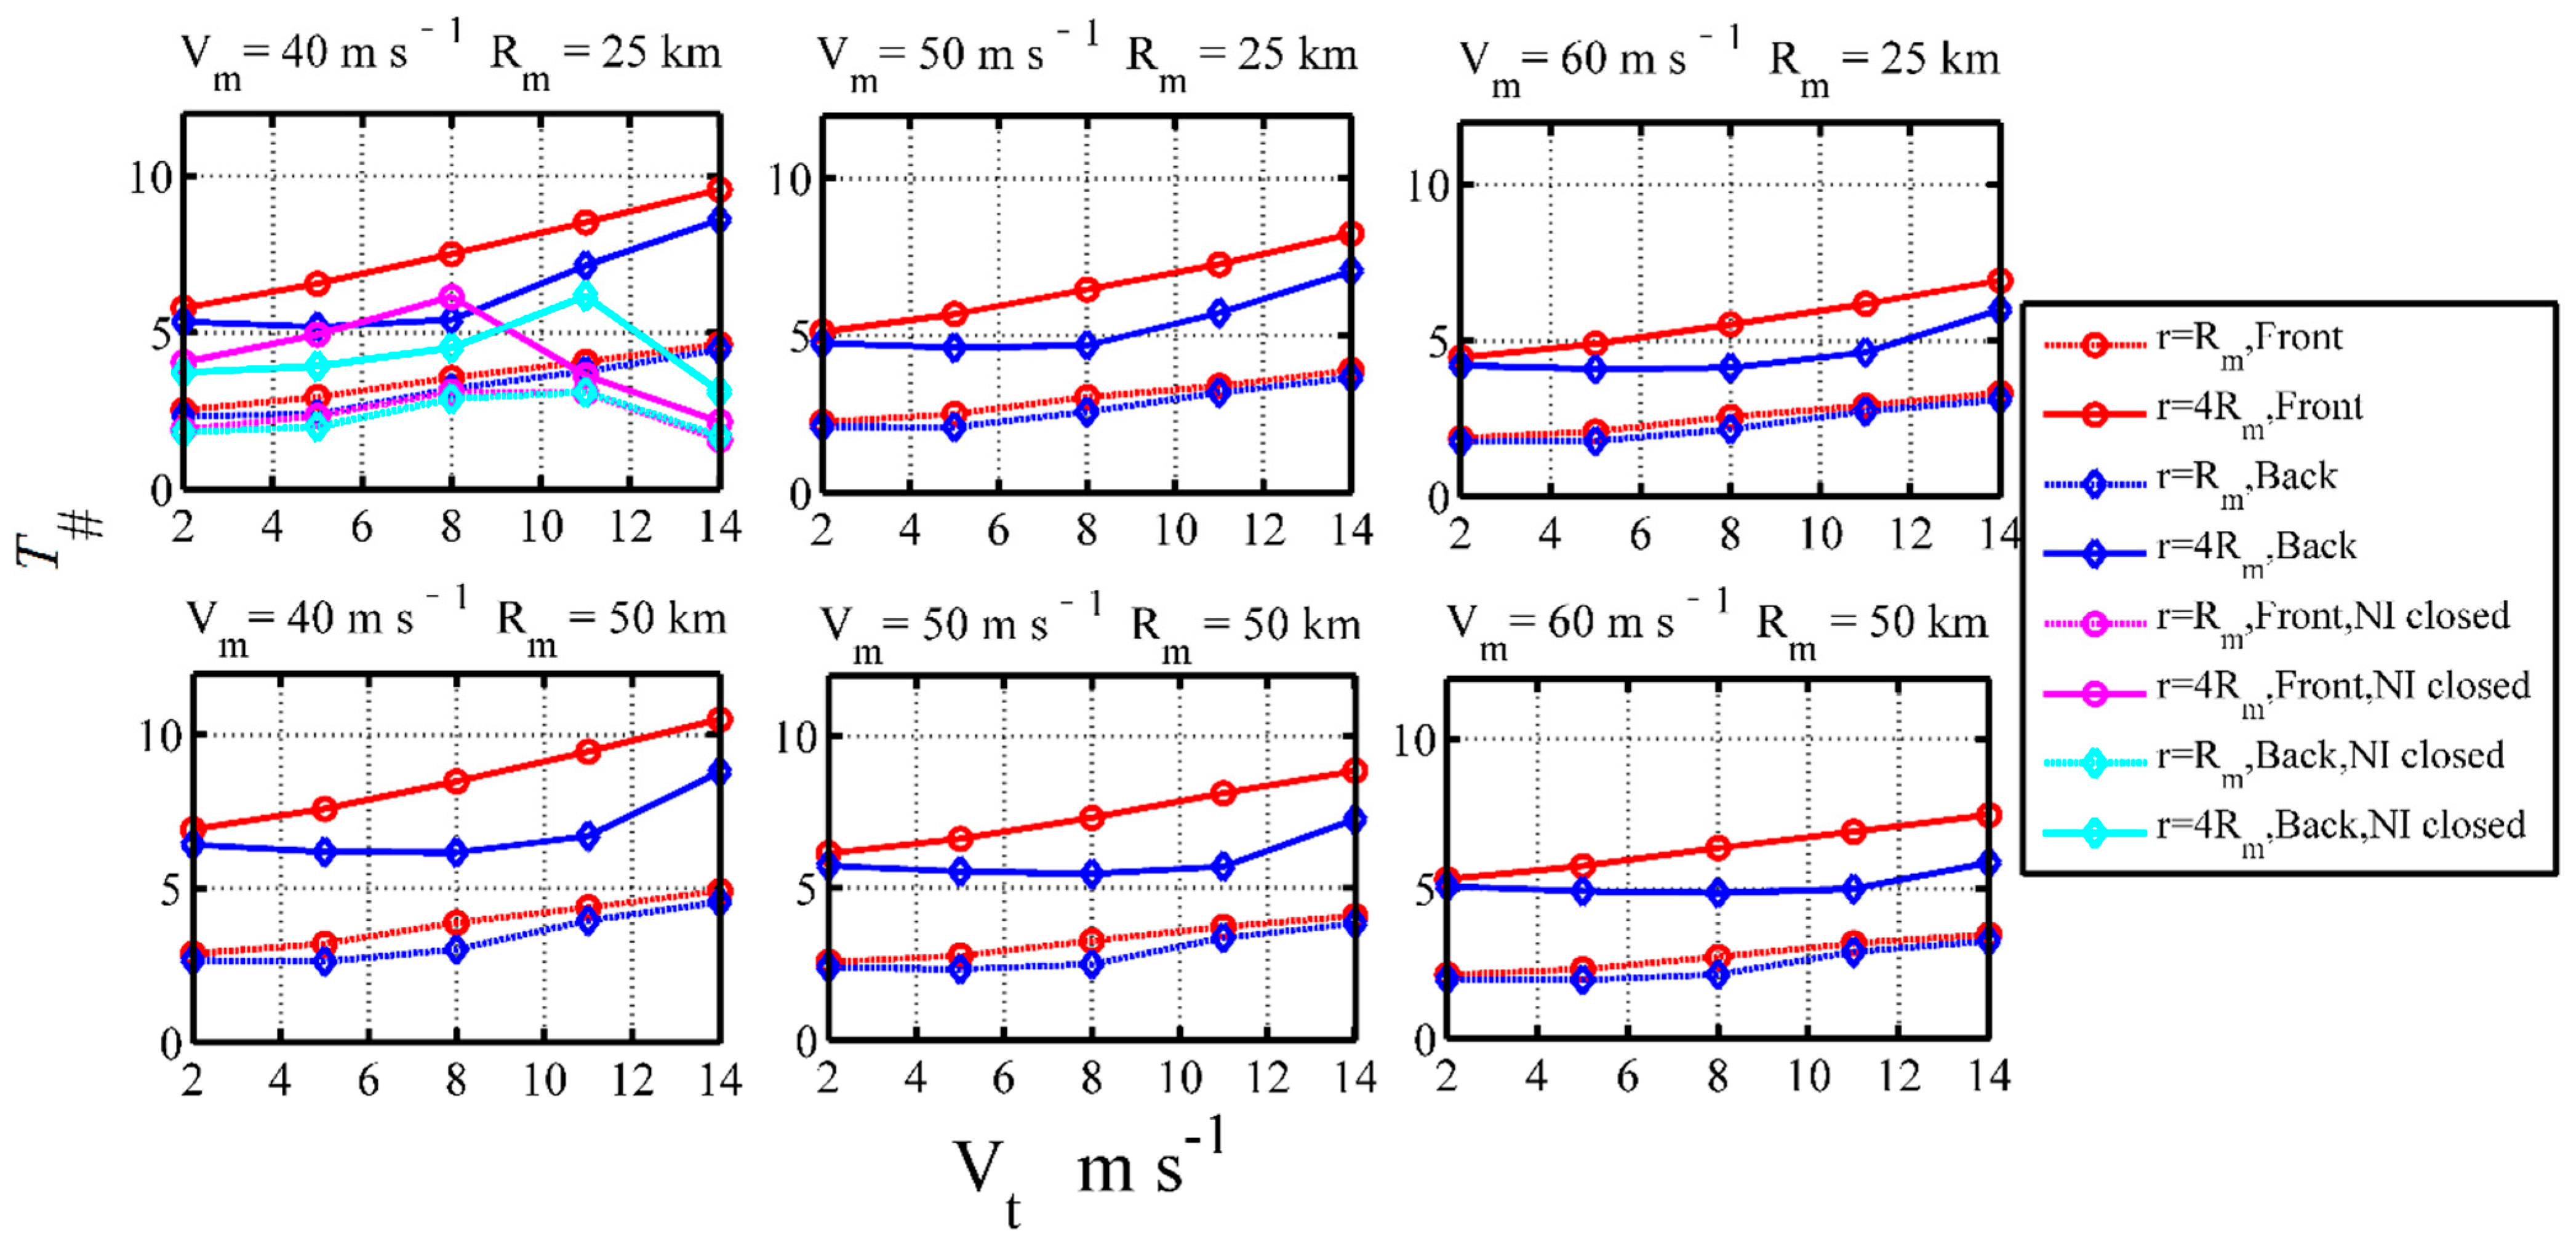
3.1. Spatial Variation of the Sea State

The sea state parameters are chosen as the dimensionless wave height H# = gHs/U102 and dimensionless wave period T# = gTp/U10 (Hs is the significant wave height, g is gravity, U10 is the speed at a height of 10 m and Tp is the dominant wave period). They are closely connected and follow similar relationships under normal and steady wind conditions [36,37,38,39,40,41,42]. These similar relationships are supposed to also hold for waves inside a TC, as revealed by observations [11,12,16,17,27,43] in which the dominant role of nonlinear wave–wave interactions is highlighted [12,44].
The spatial variations in H# and T# for different characteristics are listed in Figure 2 and Figure 3. As can be seen, the TC translation has a very strong impact on the spatial asymmetry of H#, and with increasing Vt, the asymmetry increases. Previous studies have well documented the influence of Vt on the spatial distribution of wave height. The wave heights are stronger in the front-right sector, while H# displays quite different features: its magnitude is relatively larger in the front-left sector for Vt = 8 m/s, and in the back half plane for Vt = 14 m/s; in addition, H# is systematically smaller for a more intense TC. The cases with Rm = 50 km have almost the same spatial pattern as those with Rm = 25 km. The spatial distribution is also shown to vary with Vt and Rm, but it is relatively larger in the front half plane with increasing Vt.
The above results indicate that TC translation has a significant impact on the azimuthal variation of H# and T#, but their respective effects appear to be different. To detail the influence of Vt on the two parameters, we plot the half-sector-averaged values of H# and T# against the seven Vt values in Figure 4 and Figure 5, respectively. The subfigures correspond to the results corresponding to different values of Vm and Rm. The H# at radial distances of Rm (dashed lines) and 4Rm (solid lines) from the TC center are given to check the radial variation, and the front sector and back sector correspond to the red lines and blue lines, respectively.
The radial dependence of H# is consistently positive, which has been reported by Hwang [27] with SRA measurements. When the TC moves slowly (Vt = 2 m/s), the differences in H# between the two quadrants are quite small; as the TC moves faster at moderate speeds (Vt = 3–8 m/s), H# in the front quadrant increases with Vt and is consistently larger than those in the back quadrant; as the TC moves even faster (Vt > 9 m/s), an “inflection” point occurs, above which the H# in the front quadrant begins to decrease while those in the back quadrant increase with the Vt, and they would cross each other at a certain Vt, above which H# in the front quadrant reverses to become larger. The quadrant reverse pattern is more clearly present in the case with the weakest intensity and smallest size (Vm = 40 m/s and Rm = 25 km). Zhang and Oey [15] suggested with altimeter measurements that the wave heights in the front-right (FR) sector are asymmetrically larger when a TC moves at moderate translation speeds (Vt = 3–8 m/s), while less extreme waves occur in the FR sector for faster TCs. These features are consistent with the model results.
T# is similar to H# when the TC moves at slow to moderate speeds; however, they mostly do not have an “inflection” point, and T# in the front sector is consistently larger than those in the back sector. As a result, the similarity relation between H# and T# at these higher speeds is not consistent with the observation results [12]. Two possible reasons can account for this: One is that the observations are mostly taken at low to moderate TC translation speeds, and those at large translation speeds are lacking. In addition, there are the intrinsic uncertainties in wave simulation that can be induced by several factors including numerical schemes, physics and parameterizations or neglecting the wave-current effect [30].

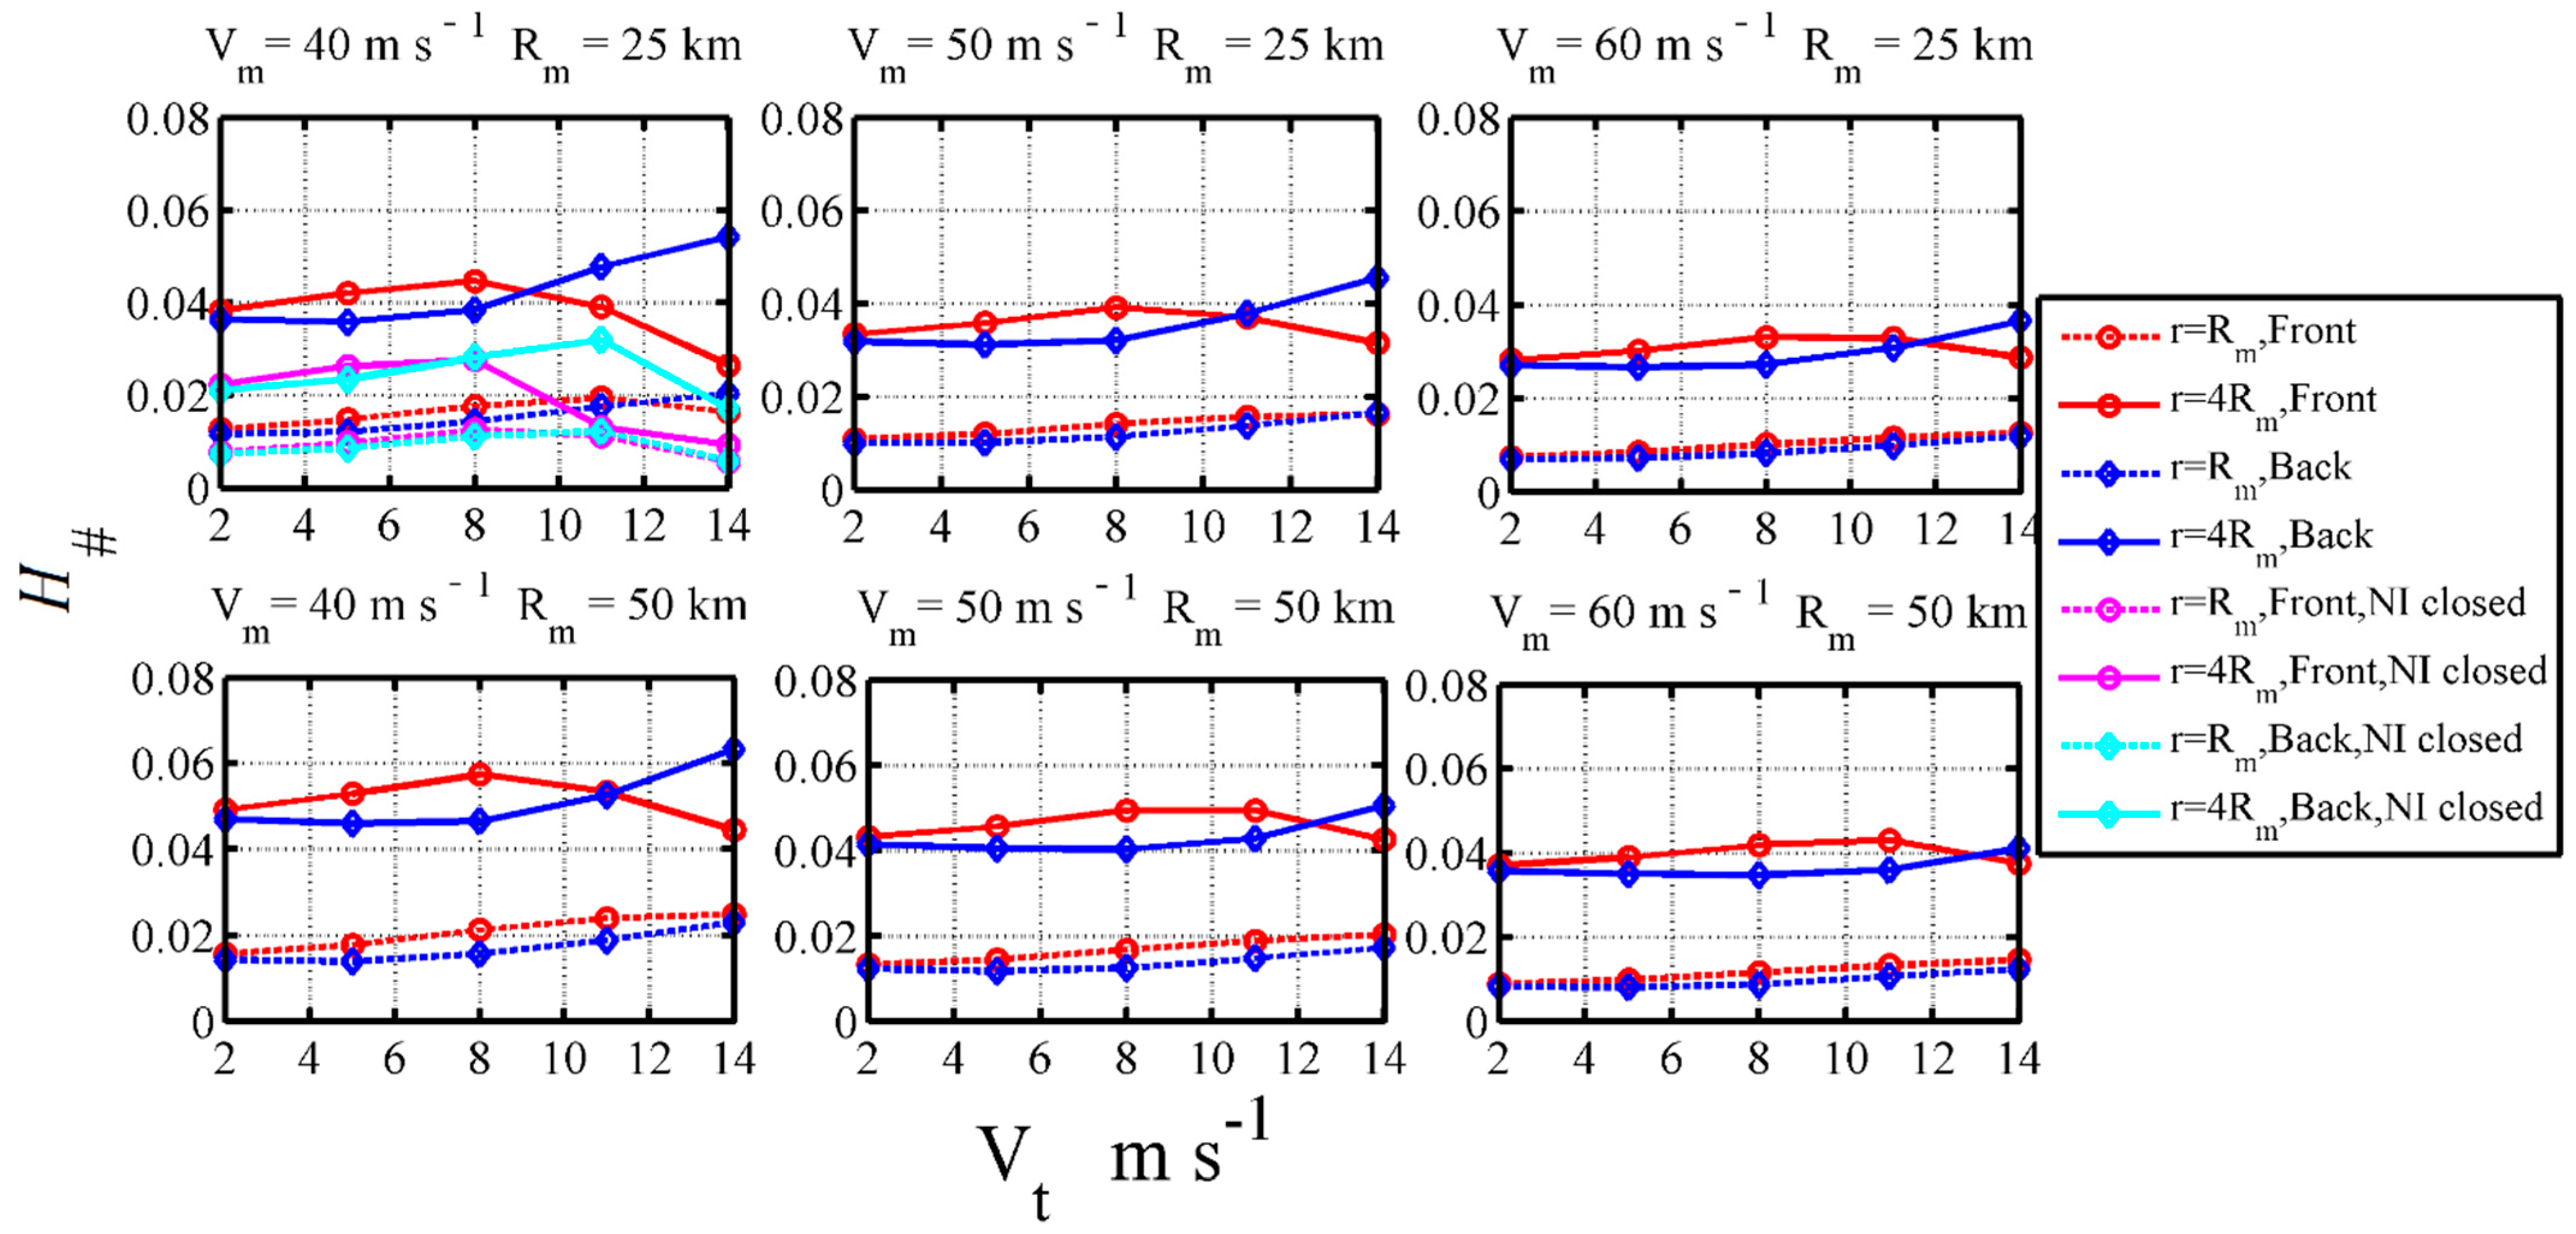
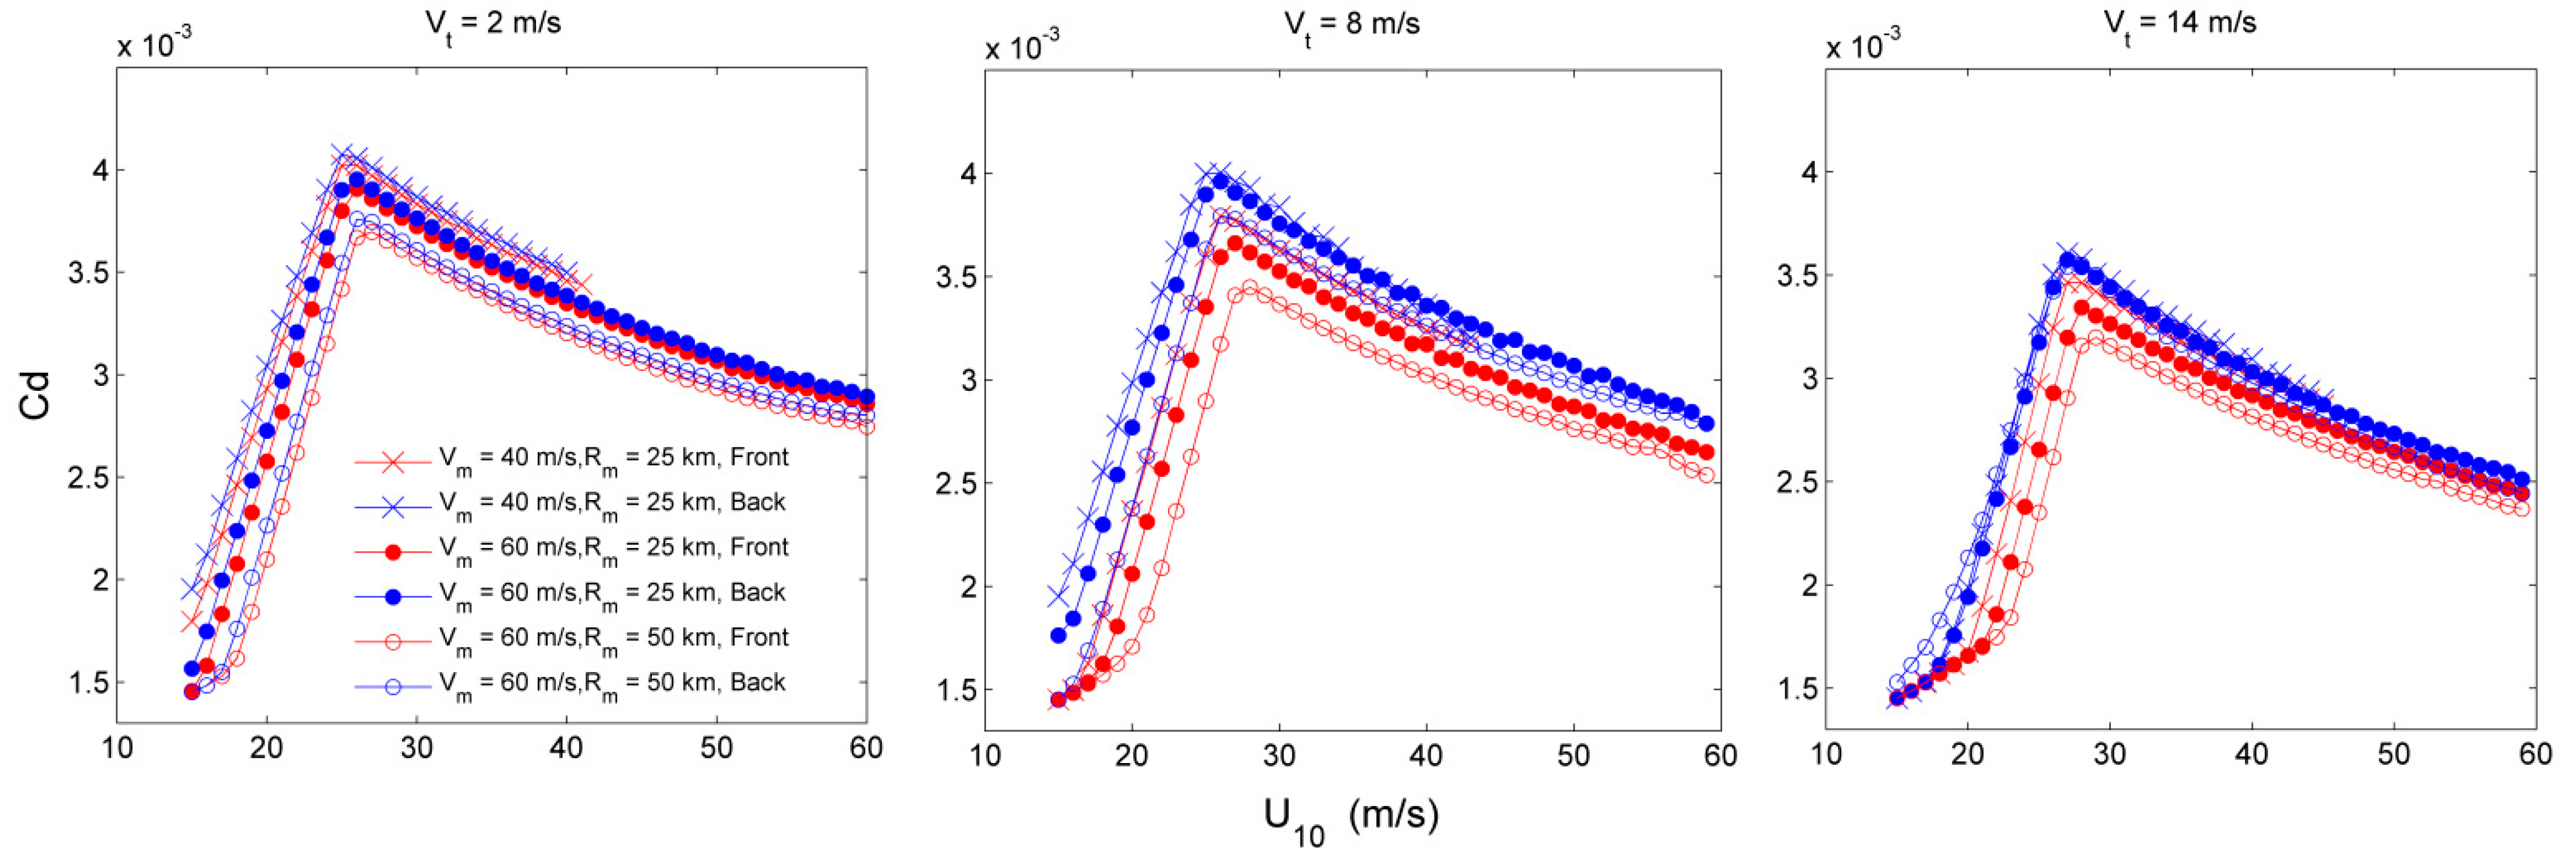
3.2. Implication on the Sea Surface Roughness

The sea surface roughness is directly related to the momentum flux across the air–sea interface according to the Monin–Obukhov similarity theory:
u = u κ ln z z 0
where u* is the friction velocity, z is the height above the sea surface, u is the wind speed at a height of z, z0 is the sea surface roughness and κ = 0.4 is the von Karman constant.
Abundant efforts have been devoted to the study of sea surface roughness, and it has been widely accepted that sea surface roughness is not solely related to wind speed but is strongly modulated by the sea state [45,46]. Liu et al. [47] proposed a sea surface dynamic roughness z0 with the effect of sea spray for full wind speeds. It combines the SCOR relation [48] and the resistance law of Makin [49] by using the 3/2 power law [50] and the relation between the significant wave period and the peak wave period:
g z 0 u 2 = c l 1 1 / ω 0.03 β exp ( 0.14 β ) 1 / ω , ~ 0.35 < β < 35 c l 1 1 / ω 0.008 1 / ω , β 35
where β is the wave age expressed as the ratio of the phase speed of the dominant waves and the friction velocity β = c p / u , and ω is the correction parameter indicating the impact of sea spray on the logarithmic wind profile, ω = min ( 1 , α c r / κ u ) , which represents a critical value of the terminal velocity of falling sea spray droplets.
The drag coefficient is related to u* according to the so-called bulk formulation:
u = Cd u
where Cd can be determined from Equations (1)–(3) in an iterative manner, in which u typically uses that at a height of 10 m.
Cd is assumed to be linearly related to the wind speed under normal wind conditions U10 < 20 m/s [51], while it was observed to level off or even decline at certain high winds U10: 25–33 m/s [52,53,54]. The wind speed variation in Cd calculated using the modelling results is given in Figure 6. Cd continues to increase with the wind speed; then, an inflection point occurs in the wind speed range of 20–30 m/s, after which the trend is reversed. The variation is generally consistent with the observation results. The variation in Cd at a given wind speed is found to be sector-dependent: the drag coefficients in the back sector are systematically higher than those in the front sector. This is expected because the wind drag (sea surface roughness) is inversely related to the dimensionless wave period T# as indicated by Equation (2). As a result, the sea surface roughness is greater for younger waves. As illustrated above, the waves are consistently more developed in the front sector than those in the back sector.
The influence of TC parameters on the wind variation in Cd can be clearly identified. The spread variation in Cd with wind speed is most dominant when a TC moves at moderate speed (Vt = 8 m/s), and for a very intense and large TC (Vm = 60 m/s, Rm = 50 km), the sector difference is largest when the TC moves at a very fast speed (Vt = 14 m/s). In addition to the sector difference, systematical variations in the drag coefficients are induced by the TC parameters: the drag coefficients are systematically larger for a weaker or a smaller TC, and the difference appears to be more significant for a TC moving at a moderate speed (Vt = 8 m/s). TC translation also has an impact on the extremes of the drag coefficient: when the TC moves increasingly fast, the extremes of the drag coefficient diminish from ~4 × 10⁻³ at Vt = 2 m/s to ~3.5 × 10⁻³ at Vt = 14 m/s. The physical interpretation of the influence of TC parameters on the sea state and sea surface roughness are discussed in the next section.

4. Discussion

The modelling results reveal significant radial and azimuth variations in the sea states, and distinct characteristics in the sea surface roughness that depend on the TC parameters (Vm, Rm, Vt). We interpret these features by considering the local and nonlocal effects on wind wave growth under the wind forcing of TCs.
The local effect is attributed to the local wind variability resulting from the moving TC vortex. A schematic description of the local wind variation is shown in Figure 7. The black arrow and blue arrow denote the wind speed at a time interval of 1 h, in which the black arrow corresponds to Time = 0 h and the blue arrow corresponds to Time = 1 h. As the figure shows, the wind variation is more significant when the distance is closer to the TC centre. To represent the wind variability, we define a ratio ΔU of U’ (Time = 1 h) to U (Time = 0), in which U’ is the component of U in the direction of U (Time = 0). Physically, the wind input is more efficient for a larger ΔU, and it is expected to decrease with increasing Vt. Given a constant Vt = 6 m/s, ΔU is estimated to be 0.91 and 0.97 at distances of Rm and 4Rm for Rm = 50 km and Vm = 30 km/s, respectively, and it is estimated to be 0.97 and 0.99 at distances of Rm and 4Rm for Rm = 100 km and Vm = 30 km/s, respectively. This result indicates that the wind variability is smaller at a larger distance for a given Rm and is smaller at a given distance for a larger Rm. This result was expected based on the fact that the wind variability is related to the curvature of the wind field. No sensitivity is found in ΔU by changing Vm.
The nonlocal effect is attributed to the fact that the waves in the outer region from the Rm are mixed with nonlocal waves and local wind-generated seas, which is evidenced in the observed directional skew in the two-dimensional wave spectrum and misalignment in the direction between the dominant wave and the local wind [12,24]. The nonlocal waves are generated remotely in the intense wind regions (in the vicinity of Rm), as schematically illustrated by Moon [13] in their Figure 17: waves from the intense wind region propagate to the right of the wind direction in the outer region. However, one cannot identify nonlocal waves well from one-dimensional spectra because they commonly have a single spectral peak [12], in which nonlinear wave–wave interactions result in a sustained transfer of energy from the locally generated wind sea to remotely generated waves and smooth the “gap” between them [44], which helps nonlocal waves maintain the dominant feature in the one-dimensional spectrum. As a result, the nonlinear interaction can contribute to the radial variation in the sea state parameters.
A sensitivity test on the influence of the nonlinear interaction is performed by closing the nonlinear interaction source term in the numerical modelling. We use the case (Vm = 40 m/s and Rm = 25 km) as an example, and the results are overlaid in the subfigures of Figure 4 and Figure 5. As the figures show, the “inflection” point reoccurs in T#, and it corresponds to a smaller Vt in H# after the nonlinear interaction source is closed. Additionally, the radial dependence is systematically reduced without the influence of the nonlinear interaction. This result indicates that the nonlinear interaction plays an important role in both the radial and azimuthal variations in the sea state.
Given the moving nature of a TC, waves generated in the front-right sector can grow higher and longer because they experience an “extended” fetch from the advancing wave field [11], and these waves would interact with the local wind-generated seas at different locations relative to the TC center that strongly depend on the translation speed of the TC, as schematically illustrated in Figure 8. Note that the variation in dominant wave speed induced by the TC translation is much less than that of TC moving speed as revealed from the modeling results. When the TC moves very slowly, the waves may “out run” the TC and propagate ahead of the wind field, and the “extended” fetch and its contribution to the azimuthal dependence of the sea state are small. As the TC moves gradually faster at moderate speeds, the “extended” fetch increases, resulting in a feature where the waves in the front quadrant are more developed than those in the back quadrant. The largest directional difference would be expected under the resonance condition that Vt is comparable with the group velocity of the nonlocal waves [12]. As the TC moves even faster, these storm-tracing waves are left behind and interact with the local wind seas in the back sector; in contrast, the waves in the front quadrant are dominated by the local wind-generated seas. As a result, the sea states in the front quadrant are less developed, and their radial dependence is also reduced. Thus, it is concluded that the azimuthal variation in the sea states depends on the relative translation speed (Vt) of the TC to the group velocity (Cg) of the storm-tracing waves.
In conclusion, the radial dependence of the sea state parameters results from both local and nonlocal effects that are mainly related to the curved nature of TCs. The azimuthal dependence results from the nonlocal effect of a TC, which is mainly modulated by the moving nature of a TC. This finding helps to understand the influence of TC parameters on the spatial variation in the sea state parameters. The influence of Rm is interpreted as it reflects the curvature of the wind field. The azimuthal variation depends on the relativity of Vt to Cg of storm-tracing waves. The systematic deviation in the sea state with Vm can be understood as a longer wind duration or fetch being required for a wave to reach a certain development stage at a higher wind speed; thus, for the same TC size and translation, the waves are expected to be younger for a higher wind speed.

5. Summary

The wind waves generated inside a TC can have devastating effects on coastal regions and dominant effects on air–sea momentum and heat exchange. Observations are still too scarce to gain a comprehensive knowledge on the development of wind waves. In this study, we perform a numerical analysis on the influence of TC characteristics on the spatial variation in the sea state parameters and sea surface roughness. The results indicate that Vm and Rm introduce systematic variations in the sea state parameters, while the azimuthal variation in the sea states is predominantly determined by Vt. For TCs moving from low to moderate speeds, the asymmetry introduced for sea state parameters at the front sector is consistently larger than those in the back sector; this situation lasts until the TC reaches a threshold of Vt, above which the sea state parameters in the back sector become larger. The threshold of Vt is not constant but depends on Vm and Rm. The radial dependence in the front quadrant is considerably reduced above the threshold of Vt. The formation of the sea state is discussed in terms of the local and non-local contribution of the surface waves that are related to the moving and curvature nature of the TC.
For application use in ocean modeling, coastal engineering and the simulation of TC development, the parameterization of the sea surface roughness as a function of wind speed alone or assuming the wind drag as a constant is still frequently applied for convenience. Using the numerical modelling results, we further performed parametric analysis on the influence of TC parameters on the sea surface roughness and drag, which characterize the air–sea interaction and are strongly related to the sea state parameter. The variations in the drag coefficient with wind speed are significantly modulated by the TC parameters, which appear to be mostly significant when TCs move at moderate speeds. These results can be useful in the interpretation the air–sea interactions under different TC conditions, and this motivates the need to incorporate the TC parameters into the a wave-independent parameterization of the sea surface roughness.
There are still many limitations to this study. First, though the accuracy of the WWIII model has been well validated in some case studies, it is not fully evaluated under fast-moving TCs, and there is still room for model improvement. For instance, the nonlinear wave–wave interaction term is popularly used with DIA, which tends to overestimate the energy transfer from high frequency to low frequency [31]. Second, the parameterization of sea surface roughness may also contain some uncertainty, and accurately describing the sea surface roughness or wind drag under extreme high wave conditions remains a challenge largely because of the lack of observations. Despite these limitations, it is believed that the numerical results can qualitatively describe the dominant features of sea state and sea surface roughness under a TC condition.

Author Contributions

Conceptualization, S.L. and R.L.; methodology, R.L.; software, Y.W. and J.L.; formal analysis, S.L.; investigation, S.L.; resources, R.L.; data curation, R.L.; writing—original draft preparation, S.L.; writing—review and editing, S.L.; visualization, S.L.; supervision, R.L.; project administration, S.L.; funding acquisition, S.L. and Y.W. All authors have read and agreed to the published version of the manuscript.

Funding

This study was jointly funded by the National Natural Science Foundation of China: 41976010, U1706216, Natural Science Foundation of Shandong Province: ZR2016DQ16, and the Open Fund Project of Key Laboratory of Marine Environmental Information Technology, and the data service provided by the Oceanographic Data Center, Chinese Academy of Sciences (CASODC) (http://msdc.qdio.ac.cn, accessed on 12 December 2021).

Institutional Review Board Statement

Not applicable.

Informed Consent Statement

Not applicable.

Data Availability Statement

The data presented in this study are available on request from the corresponding author.

Acknowledgments

We would express our gratitude to American Journal Experts and Junyan Wang for their support for the English and format editing of this manuscript.

Conflicts of Interest

The authors declare no conflict of interest. The funders had no role in the design of the study; in the collection, analyses, or interpretation of data; in the writing of the manuscript, or in the decision to publish the results.

References

  1. Moon, I.J.; Ginis, I. Effect of surface waves on Charnock coefficient under tropical cyclones. Geophys. Res. Lett. 2004, 31, L20302. [Google Scholar] [CrossRef] [Green Version]
  2. Takagaki, N.; Komori, S. Strong correlation between the drag coefficient and the shape of the wind sea spectrum over a broad range of wind speeds. Geophys. Res. Lett. 2012, 39, L23604. [Google Scholar] [CrossRef] [Green Version]
  3. Holthuijsen, L.; Powell, M. Wind and waves in extreme hurricanes. J. Geophys. Res. 2012, 117, 9003. [Google Scholar] [CrossRef] [Green Version]
  4. Hsu, J.Y.; Lien, R.C. Scaling of Drag Coefficients Under Five Tropical Cyclones. Geophys. Res. Lett. 2019, 46, 3349–3358. [Google Scholar] [CrossRef]
  5. Emanuel, K.A. Sensitivity of Tropical Cyclones to Surface Exchange Coefficients and a Revised Steady-State Model Incorporating Eye Dynamics. J. Atmos. Sci. 1995, 52, 3969–3976. [Google Scholar] [CrossRef] [Green Version]
  6. Emanuel, K.A. Similarity hypothesis for air-sea exchange at extreme wind speeds. J. Atmos. Sci. 2003, 60, 1420–1428. [Google Scholar] [CrossRef]
  7. Fan, Y.L.; Ginis, I. The Effect of Wind-Wave-Current Interaction on Air-Sea Momentum Fluxes and Ocean Response in Tropical Cyclones. J. Phys. Oceanogr. 2009, 39, 1019–1034. [Google Scholar] [CrossRef] [Green Version]
  8. Pineau-Guillou, L.; Bouin, M.N. Impact of wave-dependent stress on storm surge simulations in the North Sea: Ocean model evaluation against in situ and satellite observations. Ocean Model. 2020, 154, 101694. [Google Scholar] [CrossRef]
  9. King, D.B.; Shemdin, O.H. Radar Observation of Hurricane Wave Directions. In Proceedings of the 16th International Conference on Coastal Engineering, Hamburg, Germany, 27 August–3 September 1978. [Google Scholar]
  10. Bowyer, P.J.; MacAfee, A.W. The theory of trapped-fetch waves with tropical cyclones—An operational perspective. Weather Forecast. 2005, 20, 229–244. [Google Scholar] [CrossRef]
  11. Young, I.R. A review of the sea state generated by hurricanes. Mar. Struct. 2003, 16, 201–218. [Google Scholar] [CrossRef]
  12. Young, I.R. Directional spectra of hurricane wind waves. J. Geophys. Res. Ocean. 2006, 111, C08020. [Google Scholar] [CrossRef]
  13. Moon, I.J.; Ginis, I. Numerical simulation of sea surface directional wave spectra under hurricane wind forcing. J. Phys. Oceanogr. 2003, 33, 1680–1706. [Google Scholar] [CrossRef] [Green Version]
  14. Liu, H.Q.; Xie, L. Sensitivity of wind waves to hurricane wind characteristics. Ocean. Model. 2007, 18, 37–52. [Google Scholar] [CrossRef]
  15. Zhang, L.; Oey, L. An Observational Analysis of Ocean Surface Waves in Tropical Cyclones in the Western North Pacific Ocean. J. Geophys. Res.-Ocean. 2019, 124, 184–195. [Google Scholar] [CrossRef]
  16. Young, I. Parametric Hurricane Wave Prediction Model. J. Waterw. Port Coast. Ocean Eng. Asce 1988, 114, 637–652. [Google Scholar] [CrossRef]
  17. Young, I.R.; Vinoth, J. An “extended fetch” model for the spatial distribution of tropical cyclone wind-waves as observed by altimeter. Ocean. Eng. 2013, 70, 14–24. [Google Scholar] [CrossRef]
  18. Walsh, E.; Wright, C.A. Hurricane Directional Wave Spectrum Spatial Variation at Landfall. J. Phys. Oceanogr. 1999, 32, 1667–1684. [Google Scholar] [CrossRef] [Green Version]
  19. Walsh, E.J.; Hancock, D.W. Directional wave spectra measured with the surface contour radar. J. Phys. Oceanogr. 1985, 15, 566–592. [Google Scholar] [CrossRef]
  20. Wright, C.W.; Walsh, E.J. Hurricane directional wave spectrum spatial variation in the open ocean. J. Phys. Oceanogr. 2001, 31, 2472–2488. [Google Scholar] [CrossRef]
  21. Black, P.G.; D'Asaro, E.A. Drennan, Air-sea exchange in hurricanes—Synthesis of observations from the coupled boundary layer air-sea transfer experiment. Bull. Am. Meteorol. Soc. 2007, 88, 357–374. [Google Scholar] [CrossRef] [Green Version]
  22. Hu, K.L.; Chen, Q. Directional spectra of hurricane-generated waves in the Gulf of Mexico. Geophys. Res. Lett. 2011, 38, L9608. [Google Scholar] [CrossRef]
  23. Esquivel-Trava, B.; Ocampo-Torres, F. Spatial structure of directional wave spectra in hurricanes. Ocean. Dyn. 2015, 65, 65–76. [Google Scholar] [CrossRef]
  24. Hwang, P.A.; Fan, Y.L. Effective Fetch and Duration of Tropical Cyclone Wind Fields Estimated from Simultaneous Wind and Wave Measurements: Surface Wave and Air-Sea Exchange Computation. J. Phys. Oceanogr. 2017, 47, 447–470. [Google Scholar] [CrossRef]
  25. Collins, C.O.; Potter, H. Directional Wave Spectra Observed During Intense Tropical Cyclones. J. Geophys. Res.-Ocean. 2018, 123, 773–793. [Google Scholar] [CrossRef]
  26. Tamizi, A.; Young, I.R. The Spatial Distribution of Ocean Waves in Tropical Cyclones. J. Phys. Oceanogr. 2020, 50, 2123–2139. [Google Scholar] [CrossRef]
  27. Hwang, P.A. Fetch- and Duration-Limited Nature of Surface Wave Growth inside Tropical Cyclones: With Applications to Air-Sea Exchange and Remote Sensing. J. Phys. Oceanogr. 2016, 46, 41–56. [Google Scholar] [CrossRef]
  28. Hwang, P.A.; Walsh, E.J. Azimuthal and Radial Variation of Wind-Generated Surface Waves inside Tropical Cyclones. J. Phys. Oceanogr. 2016, 46, 2605–2621. [Google Scholar] [CrossRef]
  29. Hasselmann, S.; Hasselmann, K. The Wam Model—A 3rd Generation Ocean Wave Prediction Model. J. Phys. Oceanogr. 1988, 18, 1775–1810. [Google Scholar]
  30. Fan, Y.L.; Ginis, I. Numerical Simulations and Observations of Surface Wave Fields under an Extreme Tropical Cyclone. J. Phys. Oceanogr. 2009, 39, 2097–2116. [Google Scholar] [CrossRef]
  31. Liu, Q.; Babanin, A. Numerical simulations of ocean surface waves under hurricane conditions: Assessment of existing model performance. Ocean Model. 2017, 118, 73–93. [Google Scholar] [CrossRef]
  32. Ardhuin, F.; Rogers, E. Semiempirical Dissipation Source Functions for Ocean Waves. Part I: Definition, Calibration, and Validation. J. Phys. Oceanogr. 2010, 40, 1917–1941. [Google Scholar] [CrossRef] [Green Version]
  33. Chawla, A.; Tolman, H.L. Obstruction grids for spectral wave models. Ocean. Model. 2008, 22, 12–25. [Google Scholar] [CrossRef]
  34. Jelesnianski, C. A numerical computation of storm tides by a tropical storm impinging on a continental shelf. Mon. Weather Rev. 1965, 93, 343–358. [Google Scholar] [CrossRef] [Green Version]
  35. Wang, K.; Hou, Y.J. A comparative study of storm surge and wave setup in the East China Sea between two severe weather events. Estuar. Coast. Shelf Sci. 2020, 235, 106583. [Google Scholar] [CrossRef]
  36. Hasselmann, K.; Barnett, T. Measurements of wind-wave growth and swell decay during the Joint North Sea Wave Project (JONSWAP). Deut. Hydrogr. Z. 1973, 8, 1–95. [Google Scholar]
  37. Komen, G.; Cavaleri, L. Dynamics and Modelling of Ocean Waves; Cambridge University Press: Cambridge, UK, 1994; p. 532. [Google Scholar]
  38. Young, I. Wind Generated Ocean Waves, 1st ed.; Elsevier: Amsterdam, The Netherlands, 1999; p. 288. [Google Scholar]
  39. Janssen, P. The Interaction of Ocean Waves and Wind; Cambridge University Press: Cambridge, UK, 2004; p. 308. [Google Scholar]
  40. Zakharov, V.E. Theoretical interpretation of fetch limited wind-driven sea observations. Nonlinear Processes Geophys. 2005, 12, 1011–1020. [Google Scholar] [CrossRef]
  41. Badulin, S.I.; Pushkarev, A.N. Self-similarity of wind-driven seas. Nonlinear Processes Geophys. 2005, 12, 891–945. [Google Scholar] [CrossRef] [Green Version]
  42. Gagnaire-Renou, E.; Benoit, M. On weakly turbulent scaling of wind sea in simulations of fetch-limited growth. J. Fluid Mech. 2011, 669, 178–213. [Google Scholar] [CrossRef]
  43. Hwang, P.A.; Fan, Y.L. Ocean Surface Wave Spectra inside Tropical Cyclones. J. Phys. Oceanogr. 2017, 47, 2393–2417. [Google Scholar] [CrossRef]
  44. Xu, Y.; He, H. Observations and Modeling of Typhoon Waves in the South China Sea. J. Phys. Oceanogr. 2017, 47, 1307–1324. [Google Scholar] [CrossRef]
  45. Yelland, M.; Taylor, P.K. Wind stress measurements from the open ocean. J. Phys. Oceanogr. 1996, 26, 541–558. [Google Scholar] [CrossRef]
  46. Drennan, W.M.; Graber, H.C. On the wave age dependence of wind stress over pure wind seas. J. Geophys. Res. Ocean. 2003, 108, L18306. [Google Scholar] [CrossRef]
  47. Liu, B.; Guan, C.; Xie, L. The wave state and sea spray related parameterization of wind stress applicable from low to extreme winds. J. Geophys. Res. 2012, 117, C00J22. [Google Scholar] [CrossRef] [Green Version]
  48. Jones, I.; Toba, Y. Wind Stress over the Ocean; Cambridge University Press: Cambridge, UK, 2001; p. 307. [Google Scholar]
  49. Makin, V.K. A note on the drag of the sea surface at hurricane winds. Bound. Layer Meteorol. 2005, 115, 169–176. [Google Scholar] [CrossRef]
  50. Toba, Y. Local balance in the air-sea boundary processes. J. Oceanogr. 1972, 28, 109–120. [Google Scholar] [CrossRef]
  51. Guan, C.L.; Xie, L. On the linear parameterization of drag coefficient over sea surface. J. Phys. Oceanogr. 2004, 34, 2847–2851. [Google Scholar] [CrossRef]
  52. Powell, M.D.; Vickery, P.J. Reinhold. Reduced drag coefficient for high wind speeds in tropical cyclones. Nature 2003, 422, 279–283. [Google Scholar] [CrossRef]
  53. Jarosz, E.; Mitchell, D.A. Bottom-up determination of air-sea momentum exchange under a major tropical cyclone. Science 2007, 315, 1707–1709. [Google Scholar] [CrossRef] [Green Version]
  54. Donelan, M.A.; Haus, B.K. On the limiting aerodynamic roughness of the ocean in very strong winds. Geophys. Res. Lett. 2004, 31, L8306. [Google Scholar] [CrossRef] [Green Version]
Figure 1. Simulation domain and initiation of the TC.
Jmse 10 00609 g001
Figure 2. The spatial variation of H# for different TC characteristics (as listed in the subtitle).
Jmse 10 00609 g002
Figure 3. The spatial variation of T# for different TC characteristics (as listed in the subtitle).
Jmse 10 00609 g003
Figure 4. Modelling results of H#. The lines correspond to different radial distances, such as r = Rm, and sectors in terms of front or back and model setting with nonlinear interaction (NI) closed or not.
Jmse 10 00609 g004
Figure 5. Modelling results of T#. The lines correspond to different radial distances, such as r = Rm, and sectors in terms of front or back and model setting with nonlinear interaction (NI) closed or not.
Jmse 10 00609 g005
Figure 6. The variation in the calculated drag coefficient with the wind speed for different TC parameters.
Jmse 10 00609 g006
Figure 7. Schematic description of the temporal wind variations at different distances from the TC center.
Jmse 10 00609 g007
Figure 8. Schematic picture of the interaction between the dominant wave and TC wind corresponding to different translation speeds (slow, moderate and fast).
Jmse 10 00609 g008
Publisher’s Note: MDPI stays neutral with regard to jurisdictional claims in published maps and institutional affiliations.

