Article

Effects of the NaCl Concentration and Montmorillonite Content on Formation Kinetics of Methane Hydrate

1
Key Laboratory of Gas Hydrate, Guangzhou Institute of Energy Conversion, Chinese Academy of Sciences, Guangzhou 510640, China
2
Guangdong Provincial Key Laboratory, New and Renewable Energy Research and Development, Chinese Academy of Sciences, Guangzhou 510640, China
3
University of Chinese Academy of Sciences, Beijing 100083, China
*
Authors to whom correspondence should be addressed.
J. Mar. Sci. Eng. 2022, 10(4), 548; https://doi.org/10.3390/jmse10040548
Submission received: 9 March 2022 / Revised: 7 April 2022 / Accepted: 10 April 2022 / Published: 16 April 2022

Abstract

:
Most resources of natural gas hydrate (NGH) exist in marine sediments where salts and sea mud are involved. It is of great importance to investigate the effects of salts and sea mud on NGH formation kinetics. In this study, the mixture of silica sand and montmorillonite was used to mimic sea mud. The effects of the NaCl concentration of pore water and montmorillonite content on methane hydrate formation were studied. A low NaCl concentration of 0.2 mol/L and a low montmorillonite content range of 10–25 wt% is beneficial to reduce the induction time of hydrate formation. The high NaCl concentration and high content of montmorillonite will significantly increase the induction time. The average induction time for the experiments with the NaCl concentrations of 0, 0.2, 0.6, and 1.2 mol/L is 20.99, 8.11, 15.74, and 30.88 h, respectively. In the pure silica sand, the NaCl concentration of 0.2 mol/L can improve the final water conversion. In the experiments with pure water, the water conversion increases with the increase of the montmorillonite content due to the improvement of the dispersion of montmorillonite to water. The water conversion of the experiments in pure water with the montmorillonite contents of 0, 10, 25 and 40 wt% is 12.14% (±1.06%), 24.68% (±1.49%), 29.59% (±2.30%), and 32.57% (±1.64%), respectively. In the case of both montmorillonite and NaCl existing, there is a complicated change in the water conversion. In general, the increase of the NaCl concentration enhances the inhibition of hydrate formation and reduces the final water conversion, which is the key factor affecting the final water conversion. The average water conversion of the experiments under the NaCl concentrations of 0, 0.2, 0.6 and 1.2 mol/L is 24.74, 15.14, 8.85, and 5.74%, respectively.

1. Introduction

Because the natural gas in nature gas hydrate (NGH) is estimated to be the order of 1015 m3, NGH is considered as a potential energy resource [1,2,3]. To verify the feasibility of NGH exploitation, the United States, Canada, Japan, and China have carried out short-term hydrate production tests [4,5]. In addition, to study and better understand the physical properties of the NGH reservoir, extracting the hydrate core from the hydrate reservoir is the most direct method [6,7,8]. However, in the process of extraction, transfer, and preservation, the physical properties of the hydrate cores are inevitably disturbed, resulting in hydrate decomposition and phase saturation changes. Additionally, it is tough and expensive to obtain hydrate cores from the submarine hydrate reservoir. Therefore, it is essential to simulate the actual environment of NGH in the laboratory to establish a basic understanding of NGH [6,7].
NGH is widely distributed in permafrost and marine sediments [8]. The amount of NGH stored beneath marine locations exceeds that in permafrost areas by at least two orders of magnitude [9]. The main component of gas contained in NGH is methane. The analysis of some hydrate samples from the Pearl River Mouth basin in the South China Sea showed that the content of methane is higher than 99.9% [10,11]. In marine sediments, the compositions of minerals and salts are very complex, significantly affecting the hydrate formation and dissociation in sediments [12]. In general, the seawater in pores of sediments contains a variety of salts, in which the contents of Cl and Na+ are much higher than those of other ions [13,14]. Therefore, it is difficult to reproduce the hydrate formation and dissociation of the in situ hydrate reservoir in the laboratory. At present, studies on the effects of salt and sediment composition on hydrate formation characteristics have been carried out. As a thermodynamic inhibitor, salt shifts the methane hydrate phase curve to a higher pressure and lower temperature. The effects of salts on hydrate formation and dissociation kinetics were also widely investigated. Dholabhai et al. [15] conducted experiments on hydrate formation in NaCl and KCl solutions with different concentrations using a stirred vessel. Their experimental results showed that the formation rate of the hydrate formed in NaCl and KCl solution is lower than that in pure water under the same temperature and pressure. Mekala et al. [16] studied methane hydrate formation and dissociation kinetics in Toyoura sand with pure water and seawater, respectively. Their study reported that electrolyte significantly affects the kinetics of hydrate formation, resulting in a six times reduction in water conversion and a significant decrease in the hydrate formation rate. Chong et al. [4,5] studied the influence of NaCl, KCl, and MgCl2 on the methane hydrate formation and dissociation in porous media. They found that electrolytes suppress the kinetics of hydrate nucleation and growth, resulting in lower gas consumption and water conversion. It was also found that electrolyte promotes hydrate dissociation, and NaCl and MgCl2 have substantial effects on promoting decomposition than KCl. Altamash et al. [17] studied the methane hydrate formation in distilled water and seawater that was prepared by mixing 1.5 wt% Cl,0.99 wt% Na+,0.77 wt% So42−, and 0.2 wt% Mg2+. Their study showed that the mixture of seawater and ionic liquids yields about a 1.5 ℃ extra boost on the change of the methane hydrate equilibrium curve. The hydrophobic and hydrophilic of additives determines the influence of these additives on hydrate formation. Sowa et al. [18] found that hydrate formation kinetics are promoted at a low salt concentration (<1 mM), and the stochasticity of the hydrate formation is reduced with salts. Nguyen [19] studied the effects of sodium halides (NaBr, NaI, and NaCl), of sub molar concentrations (0–1000 mM), on the formation behaviors of methane hydrate. It was found that salts are beneficial to hydrate formation at a low concentration and inhibit the hydrate formation at a high concentration.
The hydrate formation in marine sediments is not only affected by salts but also by the mineral composition and structure of the deposits. Kawasaki et al. [20] found that the particle size of the porous media has a significant effect on hydrate saturation (the percentage of pore volume occupied by hydrate). As the particle size increases, the hydrate saturation has an obvious increase. Liu et al. [21] experimentally studied methane hydrate formation in different silica sands. They reported that the cage occupancy and hydrate number do not have a noticeable difference in silica sands with varying particle sizes. Zhang et al. [22] also investigated the influence of the particle size of the porous media on hydrate formation. The experimental results showed that the hydrate formation rate decreases with the increasing particle size and decreasing water content. Ge et al. [23] carried out experiments on methane hydrate formation and dissociation in silica sand with different water saturation (the percentage of pore volume occupied by water) and particle sizes. The research showed that the lower the water saturation, the higher the water conversion rate at the end of the hydrate formation. They pointed out that the highest gas occupancy occurs when the hydrate is formed at a water saturation of 70%, which is the optimum water saturation for hydrate formation. Bagherzadeh et al. [24] investigated methane hydrate formation characteristics in different water-saturated beds of silica sands. They observed that gas and water have a better contact in the partially saturated bed, which results in a higher formation rate and water conversion. Zhang et al. [25] investigated the influence of water saturation on hydrate formation in marine sediments. The results showed that water saturation has dual effects on hydrate formation. The hydrate formation rate increases with the increase of the water saturation ranging from 30% to 40%. However, the hydrate formation rate will decrease with the further increase of the water saturation (45% and 50%). Kumar et al. [26] investigated the effects of different proportions of the clay/sand and water saturation on hydrate formation. The study found that the hydrate formation rate increases as the pore volume increases. The rise of clay will reduce the water conversion and hydrate formation rate, and the maximum water conversion is reached when the water saturation in the pure sand is 75%.
In summary, previous studies showed that the type and concentration of salts and the particle size of porous media significantly affect hydrate formation. However, the effect of salt on the formation of hydrate in marine sediments is still unclear. Clay is one of the main components of marine sediments and could be higher than 40 wt% in some areas [27,28]. However, the silica sands were mainly used in previous studies, which cannot reflect the actual reservoir’s characteristics. Montmorillonite is an essential part of the marine sediments in the Shenhu area of the South China Sea [29]. As a result of the unique surface property and layered structure, montmorillonite adsorbs exchangeable cations (Na+, Ca2+, Mg2+) and water molecules to achieve a charge balance between the layers [30], changing the pore volume and salinity during hydrate formation, and further affects hydrate formation kinetics. In this work, the hydrate formation experiments were carried out in silica sand with different montmorillonite contents and different NaCl concentrations. The effects of the montmorillonite content and NaCl concentration on the final gas consumption, gas consumption rate, induction time, and water conversion during hydrate formation were analyzed.

2. Experimental Section

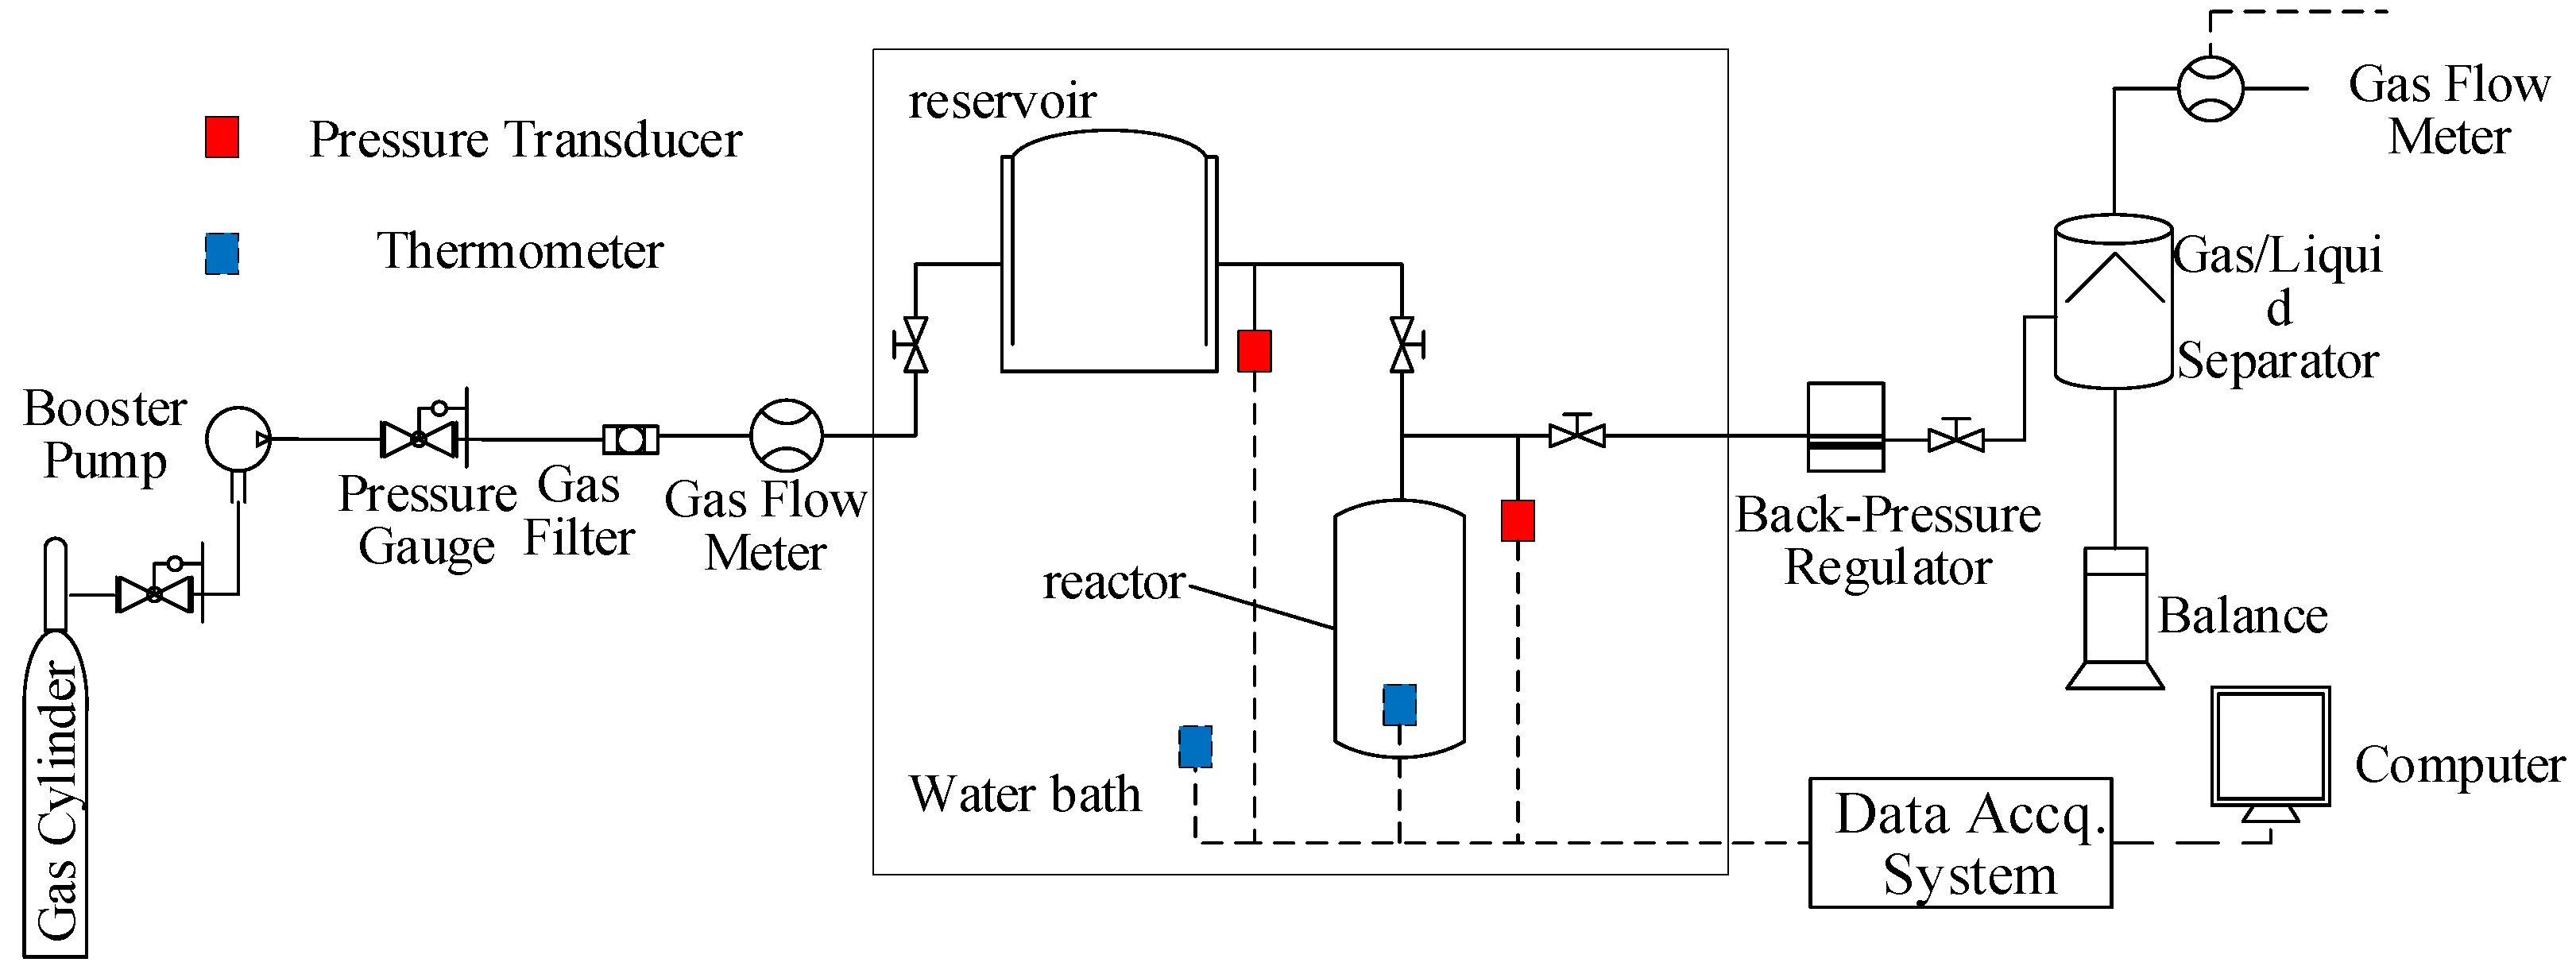
2.1. Experimental Apparatus
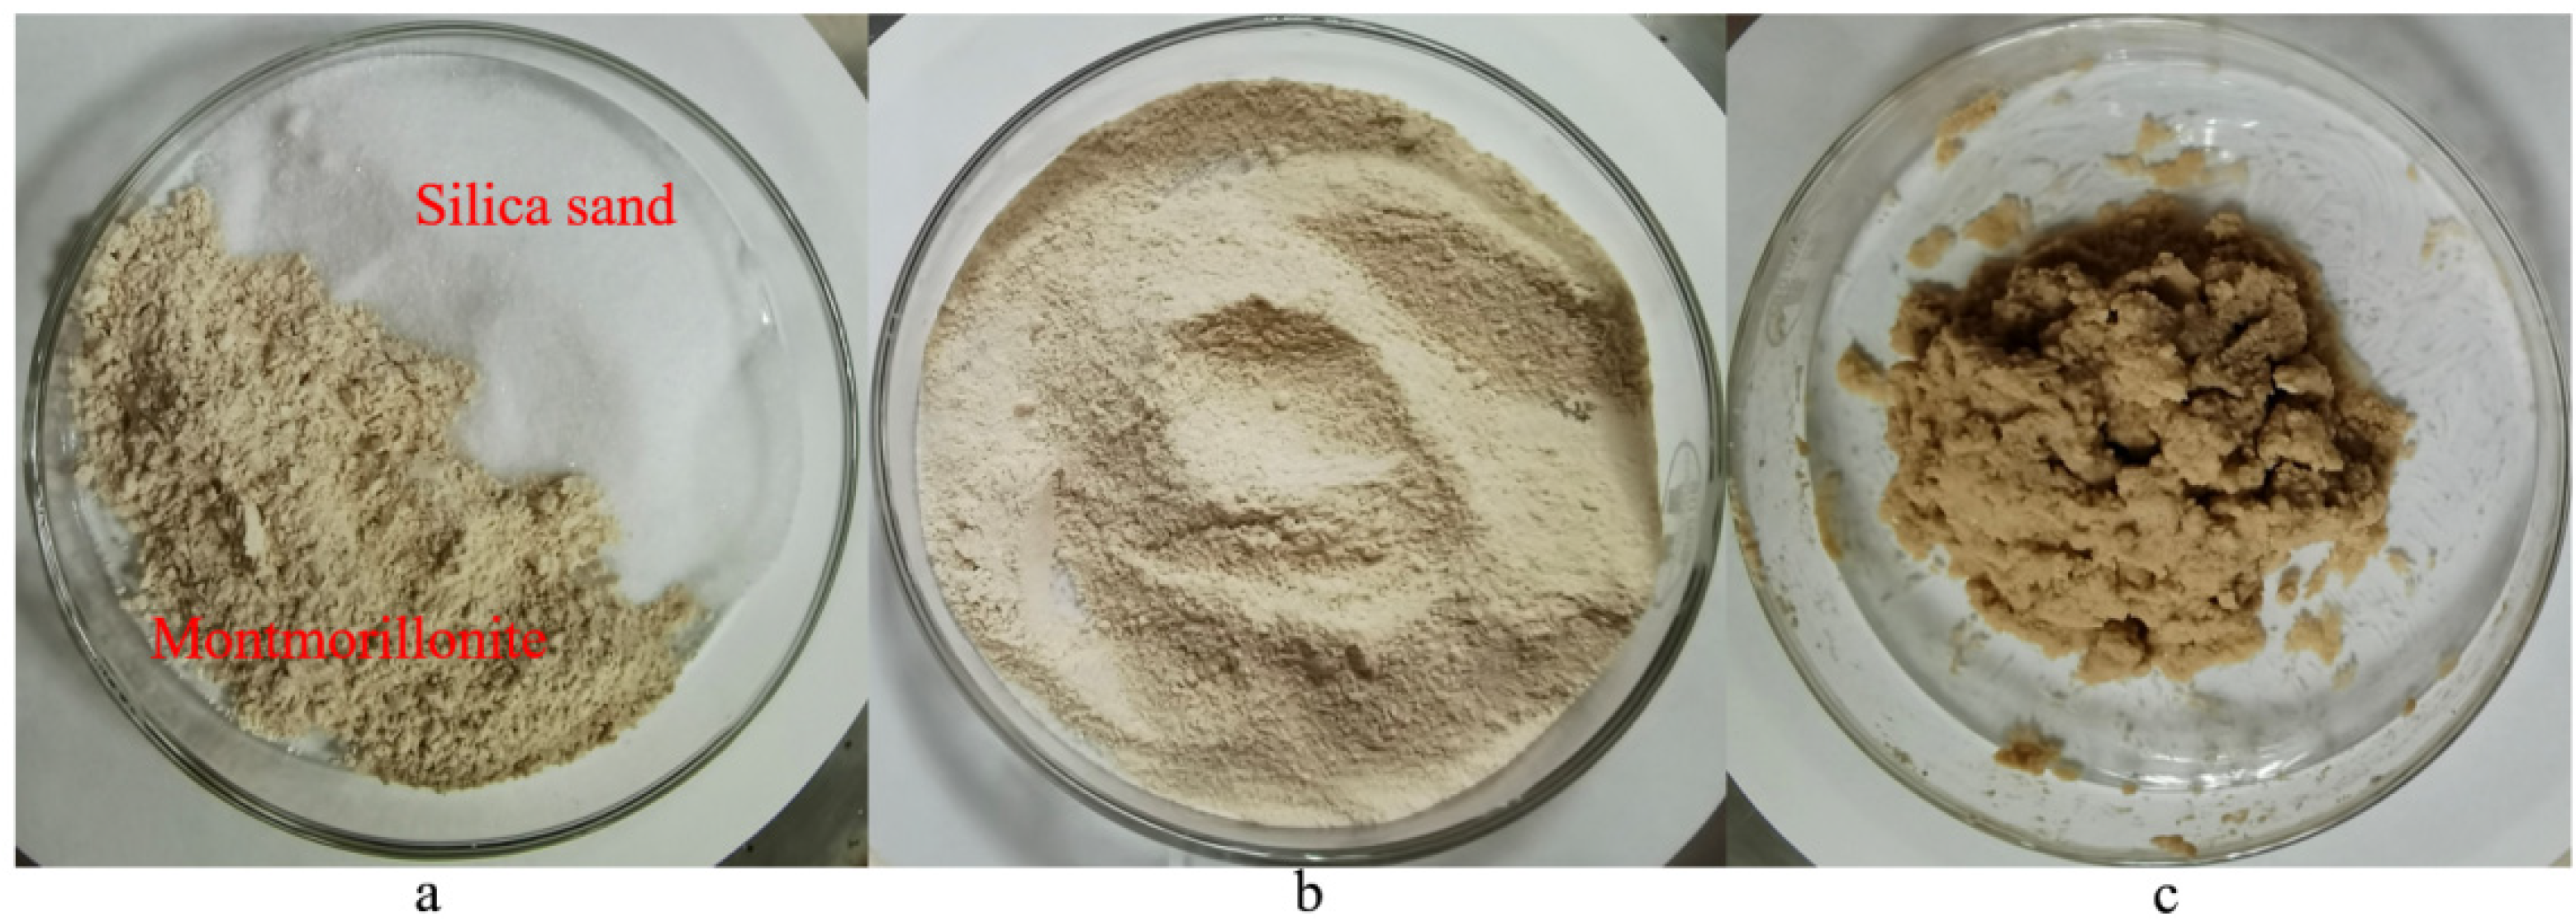
Figure 1 shows the schematic of the experimental apparatus. The apparatus has been detailed and introduced in our previous study [22]. The core component of the device is a high-pressure reactor (20 MPa) with an internal volume of 56.91 cm3. The reactor and the supply vessel are immersed in a water bath. The circulation fluid of the water bath is the mixture of deionized water (75 wt%) and ethylene glycol (25 wt%) The pressures in the reactor and supply vessel are measured by two pressure transducers (±0.025 MPa). The temperatures inside the reactor and water bath are measured by Pt100 temperature sensors (±0.1 K). The pressure of the reactor outlet is controlled by a back pressure regulator. The pressure and temperature are monitored and recorded by a data acquisition system.

2.2. Materials

In this study, silica sand and Na-montmorillonite were used to mimic marine sediments. Methane gas was used to form hydrate due to that it is the main component of the gas in NGH [31]. The materials used in this study are shown in Table 1.

2.3. Hydrate Formation

All the experiments were conducted by the excess-gas method. The experimental steps are as follows:
(1) The silica sand and montmorillonite were mixed evenly in a beaker according to the ratio set in the experiment. (2) An amount of 12 mL NaCl solution was added into the silica sand/montmorillonite mixture. Then, the silica sand and montmorillonite were mixed evenly again. The sample of the mixture is shown in Figure 2. The mixture is like wet sediments after adding NaCl solution. (3) The mixture of silica sand and montmorillonite was tightly filled into the reactor. (4) The air in the reactor was displaced by methane three times. (5) The temperature of the water bath was adjusted to 287.15 K. After the temperature in the reactor was stable, methane was injected into the reactor until the pressure was up to 10 MPa. The schematic view of the distributions of different components in the reactor before the hydrate formation is shown in Figure 3. (6) The water bath temperature was adjusted to 276.15 K to form methane hydrate. When the pressure drop rate was lower than 2 kPa/h, the hydrate formation was regarded as complete.

2.4. Calculation of the Methane Consumption Rate and Water Conversion

The number of moles of methane consumed ( Δ n ) is calculated by Equation (1).
Δ n = P 0 V 0 Z 0 R T 0 P t V t Z t R T t
where subscript 0 represents the beginning of the experiment, and subscript t represents the time of the experiment; P, T, V represents the pressure, temperature, and volume of the gas space in the reactor, respectively. The compressibility factor Z is calculated by the SRK equation [32].
Water conversion is defined as the mole percentage of water converted to hydrate. The water conversion is calculated by Equation (2):
C W H = Δ n × N h y d n H 2 O × 100 %
N h y d refers to the hydration number. In this work, the value of N h y d is 6.1 [33,34].
The gas consumption rate is calculated by Equation (3):
R f = Δ n t e n d t i n d
R f represents the gas consumption rate; t e n d represents the experiment time; t i n d represents the induction time.

3. Results and Discussion

In this study, to investigate the effects of the NaCl concentration and montmorillonite content on methane hydrate formation, the hydrate formation experiments were carried out in the mixture of the silica sand and montmorillonite with four montmorillonite contents and four NaCl concentrations. Each experiment was repeated, and a total of 32 experiments were conducted. Table 2 shows the detailed experimental conditions and results.

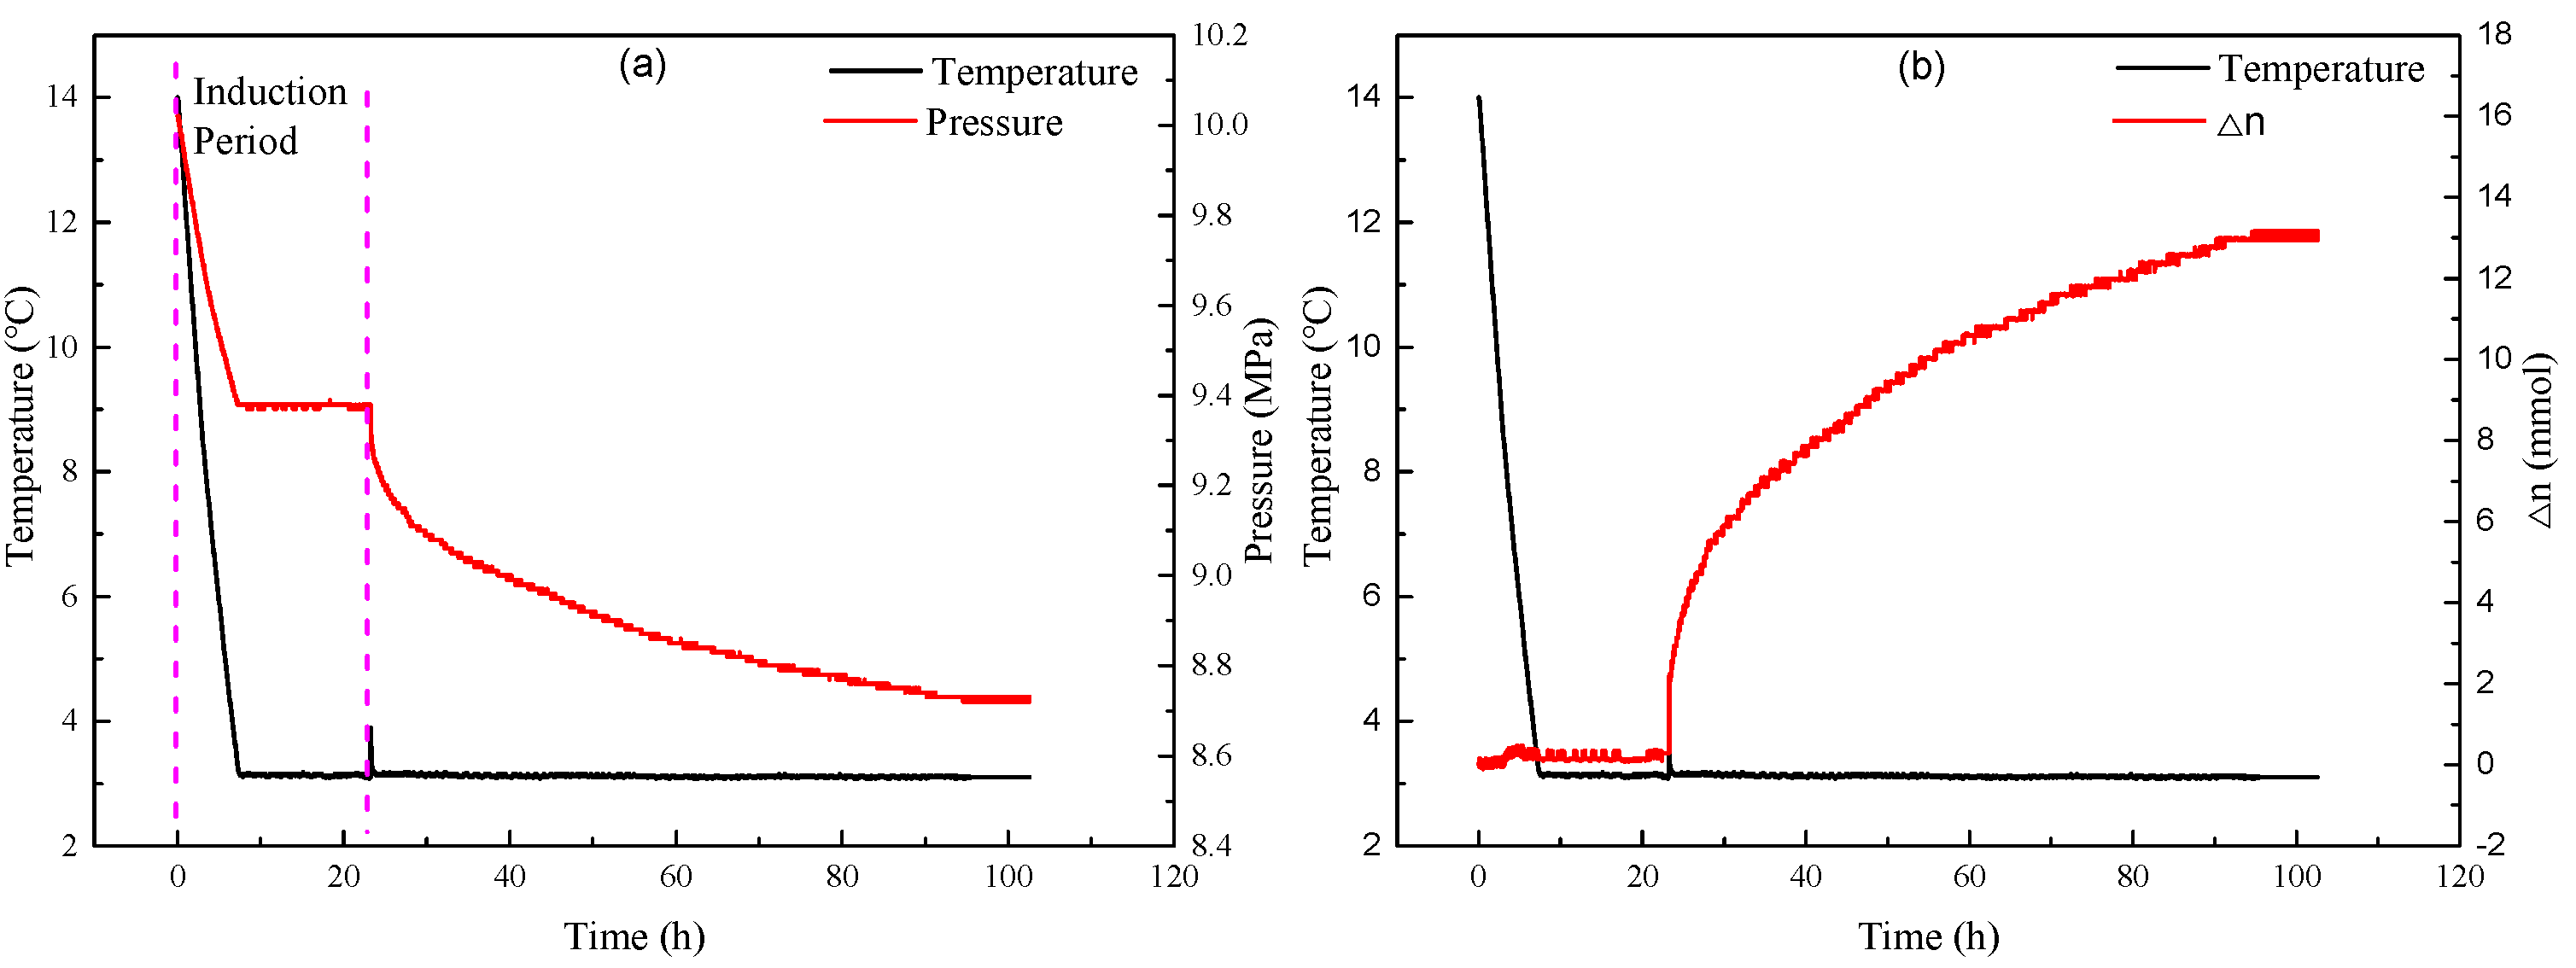
3.1. Typical Formation Process

Figure 4a shows the typical temperature and pressure curves. It can be found that the pressure in the reactor decreases with the decrease in temperature after the experiment begins and subsequently remains stable after the temperature drops to the experimental temperature. After the induction stage, the temperature in the reactor suddenly rises, and the pressure suddenly decreases, indicating that hydrate begins to form. Then, the pressure in the reactor decreases slowly, and the temperature gradually decreases to the experimental temperature. Figure 4b shows the methane consumption and temperature change during the experiment. As shown in Figure 4b, the methane consumption has a slight rise and remains stable after the beginning of the experiment. The slight rise in methane consumption may be caused by methane dissolution. When the consumption increases significantly, the temperature also increases significantly, indicating the consistency between judging hydrate formation by a sudden rise in temperature and a continuous increase in methane consumption. For some cases where there is no obvious change in the temperature and pressure during hydrate formation, the gas consumption curve can be used to judge when the hydrate formation starts.

3.2. Induction Time

Theoretically, the induction time is the duration from the generation of the supersaturated solution to the emergence of the first crystal of hydrate. However, the induction time defined in this method is challenging to quantify in the experiments in this study. Therefore, the time between the beginning of each experiment and when methane consumption rises rapidly was defined as the induction time. Figure 5a compares the induction time in the experiments with different NaCl concentrations. The induction time is the average value of two experiments conducted at the same NaCl concentration and same montmorillonite content. As shown in Figure 5a, the induction time of the methane hydrate formed in 0.2 mol/L NaCl solution is significantly shorter than that in pure water. However, the induction time increases significantly with the further increase of the NaCl concentration. This indicates that NaCl may promote hydrate nucleation at the low concentration but inhibit hydrate nucleation at the high concentration. As calculated, the average induction time for the experiments with the NaCl concentrations of 0, 0.2, 0.6, and 1.2 mol/L is 20.99, 8.11, 15.74, and 30.88 h, respectively. The study of Chong et al. [4] also showed that the induction time of hydrate formed in 1.5 wt% (approximately 0.26 mol/L) NaCl solution is obviously shorter than that in 3 wt% (approximately 0.53 mol/L). A previous study indicated that hydrophobic and hydrophilic ions have an essential influence on hydrate formation [17]. Nguyen et al. [19] found that in dilute sodium halides, large and polarizable anions behave as hydrophobic entities and interact with surrounding water molecules to form hydrophobic hydration shells whose water structure is like that of methane. The structurally similar shells facilitate gas hydrate nucleation. Furthermore, a molecular simulation study showed that a low concentration of Na+ makes for the formation of hydrate clusters, and Cl facilitates the transformation of the surrounding methane hydration [35]. However, at a high concentration, there occurs the competition between ions and methane molecules to gain water for hydration, which inhibits the growth of hydrate [35,36].
Figure 5b shows the induction time of the experiments with different montmorillonite contents. In the experiments with the montmorillonite contents of 10 and 25 wt%, the induction time is less than that of the pure silica sand. It was found that clay behaves like a thermodynamic promoter at a low content [37]. However, in the experiments with 40 wt% montmorillonite, the induction time increases significantly, especially in the experiments with pure water and the NaCl concentration of 1.2 mol/L. This shows that montmorillonite can promote hydrate nucleation in the content range of 10–25 wt%. When the content of montmorillonite further increases, montmorillonite will inhibit the nucleation of hydrate. The average induction time of the experiments carried out under the montmorillonite contents of 0, 10, 25 and 40 wt% is 20.68, 10.72, 13.35, and 30.96 h, respectively. Hydrate nucleation is likely to start from the surface of wet sediments in high content montmorillonite experiments, and in the experiment with free water, hydrate nucleation mainly occurs on water–gas interfaces [38]. Montmorillonite absorbs more water into its interlayer with the increase of the montmorillonite content. Most of the absorbed water exists in the bound water, which links with montmorillonite by hydrogen bonds, making it more difficult to form hydrate on the surface of montmorillonite [29,39]. In other words, montmorillonite also has a certain thermodynamic inhibition on hydrate formation at a high content [25]. The induction time also increases with the decrease in hydrate formation driving force (the difference between hydrate formation pressure and the equilibrium hydrate formation pressure corresponding to the formation temperature) caused by the increase of montmorillonite content. Compared with the effect of NaCl concentration on induction time, the effect of the montmorillonite content is smaller, indicating that the thermodynamic inhibition of montmorillonite on hydrate formation is less than that of NaCl.

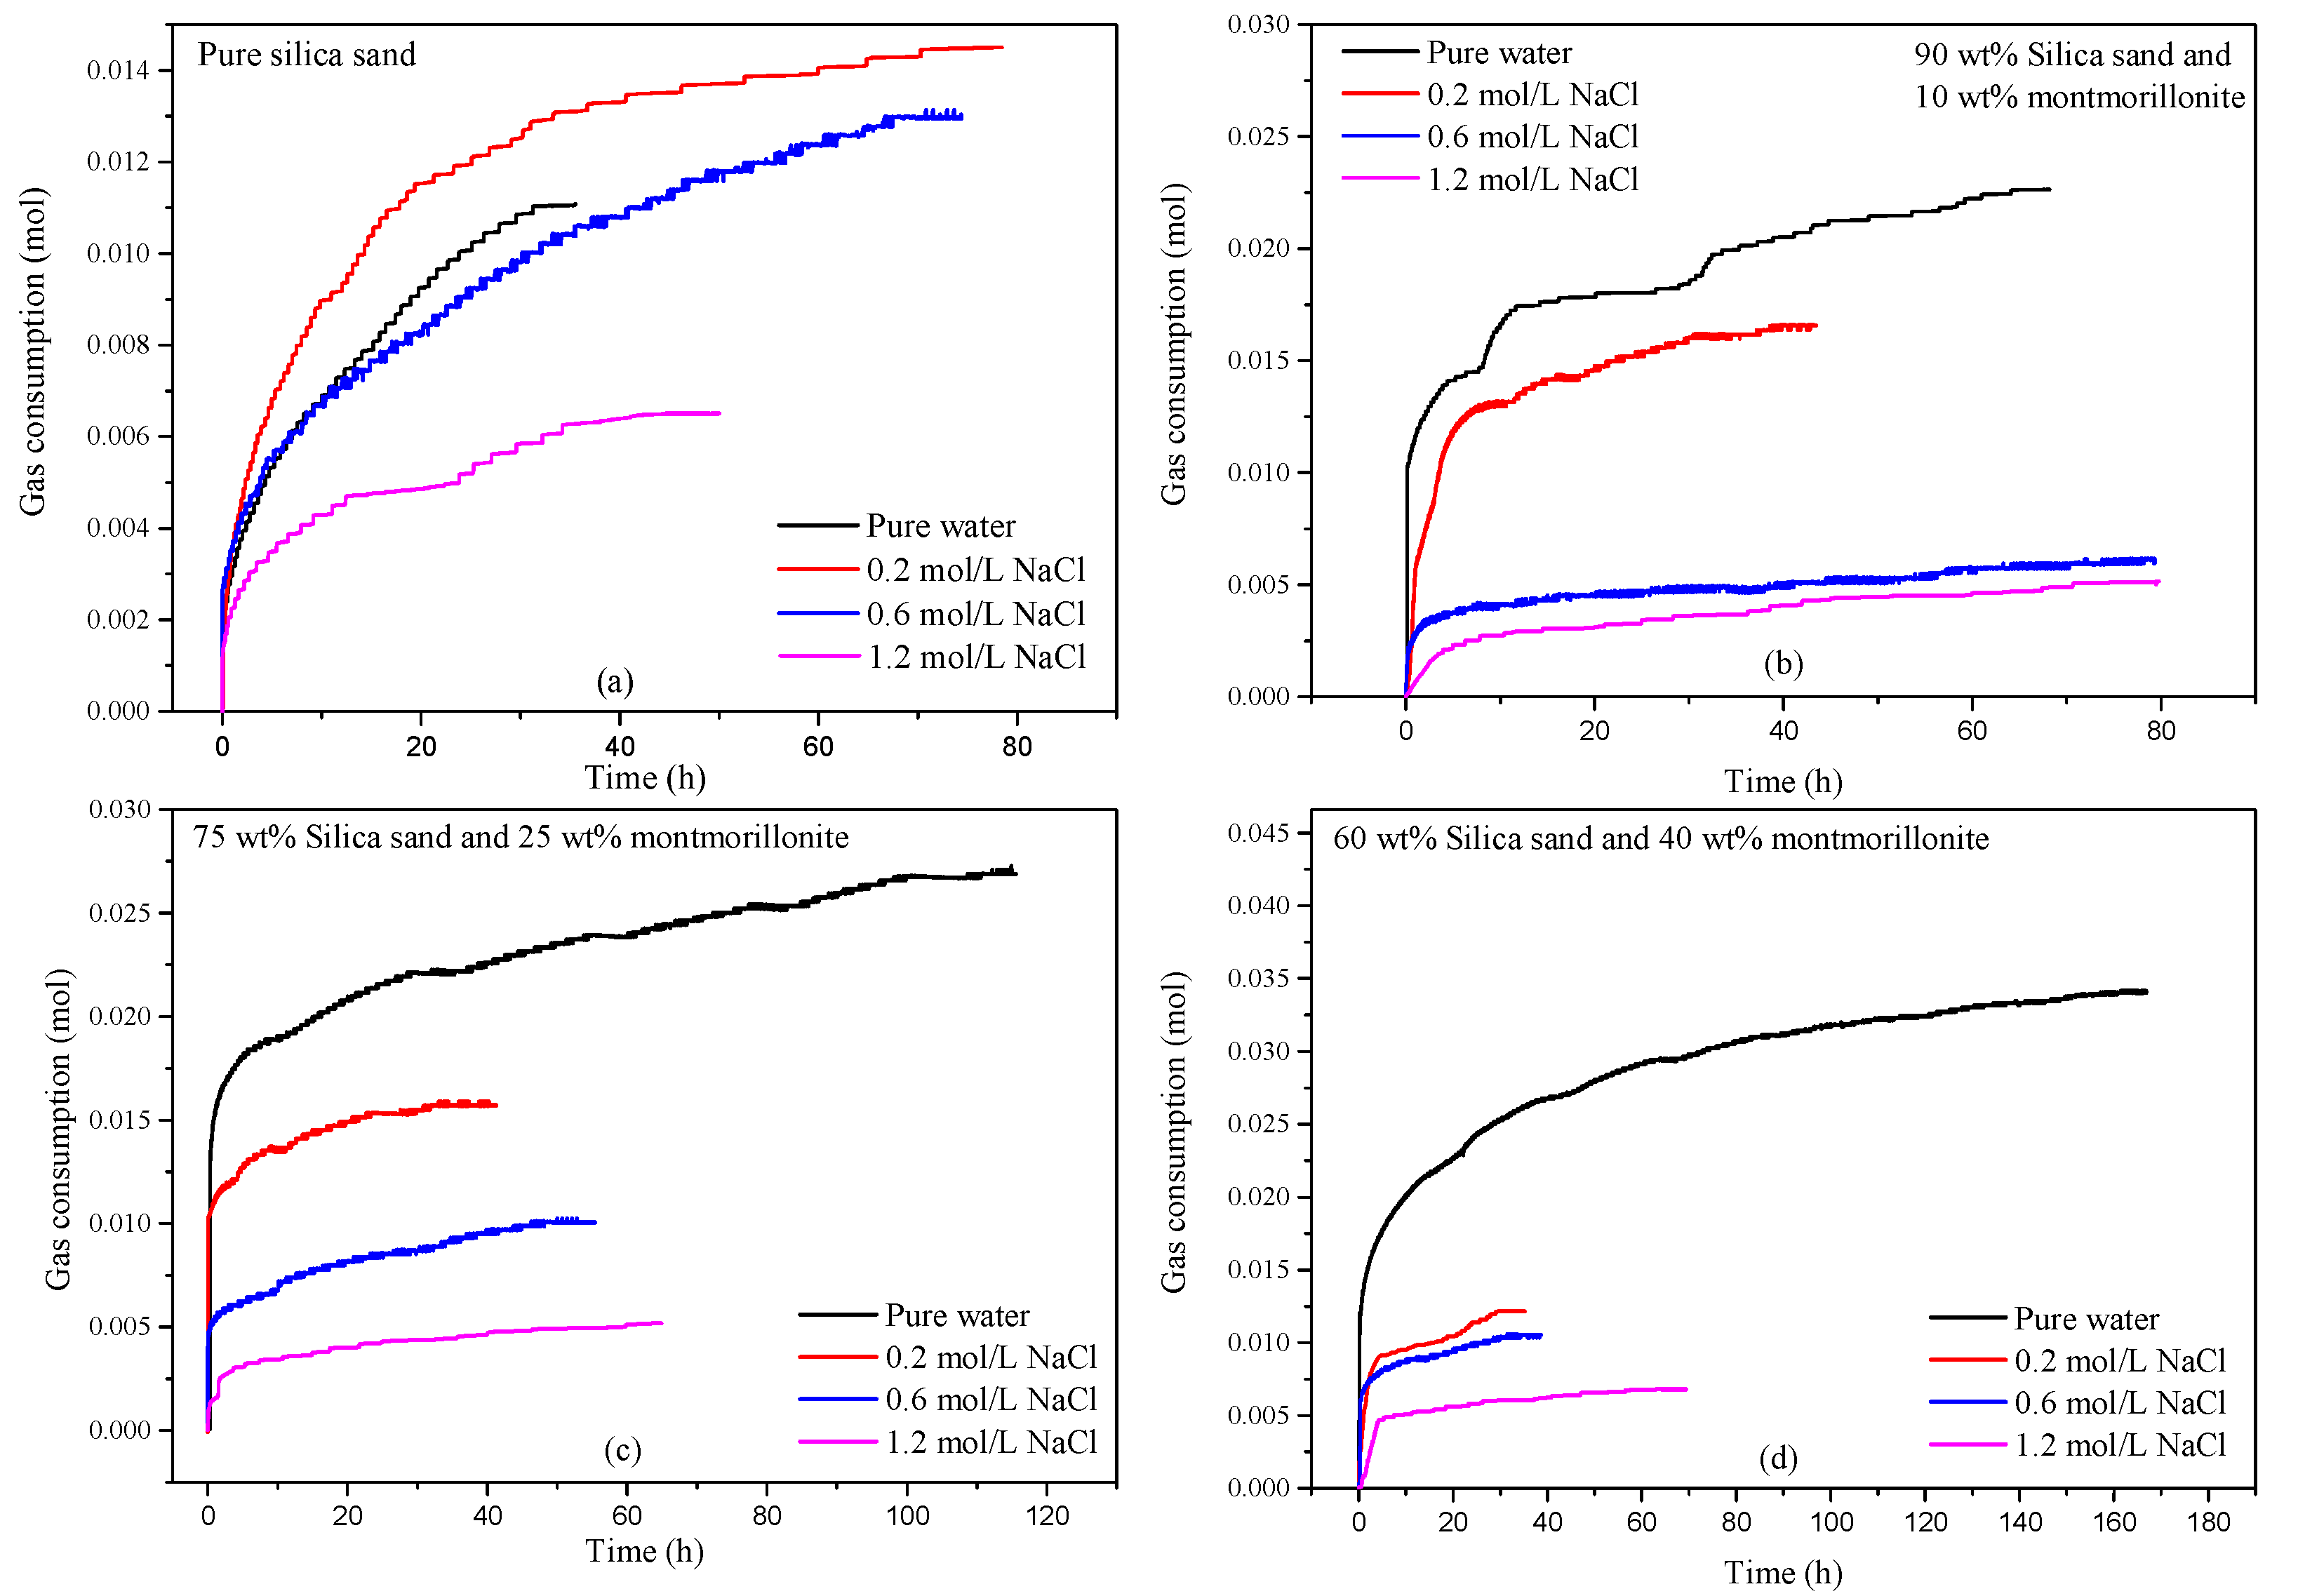
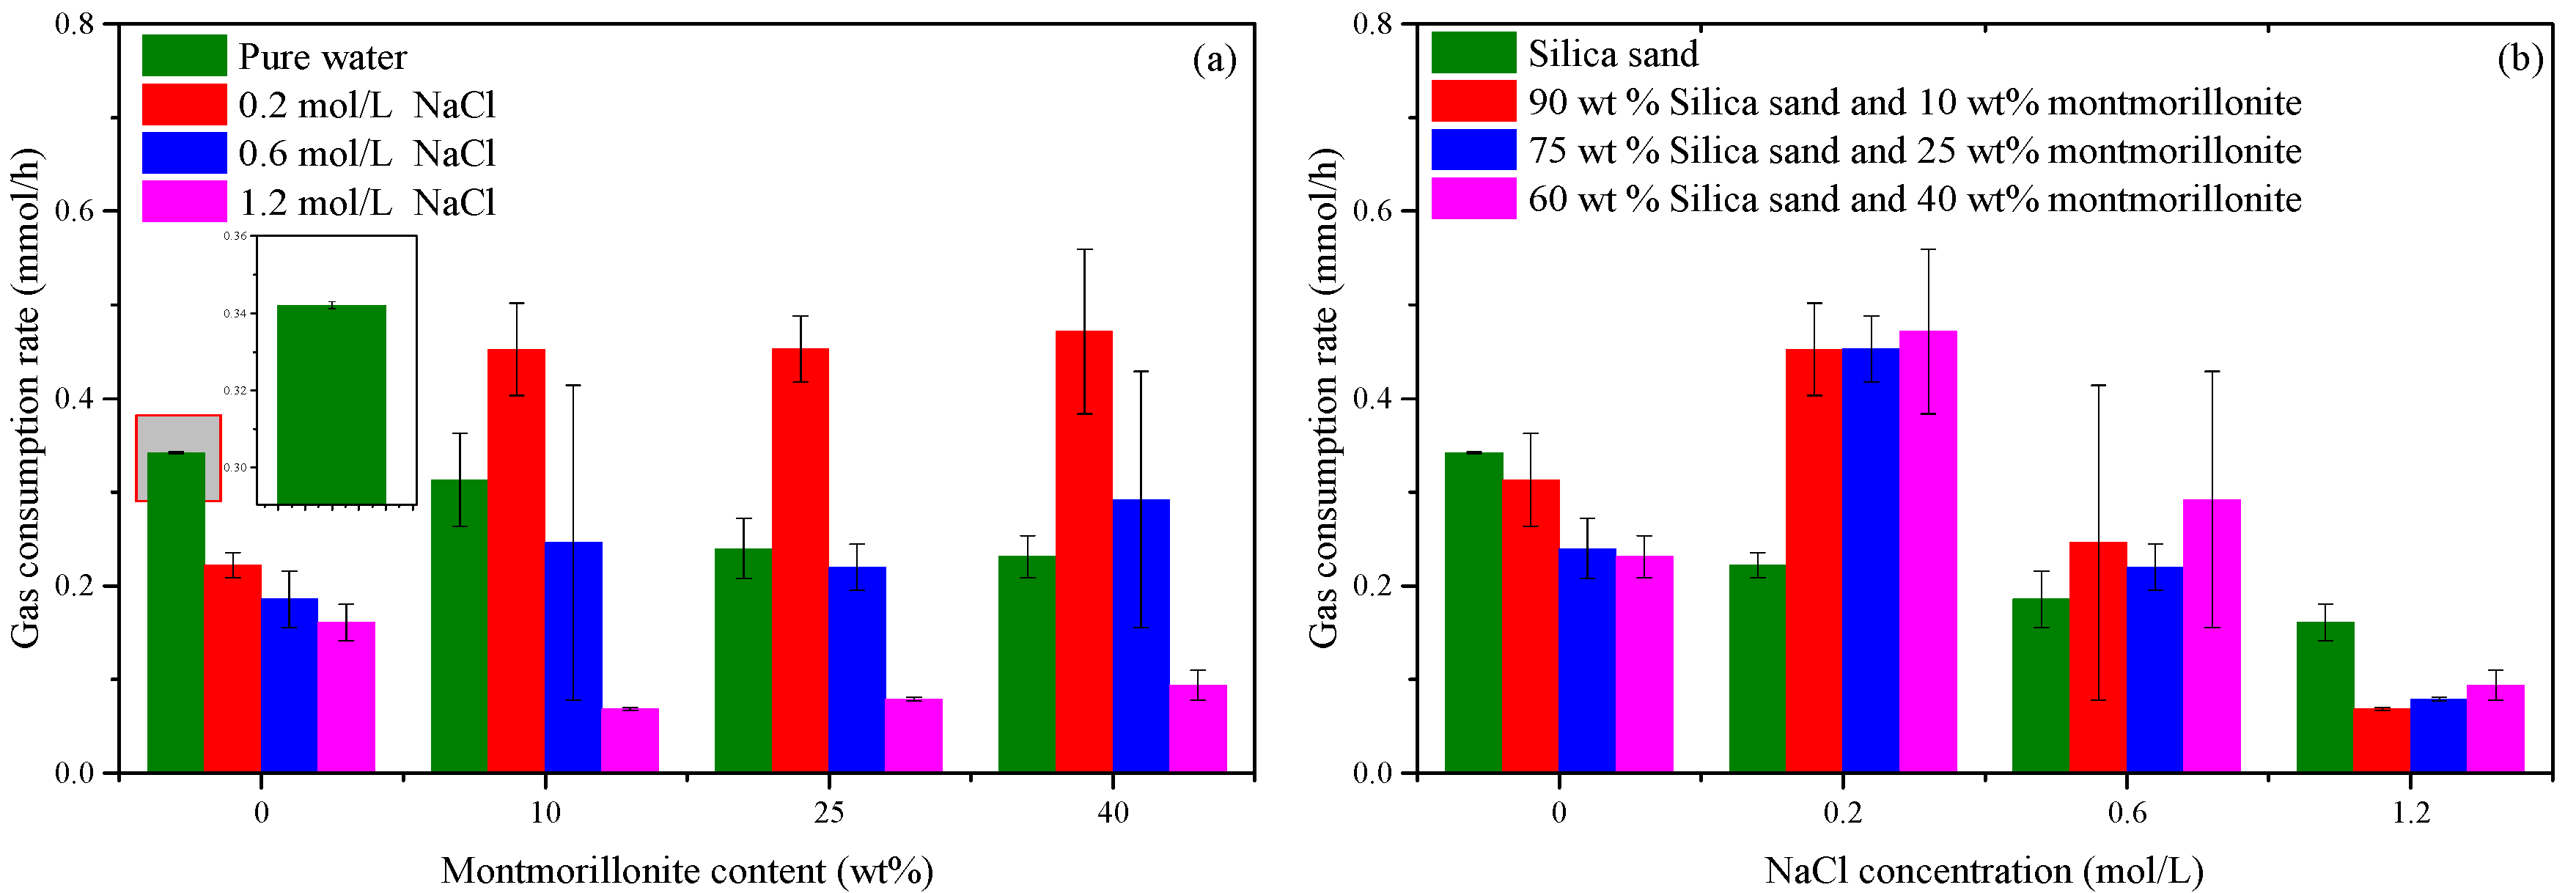
3.3. Gas Consumption and Gas Consumption Rate

Figure 6 shows the curves of methane consumption over time. For the similar change of the experiment and repeated experiment, the curve of repeated experiments is not shown. As shown in Figure 6, the methane consumption is the fastest at the beginning of hydrate formation, then its rate decreases rapidly in all experiments. This indicates that the formation rate of hydrate is the fastest at the beginning of hydrate formation and then decreases rapidly. In experiments conducted in the pure silica sand, the final methane consumption initially increases and then decreases with the increase of the NaCl concentration. This shows that NaCl solution with a low concentration can promote hydrate nucleation and improve the formation rate of methane hydrate when hydrate is formed in the pure silica sand [19]. However, when using NaCl solution to form hydrate in the pure silica sand, the hydrate formation duration increases significantly. This is because the increasing concentration of NaCl solution reduces the driving force for hydrate formation. In experimental runs, B, C, and D with montmorillonite existing, the final methane consumption decreases significantly as the NaCl concentration increases. In the experiments with pure water, the final gas consumption increases with the montmorillonite content, but the formation duration also increases significantly. In the experiments with the NaCl concentration of 0.2 mol/L, the final methane consumption in each group is relatively close, but the duration of hydrate formation in the pure silica sand is longer than that in the montmorillonite/sand mixture. In the experiments with the NaCl concentrations of 0.6 and 1.2 mol/L, the final methane consumption decreases significantly after adding montmorillonite, in which the hydrate formation duration is longer than that in the experiments with the NaCl concentration of 0.2 mol/L.
To further analyze the formation rate of methane hydrate, the average gas consumption rate of each experiment was calculated by Equation (3) and is given in Figure 7, in which the error bar represents the specific values of two groups of experiments under the same conditions
The average gas consumption rate is related to the final gas consumption and hydrate formation duration. A higher average gas consumption rate indicates a higher hydrate formation ability in a specific time. When there is little difference in the final gas consumption, the average gas consumption rate is mainly affected by the hydrate formation duration. It can be seen from Figure 7 that, in the silica sand containing montmorillonite, the average gas consumption rate under the NaCl concentration of 0.2 mol/L is significantly higher than those under other concentrations. Combined with Figure 6, it can be found that under the NaCl concentration of 0.2 mol/L, the final gas consumption of different experiments is relatively high and the hydrate formation duration is relatively short, resulting in a high average gas consumption rate.
It can be seen from Figure 7b that the average gas consumption rate decreases significantly when the NaCl concentrations are 0.6 and 1.2 mol/L. This is because with the significant increase of the NaCl concentration, the final gas consumption decreases significantly, and the overall hydrate formation rate also decreases significantly with the decrease in the driving force of hydrate formation. In general, the gas consumption rate is more significantly affected by the NaCl concentration and less affected by the montmorillonite content.

3.4. Water Conversion

Table 2 and Figure 8 show the average water conversion of the experiments with different NaCl concentrations and montmorillonite contents. The average water conversion is the average value of two experiments conducted at the same NaCl concentration and the same montmorillonite content. As shown in Figure 8a, the average water conversion in the experiments conducted in the pure silica sand with the NaCl concentrations of 0, 0.2, 0.6, and 1.2 mol/L is approximately 11.12% (±0.97%), 13.70% (±0.12%), 11.32% (±0.73%), 5.69% (±0.24%), respectively. This shows that the NaCl can promote hydrate formation at the low concentration but significantly inhibits the hydrate formation at the high concentration in the pure silica sand. This phenomenon is the same as the previous research results of Nguyen et al. [19]. The water conversion of the hydrate formed in 0.6 mol/L NaCl solution is in line with the reports of Mekala et al. [16]. In their study, the water conversion of the hydrate formed in the silica sand with 100% seawater saturated was only 8.44% (±4.51%). However, the study of Chong et al. [4,5] showed that about 64.75% (±2.79%) and 57.14 (±3.09%) water conversion was obtained in 1.5 and 3 wt% NaCl solutions with 75% water saturation. This shows that water saturation may have a stronger influence on water conversion than dilute salt solution. Their studies also showed that NaCl and MgCl2 have basically the same influence on water conversion, although MgCl2 has a stronger inhibition effect on hydrate formation, indicating that different types of salts have different influences on water conversion, and are not directly related to the thermodynamic inhibition ability of salts.
As also shown in Figure 8a, in the experiments with the montmorillonite contents of 10, 25 and 40 wt%, the water conversion decreases with the increase of the NaCl concentration. Different from the hydrate nucleation, the final water conversion of hydrate formation is mainly related to the hydrate formation driving force and mass transfer process. On the one hand, the driving force of hydrate formation determines the final stable pressure of hydrate and whether hydrate can continue to form. On the other hand, with the formation of hydrate, the increasing hydrate saturation hinders the contact between gas and unreacted water, and finally affects the water conversion. The induction time of hydrate formation and the water conversion of the experiments in the pure silica sand show the promoting effects of salt ions on hydrate formation. However, in the system containing montmorillonite, due to the high water absorption of montmorillonite, the distribution of water in the sample is more dispersed, which provides greater gas–liquid contact and reduces the obstruction of hydrate formation to the mass transfer process. Therefore, in the system containing montmorillonite, the promotion effect of the salt ion at the low concentration on hydrate formation may be reduced, while the effect of salt on the hydrate equilibrium pressure, which leads to the decrease in hydrate formation driving force with the increase of the salt concentration, plays a more significant role on hydrate formation, resulting in the decrease of the final water conversion with the increase of the NaCl concentration in the montmorillonite containing system. As found in the study of Chong et al. [4,5], different types of salts have different influences on water conversion and are not directly related to the thermodynamic inhibition ability of salts. However, in the mixture of silica sand/montmorillonite, it is found that the water conversion may have a more significant relationship with the thermodynamic inhibition ability of the salt type. Therefore, during hydrate formation with the presence of montmorillonite, it is speculated that the water conversion would be less with the salt, which has a stronger hydrate inhibition ability.
As shown in Figure 8b, in the experiments with pure water, the water conversion increases significantly with the increase of the montmorillonite content due to that montmorillonite increases the contact area of gas and water and improves the mass transfer efficiency during hydrate formation. The water conversion of the experiments in pure water with the montmorillonite contents of 0, 10, 25 and 40% is 12.14% (±1.06%), 24.68% (±1.49%), 29.59% (±2.30%), and 32.57% (±1.64%), respectively. The dispersion of water increases with the increase of the montmorillonite content. Although montmorillonite has a certain inhibition effect on the formation thermodynamics of hydrate, the higher mass transfer rate results in the higher water conversion. It shows that in a pure water system, the mass transfer process is the key factor affecting the final water conversion. It can also be seen from Figure 8b that with the increase of the NaCl concentration, the effect of the montmorillonite content on water conversion becomes less obvious, which may be due to the decrease in the hydrate formation driving force caused by the increase of the NaCl concentration, and its effect on the final water conversion is significantly higher than that of the montmorillonite content. The average water conversion of the experiments under the NaCl concentrations of 0, 0.2, 0.6 and 1.2 mol/L is 24.74, 15.14, 8.85, and 5.74%, respectively.

4. Conclusions

In this work, the effects of the NaCl concentration and montmorillonite content on hydrate formation kinetics were studied. The main conclusions are as follows:
(1)
NaCl solution has a dual effect on methane hydrate formation. A low concentration of NaCl solution effectively reduces the induction time. However, there is an opposite effect on hydrate nucleation in the NaCl solution at a high concentration. The average induction time for the experiments with the NaCl concentrations of 0, 0.2, 0.6, and 1.2 mol/L is 20.99, 8.11, 15.74, and 30.88 h, respectively.
(2)
The low content of montmorillonite is beneficial to reduce induction time, but the high content of montmorillonite will significantly increase the induction time. The average induction time of the experiments carried out under the montmorillonite contents of 0, 10, 25 and 40 wt% is 20.68, 10.72, 13.35, and 30.96 h, respectively. The effect of montmorillonite content on the induction time is smaller than NaCl, indicating that the thermodynamic inhibition of montmorillonite on hydrate formation is less.
(3)
In the experiments conducted in the pure silica sand, the low NaCl concentration of 0.2 mol/L can improve the final water conversion. In the experiments with pure water, the water conversion rate increases with the increase of the montmorillonite content due to the improvement of the dispersion of montmorillonite to water. The water conversion of the experiments in pure water with the montmorillonite contents of 0, 10, 25 and 40 wt% is 12.14% (±1.06%), 24.68% (±1.49%), 29.59% (±2.30%), and 32.57% (±1.64%), respectively.
(4)
In the case of both montmorillonite and NaCl existing, the absorption of water by montmorillonite, which increases the contact area of gas and water, and the inhibition of NaCl result in more complicated effects on the water conversion. In general, the increase of the NaCl concentration enhances the inhibition of hydrate formation and reduces the final water conversion, which is the key factor affecting the final water conversion. The average water conversion of the experiments under the NaCl concentrations of 0, 0.2, 0.6 and 1.2 mol/L is 24.74, 15.14, 8.85, and 5.74%, respectively.

Author Contributions

Conceptualization, H.Z. and Y.Z.; methodology, Y.Z.; validation, Z.C. and H.Z.; investigation, H.Z. and L.Z.; writing—original draft preparation, H.Z.; writing—review and editing, H.Z. and Y.Z.; supervision, X.L.; funding acquisition, X.L. All authors have read and agreed to the published version of the manuscript.

Funding

This work is supported by the National Natural Science Foundation of China (52076208, 51736009), the Guangdong Special Support Program (2019BT02L278), and the Special project for marine economy development of Guangdong Province (GDME-2020D044), which are gratefully acknowledged.

Institutional Review Board Statement

Not applicable.

Informed Consent Statement

Not applicable.

Data Availability Statement

Not applicable.

Conflicts of Interest

The authors declare no conflict of interest. Funders have no role in study design, data collection, analysis and interpretation, manuscript writing, and decision to publish results.

References

  1. Boswell, R.; Collett, T.S. Current perspectives on gas hydrate resources. Energy Environ. Sci. 2011, 4, 206–1215. [Google Scholar] [CrossRef]
  2. Klauda, J.B.; Sandler, S.I. Global distribution of methane hydrate in ocean sediment. Energy Fuels 2005, 19, 459–470. [Google Scholar] [CrossRef]
  3. Milkov, A.V. Global estimates of hydrate-bound gas in marine sediments: How much is really out there? Earth-Sci. Rev. 2004, 66, 183–197. [Google Scholar] [CrossRef]
  4. Chong, Z.R.; Chan, A.H.M.; Babu, P.; Yang, M.; Linga, P. Effect of NaCl on methane hydrate formation and dissociation in porous media. J. Nat. Gas Sci. Eng. 2015, 27, 178–189. [Google Scholar] [CrossRef]
  5. Chong, Z.R.; Koh, J.W.; Linga, P. Effect of KCl and MgCl2 on the kinetics of methane hydrate formation and dissociation in sandy sediments. Energy 2017, 137, 518–529. [Google Scholar] [CrossRef]
  6. Rees, E.V.L.; Priest, J.A.; Clayton, C.R.I. The structure of methane gas hydrate bearing sediments from the Krishna–Godavari Basin as seen from Micro-CT scanning. Mar. Pet. Geol. 2011, 28, 1283–1293. [Google Scholar] [CrossRef]
  7. Kneafsey, T.J.; Lu, H.; Winters, W.; Boswell, R.; Hunter, R.; Collett, T.S. Examination of core samples from the Mount Elbert Gas Hydrate Stratigraphic Test Well, Alaska North Slope: Effects of retrieval and preservation. Mar. Pet. Geol. 2011, 28, 381–393. [Google Scholar] [CrossRef] [Green Version]
  8. Makogon, Y.F. Natural gas hydrates—A promising source of energy. J. Nat. Gas Sci. Eng. 2010, 2, 49–59. [Google Scholar] [CrossRef]
  9. Sloan, E.D., Jr.; Koh, C.A. Clathrate Hydrates of Natural Gases, 3rd ed.; CRC Press: London, UK, 2007. [Google Scholar]
  10. Liu, C.; Meng, Q.; He, X.; Li, C.; Ye, Y.; Zhang, G.; Liang, J. Characterization of natural gas hydrate recovered from Pearl River Mouth basin in South China Sea. Mar. Pet. Geol. 2015, 61, 14–21. [Google Scholar] [CrossRef]
  11. Stern, L.A.; Lorenson, T.D. Grain-scale imaging and compositional characterization of cryo-preserved India NGHP 01 gas-hydrate-bearing cores. Mar. Pet. Geol. 2014, 58, 206–222. [Google Scholar] [CrossRef] [Green Version]
  12. Handa, Y.P.; Stupin, D.Y. Thermodynamic properties and dissociation characteristics of methane and propane hydrates in 70-.ANG.-radius silica gel pores. J. Phys. Chem. 1992, 96, 8599–8603. [Google Scholar] [CrossRef]
  13. Lowenstein, B. The major-ion composition of silurian seawater. Geochim. Cosmochim. Acta 2002, 66, 2683–2700. [Google Scholar]
  14. Horita, J.; Friedman, T.J.; Lazar, B.; Holland, H.D. The composition of Permian seawater. Geochim. Cosmochim. Acta 1991, 55, 417–432. [Google Scholar] [CrossRef]
  15. Dholabhai, P.D.; Kalogerakis, N.; Bishnoi, P.R. Kinetics of methane hydrate formation in aqueous-electrolyte solutions. Can. J. Chem. Eng. 1993, 71, 68–74. [Google Scholar] [CrossRef]
  16. Mekala, P.; Babu, P.; Sangwai, J.S.; Linga, P. Formation and dissociation kinetics of methane hydrates in seawater and silica sand. Energy Fuels 2014, 28, 2708–2716. [Google Scholar] [CrossRef]
  17. Altamash, T.; Aparicio, S.; Atilhan, M. An experimental study on doubly salt effect for methane hydrate inhibition. J. Nat. Gas Sci. Eng. 2019, 72, 103015. [Google Scholar] [CrossRef]
  18. Sowa, B.; Xue, H.Z.; Hartley, P.G.; Dunstan, D.E.; Maeda, N. Formation of ice, tetrahydrofuran hydrate, and methane/propane mixed gas hydrates in strong monovalent salt solutions. Energy Fuels 2014, 28, 6877–6888. [Google Scholar] [CrossRef]
  19. Nguyen, N.N.; Anh, V. The dual effect of sodium halides on the formation of methane gas hydrate. Fuel 2015, 156, 87–95. [Google Scholar] [CrossRef]
  20. Kawasaki, T.; Ukita, T.; Fujii, T.; Noguchi, S.; Ripmeester, J.A. Particle size effect on the saturation of methane hydrate in sediments—Constrained from experimental results. Mar. Pet. Geol. 2011, 28, 1801–1805. [Google Scholar]
  21. Liu, C.; Ye, Y.; Sun, S.; Chen, Q.; Meng, Q. Experimental studies on the P-T stability conditions and influencing factors of gas hydrate in different systems. Sci. China Earth Sci. 2013, 56, 594–600. [Google Scholar] [CrossRef]
  22. Zhang, Y.; Zhang, L.; Zhu, C.Y.; Xu, L.X.; Li, X.S.; Chen, Z.Y. Formation behaviors of methane hydrate in partially water-saturated porous media with different particle sizes. Energy Fuels 2021, 35, 19399–19409. [Google Scholar] [CrossRef]
  23. Ge, B.B.; Zhong, D.L.; Lu, Y.Y. Influence of water saturation and particle size on methane hydrate formation and dissociation in a fixed bed of silica sand. Energy Procedia 2019, 158, 5402–5407. [Google Scholar] [CrossRef]
  24. Bagherzadeh, S.A.; Moudrakovski, I.L.; Ripmeester, J.A.; Englezos, P. Magnetic resonance imaging of gas hydrate formation in a Bed of silica sand particles. Energy Fuels 2011, 25, 3083–3092. [Google Scholar] [CrossRef]
  25. Zhang, Y.; Li, X.; Wang, Y.; Chen, Z.; Li, G. Methane hydrate formation in marine sediment from South China Sea with different sater saturations. Energies 2017, 10, 561. [Google Scholar] [CrossRef] [Green Version]
  26. Kumar, A.; Sakpal, T.; Roy, S.; Kumar, R. Methane hydrate formation in a test sediment of sand and clay at various levels of water saturation. Can. J. Chem. 2015, 93, 1742–1773. [Google Scholar] [CrossRef]
  27. Liu, J.; Chen, M.; Chen, Z.; Yan, W. Clay mineral distribution in surface sediments of the South China Sea and its significance for in sediment sources and transport. Chin. J. Oceanol. Limnol. 2010, 28, 407–415. [Google Scholar] [CrossRef]
  28. Liu, Z.; Colin, C.; Li, X.; Zhao, Y.; Tuo, S.; Zhong, C.; Siringan, F.P.; Liu, J.T.; Huang, C.Y.; You, C.F. Clay mineral distribution in surface sediments of the northeastern South China Sea and surrounding fluvial drainage basins: Source and transport. Mar. Geol. 2010, 277, 48–60. [Google Scholar] [CrossRef]
  29. Tao, Y.; Yan, K.; Li, X.; Chen, Z.; Yu, Y.; Xu, C. Effects of salinity on formation behavior of methane hydrate in montmorillonite. Energies 2020, 13, 231. [Google Scholar] [CrossRef] [Green Version]
  30. Grim, R.E.; Güven, N. Bentonites: Geology, mineralogy, properties and uses. Dev. Sedimentol. 1978, 24, 78–79. [Google Scholar]
  31. Li, X.S.; Xu, C.G.; Zhang, Y.; Ruan, X.K.; Li, G.; Wang, Y. Investigation into gas production from natural gas hydrate: A review. Appl. Energy 2016, 172, 286–322. [Google Scholar] [CrossRef] [Green Version]
  32. Soave, G. Equilibrium constants from a modified Redlich-Kwong equation of state. Chem. Eng. Sci. 1972, 27, 1197–1203. [Google Scholar] [CrossRef]
  33. Tulk, C.A.; Ripmeester, J.A.; Klug, D.D. The application of Raman spectroscopy to the study of gas hydrates. In Gas Hydrates: Challenges for the Future; Holder, G.D., Bishnoi, P.R., Eds.; New York Academy of Sciences: New York, NY, USA, 2000; Volume 912, pp. 859–872. [Google Scholar]
  34. Uchida, T.; Hirano, T.; Ebinuma, T.; Narita, H.; Gohara, K.; Mae, S.; Matsumoto, R. Raman spectroscopic determination of hydration number of methane hydrates. Aiche J. 1999, 45, 2641–2645. [Google Scholar] [CrossRef]
  35. Xu, J.; Du, S.; Hao, Y.; Yang, X.; Zhang, J. Molecular simulation study of methane hydrate formation mechanism in NaCl solutions with different concentrations. Chem. Phys. 2021, 551, 111323. [Google Scholar] [CrossRef]
  36. Guo, Q.; Hu, W.; Zhang, Y.; Zhang, K.; Li, W. Molecular dynamics simulation of the interfacial properties of methane-water and methane-brine systems. Mol. Simul. 2021, 2, 1–14. [Google Scholar] [CrossRef]
  37. Kotkoskie, T.S.; Al-Ubaidi, B.; Wildeman, T.R.; Sloan, E.D. Inhibition of gas hydrates in water-based drilling muds. SPE Drill. Eng. 1992, 7, 130–136. [Google Scholar] [CrossRef]
  38. Lei, L.; Seol, Y.; Choi, J.H.; Kneafsey, T.J. Pore habit of methane hydrate and its evolution in sediment matrix—Laboratory visualization with phase-contrast micro-CT. Mar. Pet. Geol. 2019, 104, 451–467. [Google Scholar] [CrossRef] [Green Version]
  39. Guggenheim, S.; Groos, A. New gas-hydrate phase: Synthesis and stability of clay-methane hydrate intercalate. Geology 2003, 31, 653–656. [Google Scholar] [CrossRef]
Figure 1. Schematic of the experimental apparatus.
Jmse 10 00548 g001
Figure 2. Sediments sample: (a) montmorillonite and silica sand; (b) mixture of silica sand and montmorillonite; (c) after brine was added into the silica sand/montmorillonite mixture.
Jmse 10 00548 g002
Figure 3. Schematic view of the distributions of different components in the reactor.
Jmse 10 00548 g003
Figure 4. Typical hydrate formation curve. (a) Pressure and temperature evolution of methane hydrate formation. (b) Methane consumption and temperature evolutions of methane hydrate formation.
Jmse 10 00548 g004
Figure 5. Comparison of induction time. (a) Induction time under different NaCl concentrations. (b) Induction time under different montmorillonite contents.
Jmse 10 00548 g005
Figure 6. Comparison of methane consumption during hydrate formation in different experiments. (a) Pure silica sand. (b) 90 wt% silica sand and 10 wt% montmorillonite. (c) 75 wt% silica sand and 25 wt% montmorillonite. (d) 60 wt% silica sand and 40 wt% montmorillonite.
Jmse 10 00548 g006
Figure 7. Summary of gas consumption rate. (Error bars represent the experimental deviation). (a) Gas consumption rates under different NaCl concentrations. (b) Gas consumption rates under different montmorillonite contents.
Jmse 10 00548 g007
Figure 8. Summary of water conversion. (a) Water conversion under different NaCl concentrations. (b) Water conversion under different montmorillonite contents.
Jmse 10 00548 g008
Table 1. Properties and Suppliers of Materials.
MaterialPurity (%)Particle Size (µm)Supplier
CH499.9%-Foshan HuaTe Gas Co., Ltd.
Silica sand-120–180Shanghai McLean Biochemical Technology Co., Ltd.
Na-montmorillonite-16–22NANOCOR Company
NaCl99.5-Aladdin Industrial Co., Ltd.
Table 2. Summary of experimental conditions and results.
Exp.NaCl Concentration (mol/L)Montmorillonite Content (wt%)Final Pressure (MPa)Induction Time (h) Δ n (mmol) C W H (%)
A1008.8717.711.0810.15
A1’008.7911.1213.212.09
A20.208.6211.7114.8413.59
A2’0.208.677.1615.0913.82
A30.608.7220.8413.1612.05
A3’0.608.7723.7411.5710.6
A41.209.1154.216.485.94
A4’1.209.1518.985.965.46
B10108.1716.3823.1921.24
B1’0108.099.0826.1623.96
B20.2108.582.5616.5915.2
B2’0.2108.752.7413.9512.78
B30.6109.13.956.25.68
B3’0.6109.1614.766.055.54
B41.2109.1212.345.134.7
B4’1.2109.1223.945.184.75
C10257.957.9327.2925
C1’0257.719.2331.8829.19
C20.2258.619.4515.914.56
C2’0.2258.594.9815.7514.42
C30.6258.929.27109.19
C3’0.6259.139.075.665.18
C41.2259.0741.695.565.09
C4’1.2259.135.155.34.85
D10407.7678.0830.9328.33
D1’0407.598.4234.231.32
D20.2408.743.3512.3411.3
D2’0.2408.5522.9716.6415.24
D30.6408.8835.110.579.68
D3’0.6409.029.167.66.96
D41.2409.0358.386.966.37
D4’1.2409.1232.255.314.87
A: silica sand B: 90 wt% silica sand, 10 wt% montmorillonite C: 75 wt% silica sand, 25 wt% montmorillonite D: 60 wt% silica sand, 40 wt% montmorillonite. 1: pure water, 2: 0.2 mol/L NaCl, 3: 0.6 mol/L NaCl, 4: 1.2 mol/L NaCl. Superscript ’: repeated experiment.
Publisher’s Note: MDPI stays neutral with regard to jurisdictional claims in published maps and institutional affiliations.

