Article

Numerical Investigation on the Effect of Asymmetry of Flow Velocity on the Wake Vortex of Hydrofoils

1
College of Water Resources and Civil Engineering, China Agricultural University, Beijing 100083, China
2
Guangxi Datengxia Water Control Porject Development Co., Ltd., Guiping 530200, China
3
Beijing Engineering Research Center of Safety and Energy Saving Technology for Water Supply Network System, Beijing 100083, China
4
Department of Energy and Power Engineering, Tsinghua University, Beijing 100084, China
*
Author to whom correspondence should be addressed.
J. Mar. Sci. Eng. 2022, 10(4), 546; https://doi.org/10.3390/jmse10040546
Submission received: 23 March 2022 / Revised: 11 April 2022 / Accepted: 13 April 2022 / Published: 15 April 2022
(This article belongs to the Section Ocean Engineering)

Abstract

:
The Karman vortex street is a common flow phenomenon. In hydraulic machinery, it is usually located downstream of the guide vanes and the runner blades, which reduces hydraulic performance and may also cause fatigue damage to the structure. The latest research suggested that the difference in velocity gradient on each side of the blade trailing edge may have a significant impact on the strength of the wake vortex. The current work aims to verify the above conclusion and further explore the influence of asymmetry of flow velocity on the wake vortex. A numerical model with the velocity ratio, α, between the two sides of the hydrofoil as the only variable was designed, and the wake characteristics were solved by a computational fluid dynamics (CFD) method based on the finite volume. The unsteady Reynolds-average Navier–Stokes (URANS) equations were numerically solved by coupling with a transitional shear-stress transport (SST) turbulence model. The results showed that with the increase of α, the vortex shedding frequency decreased first, and then increased after reaching the critical velocity ratio αc1 ≈ 1.4. The vortex intensity first gradually decreased, and the vortex street suddenly disappeared after reaching the critical velocity ratio αc2 ≈ 2.2. The value of αc1 was affected by the thickness of the trailing edge, and αc2 was affected by the thickness and the Reynolds number. Besides, the asymmetry of the flow velocity also affected the effectiveness of the trailing-edge trimming. This research can provide references for the design of hydraulic machinery and other submerged structures.

1. Introduction

When the steady incoming flow with a certain Reynolds number bypasses a bluff body, double-row vortices with opposite rotation direction and regular arrangement will shed periodically at the tail of the bluff body, which is called the Karman vortex street. At this time, the fluid produces a periodic alternating force on the structure, causing it to vibrate, which is called vortex-induced vibration (VIV) [1]. Since it was first reported by Von Kármán in 1911, the Karman vortex has been deeply investigated in many engineering fields. A systematic review of the Karman vortex and VIV can be found in works by Gabbai et al. [2] and Williamson et al. [3].
In the early research of the Karman vortex, theoretical analysis and experiment were the main methods [2]. With the development of computer technology, numerical simulation provides support for the further study of the Karman vortex. Lam et al. [4] simulated the vortex shedding downstream of an inclined plate by using the finite volume CFD code and the RNG k-ω turbulence model, and the results were in good agreement with the experiment. Vagnoli et al. [5] conducted experiments and numerical simulations on the guide vane of a front-loaded turbine. They believed that the large eddy simulation (LES) is the most appropriate method to obtain reliable results of unstable wake characteristics. However, LES has not been widely used because of the high computational cost. To reduce the simulation time, Zhou et al. [6] used a dynamic, adaptive, grid-based LES method to solve the evolution of an airplane’s wake vortex. The results showed that the adaptive grid method could generate refined meshes in the vortex core area, and captured the dynamic performance of vortex more effectively. Zeng et al. [7] used a transition SST model coupled with the SST k-ω model and the γ-Reθt transition model to simulate the vortex shedding of a hydrofoil, and the results were in good agreement with the experimental data. Compared with the LES model, the transitional SST model greatly saves computing resources on the basis of high accuracy.
In hydraulic machinery, the Karman vortex street mainly exists in the tail of foil-shaped structures such as blades and guide vanes. Many hydropower stations have successively reported the noise, vibration, and structural damage caused by the coincidence of the Karman vortex frequency with the structural natural frequency [8]. Therefore, a lot of research has been conducted on the performance of the Karman vortex and how to suppress the VIV in hydraulic machinery. For example, Villegas et al. [9] used the time-resolved particle image velocimetry (TR-PIV) technique to experimentally study the relationship between the fluid force and the wake vortex shedding for a low Reynolds number wing, and then a six-step model describing the vortex–force relation was proposed. Ausoni et al. [10], through a series of experiments on hydrofoils, found that the Karman vortex may cause cavitation, thus increasing the vortex shedding frequency and the vibration amplitude of the hydrofoil. Besides, the shedding performance of the Karman vortex also changed with the surface roughness of the hydrofoil [11]. Lee et al. [12] numerically investigated the wake flow of a modified NACA 0009 hydrofoil, and the results showed that the strength and shedding frequency of the Karman vortex are significantly affected by the cross-sectional shape of the trailing edge.
There are many factors that affect the strength and the shedding frequency of the wake vortex. In addition to the above items, there are also inflow velocity, attacking angle, turbulence intensity, and so on. However, the shape of the trailing edge is the most controllable factor. As early as the 1950s, Donaldson [13] experimentally studied the influence of different shapes of the trailing edges of the Francis-turbine blades on the excitation force, and successfully eliminated some unpleasant vibrations by trimming the edges. Since then, trailing-edge trimming has gradually become the mainstream method to suppress VIV of blades and guide vanes. Do et al. [14] numerically researched the wake flow of a blunt-tailed two-dimensional NACA 0015 section with different base cavity shapes and sizes at high Reynolds numbers. The results showed that the base cavity at the trailing edge did not change the intrinsic Strouhal number of this section, but did have a remarkable impact on the local pressure fluctuations, lift fluctuations, and wake structure. Peng et al. [15] established an intelligent optimization model of the blade trailing-edge profile based on factorial experiments, extreme learning machine (ELM), and particle swarm optimization (PSO), with the goal of reducing the VIV of the stay vane of hydro-turbines. Wang et al. [16] used the delayed separation vortex technique to simulate the wake of a high Reynolds number turbine blade and found that the characteristics of the wake vortex street changed observably with the suction profile. In addition, the suction boundary layer with an incomplete velocity profile tended to stabilize the wake, suppress the generation of wake vortices, and weaken the unsteady effect of the wake. Zobeiri et al. [17] compared the wake behind hydrofoils with a sloping tail and an obtuse tail using a laser Doppler velocimetry (LDV). The results showed that the shape of the trailing edge of a guide vane directly affected the distribution of wake vorticity, and the vortices on both sides of the asymmetric trailing edge tended to collide with each other, thereby reducing the vortex excitation energy. Yao et al. [18] and Zeng et al. [7] performed a series of experiments and numerical simulations on the hydrodynamic damping of hydrofoils, and found that an asymmetric trimming resulted in a significant increase in hydrodynamic damping under large flow conditions. Lee et al. [19] and Neidhardt et al. [20] investigated the effect of the tail thickness of a hydrofoil on the wake performance through numerical simulations. Neidhardt et al. [20] reported that the elimination of the Karman vortex resonance by trailing-edge modification should be attributed more to a decrease in excitation energy rather than a change in shedding frequency. Xia et al. [21] respectively performed bevel cuts on the two sides of the trailing edge of an asymmetric guide vane, and compared the effectiveness of the two modifications by numerical methods. For this case, trimming on the side with a larger velocity gradient near the trailing edge could effectively suppress the Karman vortex, while trimming on the other side was less effective. Besides, it was found that the strength of the wake vortex seemed to be directly related to the difference of the velocity gradient on the two sides of the trailing edge.
The purpose of this study is to verify and further explore the influence of the asymmetry of the flow velocity on both sides of the trailing edge on the strength and the shedding frequency of the wake vortex. The results show that as the asymmetry of the flow velocity increases, the vortex shedding frequency first decreases and then increases. The vortex intensity gradually decreases, and then the wake suddenly stabilizes, and the vortex street almost disappears at this time. During this process, two critical states can be observed. As the Reynolds number and the thickness of the trailing edge change, the critical states are slightly advanced or delayed. In addition, the asymmetry of the flow velocity significantly affects the effectiveness of the tail-edge trimming.

2. Numerical Methods

2.1. Governing Equation

The fluid flow was described by the following unsteady Reynolds-averaged Navier–Stokes (URANS) Equations (1) and (2), which were solved by coupling with a transitional shear-stress transport (SST) turbulence model:
u i x i = 0
u i t + u i u j x j = 1 ρ p x i + μ ρ 2 u i u i u j ¯ x j
where ui and uj are the velocity components, p is the pressure, ρ is the density of the fluid, and μ is the dynamic viscosity.
The transitional SST model used in the current work was formed by coupling the SST k-ω model and the γ-Reθt transition model. The SST k-ω model can be used to accurately predict the flow separation of the boundary layer under an inverse pressure gradient, so it has been widely used. However, it is not accurate enough to simulate the position of the transition point and the length of the transition zone. In the numerical simulation of the Karman vortex of a hydrofoil, the prediction of transition phenomenon directly affects the vortex intensity and the shedding frequency. Based on massive statistical data, Menter et al. [22] proposed a γ-Reθt transition model. It is mainly composed of an equation about the intermittent factor, γ, and an equation about the transitional momentum-thickness Reynolds number, Reθt. The transitional SST model is as follows:
ρ k t + x i ρ u i k = P ˜ k + D ˜ k + x i μ + σ k μ t k x i
ρ ω t + x i ρ u i ω = β P k ν t D ω + C d ω + x i μ + σ k μ t ω x i
P ˜ k = γ e f f P k
D ˜ k = min max γ e f f , 0.1 , 1.0 D k
where k is the turbulent kinetic energy, ω is the specific dissipation rate, Pk, Dk, and Dω are the production and destruction terms from the turbulent kinetic energy equation and the specific dissipation rate equation in the original SST model, and μt is the eddy viscosity. The values of model parameters such as γeff, β, σk, and Cdω are provided in [23].

2.2. Case Setup

The two-dimensional computational domain designed in this paper is shown in Figure 1. In order to make the fluid fully developed before reaching the trailing edge, an area with a length of L = 0.3 m was reserved in the model. The total length of the computational domain was 3 L, the width was 4 L/3, and the thickness of the trailing edge of the hydrofoil was h = L/10. The two inlets on both sides of the hydrofoil were set as velocity boundary, and the inflow velocities were U1 and U2, respectively. The average velocity was Uin = (U1 + U2)/2 = 20 L/s. The Reynolds number, Re, with L and Uin as the characteristic length and the characteristic velocity, was about 1.8 × 10⁶. The surface of the hydrofoil and the two sides of the channel were set as the non-slip wall, and the outlet was set as a static pressure boundary.
The planar quad elements were used to discretize the computational domain, and the elements on the surface and tail of the hydrofoil were refined, as shown in Figure 2. Four sets of grids with 13,866, 28,842, 58,050, and 135,014 elements were obtained, respectively. The vortex shedding frequency and lift coefficient amplitude of the case U1 = U2 = 20 L/s calculated by these four sets of grids were compared, and the results are shown in Figure 3. Here, the vortex shedding frequency, fv, was characterized by the Strouhal number, St. The lift coefficient amplitude, A C L , referred to the amplitude corresponding to the dominant frequency obtained by the fast Fourier transform (FFT) of the lift coefficient, CL. CL and St were defined as:
C L = F L 1 2 ρ U in 2 L
S t = h f v U in
where FL is the lift of the fluid acting on the hydrofoil.
It could be seen that, as the number of elements increased, both A C L and St tended to converge, and the error between the A C L obtained by the third and the fourth sets of grids was only about 2.86%, and the error between St was about 1.17%. Considering the efficiency and the accuracy, the third set of grids with 58,050 elements was finally selected for simulation. The thickness of the first layer of grids on the hydrofoil was 3 × 10⁻⁵ m, and the maximum value of y+ was approximately 1.9.
The value of the time step, Δt, was determined according to the Courant–Friedrichs–Lewy (CFL) condition [24], and the Courant number, CC = u·Δts, should be small enough, where u is the local flow velocity at a grid element, and Δs is the grid size along the flow direction. In this paper, the value of Δt was 5 × 10⁻⁵ s, and the maximum value of CC was about 0.6.
The numerical solution was carried out using the commercial software CFX based on the finite volume method. The advection and transient terms were discretized by a high-resolution scheme and a second-order backward Euler scheme, respectively [25].

2.3. Method Verification

To verify the accuracy of the numerical model constructed in this paper, a more complex structure (i.e., a blunt-tailed NACA 0009 hydrofoil) was subjected to CFD analysis using the same turbulence model and a grid with a similar number of elements, and the computational domain is shown in Figure 4. The NACA 0009 is one of a series of foils designed by the National Advisory Committee for Aeronautics in the United States. Ausoni et al. [26] conducted a series of experiments on this foil in a water tunnel. Comparing the fv obtained by the numerical simulation and the experiment, the two results were highly consistent, as shown in Figure 5, indicating that the two-dimensional numerical model used in this paper can reliably predict the shedding process of the wake vortex.
In fact, prior to the formal study, the wake vortices of the NACA 0009 foil and the flat foil had been simulated using the SST k-ω model, the transition SST model, and the Scale-Adaptive Simulation (SAS) model, respectively. For the NACA 0009 foil, the calculated results of the transition SST model were in good agreement with the experimental results, while the effects of the other two models were less effective. However, for flat foil, the results corresponding to different turbulence models were almost the same.

3. Results and Discussion

3.1. Influence of Flow Velocity Asymmetry on the Wake Vortex

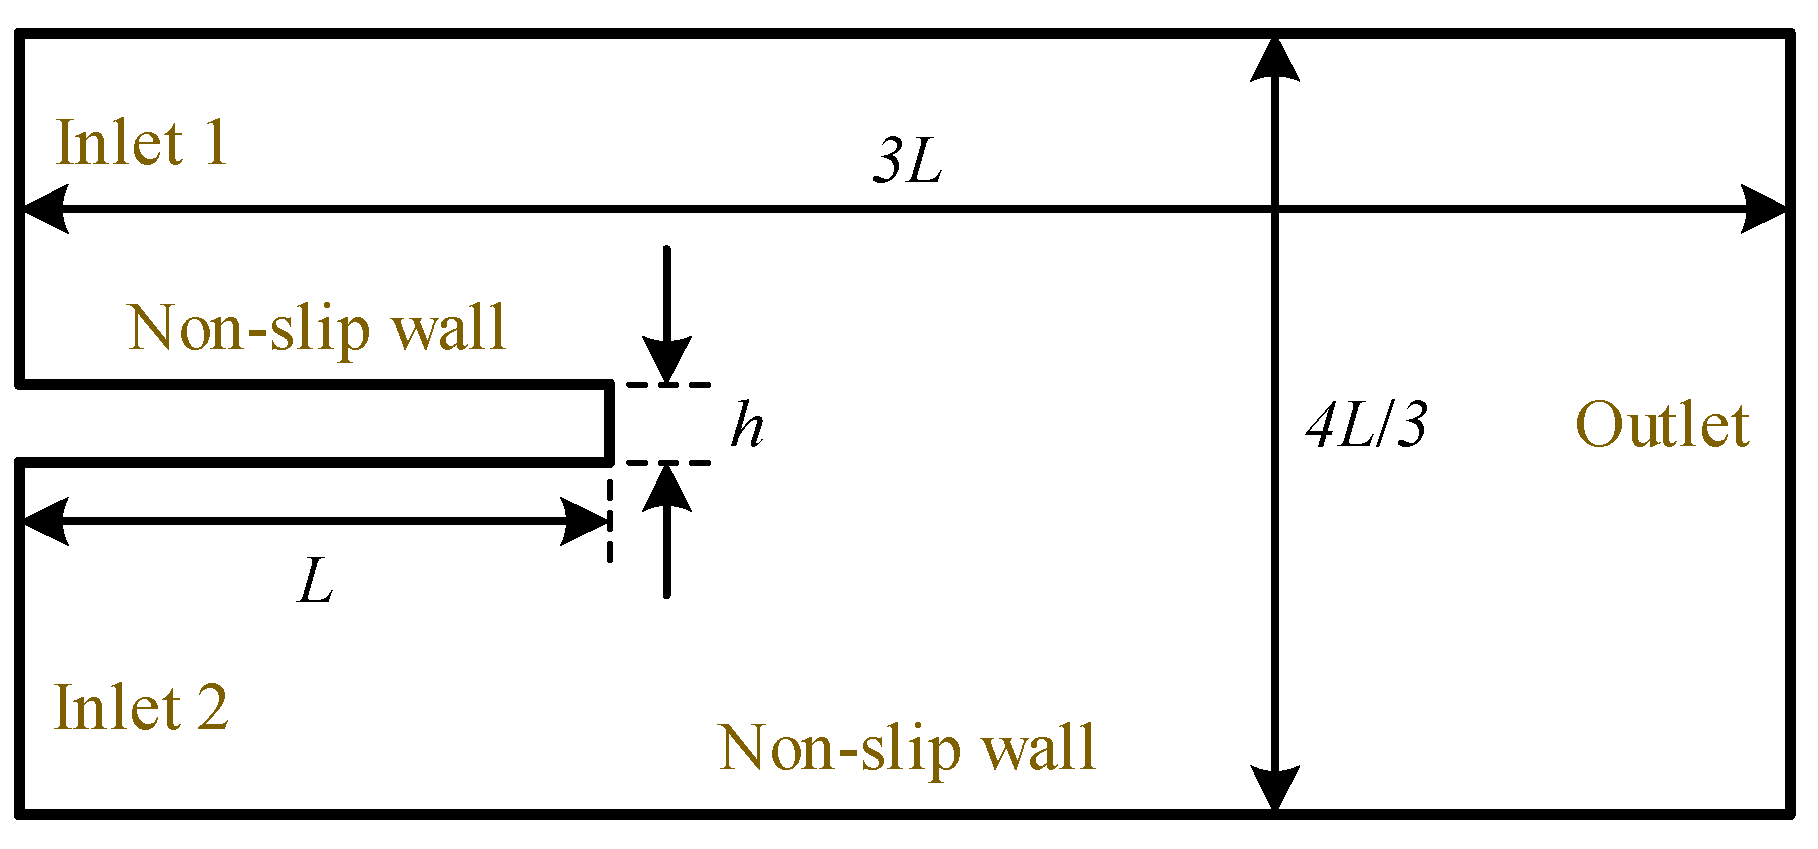
The ratio U1/U2 of the inlet velocities on both sides of the hydrofoil was defined as α (α ≥ 1). The larger α is, the larger the difference of the velocity gradient at the flow separation point on both sides of the trailing edge. Firstly, keeping Uin = (U1 + U2)/2 = 20 L/s (i.e., Re ≈ 1.8 × 10⁶), and α was set as different values for simulation.
Figure 6 shows the contours of the vorticity downstream of the hydrofoil under various conditions. When 1 ≤ α ≤ 2, periodic shedding vortex street was observed. With the increase of α, the vorticity of the vortex located below the center line of the hydrofoil decreased rapidly, while the vorticity of the upper vortex changed relatively less. When 1 ≤ α ≤ 1.4, the shedding and development of the lower vortex was relatively complete, and the wake vorticity presented the most common form of the Karman vortex street. When 1.53 ≤ α ≤ 2, the upper vortex dominated the wake structure, and the lower vortex gradually disappeared. When α ≥ 2.2, two stable vortex regions were formed at the tail of the hydrofoil, and no alternate shedding vortex structure was observed.
Figure 7 shows the velocity vectors downstream of the hydrofoil when α = 1 and α = 2, which represent the cases in the range of 1 ≤ α ≤ 1.4 and 1.53 ≤ α ≤ 2, respectively. For 1 ≤ α ≤ 1.4, the interaction between the upper and lower vortices was mainly reflected in promoting the formation of each other and pushing each other to develop downstream. When 1.53 ≤ α ≤ 2, the induced velocity of the upper vortex destroyed the further development of the lower vortex to a certain extent, and accelerated the formation of the next lower vortex. At this time, the wake had a higher stability.
In addition to this, the pressure field was also analyzed. The results displayed that the pressure field did not become a key factor affecting the Karman vortex, but showed a certain oscillation under the influence of the vortex. From the pressure contours, the distribution of the pressure field corresponded to the vorticity field, so it was not shown in the paper.
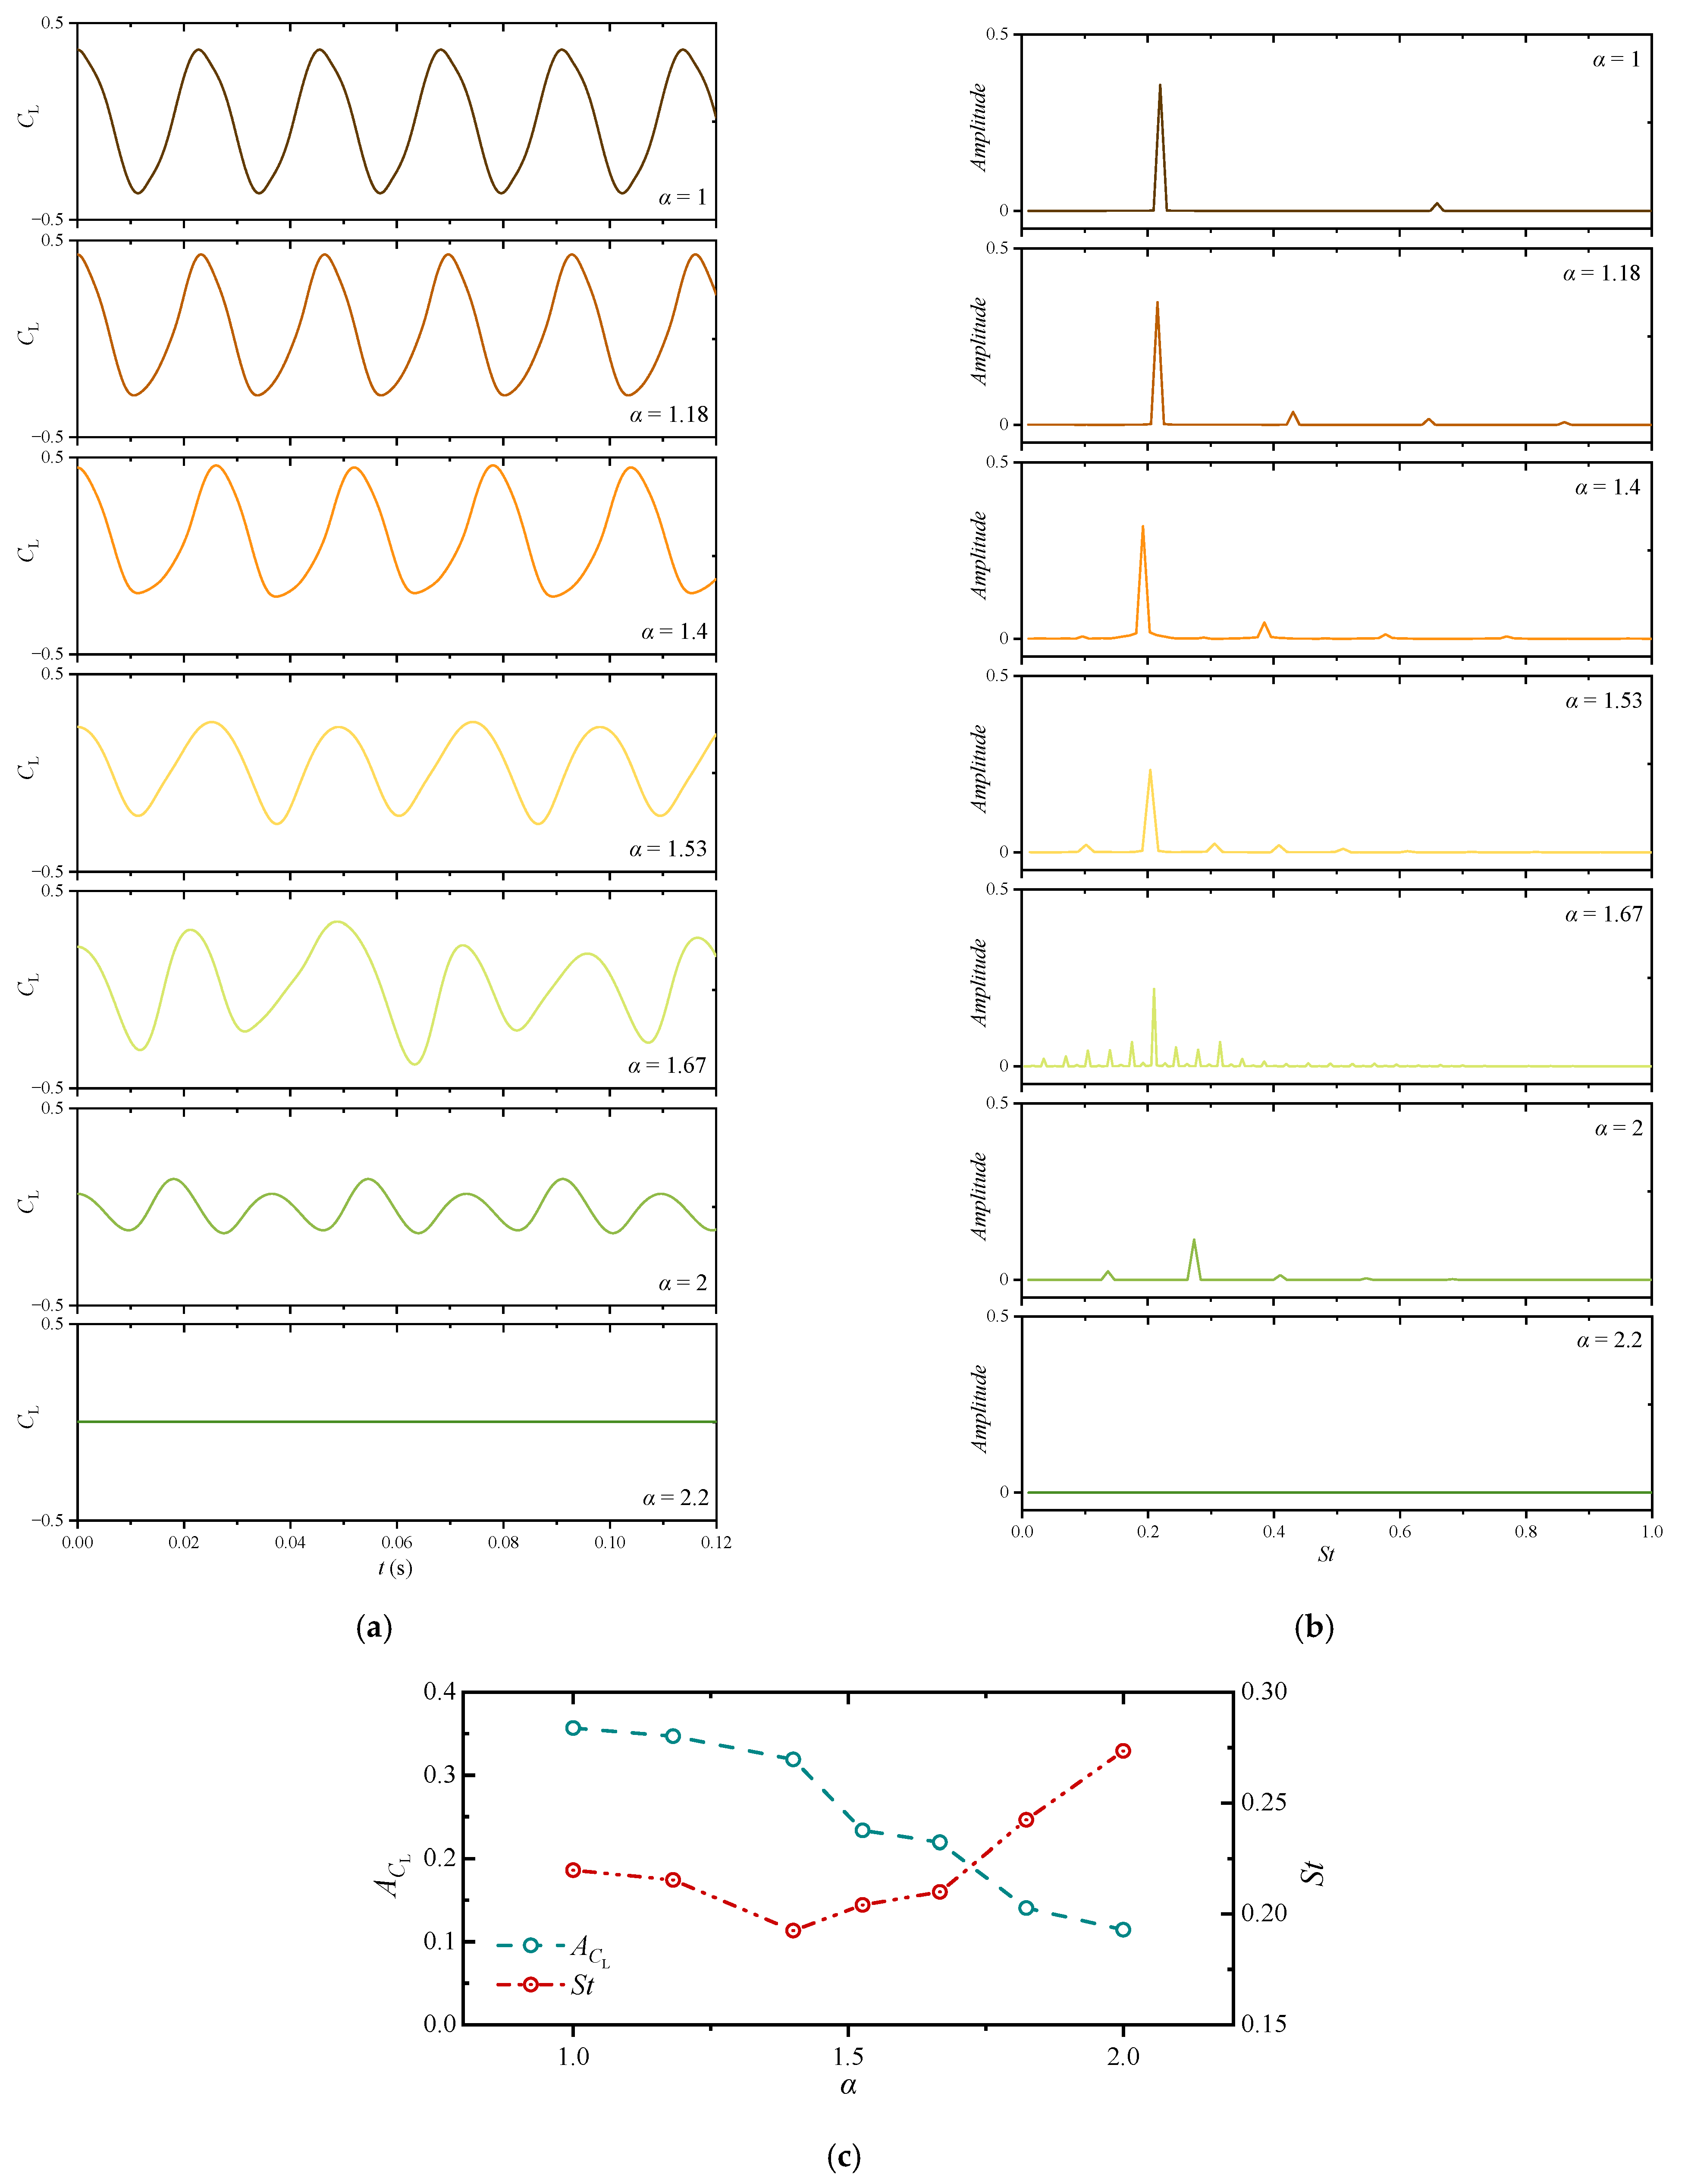
Due to the asymmetry of the flow on the upper and lower sides, it was difficult to accurately judge the magnitude relationship between the vortex intensities under various conditions from the vorticity contours or velocity vectors. The magnitude of the fluid excitation force caused by the pressure field oscillation is a direct factor that determines the strength of VIV. Therefore, the fluctuation amplitude of the lift coefficient was directly used to characterize the vortex intensity. The time domain and frequency domain signals of the lift coefficient, CL, on the hydrofoil under different α conditions are shown in Figure 8a,b. The fluctuation amplitude and dominant frequency of CL are shown in Figure 8c, where the dominant frequency of CL was always equal to the vortex shedding frequency, fv. When 1 ≤ α ≤ 2, the change of CL with time was obviously periodic, and the frequency component was relatively single. As α increased, the pulsation amplitude of CL gradually decreased, and the variation of the dominant frequency was divided into two stages: (1) when 1 ≤ α ≤ 1.4, the frequency gradually decreased, and (2) when 1.53 ≤ α ≤ 2, the frequency increased with α. For α ≥ 2.2, CL had no obvious fluctuation.
The above results showed that the asymmetry of the flow velocity on both sides of the trailing edge did have a significant impact on the strength and frequency characteristics of the wake vortex. Besides, there were two critical velocity ratios, αc1 and αc2, in the variation of the amplitude and dominant frequency of CL with α. Among them, the frequency of CL reached its minimum value at αc1. According to the current results, it could be roughly judged that αc1 ≈ 1.4. αc2 was the critical velocity for the stability of the wake, and the range was 2 < αc2 ≤ 2.2. When ααc2, the wake was stable, and the vortex street disappeared. Since these two critical values directly determined the variation of the Karman vortex performance with the velocity ratio, their influencing factors were further explored next.

3.2. Influencing Factors of the Critical Velocity Ratios

Firstly, Uin = 10 L/s and 30 L/s (i.e., Re ≈ 0.9 × 10⁶ and 2.7 × 10⁶) were set to simulate the effects of the Reynolds number on αc1 and αc2. Figure 9a shows the fluctuation amplitude and dominant frequency of the lift coefficient under different α, while Figure 9b shows the range of αc1 and αc2 under different Uin. Overall, the value of Uin had a negligible effect on A C L and St. According to the definitions of A C L and St, the amplitude of the lift acting on the hydrofoil was roughly proportional to the quadratic of Uin, and the vortex shedding frequency, fv, was approximately proportional to Uin.
The critical velocity ratio αc1 did not change significantly under different Uin, and the trough of the dominant frequency always remained around α = 1.4 (precisely, 1.29 < αc1 < 1.53). However, the critical value αc2 changed with Uin. From the current results, when the value of Uin was 20 L/s or 30 L/s, 2 < αc2 ≤ 2.2. When Uin was reduced to 10 L/s, αc2 decreased to below 2 (precisely, 1.8 < αc2 ≤ 2). When Uin = 10 L/s and α = 2, no obvious Karman vortex street was observed in the wake of the hydrofoil. This result showed that the smaller the Reynolds number was, the easier it was for the hydrofoil wake to reach a stable state, and the easier it was to suppress the Karman vortex by changing the asymmetry of the flow on both sides.
Experience has shown that in addition to Uin, the thickness of the trailing edge is also one of the key factors affecting the wake performance. Then, keeping Uin = 20 L/s, the trailing edge thickness, h, was changed to L/20 and 3 L/20, respectively, for simulation, and the results are shown in Figure 10. In general, with the increase of h, A C L showed an increasing trend, while the change of St was more complicated. When α < αc1, the change of St was small as h increased. On the contrary, when ααc1, St increased first and then decreased. Among them, h = L/10 corresponded to the largest St, h = L/20 was the next, and h = 3 L/20 corresponded to the smallest. In this case, the trend of A C L was equivalent to the trend of lift amplitude. That is, the larger h was, the larger the amplitude of the lift acting on the hydrofoil, indicating a greater intensity of the vortex. The magnitude relationship of St could not directly reflect the relationship between the vortex shedding frequencies with different h. After converting St to fv, it could be seen that fv decreased significantly with the increase of h.
The influence of the thickness, h, on the critical velocity ratios was more significant than that of Uin. When h = L/20, αc1 was around 1.53 (precisely, 1.4 < αc1 < 1.67), 2.2 < αc2 ≤ 2.43; when h = L/10, αc1 was around 1.4, 2 < αc2 ≤ 2.2; when h = 3 L/20, αc1 returned to around 1.53, 1.8 < αc2 ≤ 2. According to the present results, αc1 decreased first and then increased with the increase of trailing-edge thickness, while αc2 decreased monotonically.
According to the above research, in the design of the blades and guide vanes of the hydraulic machinery and other foil-shaped flow components, it can be considered to strengthen the flow asymmetry at the trailing edge to obtain a more stable wake. When the Reynolds number is small and the trailing-edge thickness is large, it is easier to eliminate the Karman vortex street by enhancing the flow asymmetry.

3.3. Influence of Flow Velocity Asymmetry on Trimming Effect

Trailing-edge trimming is the most popular measure to suppress VIV in hydraulic machinery, and one-sided beveling is the most common trimming method. In this paper, a beveled trailing-edge shape (as shown in Figure 11) was designed to study the influence of the flow asymmetry on the effectiveness of trimming. Bevel cuts were made on both sides of the trailing edge, respectively, and α = 1.18, 1.4, and 1.67 were set.
The vorticity contours downstream of the modified hydrofoil under different conditions are shown in Figure 12, where the upper side of the hydrofoil is the high-velocity side. When the low-velocity side was modified, the formation and development process of the vortex on the low-velocity side moved forward, and the damage of the vortex on the high-velocity side on its development was further enhanced. Therefore, the wake of the hydrofoil trimmed on the low-velocity side was more stable. In the case of trimming on the high-velocity side, the vortex on this side was limited to the cutting area, and its shedding strength was weakened. However, the damage of the induced velocity of this vortex to the development of the vortex on the low-velocity side was also weakened. Therefore, a distinct double-row Karman vortex street was observed. In general, the strength of the vortex shedding was reduced regardless of which side was trimmed. However, for the flat foil simulated in this paper, trimming on the low-velocity side suppressed the Karman vortex more effectively. Besides, the trimming enhanced the stability of the wake by affecting the relative position and interaction of the main vortices on the two sides instead of changing the difference between the velocity gradients on the two sides of the trailing edge. It could be inferred that the outflow angle on both sides of the hydrofoil may have a significant impact on the effect of trimming.
To quantify the effect of the trimming, the amplitude-decreased rate, λA, and the frequency-increased rate, λf, were introduced, which were defined as follows:
λ A = A M A 0 A 0 × 100 %
λ f = f M f 0 f 0 × 100 %
where A0 and AM are the amplitudes of the lift coefficient before and after modification, and f0 and fM are the vortex shedding frequencies before and after modification, respectively.
The corresponding λA and λf of the trimming under different conditions are shown in Figure 13. From the perspective of the change in amplitude, the trimming on the low-velocity side reduced the amplitude of the lift coefficient by more than 90%, and the larger the α, the better the effect. The effect of the trimming on the high-velocity side was poor, and the larger the α, the worse the effect. Judging from the change of the vortex shedding frequency, the λf corresponding to the low-velocity side trimming was higher. When ααc1, the corresponding λf was the highest, no matter which side was modified.
To verify the above conclusions, two additional beveled trailing-edge shapes were designed, as shown in Figure 14a,b. The hydrofoil corresponding to Figure 11 was named foil I. The trimming effects of these three trailing-edge shapes under the condition of α = 1.4 are shown in Figure 14c. The results showed that, for this type of flat foil, trimming on the low-velocity side always suppressed the Karman vortex better. It was also found that the effects of trimming in different ways on the vortex strength and shedding frequency significantly differed. However, this was not the focus of this paper, so it was not repeated here.

4. Conclusions

In this article, a numerical model with the velocity ratio, α, on the two sides of a hydrofoil as the only variable was designed to study the effect of flow asymmetry on the wake vortex. The conclusions were as follows:
  • There were two critical velocity ratios: αc1 ≈ 1.4 and αc2 ≈ 2.2, which satisfied the following laws: when 1 ≤ ααc1, the vortex shedding frequency decreased with the increase of α; when ααc1, the vortex shedding frequency increased with the increase of α; when 1 ≤ ααc2, the wake vortex intensity (represented by the magnitude of the lift coefficient in this paper) decreased with the increase of α; when ααc2, the wake was stable and the Karman vortex street disappeared.
  • As the Reynolds number decreased, the value of αc1 always remained around 1.4, while the value of αc2 decreased. The influence of the thickness of the trailing edge on the critical velocity ratios was more obvious than that of the Reynolds number. As the thickness increased, αc1 first decreased and then increased, while αc2 decreased monotonically. According to the variation of αc2, when the Reynolds number was small and the thickness of the trailing edge was large, it was easier to eliminate the Karman vortex street by strengthening the flow asymmetry.
  • For this type of flat foil simulated in this paper, trimming on the low-velocity side suppressed the Karman vortex more effectively, and the larger the α, the better the effect. The effect of the trimming on the high-velocity side was poor, and the larger the α, the worse the effect. The trimming enhanced the stability of the wake by affecting the relative position and interaction of the main vortices on the two sides. It could be inferred that the outflow angle on both sides of the hydrofoil may have a significant impact on the effect of trimming. Therefore, this conclusion is not absolutely accurate for the foil-shaped structure with a certain outflow angle.

Author Contributions

Conceptualization, X.X. and Z.W.; methodology, L.Z.; software, X.X.; validation, L.G. and Y.F.; formal analysis, H.Z.; investigation, X.X.; resources, Z.W.; data curation, L.G.; writing—original draft preparation, X.X.; writing—review and editing, L.Z.; visualization, L.G. and H.Z.; supervision, Z.W.; project administration, Z.W.; funding acquisition, Z.W. and L.Z. All authors have read and agreed to the published version of the manuscript.

Funding

This work was supported by the National Natural Science Foundation of China (Nos. 51876099 and 52079141).

Institutional Review Board Statement

Not applicable.

Informed Consent Statement

Not applicable.

Data Availability Statement

Not applicable.

Conflicts of Interest

The authors declared no potential conflict of interest with respect to the research, authorship, and publication of this article.

Nomenclature

A C L lift coefficient amplitude (-)
CLlift coefficient (-)
fvvortex shedding frequency (Hz)
hthickness of trailing edge (m)
Llength of hydrofoil (m)
ReReynolds number (-)
StStrouhal number (-)
Uinaverage inflow velocity (m/s)
αvelocity ratio (-)
αc1critical velocity ratio (-)
αc2critical velocity ratio (-)
λAamplitude-decreased rate (-)
λffrequency-increased rate (-)

References

  1. Dörfler, P.; Sick, M.; Coutu, A. Flow-Induced Pulsation and Vibration in Hydroelectric Machinery: Engineer’s Guidebook for Planning, Design and Troubleshooting; Springer: London, UK, 2013. [Google Scholar]
  2. Gabbai, R.D.; Benaroya, H. An overview of modeling and experiments of vortex-induced vibration of circular cylinders. J. Sound Vib. 2005, 282, 575–616. [Google Scholar] [CrossRef]
  3. Williamson, C.H.K.; Govardhan, R. A brief review of recent results in vortex-induced vibrations. J. Wind Eng. Ind. Aerodyn. 2008, 96, 713–735. [Google Scholar] [CrossRef]
  4. Lam, K.M.; Wei, C.T. Numerical simulation of vortex shedding from an inclined flat plate. Eng. Appl. Comput. Fluid Mech. 2010, 4, 569–579. [Google Scholar] [CrossRef] [Green Version]
  5. Vagnoli, S.; Verstraete, T.; Mateos, B.; Sieverding, C.H. Prediction of the unsteady turbine trailing edge wake flow characteristics and comparison with experimental data. Proc. Inst. Mech. Eng. Part A J. Power Energy 2015, 229, 487–497. [Google Scholar] [CrossRef]
  6. Zhou, J.; Chen, Y.; Li, D.; Zhang, Z.; Pan, W. Numerical simulation of aircraft wake vortex evolution and wake encounters based on adaptive mesh method. Eng. Appl. Comput. Fluid Mech. 2020, 14, 1445–1457. [Google Scholar] [CrossRef]
  7. Zeng, Y.; Yao, Z.; Gao, J.; Hong, Y.; Wang, F.; Zhang, F. Numerical investigation of added mass and hydrodynamic damping on a blunt trailing edge hydrofoil. J. Fluids Eng. 2019, 141, 081108. [Google Scholar] [CrossRef]
  8. Pang, L.; Lu, G.; Zhong, S.; Liu, J. Vortex shedding simulation and vibration analysis of stay vanes of hydraulic turbine. Chin. J. Mech. Eng. 2011, 47, 159–166. [Google Scholar] [CrossRef]
  9. Villegas, A.; Diez, F.J. Effect of vortex shedding in unsteady aerodynamic forces for a low Reynolds number stationary wing at low angle of attack. J. Fluids Struct. 2016, 64, 138–148. [Google Scholar] [CrossRef]
  10. Ausoni, P.; Farhat, M.; Escaler, X.; Egusquiza, E.; Avellan, F. Cavitation influence on von Kármán vortex shedding and induced hydrofoil vibrations. J. Fluids Eng. 2007, 129, 966–973. [Google Scholar] [CrossRef] [Green Version]
  11. Ausoni, P.; Farhat, M.; Avellan, F. Hydrofoil roughness effects on von Karman vortex shedding. In Proceedings of the 2nd IAHR International Meeting of the Workgroup on Cavitation and Dynamic Problems in Hydraulic Machinery and Systems, Timisoara, Romania, 24–26 October 2007. [Google Scholar]
  12. Lee, S.J.; Lee, J.H.; Suh, J.C. Numerical investigation on vortex shedding from a hydrofoil with a beveled trailing edge. Model. Simul. Eng. 2015, 2015, 9. [Google Scholar] [CrossRef] [Green Version]
  13. Donaldson, R.M. Hydraulic-turbine runner vibration. Trans. Am. Soc. Mech. Eng. 1956, 78, 1141–1144. [Google Scholar] [CrossRef]
  14. Do, T.; Chen, L.; Tu, J. Numerical study of turbulent trailing-edge flows with base cavity effects using URANS. J. Fluids Struct. 2010, 26, 1155–1173. [Google Scholar] [CrossRef]
  15. Peng, X.; Zhou, J.; Zhang, C.; Li, R.; Xu, Y.; Chen, D. An intelligent optimization method for vortex-induced vibration reducing and performance improving in a large Francis turbine. Energies 2017, 10, 1901. [Google Scholar] [CrossRef] [Green Version]
  16. Wang, S.; Wen, F.; Zhang, S.; Zhang, S.; Zhou, X. Influences of trailing boundary layer velocity profiles on wake vortex formation in a high-subsonic-turbine cascade. Proc. Inst. Mech. Eng. Part A J. Power Energy 2019, 233, 186–198. [Google Scholar] [CrossRef] [Green Version]
  17. Zobeiri, A.; Ausoni, P.; Avellan, F.; Farhat, M. How oblique trailing edge of a hydrofoil reduces the vortex-induced vibration. J. Fluids Struct. 2012, 32, 78–89. [Google Scholar] [CrossRef] [Green Version]
  18. Yao, Z.; Wang, F.; Dreyer, M.; Farhat, M. Effect of trailing edge shape on hydrodynamic damping for a hydrofoil. J. Fluids Struct. 2014, 51, 189–198. [Google Scholar] [CrossRef] [Green Version]
  19. Lee, S.G.; Park, S.J.; Lee, K.S.; Chung, C. Performance prediction of NREL (National Renewable Energy Laboratory) Phase VI blade adopting blunt trailing edge airfoil. Energy 2012, 47, 47–61. [Google Scholar] [CrossRef]
  20. Neidhardt, T.; Jung, A.; Hyneck, S.; Gummer, J. An alternative approach to the Von Karman vortex problem in modern hydraulic turbines. Hydropower Dams 2018, 3, 58–62. [Google Scholar]
  21. Xia, X.; Zhou, L.; Wang, Z.; Liu, D. Effects of trailing-edge modification of guide vanes on the wake vortices under different inflow conditions. Proc. Inst. Mech. Eng. Part A J. Power Energy 2021, 235, 1892–1901. [Google Scholar] [CrossRef]
  22. Menter, F.R.; Esch, T.; Kubacki, S. Transition modelling based on local variables. In Engineering Turbulence Modelling and Experiments 5; Elsevier Science Ltd.: Amsterdam, The Netherlands, 2002; pp. 555–564. [Google Scholar]
  23. Menter, F.R.; Langtry, R.B.; Likki, S.R.; Suzen, Y.B.; Huang, P.G.; Völker, S. A correlation-based transition model using local variables—Part I: Model formulation. J. Turbomach. 2006, 128, 413–422. [Google Scholar] [CrossRef]
  24. Courant, R.; Friedrichs, K.; Lewy, H. Über die partiellen Differenzengleichungen der mathematischen Physik. Math. Ann. 1928, 100, 32–74. [Google Scholar] [CrossRef]
  25. ANSYS Inc. CFX Theory Guide; ANSYS: Canonsburg, PA, USA, 2017. [Google Scholar]
  26. Ausoni, P. Turbulent Vortex Shedding from a Blunt Trailing Edge Hydrofoil; EPFL: Lausanne, Swtizerland, 2009. [Google Scholar]
Figure 1. Computational domain and boundary conditions.
Jmse 10 00546 g001
Figure 2. Schematic of grid elements.
Jmse 10 00546 g002
Figure 3. A C L and St based on different grids.
Jmse 10 00546 g003
Figure 4. Computational domain and boundary conditions of NACA 0009 hydrofoil.
Jmse 10 00546 g004
Figure 5. Comparison of numerical results and experimental data.
Jmse 10 00546 g005
Figure 6. Vorticity contours downstream of the hydrofoil under different α.
Jmse 10 00546 g006
Figure 7. Velocity vectors downstream of the hydrofoil under different α.
Jmse 10 00546 g007
Figure 8. Lift coefficient of the hydrofoil under different α: (a) time domain plot, (b) frequency domain plot, and (c) values of A C L and St.
Jmse 10 00546 g008
Figure 9. Effects of Uin on critical velocity ratios: (a) values of A C L and St, and (b) range of αc1 and αc2.
Jmse 10 00546 g009
Figure 10. Effects of h on critical velocity ratios: (a) values of A C L and St, and (b) range of αc1 and αc2.
Jmse 10 00546 g010
Figure 11. Schematic of trailing-edge trimming.
Jmse 10 00546 g011
Figure 12. Vorticity contours downstream of the modified hydrofoil under different α.
Jmse 10 00546 g012
Figure 13. Effectiveness of trimming under different α.
Jmse 10 00546 g013
Figure 14. Effectiveness of trimming in different ways: (a) schematic of trimming II, (b) schematic of trimming III, and (c) effectiveness of trimming with α = 1.4.
Jmse 10 00546 g014
Publisher’s Note: MDPI stays neutral with regard to jurisdictional claims in published maps and institutional affiliations.

