
Simulation of Marine Leisure Accidents Using Random-Walk Particle Tracking on Macro-Tidal Environment


Abstract
:1. Introduction
2. Background
3. Method
3.1. Sensitivity Tests to Identify Geomorphological Characteristics
3.2. Wind Effect on Particle Movement
3.3. In Situ Mannequin Tracking and Numerical Discretization
4. Results and Discussion
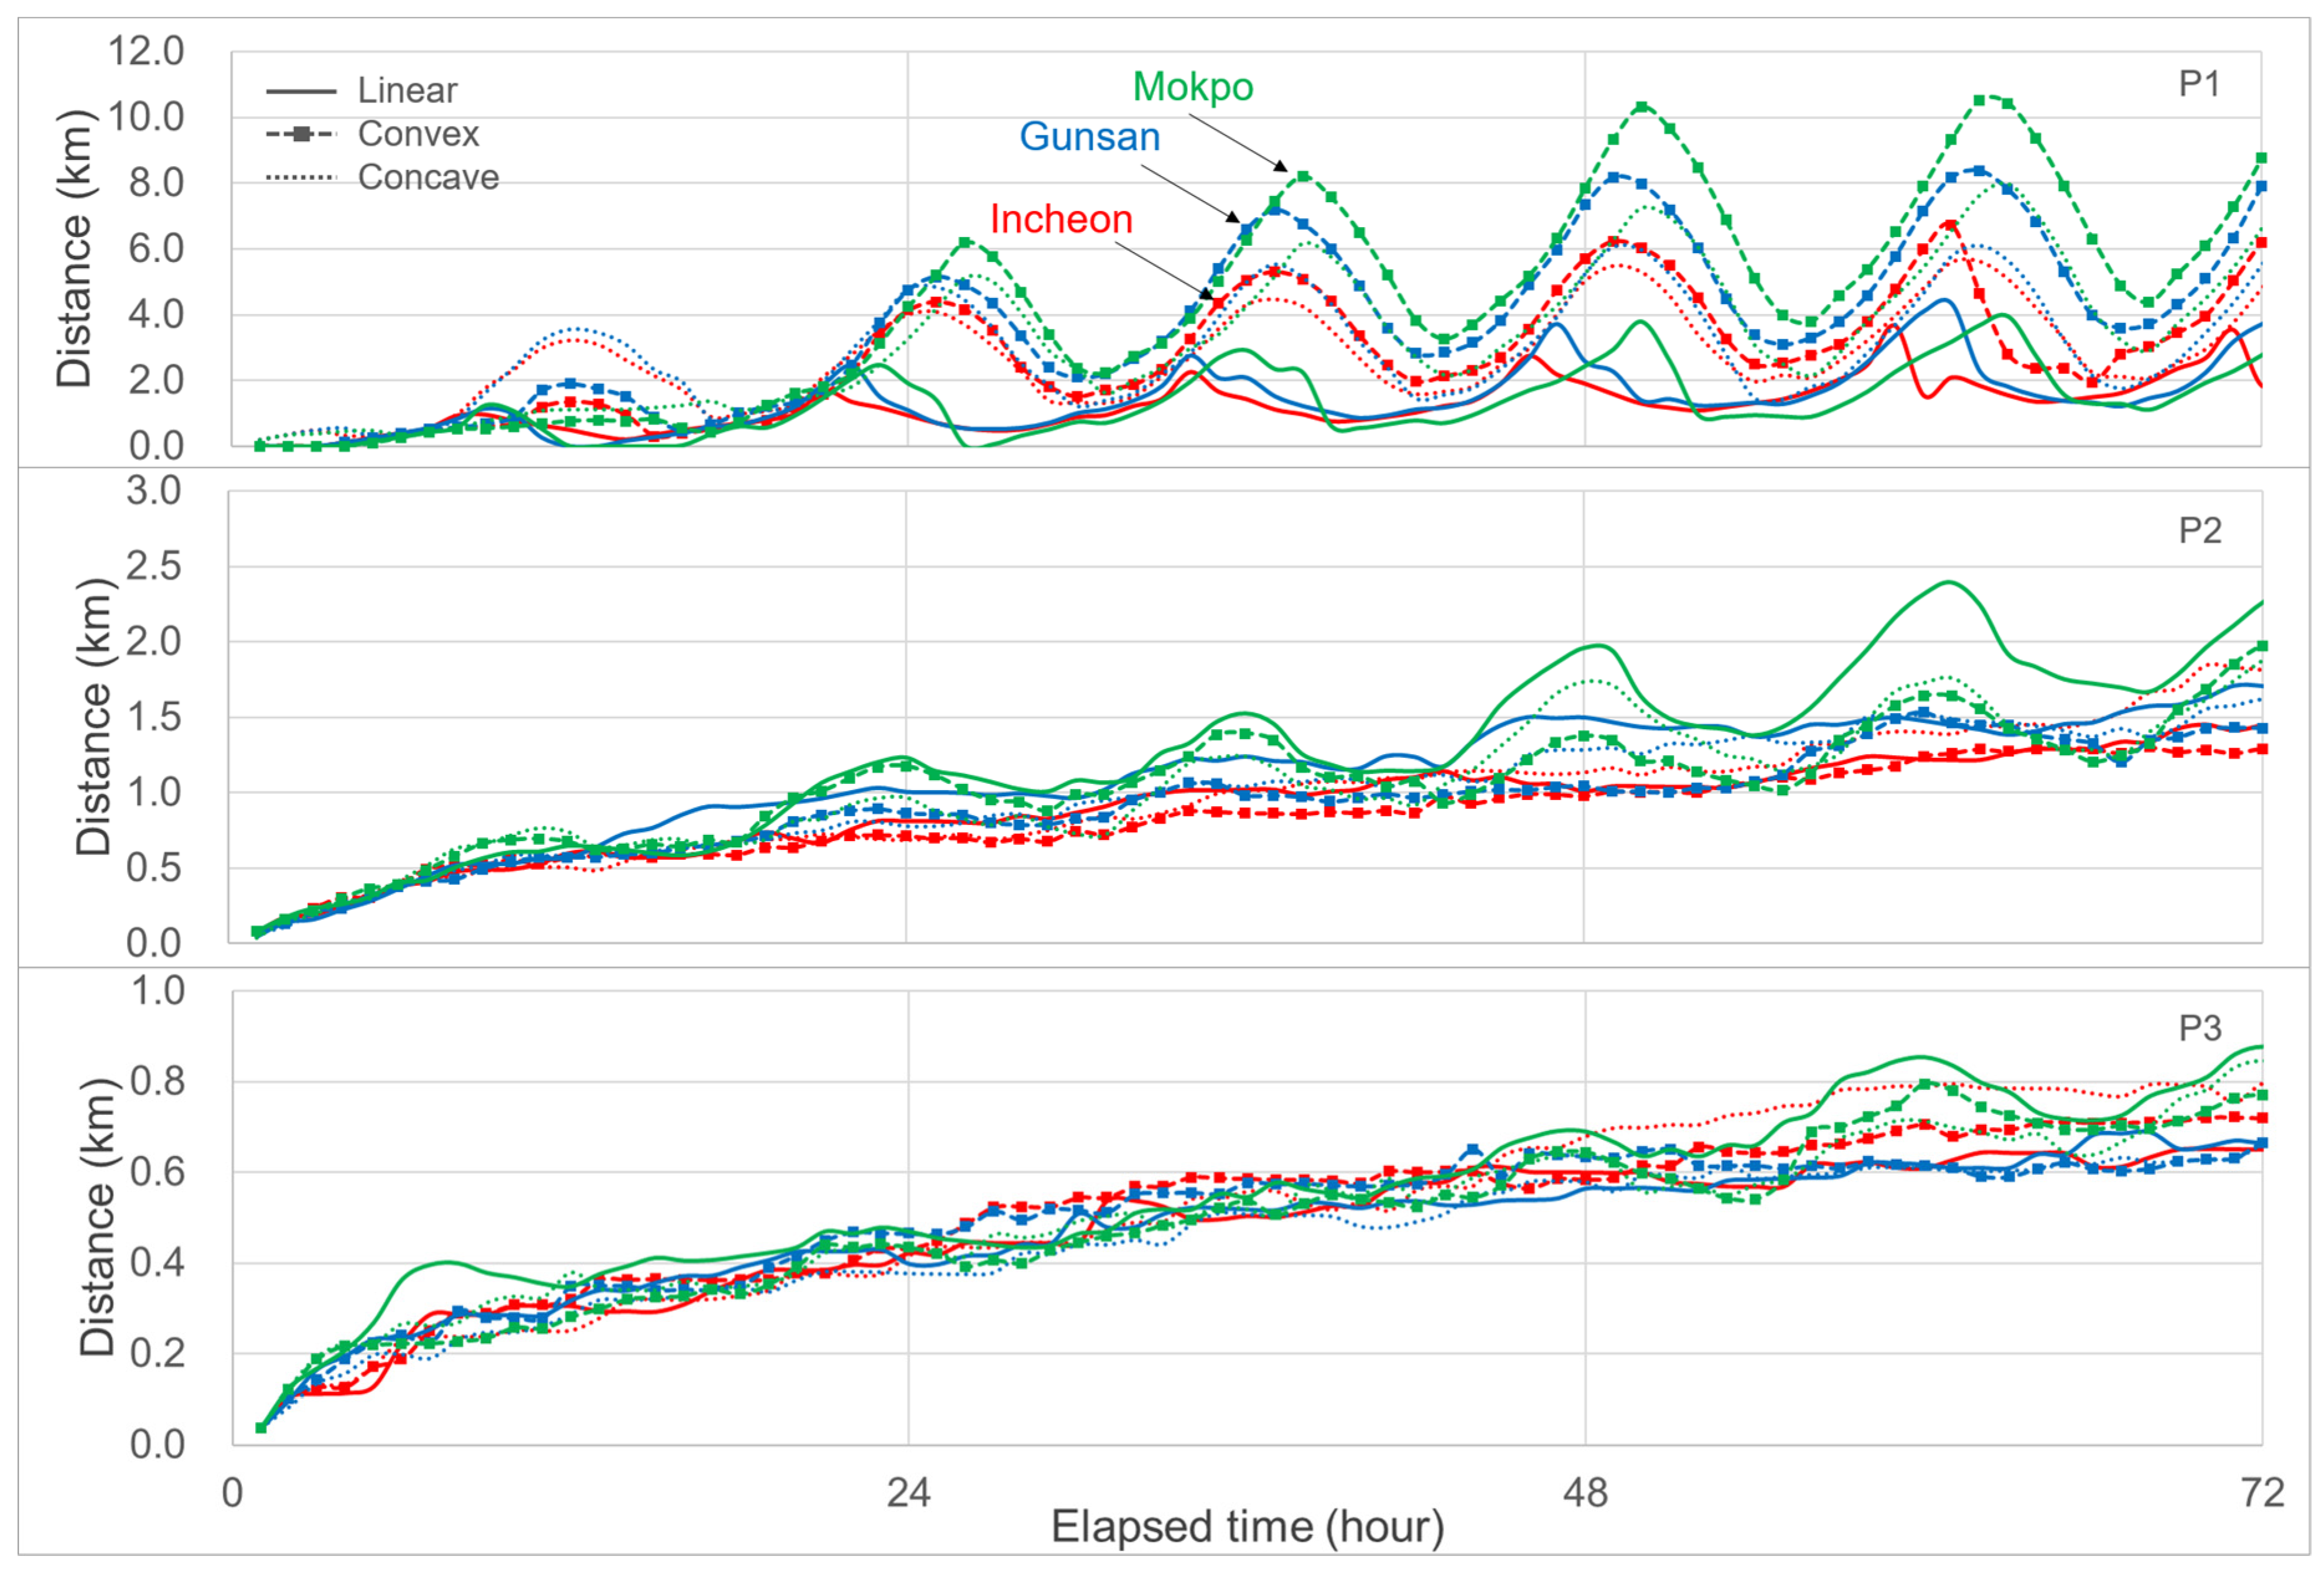
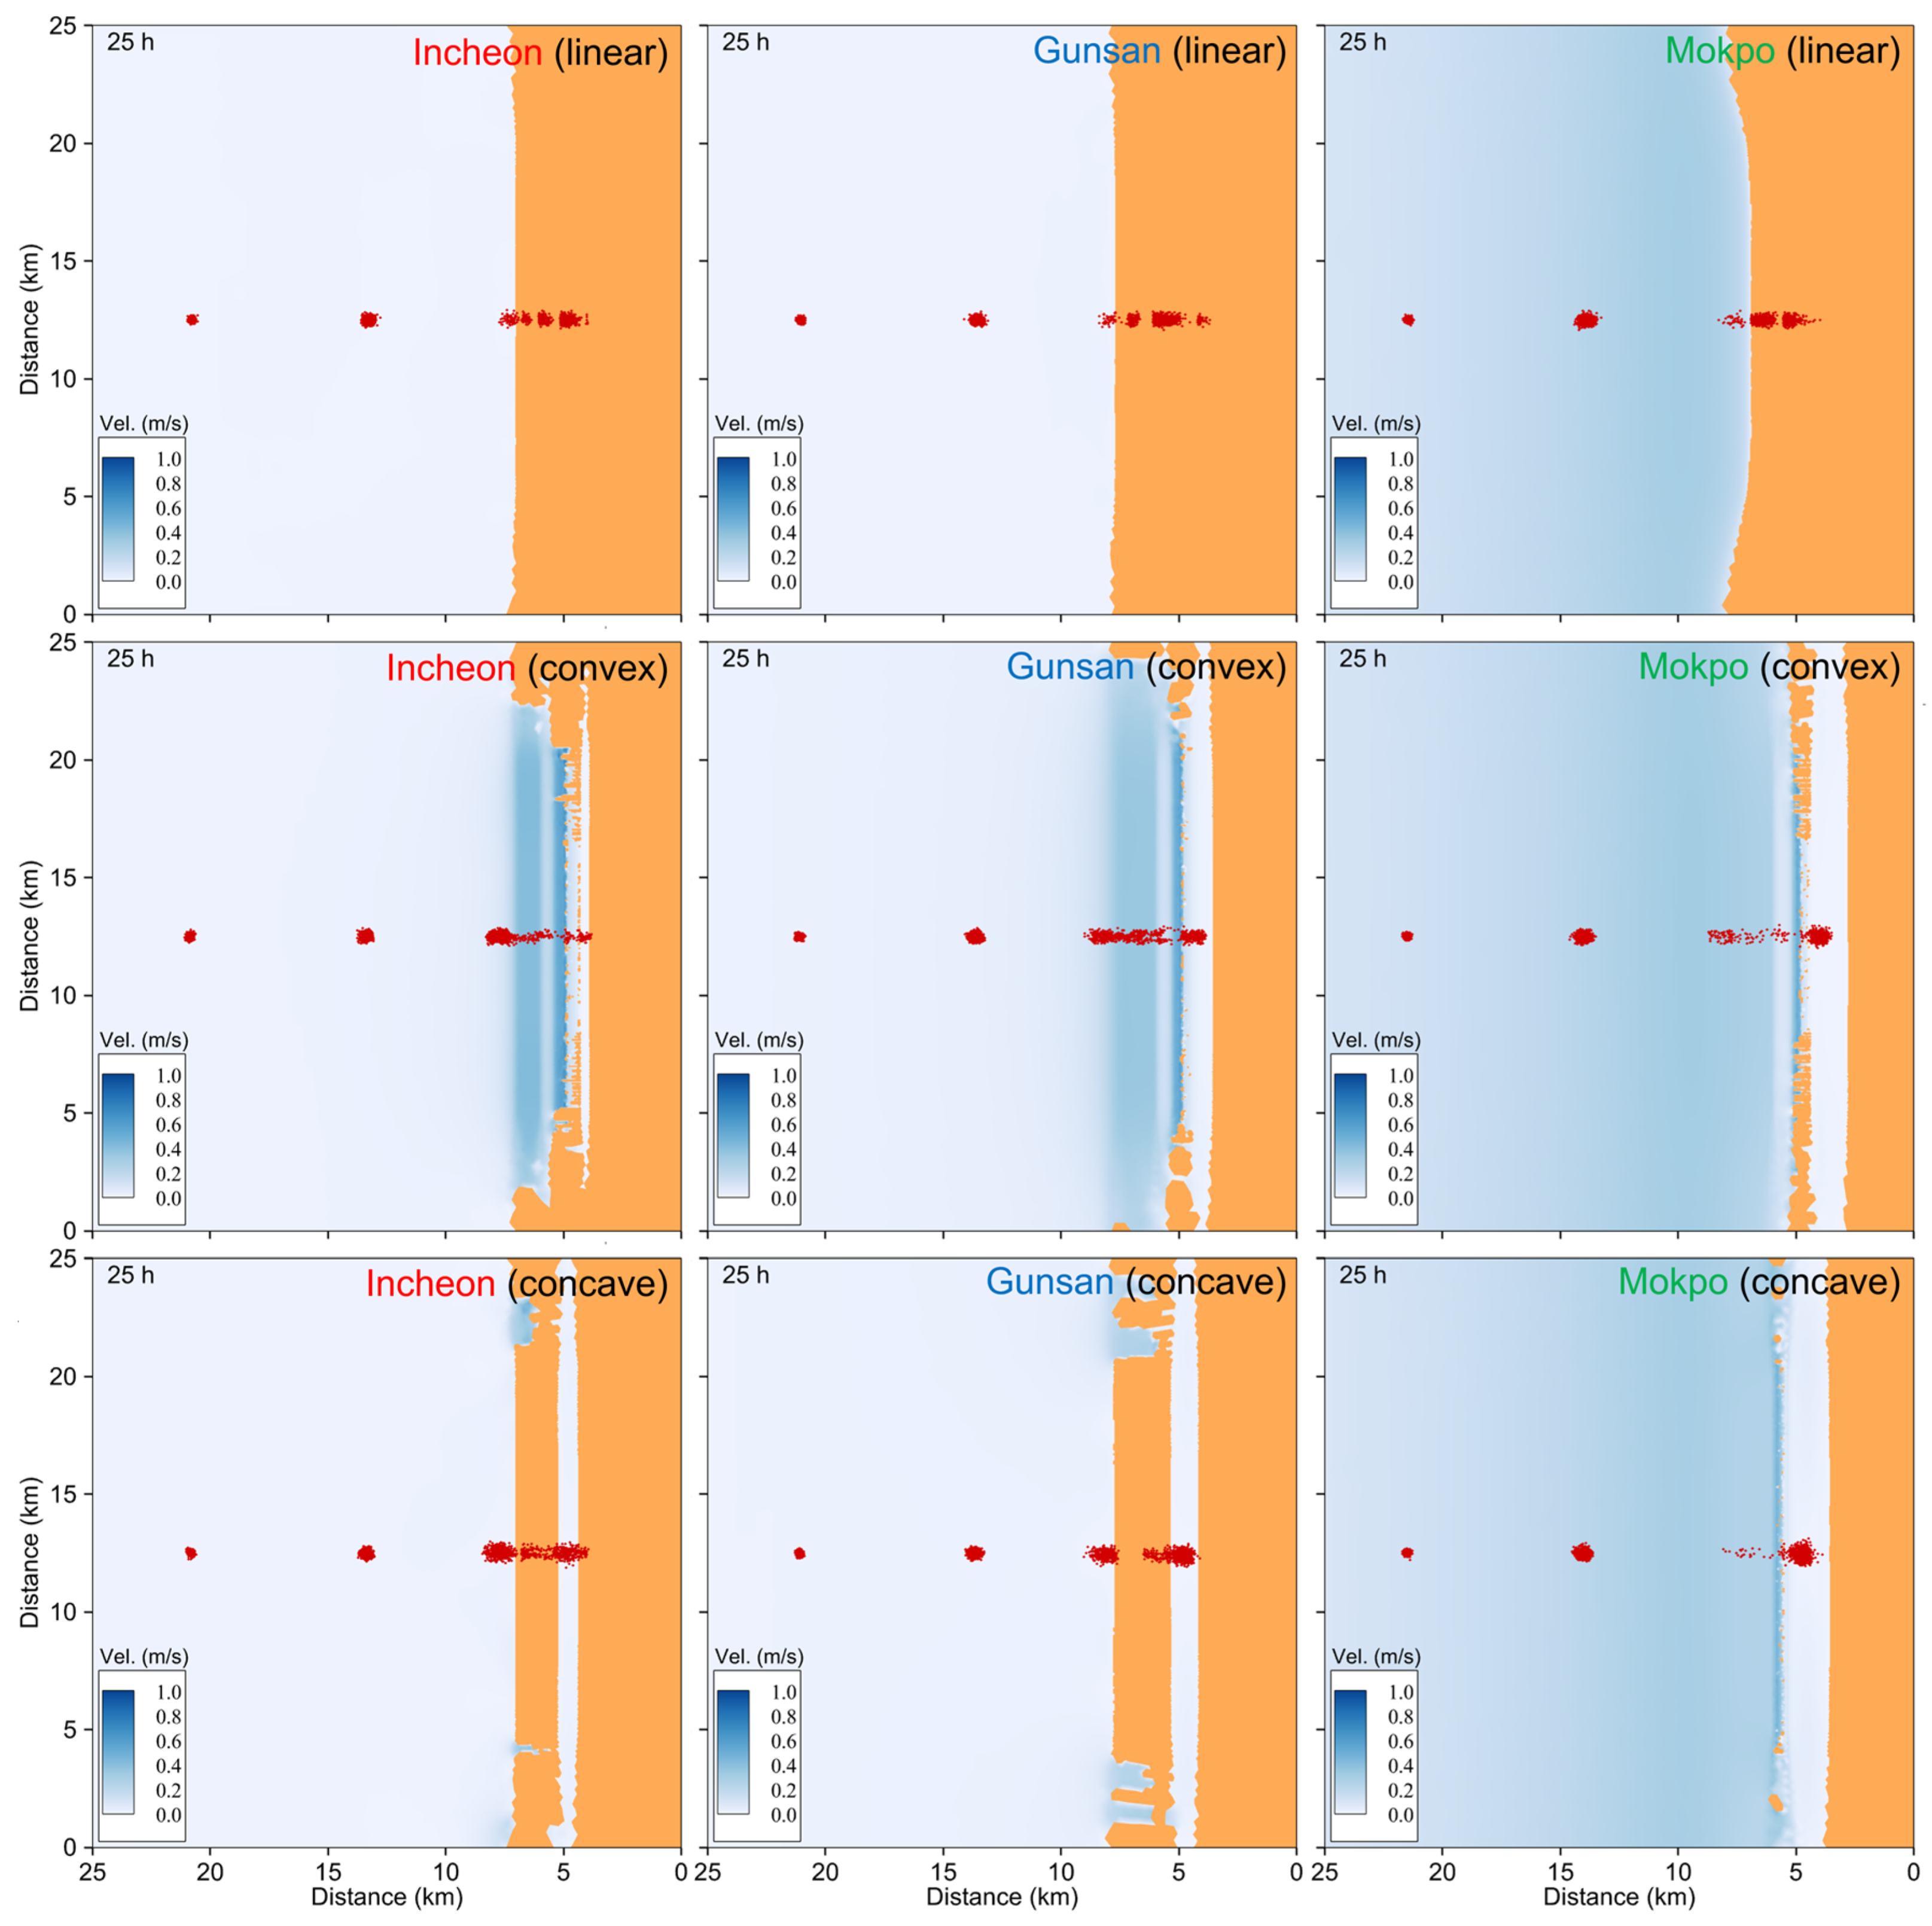
4.1. Effects of Bottom Slope and Shape in PTM
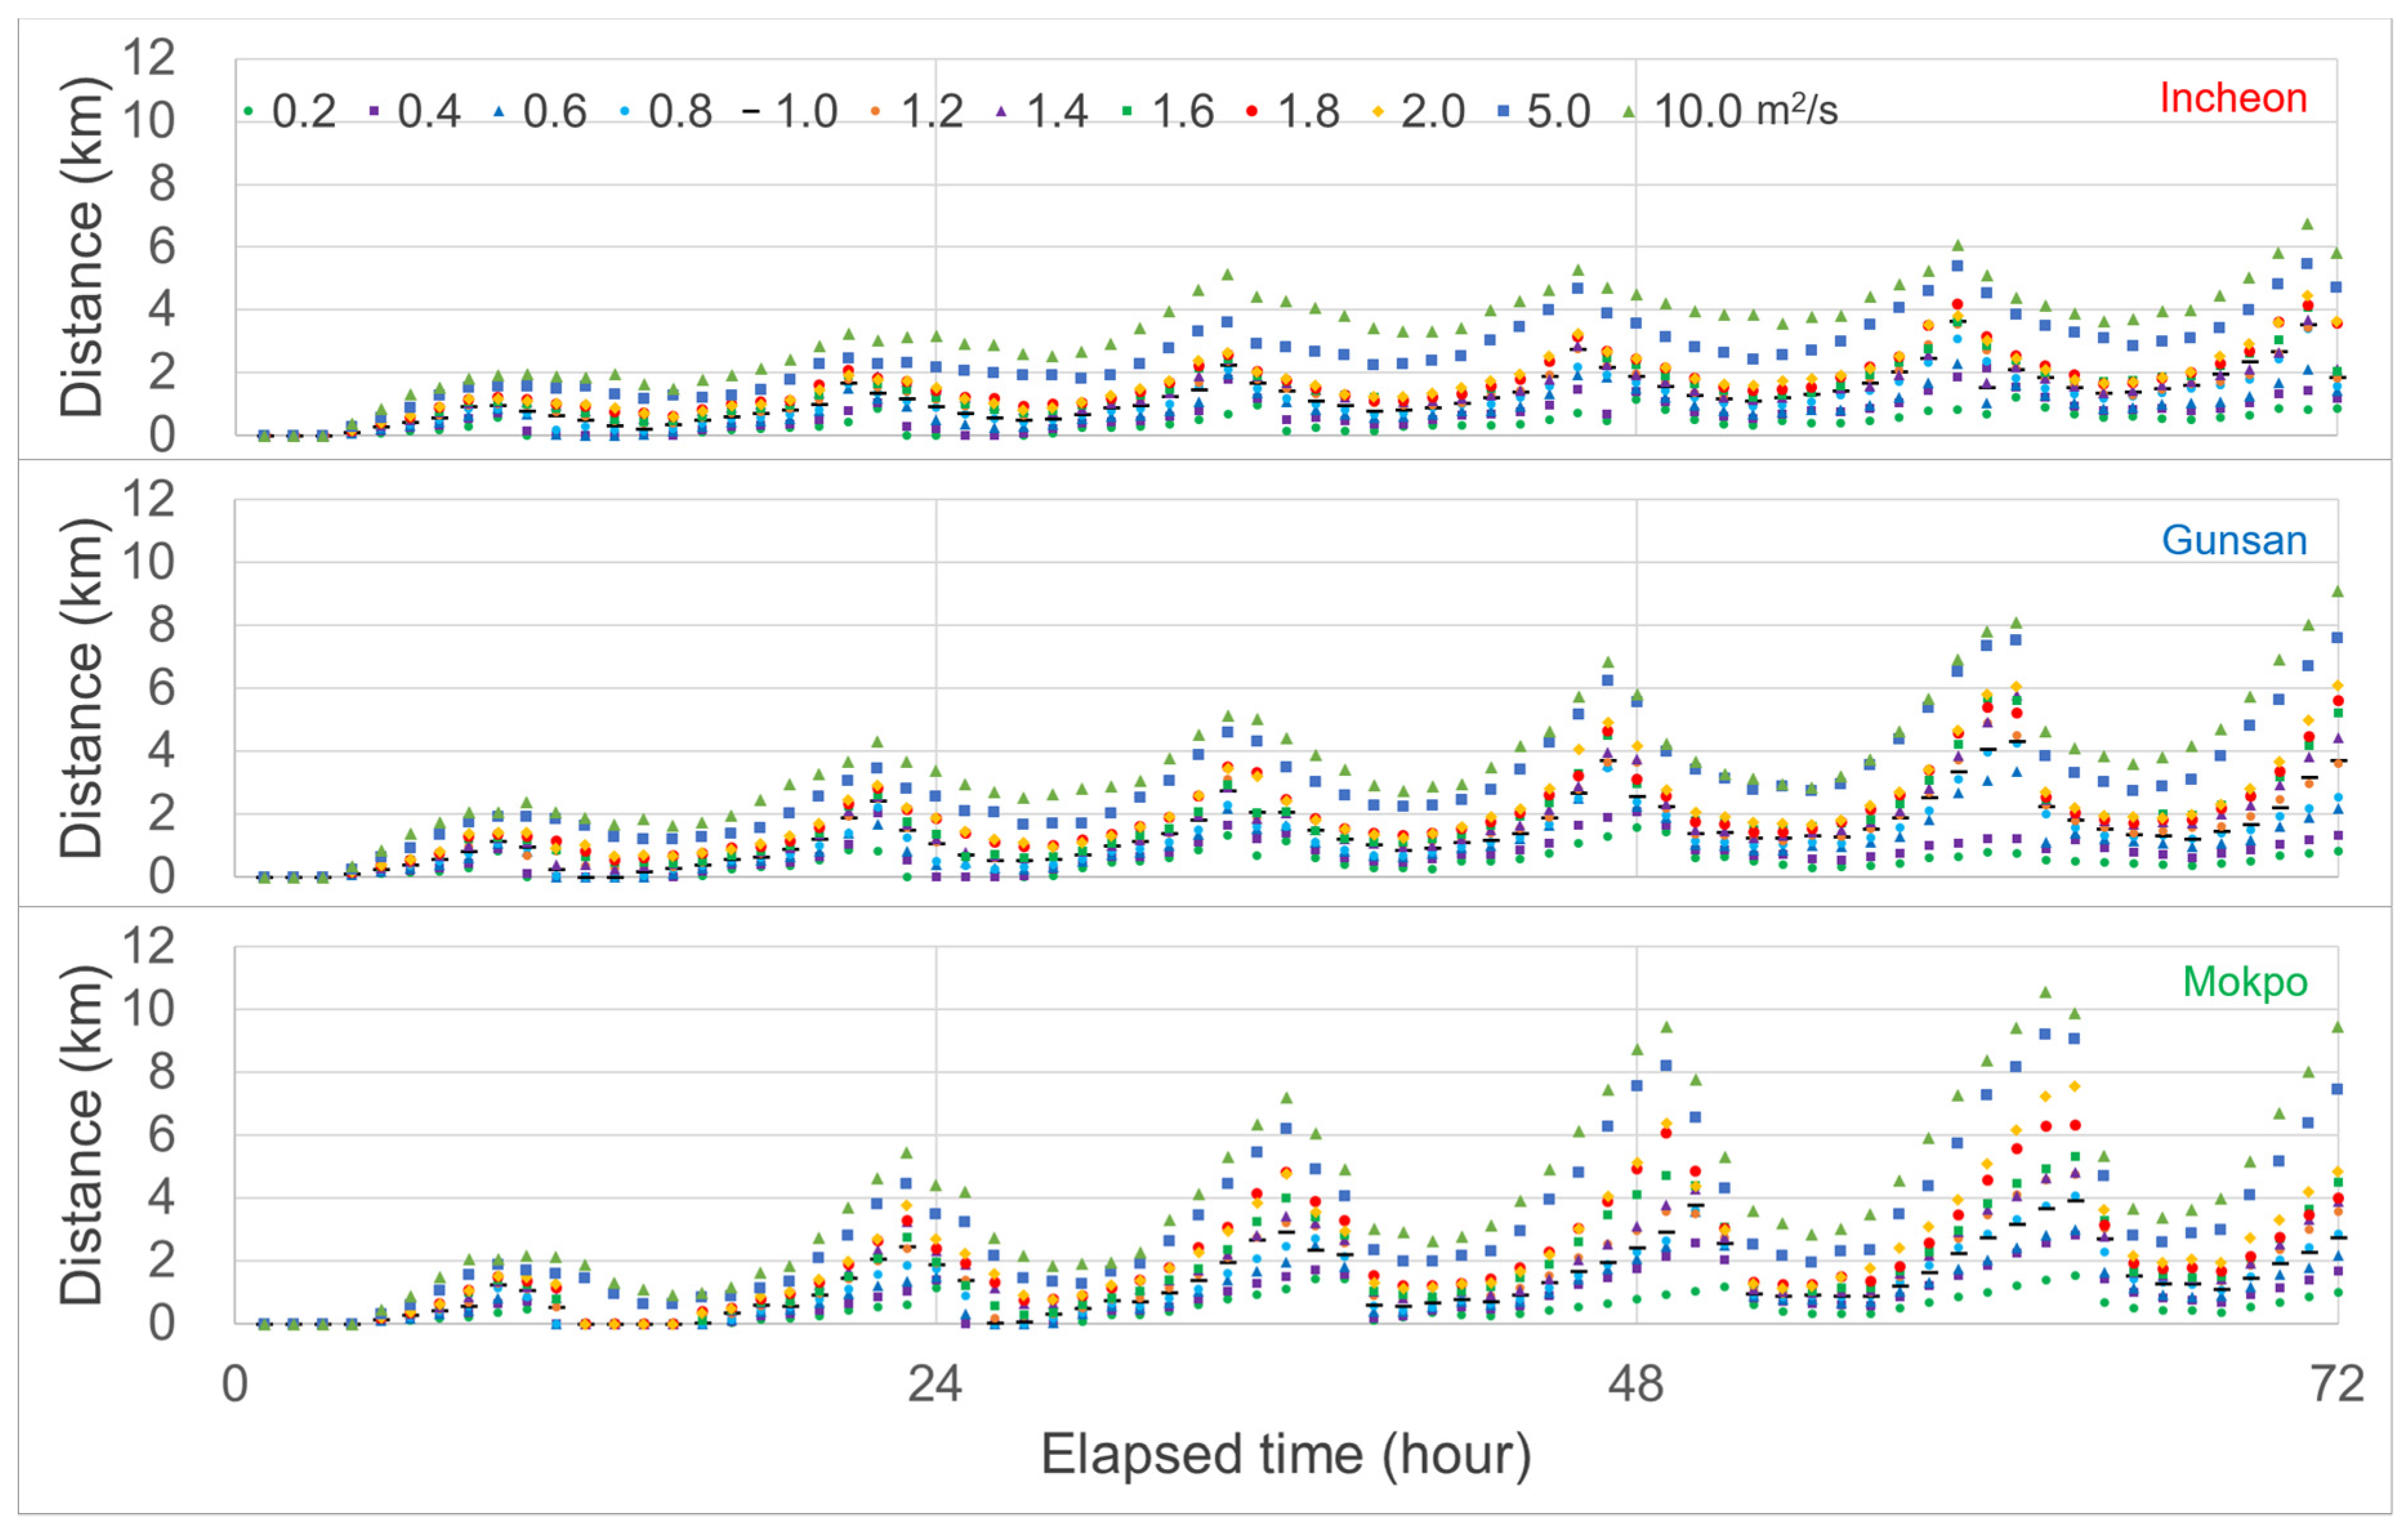
4.2. Contribution of Dispersion
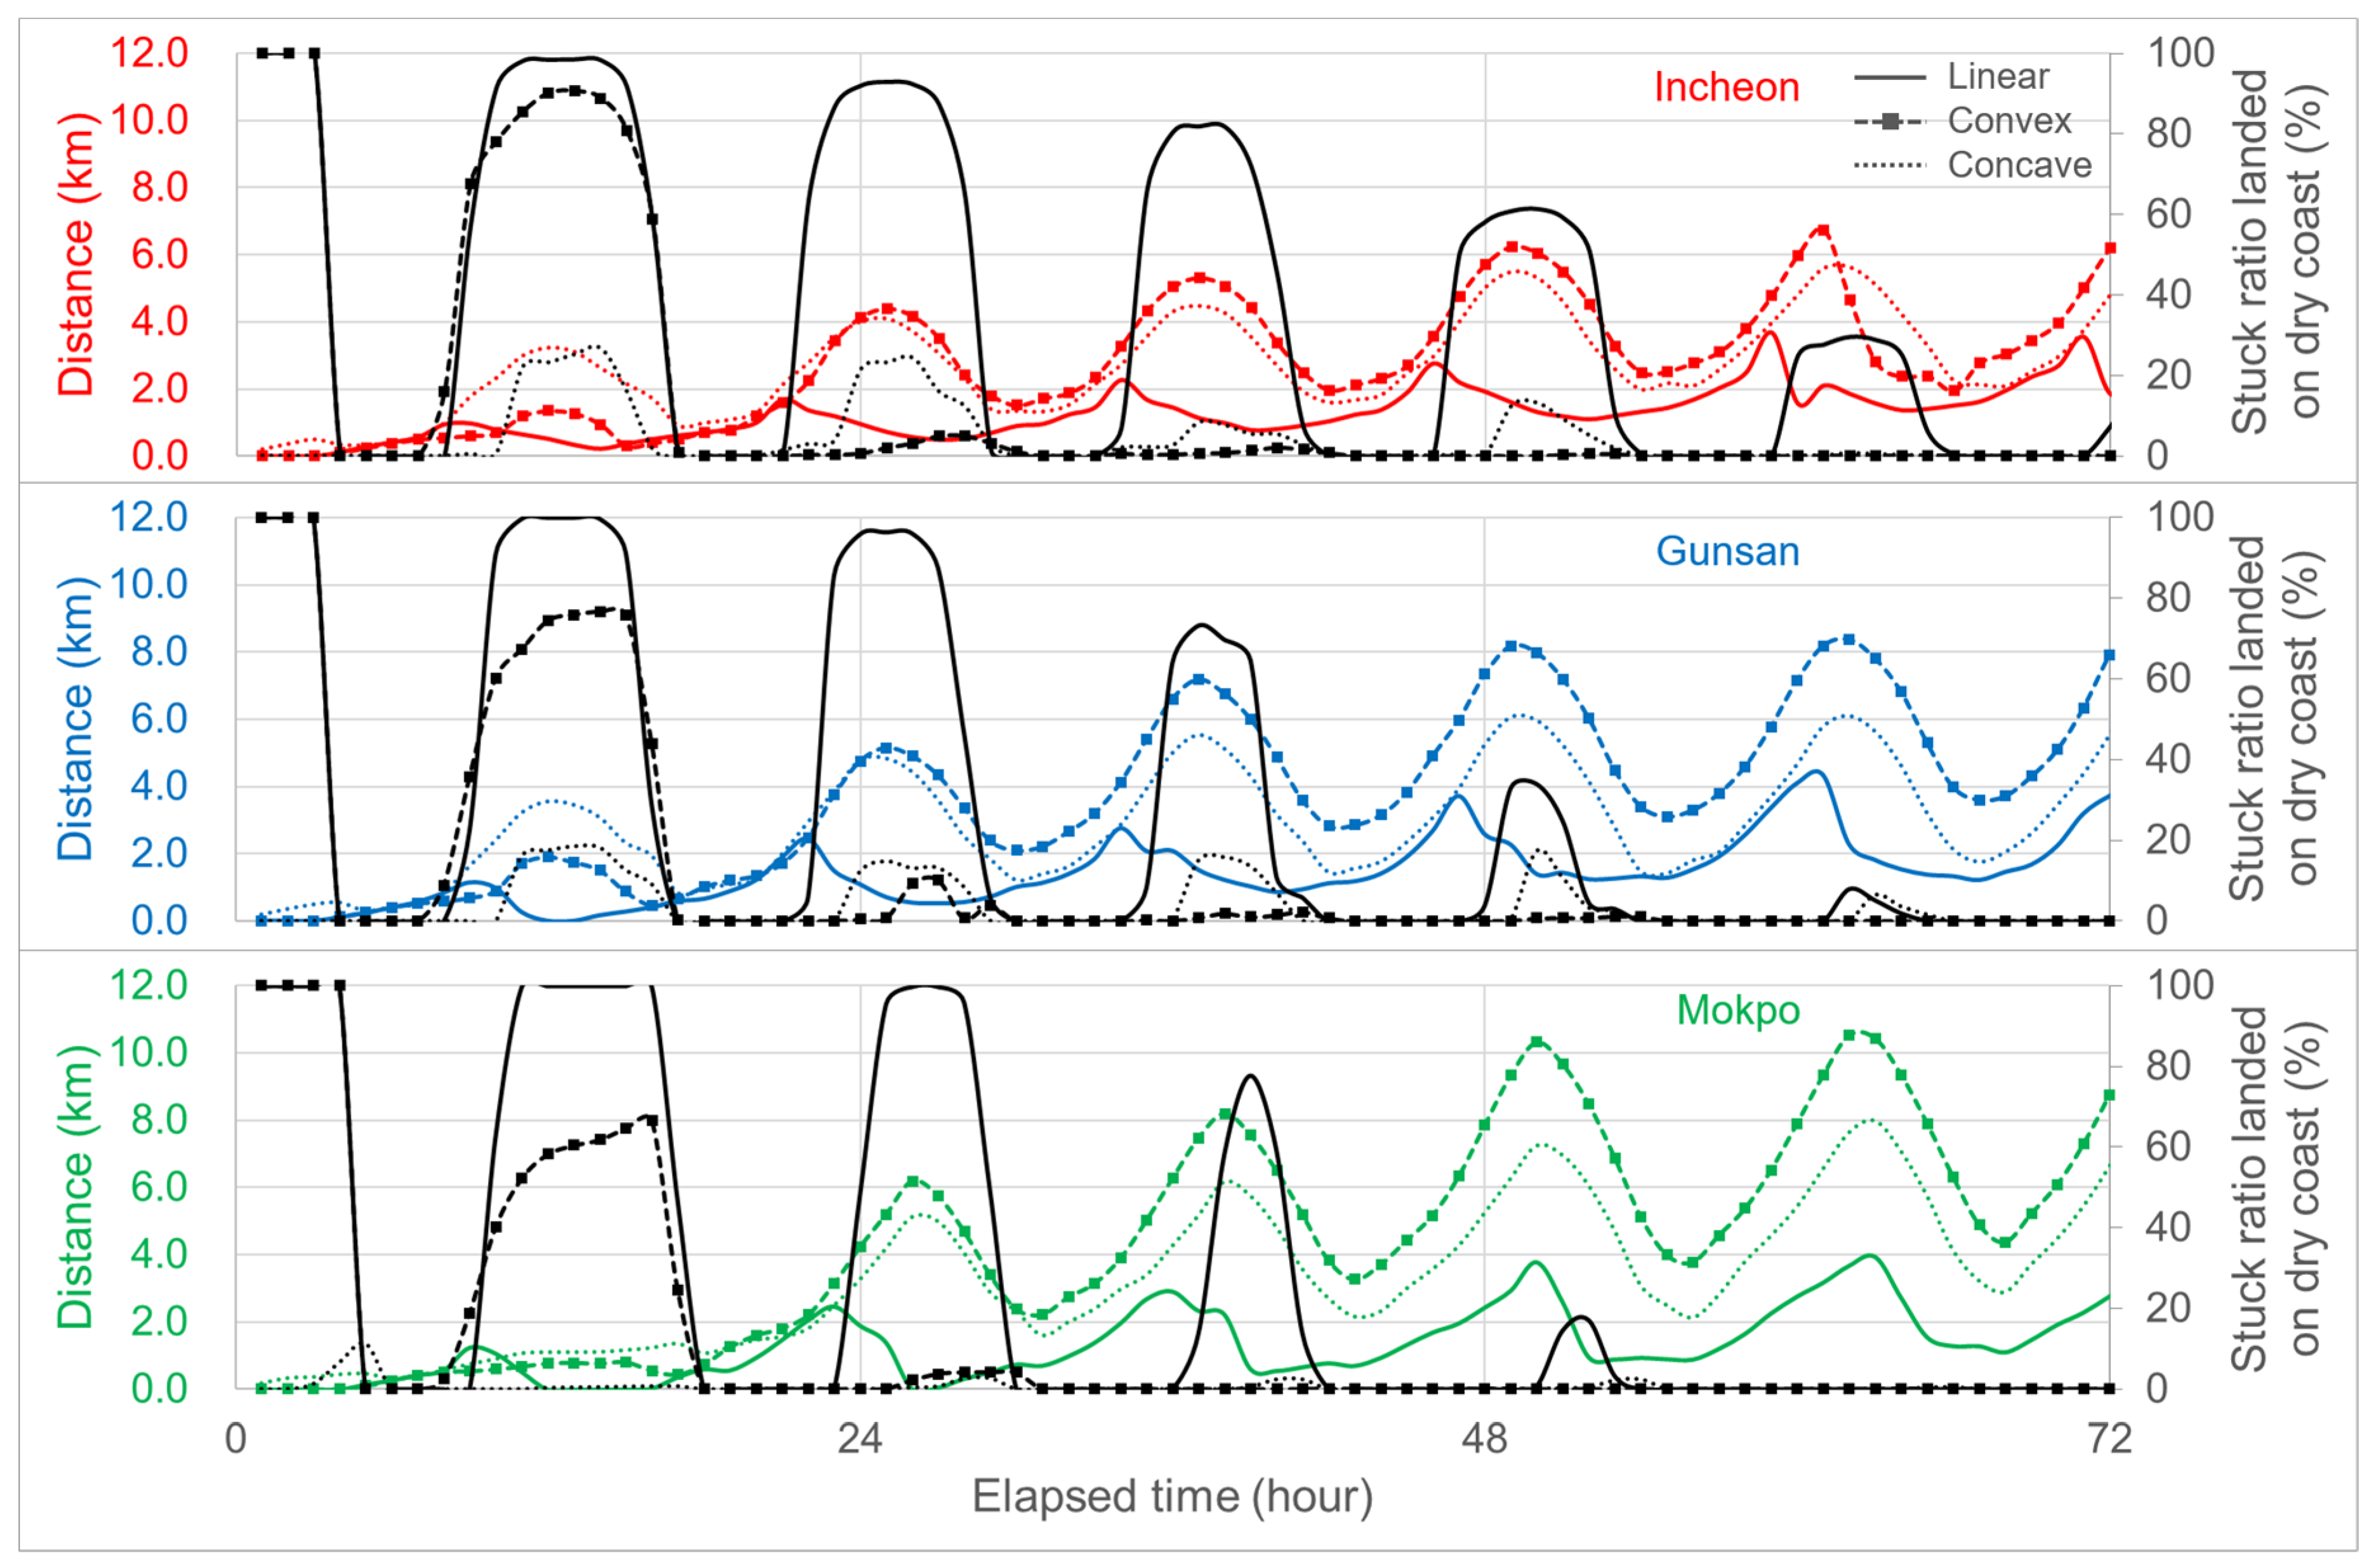
4.3. Impacts of Particle Release Location Affecting Beaching and Backwashing
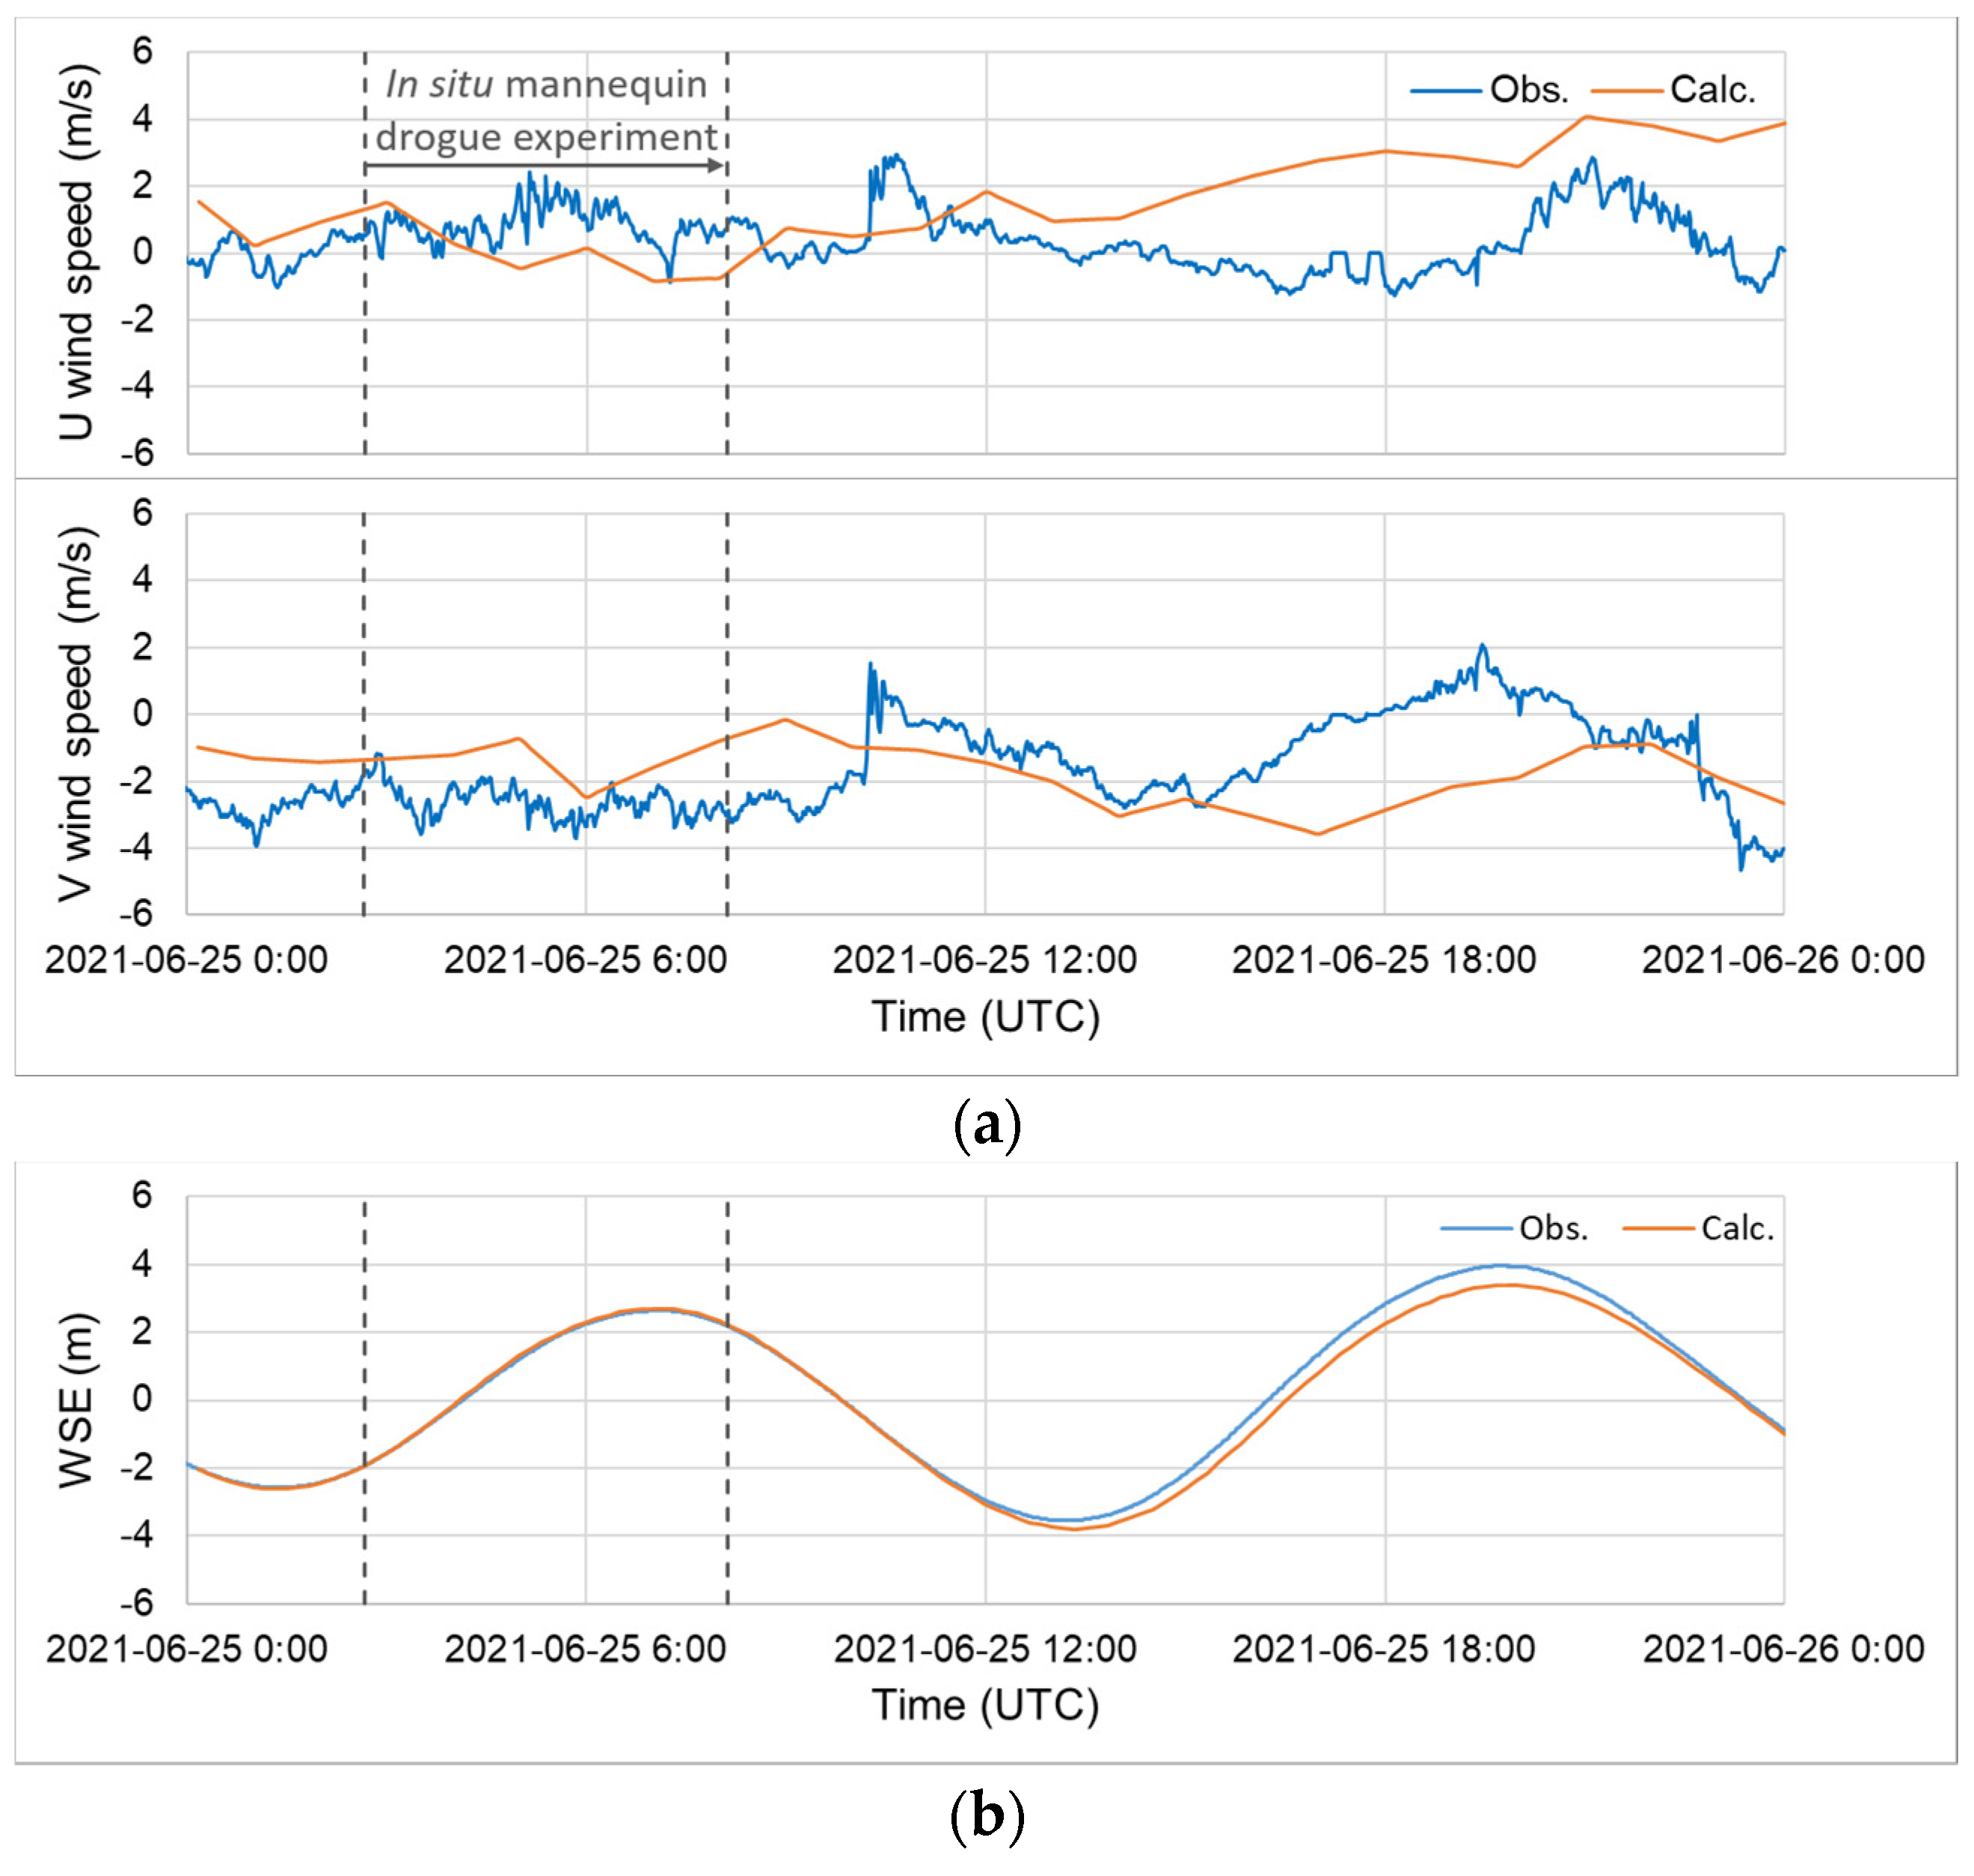
4.4. Verification of Wind and Tide for In Situ Test
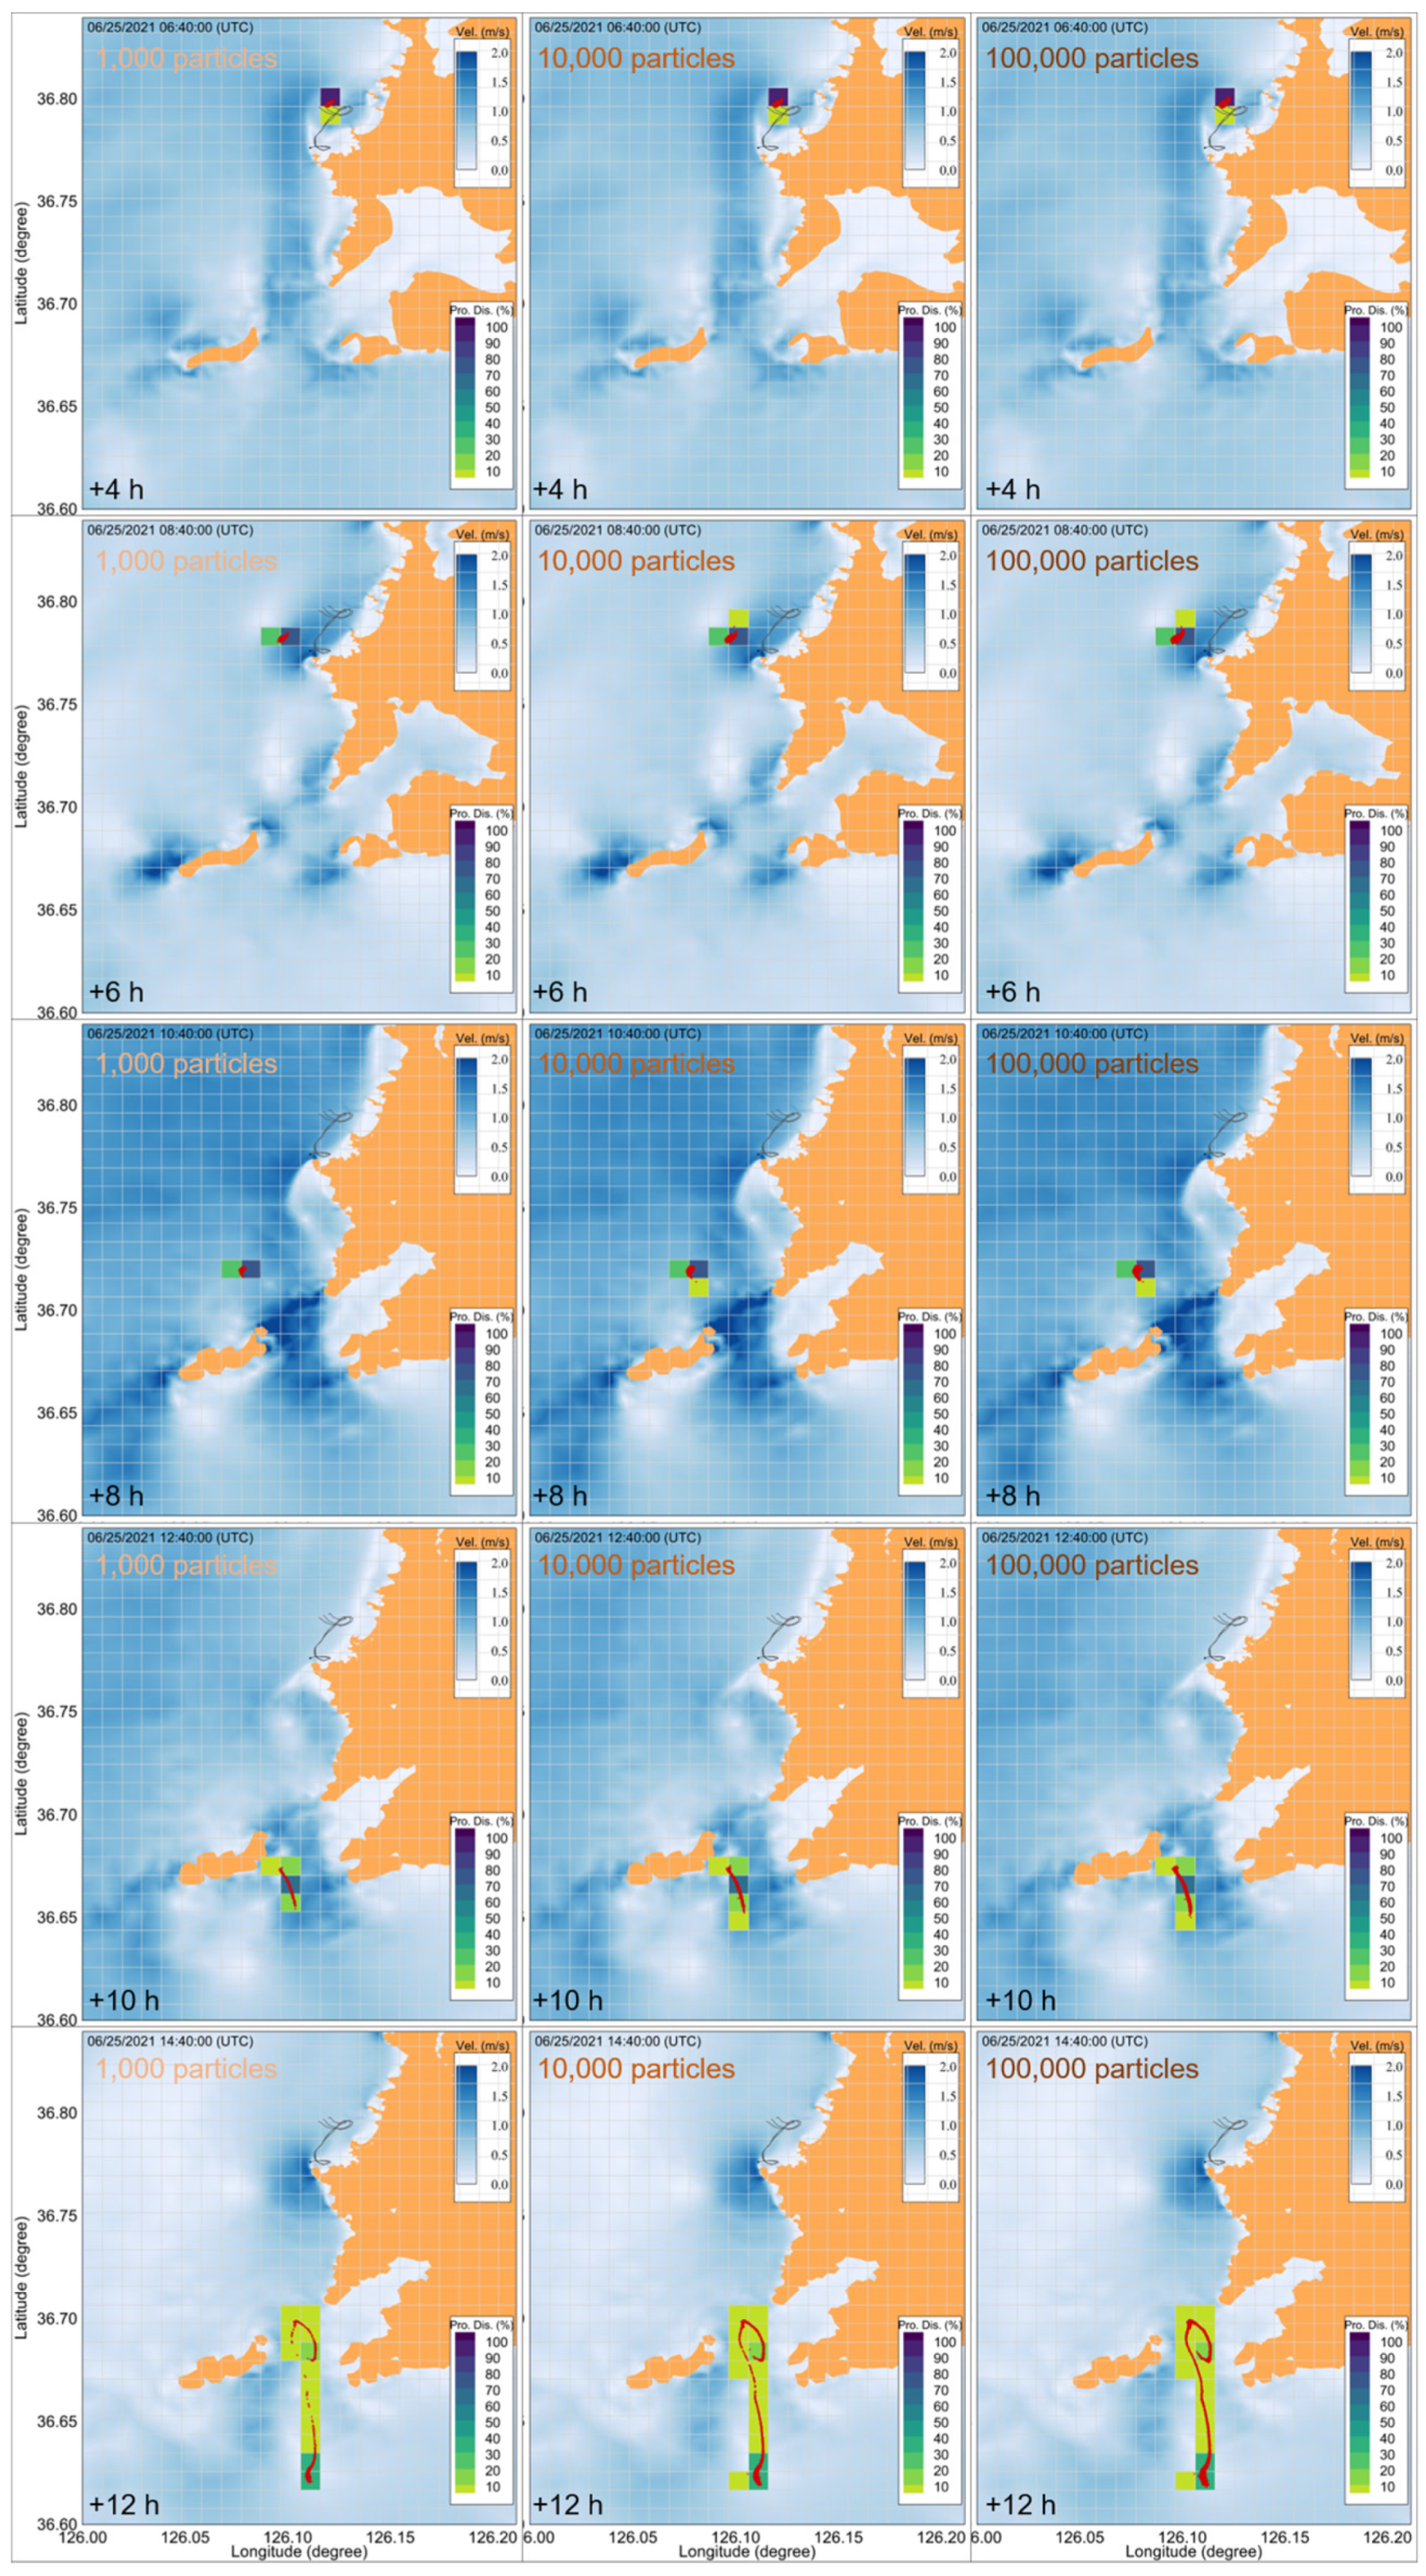
4.5. Probability in Finding Location
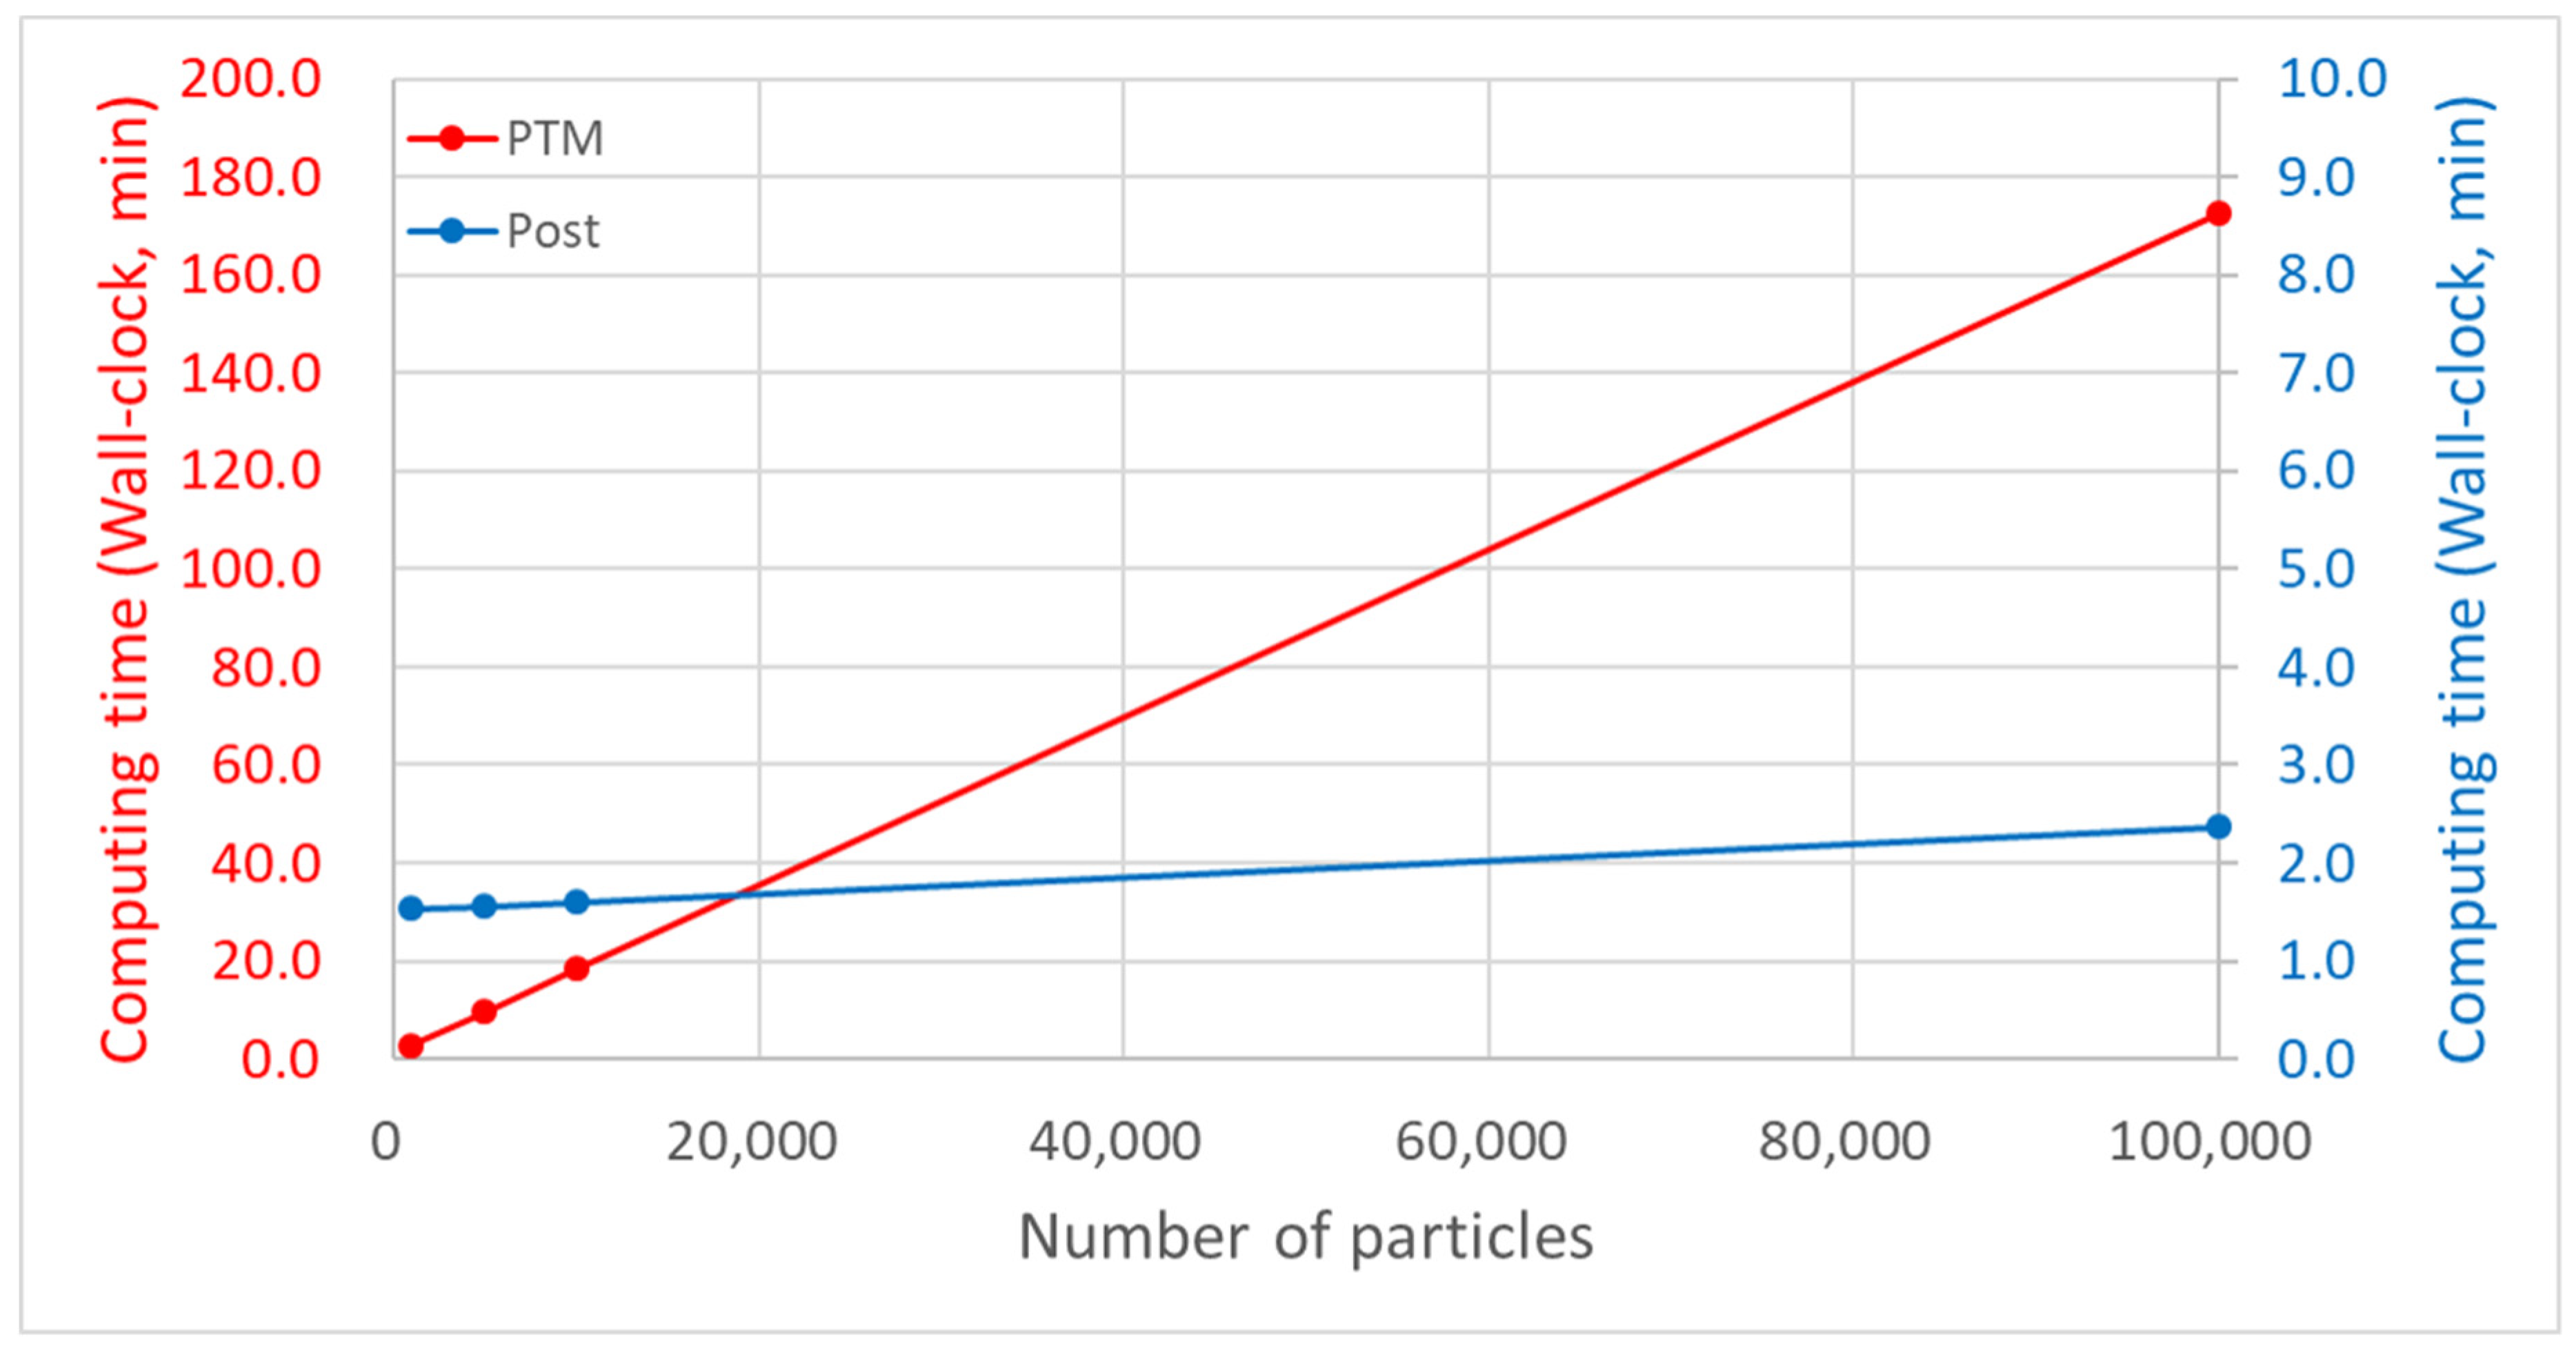
4.6. Impact of Number of Particles on Accuracy and Computing Time
4.7. Importance of Genesis Time and Location in SAR
4.8. Wind Effects
5. Conclusions and Further Study
Supplementary Materials
Author Contributions
Funding
Institutional Review Board Statement
Informed Consent Statement
Data Availability Statement
Conflicts of Interest
References
- Seo, S.-N. Digital 30sec gridded bathymetric data of Korea marginal seas—KorBathy30s. J. Korean Soc. Coast. Ocean Eng. 2008, 20, 110–120. (In Korean) [Google Scholar]
- Bilgili, A.; Proehl, J.A.; Lynch, D.R.; Smith, K.W.; Swift, M.R. Estuary/ocean exchange and tidal mixing in a Gulf of Maine Estuary: A Lagrangian modeling study. Estuar. Coast. Shelf Sci. 2005, 65, 607–624. [Google Scholar] [CrossRef]
- Büyükçelebi, B.T.; Karabay, H.; Bilgili, A. Exchange characteristics of an anthropogenically modified lagoon: An Eulerian-Lagrangian modeling case study with an emphasis on the number of particles. J. Environ. Eng. Landsc. Manag. 2021, 29, 251–262. [Google Scholar] [CrossRef]
- Eichhorn, M.; Haertel, A. A debris backwards flow simulation system for Malaysia airlines flight 370. In Proceedings of the OCEANS 2016, Shanghai, China, 10–13 April 2016. [Google Scholar] [CrossRef] [Green Version]
- Kim, T.H.; Yang, C.S.; Oh, J.H.; Ouchi, K. Analysis of the contribution of wind drift factor to oil slick movement under strong tidal condition: Hebei Spirit oil spill case. PLoS ONE 2014, 9, e87393. [Google Scholar] [CrossRef]
- Jung, T.S. Numerical simulation of spilled oil dispersion in Taean coastal zone. J. Korean Soc. Mar. Environ. Energy 2009, 12, 264–272. (In Korean) [Google Scholar]
- Dietrich, J.C.; Trahan, C.J.; Howard, M.T.; Fleming, J.G.; Weaver, R.J.; Tanaka, S.; Yu, L.; Luettich, R.A.; Dawson, C.N.; Westerink, J.J.; et al. Surface trajectories of oil transport along the Northern Coastline of the Gulf of Mexico. Cont. Shelf Res. 2012, 41, 17–47. [Google Scholar] [CrossRef]
- Xiong, W.; Van Gelder, P.H.A.J.M.; Yang, K. A decision support method for design and operationalization of search and rescue in maritime emergency. Ocean Eng. 2020, 207, 107399. [Google Scholar] [CrossRef]
- Otote, D.A.; Li, B.; Ai, B.; Gao, S.; Xu, J.; Chen, X.; Lv, G. A decision-making algorithm for maritime search and rescue plan. Sustainability 2019, 11, 2084. [Google Scholar] [CrossRef] [Green Version]
- Mou, J.; Hu, T.; Chen, P.; Chen, L. Cooperative MASS path planning for marine man overboard search. Ocean Eng. 2021, 235, 109376. [Google Scholar] [CrossRef]
- Ličer, M.; Estival, S.; Reyes-Suarez, C.; Deponte, D.; Fettich, A. Lagrangian modelling of a person lost at sea during the Adriatic scirocco storm of 29 October 2018. Nat. Hazards Earth Syst. Sci. 2020, 20, 2335–2349. [Google Scholar] [CrossRef]
- Suh, S.-W.; Lee, H.-Y. Analysis of hydrodynamic change around the Saemangeum area using a particle tracking method. J. Korean Soc. Coast. Ocean Eng. 2011, 23, 442–450. [Google Scholar] [CrossRef] [Green Version]
- Suh, S.-W. A hybrid approach to particle tracking and Eulerian–Lagrangian models in the simulation of coastal dispersion. Environ. Model. Softw. 2006, 21, 234–242. [Google Scholar] [CrossRef]
- Simons, R.D.; Siegel, D.A.; Brown, K.S. Model sensitivity and robustness in the estimation of larval transport: A study of particle tracking parameters. J. Mar. Syst. 2013, 119–120, 19–29. [Google Scholar] [CrossRef]
- George, G.; Vethamony, P.; Sudheesh, K.; Babu, M.T. Fish larval transport in a macro-tidal regime: Gulf of Kachchh, west coast of India. Fish. Res. 2011, 110, 160–169. [Google Scholar] [CrossRef]
- Hinata, H.; Sagawa, N.; Kataoka, T.; Takeoka, H. Numerical modeling of the beach process of marine plastics: A probabilistic and diagnostic approach with a particle tracking method. Mar. Pollut. Bull. 2020, 152, 110910. [Google Scholar] [CrossRef] [PubMed]
- Seo, S.; Park, Y.-G. Destination of floating plastic debris released from ten major rivers around the Korean Peninsula. Environ. Int. 2020, 138, 105655. [Google Scholar] [CrossRef] [PubMed]
- Yoon, J.-H.; Kawano, S.; Igawa, S. Modeling of marine litter drift and beaching in the Japan Sea. Mar. Pollut. Bull. 2010, 60, 448–463. [Google Scholar] [CrossRef]
- Isobe, A.; Kako, S.; Chang, P.-H.; Matsuno, T. Two-way particle-tracking model for specifying sources of drifting objects: Application to the East China Sea Shelf. J. Atmos. Ocean. Technol. 2009, 26, 1672–1682. [Google Scholar] [CrossRef]
- Mohtar, S.E.; Hoteit, I.; Knio, O.; Issa, L.; Lakkis, I. Lagrangian tracking in stochastic fields with application to an ensemble of velocity fields in the Red Sea. Ocean Modell. 2018, 131, 1–14. [Google Scholar] [CrossRef] [Green Version]
- Allen, A.; Roth, J.-C.; Maisondieu, C.; Breivik, Ø.; Forest, B. Field Determination of the Leeway of Drifting Objects, The Leeway of a 20-ft Container, WWII Mine, Skiff, Sunfish, and a PIW in the Deceased Position; Norwegian Meteorological Institute: Fedje, Norway; Andfjord, Norway, 2010; p. 43. [Google Scholar]
- Kako, S.; Isobe, A.; Seino, S.; Kojima, A. Inverse estimation of drifting-object outflows using actual observation data. J. Oceanogr. 2010, 66, 291–297. [Google Scholar] [CrossRef]
- Breivik, Ø.; Allen, A.A.; Maisondieu, C.; Roth, J.C. Wind-induced drift of objects at sea: The leeway field method. Appl. Ocean Res. 2011, 33, 100–109. [Google Scholar] [CrossRef] [Green Version]
- Brushett, B.A.; Allen, A.A.; Futch, V.C.; King, B.A.; Lemckert, C.J. Determining the leeway drift characteristics of tropical Pacific island craft. Appl. Ocean Res. 2014, 44, 92–101. [Google Scholar] [CrossRef] [Green Version]
- Brushett, B.A.; Allen, A.A.; King, B.A.; Lemckert, C.J. Application of leeway drift data to predict the drift of panga skiffs: Case study of maritime search and rescue in the tropical pacific. Appl. Ocean Res. 2017, 67, 109–124. [Google Scholar] [CrossRef]
- Richardson, P.L. Drifting in the wind: Leeway error in shipdrift data. Deep Sea Res. Part I Oceanogr. Res. Pap. 1997, 44, 1877–1903. [Google Scholar] [CrossRef]
- Zhang, J.; Teixeira, Â.P.; Soares, C.G.; Yan, X. Probabilistic modelling of the drifting trajectory of an object under the effect of wind and current for maritime search and rescue. Ocean Eng. 2017, 129, 253–264. [Google Scholar] [CrossRef]
- Korea Research Institute of Ships & Ocean Engineering (KRISO). Understanding of Floating Marine Litter Distribution in the NOWPAP Region; Korea Research Institute of Ships & Ocean Engineering: Deajeon, Korea, 2017; p. 58. [Google Scholar]
- Critchell, K.; Grech, A.; Schlaefer, J.; Andutta, F.P.; Lambrechts, J.; Wolanski, E.; Hamann, M. Modelling the fate of marine debris along a complex shoreline: Lessons from the Great Barrier Reef. Estuar. Coast. Shelf Sci. 2015, 167, 414–426. [Google Scholar] [CrossRef] [Green Version]
- Luettich, J.R.; Westerink, J.; Scheffner, N. ADCIRC: An Advanced Three-Dimensional Circulation Model for Shelves, Coasts, and Estuaries. Report 1. Theory and Methodology of ADCIRC-2DDI and ADCIRC-3DL; Department of the Army US Army Corps of Engineers: Washington, DC, USA, 1992; p. 137. [Google Scholar]
- Suh, S.-W.; Lee, H.-Y.; Kim, H.-J.; Fleming, J.G. An efficient early warning system for typhoon storm surge based on time-varying advisories by coupled ADCIRC and SWAN. Ocean Dyn. 2015, 65, 617–646. [Google Scholar] [CrossRef]
- Salamon, P.; Fernàndez-Garcia, D.; Gómez-Hernández, J.J. A review and numerical assessment of the random walk particle tracking method. J. Contam. Hydrol. 2006, 87, 277–305. [Google Scholar] [CrossRef] [PubMed]
- Suh, S.-W.; Lee, H.-Y.; Kim, H.-J. Spatio-temporal variability of tidal asymmetry due to multiple coastal constructions along the West Coast of Korea. Estuar. Coast. Shelf Sci. 2014, 151, 336–346. [Google Scholar] [CrossRef]
- Matsumoto, K.; Takanezawa, T.; Ooe, M. Ocean tide models developed by assimilating TOPEX/POSEIDON altimeter data into hydrodynamical model: A global model and a regional model around Japan. J. Oceanogr. 2000, 56, 567–581. [Google Scholar] [CrossRef]
- Jalón-Rojas, I.; Wang, X.H.; Fredj, E. A 3D numerical model to Track Marine Plastic Debris (TrackMPD): Sensitivity of microplastic trajectories and fates to particle dynamical properties and physical processes. Mar. Pollut. Bull. 2019, 141, 256–272. [Google Scholar] [CrossRef] [PubMed]
- Hammoud, M.A.E.R.; Lakkis, I.; Knio, O.; Hoteit, I. Moving source identification in an uncertain marine flow: Mediterranean Sea application. Ocean Eng. 2021, 220, 108435. [Google Scholar] [CrossRef]
- Ai, B.; Li, B.; Gao, S.; Xu, J.; Shang, H. An intelligent decision algorithm for the generation of maritime search and rescue emergency response plans. IEEE Access 2019, 7, 155835–155850. [Google Scholar] [CrossRef]


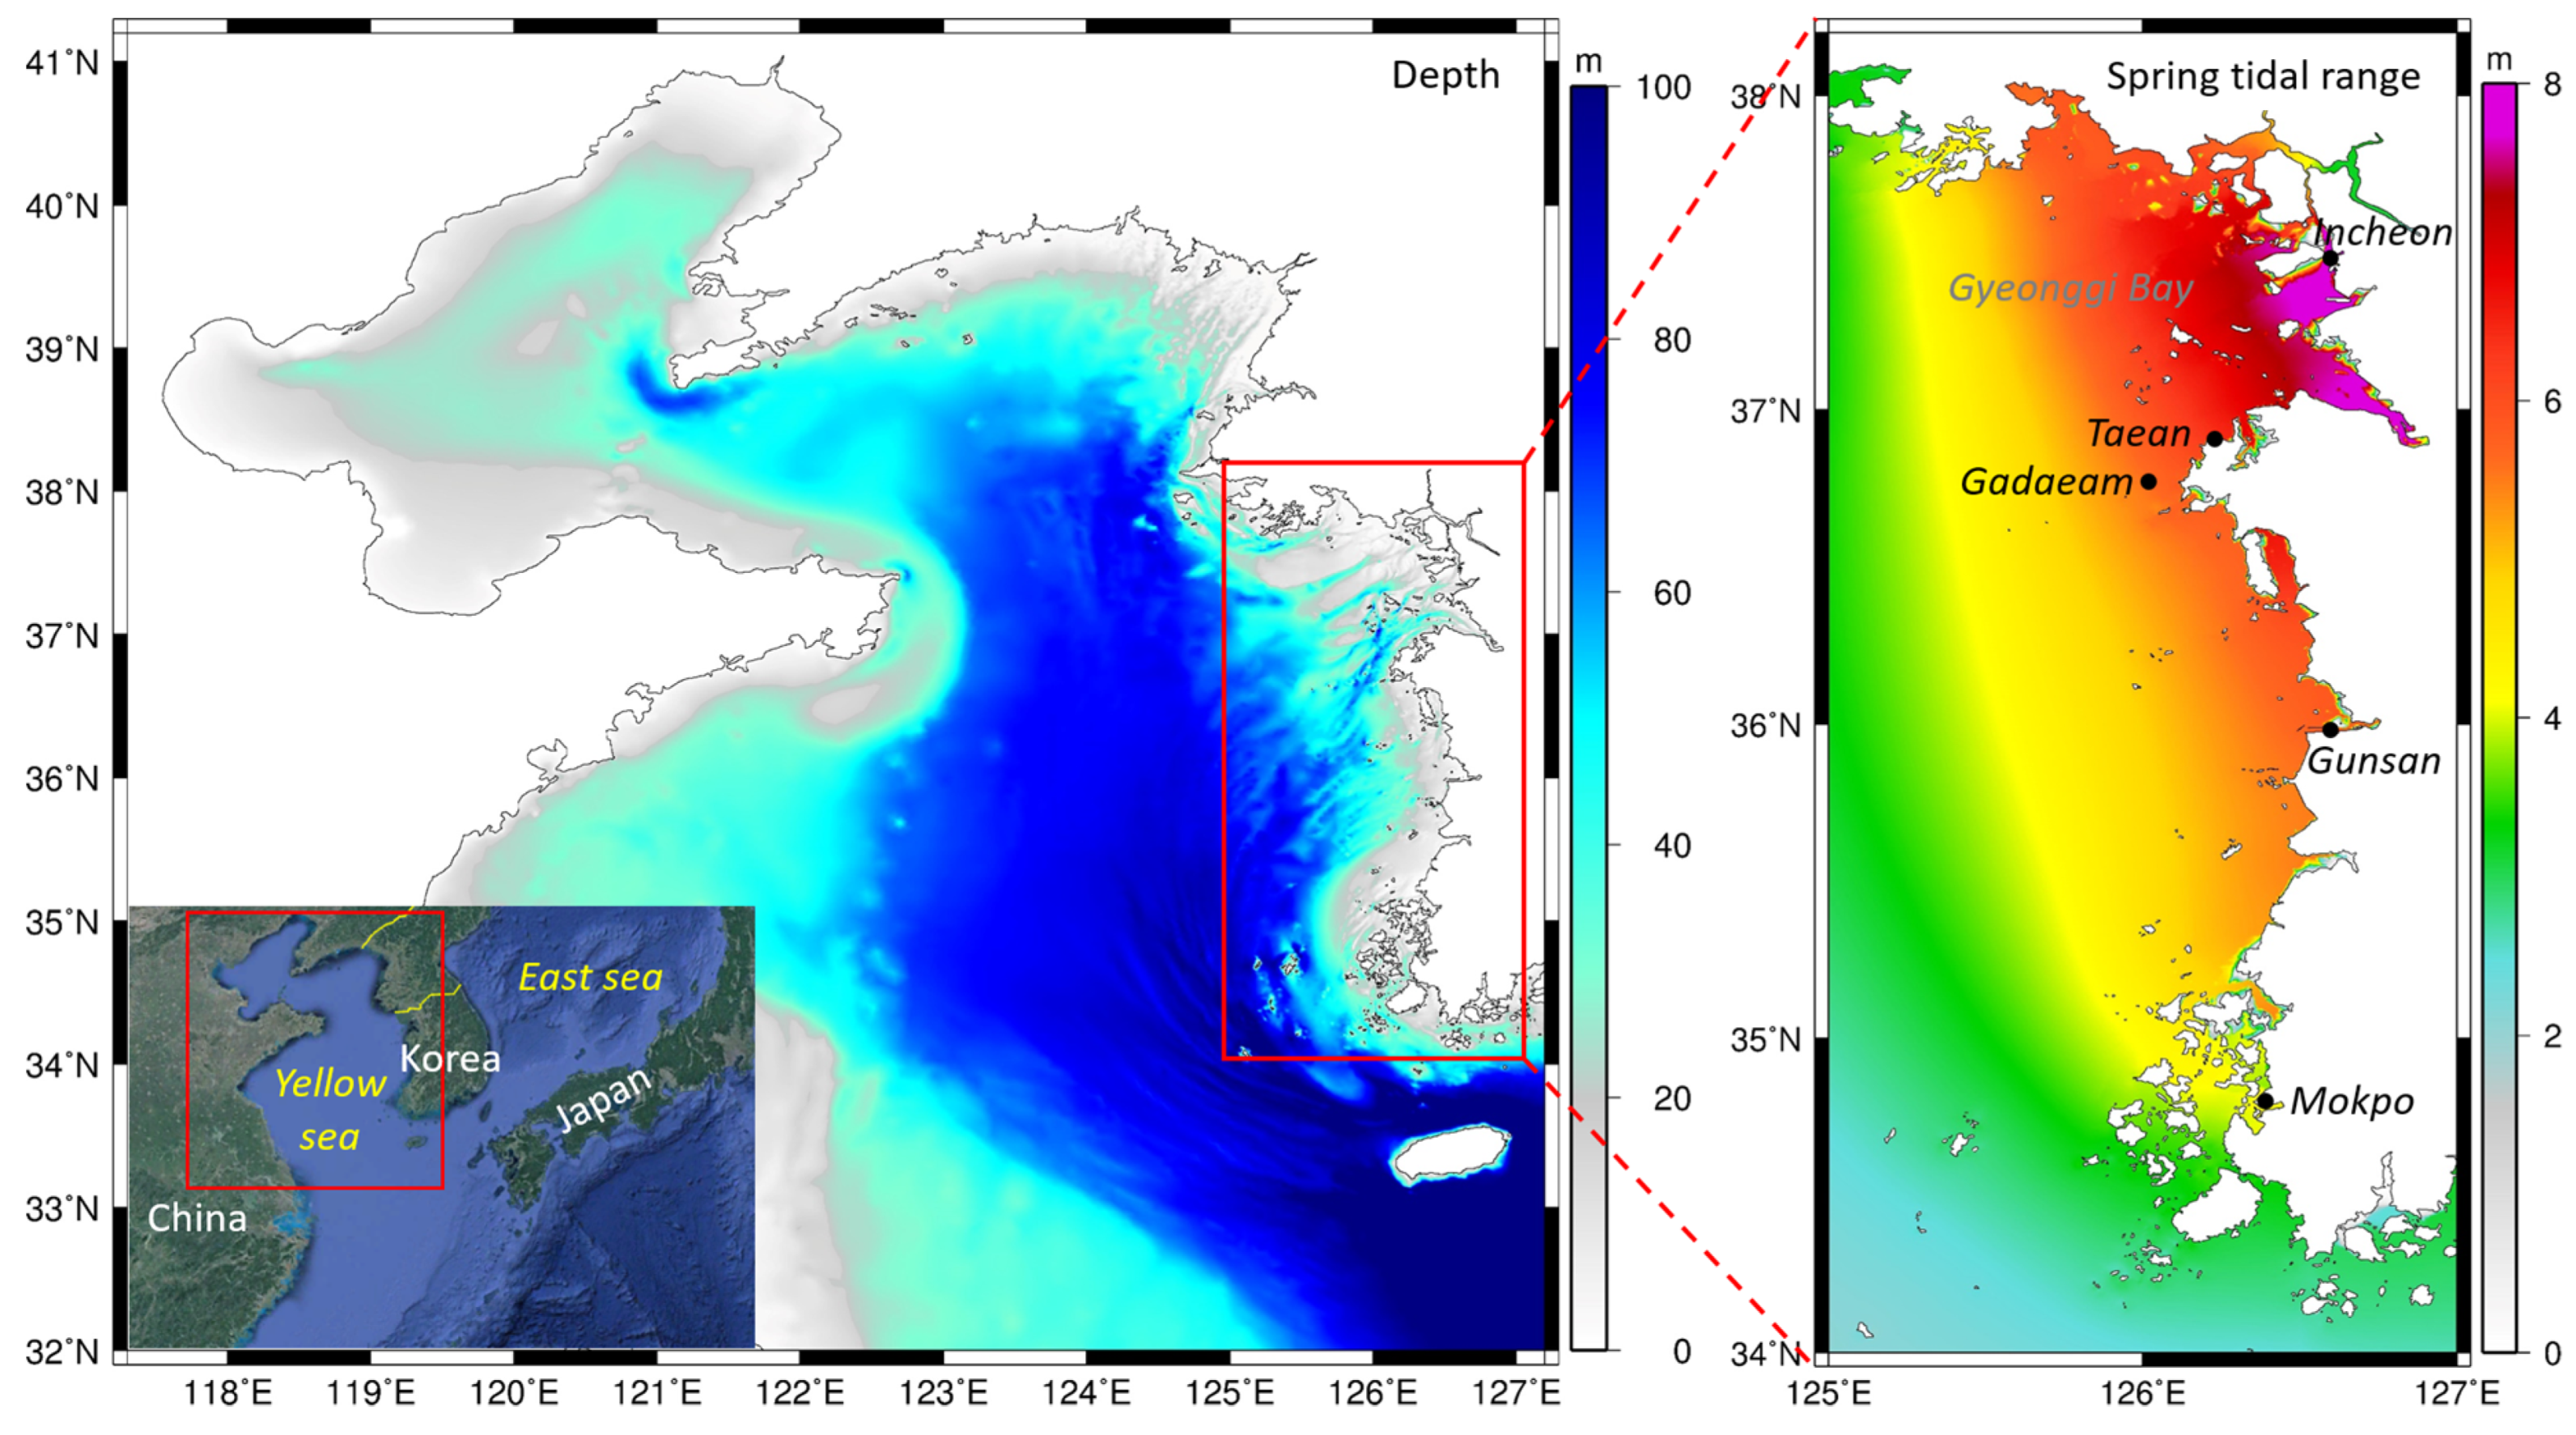
| Constituents | Incheon | Gunsan | Mokpo |
|---|---|---|---|
| M2 | 2.57 | 2.04 | 1.43 |
| S2 | 0.97 | 0.77 | 0.52 |
| K1 | 0.39 | 0.34 | 0.32 |
| O1 | 0.29 | 0.24 | 0.24 |
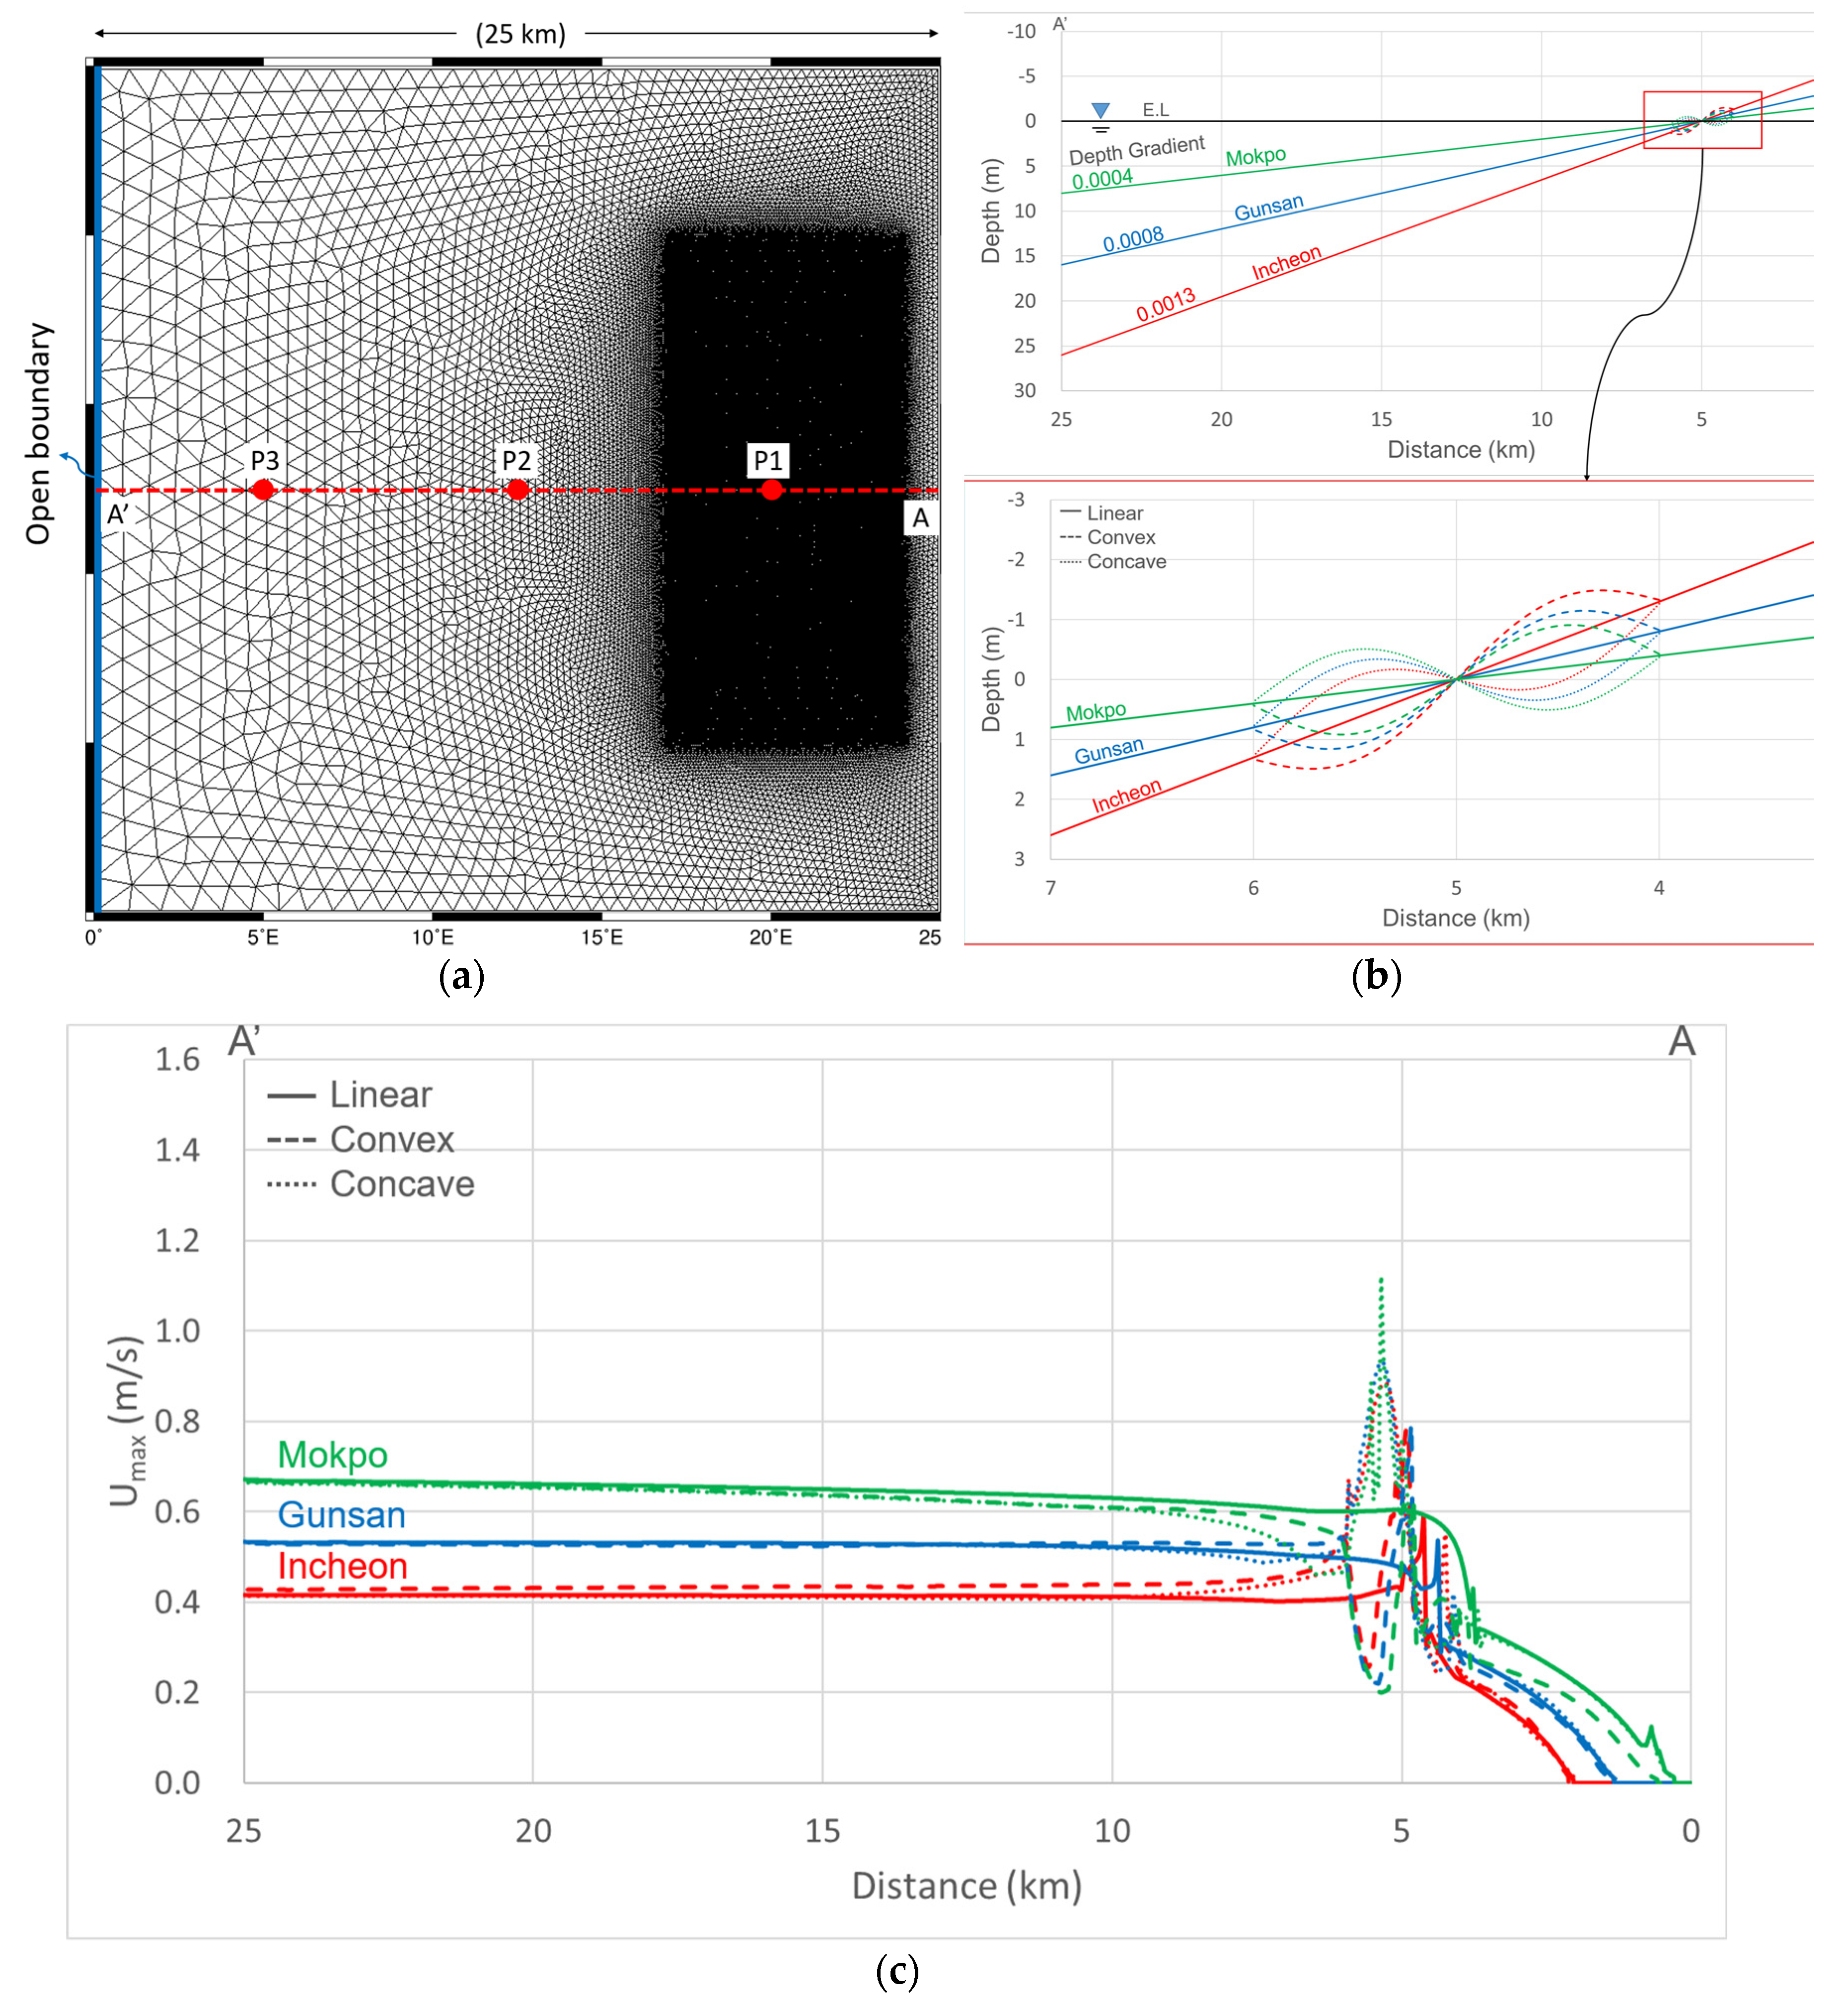
| Station | Bottom Slope Shape | Incheon | Gunsan | Mokpo | |||
|---|---|---|---|---|---|---|---|
| Ave. | Max. | Ave. | Max. | Ave. | Max. | ||
| P1 | Linear | 1.24 | 3.67 | 1.40 | 4.33 | 1.30 | 3.95 |
| Convex | 2.77 | 6.74 | 3.76 | 8.36 | 4.37 | 10.52 | |
| Concave | 2.70 | 5.62 | 2.88 | 6.10 | 3.28 | 7.98 | |
| P2 | Linear | 0.91 | 1.45 | 1.10 | 1.71 | 1.25 | 2.40 |
| Convex | 0.84 | 1.30 | 0.93 | 1.53 | 1.05 | 1.97 | |
| Concave | 0.96 | 1.84 | 0.99 | 1.62 | 1.04 | 1.87 | |
| P3 | Linear | 0.47 | 0.65 | 0.48 | 0.69 | 0.55 | 0.88 |
| Convex | 0.51 | 0.72 | 0.50 | 0.57 | 0.49 | 0.79 | |
| Concave | 0.52 | 0.80 | 0.45 | 0.66 | 0.50 | 0.85 | |
Publisher’s Note: MDPI stays neutral with regard to jurisdictional claims in published maps and institutional affiliations. |
© 2022 by the authors. Licensee MDPI, Basel, Switzerland. This article is an open access article distributed under the terms and conditions of the Creative Commons Attribution (CC BY) license (https://creativecommons.org/licenses/by/4.0/).
Share and Cite
Kim, H.-J.; Suh, S.-W. Simulation of Marine Leisure Accidents Using Random-Walk Particle Tracking on Macro-Tidal Environment. J. Mar. Sci. Eng. 2022, 10, 447. https://doi.org/10.3390/jmse10030447
Kim H-J, Suh S-W. Simulation of Marine Leisure Accidents Using Random-Walk Particle Tracking on Macro-Tidal Environment. Journal of Marine Science and Engineering. 2022; 10(3):447. https://doi.org/10.3390/jmse10030447
Chicago/Turabian StyleKim, Hyeon-Jeong, and Seung-Won Suh. 2022. "Simulation of Marine Leisure Accidents Using Random-Walk Particle Tracking on Macro-Tidal Environment" Journal of Marine Science and Engineering 10, no. 3: 447. https://doi.org/10.3390/jmse10030447