Article

Influence of Anaerobic Degradation of Organic Matter on the Rheological Properties of Cohesive Mud from Different European Ports

1
Section of Environmental Fluid Mechanics, Department of Hydraulic Engineering, Faculty of Civil Engineering & Geosciences, Delft University of Technology, Stevinweg 1, 2628 CN Delft, The Netherlands
2
Department of Chemical, Polymer & Composite Materials Engineering, University of Engineering & Technology (New Campus), Lahore 54890, Pakistan
3
Section of Geo-Engineering, Department of Geoscience and Engineering, Faculty of Civil Engineering & Geosciences, Delft University of Technology, Stevinweg 1, 2628 CN Delft, The Netherlands
4
Section of Rivers, Ports, Waterways and Dredging Engineering, Department of Hydraulic Engineering, Faculty of Civil Engineering & Geosciences, Delft University of Technology, Stevinweg 1, 2628 CN Delft, The Netherlands
*
Author to whom correspondence should be addressed.
J. Mar. Sci. Eng. 2022, 10(3), 446; https://doi.org/10.3390/jmse10030446
Submission received: 4 February 2022 / Revised: 9 March 2022 / Accepted: 16 March 2022 / Published: 21 March 2022
(This article belongs to the Special Issue Sediment Remediation at Harbour)

Abstract

:
The presence of clay-organic flocs in cohesive mud results in a complex rheological behavior of mud, including viscoelasticity, shear-thinning, thixotropy and two-step yielding. In this study, the effect of microbial degradation of organic matter on the rheological properties of mud samples, collected from different ports, was examined. The mud samples were collected from five different European ports (Port of Antwerp (PoA), Port of Bremerhaven (PoB), Port of Emden (PoE), Port of Hamburg (PoH) and Port of Rotterdam (PoR)), displaying varying sediment properties. The rheological analysis of fresh and degraded mud samples was performed with the help of several tests, including stress ramp-up tests, amplitude sweep tests, frequency sweep tests, time-dependent tests and structural recovery tests. The results showed: (i) a significant decrease in yield stresses and complex modulus after organic matter degradation for mud samples from PoA, PoH and PoR, (ii) a negligible change in rheological properties (yield stresses, crossover amplitude and complex modulus) for mud samples from PoB, and (iii) a significant increase in rheological properties for mud samples from PoE. For time-dependent tests, mud samples from PoB showed a substantial increase in hysteresis (~50% mean value) as compared to the changes in yield stresses and crossover amplitude. The analysis of gas production during degradation of organic matter showed a (i) significant release of carbon per g dry matter for mud samples from PoA, PoH and PoR, (ii) lower carbon release per g dry matter for mud samples from PoB, and (iii) a negligible carbon release per g dry matter for mud samples from PoE, which corresponded well with the change in rheological properties.

1. Introduction

Cohesive mud is composed of varying amount of fine-grained mineral particles (clay, silt and fine sand) and of organic matter (OM). Particulate organic matter is typically suspended in the water phase (as pure, biogenic organic matter or bound to suspended mineral particles) or attached to the already settled sediment. The existence of organic matter creates flocculated systems due to the interactions (bridging or charge neutralization) between the clay particles and organic matter [1]. The complex rheological fingerprint of cohesive mud such as viscoelasticity, shear thinning, thixotropy and two-step yielding is attributed to the formation of a clay-organic flocculated network [2,3,4,5]. For example, the mud samples having higher organic matter content displayed larger values of rheological properties (i.e., yield stresses and moduli), which were linked to the formation of a stronger and large number of clay-organic flocs [6].
The microbial degradation of organic matter, under anaerobic conditions, produces methane (CH4) and carbon dioxide (CO2) gases [7], which are either trapped in the mud layers or released via the water column. The density and settling–consolidation behavior of mud are known to be significantly influenced by the presence of entrapped gas bubbles. Moreover, owing to the significant influence of clay-organic flocs on the rheological and cohesive properties of mud [6,8,9,10,11,12], anaerobic degradation of organic matter is observed to significantly reduce the rheological properties of mud from Port of Hamburg, Germany [13,14]. However, as the sediment properties including type and content of organic matter, salinity, clay type and content, and particle size distribution, along with the sediment management techniques vary for different ports, different rheological responses to organic matter and its decay can be expected. A systematic analysis of the influence of organic matter degradation on the rheological properties of mud from different ports is still missing.
The main objective of the present study was, therefore, to analyze the effect of organic matter degradation on the rheological properties of mud samples from different European ports (Antwerp, Bremerhaven, Emden, Hamburg and Rotterdam). To this end, the rheological properties of fresh samples and microbially degraded samples, collected from different ports, were analyzed. Rheological tests included stress ramp-up tests, amplitude sweep tests, frequency sweep tests, time-dependent tests and structural recovery tests. In the first part of study, the results of gas production due to the anaerobic degradation of organic matter are discussed for mud samples from different ports, while in the second part, different rheological properties of fresh samples and samples degraded for 250 days were compared.

2. Experimental Methods

2.1. Sample Collection

Mud samples were collected from different European ports, including PoA, PoB, PoE, PoH and PoR (see Table S1, Supporting information) using either a core sampler or a grab sampler. Directly after sampling, the core was divided into sublayers such as fluid mud, pre-consolidated and consolidated sediments, based on their visual strength and consistency. However, in this study, only the top mud layer (fluid mud or pre-consolidated mud layer) was considered for analysis. PoA, PoB, PoE and PoR mud samples were collected from different locations within the port (see Table S1 for WGS coordinates and sample IDs). Conversely, the mud samples from PoH were collected from only one location (Köhlfleet mit Köhlfleethafen) due to the large number of samples collected from this particular location for our previous analysis [13]. Moreover, for comparison with PoE mud samples, only fluid mud samples were considered from PoH, while for comparing with other ports, pre-consolidated mud samples were selected from PoH.

2.2. Wet Bulk Density, Particle Size Distribution and TOC Content

The specific gravity of the mineral particles was taken to be 2.65 [2]. The wet bulk density ρ of the mud samples was then estimated by determining the content of water/solids after drying at 105 °C for 24 h [15] (see Table S1). The particle size distribution of the mud samples was measured by using the static light scattering (SLS) technique. The total organic carbon (i.e., TOC content) of the mud samples was determined using an ISO standard [16] (see Table S1).

2.3. Anaerobic Degradation of Organic Matter

The anaerobic degradation of organic matter was performed by placing the fresh mud samples into 500 mL airtight glass bottles. The anaerobic conditions were maintained by flushing the headspace above the samples with N2, and samples were incubated at 36 °C in the absence of light for 250 days. Anaerobic carbon release was estimated from the increase in headspace pressure and headspace composition, as analyzed by gas chromatography (GC-WLD; Da Vinci Laboratory Solutions). The share of CO2-C dissolved in the aqueous phase was calculated using the CO2 concentration, the pressure in the bottle headspace, and the temperature-corrected solubility of CO2 in water as given by Henry’s constant (given by Sander [17]). All the samples were incubated and analyzed in triplicate.

2.4. Rheological Characterization

The rheological analysis of both fresh and degraded mud samples was performed using a HAAKE MARS I rheometer (Thermo Scientific, Karlsruhe, Germany) with Couette geometry (gap width = 1 mm). The mud samples were gently homogenized before each experiment. After inserting the geometry into the sample, a waiting time of 3–5 min was adopted, in order to minimize the disturbances created by the bob. The rheological experiments were performed at 20 °C, maintained by a Peltier controller system. In order to check the repeatability, all the experiments were performed in duplicate, and the repeatability error was less than 2%.
Different types of rheological tests were performed in order to analyze the effect of organic matter degradation on the rheological properties of mud. Stress ramp-up tests were performed by linearly increasing the stress at a rate of 0.1–1.0 Pa s−1, until the shear rate reached 300 s−1 [4,18]. The corresponding rotation of the geometry was measured, which eventually provided the shear rate and apparent viscosity. The amplitude sweep tests were carried out at a frequency of 1 Hz by applying an oscillatory stress/amplitude. The storage ( G ) and loss ( G ) moduli [3] were obtained as a function of oscillatory amplitude. The frequency sweep test was performed within the linear viscoelastic (LVE) regime, from 0.1 to 100 Hz. The outcome of frequency sweep tests was obtained in the form of storage and loss moduli as a function of frequency, which was then converted into complex modulus ( G * ) and phase angle ( δ ). The time-dependent test was conducted by performing the shear rate ramp up and ramp down experiment as follows: (i) shear rate ramp-up from 0 to 100 s−1 over 50 s, (ii) constant shear rate of 100 s−1 over 50 s, and (iii) shear rate ramp-down from 100 to 0 s−1 over 50 s. In addition to the time-dependent test, a structural recovery test was performed by using a three-step protocol given in Shakeel et al. [19]. In short, the first step provides the moduli of the mud sample ( G 0 ) before pre-shearing, by performing a small amplitude oscillatory time sweep experiment. The second step involves the application of a high shear rate (300 s−1 for 500 s) to completely disturb the sample. The last step allows the sample to recover its structure by again performing a small amplitude oscillatory time sweep experiment for 500 s and recording the moduli ( G ) as a function of time.

3. Results and Discussion

3.1. Anaerobic Degradation Tests

The cumulated release of carbon after 250 days of degradation time is shown in Figure 1a for mud samples from different ports. It is evident that the mud samples from PoA, PoH and PoR showed significant release of carbon per g dry matter while lower carbon release per g dry matter was observed for mud samples from PoB, which corresponded well with the change in rheological properties. The comparison between PoE mud samples and fluid mud samples from PoH for cumulated release of carbon after 250 days of degradation time is presented in Figure 1b. It is evident that the mud samples from PoE displayed a negligible carbon release, while in the case of PoH fluid mud samples, a pronounced carbon release was observed, which is again in line with the rheological results.

3.2. Wet Bulk Density, Particle Size Distribution and TOC Content

The change in excess wet bulk density ( ρ ρ w , with ρ w = density of water), obtained by the difference between excess wet bulk density of degraded and fresh mud samples, is plotted as a function of excess wet bulk density of fresh mud samples (Figure S1). It is seen that the change in wet bulk density incurred during the long-term (250 days) incubation to degrade organic matter was generally lower than 5% of its original value. It was, therefore, assumed that changes in rheological properties between fresh and degraded samples were not related to the change in density or water content.
Mud samples obtained from PoB, PoE, PoH and PoR showed quite similar particle size distribution (Figure S2a) along with the similar D50 values (see Table S2). Conversely, the mud samples collected from PoA displayed two different behaviors (Figure S2b), i.e., one was similar to the other ports while another one showed bimodal particle size distribution along with the higher D50 values (see samples A2 and A4 in Table S2), which was linked with the presence of a significant amount of sand sized particles. For these two samples (A2 and A4), the higher sand content was also found in the particle size distribution obtained by the sieving technique [20], which verified the SLS results (see Table S3). Some other sediment properties such as TOC content, electrical conductivity and pH of mud samples from different ports are presented in Table S1.

3.3. Stress Ramp-Up Tests

Stress ramp-up tests were performed to analyze the effect of organic matter degradation on the yield stresses of mud from different ports. Figure S3 shows the outcome of stress ramp-up tests in terms of apparent viscosity as a function of shear stress for fresh mud samples and degraded mud samples from various ports. A two-step yielding behavior was evident from the two declines in viscosity. A similar two-step yielding behavior has already been reported in the literature for fine-grained sediments [3,21]. This two-step yielding behavior in mud samples was associated with the structural reorganization during shearing, i.e., breakage of interconnected networks of flocs, formation of rolls/cylinder-like structures and collapse of cylinder-like structures [22]. The yield stress values, corresponding to these viscosity declines, were defined as static yield stress ( τ s ) and fluidic yield stress ( τ f ).
Figure S3 shows that the degraded mud samples had lower yield stress values as compared to the fresh mud samples, except for mud samples from PoB and PoE. This decrease in yield stress values may be associated with the degradation of organic matter and the corresponding decline of the extent of mineral bridging, which eventually results in a weaker system [6]. A similar decrease in yield stress values by chemically removing the organic matter from mud was also reported in the literature [23]. The mud samples from PoB and PoE showed either similar yield stress values or even higher yield stress values after organic matter degradation.
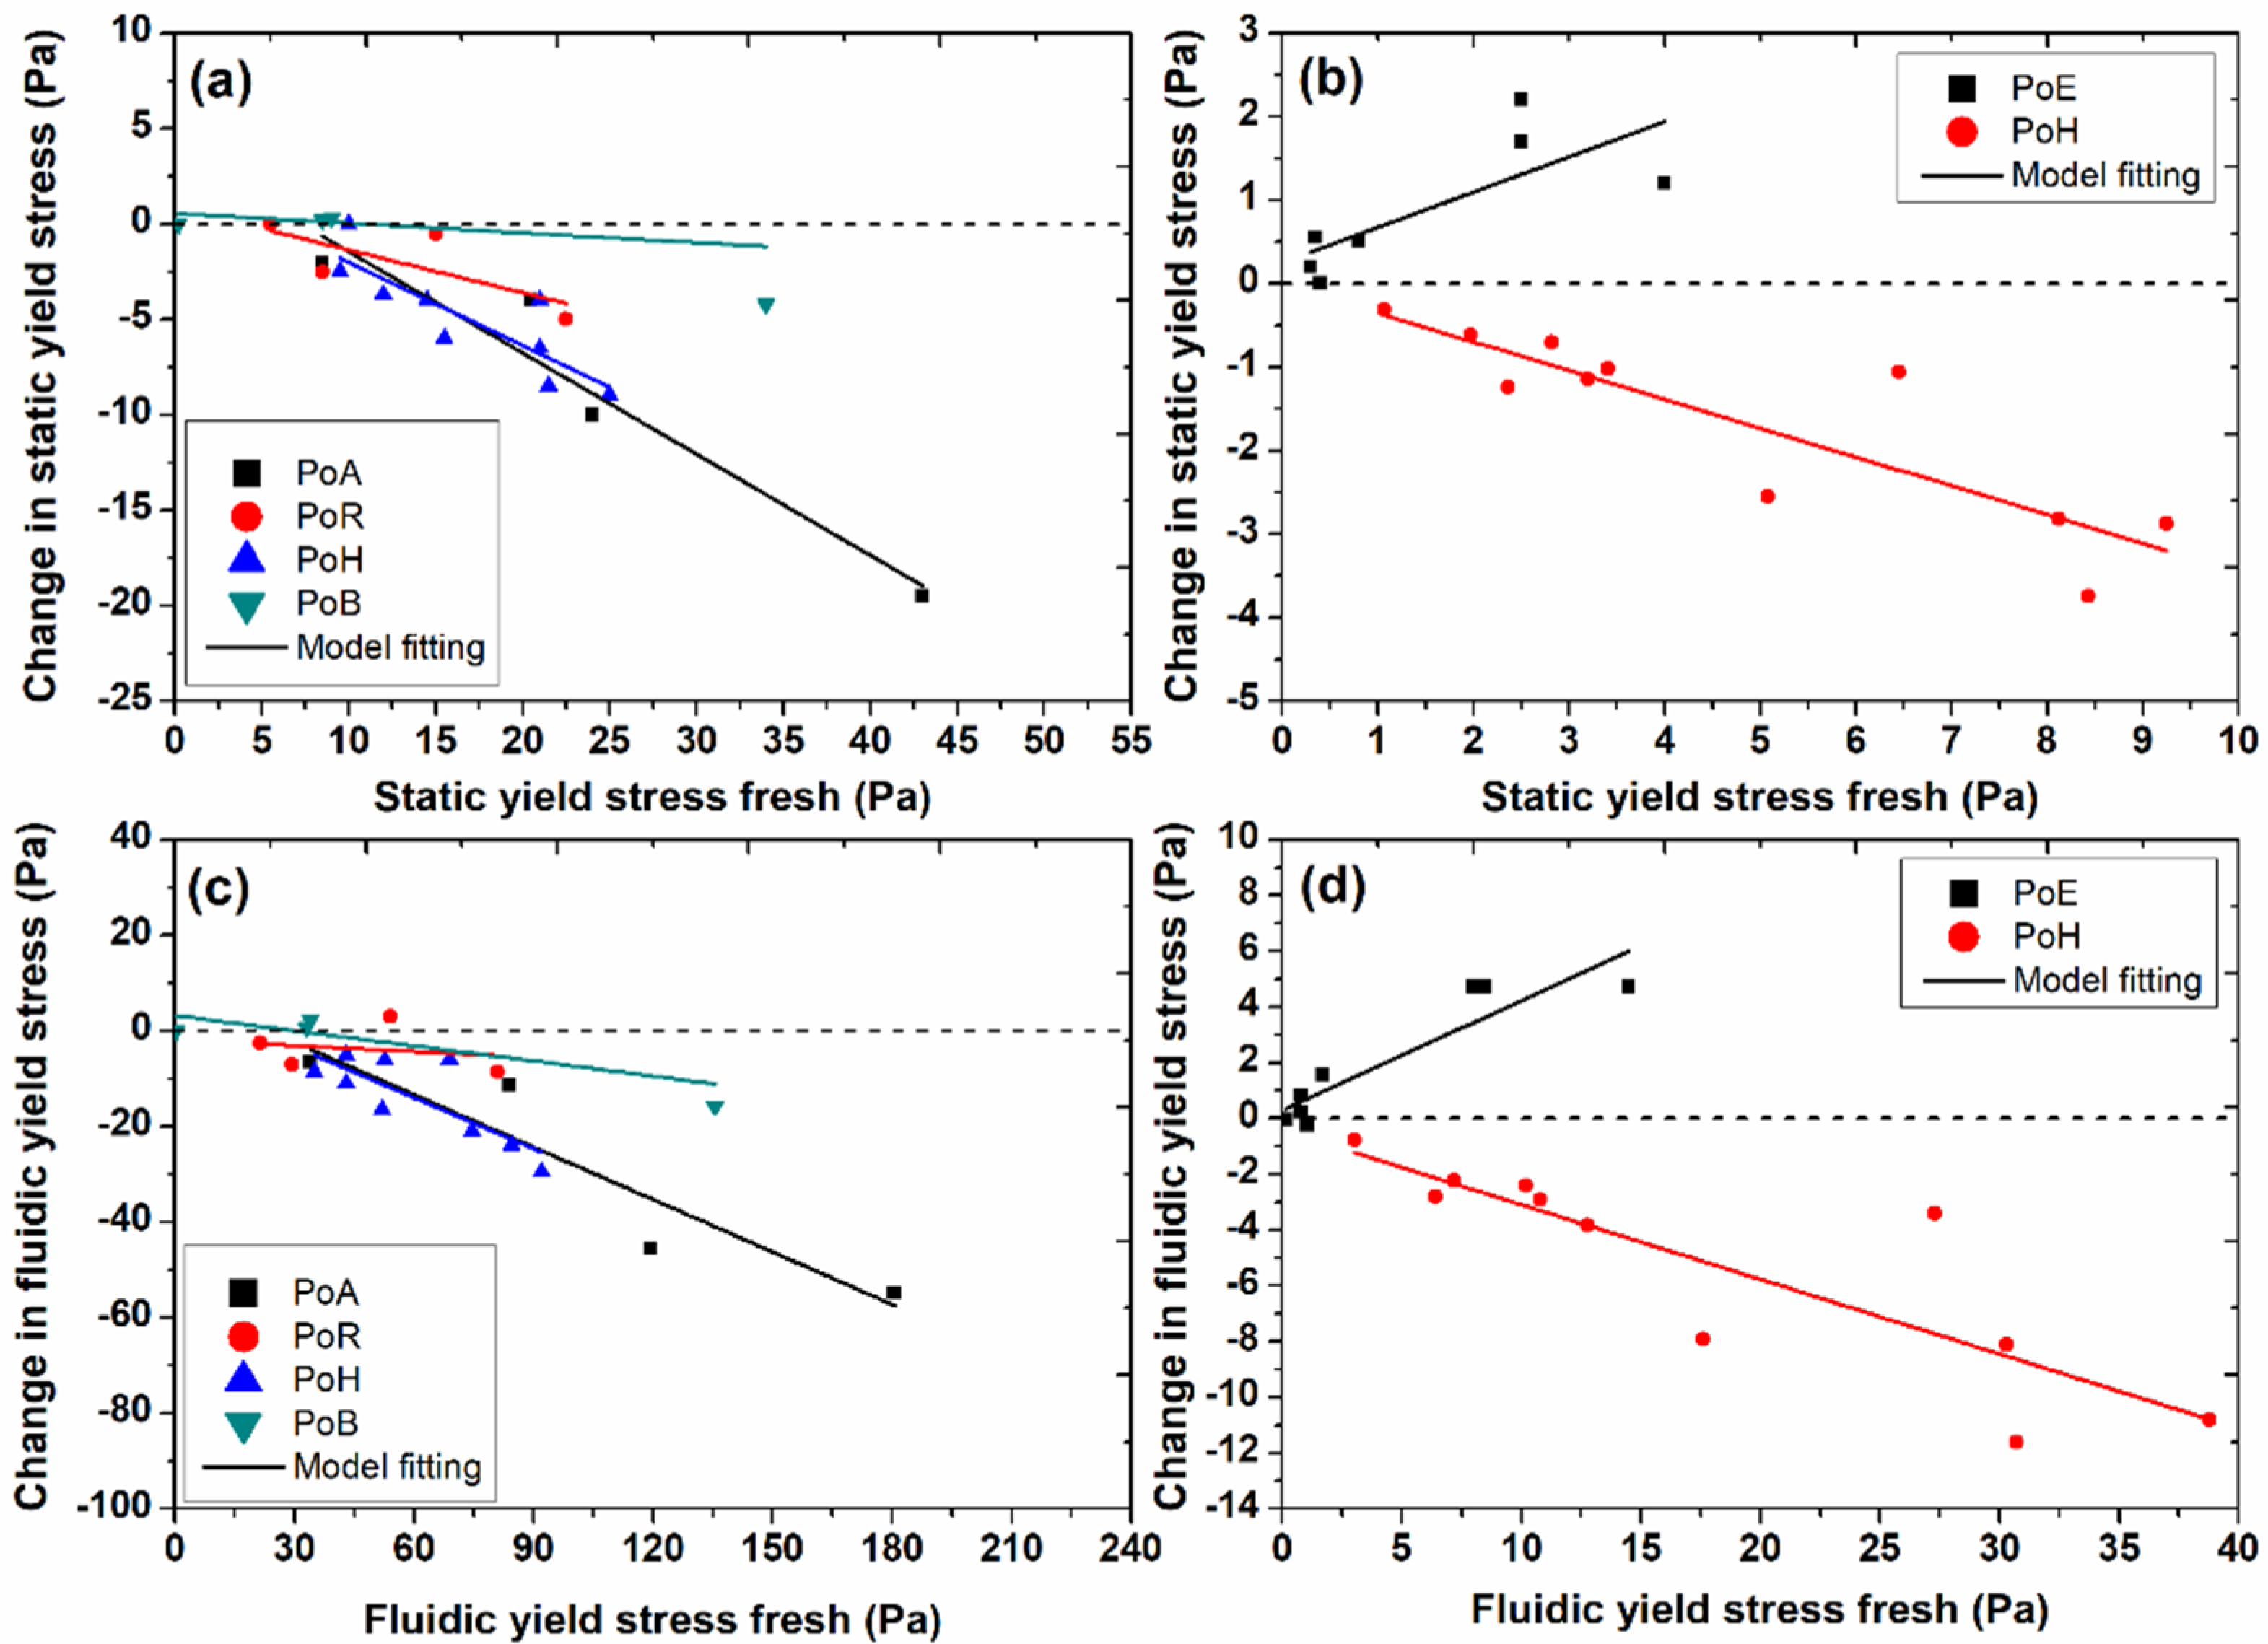
In order to further quantify the influence of organic matter degradation on the yield stress of mud samples from different ports, the change in static and fluidic yield stresses (degraded–fresh) was plotted as a function of yield stress of fresh samples (see Figure 2a,c). A strong inverse correlation was observed between the change in yield stresses and the yield stresses of fresh mud samples, i.e., the higher the original yield stress, the higher its reduction after organic matter degradation (i.e., negative slope) [13,14]. Moreover, the following empirical equation was used to fit the experimental data of change in the rheological property (degraded–fresh) as a function of the same rheological property before degradation:
y = a + b x
where a (Pa or Pa s−1) and b (–) represent the intercept and slope of the line, respectively. The values of these fitting parameters are presented in Table S4. The values of the slope indicated that the yield stresses (static and fluidic) were significantly reduced for mud samples from PoA and PoH due to the degradation of organic matter. In the case of mud samples from PoB and PoR, the reduction in yield stresses after organic matter degradation was less significant, as evident from the smaller values of negative slope (Table S4). The mud samples collected from PoE exhibited smaller densities as compared to the samples collected from other ports (see Table S1). Therefore, the change in yield stresses (degraded–fresh) as a function of yield stresses of fresh mud samples for PoE is compared with the fluid mud samples collected from PoH with similar densities (Figure 2b,d, static and fluidic yield stresses). It is observed that the mud samples from PoE displayed an increase in both static and fluidic yield stress values after organic matter degradation (i.e., positive slope), while in the case of PoH, a pronounced negative slope was found with significant reduction in both static and fluidic yield stresses (Table S4).
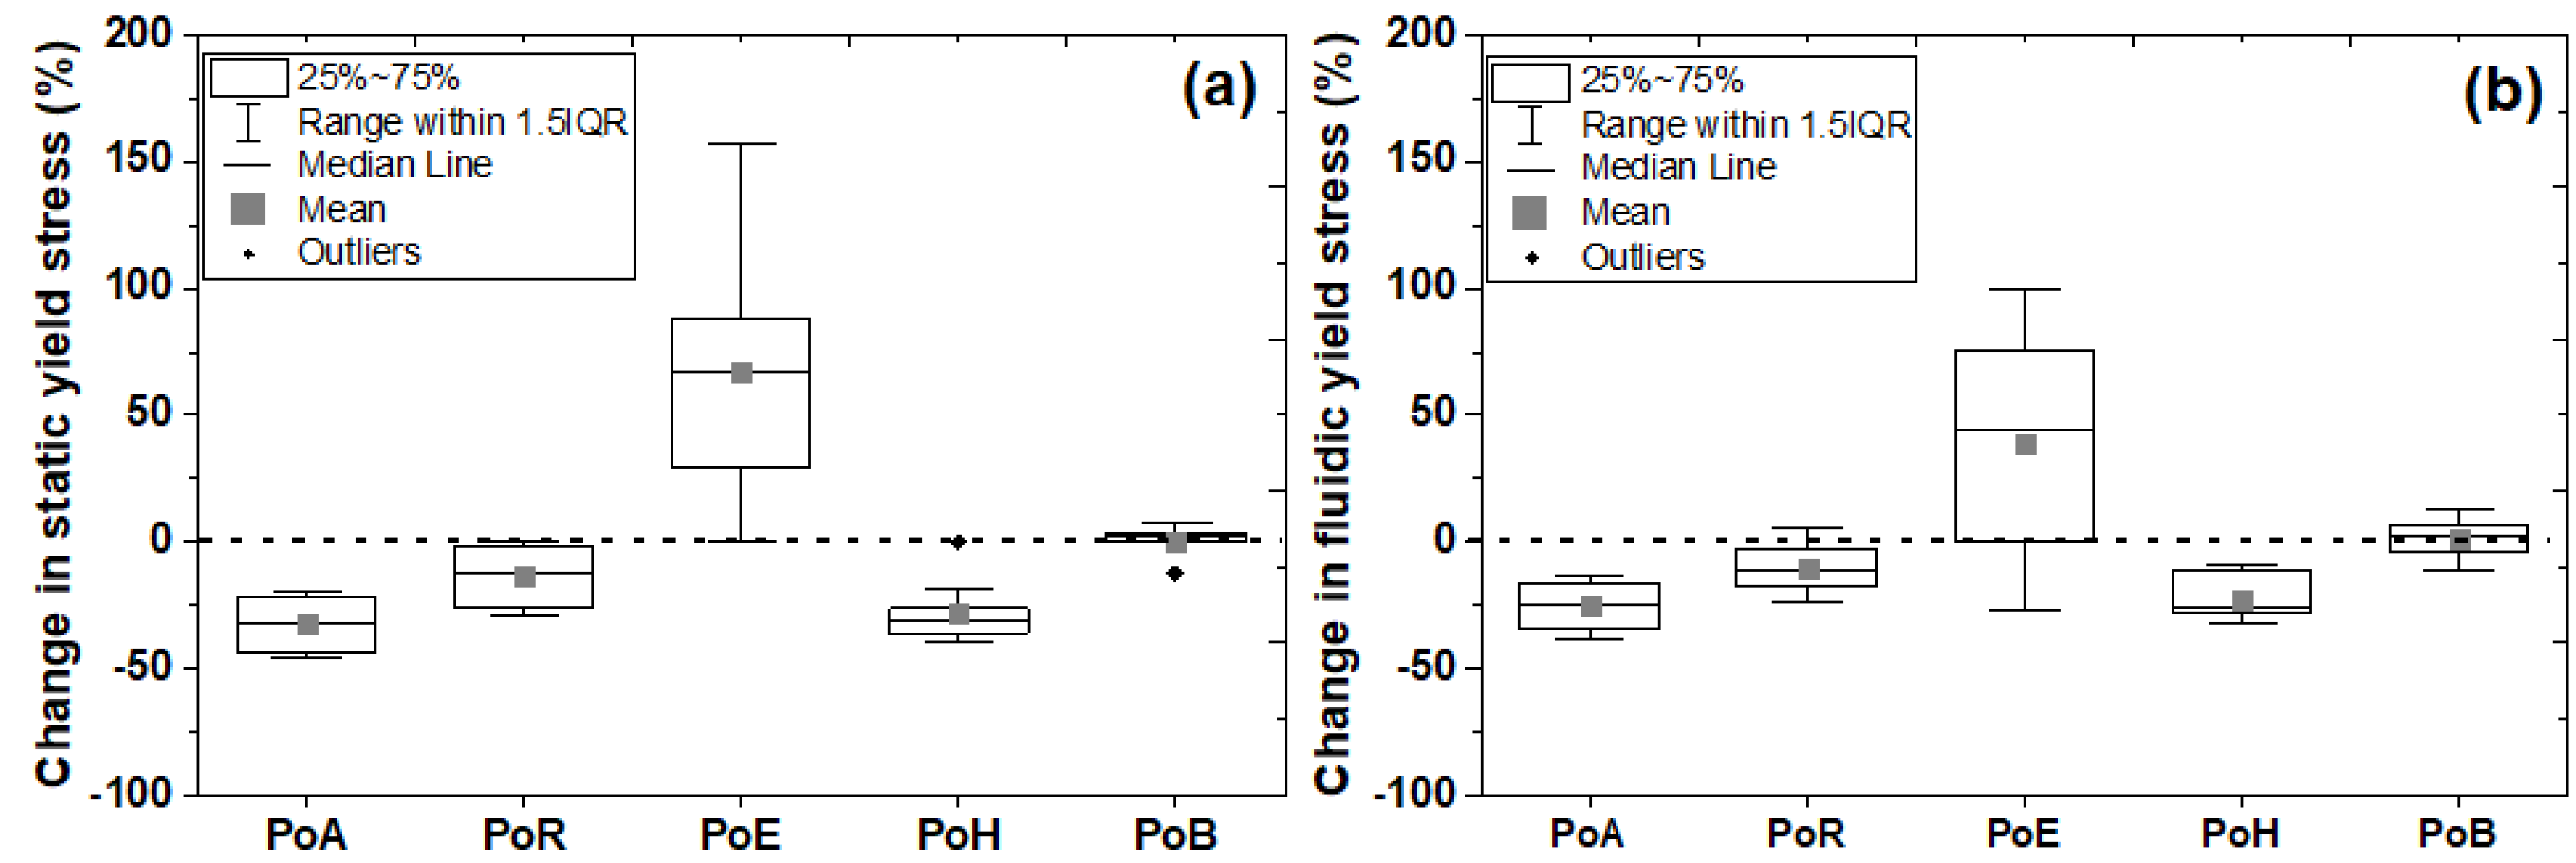
The aforementioned results were plotted in terms of percent change in yield stresses ( d e g r a d e d     f r e s h f r e s h × 100 )   after organic matter degradation for different ports (
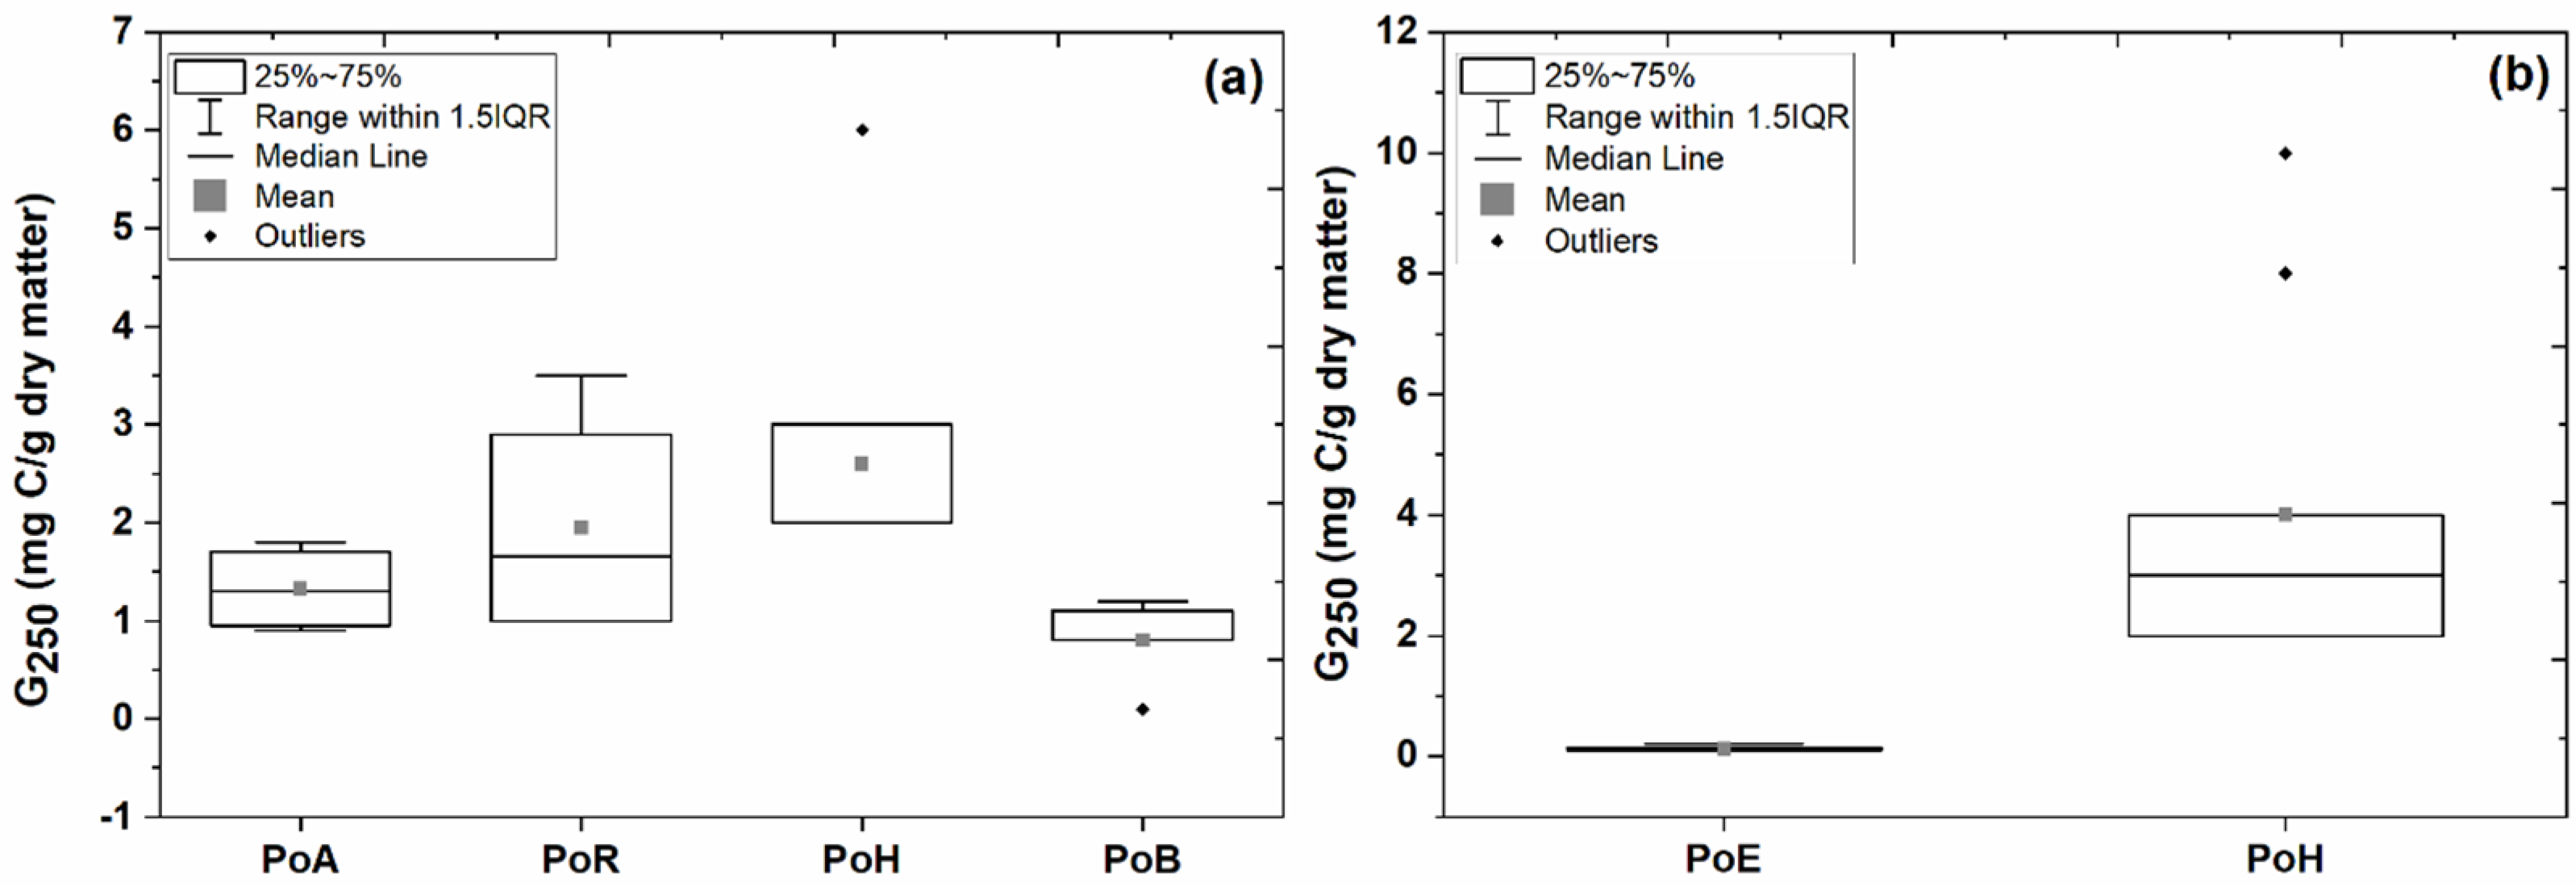
Figure 3). These results identified a significant reduction in yield stresses for PoA and PoH (~20–40% mean value), a less pronounced decrease in yield stresses for PoR (~10–20% mean value), a negligible change in yield stresses for PoB (~0–5% mean value), and a significant increase in yield stresses for PoE (~40–70% mean value). The significant decrease in yield stresses for mud from PoA and PoH may be attributed to the active nature of the organic matter, particularly for PoH [14], which degrades under suitable conditions. The small or negligible changes in yield stresses after degradation for PoB may be associated with the lower organic matter decay as compared to the other ports. Conversely, the increase in yield stresses after degradation of organic matter in mud from PoE is quite unexpected. It is hypothesized that under laboratory conditions, i.e., in a closed incubation system with no addition of fresh new carbon and favorable conditions of temperature, the composition of the microbial community, its abundance, and thereby the floc/biofilm architecture also change. This means that as organic matter (OM) is decayed, and is released as CH4 and CO2, the remaining OM undergoes a transformation toward more stable organo-mineral associations with concurrent changes of the microbial community composition, compared to the fresh sample. As a result, different floc and biofilm properties change, which could result in a different strength. It is assumed that this effect also occurs in the samples from the other ports but might be masked due to the high OM decay and the significant mass loss of carbon, which dominate the rheological response by disrupting mineral bridging. Hence, due to low mass loss and OM decay rates in PoE (see Figure 1), other processes changing the physical architecture of flocs and biofilms might become more relevant.

3.4. Amplitude Sweep Tests

In addition to the yield stress, the transition between solid-like and liquid-like behavior of mud samples was investigated by performing oscillatory amplitude sweep tests. Figure S4 shows the phase angle as a function of oscillatory amplitude for fresh and degraded mud samples. The solid–liquid transition point was estimated when the phase angle became equal to 45° (i.e., crossover point between G and G ), and the corresponding stress amplitude was demonstrated as crossover amplitude. Figure S4 illustrates a decrease in crossover amplitude by the degradation of organic matter, except for samples from PoE and PoB, which is in agreement with the yield stress analysis.
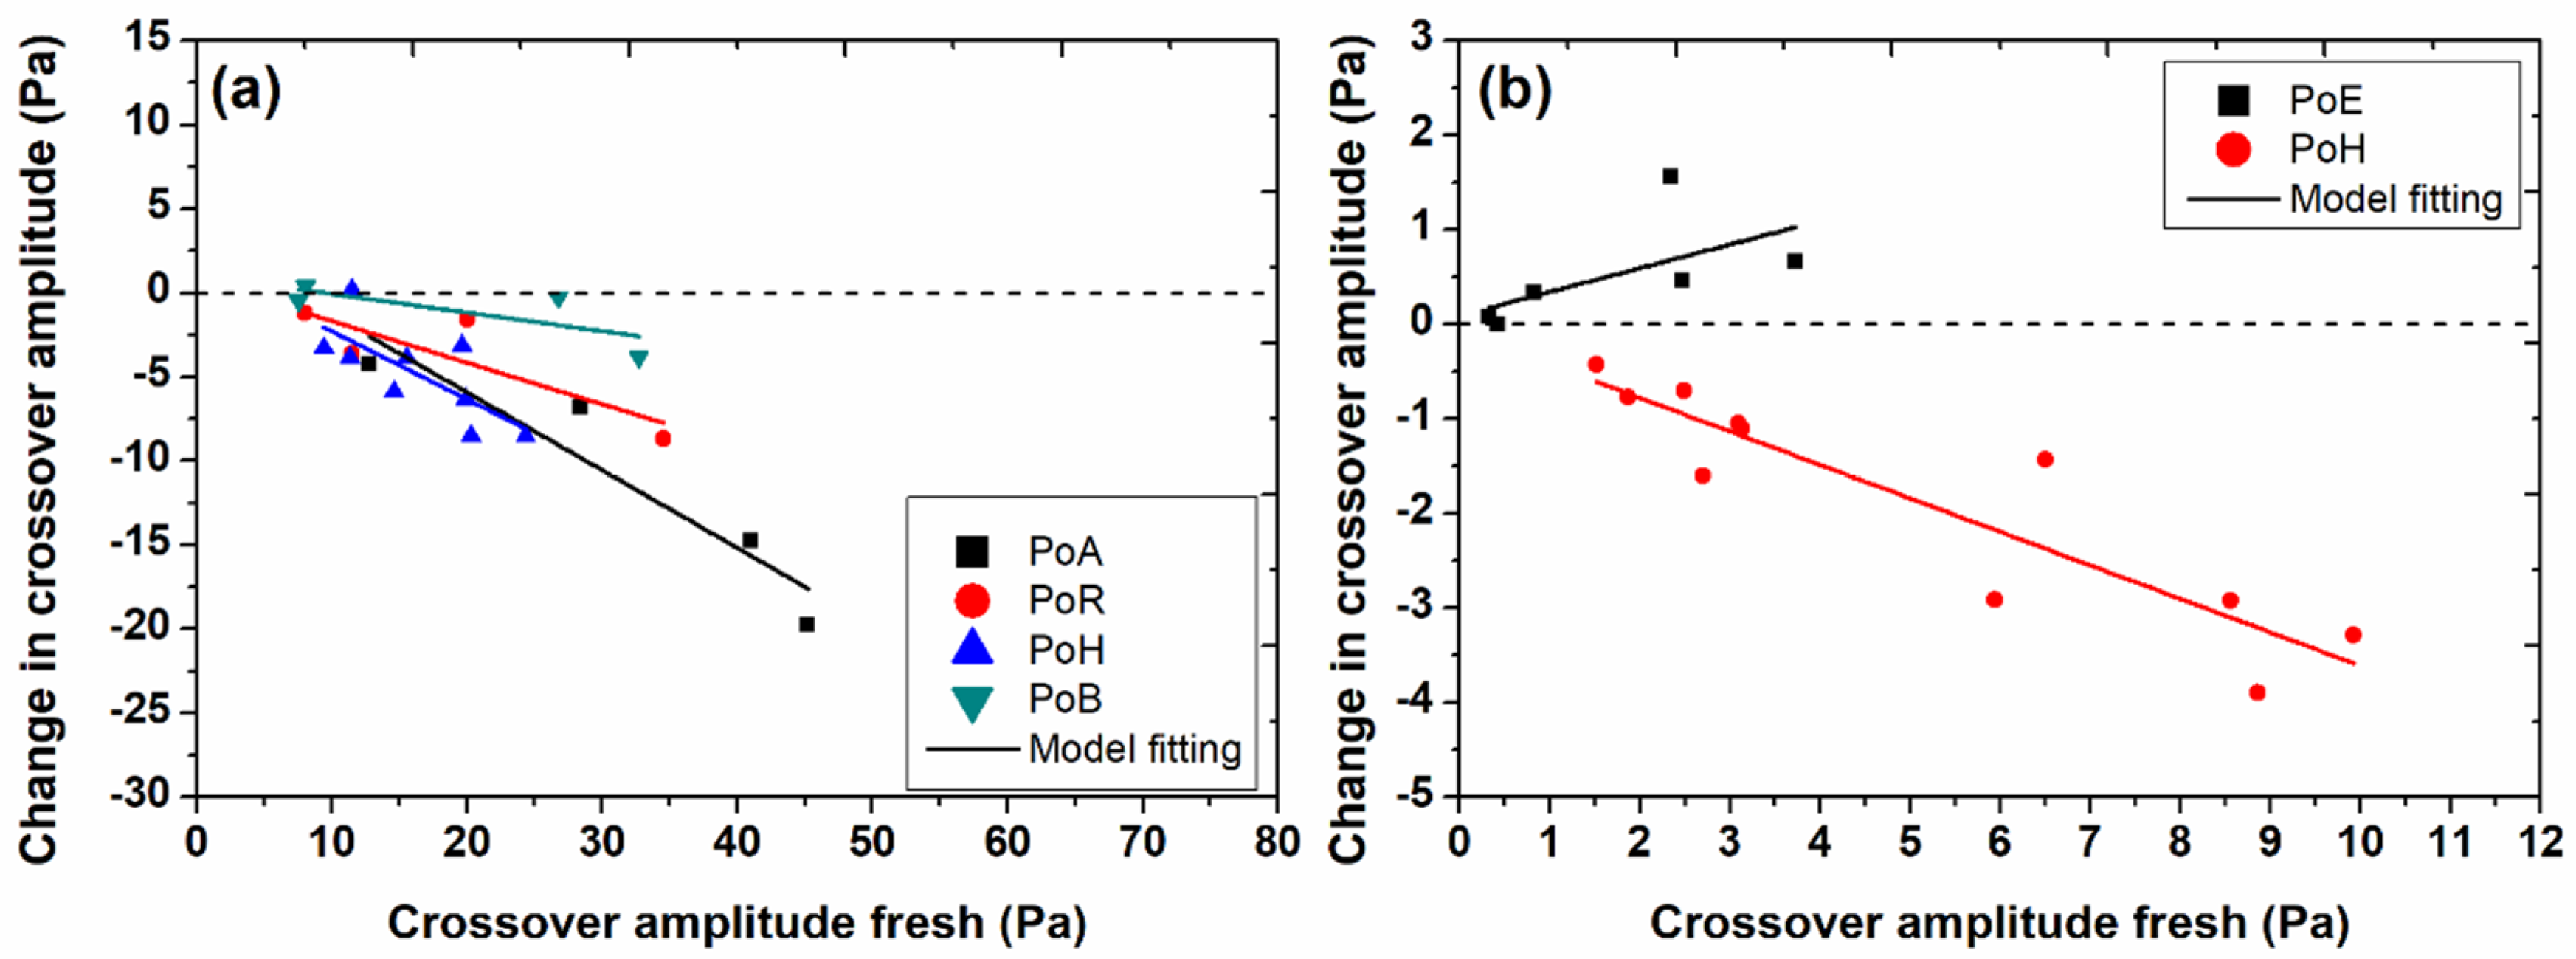
Change in crossover amplitude (degraded–fresh) is now plotted as a function of crossover amplitude of fresh mud samples from different ports (see Figure 4a). The organic matter degradation again showed a significant influence on the crossover amplitude for the mud samples having higher crossover amplitude before degradation. The experimental data were then fitted with Equation (1), and the values of a and b are given in Table S4. The slope values are quite similar in the case of crossover amplitude and yield stresses for mud samples from different ports. This behavior shows that the influence of organic matter degradation on the extent of decrease in rheological properties (crossover amplitude and yield stresses) is quite similar, because both these properties involve the application of a shearing action to disturb the intact structure. The change in crossover amplitude (degraded–fresh) as a function of crossover amplitude of fresh mud samples for PoE was again compared with the fluid mud samples collected from PoH with similar densities (Figure 4b). It is again evident that the mud samples from PoE displayed an increase in crossover amplitude values after organic matter degradation (i.e., positive slope), while in the case of PoH, a pronounced negative slope was observed with significant reduction in crossover amplitude (Table S4).
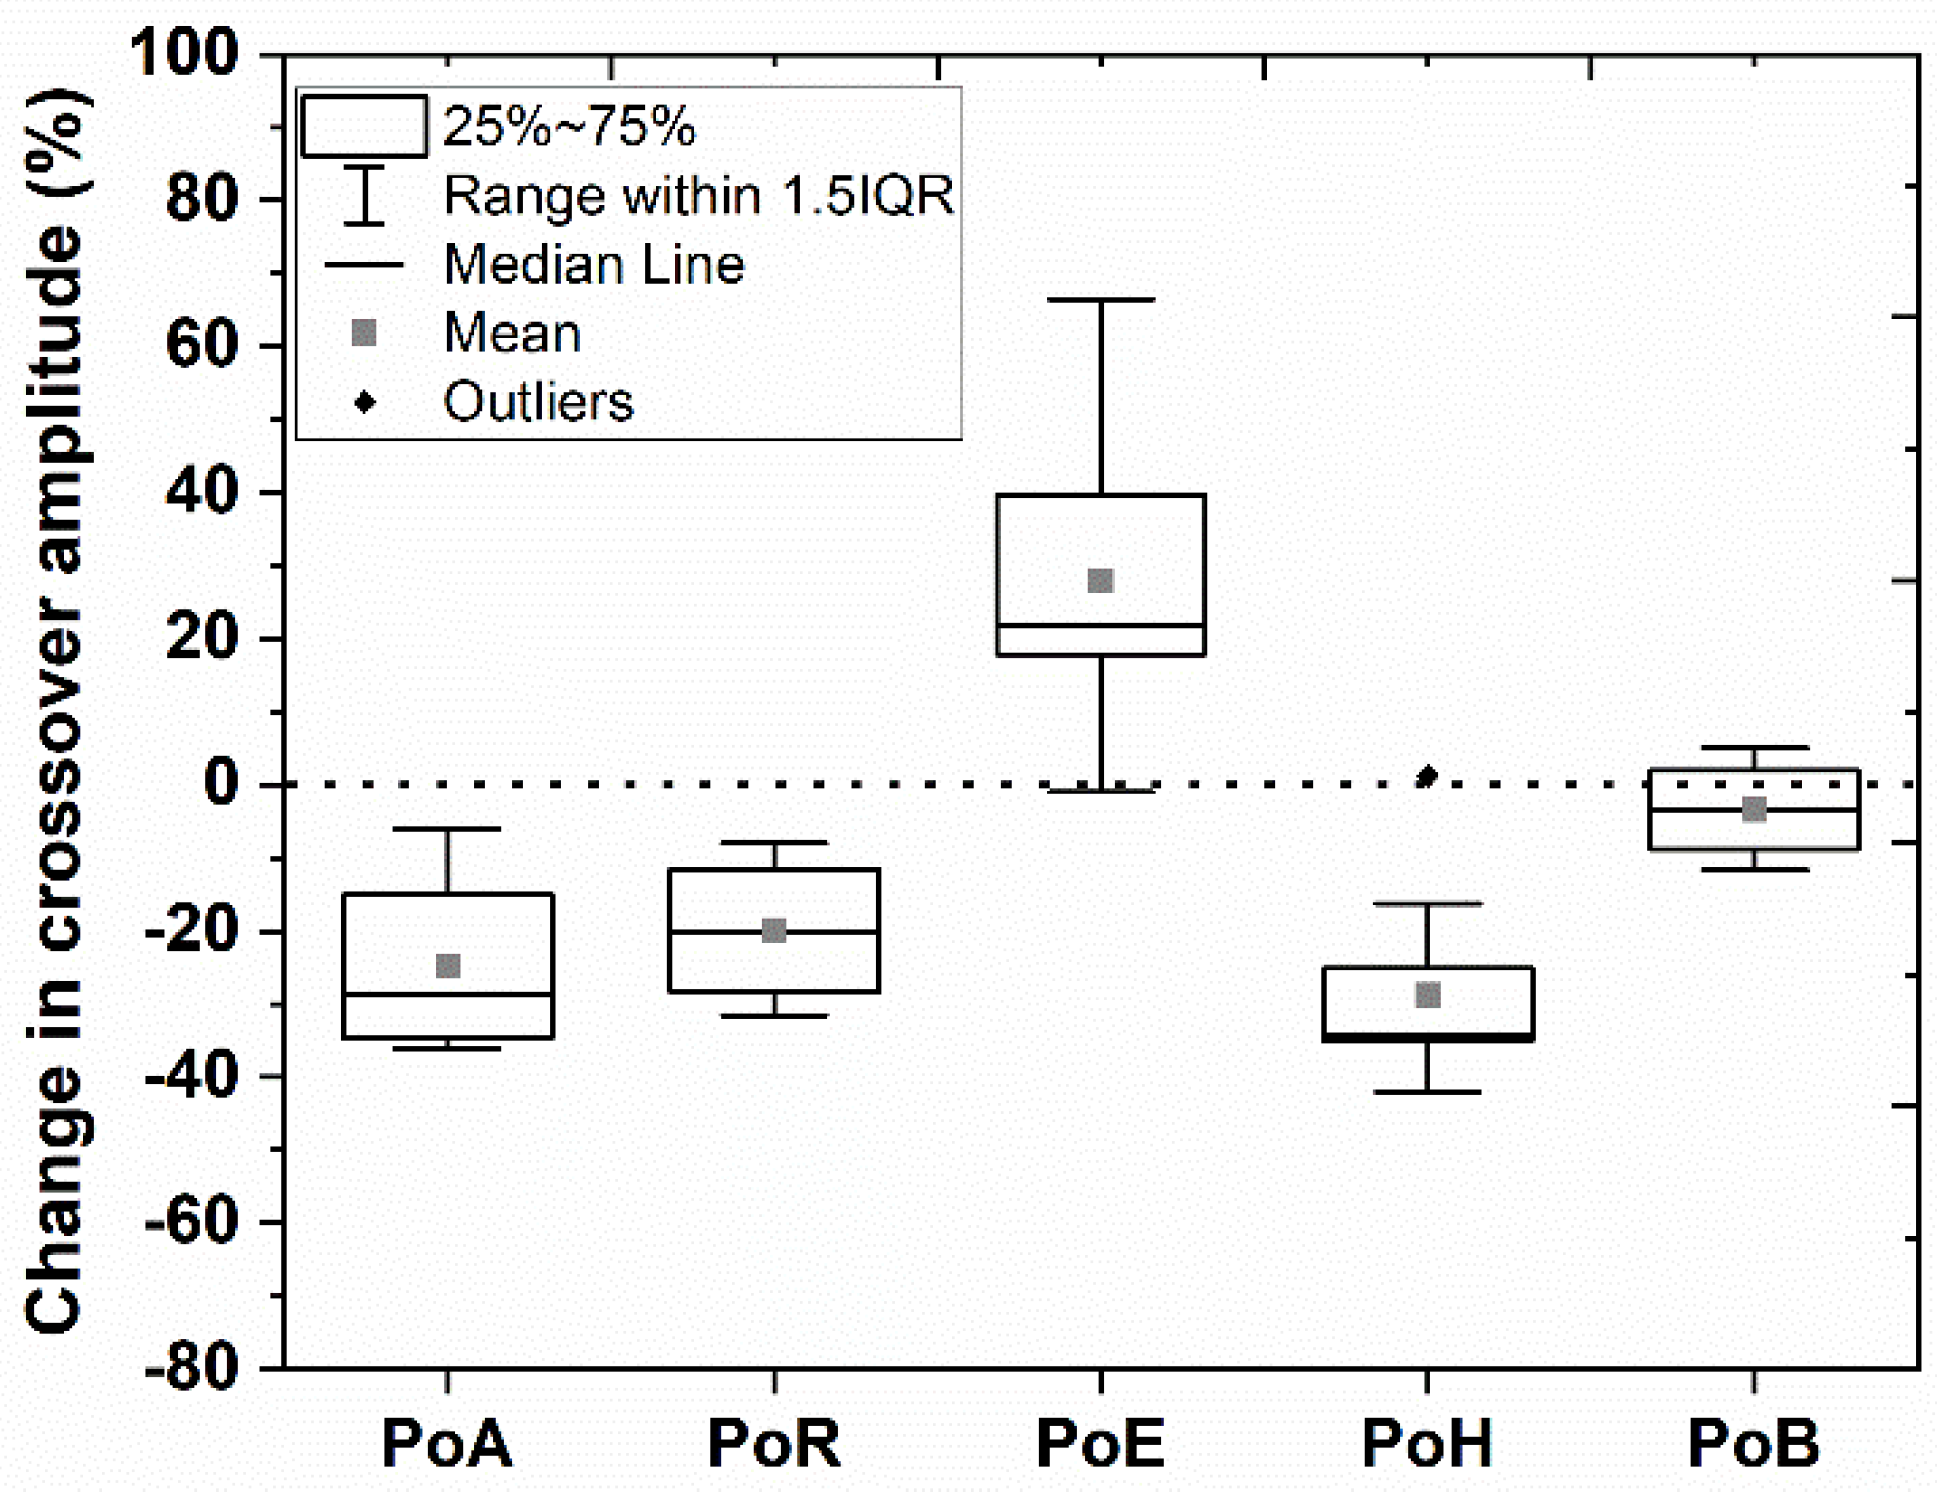
The percent change in crossover amplitude ( d e g r a d e d     f r e s h f r e s h × 100 )   after organic matter degradation for mud samples from different ports is shown in Figure 5. These results again identified a significant reduction in crossover amplitude for PoA, PoH and PoR (~20–30% mean value), a negligible decrease in crossover amplitude for PoB (~0–5% mean value), and a significant increase in crossover amplitude for PoE (~30% mean value). These results verified the outcome of yield stress analysis and can be attributed to the processes changing the physical architecture of flocs and biofilms.

3.5. Frequency Sweep Tests

Frequency sweep tests were performed within the LVE regime from 0.1 to 100 Hz in order to analyze the strength of mud samples, without disturbing their structure, and before and after degradation of the organic matter. Figure S5 shows the complex modulus and phase angle as a function of frequency for fresh and degraded mud samples for different ports. A solid-like behavior was observed for both fresh and degraded mud samples, i.e., an almost independence of complex modulus on frequency and significantly smaller values of phase angle [24]. A similar solid-like character of mud samples has already been reported in the literature [5,25,26,27]. However, the organic matter degradation resulted in a weaker system (i.e., lower complex modulus values), particularly for PoA and PoH mud samples. The experimental data at higher frequencies were excluded from the graphs due to the inertial effects caused by the rheometer head.
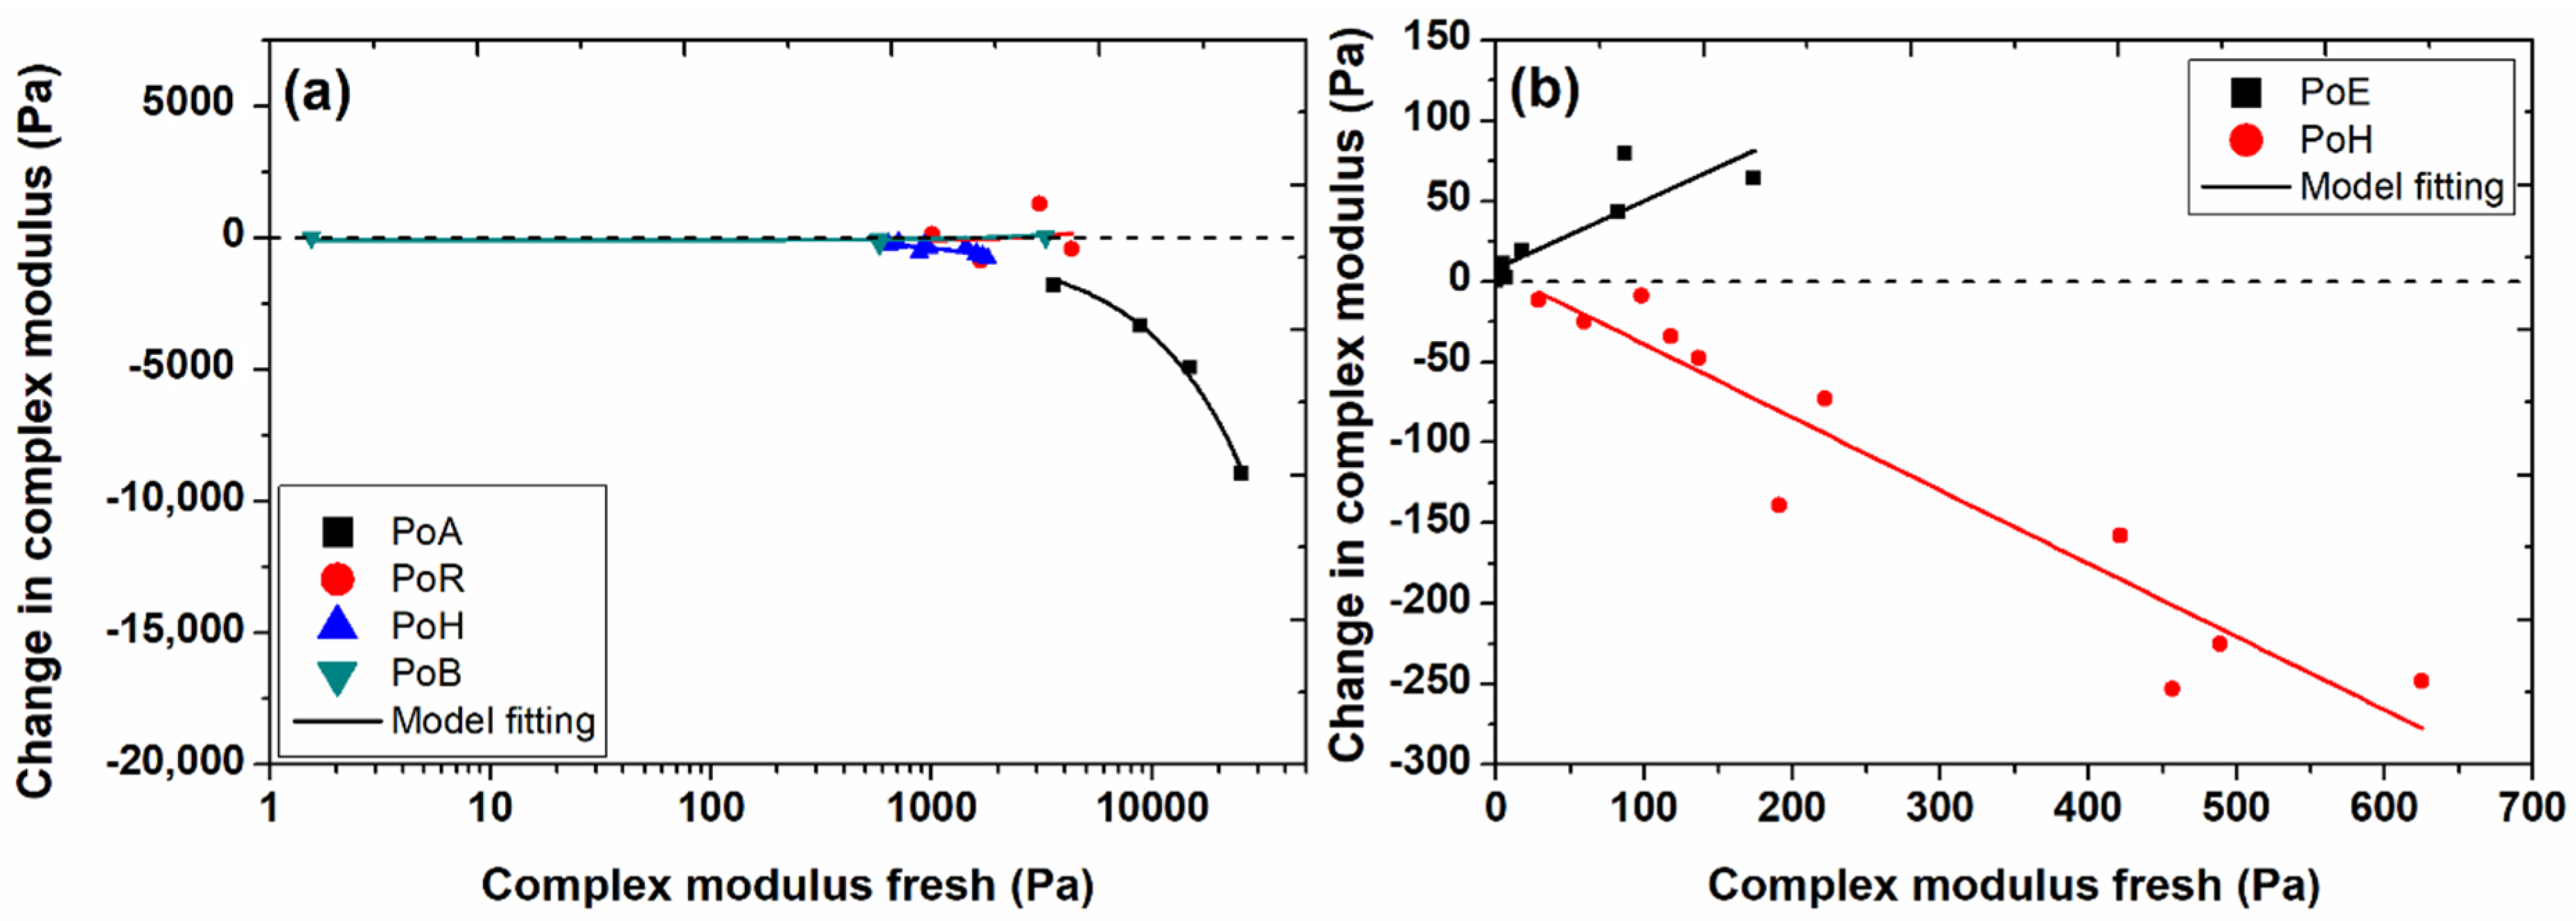
Figure 6a shows the correlation between the change in complex modulus at 1 Hz (degraded–fresh) and the values of complex modulus at 1 Hz of fresh mud samples collected from different ports on a semi-log scale. A significant decrease in complex modulus was observed due to the degradation of organic matter, which became more pronounced for the fresh samples having higher complex modulus, particularly for PoA and PoH mud samples. For PoB and PoR mud samples, the complex modulus remains almost the same after the organic matter degradation. This behavior was also evident from the values of the fitting parameters (i.e., slope) of Equation (1) for the experimental data of complex modulus (Table S4). The comparison between PoE and fluid mud samples from PoH for change in complex modulus at 1 Hz due to the organic matter degradation is presented in Figure 6b. It is again evident that the mud samples from PoE displayed an increase in complex modulus values after organic matter degradation (i.e., positive slope), while in the case of PoH, a pronounced negative slope was observed with significant reduction in complex modulus (Table S4).
The correlation between the change in phase angle at 1 Hz (degraded–fresh) and the values of phase angle at 1 Hz of fresh mud samples, obtained from different ports, was not prominent (Figure S6). However, the degraded samples from PoA, PoB and PoH exhibited positive values of change in phase angle (i.e., higher phase angle values of degraded samples as compared to the fresh samples), which indicated the weakening of these mud samples. However, for mud samples from PoE and PoR, negative values of change in phase angle were observed, which highlighted the strengthening of mud samples.
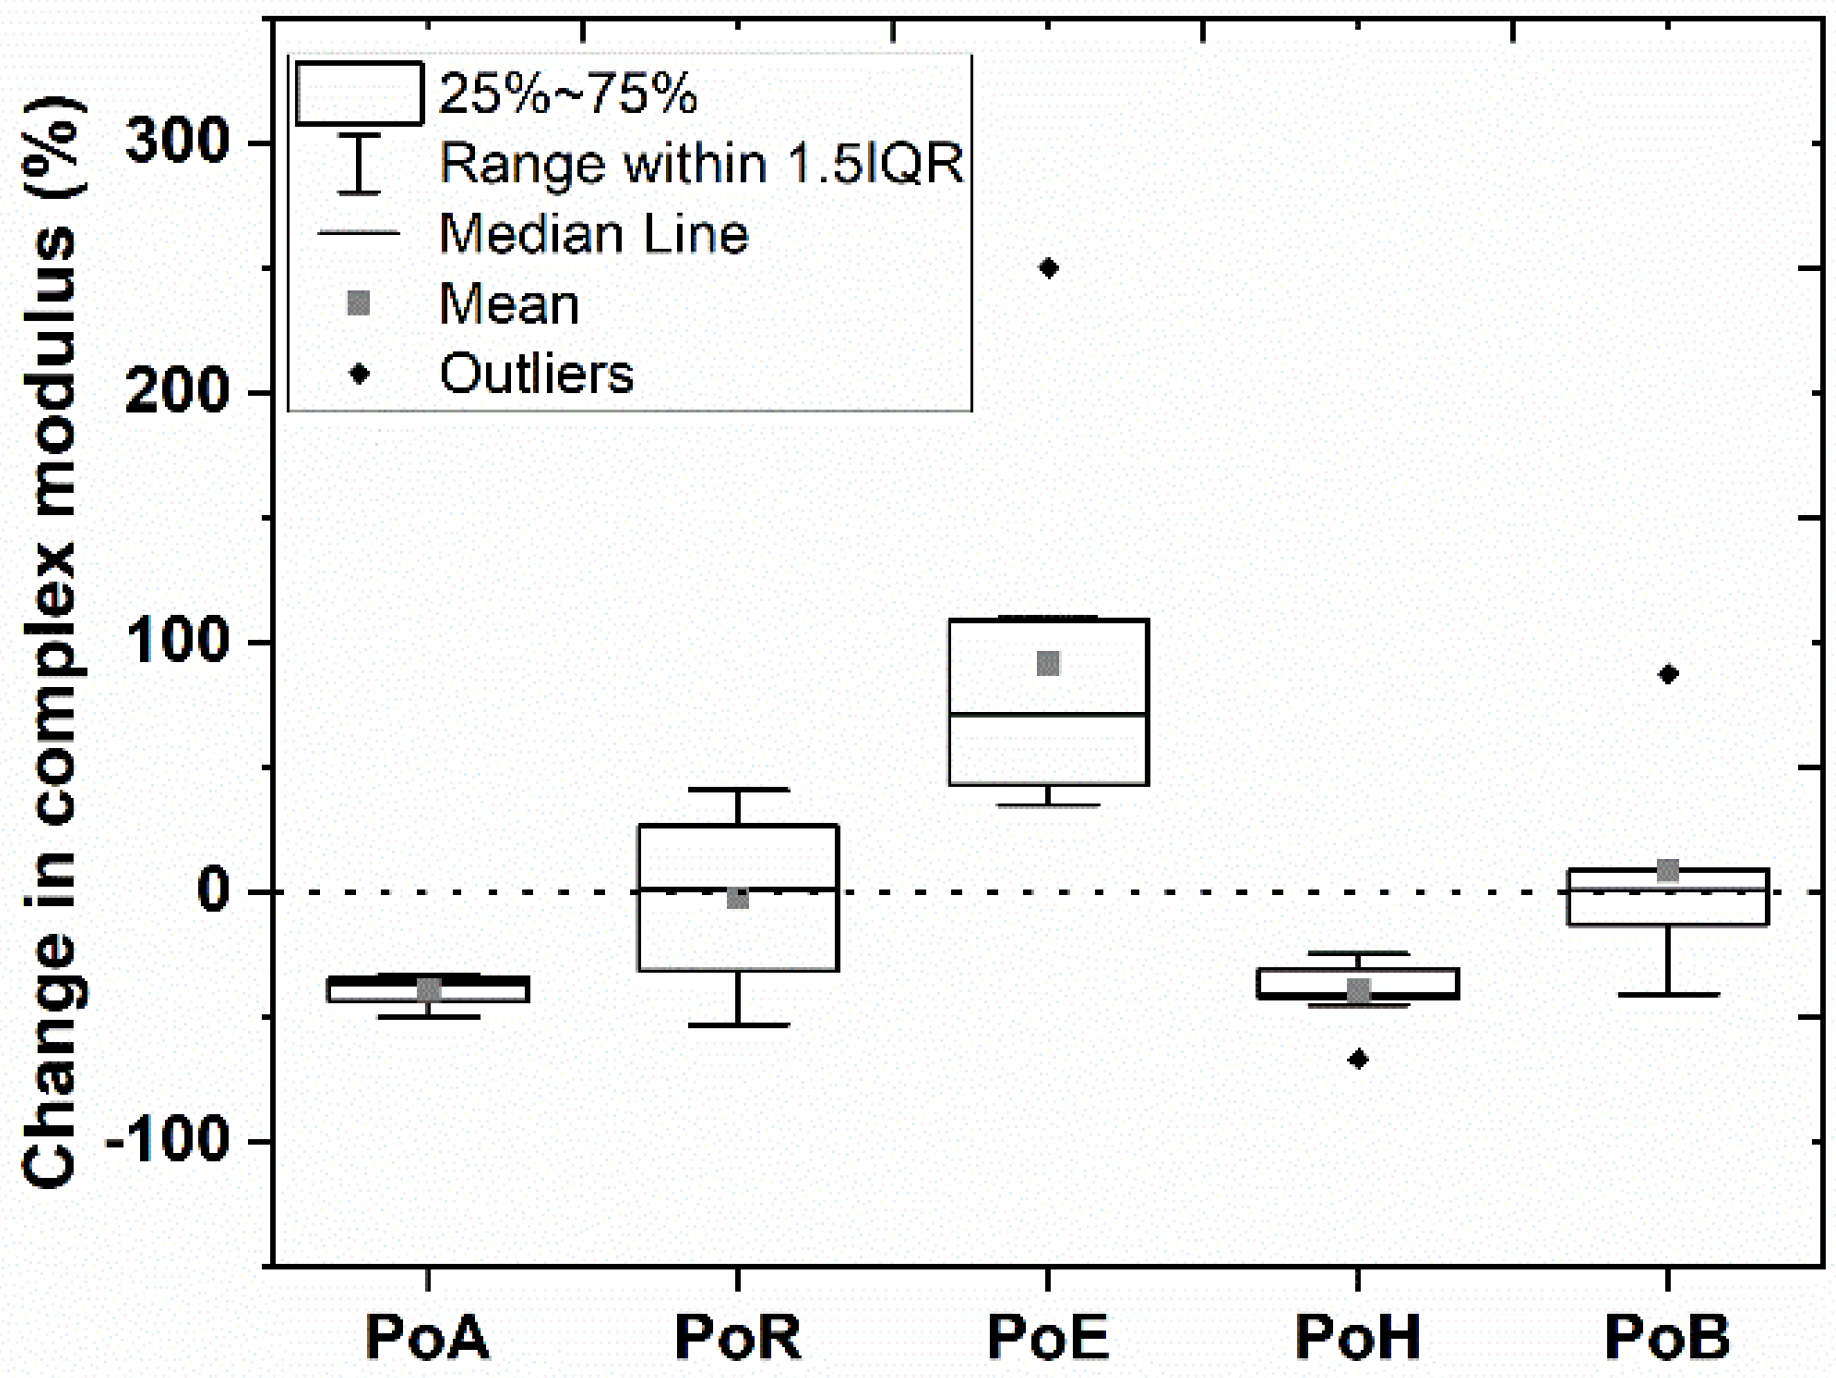
The percent change in complex modulus ( d e g r a d e d     f r e s h f r e s h × 100 )   after organic matter degradation for mud samples from different ports is shown in Figure 7. These results identified a significant reduction in complex modulus for PoA and PoH (~30–40% mean value), a negligible increase in complex modulus for PoB (~0–5% mean value), and a significant increase in complex modulus for PoE (~80% mean value). These results corresponded well to the outcome of yield stress and crossover amplitude. However, for mud samples from PoR, a negligible change in complex modulus was observed as compared to the changes in yield stresses and crossover amplitude. This behavior shows that the organic matter degradation strongly influenced the rheological property, which involves the destruction of structure (i.e., yield stress and crossover amplitude). While the effect of organic matter degradation on the rheological property, which is typically measured by having undisturbed structure (i.e., complex modulus within LVE regime), was negligible for the mud samples from PoR. This behavior may be attributed to the higher salinity (see Table S1 for conductivity values) of these samples, which results in stronger flocculated structure and compensates the decrease in modulus values due to the organic matter degradation. However, this compensation offered by the salt-induced flocculation was negligible for yield stresses and crossover amplitude due to the application of higher shearing action for these rheological properties and the weaker nature of salt-induced flocs [28].

3.6. Time Dependent and Structural Recovery Tests

Shear rate-controlled ramp-up and ramp-down experiments were performed from 0 to 100 s−1, in order to investigate the time-dependent behavior of fresh and degraded mud samples from different ports. The results of the time-dependent experiments revealed the existence of a typical clockwise loop at higher shear rates for both fresh and degraded mud samples (Figure S7). However, at lower shear rates, a counterclockwise loop was observed, which may be associated with a shear thickening phenomenon or a structural reorganization due to the shearing action [3,22]. A similar combination of clockwise and counterclockwise loops has already been reported in the literature for mud samples [29].
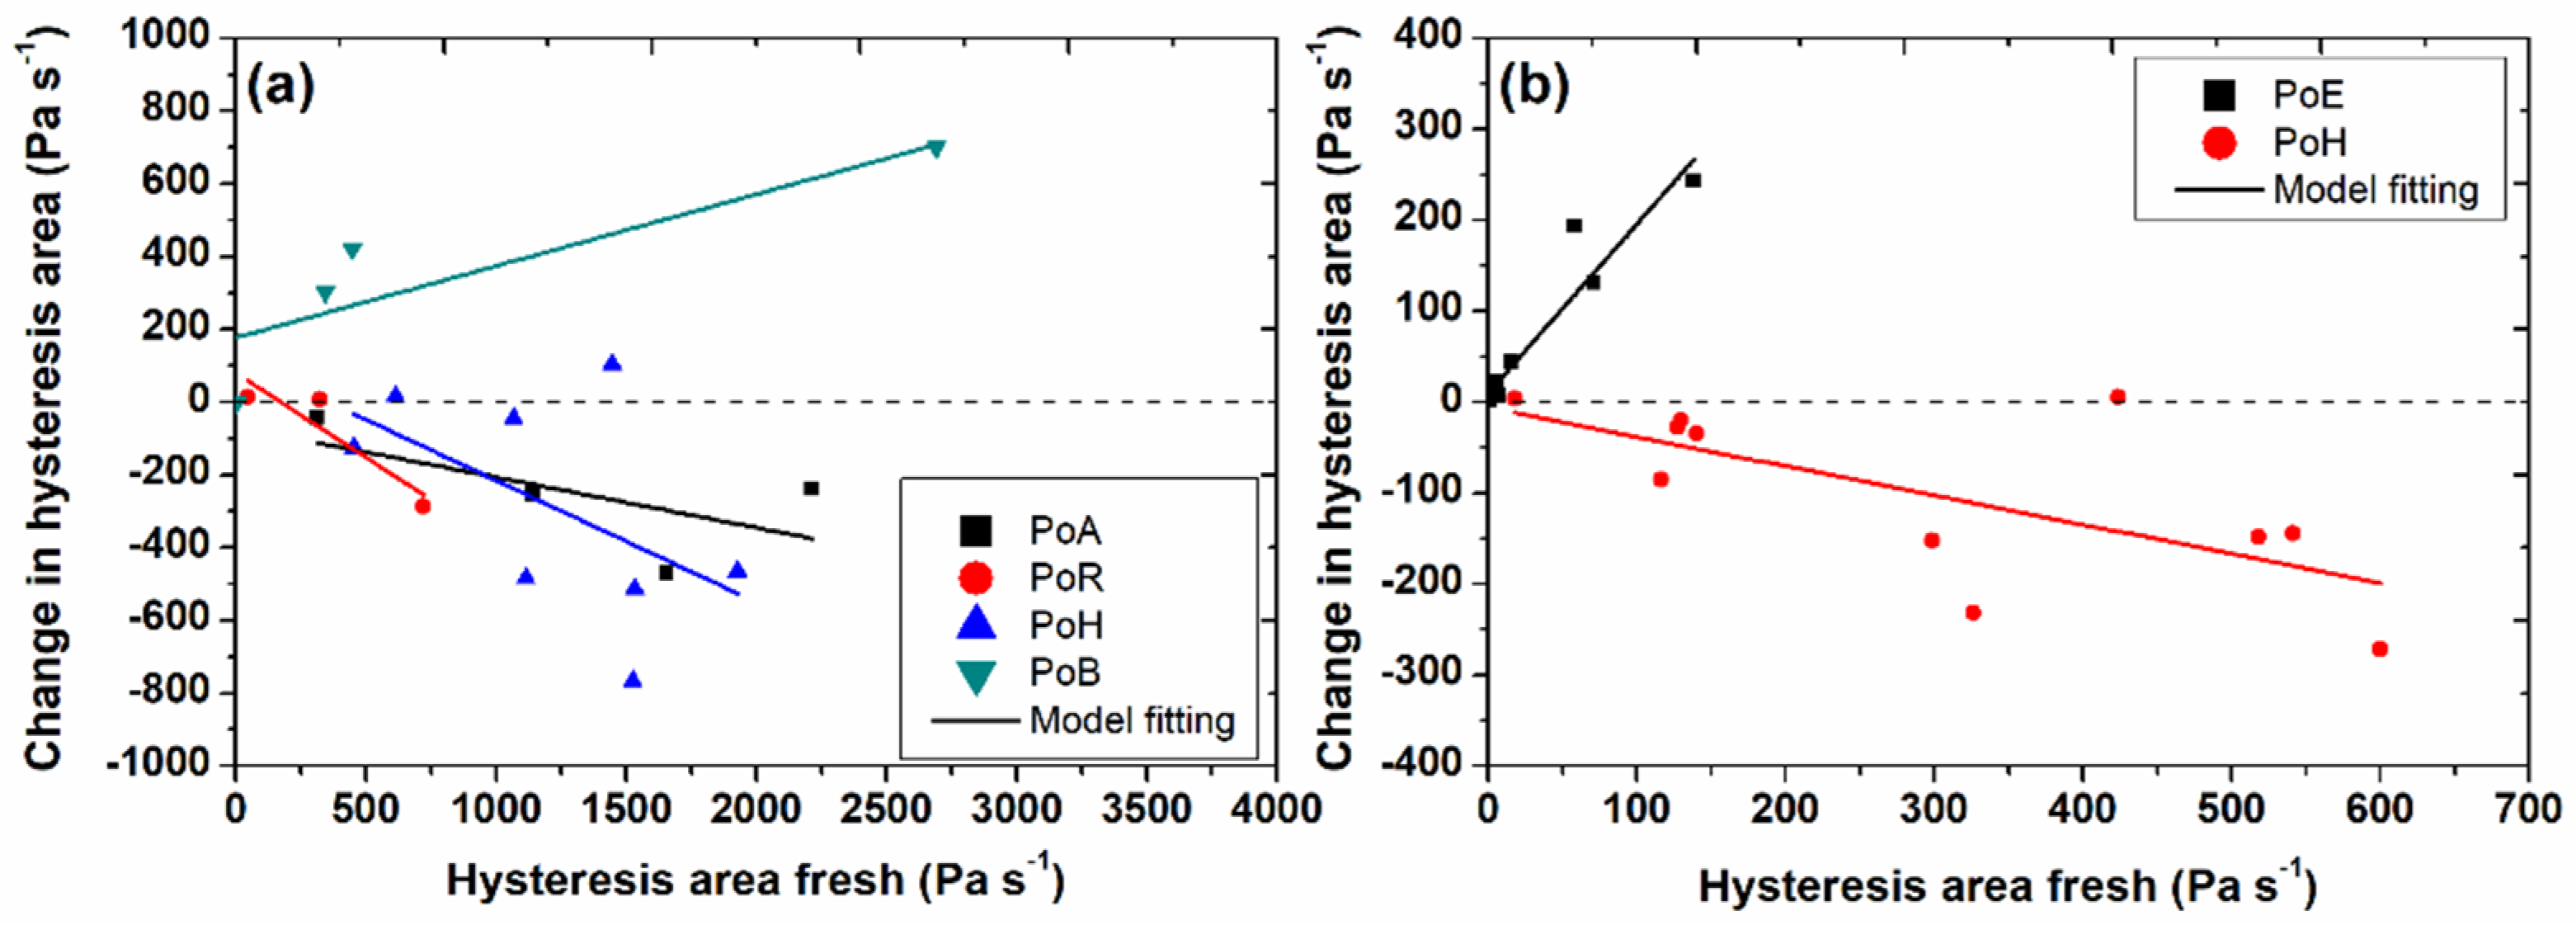
Furthermore, the hysteresis loop was significantly lower for the degraded mud samples as compared to the fresh mud samples, which is again in line with the previous results. The hysteresis area between the clockwise loop (i.e., shaded region in Figure S7) was estimated. The change in hysteresis area (degraded–fresh) as a function of the values of hysteresis area of fresh mud samples, for different ports, is presented in Figure 8a. A similar decrease in hysteresis area was found as a function of organic matter degradation as already observed for other rheological properties, except for mud samples from PoB. This behavior is also evident from the values of fitting parameters of Equation (1) for time-dependent experiment (Table S4). The mud samples from PoB displayed an increase in hysteresis area after the organic matter degradation, as also observed for PoE mud samples (Figure 8b).
The percent change in hysteresis area ( d e g r a d e d     f r e s h f r e s h × 100 )   after organic matter degradation for mud samples from different ports is shown in Figure 9. These results identified a significant reduction in hysteresis area for mud samples from PoA, PoH and PoR (~20–30% mean value) and a significant increase in hysteresis area for PoE mud samples (~210% mean value). These results again corresponded well to the outcome of yield stress and crossover amplitude. However, for mud samples from PoB, a substantial increase in hysteresis area (~50% mean value) was observed as compared to the changes in yield stresses and crossover amplitude. This behavior shows that the influence of organic matter degradation on the rheological property, which involves the destruction of structure (i.e., yield stress and crossover amplitude), was negligible for PoB mud samples. However, the organic matter degradation significantly affected the rheological property, which involves the measurement of a time-dependent response (i.e., stress/viscosity) of the mud samples from PoB. This behavior may be attributed to the different size and type of organic matter present in the mud samples from PoB, which needs further investigation.
In addition to the time-dependent characteristic of fresh and degraded mud samples, the structural recovery after intensive pre-shearing was investigated using a three-step protocol, as explained in Section 2.4. The normalized time-dependent storage modulus ( G / G 0 ) as a function of time for fresh and degraded mud samples is presented in Figure S8. The oscillations in the storage modulus behavior as a function of time may be associated with the higher elasticity of the samples, which is typically stated as creep ringing [19,30]. A simple stretched exponential function, adapted from Mobuchon et al. [31], was further used to fit the experimental data of the third step of structural recovery protocol, written as follows:
G G 0 = G i G 0 + ( ( G G i G 0 ) ( 1 exp [ ( t t r ) d ]   ) )
where G and t r represent the two most important parameters of equilibrium storage modulus and characteristic time of the material, respectively. G is the time-dependent storage modulus of mud after shearing, G 0 is the storage modulus before structural breakup, G i is the storage modulus right after pre-shearing (at t→0) and d 
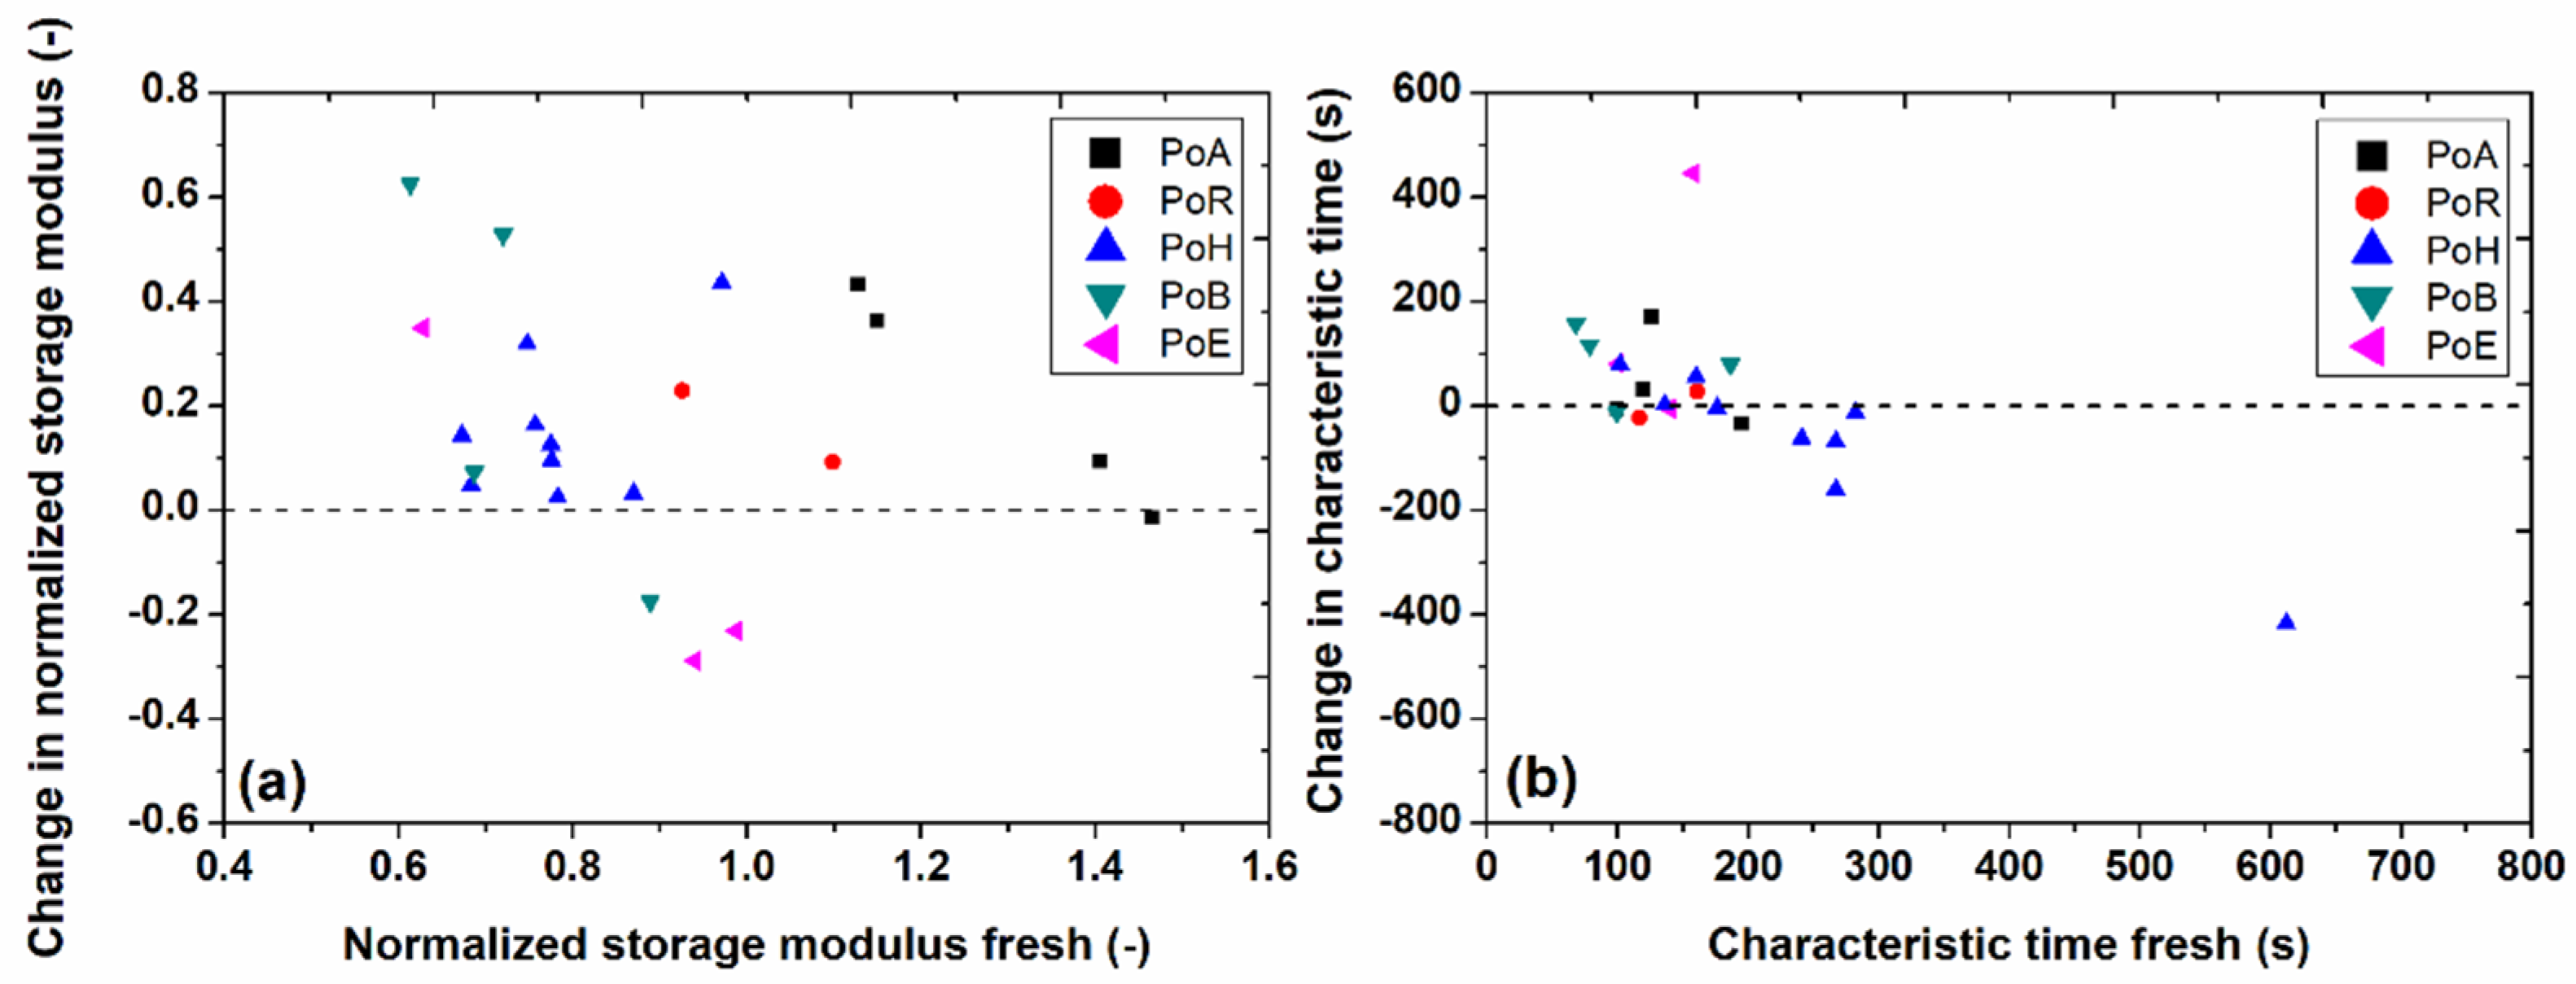
is the stretching exponent. The change in normalized equilibrium storage modulus, G / G 0 (degraded–fresh) as a function of the values of normalized equilibrium storage modulus of fresh mud samples is plotted in Figure 10a for different ports. It can be seen that the values of normalized equilibrium storage modulus ( G / G 0 ) are higher for the degraded mud samples than for the fresh mud samples (i.e., positive values of change in normalized equilibrium storage modulus). This may be attributed to the fact that the degradation of organic matter results in a weaker system, behaving as a purely mineral suspension without the bridging effect provided by organic matter, which eventually has a better structural recovery (i.e., higher values of modulus, higher strength) after pre-shearing. A similar enhanced structural recovery was observed in the literature for mud samples having lower organic matter content as compared to the samples having higher organic matter content [19].
Furthermore, Figure 10b shows a correlation between the change in characteristic time, t r (degraded–fresh) and the values of characteristic time of fresh mud samples, for different ports. It is evident that for some samples the characteristic time was higher for degraded samples as compared to fresh mud samples (i.e., positive value of change), while for other samples it was lower for degraded samples than the fresh samples (i.e., negative value of change). This behavior may again be linked to the variable density of the mud samples, in addition to the organic matter degradation.

4. Conclusions

The presence of clay-organic flocs in cohesive mud results in a complex rheological behavior of mud including viscoelasticity, shear-thinning, thixotropy and two-step yielding. The degradation of this organic matter, under anaerobic conditions, results in the formation of greenhouse gases (CO2 and CH4) and influences the rheological properties of mud by breaking/weakening the organic bridges between mineral particles. Hence, in this study, the effect of organic matter degradation on the rheological properties of mud samples, collected from different ports, was examined. The mud samples were collected from five different European ports (Port of Antwerp (PoA), Port of Bremerhaven (PoB), Port of Emden (PoE), Port of Hamburg (PoH) and Port of Rotterdam (PoR)), in order to have samples with varying sediment properties. The rheological analysis of fresh and degraded mud samples was performed with the help of several tests, including stress ramp-up tests, amplitude sweep tests, frequency sweep tests, time-dependent tests and structural recovery tests.
The results showed a significant reduction in yield stresses for PoA and PoH (~20–40% mean value), a less pronounced decrease in yield stresses for PoR (~10–20% mean value), a negligible change in yield stresses for PoB (~0–5% mean value), and a significant increase in yield stresses for PoE (~40–70% mean value). This varying behavior is attributed to the nature of organic matter and its degradability, port maintenance strategies and sediment properties. Moreover, in order to understand the increase in yield stresses after degradation of organic matter for mud samples of low gas production potential, such as from PoE, it is recommended to study the change in floc and biofilm structure that results from long-term laboratory incubations of organic mud suspensions, for example by using a floc camera setup. The similar trend was also observed for other rheological properties, including crossover amplitude and complex modulus for mud samples from different ports. For time-dependent tests, mud samples from PoB showed a substantial increase in hysteresis area (~50% mean value) as compared to the changes in yield stresses and crossover amplitude. This behavior may be attributed to the different size and type of organic matter present in the mud samples from PoB, which needs further investigation. Moreover, the structural recovery was higher for the degraded mud samples than for the fresh mud samples from different ports. This may be attributed to the fact that the degradation of organic matter results in a weaker system, behaving as a purely mineral suspension with better structural recovery. The analysis of gas production during degradation of organic matter showed a (i) significant release of carbon per g dry matter for mud samples from PoA, PoH and PoR, (ii) lower carbon release per g dry matter for mud samples from PoB, and (iii) a negligible carbon release per g dry matter for mud samples from PoE, which corresponded well with the change in rheological properties. This study provided a useful understanding about the influence of organic matter degradation on the rheological properties of mud from different European ports, which can be used to optimize sediment management strategies in ports and waterways.

Supplementary Materials

The following supporting information can be downloaded at: https://www.mdpi.com/article/10.3390/jmse10030446/s1, Table S1: Details of the mud samples collected from different European ports; Table S2: Particle size distribution, obtained by static light scattering technique, of the mud samples collected from different European ports; Table S3: Particle size distribution, obtained by sieving technique (DIN ISO 11277 2009), of the mud samples collected from different European ports; Table S4: The values of the fitting parameters of Equation (1) for different ports; Figure S1: Change in excess bulk density (degraded – fresh) as a function of excess bulk density ( ρ ρ w ) of fresh mud sample from different ports. The dashed line represents the value where the degraded and fresh mud samples have the same bulk densities; Figure S2: Particle size distribution of (a) mud samples from PoA, PoR, PoE, PoH and PoB; (b) mud samples from different locations of PoA obtained using static light scattering technique; Figure S3: Apparent viscosity as a function of shear stress for fresh mud samples (filled symbol) and mud samples degraded for 250 days (empty symbols) collected from different ports. The dashed lines represent the static ( τ s ) and fluidic ( τ f ) yield stresses; Figure S4: Phase angle as a function of oscillatory stress amplitude for fresh mud samples (filled symbol) and mud samples degraded for 250 days (empty symbols) collected from different ports. The dashed line represents the crossover amplitude (i.e., G = G or phase angle = 45°); Figure S5: (a) Complex modulus and (b) phase angle as a function of frequency for fresh mud samples (filled symbol) and mud samples degraded for 250 days (empty symbols) collected from different ports. The dashed lines represent the complex modulus and phase angle at 1 Hz, which is typically used for comparative analysis of different samples; Figure S6: Change in phase angle (degraded – fresh) at 1 Hz as a function of phase angle at 1 Hz of fresh mud samples from different ports. The dashed line represents the value where the degraded and fresh mud samples have same phase angle at 1 Hz; Figure S7: Shear stress as a function of shear rate obtained by performing shear rate controlled ramp-up and ramp-down experiments for fresh mud sample and mud sample degraded for 250 days, collected from PoH. The direction of arrows represent the ramp-up or ramp-down curve. The filled region represents the hysteresis area; Figure S8: Normalized time dependent storage modulus, G / G 0 as a function of time obtained from the structural recovery step for fresh mud sample and mud sample degraded for 250 days, collected from PoH. The solid line represents the empirical fitting using Equation (2).

Author Contributions

Conceptualization: A.S., A.K., J.G. and C.C.; Formal analysis: A.S., F.Z. and J.G.; Investigation: A.S. and F.Z.; Methodology: A.S. and F.Z.; Project administration: A.K.; Supervision: J.G. and C.C.; Writing—original draft: A.S.; Writing—review and editing: A.K., J.G. and C.C. All authors have read and agreed to the published version of the manuscript.

Funding

This study is funded by the Hamburg Port Authority.

Institutional Review Board Statement

Not applicable.

Informed Consent Statement

Not applicable.

Data Availability Statement

The data presented in this study are available on request from the corresponding author.

Acknowledgments

This study is carried out within the framework of the MUDNET academic network: https://www.tudelft.nl/mudnet/ (accessed on 26 January 2022). The authors would like to acknowledge Deltares, the Netherlands, for the use of the HAAKE MARS I rheometer, which was made possible thanks to the Memorandum of Understanding signed between Deltares and the TU Delft.

Conflicts of Interest

The authors declare no conflict of interest.

References

  1. Lagaly, G.; Dékány, I. Chapter 8—Colloid Clay Science. In Developments in Clay Science; Bergaya, F., Lagaly, G., Eds.; Elsevier: Amsterdam, The Netherlands, 2013; Volume 5, pp. 243–345. [Google Scholar]
  2. Coussot, P. Mudflow Rheology and Dynamics; CRC Press: Rotterdam, The Netherlands, 1997; p. 272. [Google Scholar]
  3. Shakeel, A.; Kirichek, A.; Chassagne, C. Rheological analysis of mud from Port of Hamburg, Germany. J. Soils Sediments 2020, 20, 2553–2562. [Google Scholar] [CrossRef] [Green Version]
  4. Shakeel, A.; Kirichek, A.; Chassagne, C. Yield stress measurements of mud sediments using different rheological methods and geometries: An evidence of two-step yielding. Mar. Geol. 2020, 427, 106247. [Google Scholar] [CrossRef]
  5. Van Kessel, T.; Blom, C. Rheology of cohesive sediments: Comparison between a natural and an artificial mud. J. Hydraul. Res. 1998, 36, 591–612. [Google Scholar] [CrossRef]
  6. Shakeel, A.; Kirichek, A.; Chassagne, C. Is density enough to predict the rheology of natural sediments? Geo Mar. Lett. 2019, 39, 427–434. [Google Scholar] [CrossRef] [Green Version]
  7. Zander, F.; Heimovaara, T.; Gebert, J. Spatial variability of organic matter degradability in tidal Elbe sediments. J. Soils Sediments 2020, 20, 2573–2587. [Google Scholar] [CrossRef] [Green Version]
  8. Malarkey, J.; Baas, J.H.; Hope, J.A.; Aspden, R.J.; Parsons, D.R.; Peakall, J.; Paterson, D.M.; Schindler, R.J.; Ye, L.; Lichtman, I.D.; et al. The pervasive role of biological cohesion in bedform development. Nat. Commun. 2015, 6, 6257. [Google Scholar] [CrossRef] [Green Version]
  9. Parsons, D.R.; Schindler, R.J.; Hope, J.A.; Malarkey, J.; Baas, J.H.; Peakall, J.; Manning, A.J.; Ye, L.; Simmons, S.; Paterson, D.M.; et al. The role of biophysical cohesion on subaqueous bed form size. Geophys. Res. Lett. 2016, 43, 1566–1573. [Google Scholar] [CrossRef] [Green Version]
  10. Schindler, R.J.; Parsons, D.R.; Ye, L.; Hope, J.A.; Baas, J.H.; Peakall, J.; Manning, A.J.; Aspden, R.J.; Malarkey, J.; Simmons, S.; et al. Sticky stuff: Redefining bedform prediction in modern and ancient environments. Geology 2015, 43, 399–402. [Google Scholar] [CrossRef] [Green Version]
  11. Tolhurst, T.J.; Gust, G.; Paterson, D.M. The influence of an extracellular polymeric substance (EPS) on cohesive sediment stability. Proc. Mar. Sci. 2002, 5, 409–425. [Google Scholar]
  12. Wurpts, R.; Torn, P. 15 years experience with fluid mud: Definition of the nautical bottom with rheological parameters. Terra Aqua 2005, 99, 22–32. [Google Scholar]
  13. Shakeel, A.; Zander, F.; De Klerk, J.; Kirichek, A.; Gebert, J.; Chassagne, C. Effect of organic matter degradation in cohesive sediment: A detailed rheological analysis. J. Soils Sediments 2022, 1–10. [Google Scholar] [CrossRef]
  14. Zander, F.; Shakeel, A.; Kirichek, A.; Chassagne, C.; Gebert, J. Effect of organic matter degradation in cohesive sediment: A spatiotemporal analysis of yield stresses. J. Soils Sediments 2022, 1–10. [Google Scholar] [CrossRef]
  15. ISO 11465; Soil Quality—Determination of Dry Matter and Water Content on a Mass Basis—Gravimetric Method. International Organization for Standardization: Geneva, Switzerland, 1993.
  16. ISO 10694; Soil Quality—Determination of Organic and Total Carbon after Dry Combustion (Elementary Analysis). International Organization for Standardization: Geneva, Switzerland, 1995.
  17. Sander, R. Compilation of Henry’s law constants (version 4.0) for water as solvent. Atmos. Chem. Phys. 2015, 15, 4399–4981. [Google Scholar] [CrossRef] [Green Version]
  18. Shakeel, A.; Kirichek, A.; Talmon, A.; Chassagne, C. Rheological analysis and rheological modelling of mud sediments: What is the best protocol for maintenance of ports and waterways? Estuar. Coast. Shelf Sci. 2021, 257, 107407. [Google Scholar] [CrossRef]
  19. Shakeel, A.; Kirichek, A.; Chassagne, C. Effect of pre-shearing on the steady and dynamic rheological properties of mud sediments. Mar. Pet. Geol. 2020, 116, 104338. [Google Scholar] [CrossRef]
  20. ISO 11277; Soil Quality–Determination of Particle Size Distribution in Mineral Soil Material–Method by Sieving and Sedimentation. International Organization for Standardization: Geneva, Switzerland, 2009.
  21. Nie, S.; Jiang, Q.; Cui, L.; Zhang, C. Investigation on solid-liquid transition of soft mud under steady and oscillatory shear loads. Sediment. Geol. 2020, 397, 105570. [Google Scholar] [CrossRef]
  22. Shakeel, A.; MacIver, M.R.; van Kan, P.J.M.; Kirichek, A.; Chassagne, C. A rheological and microstructural study of two-step yielding in mud samples from a port area. Colloids Surf. A Physicochem. Eng. Asp. 2021, 624, 126827. [Google Scholar] [CrossRef]
  23. Fass, R.W.; Wartel, S.I. Rheological properties of sediment suspensions from Eckernforde and Kieler Forde Bays, Western Baltic Sea. Int. J. Sediment Res. 2006, 21, 24–41. [Google Scholar]
  24. Lupi, F.R.; Shakeel, A.; Greco, V.; Oliviero Rossi, C.; Baldino, N.; Gabriele, D. A rheological and microstructural characterisation of bigels for cosmetic and pharmaceutical uses. Mater. Sci. Eng. C 2016, 69, 358–365. [Google Scholar] [CrossRef]
  25. Shakeel, A.; Kirichek, A.; Chassagne, C. Rheological analysis of natural and diluted mud suspensions. J. Non Newton. Fluid Mech. 2020, 286, 104434. [Google Scholar] [CrossRef]
  26. Soltanpour, M.; Samsami, F. A comparative study on the rheology and wave dissipation of kaolinite and natural Hendijan Coast mud, the Persian Gulf. Ocean Dyn. 2011, 61, 295–309. [Google Scholar] [CrossRef]
  27. Xu, J.; Huhe, A. Rheological study of mudflows at Lianyungang in China. Int. J. Sediment Res. 2016, 31, 71–78. [Google Scholar] [CrossRef]
  28. Mietta, F.; Chassagne, C.; Winterwerp, J.C. Shear-induced flocculation of a suspension of kaolinite as function of pH and salt concentration. J. Colloid Interface Sci. 2009, 336, 134–141. [Google Scholar] [CrossRef]
  29. Yang, W.; Yu, G.-L.; Tan, S.K.; Wang, H.-K. Rheological properties of dense natural cohesive sediments subject to shear loadings. Int. J. Sediment Res. 2014, 29, 454–470. [Google Scholar] [CrossRef]
  30. Goudoulas, T.B.; Germann, N. Viscoelastic properties of polyacrylamide solutions from creep ringing data. J. Rheol. 2016, 60, 491–502. [Google Scholar] [CrossRef]
  31. Mobuchon, C.; Carreau, P.J.; Heuzey, M.-C. Structural analysis of non-aqueous layered silicate suspensions subjected to shear flow. J. Rheol. 2009, 53, 1025–1048. [Google Scholar] [CrossRef] [Green Version]
Figure 1. Cumulative carbon release after 250 days of degradation normalized to dry mass for mud samples (a) from different ports, and (b) from PoE and fluid mud samples from PoH. 1.5IQR, factor 1.5 of the interquartile range (25~75%).
Jmse 10 00446 g001
Figure 2. Change in static yield stress (degraded–fresh) as a function of static yield stress of fresh mud samples (a) from different ports and (b) from PoE and fluid mud samples from PoH; (b) change in fluidic yield stress (degraded–fresh) as a function of fluidic yield stress of fresh mud samples (c) from different ports and (d) from PoE and fluid mud samples from PoH. The dashed line represents the value where the degraded and fresh mud samples have the same yield stresses. The solid line represents the empirical fitting using Equation (1).
Jmse 10 00446 g002
Figure 3. Percent change in (a) static and (b) fluidic yield stresses ( d e g r a d e d     f r e s h f r e s h × 100 ) of mud samples from different ports. 1.5IQR, factor 1.5 of the interquartile range (25~75%). Negative values represent the percent decrease in yield stresses after degradation, while positive values represent the percent increase in yield stresses after degradation.
Jmse 10 00446 g003
Figure 4. Change in crossover amplitude (degraded–fresh) as a function of crossover amplitude of fresh mud samples (a) from different ports and (b) from PoE and fluid mud samples from PoH. The dashed line represents the value where the degraded and fresh mud samples have the same crossover amplitude. The solid line represents the empirical fitting using Equation (1).
Jmse 10 00446 g004
Figure 5. Percent change in crossover amplitude ( d e g r a d e d     f r e s h f r e s h × 100 ) of mud samples from different ports. 1.5IQR, factor 1.5 of the interquartile range (25~75%). Negative values represent the percent decrease in crossover amplitude, while positive values represent the percent increase in crossover amplitude after degradation.
Jmse 10 00446 g005
Figure 6. Change in complex modulus (degraded–fresh) at 1 Hz as a function of complex modulus at 1 Hz of fresh mud samples (a) from different ports and (b) from PoE and fluid mud samples from PoH. The solid line represents the empirical fitting using Equation (1). The dashed line represents the value where the degraded and fresh mud samples have the same complex modulus at 1 Hz.
Jmse 10 00446 g006
Figure 7. Percent change in complex modulus at 1 Hz ( d e g r a d e d     f r e s h f r e s h × 100 ) of mud samples from different ports. 1.5IQR, factor 1.5 of the interquartile range (25~75%). Negative values represent the percent decrease in the complex modulus, while positive values represent the percent increase in the complex modulus after degradation.
Jmse 10 00446 g007
Figure 8. Change in hysteresis area (degraded–fresh) as a function of hysteresis area of fresh mud samples (a) from different ports and (b) from PoE and fluid mud samples from PoH. The dashed line represents the value where the degraded and fresh mud samples have the same hysteresis area. The solid line represents the empirical fitting using Equation (1).
Jmse 10 00446 g008
Figure 9. Percent change in the hysteresis area ( d e g r a d e d     f r e s h f r e s h × 100 ) of mud samples from different ports. 1.5IQR, factor 1.5 of the interquartile range (25~75%). Negative values represent the percent decrease in the hysteresis area, while positive values represent the percent increase in the hysteresis area after degradation.
Jmse 10 00446 g009
Figure 10. (a) Change in normalized equilibrium storage modulus, G / G 0 (degraded–fresh) as a function of normalized equilibrium storage modulus, G / G 0 of fresh mud samples from different ports, and (b) change in characteristic time, t r (degraded–fresh) as a function of characteristic time, t r of fresh mud samples from different ports. The dashed line represents the value where the degraded and fresh mud samples have same normalized equilibrium storage modulus or characteristic time.
Jmse 10 00446 g010
Publisher’s Note: MDPI stays neutral with regard to jurisdictional claims in published maps and institutional affiliations.

