Article

Hydrodynamic Performance of Full-Scale T0 and T90 Codends with and without a Codend Cover

1
Centre for Sustainable Aquatic Resources, Fisheries and Marine Institute, Memorial University of Newfoundland, P.O. Box 4920, St. John’s, NL A1C 5R3, Canada
2
Hampidjan Canada Ltd., 527 Conception Bay Hwy, Spaniard’s Bay, NL A0A 3X0, Canada
*
Author to whom correspondence should be addressed.
Current address: School of Environmental Science and Engineering, Hubei Polytechnic University, 16 Guilinbei Road, Huangshi 435003, Hubei, China.
J. Mar. Sci. Eng. 2022, 10(3), 440; https://doi.org/10.3390/jmse10030440
Submission received: 25 February 2022 / Revised: 15 March 2022 / Accepted: 16 March 2022 / Published: 18 March 2022
(This article belongs to the Section Ocean Engineering)

Abstract

:
The hydrodynamic performance of one full-scale T0 (mesh size 90 mm) and three T90 (mesh size 90, 100, and 110 mm) codends was investigated and compared using flume tank testing, with and without a small-mesh cover. We evaluated how flow velocity, mesh circularity, and drag changed in each codend at five different towing speeds (0.5–0.9 m/s). The results demonstrated that flow velocity decreased along the length of a codend, and this effect was pronounced in the T0 codend. Increasing the mesh size of T90 codends from 90 to 110 mm did not significantly affect flow velocity. A novel parameter, termed mesh circularity, was developed and introduced to describe mesh opening. Mesh circularity in the T0 codend decreased along the length of the codend, which contrasted with the T90 codends. Results showed that the T90 codends maintained relatively open meshes (circularity ranged from ~0.8 to 1.0 along the length of the codend) compared to the T0 (circularity ranged from ~0.6 to 0.4). Each T90 codend had a significantly (p < 0.05) higher drag than the T0 codend when using the same simulated catch. For the covered codend comparisons, the flow velocity in the area between codend and cover did not change for the T0 codend (p > 0.05), but was significantly different for the T90 codend (p < 0.05). The results of this research provide fundamental knowledge useful for understanding and improving selectivity of trawls in marine fisheries, especially for revealing the masking effects of the cover net on the codend.

1. Introduction

The codend is the terminal section of a trawl where the catch accumulates and is retained. It is considered the most important trawl component in terms of the selection process, where different mesh sizes can be applied to increase the sorting of unwanted animals by species and size [1]. However, during this process, the unavoidable capture of juvenile, undersized, or nonmarketable species also occurs (called bycatch), which is problematic for fisheries management and population conservation [2,3]. Improving the selectivity of trawl codends is one of the effective ways to reduce bycatch in trawling fisheries.
The covered codend method is commonly used for estimating selectivity of towed fishing gears [4]. In order to retain the fish escaping through a codend, a small mesh cover is often used in codend selectivity research [1]. Through analyzing the catch data from the codend and the cover, the selectivity of the codend can be estimated. However, the cover may affect fish escaping from the codend mesh and, therefore, affect the estimation of codend selectivity [5]. When conducting a codend selectivity experiment with a cover, it is important to consider the possible effects of the cover on the codend.
Many studies have been undertaken to improve the size selectivity of trawls focusing on modifications to the codend. Over the last few decades, researchers have investigated the effects of mesh size [6], twine thickness [7], codend circumference [8], mesh orientation [9], lastridge ropes [10], and knotless netting [11]. Methodologies have ranged from computational fluid dynamics simulations [12,13,14] to morphological investigations of animal shape relative to the mesh [15] and at-sea observations of catch performance [16,17]. The field of science has expanded so quickly that several reviews are now available on the topic [18,19,20].
One area which has received only modest investigation is full-scale empirical observations of codend hydrodynamics. Understanding how water moves through a trawl codend, especially in response to bycatch reduction devices, is key to the effective development of viable fishing technologies [21]. The hydrodynamic performance of a trawl codend will affect its mesh shape and mesh opening [22]. Open meshes promote escapement of nontargeted fish. Water velocity also affects the swimming behavior of fish, which affects codend mesh selectivity [23]. Conducting these hydrodynamic observations at sea started with scientific divers in underwater vehicles [24,25]. However, in recent years, the use of flume tanks has increased remarkably, with several large modern facilities now available throughout the world [26,27]. Measuring water velocity, flow field, mesh opening, and codend dynamics is considerably easier in the controlled conditions of a laboratory setting. Bouhoubeiny et al. [28] used particle image velocimetry (PIV) to document the fine-scale flow field of a codend and its vortices. Madsen et al. [29] documented the behavior of T0, T90, and Bacoma codends in a flume tank, which provided basic information for improving selectivity.
Changing the mesh orientation is a relatively simple and potential way to improve the size selectivity of trawls. Rotating diamond netting 90° to the direction of tow (called T90) was first proposed in the 1980s [30]. Since then, several studies have documented improved size selectivity (i.e., reduction in bycatch and discards) for many species compared to codends constructed of traditional diamond (T0) netting [13,31,32]. While several studies have observed codends in a flume tank [4,33,34], to our knowledge, there is currently no published literature on the relative performance of T0 versus T90 codends with empirical data on flow velocity, mesh shape, and drag.
The purpose of this study was to compare the hydrodynamic performance of full-scale T0 and T90 codends, with and without a cover, using a flume tank. Important parameters that affect the performance of codends were quantified and compared between T0 and T90 codends, including flow velocity, mesh circularity, and drag. We also investigated the flow velocity between a codend and cover, for both T0 and T90 codends. The results are discussed in relation to codend selectivity and past engineering studies. The study provides fundamental knowledge useful for understanding the hydrodynamic performance of T0 and T90 codends, with and without a cover, and is important to understanding and improving the selectivity of trawl codends.

2. Materials and Methods

2.1. Gear Specifications
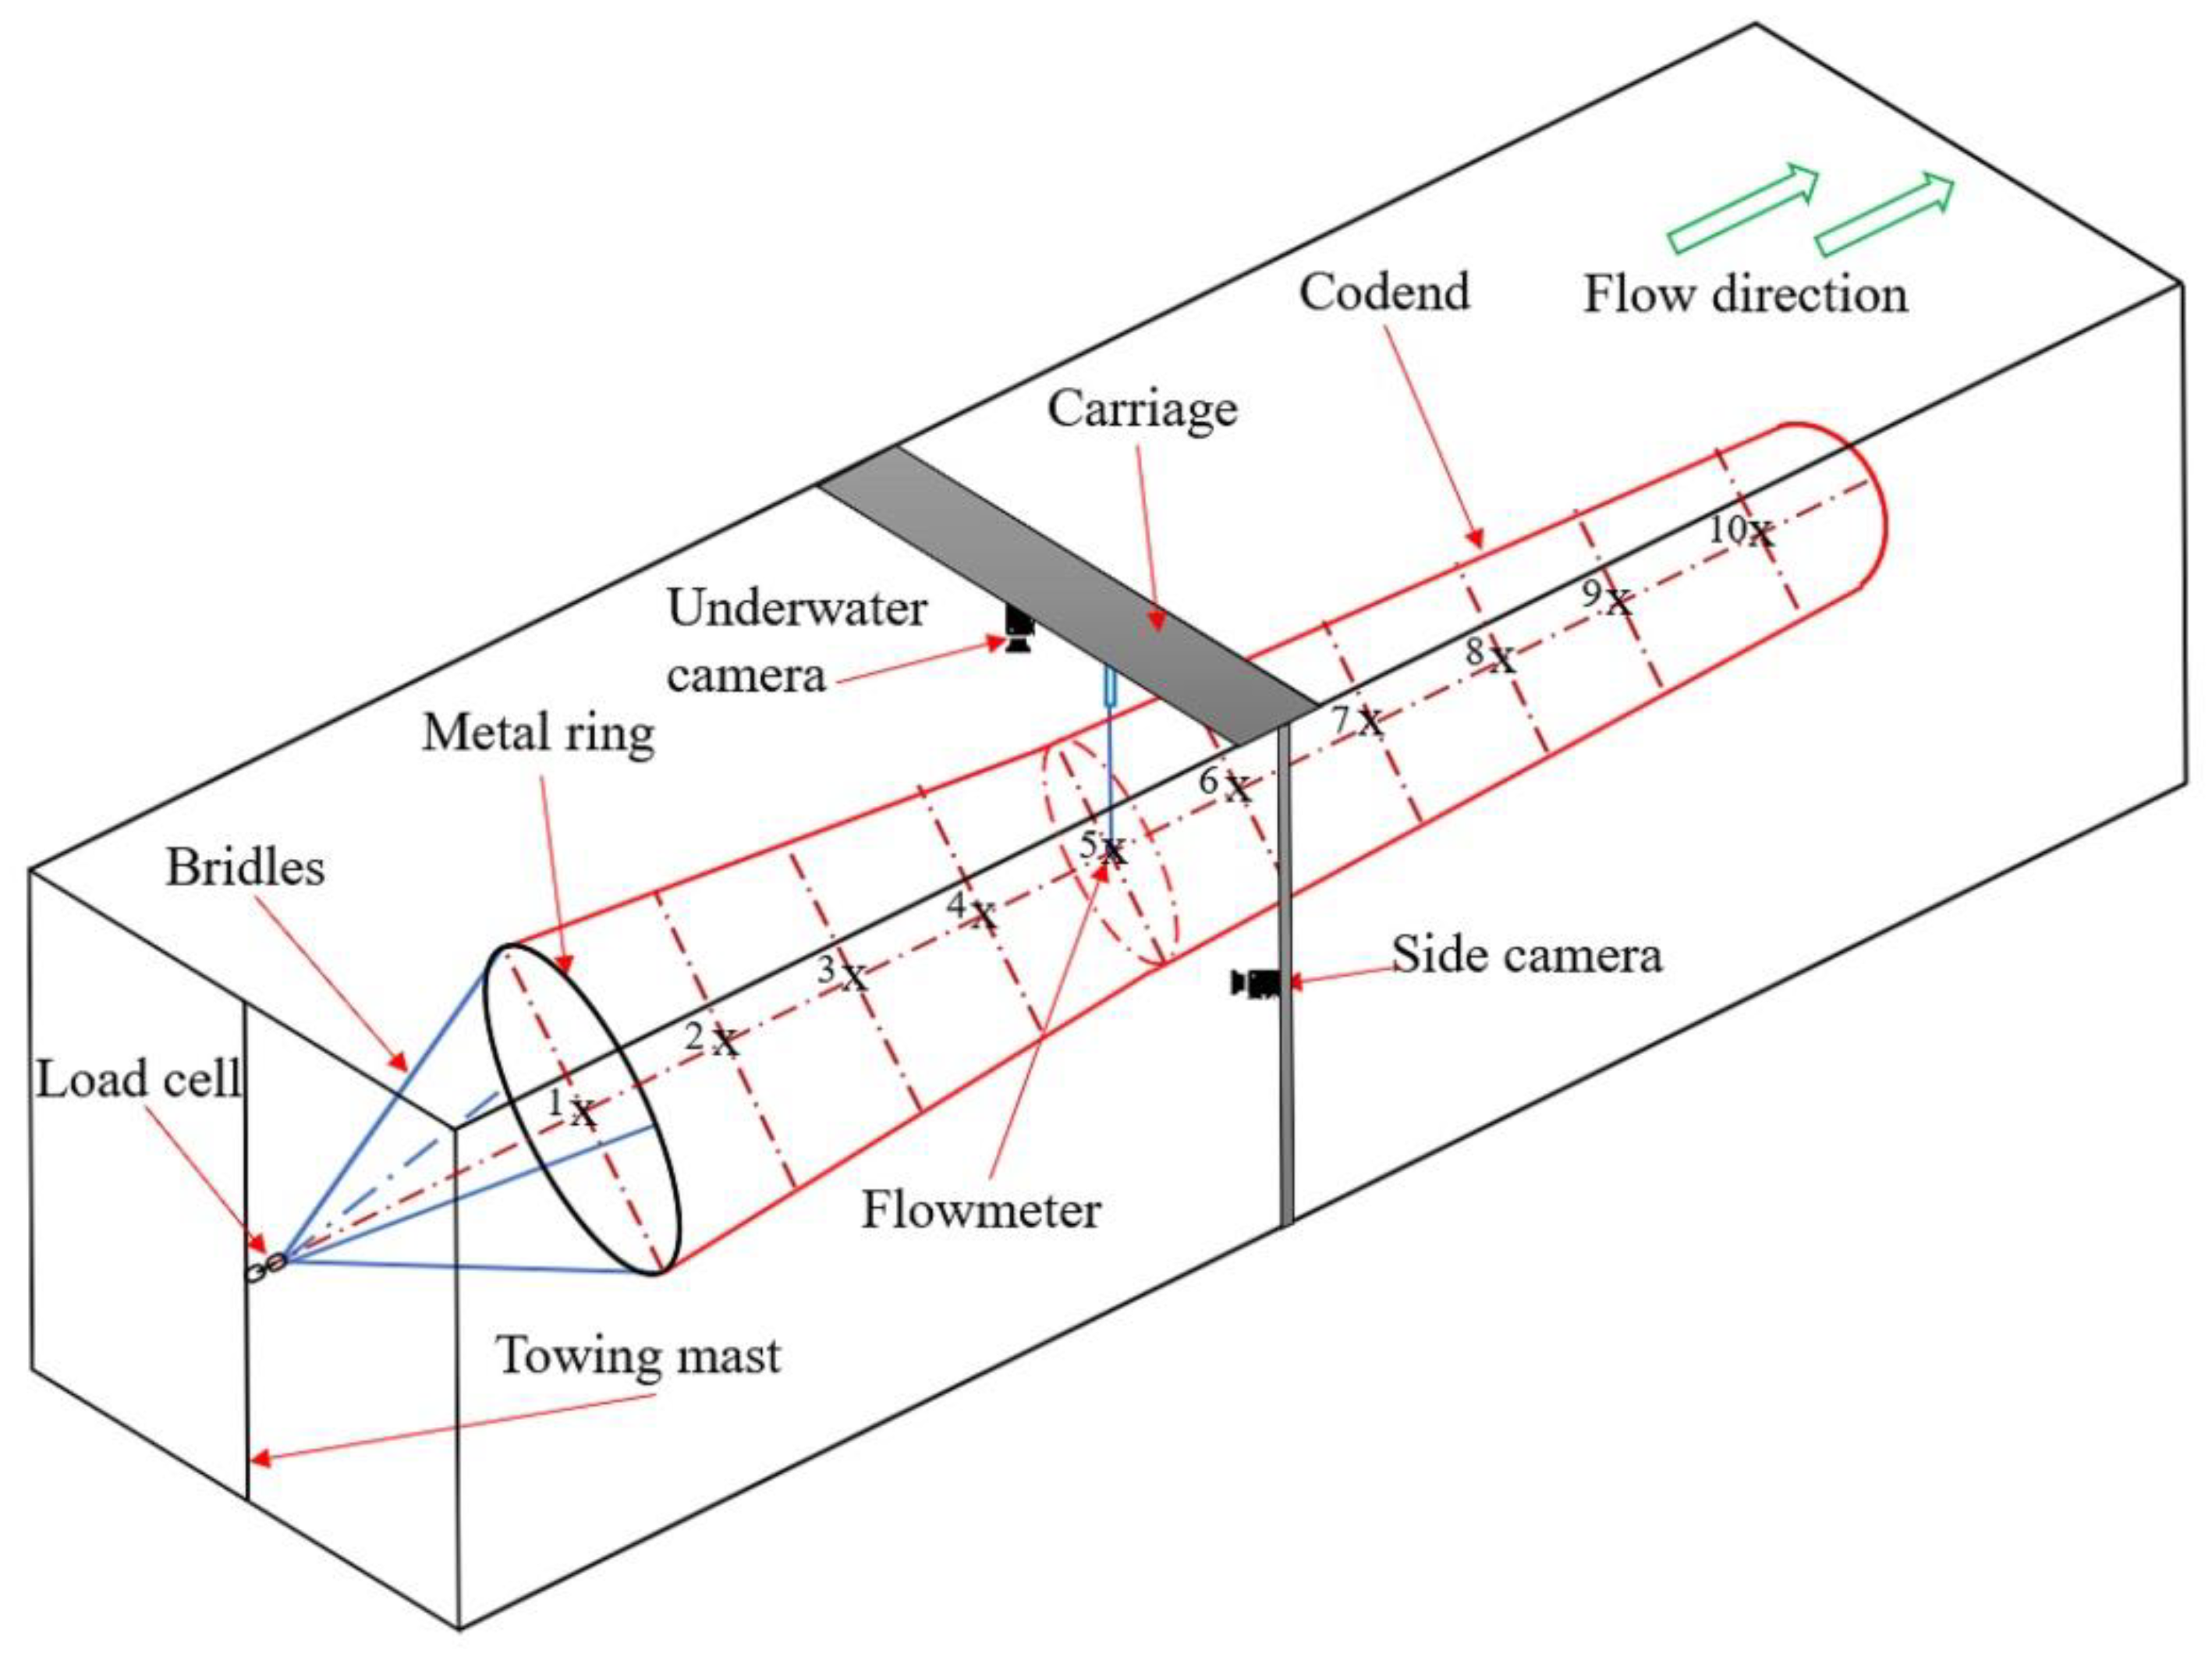
Four full-scale codends were used in this study (see descriptions in Table 1 and Cheng et al. [35] for net plans). They were designed by Hampidjan Canada Ltd. (Spaniard’s Bay, Newfoundland and Labrador, Canada), had four panels, and were constructed of double-braided polyethylene netting (nominal 4.6 mm Ø). Each codend was attached to an extension made of the same netting material. Only one of the codends was constructed with diamond netting in the traditional direction (T0). It had a nominal 90 mm stretched inside mesh opening and was typical for fisheries in eastern Canada. Three meshes constituted the selvedges. The riblines were made of three-strand polypropylene rope (30 mm Ø) and were 5% shorter in length than the selvedges. The remaining three codends were constructed using diamond netting rotated 90° (T90) with stretched inside mesh openings of 90 mm, 100 mm, and 110 mm (T90-90, T90-100, and T90-110, respectively). Two meshes constituted the selvedges. The riblines were made of Quicklines (DynIce DuxTM, Dyneema, 18/22 mm Ø) and were 5% shorter than the selvedges. The construction of the riblines was based on the company’s industry standards. The stretched inside mesh size was measured using an ICES OMEGA gauge following procedures described by Fonteyne [36]. Schematic net plans of the codends are available in Cheng et al. [35].

2.2. Flume Tank

Each codend was tested in the flume tank located at the Center for Sustainable Aquatic Resources (CSAR), Fisheries and Marine Institute of Memorial University, St. John’s, NL, Canada. The test section of the tank was 22.3 m long, 8.0 m wide, and 4 m deep. The side observation window was 20 m long and 3 m high. Maximum water speed (towing speed) was 1.0 m/s (see Winger et al. [26] and Kebede et al. [37] for details).
The codends were mounted on a steel ring (140 cm Ø) which was attached by four bridles (2 m) to a towing mast in the flume tank (Figure 1). The diameter of the steel ring was selected according to the mesh opening at this section of the trawl (H. DeLouche, Fisheries and Marine Institute, St. John’s, Newfoundland and Labrador, Canada, pers. comm.). Codend catch was simulated using perforated and flooded trawl floats (n = 80; 20 cm Ø; Pescaflot N-90, Castro, Donostia, Gipuzkoa, Spain). Each float had six 2.6 cm diameter holes drilled to balance its weight and buoyancy in water. Together, the 80 floats simulated a catch of approximately 350 kg (estimated according to the total volume of the floats).
A total of 10 measurement points were identified along the length of the codends (Figure 1). The distance between each position was 1.5 m. Measurement points were selected and marked prior to deployment in the flume tank. The first measurement point was set as a reference; no data were collected at this point. Measurement points 2 to 6 belonged to the extension piece, while measurement points 7 to 10 belonged to the codend section. A downward looking underwater camera (Sony FCB-ER8300, Minato, Tokyo, Japan) was used to determine the horizontal spread of the codend at each measurement point. A side-looking camera (Panasonic MDV12885, Kadoma, Osaka, Japan) perpendicular to the flume tank window was used to measure the vertical spread at each of the same measurement points.
Flow velocity (m/s) was measured using a two-axis electromagnetic current meter (Valeport Model 802, Valeport, St Peter’s Quay, Totnes, UK). At each measurement point, the data were collected over a period of 1 min (96 Hz) and were then averaged to get the velocity. The instrument was lowered vertically from the surface of the tank through an open mesh until the desired depth was achieved. At some locations, especially near the end of the codend, the vertical spread in the codend was often too small, limiting our ability to collect measurements at the locations. The measuring accuracy was ±5 mm/s plus 1% of averaged data.

2.3. Codend Hydrodynamics without a Cover
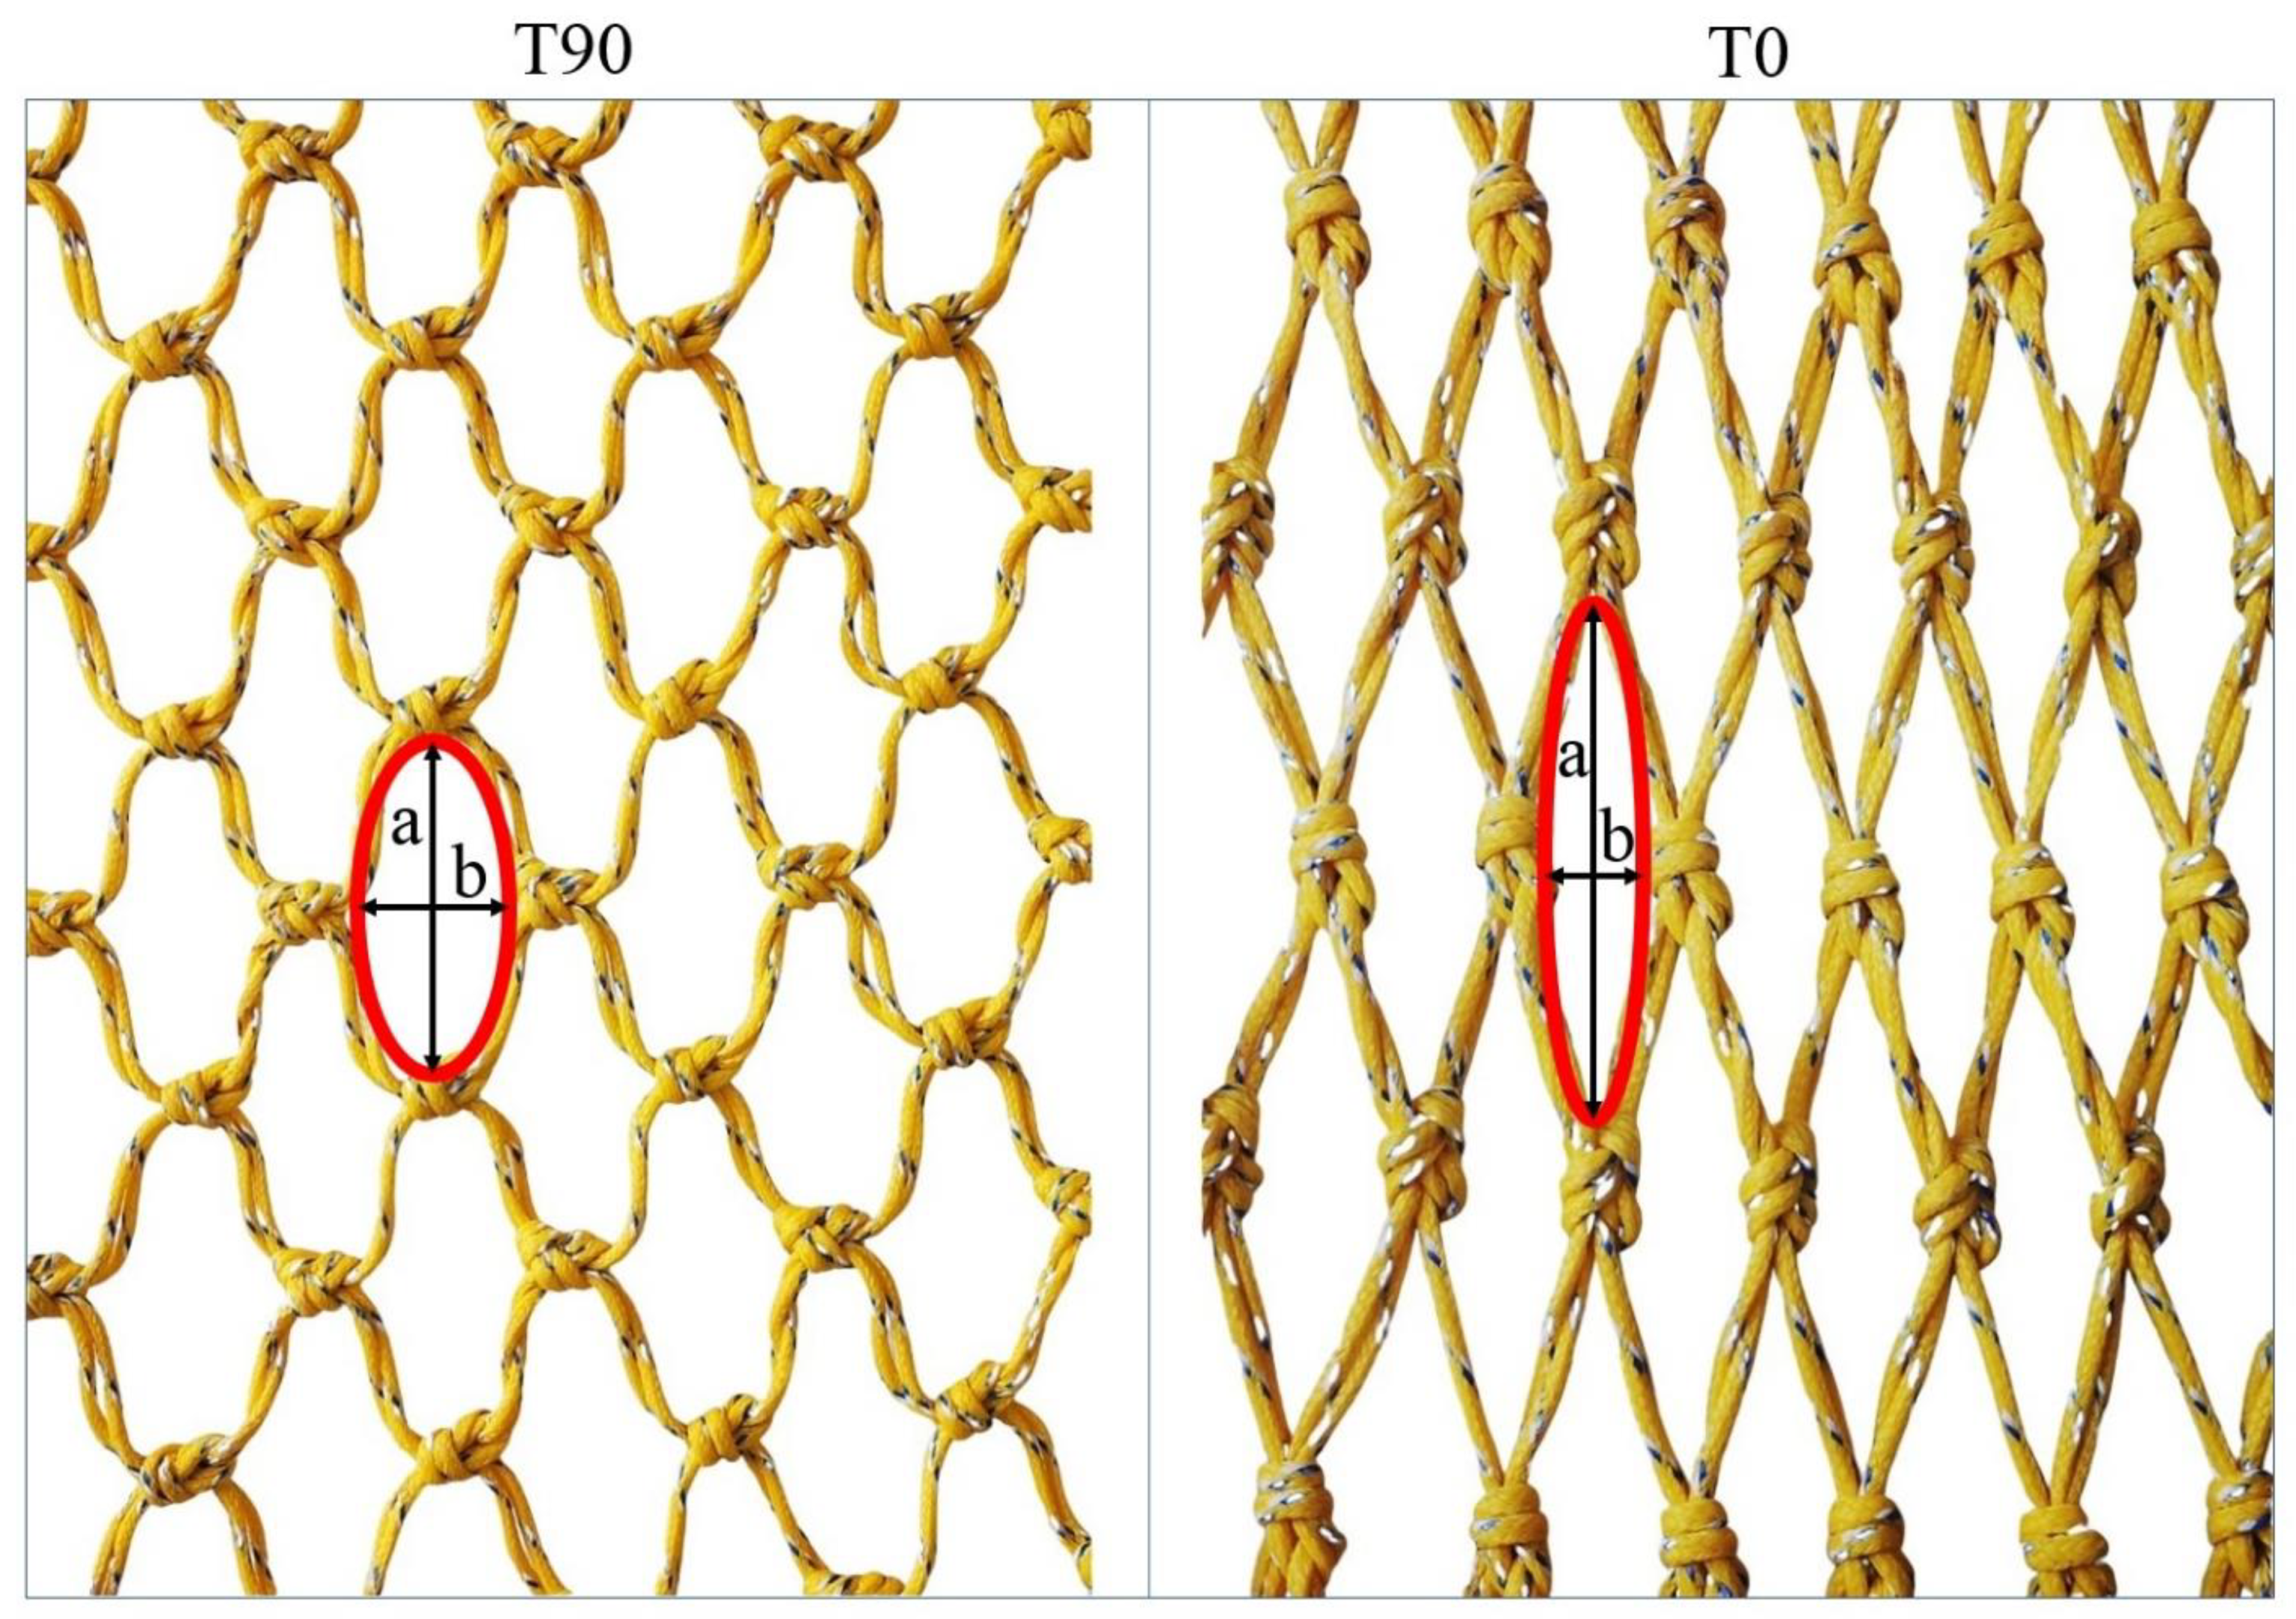
Our first experiment examined the hydrodynamics of the four codends without a cover. Towing speeds ranged from 0.5 to 0.9 m/s at increments of 0.1 m/s. At each towing speed, the mean flow velocity through the center of each codend was measured at the different measurement points.

2.3.1. Mesh Opening

For the mesh opening analysis, meshes were selected along the midline of the top panel. The downward-looking underwater camera recorded images at each of the measurement points (Figure 1). At least five meshes were selected for image analysis using ImageJ software following procedures described by Ferreira et al. [38]. Mesh shape was fitted with an ellipse shape (Figure 2). The circularity (Circ, Equation (1)) of the fitted ellipse was used to characterize the mesh opening, described by
Circ = (2 × a × b)/(a2 + b2),
where a is the length of major axis of the fitted ellipse, and b is the minor axis. The value of Circ cannot be smaller than 0.0 with a maximum value of 1.0. When Circ is equal to 0.0, this indicates a totally closed mesh. Circ equal to 1.0 suggests a perfect circle shape fitting the mesh.

2.3.2. Drag

An underwater load cell (Honeywell Sensotec Model 31, Honeywell International Inc., Charlotte, NC, USA) was inserted between the towing mast and bridles to measure the total drag (kgF, kilogram force) of the codend systems (Figure 1). The drag at each towing speed was recorded for all the codends with the same simulated catch size. Measurements were collected over a period of 1 min (50 Hz) and were then averaged to get the drag.

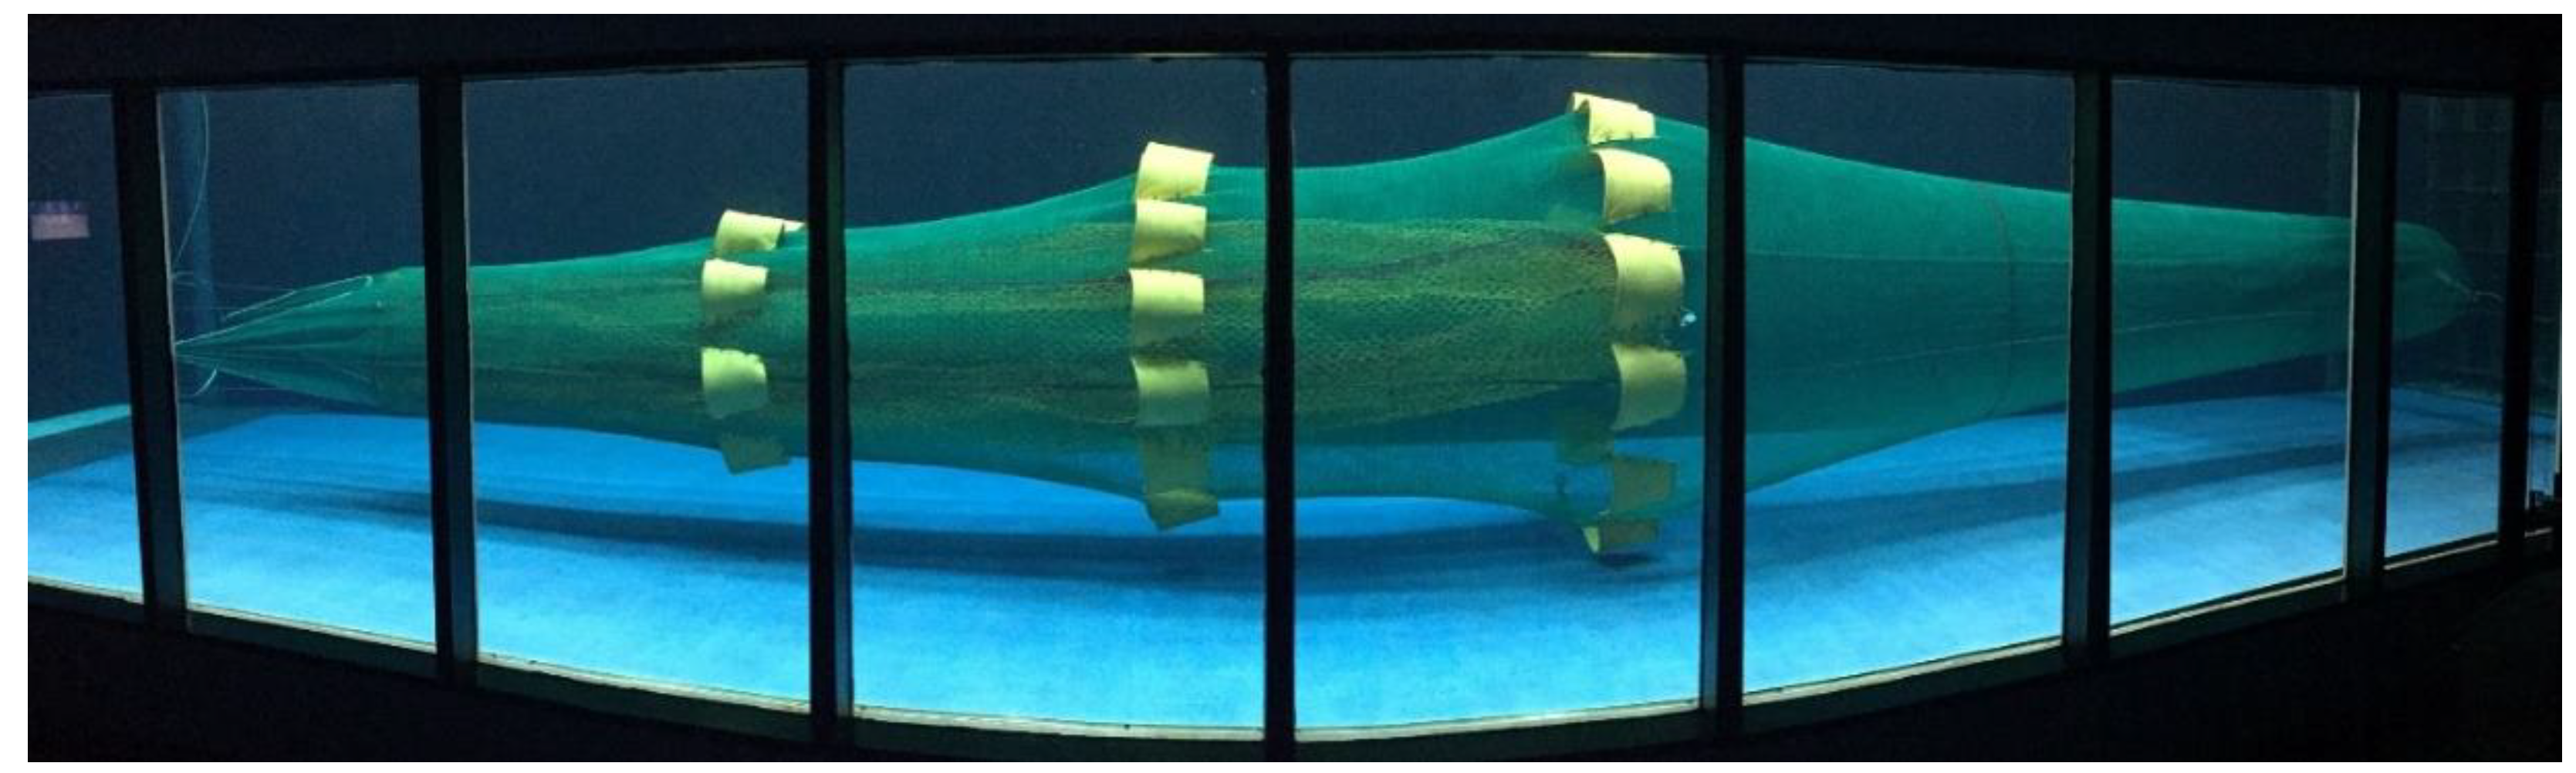
2.4. Codend Hydrodynamics with a Cover

Our second experiment examined the hydrodynamics of two codends with a cover attached. We selected the T0 and T90 codends with the same inside stretched mesh size (90 mm) for the experiment (T0-90 and T90-90, respectively).
The cover was a two-panel design constructed of single 2.5 mm Ø PE twine with a nominal mesh size of 50 mm (Figure 3). A total of 29 flexible kites were mounted around the circumference of the cover to expand the cover and avoid masking of the codend meshes, similar to Madsen et al. [4], He [16], and Grimaldo et al. [39]. The cover was 1.5 times the length of the T0 codend, the longest codend. To fit into the flume tank, the extension of each codend was removed. The codend and the cover were mounted on two steel rings (100 cm Ø). The ring with the codend was attached by four bridles (2 m in length) to the towing mast of the flume tank. The ring with the cover was linked to the one with the codend by four bridles (each 2 m in length).
Flow velocities were recorded using the current meter inserted at the location corresponding to measurement point 8 (Figure 1). Measurements were collected at two vertical locations: (1) between the cover and codend, equidistant between the netting panels, and (2) inside the center of the codend. Towing speeds ranged from 0.7 to 0.9 m/s with 0.1 m/s intervals. Measurements were collected over a period of 1 min (96 Hz) and then averaged to get the velocity.

2.5. Statistical Analysis

The flow velocity was fit with a multiple regression including codends, towing speeds, and measurement points as independent variables. Regressions were performed using the GLM function in MATLAB including all the variables (Equation (2)).
Mv = α + β1Cd + β2Ts + β3Mp + β4Mp2 + ε,
where α is the intercept, β terms are regression coefficients, and ε is the error term. Mv represents the measured flow velocity (m/s), Cd is the codend, Ts is the towing speed (m/s), and Mp is the measurement point along the codend. Cd is a categorical variable; all other variables are continuous.
A Pearson’s correlation was conducted to determine the relationship between the circularity values and the measurement points. The Circ of each codend was fit using a regression and the GLM function in MATLAB (Equation (3)).
Circ = α + β1Cd + β2Ts + β3Mp + ε,
where α is the intercept, β terms are regression coefficients, and ε is the error term. Cd represents the codend type, Ts is the towing speed (m/s), and Mp is the measurement point along the codend. A p-value of <0.05 was considered to be statistically significant. When terms were found to be nonsignificant, the highest p-value term was removed, and the model was refitted until all terms were significant.
Analyses of variance (ANOVA) was used to examine differences between the flow velocity through the center of the codends and the towing speed. A level of significance (p < 0.05) was used to evaluate the null hypothesis in the ANOVA analyses. To compare the flow velocity among the different codends, only data recorded at measurement points 7 to 10 were utilized.
A regression using the GLM function in MATLAB was used to analyze the difference in the drag of the codends (Equation (4)).
Dr = α + β1Ts + β2Cd + ε,
where α is the intercept, β terms are regression coefficients, and ε is the error term. Dr represents the drag of codend (kgF), Cd is the codend type, and Ts is the towing speed (m/s).
For the second experiment, the measured flow velocity was fit with a regression with towing speeds and measurement areas (inside the codend and between the cover and the codend) as independent variables. Regressions were performed using the GLM function in MATLAB including all the variables (Equation (5)).
Mv = α + β1Ts + β2Ma + ε,
where α is the intercept, β terms are regression coefficients, and ε is the error term. Ts represents the towing speed (m/s), and Ma is the measurement area. Ts is a continuous variable, and Ma is a categorical variable.

3. Results

3.1. Gear Specifications

Design parameters for each of the four codends are listed in Table 1. The measured mesh size was 95.0 mm (standard deviation (SD) = 2.4) for the T0-90 codend, 93.6 mm (SD = 2.5) for T90-90, 104.6 mm (SD = 2.9) for T90-100, and 110.7 mm (SD = 2.1) for T90-110.

3.2. Codend Hydrodynamics without a Cover

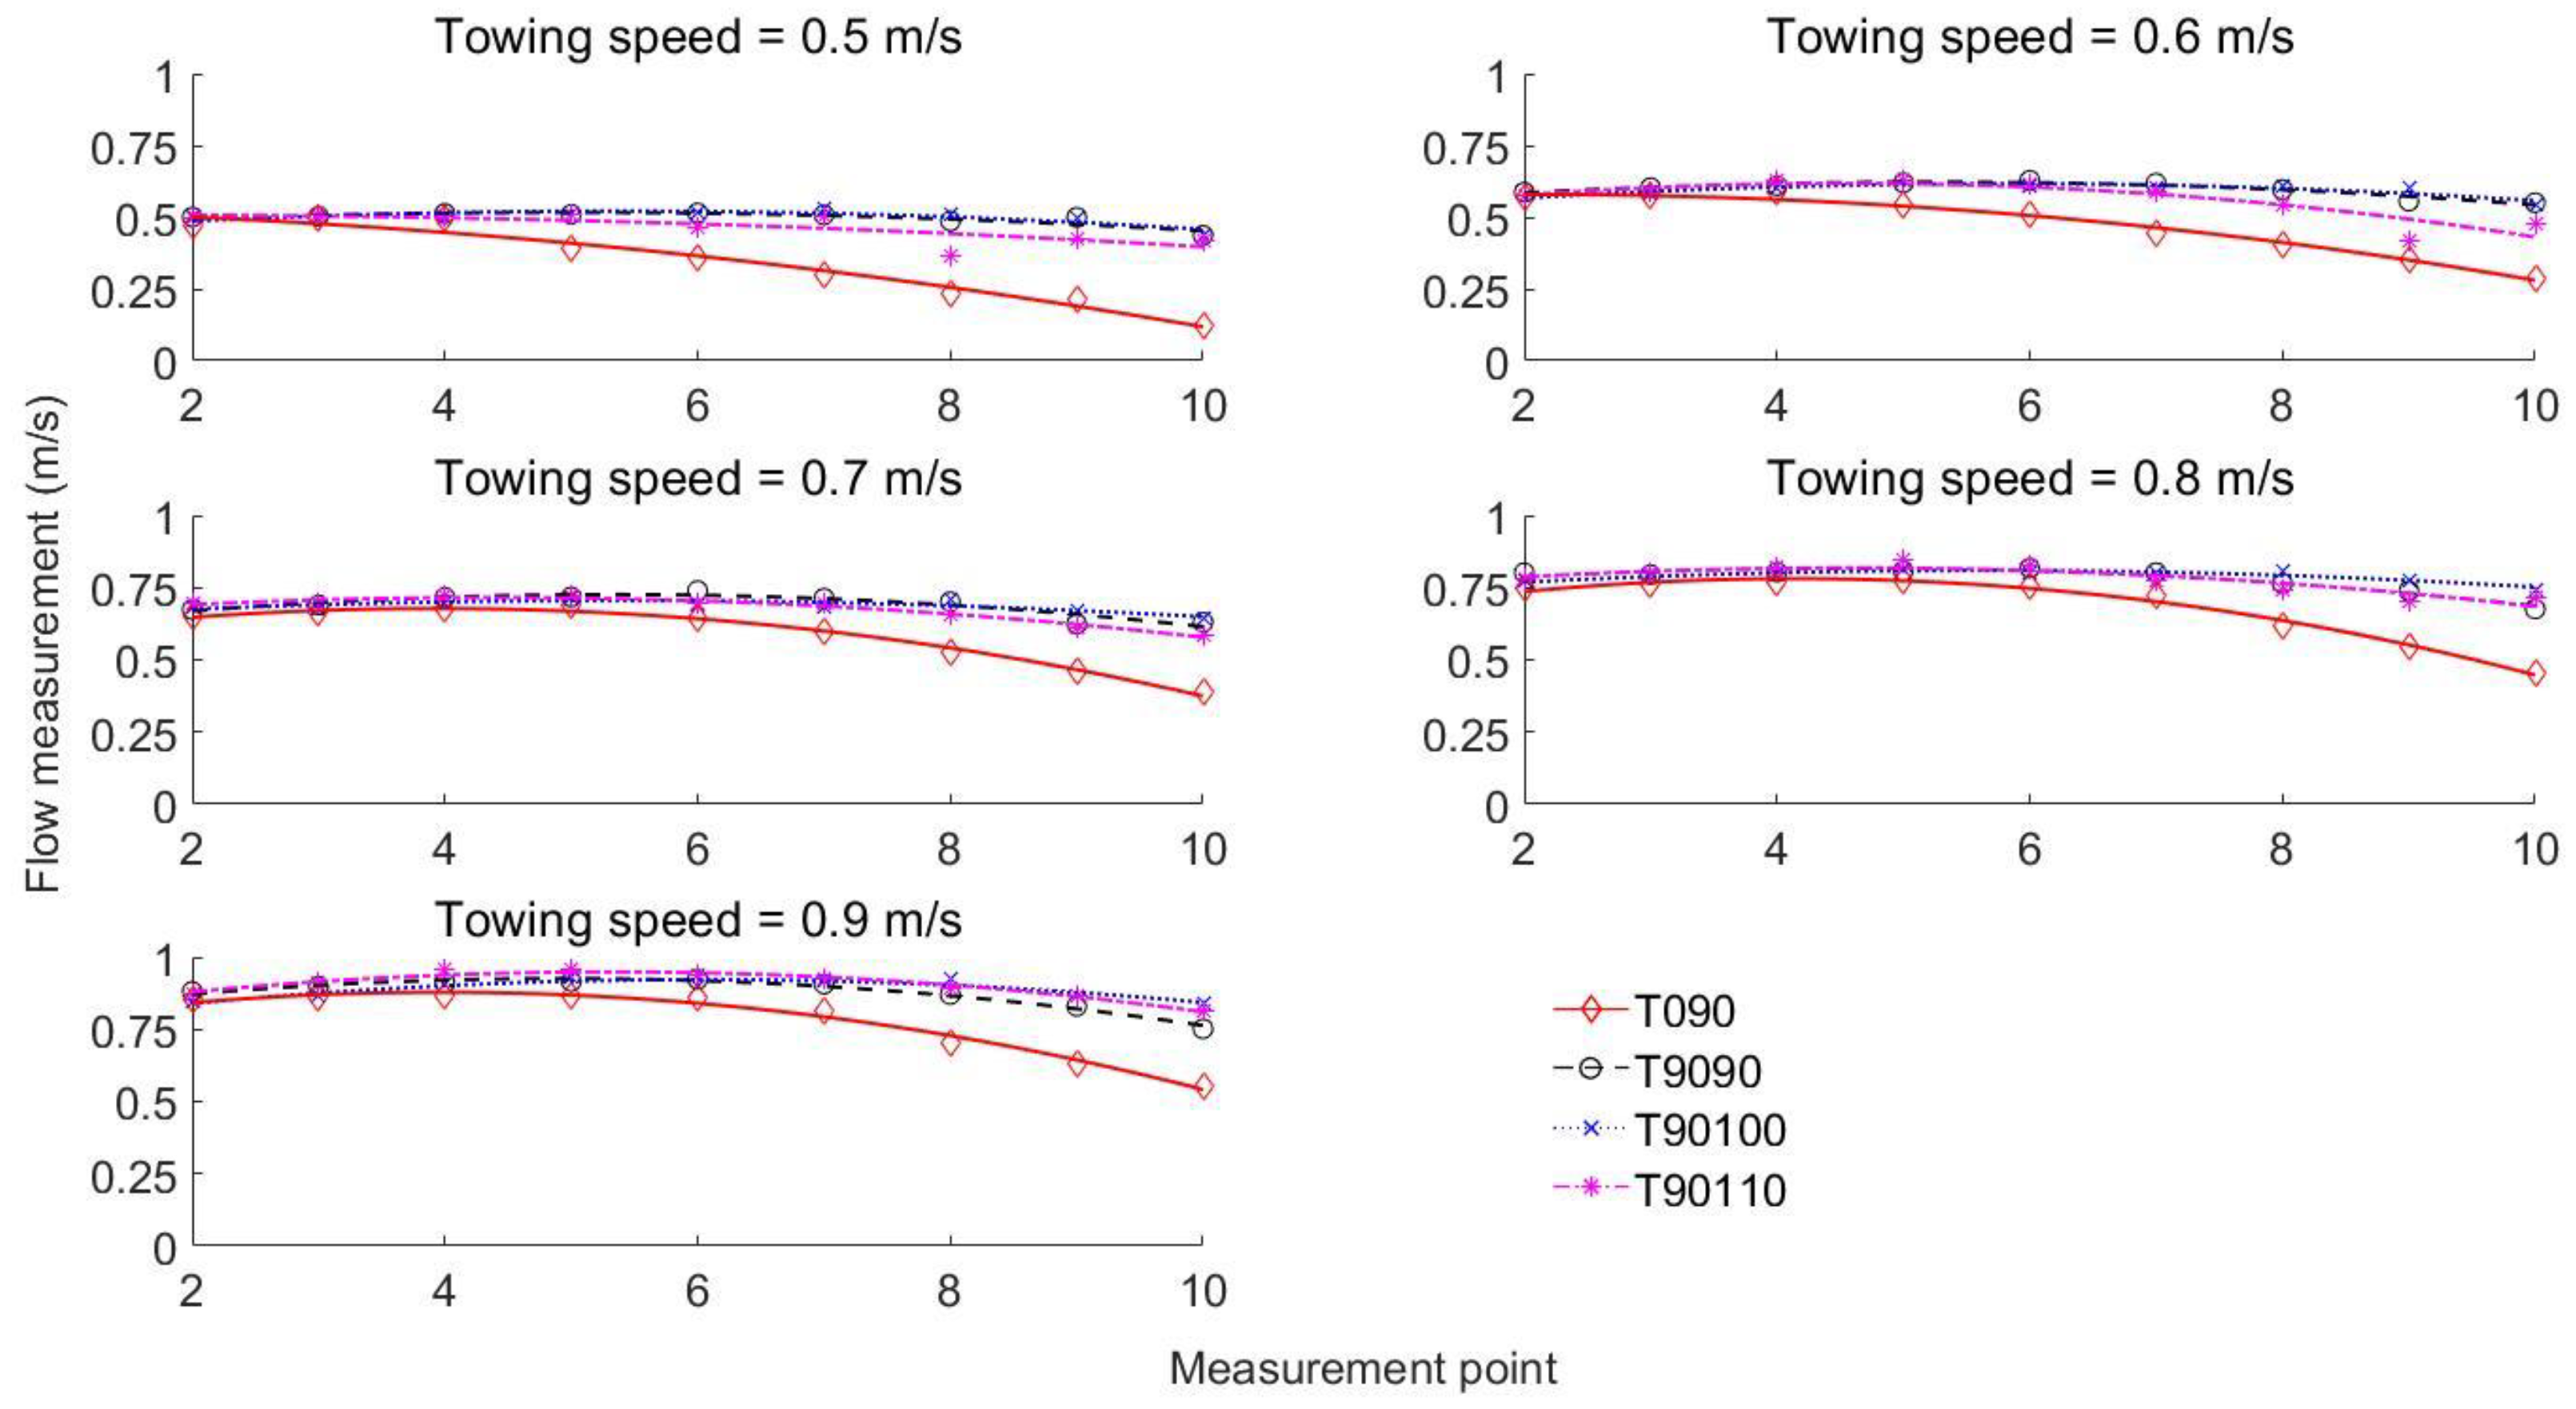
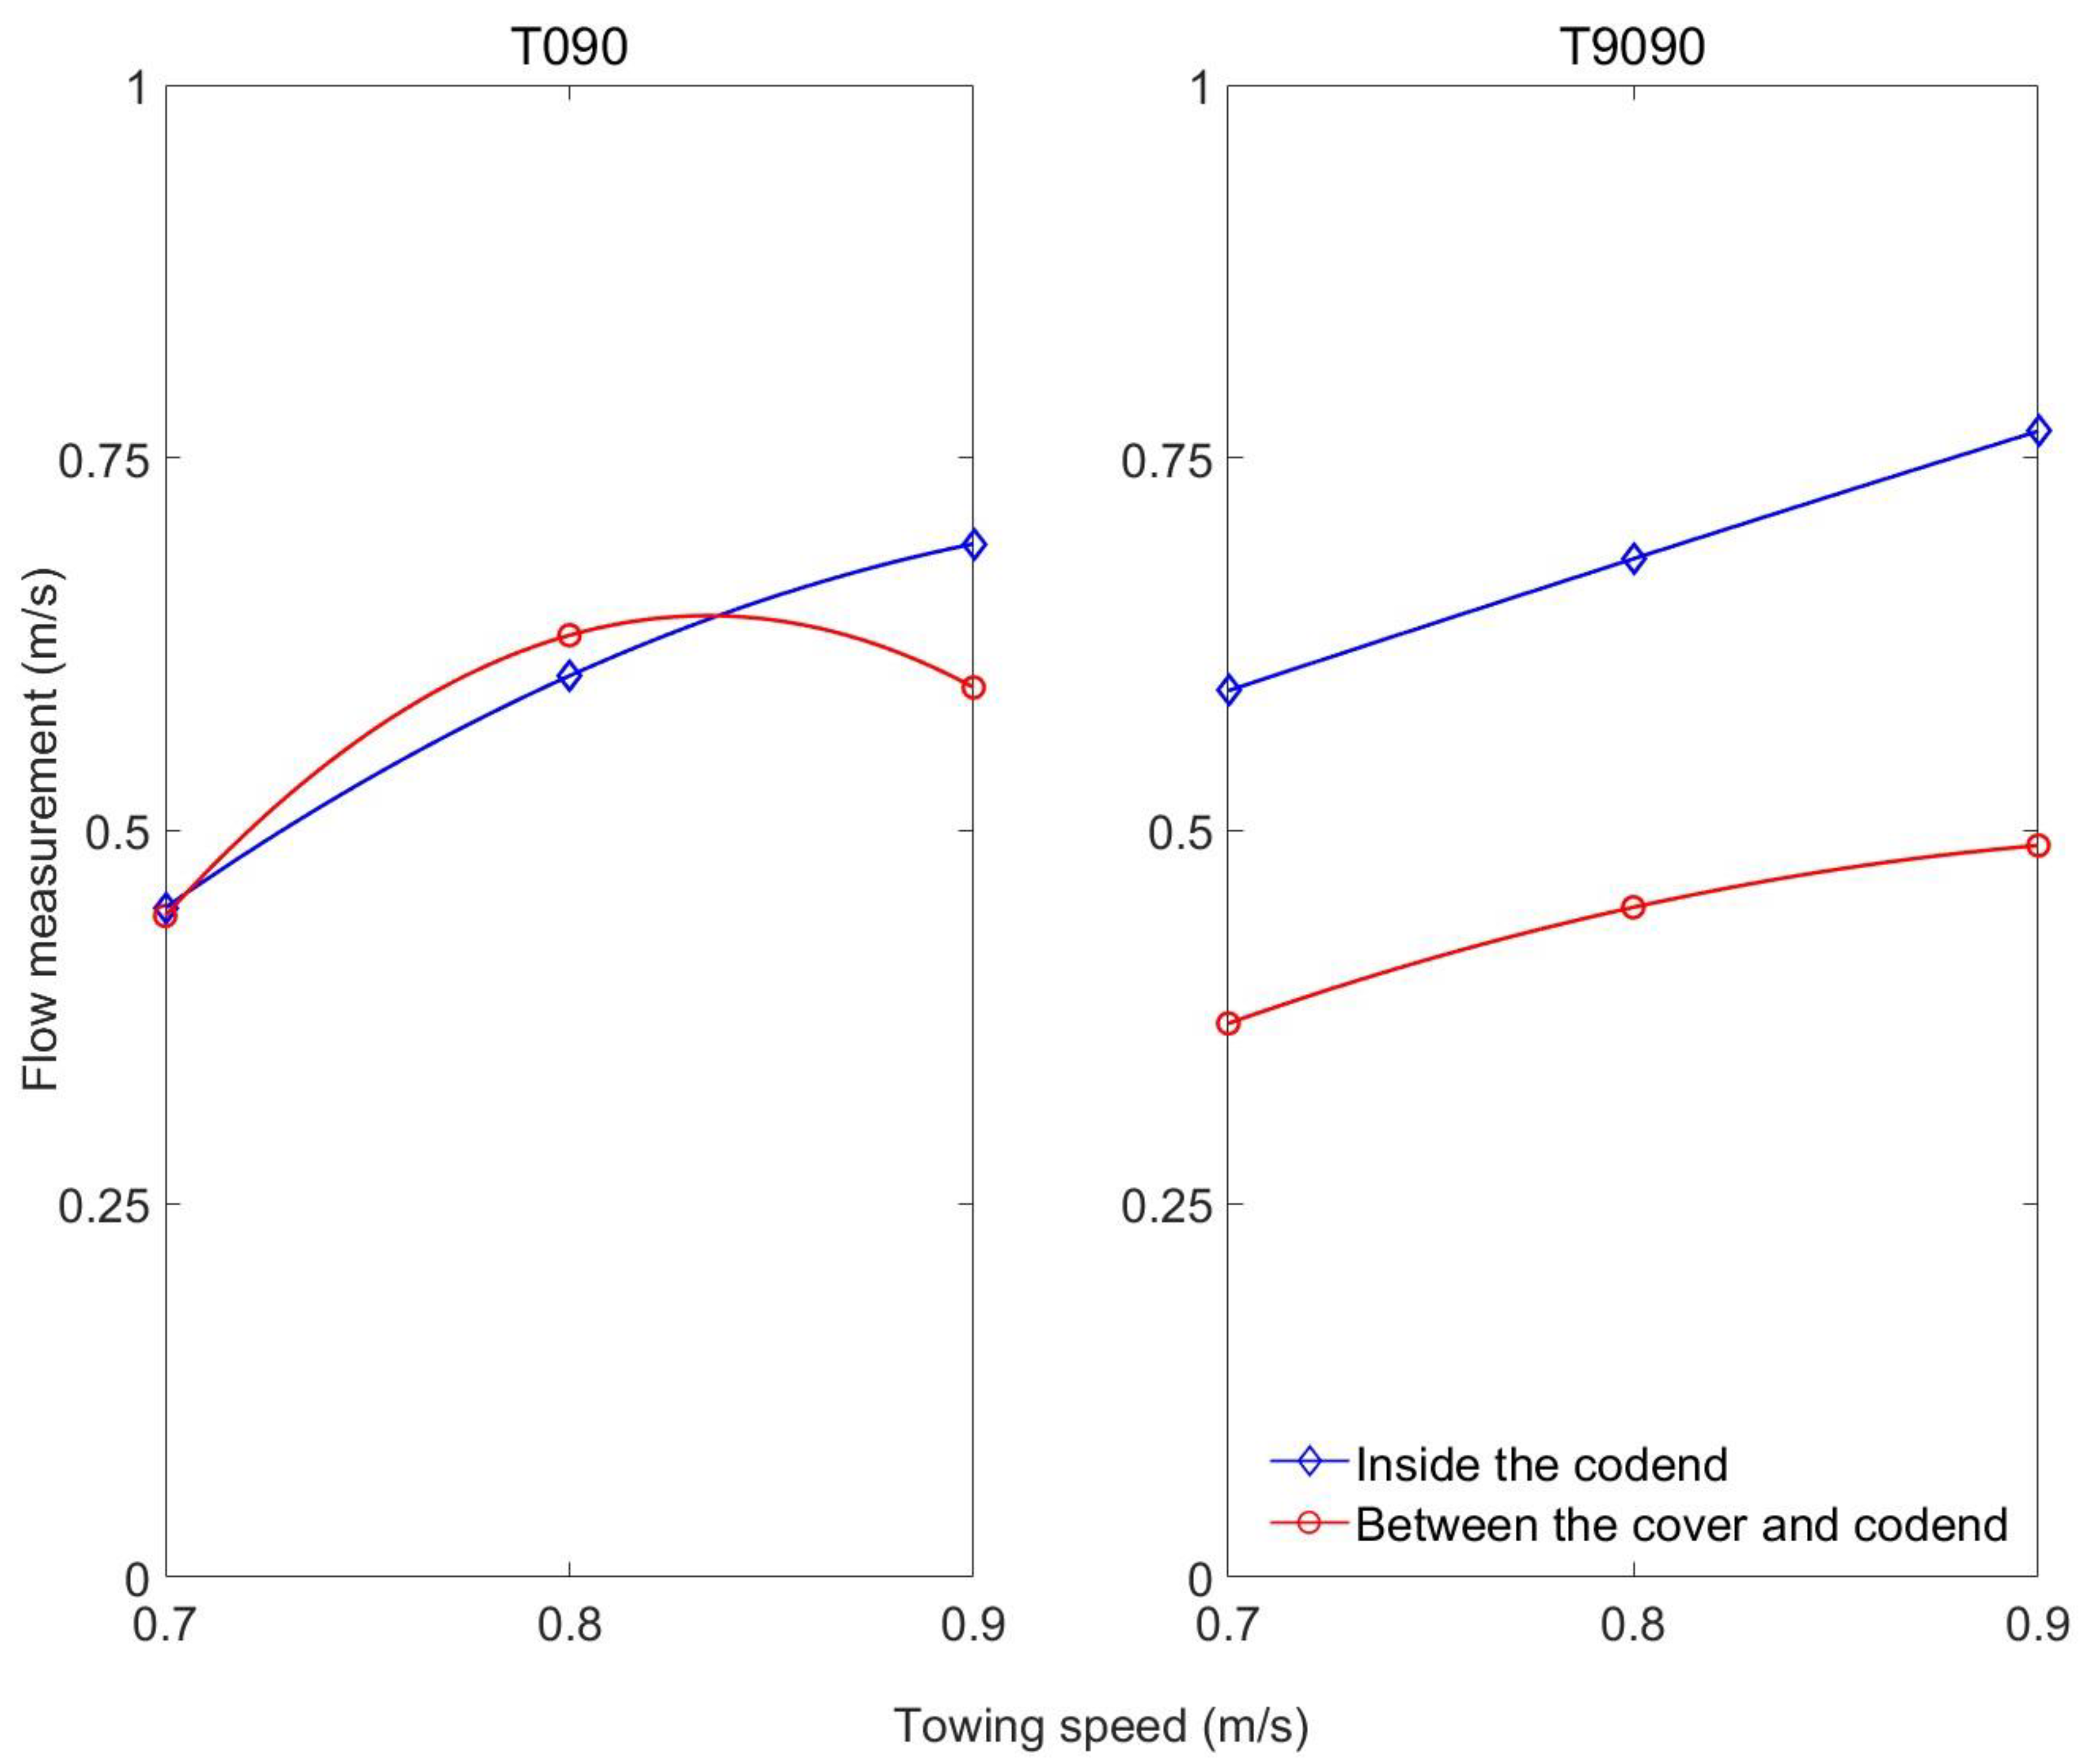
3.2.1. Flow Velocity

The flow velocity observed at the different measurement points is shown in Figure 4. All codends exhibited an early reduction in flow velocity (at location point 2) compared to the test speed of the flume tank. Flow velocity generally decreased as the water traveled down the length of the extension and codend, with the greatest reductions observed near the terminal part of the codend (measurement point 10). The shape of the fitted regressions was noticeably different between the T0 and T90 codends (Figure 4). The T0 codend showed the greatest reductions in flow velocity. At a towing speed of 0.9 m/s, the flow velocity of the T0 codend dropped more than 34% between points 2 and 10. By comparison, the T90 codends exhibited less reduction in flow velocity along their length. The decrease in flow velocity at the last measurement point was less than 14% with respect to the beginning position.
The results of the regression (Table 2) describing flow velocity in the codends explained 93.1% of the variability in the response variable (R2). The most important factor affecting the flow velocity inside a codend was towing speed (t = 43.46, p < 0.001). Holding the other variables constant, a one-unit increase (by 1 m/s) in towing speed would significantly increase the inside flow velocity by 1.02 m/s.
Differences in flow velocity between the T0 and T90 codends were interpreted with the coefficient of category variable (Cd). Holding the other variables constant, the flow velocity in the T90-90 codend was 0.11 m/s higher than that in the T0-90 codend, and this difference was statistically significant (p < 0.001). The other T90 codends also had significantly higher mean flow (>0.1 m/s) than the T0 codend under the same experimental conditions (Table 2).

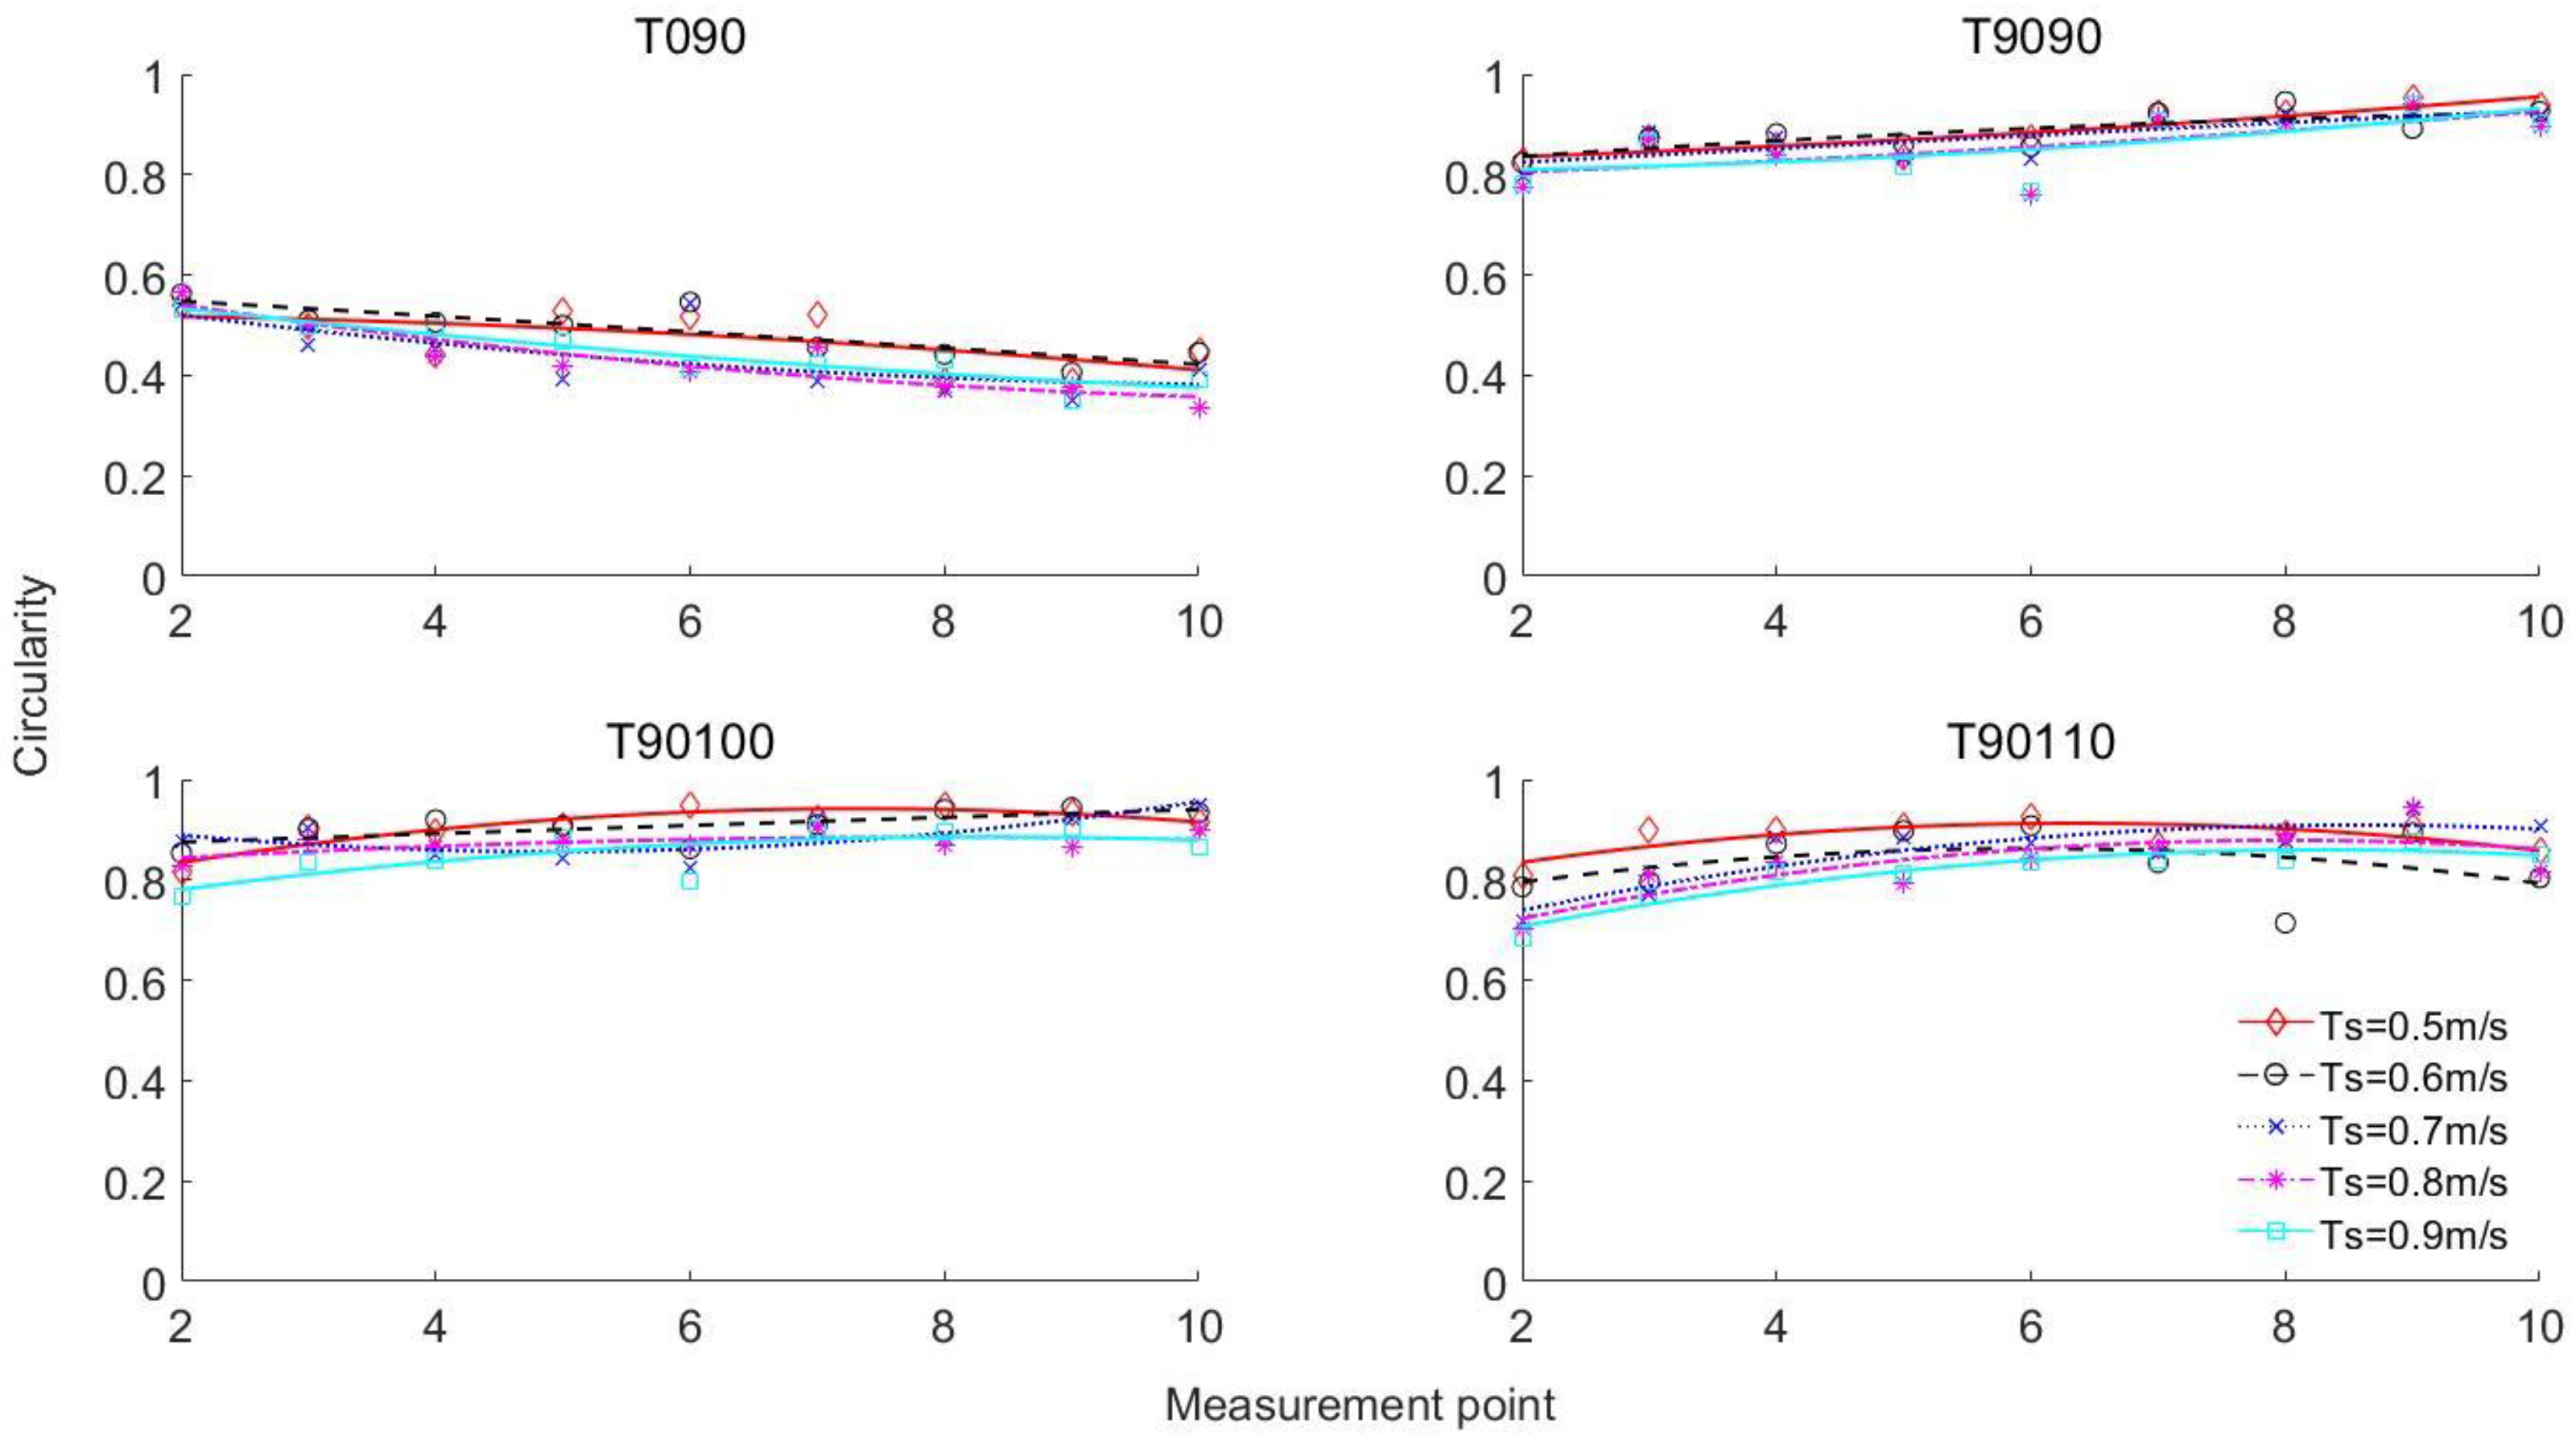
3.2.2. Mesh Circularity
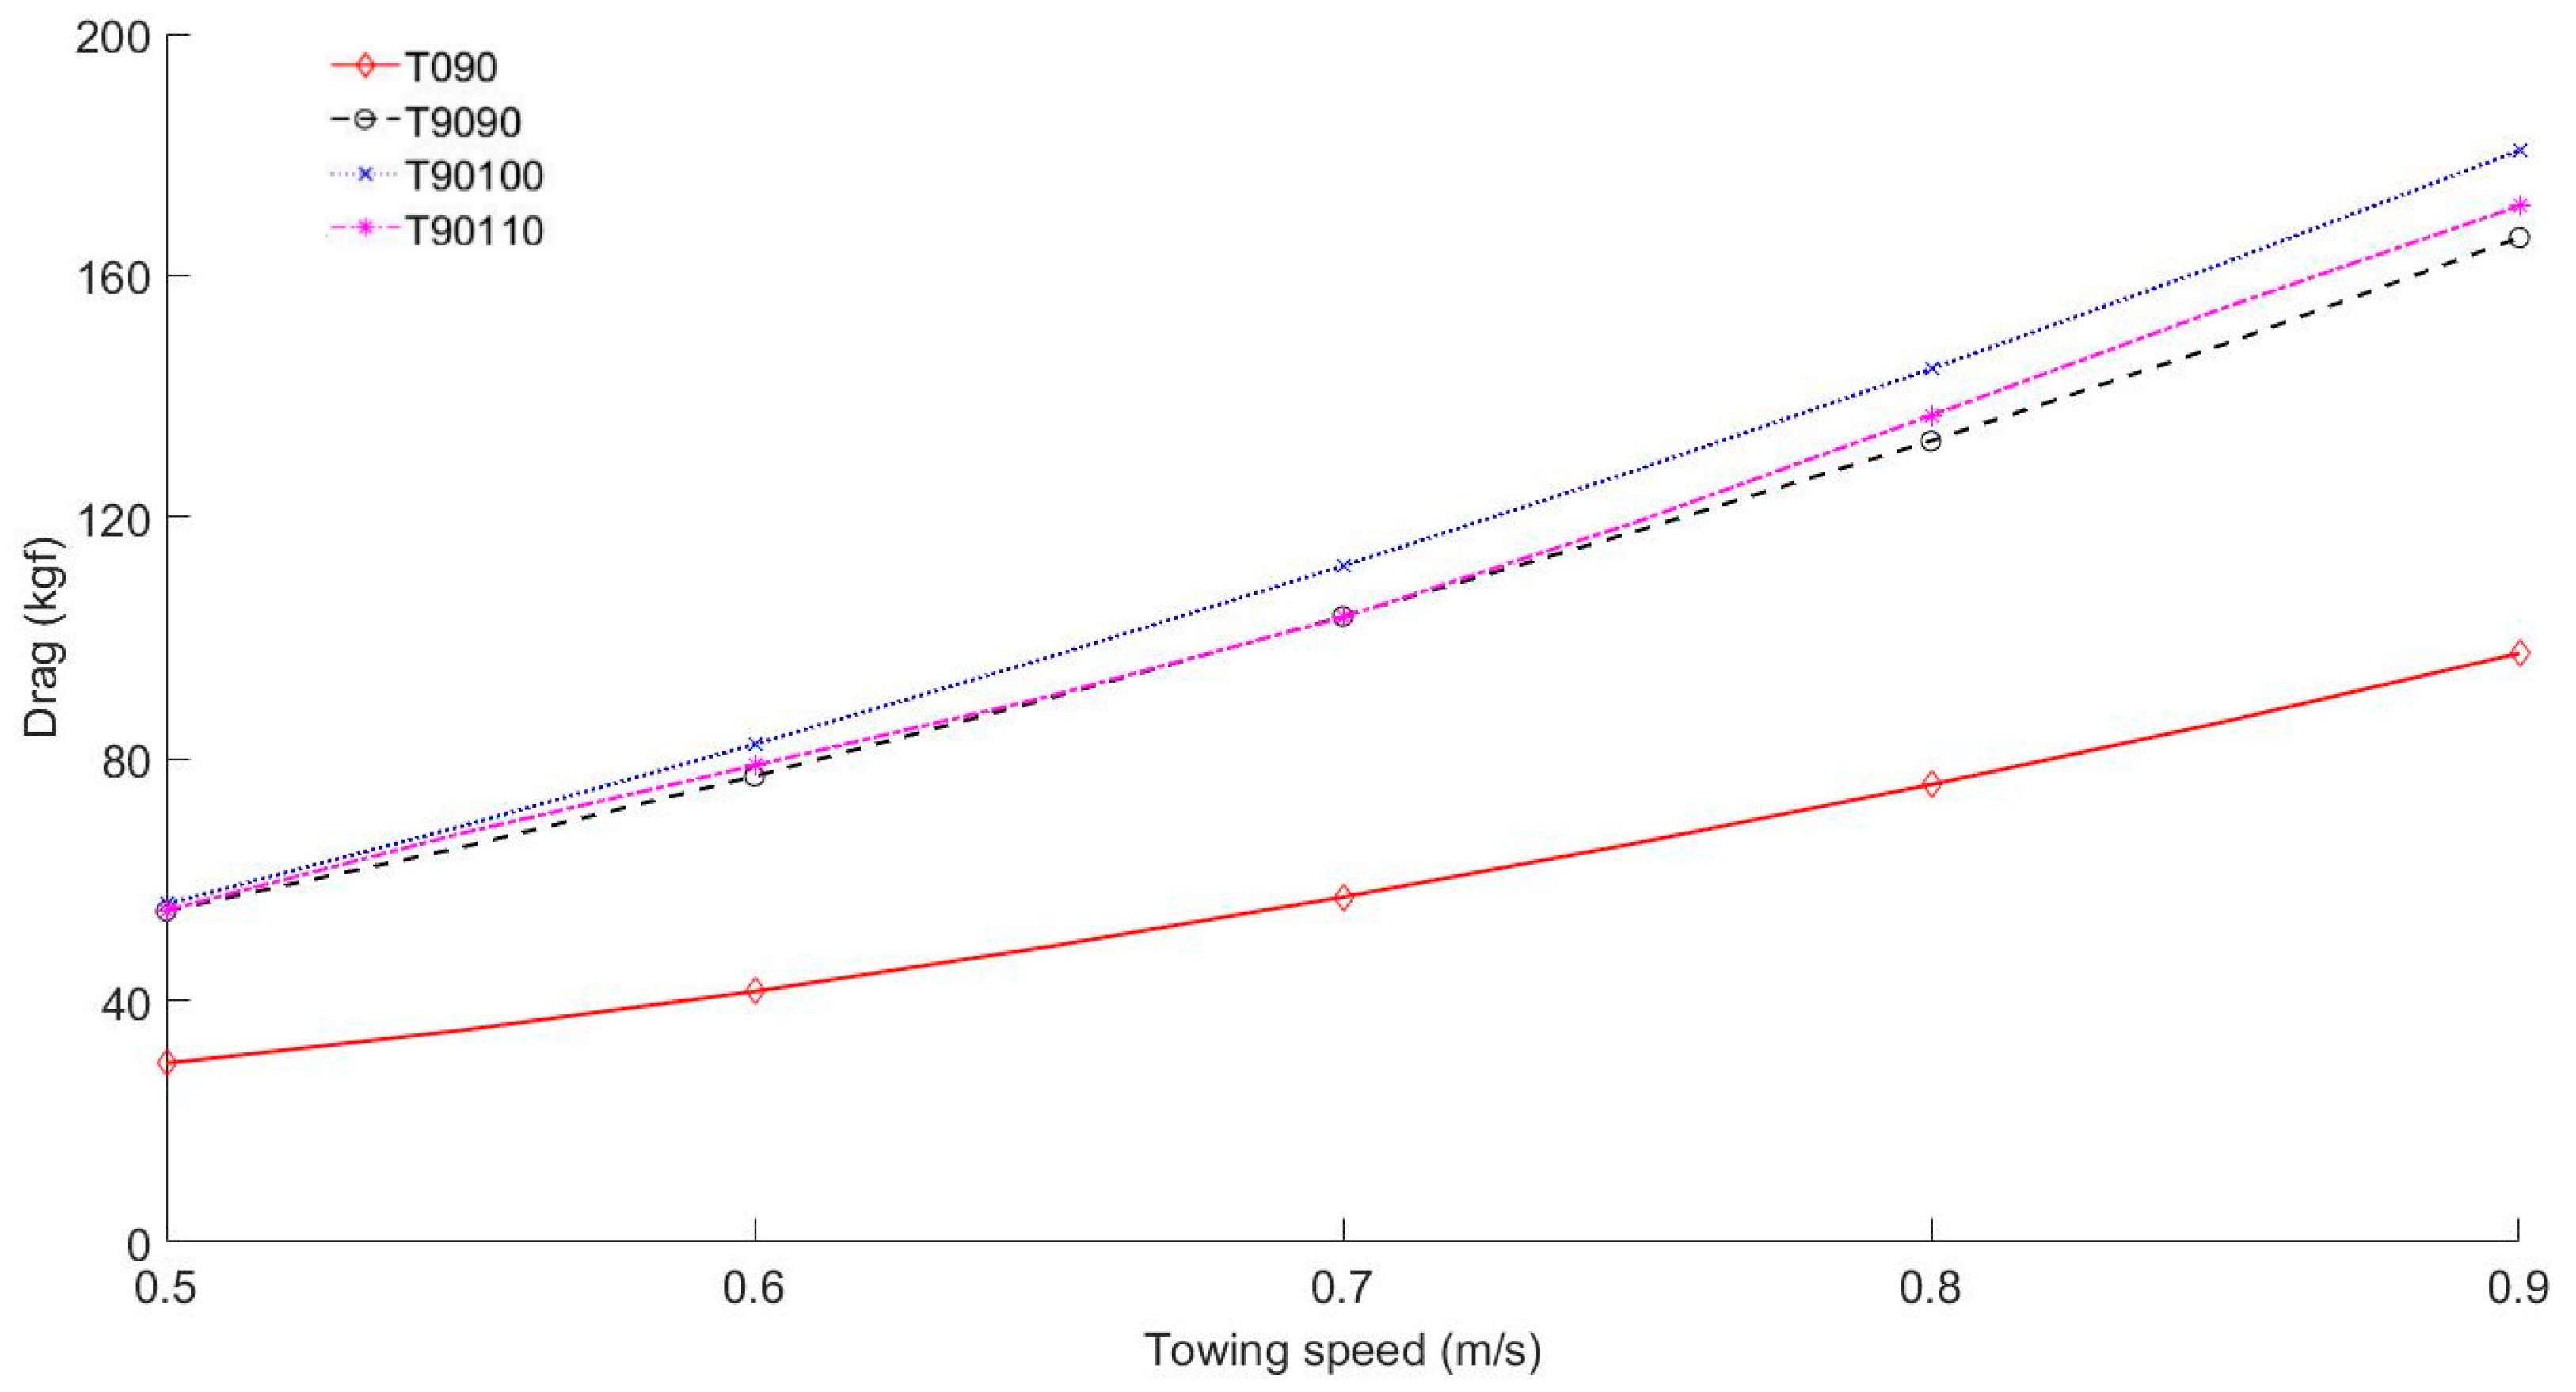
Figure 5 shows the change of mesh opening observed along the extension and codend at different towing speeds. The circularity of the T0 codend was 0.53 at measurement point 2, decreasing to 0.39 at the last measurement point. According to this figure, the circularity of the T0 codend showed a decreasing trend from the front to the rear of the codend for all towing speeds. The coefficient was statistically significant (r = −0.73, p < 0.001), indicating a strong negative correlation between the two variables [40]. The results for the T0 codend indicated that mesh circularity decreased as towing speed increased; however, while this difference was not significant, the p-value was close to being below the alpha of 0.05 (r = −0.25, p = 0.09).
In comparison, mesh circularity in the T90 codends exhibited a slight increasing tendency along the length of the extension and codends (points 2 to 10). At the leading edge (point 2), the mean circularity values were 0.80 (SD = 0.026), 0.83 (SD = 0.042), and 0.74 (SD = 0.054) for T90-90, T90-100, and T90-110, respectively. These increased to 0.92 (SD = 0.017), 0.91 (SD = 0.033), and 0.85 (SD = 0.040) at the end of the codend (point 10).
Results of the Pearson correlation coefficient showed that there was a strong positive association between the mesh circularity and measurement points for the T90-90 codend (r = 0.75, p < 0.001), as well as the T90-100 codend (r = 0.66, p < 0.001) and T90-110 codend (r = 0.61, p < 0.001). The correlation between mesh circularity and towing speed was negative, indicating that increasing the towing speed led to greater mesh closure.
The results of the regression (Table 3) showed that the three predictors (Cd, Ts, and Mp) explained 91.7% of the variance observed (F (5, 188) = 413, p < 0.001). The coefficient for towing speed was negative, indicating that mesh circularity decreased with increasing towing speed. More specifically, for every additional 1 m/s increase in towing speed, mesh circularity decreased by 13%. The circularity also changed along the length of the extension and codend, as shown by the statistically significant coefficient for Mp (p < 0.001). Moving the measurement point by one unit generated a 0.7% increase in mesh opening (Table 3).
Comparing the T0-90 and T90-90 codends, which have the same mesh size, the results revealed that the T9090 codend had higher overall circularity (mean = 0.4) compared with the T0. Changing the mesh orientation from T0 to T90 significantly increased the mesh opening (p < 0.001). T90-100 and T90-110 also had a significantly higher mesh opening than did the T0 (p < 0.001) (Table 3; Figure 5).

3.2.3. Drag

The total drag of each codend (with the simulated catch) at different towing speeds is shown in Figure 6. The drag of each codend increased with increasing towing speed, as expected. At a towing speed of 0.5 m/s, the difference in drag between the T0 and T90 codends was approximately 25.3 kgF. This difference increased to 75.0 kgF when the towing speed increased to 0.9 m/s. The curve for the T0 codend was noticeably lower than that for the T90 codends (Figure 6). The regression analysis showed that the drag of T90 codends was significantly higher than that of the T0 codend (p < 0.001; Table 4).

3.3. Codend Hydrodynamics with a Cover

Flow velocities measured inside the codend and between the cover and the codend, are shown in Figure 7. Flow velocity showed an increasing trend as Ts increased from 0.7 to 0.9 m/s. The coefficient for Ts was positive and statistically significant for both codends (Table 5). For the T0 codend, measurements of flow were not statistically different inside the codend versus between the cover and the codend (t = −0.501; p > 0.05; Table 5). Conversely, flow velocity between the cover and T90 codend was noticeably and statistically lower than the flow velocity recorded inside the codend (p < 0.001; Table 5).

4. Discussion

This study investigated the hydrodynamic performance of full-scale T0 and T90 codends using a flume tank in St. John’s, Newfoundland and Labrador, Canada. These results join previously published codend experiments conducted in flume tanks located in Australia [41], England [42], Denmark [4,33], and France [34]. Our results demonstrated that flow velocity decreased along the length of the extension and codend. This finding is consistent with Hansen [33] and Wakeford [41]. Whether model or full-scale codends, all three studies documented that filtration efficiency is hindered due to blockage from the netting. Depending on the design of the codend, water will always be entrained and carried along. We found that the T90 codends, regardless of their mesh size, all exhibited a relatively high flow velocity along their length. Hansen [33] made a similar observation for one of his T90 codend designs, but not the other. Thus, the extent of entrainment and resulting flow reduction can vary depending on a trawl designer’s choice of netting, codend design, and towing speed. In many cases, this may not be known at the design stage, justifying the need for controlled flume experiments prior to sea trials [26].
To our knowledge, this is the first study to compare the relative performance of full-scale T0 and T90 codends of similar design under controlled flume tank conditions. Our results demonstrate that T90 codends are fundamentally different from T0 codends in their flow profile, mesh circularity, and drag. These results are helpful in explaining size selectivity differences between T0 and T90 codends and provide some insight into the background mechanisms affecting size selectivity. T90 codends have been shown to improve size selectivity for many round-body fish species compared to T0 codends made of the same netting [17,35] The T0 and T90 codends used in this study were recently evaluated at sea for their size-selectivity performance in an experimental redfish (Sebastes spp.) fishery in the Gulf of St. Lawrence, Canada [35]. The results showed that the T90 codends had improved size selectivity compared to T0 at releasing undersized individuals (<25 cm). Changing the mesh orientation alone (T0-90 to T90-90) significantly affected the selection properties of the codend [35]. This is due to T0 meshes closing when tension acts on the netting in the tow direction of the trawl, whereas T90 meshes remain open, as demonstrated in this flume tank study. Independent of the mesh size, it would be difficult for fish to escape from totally closed meshes where there is no gap between the mesh bars [43]. Thus, we conclude that the increased mesh opening for T90 observed in this flume tank study was responsible for the increased escapement of small fish and improved size-selectivity reported by Cheng et al. [35].
To investigate mesh opening, many studies have used the parameter known as opening angle (e.g., [44,45,46]). In this study, we elected to develop and use a novel parameter, which we call mesh circularity. This is because the bar of T90 mesh is distorted and shows a curvilinear shape (Figure 2). Thus, the two sides of the triangle defining the opening angle are not straight, making the estimation of an opening angle difficult. Given that measurements of opening angle at sea are generally based on image analysis (e.g., [46]), measurement error can result from the situation that the underwater camera and netting are not parallel. However, describing mesh opening with circularity avoids this error. The circularity value is a ratio without units; measurement errors from the numerator and denominator of the function are canceled out (Equation (1)). Using circularity is, therefore, a reliable and accurate method to describe mesh opening and mesh shape.
Mesh circularity also corresponds well with general fish morphology, especially the cross-sectional body shape and body height to width ratio [45,47]. Previous studies have shown that associating fish morphology with mesh opening can be helpful for understanding the selectivity of netting [48,49]. When circularity is equal to one, the mesh promotes the escapement of small individuals with round-body shape (e.g., body height-to-width ratio of one). As circularity approaches zero, the mesh shape may be good for undersized flatfish to escape. Therefore, the circularity combined with species morphology data could be applied to design selective fishing gears.
This study reports novel data on the hydrodynamics of attaching a cover over a codend. While our data are limited to a single location (point 8) for only a few towing speeds, to our knowledge, no other scientific literature exists on flow velocities between a codend and cover. We speculate that the lower flow velocities observed in the T90 codend may be attributed to greater frontal area (projection area). O’Neill et al. [42] found that the maximum frontal area of a codend was a good predictor of its total drag in a flume tank. Given that the T90-90 codend had greater drag than the T0-90 codend, we speculate that this may have been related to differences in frontal area between the codends. Unfortunately, frontal area was not quantified in this study. We recommend additional experiments be conducted to fully elucidate this phenomenon, perhaps using a combination of numerical simulations using desktop computers and physical modelling in flume tanks.
Although full-scale codends were tested in this study, we recognize that the experimental conditions of a flume tank are different from conditions at sea. The towing speeds we used are significantly lower than those expected at sea. This limitation has been previously discussed [37,50]. During sea trials, towing speeds are typically closer to 1.3 m/s, and catch sizes can be several thousand kilograms. Under these conditions, we expect that the drag of the codend would increase with increasing towing speed and catch weight, and the flow velocity inside the codend and mesh opening may be affected accordingly. We also recognize that using perforated floats to simulate catch may not necessarily reflect actual fish in a codend. Nevertheless, our research methods can be used to investigate and compare the hydrodynamic performance of different codends under controlled experimental conditions and may prove helpful in interpreting codend selectivity. Coupling this kind of knowledge on the engineering performance of codends with underwater observations of fish behavior in response to trawl netting is key to understanding the mechanisms of codend selectivity [51].

Author Contributions

Conceptualization, Z.C., P.D.W. and S.M.B.; investigation, Z.C., P.D.W., S.M.B. and D.K.; data curation, Z.C. and S.M.B.; writing—original draft preparation, Z.C.; writing—review and editing, Z.C., P.D.W. and S.M.B.; supervision, P.D.W. and S.M.B. All authors have read and agreed to the published version of the manuscript.

Funding

This research was funded by Canada First Research Excellence Fund through the Ocean Frontier Institute (Module H) and Research and Development Corporation (RDC) of Newfoundland and Labrador, grant number 5404-1787-102.

Institutional Review Board Statement

Not applicable.

Informed Consent Statement

Not applicable.

Data Availability Statement

Data sharing not applicable.

Acknowledgments

We would like to thank many staff and graduate students from CSAR who assisted with the project, including Harold DeLouche, Craig Hollett, George Legge, Jessica Wood, Meghan Donovan, Vang Nguyen, Mark Santos, and Kelly Moret. We are also grateful to Haraldur Arnar Einarsson, Steve Walsh, and Michael Pol for invaluable assistance during all stages of this study.

Conflicts of Interest

The authors declare no conflict of interest.

References

  1. Wileman, D.A.; Council, I. Manual of Methods of Measuring the Selectivity of Towed Fishing Gears; International Council For The Exploration of the Sea: Copenhagen, Denmark, 1996. [Google Scholar]
  2. He, P. Behavior of Marine Fishes: Capture Processes and Conservation Challenges; Wiley-Blackwell: Ames, Iowa, 2010. [Google Scholar]
  3. Breen, M.; Huse, I.; Ingolfsson, O.A.; Madsen, N.; Soldal, A.V. Survial: An Assessment of Mortality in Fish Escaping from Trawl Codends and Its Use in Fisheries Management; EU Final Report No. Project Q5RS-2002-01603 SURVIVAL; European Commission: Brussels, Belgium, 2007. [Google Scholar]
  4. Madsen, N.; Hansen, K.E.; Moth-Poulsen, T. The Kite Cover: A New Concept for Covered Codend Selectivity Studies. Fish. Res. 2001, 49, 219–226. [Google Scholar] [CrossRef]
  5. Madsen, N.; Holst, R. Assessment of the Cover Effect in Trawl Codend Selectivity Experiments. Fish. Res. 2002, 56, 289–301. [Google Scholar] [CrossRef]
  6. Pol, M.V.; Herrmann, B.; Rillahan, C.; He, P. Impact of Codend Mesh Sizes on Selectivity and Retention of Acadian Redfish Sebastes Fasciatus in the Gulf of Maine Trawl Fishery. Fish. Res. 2016, 184, 54–63. [Google Scholar] [CrossRef]
  7. Herrmann, B.; O’Neill, F.G. Theoretical Study of the Influence of Twine Thickness on Haddock Selectivity in Diamond Mesh Cod-Ends. Fish. Res. 2006, 80, 221–229. [Google Scholar] [CrossRef]
  8. Sala, A.; Lucchetti, A. Effect of Mesh Size and Codend Circumference on Selectivity in the Mediterranean Demersal Trawl Fisheries. Fish. Res. 2011, 110, 252–258. [Google Scholar] [CrossRef]
  9. Catchpole, T.L.; Revill, A.S.; Dunlin, G. An Assessment of the Swedish Grid and Square-Mesh Codend in the English (Farn Deeps) Nephrops Fishery. Fish. Res. 2006, 81, 118–125. [Google Scholar] [CrossRef]
  10. Hickey, W.M.; Boulos, D.L.; Brothers, G. A study of the influence of lastridge ropes on redfish selectivity in a bottom trawler. Can. J. Fish. Aquat. 1995, 2076, vii+25. [Google Scholar]
  11. Cheng, Z.; Einarsson, H.A.; Bayse, S.; Herrmann, B.; Winger, P. Comparing Size Selectivity of Traditional and Knotless Diamond-Mesh Codends in the Iceland Redfish (Sebastes Spp.) Fishery. Fish. Res. 2019, 216, 138–144. [Google Scholar] [CrossRef]
  12. O’Neill, F.G. Differential Equations Governing the Geometry of a Diamond Mesh Cod-End of a Trawl Net. J. Appl. Mech. 1997, 64, 7–14. [Google Scholar] [CrossRef]
  13. Herrmann, B.; Priour, D.; Krag, L.A. Simulation-Based Study of the Combined Effect on Cod-End Size Selection of Turning Meshes by 90° and Reducing the Number of Meshes in the Circumference for Round Fish. Fish. Res. 2007, 84, 222–232. [Google Scholar] [CrossRef] [Green Version]
  14. Bi, C.-W.; Zhao, Y.-P.; Dong, G.-H.; Xu, T.-J.; Gui, F.-K. Numerical Simulation of the Interaction between Flow and Flexible Nets. J. Fluids Struct. 2014, 45, 180–201. [Google Scholar] [CrossRef]
  15. Herrmann, B.; Krag, L.A.; Frandsen, R.P.; Madsen, N.; Lundgren, B.; Stæhr, K.-J. Prediction of Selectivity from Morphological Conditions: Methodology and a Case Study on Cod (Gadus morhua). Fish. Res. 2009, 97, 59–71. [Google Scholar] [CrossRef]
  16. He, P. Selectivity of Large Mesh Trawl Codends in the Gulf of Maine. Fish. Res. 2007, 83, 44–59. [Google Scholar] [CrossRef]
  17. Bayse, S.M.; Herrmann, B.; Lenoir, H.; Depestele, J.; Polet, H.; Vanderperren, E.; Verschueren, B. Could a T90 Mesh Codend Improve Selectivity in the Belgian Beam Trawl Fishery? Fish. Res. 2016, 174, 201–209. [Google Scholar] [CrossRef]
  18. Ferro, R.S.T.; O’Neill, F.G. An overview of the characteristics of twines and netting that may change codend selectivity. ICES CM 1994, 1994, 35. [Google Scholar]
  19. Herrmann, B.; Moderhak, W.; Wienbeck, H.; Valentinsson, D.; Priour, D.; Sala, F.A. Report of the Study Group on Turned 90° Codend Selectivity, Focusing on Baltic Cod Selectivity (SGTCOD); FTC:05; ICES C.M.: Hirtshals, Denmark, 2009. [Google Scholar]
  20. O’Neill, F.G.; Mutch, K. Selectivity in trawl fishing gears. Scott. Mar. Freshw. Sci. 2017, 8, 1–85. [Google Scholar]
  21. Druault, P.; Germain, G. Analysis of Hydrodynamics of a Moving Trawl Codend and Its Fluttering Motions in Flume Tank. Eur. J. Mech. B Fluids 2016, 60, 219–229. [Google Scholar] [CrossRef] [Green Version]
  22. Germain, G.; Facq, J.V.; Priour, D. Flow Characterization around A Cod-End. In Proceedings of the IMAM 2005, Lisboa, Portugal, 26–30 September 2005. [Google Scholar]
  23. He, P. Swimming speeds of marine fish in relation to fishing gears. ICES Mar. Sci. Symp. 1993, 196, 183–189. [Google Scholar]
  24. Martyshevskii, V.N.; Korotkov, V.N. Fish Behavior in the Area of the Trawl, as Studied by Bathyplane. FAO Fish. Aquac. Rep. (FAO) 1969, 62, 781–791. [Google Scholar]
  25. Main, J.; Sangster, G.I. TUV II—A Towed Wet Submersible for Use in Fishing Gear Research. Scottish Fish. Res. Rep. 1983, 29, 1983. [Google Scholar]
  26. Winger, P.D.; DeLouche, H.; Legge, G. Designing and Testing New Fishing Gears: The Value of a Flume Tank. Mar. Technol. Soc. J. 2006, 40, 44–49. [Google Scholar] [CrossRef]
  27. Winger, P.D. History of fisheries flume tanks around the world. J. Ocean Technol. 2021, 16, 108–109. [Google Scholar]
  28. Bouhoubeiny, E.; Germain, G.; Druault, P. Time-resolved PIV investigations of the flow field around cod-end net structures. Fish. Res. 2011, 108, 344–355. [Google Scholar] [CrossRef] [Green Version]
  29. Madsen, N.; Hansen, K.; Madsen, N.A. Behavior of different trawl codend concepts. Ocean Eng. 2015, 108, 571–577. [Google Scholar] [CrossRef]
  30. Moderhak, W. Some problems of water flow through trawl codend. ICES Counc. Meet. Pap. B 1993, 11, 1–6. [Google Scholar]
  31. Wienbeck, H.; Herrmann, B.; Moderhak, W.; Stepputtis, D. Effect of netting direction and number of meshes around on size selection in the codend for Baltic cod (Gadus morhua). Fish. Res. 2011, 109, 80–88. [Google Scholar] [CrossRef]
  32. Einarsson, H.A.; Cheng, Z.; Bayse, S.M.; Herrmann, B.; Winger, P.D. Comparing the Size Selectivity of a Novel T90 Mesh Codend to Two Conventional Codends in the Northern Shrimp (Pandalus borealis) Trawl Fishery. Aquac. Fish. 2021, 6, 382–392. [Google Scholar] [CrossRef]
  33. Hansen, U.J. Performance of a trawl codend made from 90° turned netting (T90) compared with that of traditional codends. In Proceedings of the ICES Fishing Technology and Fish Behaviour Working Group Meeting, Gdynia, Poland, 20–23 April 2004. [Google Scholar]
  34. Pichot, G.; Germain, G.; Priour, D. On the Experimental Study of the Flow around a Fishing Net. Eur. J. Mech. B Fluids 2009, 28, 103–116. [Google Scholar] [CrossRef] [Green Version]
  35. Cheng, Z.; Winger, P.D.; Bayse, S.M.; Kebede, G.E.; DeLouche, H.; Einarsson, H.A.; Pol, M.V.; Kelly, D.; Walsh, S.J. Out with the Old and in with the New: T90 Codends Improve Size Selectivity in the Canadian Redfish (Sebastes mentella) Trawl Fishery. Can. J. Fish. Aquat. 2020, 77, 1711–1720. [Google Scholar] [CrossRef]
  36. Fonteyne, R. Protocol for the Use of an Objective Mesh Gauge for Scientific Purposes; (No. 279); International Council for the Exploration of the Sea: Oostende, Belgium, 2005. [Google Scholar]
  37. Kebede, G.E.; Winger, P.D. A Comparison of Hydrodynamic Forces in Knotted and Knotless Netting, Using Both Helix and Conventional Ropes for Midwater Trawls. Aquac. Fish. 2021, 6, 96–105. [Google Scholar] [CrossRef]
  38. Ferreira, T.; Rasband, W. ImageJ User Guide; 2012; pp. 155–161. Available online: https://imagej.nih.gov/ij/docs/guide/user-guide.pdf (accessed on 10 September 2020).
  39. Grimaldo, E.; Larsen, R.B.; Sistiaga, M.; Madsen, N.; Breen, M. Selectivity and Escape Percentages during Three Phases of the Towing Process for Codends Fitted with Different Selection Systems. Fish. Res. 2009, 95, 198–205. [Google Scholar] [CrossRef]
  40. Geher, G.; Hall, S. Straightforward Statistics: Understanding the Tools of Research; Oxford University Press: Oxford, UK; New York, NY, USA, 2014. [Google Scholar]
  41. Wakeford, J. An investigation into the influence of the Super-shooted TED and several types of bycatch reduction devices on water flow through a prawn trawl codend. In Assessment and Improvement of TEDs and BRDs in the NPF: A Co-Operative Approach Be Fishers, Scientists, Fisheries Technologists, Economists and Conservationists; Final Report on FRDC Project 2000/173; CSIRO: Cleveland, OH, USA, 2004; p. 412. [Google Scholar]
  42. O’Neill, F.G.; Knudsen, L.H.; Wileman, D.A.; McKay, S.J. Cod-End Drag as a Function of Catch Size and Towing Speed. Fish. Res. 2005, 72, 163–171. [Google Scholar] [CrossRef]
  43. MacLennan, D.N. Fishing Gear Selectivity: An Overview. Fish. Res. 1992, 13, 201–204. [Google Scholar] [CrossRef]
  44. Sistiaga, M.; Herrmann, B.; Nielsen, K.N.; Larsen, R.B. Understanding Limits to Cod and Haddock Separation Using Size Selectivity in a Multispecies Trawl Fishery: An Application of FISHSELECT. Can. J. Fish. Aquat. 2011, 68, 927. [Google Scholar] [CrossRef]
  45. Herrmann, B.; Sistiaga, M.; Nielsen, K.N.; Larsen, R.B. Understanding the Size Selectivity of Redfish (Sebastes spp.) in North Atlantic Trawl Codends. J. Northwest Atl. Fish. Sci. 2012, 44, 1–13. [Google Scholar] [CrossRef] [Green Version]
  46. Krag, L.A.; Herrmann, B.; Iversen, S.A.; Engås, A.; Nordrum, S.; Krafft, B.A. Size Selection of Antarctic Krill (Euphausia superba) in Trawls. PLoS ONE 2014, 9, e102168. [Google Scholar] [CrossRef] [Green Version]
  47. Tosunoğlu, Z.; Özbilgin, Y.D.; Özbilgin, H. Body Shape and Trawl Cod End Selectivity for Nine Commercial Fish Species. J. Mar. Biol. Assoc. UK 2003, 83, 1309–1313. [Google Scholar] [CrossRef]
  48. Stergiou, K.I.; Karpouzi, V.S. Length–Girth Relationships for Several Marine Fishes. Fish. Res. 2003, 60, 161–168. [Google Scholar] [CrossRef]
  49. Broadhurst, M.K.; Dijkstra, K.K.P.; Reid, D.D.; Gray, C.A. Utility of Morphological Data for Key Fish Species in Southeastern Australian Beach-Seine and Otter-Trawl Fisheries: Predicting Mesh Size and Configuration. N. Z. J. Mar. Freshw. Res. 2006, 40, 259–272. [Google Scholar] [CrossRef] [Green Version]
  50. Kebede, G.E.; Winger, P.D.; DeLouche, H.; Legge, G.; Cheng, Z.; Kelly, D.; Einarsson, H. Flume Tank Evaluation of the Hydrodynamic Lift and Drag of Helix Ropes Compared to Conventional Ropes used in Midwater Trawls. Ocean Eng. 2020, 195, 106674. [Google Scholar] [CrossRef]
  51. Winger, P.D.; Eayrs, S.; Glass, C.W. Fish behaviour near bottom trawls. In Behavior of Marine Fishes: Capture Processes and Conservation Challenges; Blackwell Publishing: Ames, Iowa, 2010; pp. 67–103. [Google Scholar]
Figure 1. Schematic representation of the experimental setup in the flume tank. Black crosses indicate the measurement points (1 to 10) through the center of the net for flow velocity and mesh opening.
Jmse 10 00440 g001
Figure 2. Mesh shape fitted with an ellipse. The letter a indicates the length of major axis of the fitted ellipse; b is the minor axis. CircT90 = 0.74; CircT0 = 0.33.
Jmse 10 00440 g002
Figure 3. Codend (yellow netting) with cover (green netting) shown in the flume tank, St. John’s, NL, Canada.
Jmse 10 00440 g003
Figure 4. The flow velocity through the center of each codend, where the line represents the fitted model and the marker is the mean of the recorded velocity in m/s. The codend starts at point 7.
Jmse 10 00440 g004
Figure 5. Mesh circularity from the beginning to terminal end of each codend, where the line represents the fitted model and the marker is the mean of the measured value. Ts is towing speed in m/s. The codend starts at point 7.
Jmse 10 00440 g005
Figure 6. Total drag of each codend with simulated catch. The markers show the mean value of measured drag (kgF); the lines indicate the fitted model.
Jmse 10 00440 g006
Figure 7. The flow velocity in the T0 (90 mm) and T90 (90 mm) codends with the cover attached, where the marker represents the mean of measured velocity in m/s. Solid lines represent the fitted linear regression curves.
Jmse 10 00440 g007
Table 1. Design parameters of the four experimental codends and their extensions. Numbers in brackets represent standard deviation.
NetNominal Mesh Size (mm)TwineLength
(Number of Meshes)
Circumference
(Number of Meshes)
Measured Mesh Size (mm)
Codend
T0-9090Magnet Yellow 2 × 4.6 mm99.511695.0 (2.4)
T90-9090Magnet Yellow 2 × 4.6 mm1207693.6 (2.5)
T90-100100Magnet Yellow 2 × 4.6 mm10976104.6 (2.9)
T90-110110Magnet Yellow 2 × 4.6 mm9976110.7 (2.1)
Extension
T0-90110Magnet Yellow 2 × 4.6 mm72.596112.3 (3.5)
T90-90110Magnet Yellow 2 × 4.6 mm9179.5110.0 (3.2)
T90-100110Magnet Yellow 2 × 4.6 mm9185114.2 (2.1)
T90-110110Magnet Yellow 2 × 4.6 mm9187.9112.0 (1.9)
Table 2. The results of the GLM model explaining the variability in flow velocity (m/s). Ts indicates the towing speed (m/s), Mp is the measurement point, and Cd is the codend type.
VariableCoefficientStandard Errort-Statisticp-Value
Intercept−0.190.026−7.49<0.001
Ts1.020.02343.46<0.001
Mp0.0430.0076.2<0.001
Cd_T90-900.110.009412.2<0.001
Cd_T90-1000.120.009412.62<0.001
Cd_T90-1100.100.009411.11<0.001
Mp2−0.00490.00057−8.61<0.001
Number of observations: 180, error degrees of freedom: 173, root-mean-squared error: 0.045, R-squared: 0.931, adjusted R-squared: 0.928, F-statistic vs. constant model: 388, p-value < 0.001.
Table 3. The results of the GLM model explaining the variability in mesh circularity. Ts indicates the towing speed (m/s), Mp is the measurement point, and Cd is the codend type.
VariableCoefficientStandard Errort-Statisticp-Value
Intercept0.4990.02222.45<0.001
Ts−0.130.027−4.65<0.001
Mp0.0070.0015.23<0.001
Cd_T90-900.4170.01137.85<0.001
Cd_T90-1000.4260.01138.82<0.001
Cd_T90-1100.3830.01134.93<0.001
Number of observations: 194, error degrees of freedom: 188, root-mean-squared error: 0.0533, R-squared: 0.917, adjusted R-squared: 0.914, F-statistic vs. constant model: 413, p-value < 0.001.
Table 4. The results of the GLM model explaining the variability in drag (kgF). Ts indicates the towing speed (m/s), and Cd is the codend type.
GLM
VariableCoefficientStandard Errort-Statisticp-Value
Intercept−123.6711.5−10.75<0.001
Ts262.7615.2317.25<0.001
Cd_T90-9046.66.097.65<0.001
Cd_T90-10054.826.099.00<0.001
Cd_T90-11048.836.098.01<0.001
Number of observations: 20, error degrees of freedom: 15, root-mean-squared error: 9.63, R-squared: 0.964, adjusted R-squared: 0.954, F-statistic vs. constant model: 100, p-value < 0.001.
Table 5. The results of the GLM model for explaining the variability in flow velocity inside the T0-90 and T90-90 codends with a cover. Ts indicates the towing speed (m/s), and Ma_B is the measurement area.
GLM-T0-90
VariableCoefficientStandard Errort-Statisticp-Value
Intercept−0.2130.246−0.8650.451
Ts0.9930.3043.2640.047
Ma_B−0.0250.050−0.5010.651
Number of observations: 6, error degrees of freedom: 3, root-mean-squared error: 0.0608, R-squared: 0.784, adjusted R-squared: 0.64, F-statistic vs. constant model: 5.45, p-value = 0.1.
GLM-T90-90
VariableCoefficientStandard Errort-Statisticp-Value
Intercept0.0950.0731.3030.284
Ts0.7330.0898.1590.004
Ma_B−0.2450.015−16.679<0.001
Number of observations: 6, error degrees of freedom: 3, root-mean-squared error: 0.018, R-squared: 0.991, adjusted R-squared: 0.986, F-statistic vs. constant model: 172, p-value < 0.001.
Publisher’s Note: MDPI stays neutral with regard to jurisdictional claims in published maps and institutional affiliations.

