Article

Numerical Simulation on the Hydrodynamic Flow Performance and an Improve Design of a Circulating Water Channel

1
Yantai Research Institute, Harbin Engineering University, Yantai 265500, China
2
College of Shipbuilding Engineering, Harbin Engineering University, Harbin 150001, China
3
State Key Laboratory of Hydraulic Engineering Simulation and Safety, Tianjin University, Tianjin 300072, China
4
College of Engineering, Penryn Campus, Mathematics and Physical Sciences, University of Exeter, Penryn TR10 9FE, UK
*
Author to whom correspondence should be addressed.
J. Mar. Sci. Eng. 2022, 10(3), 429; https://doi.org/10.3390/jmse10030429
Submission received: 11 February 2022 / Revised: 11 March 2022 / Accepted: 13 March 2022 / Published: 15 March 2022
(This article belongs to the Section Coastal Engineering)

Abstract

:
A Circulating Water Channel (CWC) is an important piece of equipment for hydrodynamic tests in ocean engineering, the quality of the flow field produced by the CWC directly affects the accuracy of the experimental results. Optimizing the key parts of the CWC device can efficiently improve the velocity uniformity and helps to achieve a high-level flow performance. In this paper, a CWC flume is set up numerically, and a series of hydrodynamic tests were carried out to evaluate the flow uniformity by optimizing the turning vane and contraction section. The numerical model is solved based on the RANS equation by using the RNG model to simulate turbulence. The improved design of the CWC includes the investigations of the flow guiding vane at the turning corners and the contraction section in the flow acceleration zone. The turning vane cross-sectional shape, the straight-edged length of the wing, and the layout of the contraction transition section design were considered and verified. The obtained results show that the wing-type turning vane with appropriate straight-edged length can help to improve the velocity uniformity of the flow field. The Witozinsky transition curve could achieve better pressure gradient effects for CWC contraction section design, and the flow uniformity improved by increasing the contraction transition length. Based on the optimal design, the internal flow characteristics of the circulating water channel have been greatly improved, laying a solid foundation for wind-wave-current multifunction CWC equipment applications for future experiments.

1. Introduction

The circulating water channel is one of the most important pieces of physical equipment for hydrodynamic studies. Compared with the towing tank, it occupies less area but can generate a stable flow field, which could be used for long-term observation and measurement. The hydrodynamic characteristics of the flow field in the CWC, such as the uniformity of the flow velocity, is always affected by the CWC overall performance; however, to some extent, the uniformity of the flow velocity will also play a key role in the indicators to evaluate the hydrodynamic performance of the total CWC [1]. Hence, for the refining design procedure of the CWC, it is particularly important to improve the uniformity performance of the water flow to ensure the homogeneity of the flow velocity distribution regarding its test section of the CWC.
The CWC produces a stable flow field to provide test conditions for long-term measurement in experiments. In the process of optimizing the CWC, the water flow runs a 360° cyclic motion in the channel field, which needs to pass four rectangle corners during the operating procedure. The quality of the water flow field at the corner will be seriously affected by the deflector performance, and the effective design of a deflector could avoid the water flow being the “secondary flow” after the corners. Therefore, the form of the turning vanes and the arrangement of it plays an important role in reducing the water flow resistance at the corners, and the uniformity of the flow velocity in the test area will improve based on its enhancements.
Achieving the uniformed flow field and the flatness of the free surface in the testing section is a basic requirement thus researchers have focused on the study of improving it and undertaking the challenge for CWC design. Chen et al. [2] carried out a series of fluid mechanics problems involved in the CWC and optimized the turning vanes with different quantities and geometrical dimensions at the fourth corner of the CWC to enhance the flow uniformity of the water velocity. Pullinger and Sargison [3] used a computational fluid dynamics (CFD) method as a design tool to optimize and improve the flow uniformity of the CWC. The results show that the increasing of the drag coefficient of the honeycomb device and the trailing edge of the turning vanes could promote the flow uniformity, whilst there is little effect of the turning vanes’ angle on the alterations of the flow uniformity. In order to evaluate the influence of the turning vanes on the flow quality of the CWC’s test section and determine the optimal form of the turning vanes, Yu et al. [4] involved the RANS equation combined with the RNG turbulence model to analyze the flow field at the elbow of the channel by using FLUENT software based on the finite volume method. It was found that the redundant turning vanes will cause frictional resistance, consume energy, and the blocking effects; when the square elbow turning vanes are arranged densely and sparsely, the flow field at the corner has the smallest pressure gradient and best velocity uniformity. Zhu et al. [5] established a numerical model using the RANS method to simulate the free surface and the flow filed in the CWC. The results showed that the honeycomb had a strong inhibitory effect on the swirling flow; the stamping metal can significantly improve the flow uniformity, but not for the vorticity of the front and rear sections.
For the long-term continuous upgrading process of the CWC, the contraction section had been successfully introduced to promote the flow uniformity performance in the front of the test section. The existing method for the contraction section design mostly uses numerical solutions with the incompressible and inviscid flow assumptions; the physical study of the actual contraction model is rarely conducted. Mikhail [6] linked the contraction section with the CWC and calculated the flow field characteristics by using the non-viscous flow method; it was found that the contraction length has an essential influence on the flow stability and uniformity for the test section in the CWC. Fang et al. [7] numerically studied the distribution of the cross-sectional velocity and longitudinal pressure along the wall centerline of the contraction section and validated the simulations with the experimental results. Wang et al. [8] numerically investigated the flow field characteristics with the contraction section in the tube-flume by solving the RANS equations. Two contraction forms with different outlet dimensions and contraction ratios, allowing three different contraction transition curves, were selected for evaluating the CWC performance. The degree of the contraction transition curves can be judged according to the reversal pressure gradient, uniformity of the outlet velocity, and the wall separation effects.
Further, the contraction section is not only used in the design of the CWC but also exists in the wind tunnel and the turbine structures in the OWC device. Morel [9] designed the contraction part of the wind tunnel by using the non-viscous and incompressible flow analysis. By evaluating the maximum pressure coefficient at the three arc walls, it was found that the one-parameter family of wall shapes formed of two smoothly joined cubics is a suitable choice for a wall contour. Sargison et al. [10] carried out the numerical simulation to research the optimal position of the inflection point of the contraction shape formed by the sixth-order polynomial and the curvature of the contraction entrance. The physical calibration of the facility proved that the involved technology can be used in future wind tunnel designs. Zhuang et al. [11] numerically simulated the Witozinsky transition curve and the fifth power transition curve of the flow field in CWC. Regarding the total pressure loss coefficient, the Witozinsky transition curve performed a higher velocity uniformity and axial static pressure gradient. Ezhilsabareesh et al. [12] investigated the asymmetric velocity distribution for the OWC inhalation and exhalation modes; the average power conversion efficiency of the OWC device increased by nearly 9.5% after optimizing the asymmetrical rotor blade angle γ and the shape of the turning vanes.
The above-mentioned research has proved the feasibility of applying the CFD method to the CWC. The main aim of this article is to optimize the key components of the CWC for its flow field uniformity improvement. In this paper, a CWC flume was numerically modeled, and an improved design of the CWC was conducted to achieve the high quality of the flow field for experimental tests by optimizing the turning vane and contraction sections. The outline of this article is as follows: Section 2 introduces the numerical model and verifies its grid independence between the turning vanes and the contraction sections by following validations of the numerical results with relative published experimental data to verify the feasibility of the CFD method. Section 3 discusses the effects of different turning vane shapes and the optimization of the contraction section forms of the proposed CWC. Lastly, the conclusions are given in Section 4.

2. Theory and Model Validation

2.1. Numerical Model

To investigate the free surface deformation and the internal flow field of the CWC, three-dimensional numerical simulations were carried out to evaluate the performance of the turning vanes, constricted section area, and the whole circle tube of the CWC by using the commercial software package STAR-CCM+.
The RNG turbulence model was adopted for the numerical calculation; the standard model assumed the calculated fluid state is completely turbulent, and the influence of the molecular viscosity of the fluid is negligible [13]. The finite volume method (FVM) was used to solve the RANS equations, which are used to calculate the pressure and the velocity in the flow field of the CWC. The governing equations are:
ρ t + x i ( ρ u i ) = 0
( ρ u i ) t + ( ρ u i u j ) x j = p x j + x j ( μ u i x j ρ u i u j ¯ ) + S i
where ρ is the fluid density, μ is the dynamic viscosity, μi and μj are the Reynolds averaged velocity components, μi and μj represent the turbulence velocity, and p is the time-averaged pressure. According to the eddy viscosity assumption, the Reynolds stress term ρ u i u j ¯ can be rewritten as:
ρ u i u j ¯ = u t ( u i x j + u i x i ) 2 3 ( ρ κ + μ u i x i ) δ i j
where μt is the eddy viscosity, δij is the Kronecker delta function, and κ is the turbulent kinetic energy, which can be described as:
κ = u i u j ¯ 2
To compensate the distortion of the standard k-ε model for the condition of strong swirling or flow with curved walls, the RNG k-ε turbulence model is usually used for numerical calculation. Compared with the standard k-ε model, the RNG k-ε model can operate at a low Reynolds number. The rationality of the results depends on whether the correct near-wall region equation is selected in the pre-processing process. The Reynolds stress term is modeled by the RNG k-ε turbulence model:
( ρ k ) t + ( ρ k u i ) x i = x j [ α k μ e f f k x j ] + G k + ρ ε
( ρ ε ) t + ( ρ ε μ i ) x i = x j [ α ε μ e f f ε x j ] + C 1 ε * k G k C 2 ε ρ ε 2 k
The turbulent viscosity μt and the diffusion coefficient μeff are:
μ t = ρ C μ k 2 ε
μ e f f = μ + μ t
where ε is the dissipation rate of the turbulent kinetic energy, k is the turbulent kinetic energy, ε is the dispersion rate, and the expression of C 1 ε * can be written as:
C 1 ε * = C 1 ε η ( 1 η / η 0 ) 1 + β η 3
in which η = ( 2 E y E i j ) k ε and E i j = 1 2 ( u i x j + u i x i ) . The values of the constant terms in Equations (5)–(9) are adopted as Cμ = 0.0845, C1ε = 1.42, C2ε = 1.42, η0 = 4.377, β = 0.012, αk = αε = 1.39.
The RNG k-ε model is a k-ε model modified by Yakhot et al. [14] using a renormalization group method. The RNG k-ε model takes into account the rotation and swirl flow in the mean flow by correcting the turbulent viscosity. The time-averaged strain rate Eij reflecting the mainstream is added to the ε equation. The term generated in the RNG k-ε model is not only related to the flow situation but is also a function of the spatial coordinates in the same problem. Therefore, the RNG k-ε model can better handle the flow with a high strain rate and a large degree of streamline bending. It should be noted that the RNG k-ε model is still valid for a fully developed turbulent flow, then the wall function method for the flow can be used in the near-wall region. The wall function method is used to directly relate the physical quantity of the wall to the unknown quantity to be solved in the turbulent core region. The k-epsilon model is used to solve the flow in the turbulent core region but not in the wall region, and the semi-empirical formula is directly used to connect the physical quantities on the wall with the solution variables in the turbulent core region. In this way, the node variables of the control volume adjacent to the wall can be directly obtained without solving the flow in the wall area.
The Second Order Upwind scheme was chosen as the spatial discretization of the equations, and the algorithm of the Semi-Implicit Method for Pressure Linked Equations (SIMPLE) was used to evaluate the coupled pressure-velocity problem. The tracking free water surface is solved by the Volume of Fluid (VOF) method.
The numerical computational domain with the boundary of velocity inlet and the pressure outlet sections are depicted. The CWC flume is 85 m long, 8 m in width, and the total length of the circle tube flume is 256 m. The water depth is 8 m. The total CWC flume in the prototype scale is simulated in the numerical model. The surfaces of the turning guide vanes are set to 0.5 m thickness to simulate the laminar structure effects. The extra computational domain at the turning corner is encrypted due to the water flow turbulence. The pressure outlet boundary conditions are set at the top of the annular circle tube, and the no-slip boundary condition is applied to the other solid boundaries. The main flow and the surface flow are considered in the numerical model and carried out in this paper. Based on the real CWC device, several paralleled horizontal rigid plates were used as the wave absorber with no thickness in the numerical calculation domain. To analyze the flow field characteristics of the free surface in the CWC, uniform velocity conditions with U = 1.0 m/s are applied at the inlet and outlet boundaries.

2.2. Validation of the Numerical Model

2.2.1. Mesh Generation and Grid Convergence Study

The numerically modeled whole CWC with the generated mesh structure is detailed in Figure 1. The CWC presented in this study is 83 m in length, 43 m in width, and 8 m in height. The testing section is 22 m long and 4 m wide, with a water depth of 4 m. The dimensions of the test section are listed in Table 1. The CWC consists of the water inlet, the diffuser, four corners with the turning vanes, the contraction section located behind the second corner, and the test section after the contraction area. The flow velocity in the test section is adjusted by the water inlet, the water flows into the diffuser, and flow velocity becomes slow caused by the loss of energy. Then, after the rectification by the turning vanes and the contraction section, it improved the flow uniformity in the test section. For the turning guide vanes and the grid area of the contraction section, the polyhedral mesh is applied, and the structured mesh constructs the residual mesh to ensure computational efficiency. The connected interfaces between the joint faces mesh to transfer the exchanging data. The mesh information involved in the CWC numerical model is given in Table 2.
In Figure 1b,c, a finer mesh is generated on the turning guide vanes and the contraction section of the CWC to capture the surface flow field more accurately near the water surface. Before generating the mesh grids, the number of the grids should be reduced as much as possible under the premise of ensuring the calculation accuracy and improving the calculation efficiency of each section part in the numerical model. Hence, verifying the grid independent performance on the specified turning guide vanes and the contraction sections are much needed for the grid convergence study.
In the convergence modeling approach, three basic mesh sizes with l = 0.2, 0.4, and 1.0 m were selected for generating the mesh at the deflector area and the contraction section area, allowing the encryption on the deflector surface, the edge curve, and the contraction curve section. Figure 2a,b shows the velocity of a random point at the turning corner and the contraction section of the CWC against different iterative steps, M, respectively. Compared with the mesh grid size of l = 1.0 m, the cases for the grid size of 0.4 and 0.2 m have larger iterative steps and the same trend of the calculating convergence at M = 320 for guide vanes and M = 250 for the contraction section. Considering both the calculation efficiency and accuracy, the grid size of l = 0.4 m was chosen for structure mesh division to meet the grid independence requirement. According to the determined basic grid size, the final information of the mesh for total elements and numerical results for different grids are listed in Table 2.

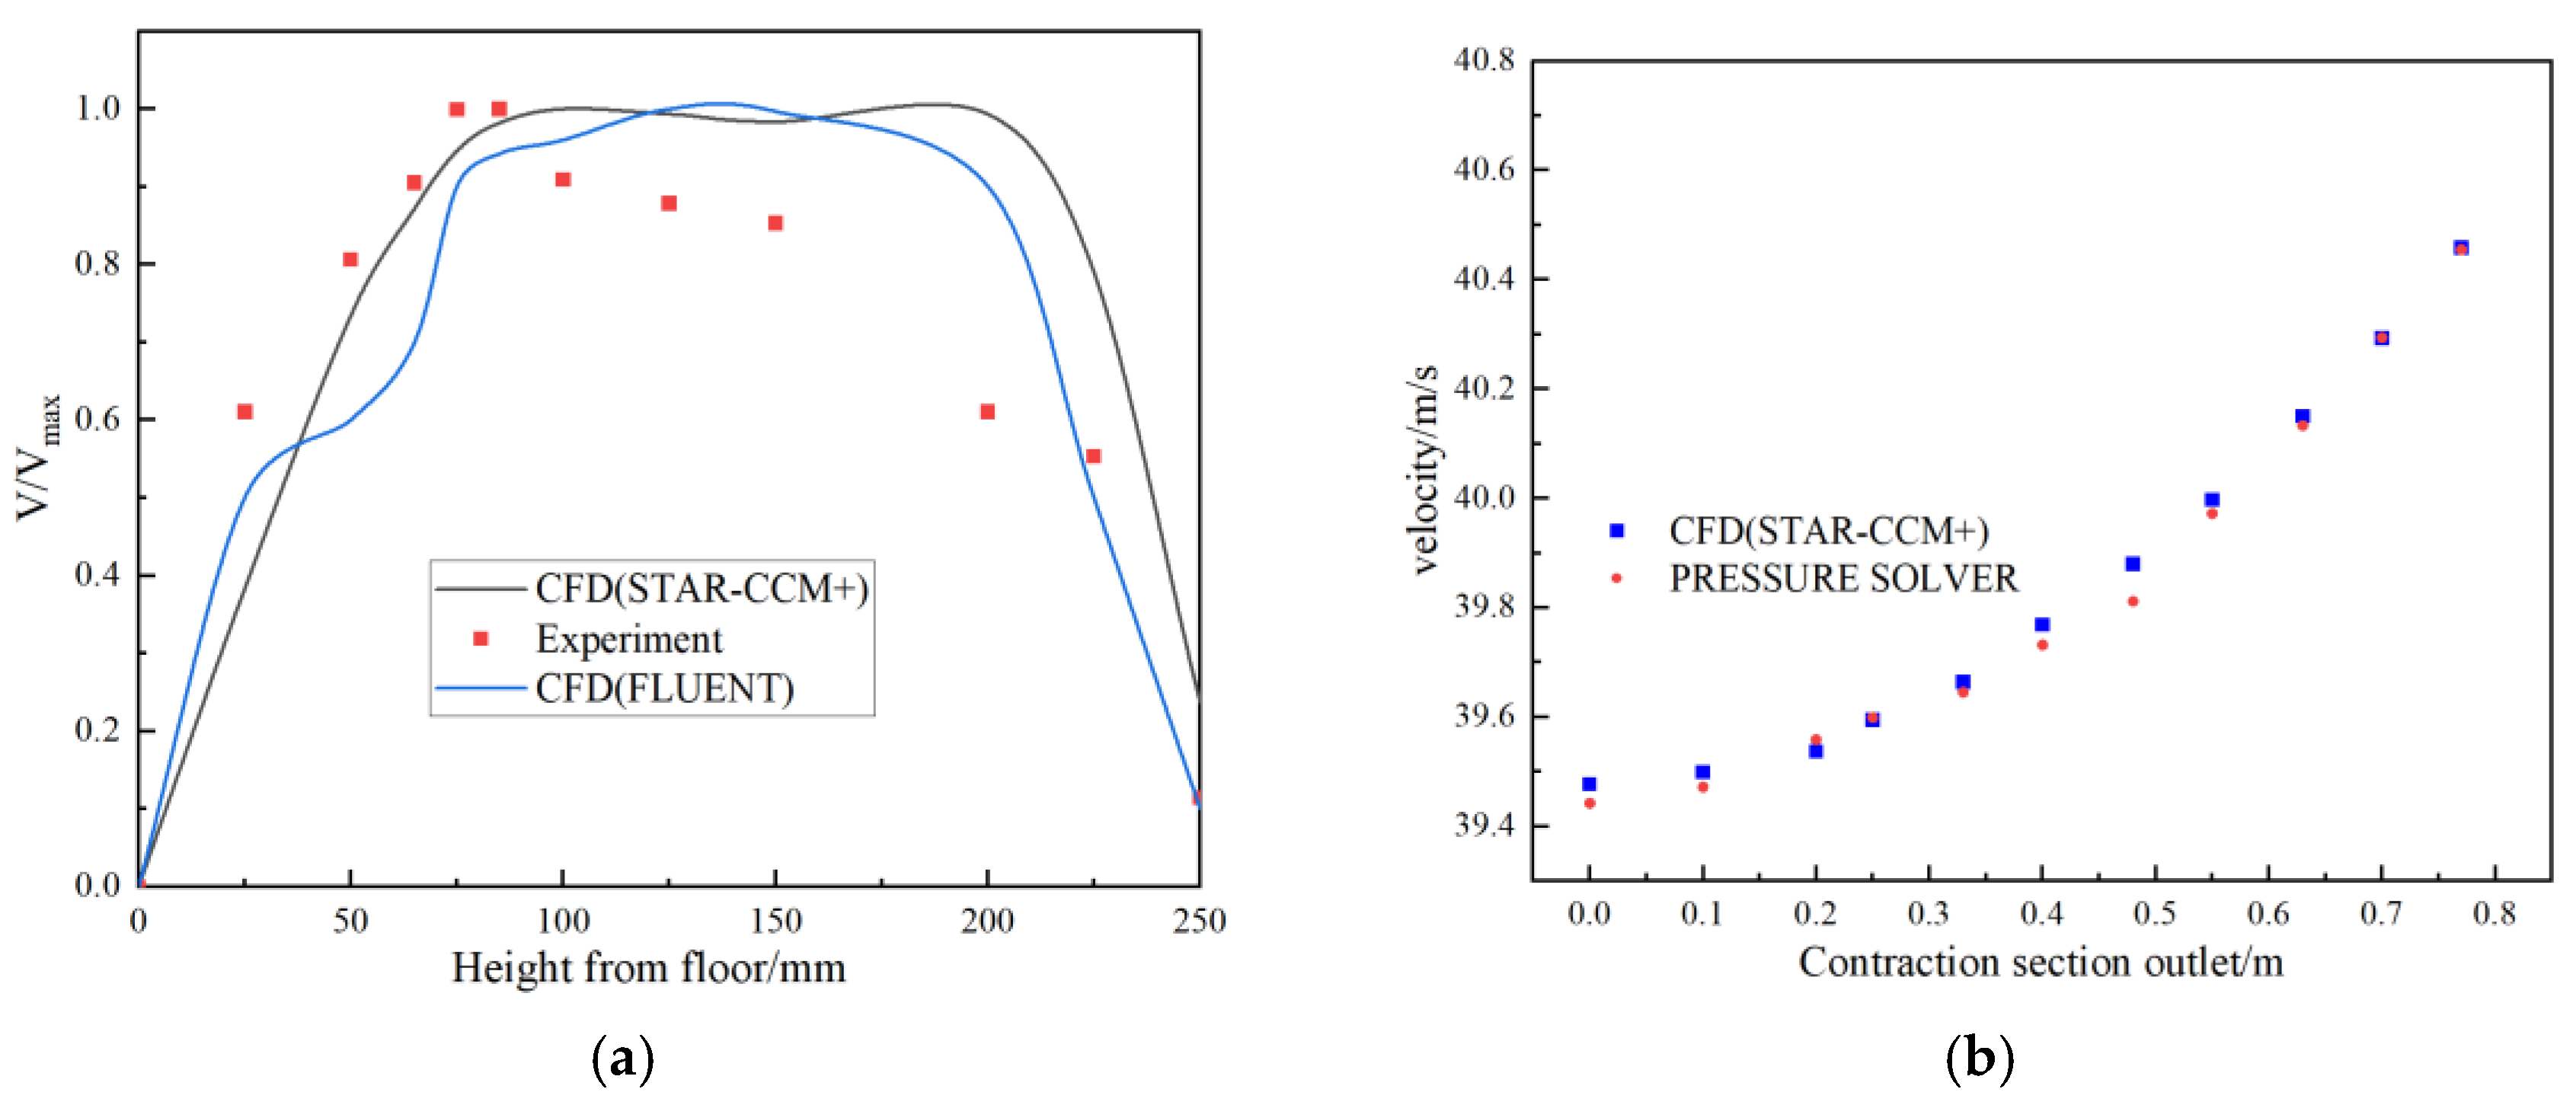
2.2.2. Comparison of Published Experimental and Numerical Results

Based on the above set-up numerical model, the comparison of the simulated results and the published physical data was carried out for validation. Figure 3a shows the velocity distribution at the outlet of the deflector compared with the experimental profile of the CWC model measured by Tucker [15] and the velocity profile at the inlet of the working section using CFD software, which was carried out by Pullinger et al. [3]. In Figure 3, the same phenomenon has been achieved with the results obtained by Pullinger where the CFD demonstrates good agreement with the experimental data in the lower half of the CWC, but for the upper half of the channel, the difference caused by the over predictions of the velocity using the CFD method is inevitable in the comparison. Moreover, in this presented model, the region of interest mainly focused on the lower half of the channel, and the increased resolution of data points can also perform a greater understanding of the flow in the upper region thus it can be considered that the numerical model has the reliability of the CWC flow calculations. To evaluate the uniformity of the flow velocity, the main region of interest in this present study is the middle and lower half of the channel. With the increasing data measured in the upper region of the flume for resolutions, an understanding of the flow field will be obtained for this region.
Figure 3b shows the flow velocity profiles at the outlet of the contraction section of the CWC, compared with the outlet velocity results obtained by using a two-dimensional axisymmetric pressure solver by Zhuang et al. [11]. Eleven continuous monitoring points were located along the contraction segment in the longitudinal direction; the probes were homogeneously arranged from the inlet to the outlet of the contraction section. The stable velocity of these monitoring points was measured to be compared with the published pressure solver data. The results show that the calculated CFD data agrees well with the published simulation for the contraction section of the CWC device, which provides a reliable numerical tool for the following analysis of this proposed CWC.

3. Results and Discussions

The uniformity of the velocity of the flow field in the test section is one of the most basic indexes for a CWC and its optimization design. Hence, the flow characteristics of the CWC should be much concerned and studied to ensure velocity uniformity, and to avoid the flow separation, especially at the turning corner of the CWC flume. Compared with the variation of the velocity, the influence of the flow direction is also a great impact factor for the CWC flow uniformity evaluation. The quality of the flow field at the corner of the CWC mainly relies on the form of the turning vanes. A suitable turning vane can improve the velocity uniformity and reduce the resistance loss at the turning corner. In this section, the effects of the turning vanes and the contraction section on the flow velocity characteristics are studied and discussed.

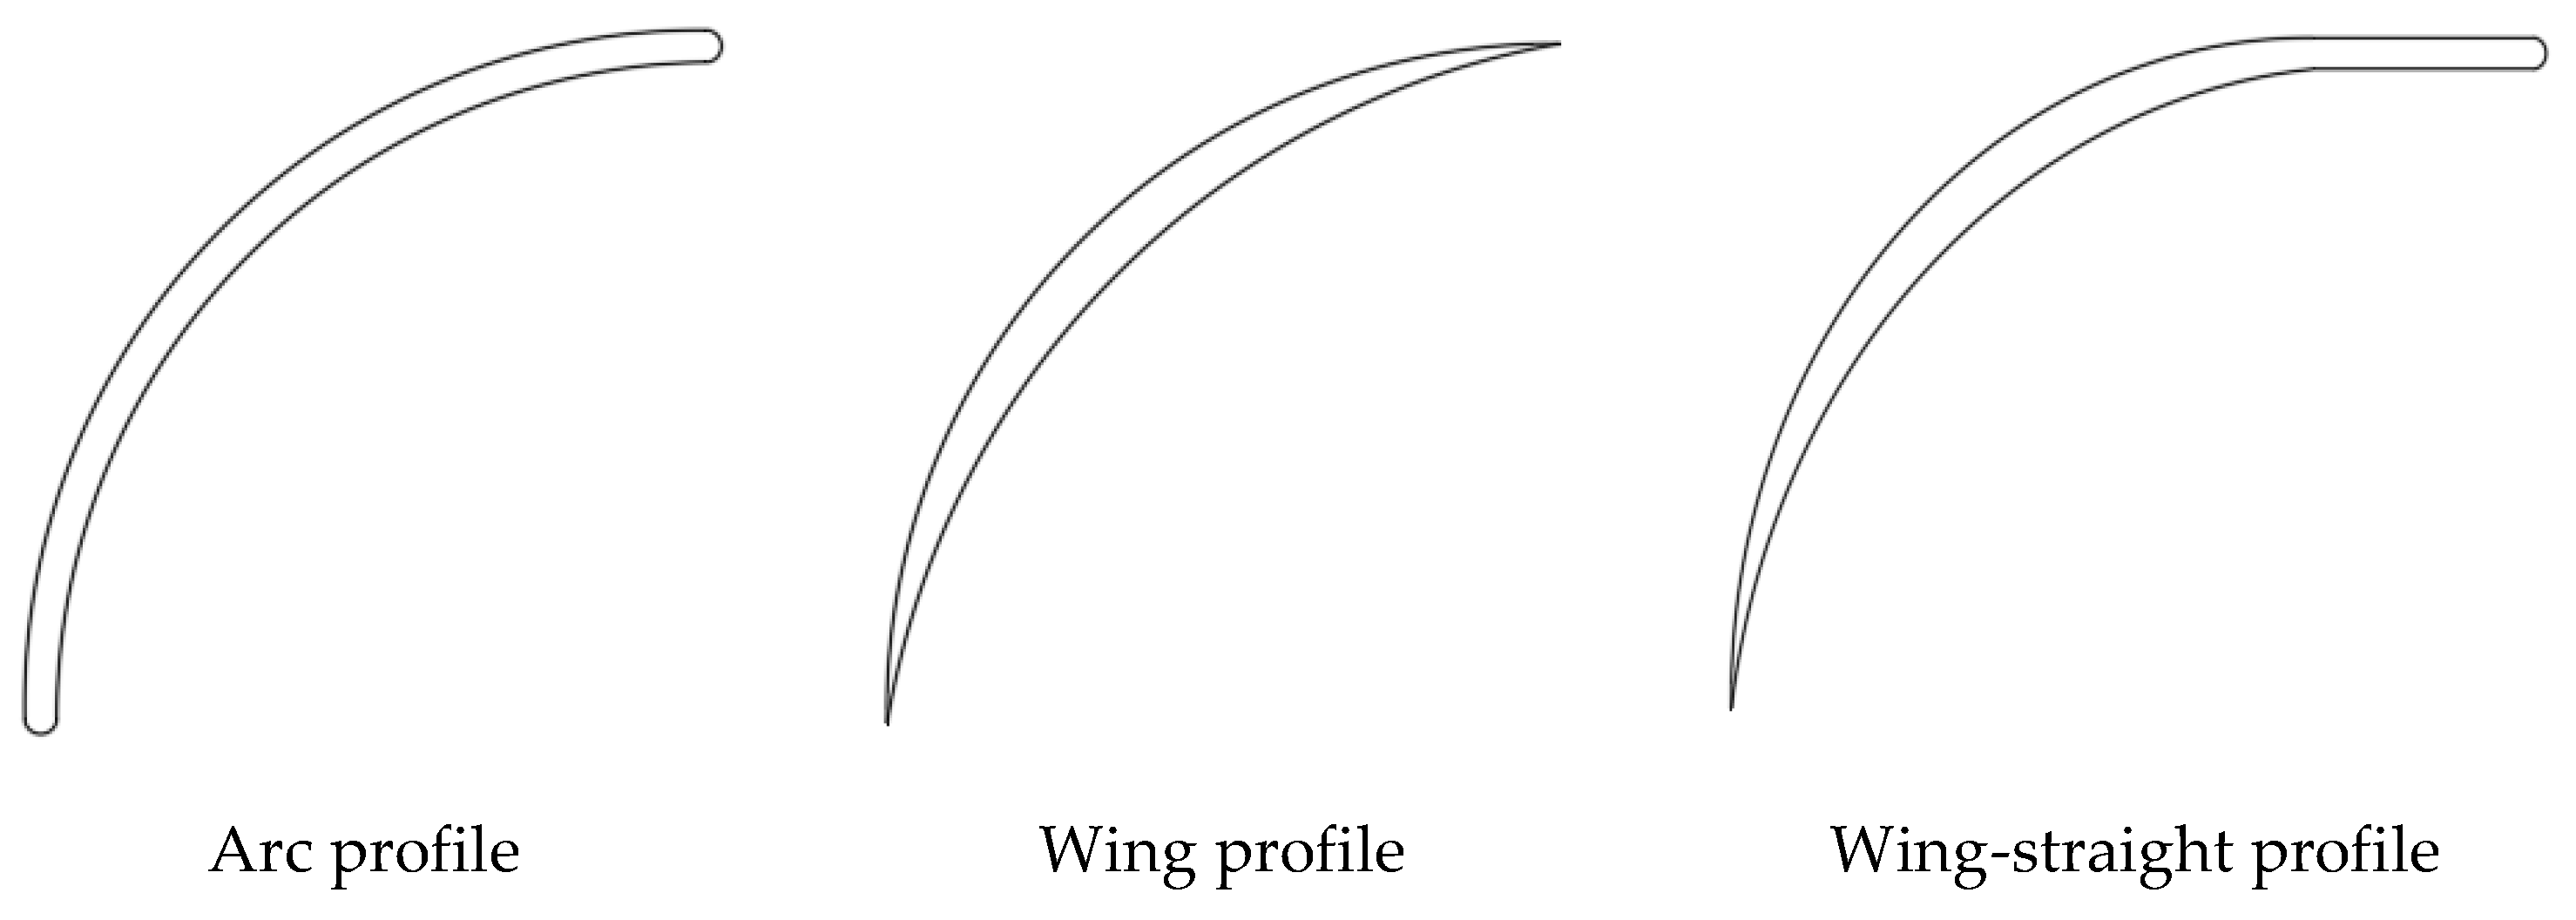
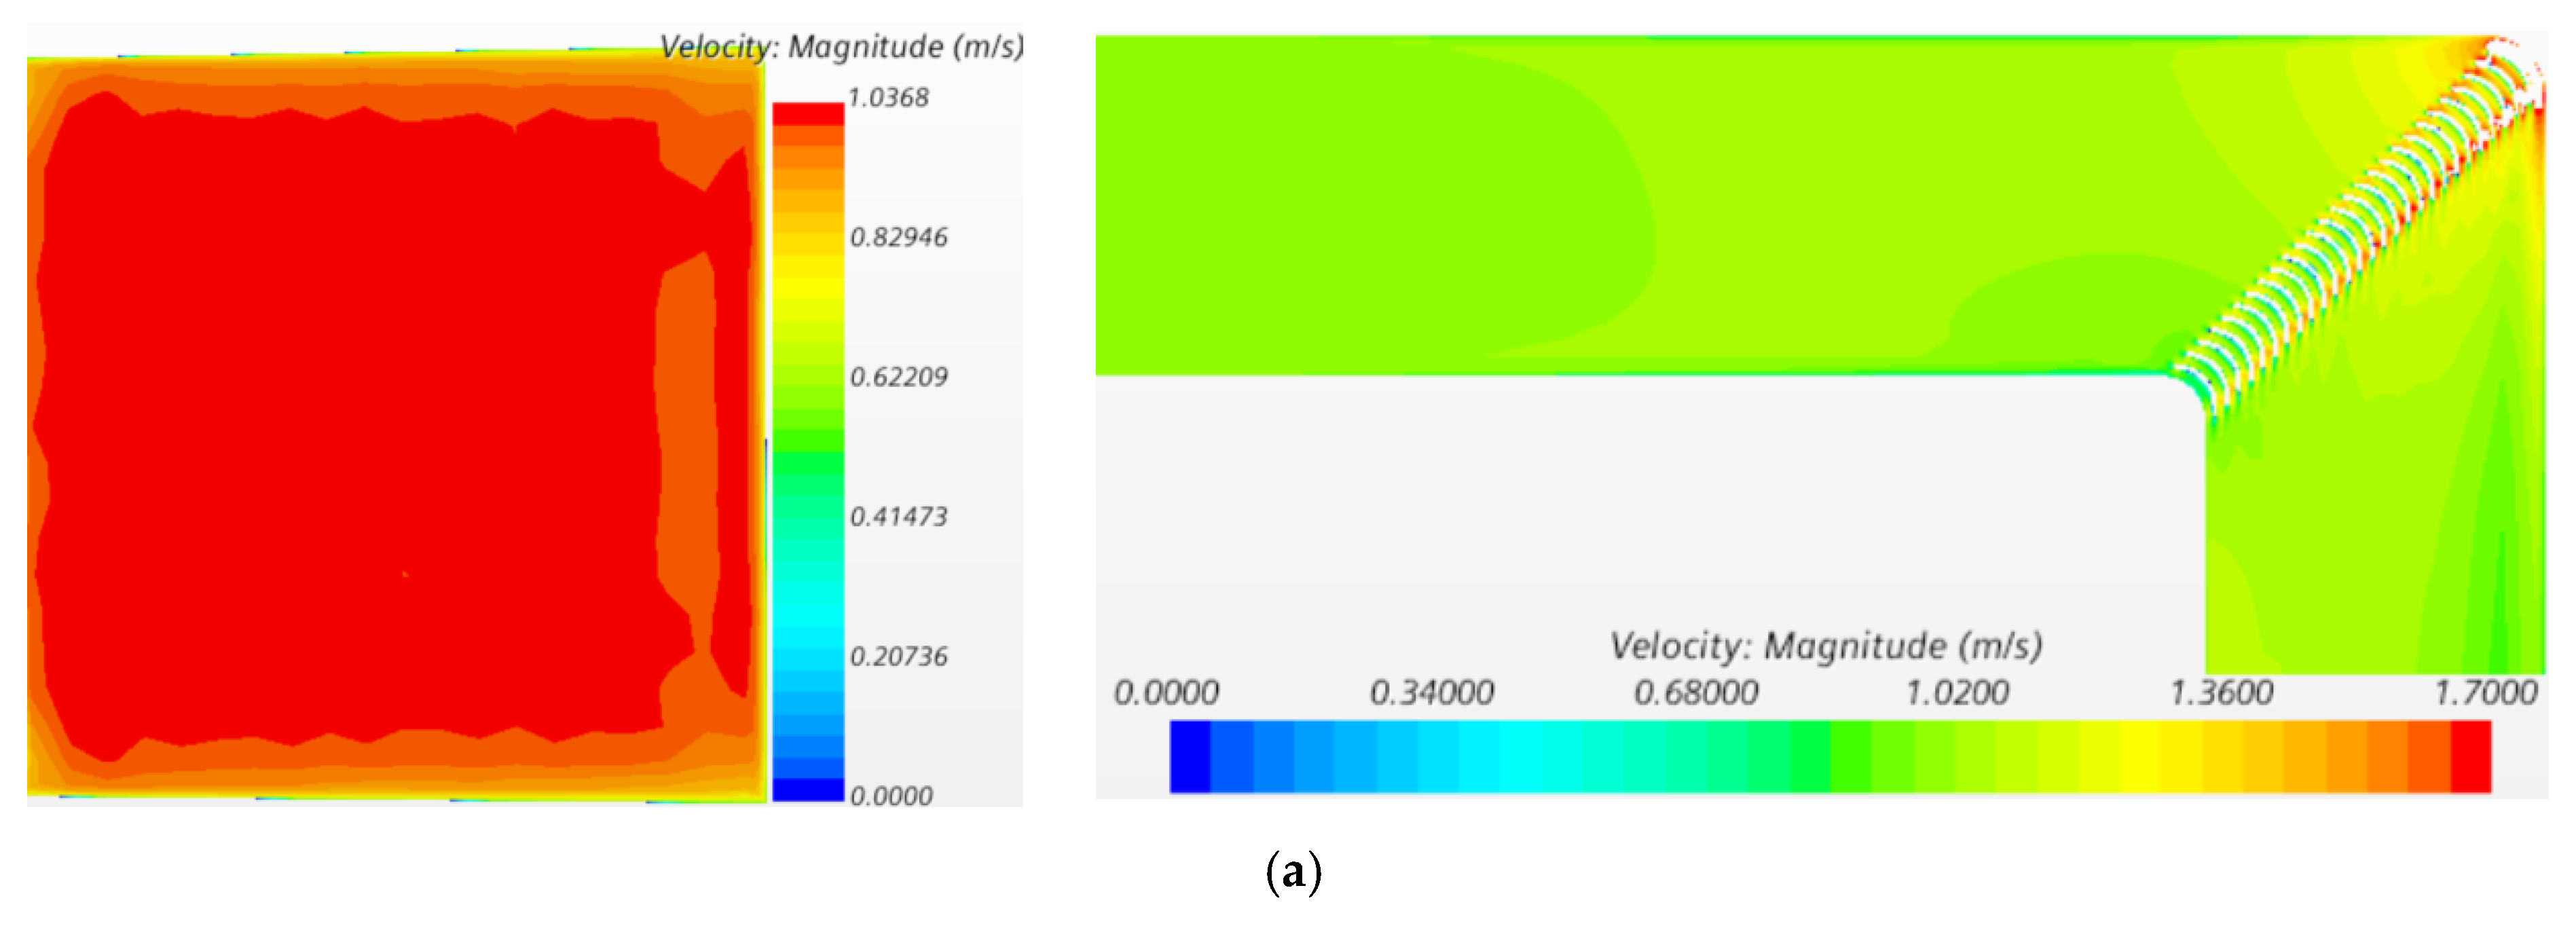
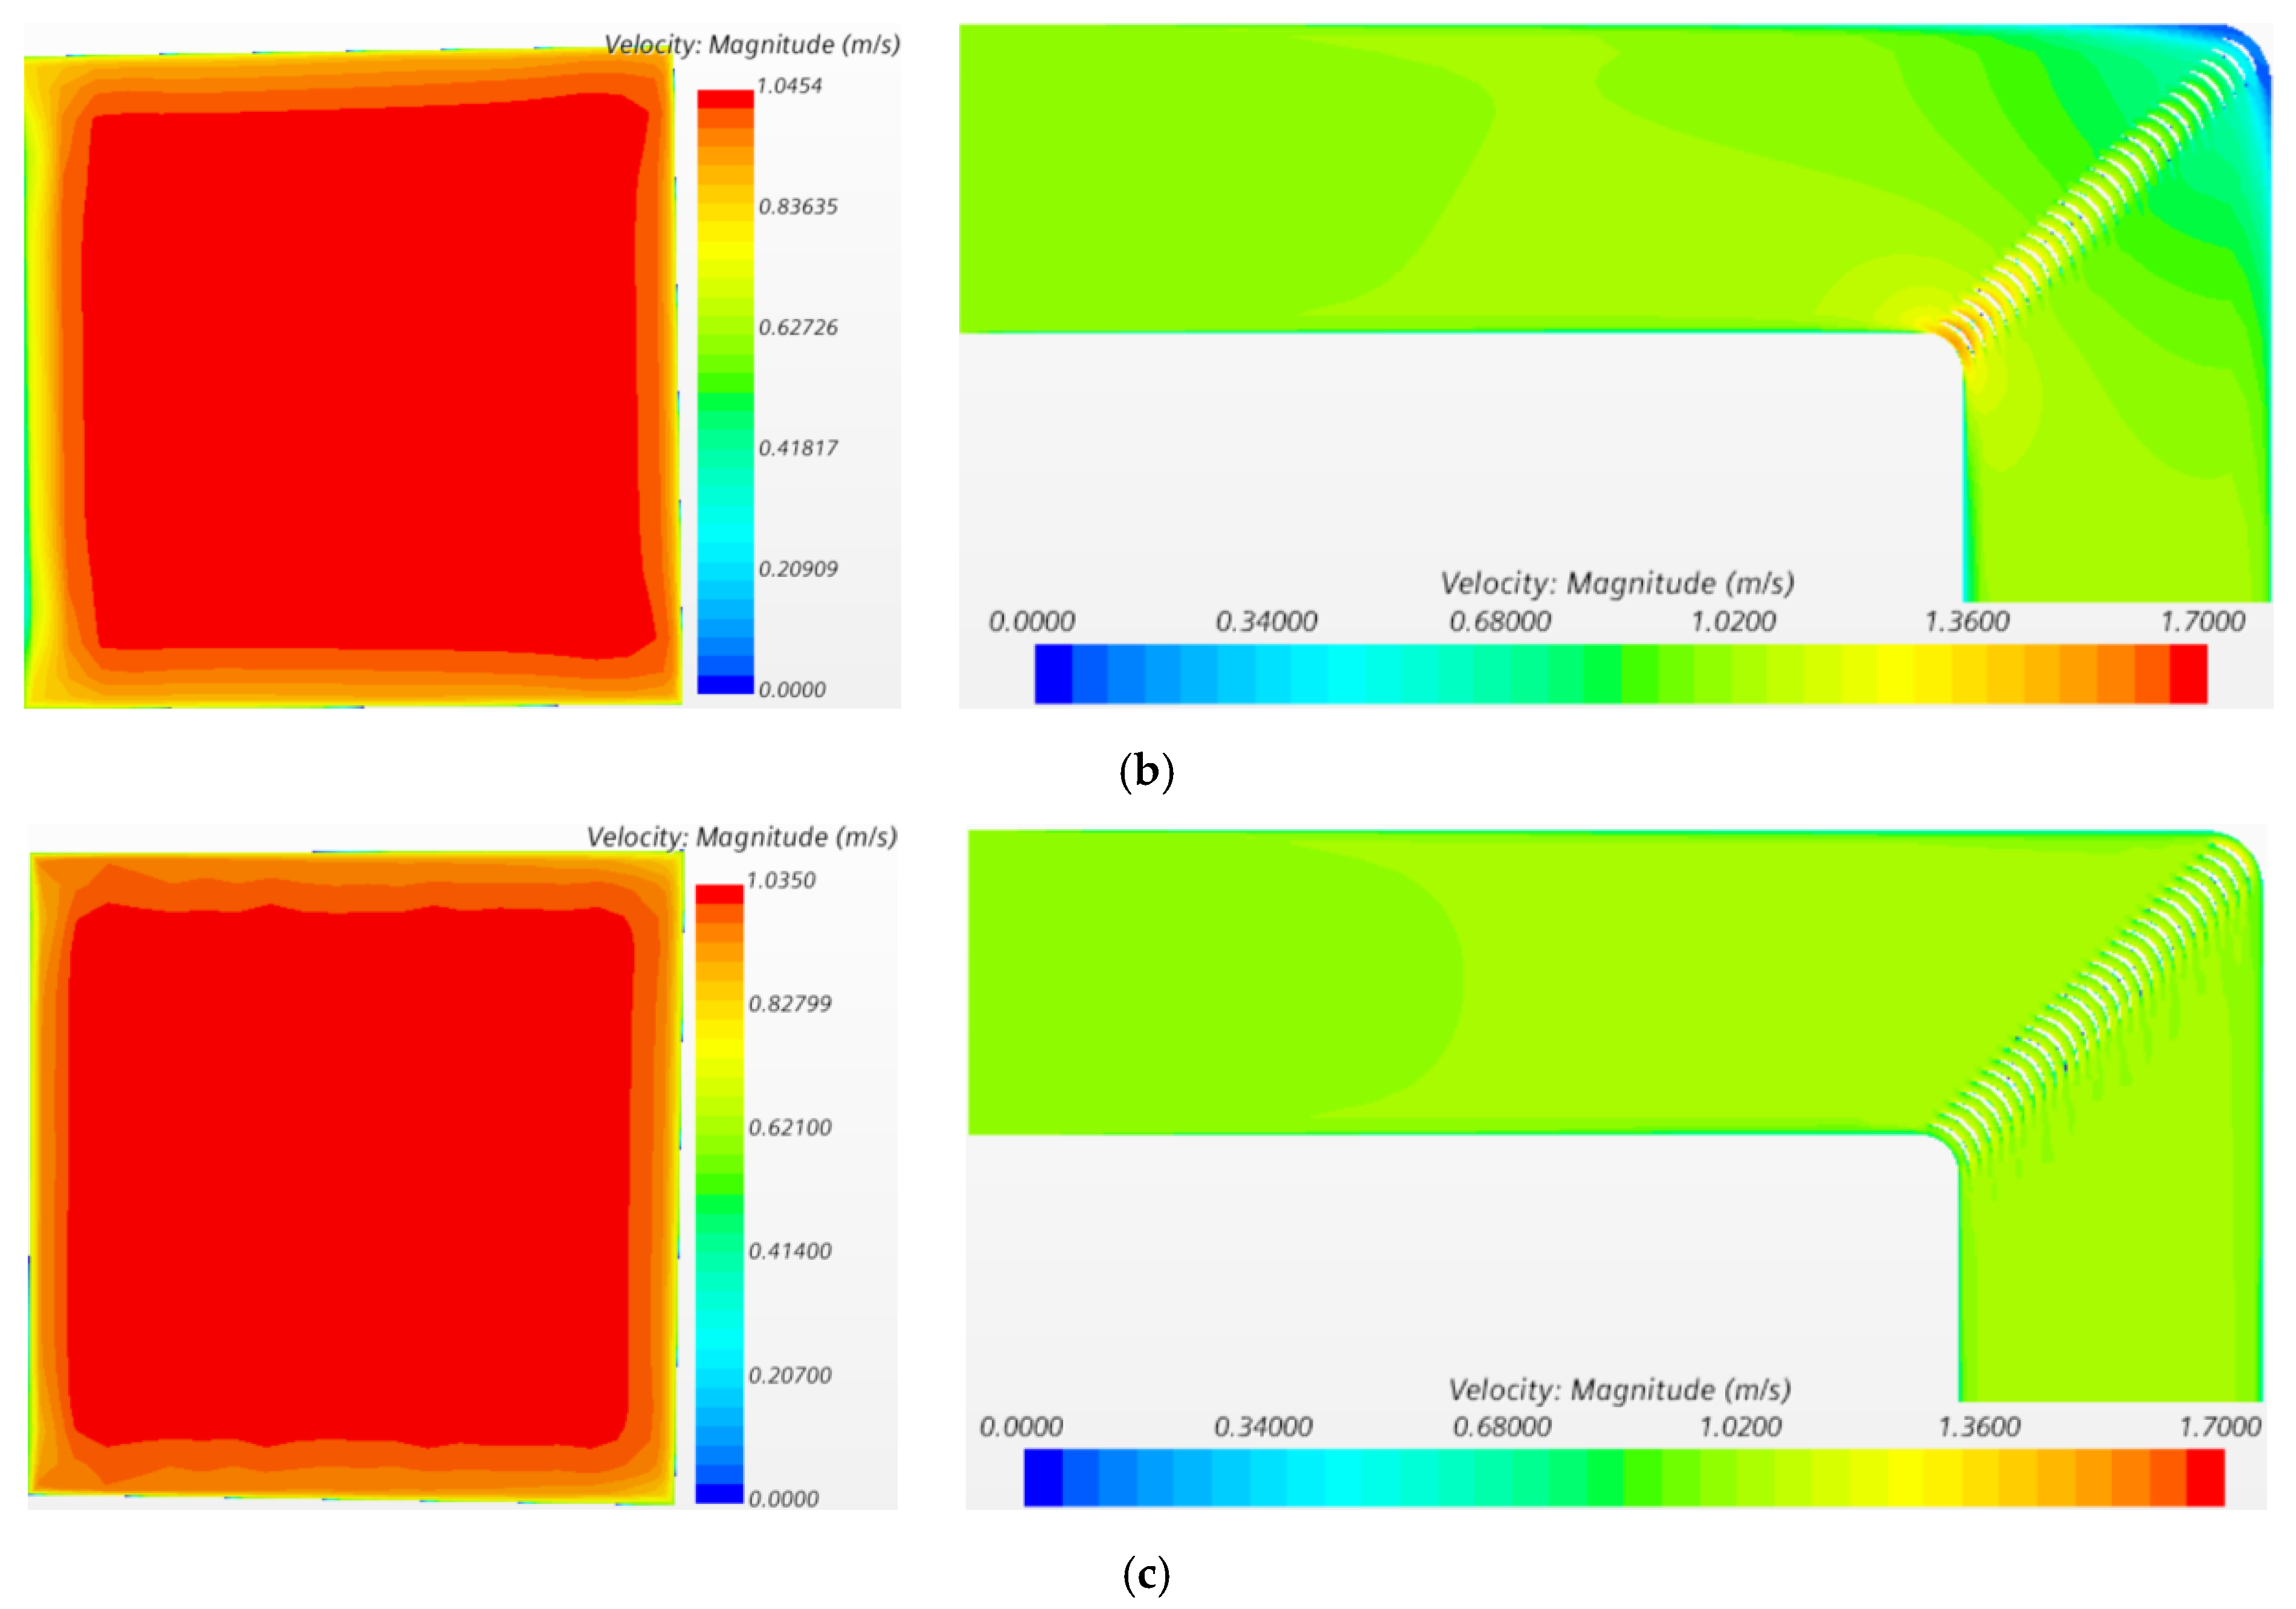
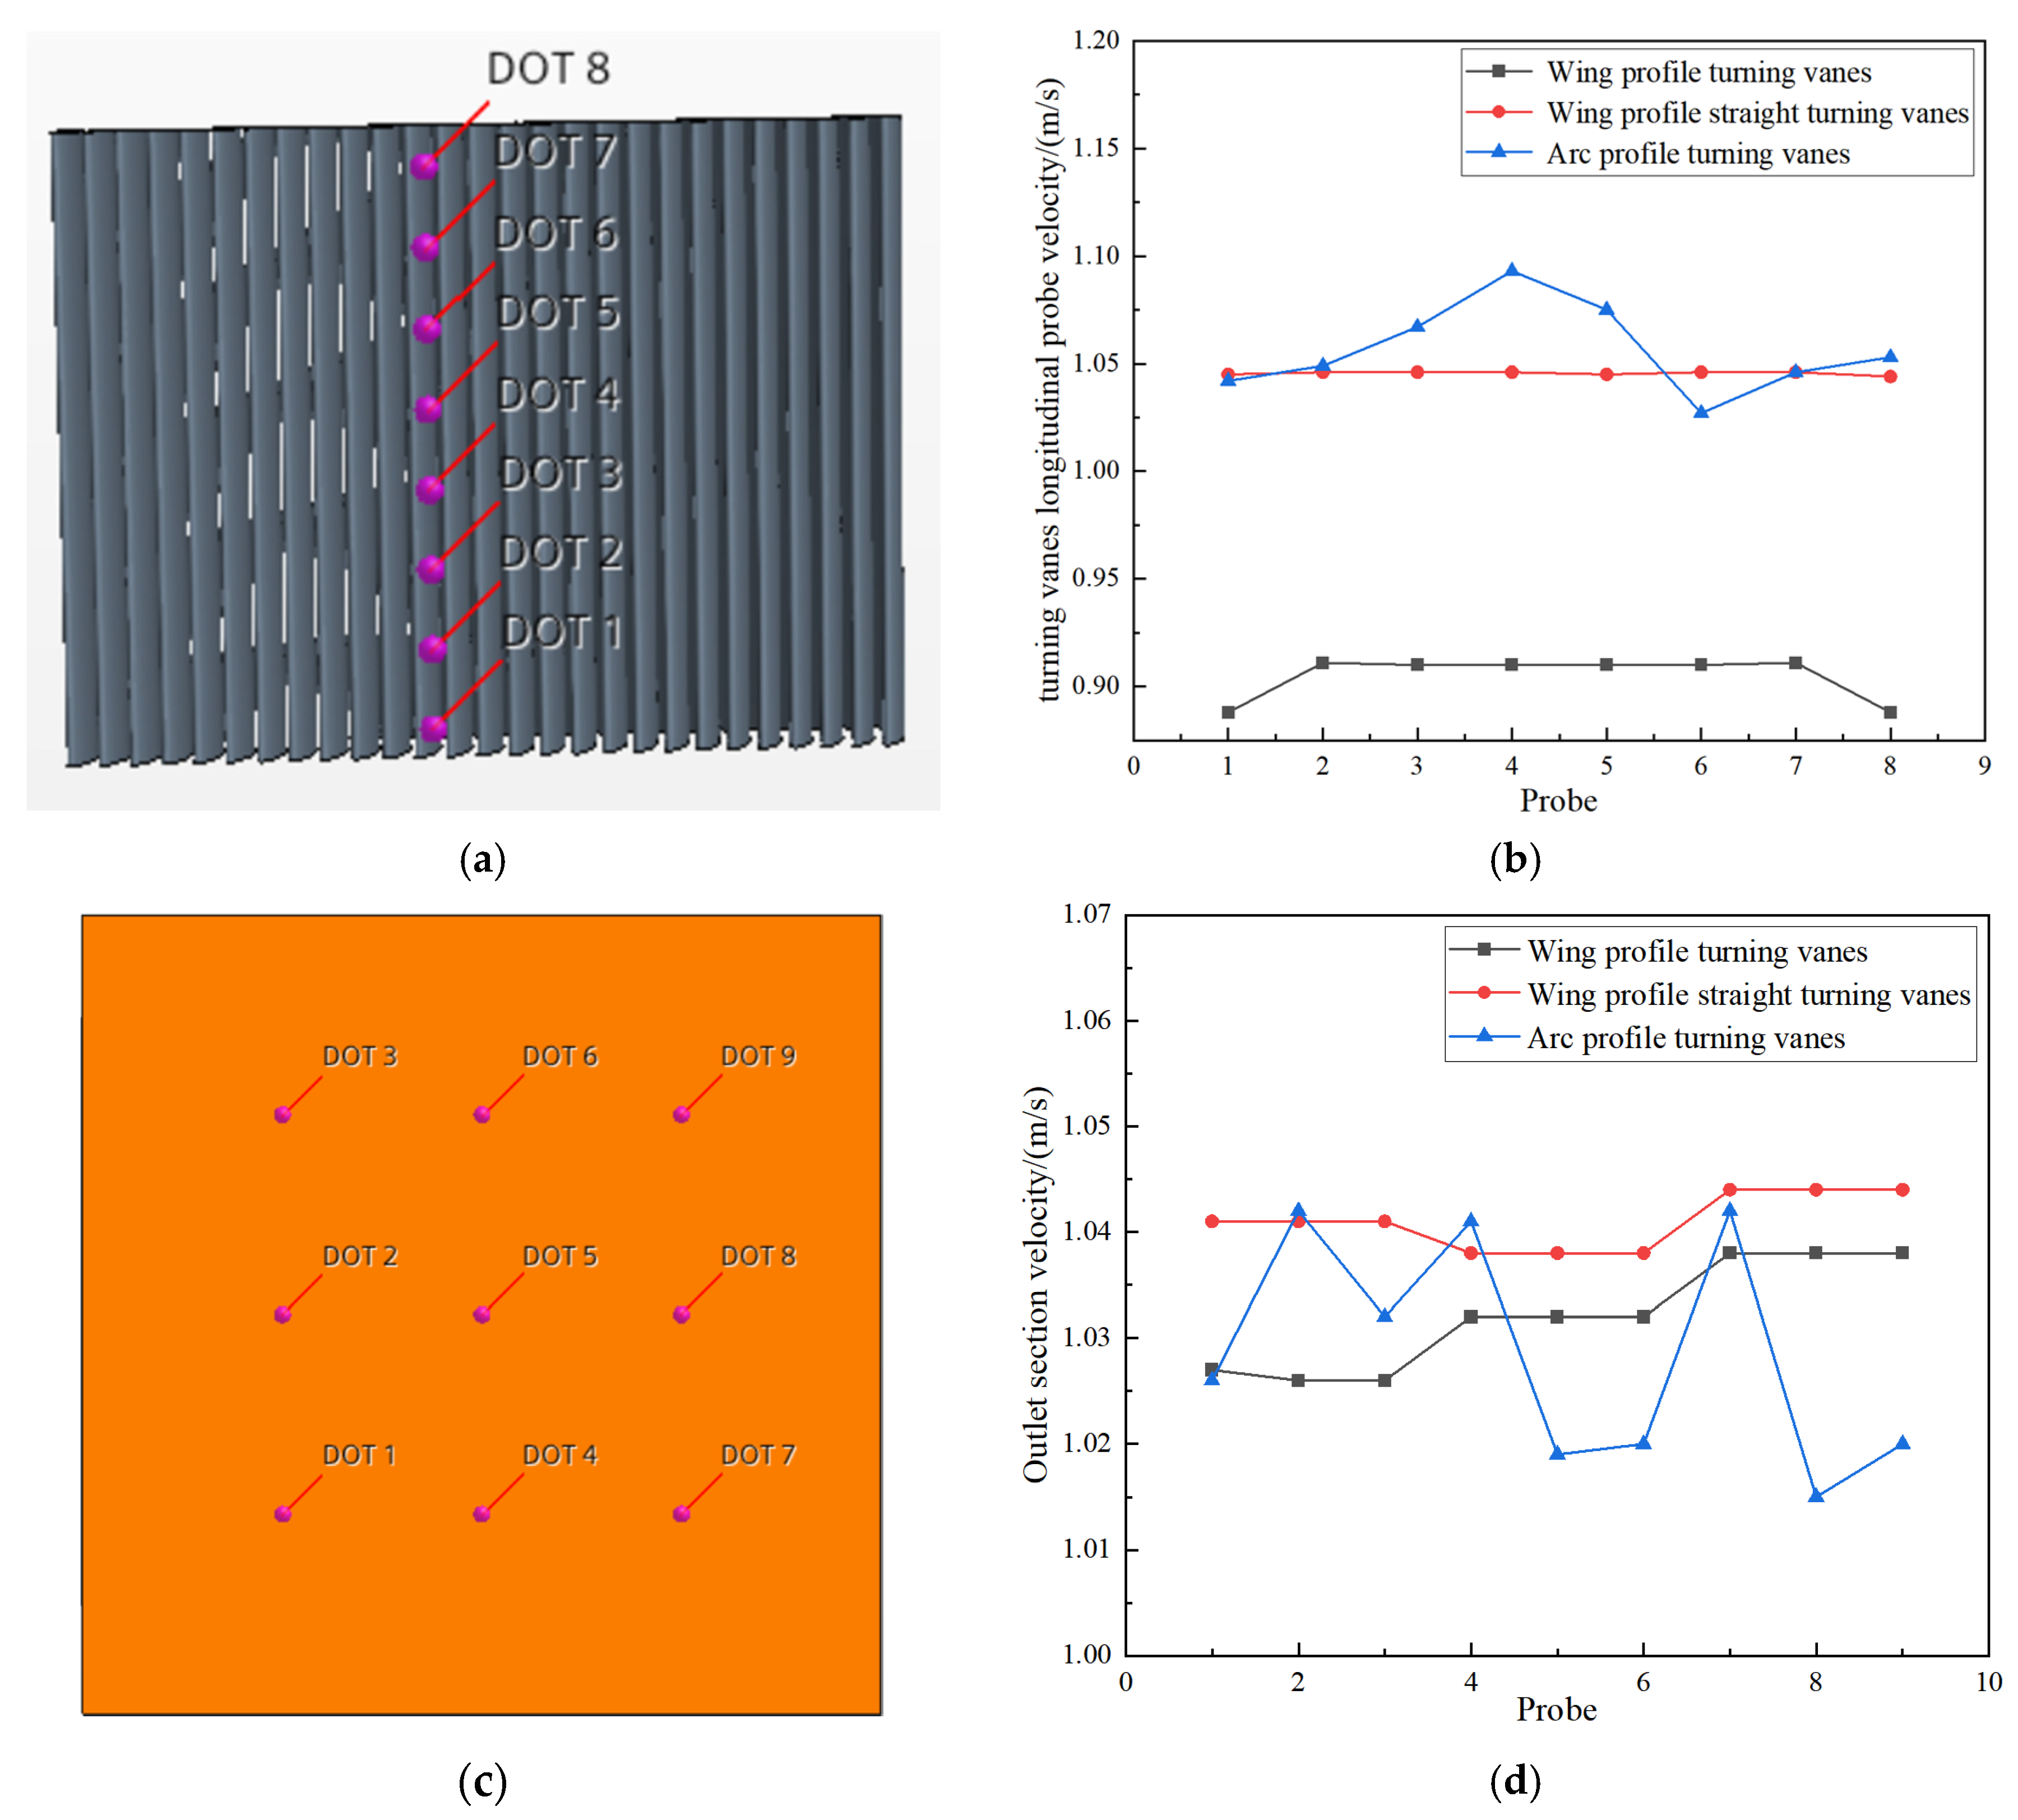
3.1. Effect of Turning Vanes Shapes

In order to exclude the influence of the blade shape of the flow-guiding plate, three main shape types of the turning vane are selected: (i) arc profile; (ii) wing profile; (iii) wing-straight profile, as is shown in Figure 4. The flow-guiding vanes are arranged diagonally at the turning corners in the CWC, allowing a total of 27 turning vanes straight located at the corner with the uniformed interval.
Figure 5 shows the velocity scalar field characteristics of the outlet surface after flowing through the turning vanes and the velocity distribution along the observation section with three types of turning vanes. The cross-sectional flow velocity of the turning vane was measured at the outlet section located at 13 m below the upper edge of the corner. It can be seen from the scalar results that after locating the turning vanes at the corner, the flow field performed with good uniformity of the velocity at the outlet section. By comparing the outlet velocity field for the three shapes of the turning vanes, it can be found that the outlet velocity of the cross-section at the turning corner in the CWC has the lowest flow uniformity when the guiding vanes are of a circular-arc profile shape, the velocity changed greatly at the flow–plate contact surface and the excessive velocity occurred at the edges of each turning vane. In the scalar vision, the large flow velocity can still be observed at the concave corner of the CWC due to the centrifugal force effect of the running flow. The wing profile turning vane cut down the velocity at the concave side to nearly 0 m/s but made the velocity slightly increased at the convex side, thus performing an inhomogeneous velocity field along the diagonal line with an increasing trend from the concave to convex side. Compared with the above two shapes of the turning vanes (i) and (ii), the addition of the straight edges in (iii), wing profile straight turning vanes, could help to improve the generating flow field quality with very good velocity uniformity for this proposed CWC, as is shown in Figure 5c.
In order to further compare the influence of the three shapes of turning vanes on the uniformity of the water flow, several monitoring points were selected and arranged in the longitudinal direction and outlet of the turning vanes to evaluate the velocity uniformity of the CWC, as shown in Figure 6a,c, respectively. In Figure 6a, the probes are arranged vertically at the edge of the turning vanes at the center of the CWC corner, with eight probes set at the cross-section. In Figure 6c, nine probes are evenly arranged at the outlet section of the turning vanes, which are located at 13 m below the turning corner upper-edge. The presented data of the flow velocity at each point were obtained after the transition stage with the stabilized flow field; the velocity of the water flow at the relative marked points with three different types of turning vanes were drawn in Figure 6. The comparison results at the longitudinal probes of the turning vanes can help to understand the flow velocities for different depths in the flow field after guiding the flow by turning vanes, while the arrangement of the outlet probes can further evaluate the velocity uniformity under the deflector impacts. By comparing the flow velocity uniformity at each marked point, the velocity uniformity of the turning area with the arc profile type vane is much lower than that of the wing profile types for both the longitudinal flow line (Figure 6b) and the outlet of the turning vane (Figure 6d), allowing sharp points of the flow velocity value to occur at different water depths within the same cross-section. The wing profile turning vanes can make the water flow field more stable with little velocity variation at most of the monitoring points. Meanwhile, the wing profile with a straight edge of the turning vane had a larger flow velocity than that of the wing profile type only, and it also shows better flow velocity uniformity than that of the wing profile. Therefore, a comprehensive result can be concluded that the straight-edged wing profile turning vane can better improve the velocity uniformity of the water flow and make the flow field more stable, especially at the corners of the CWC device.

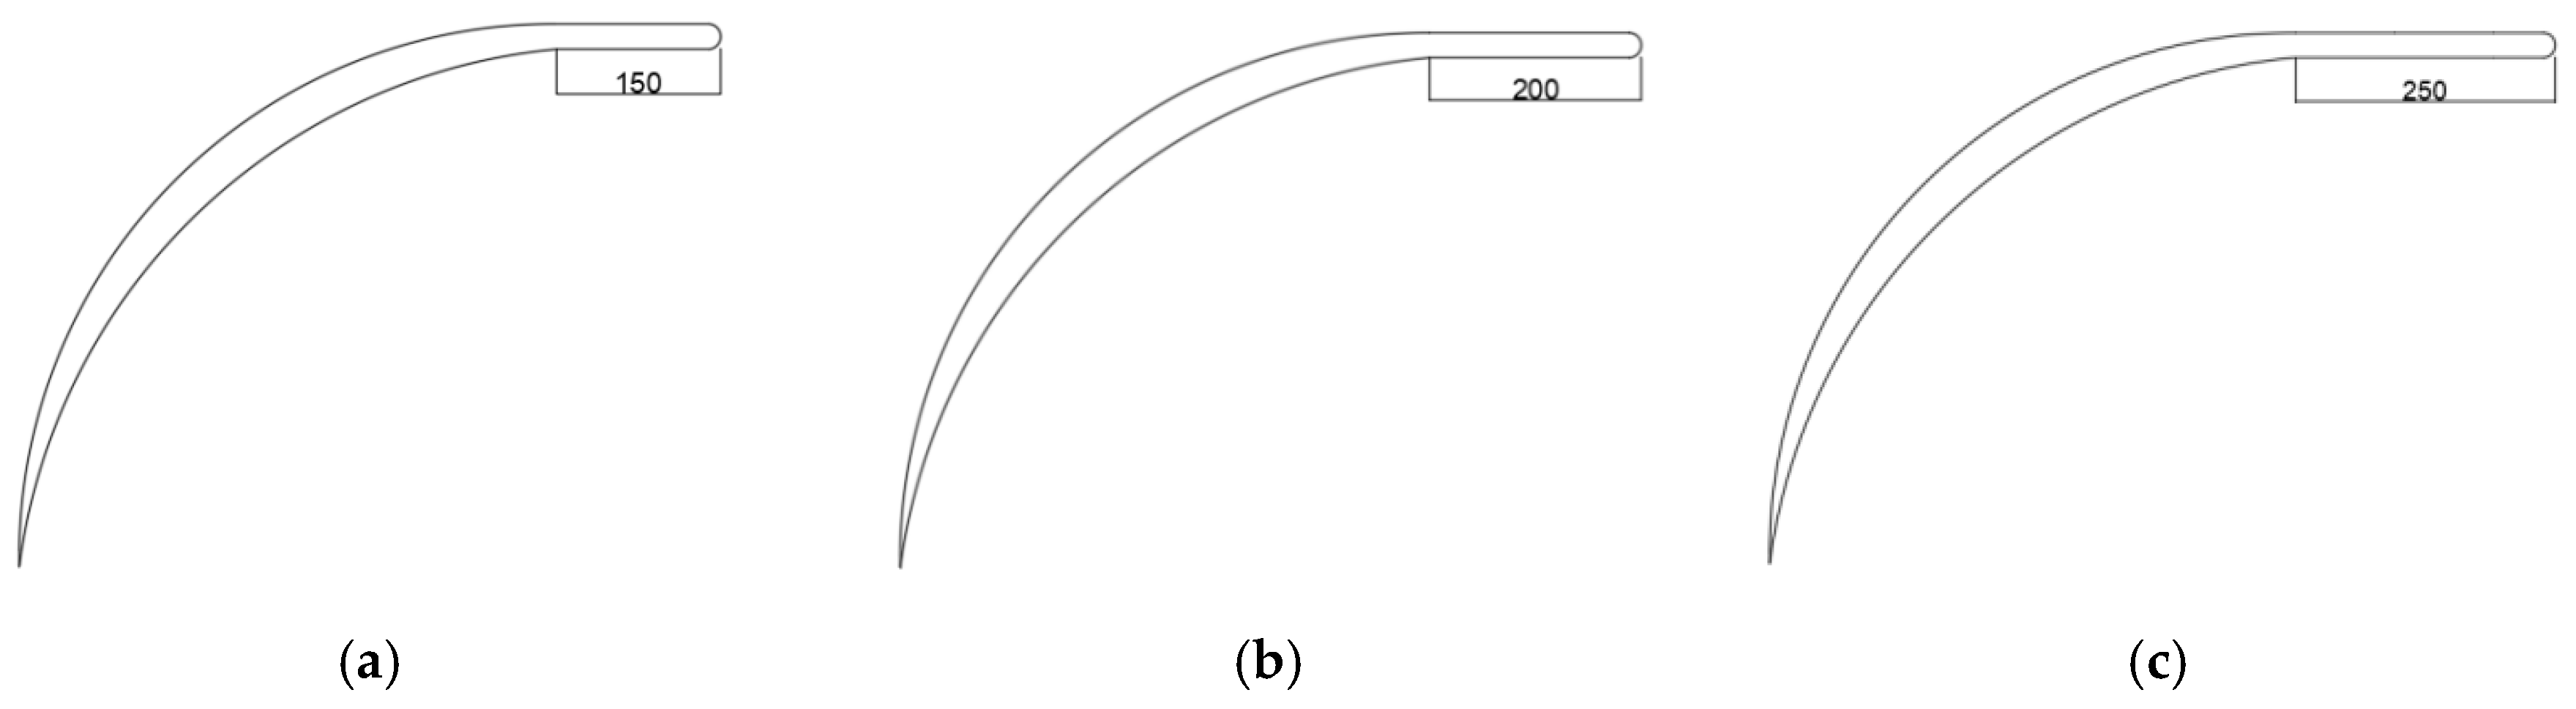
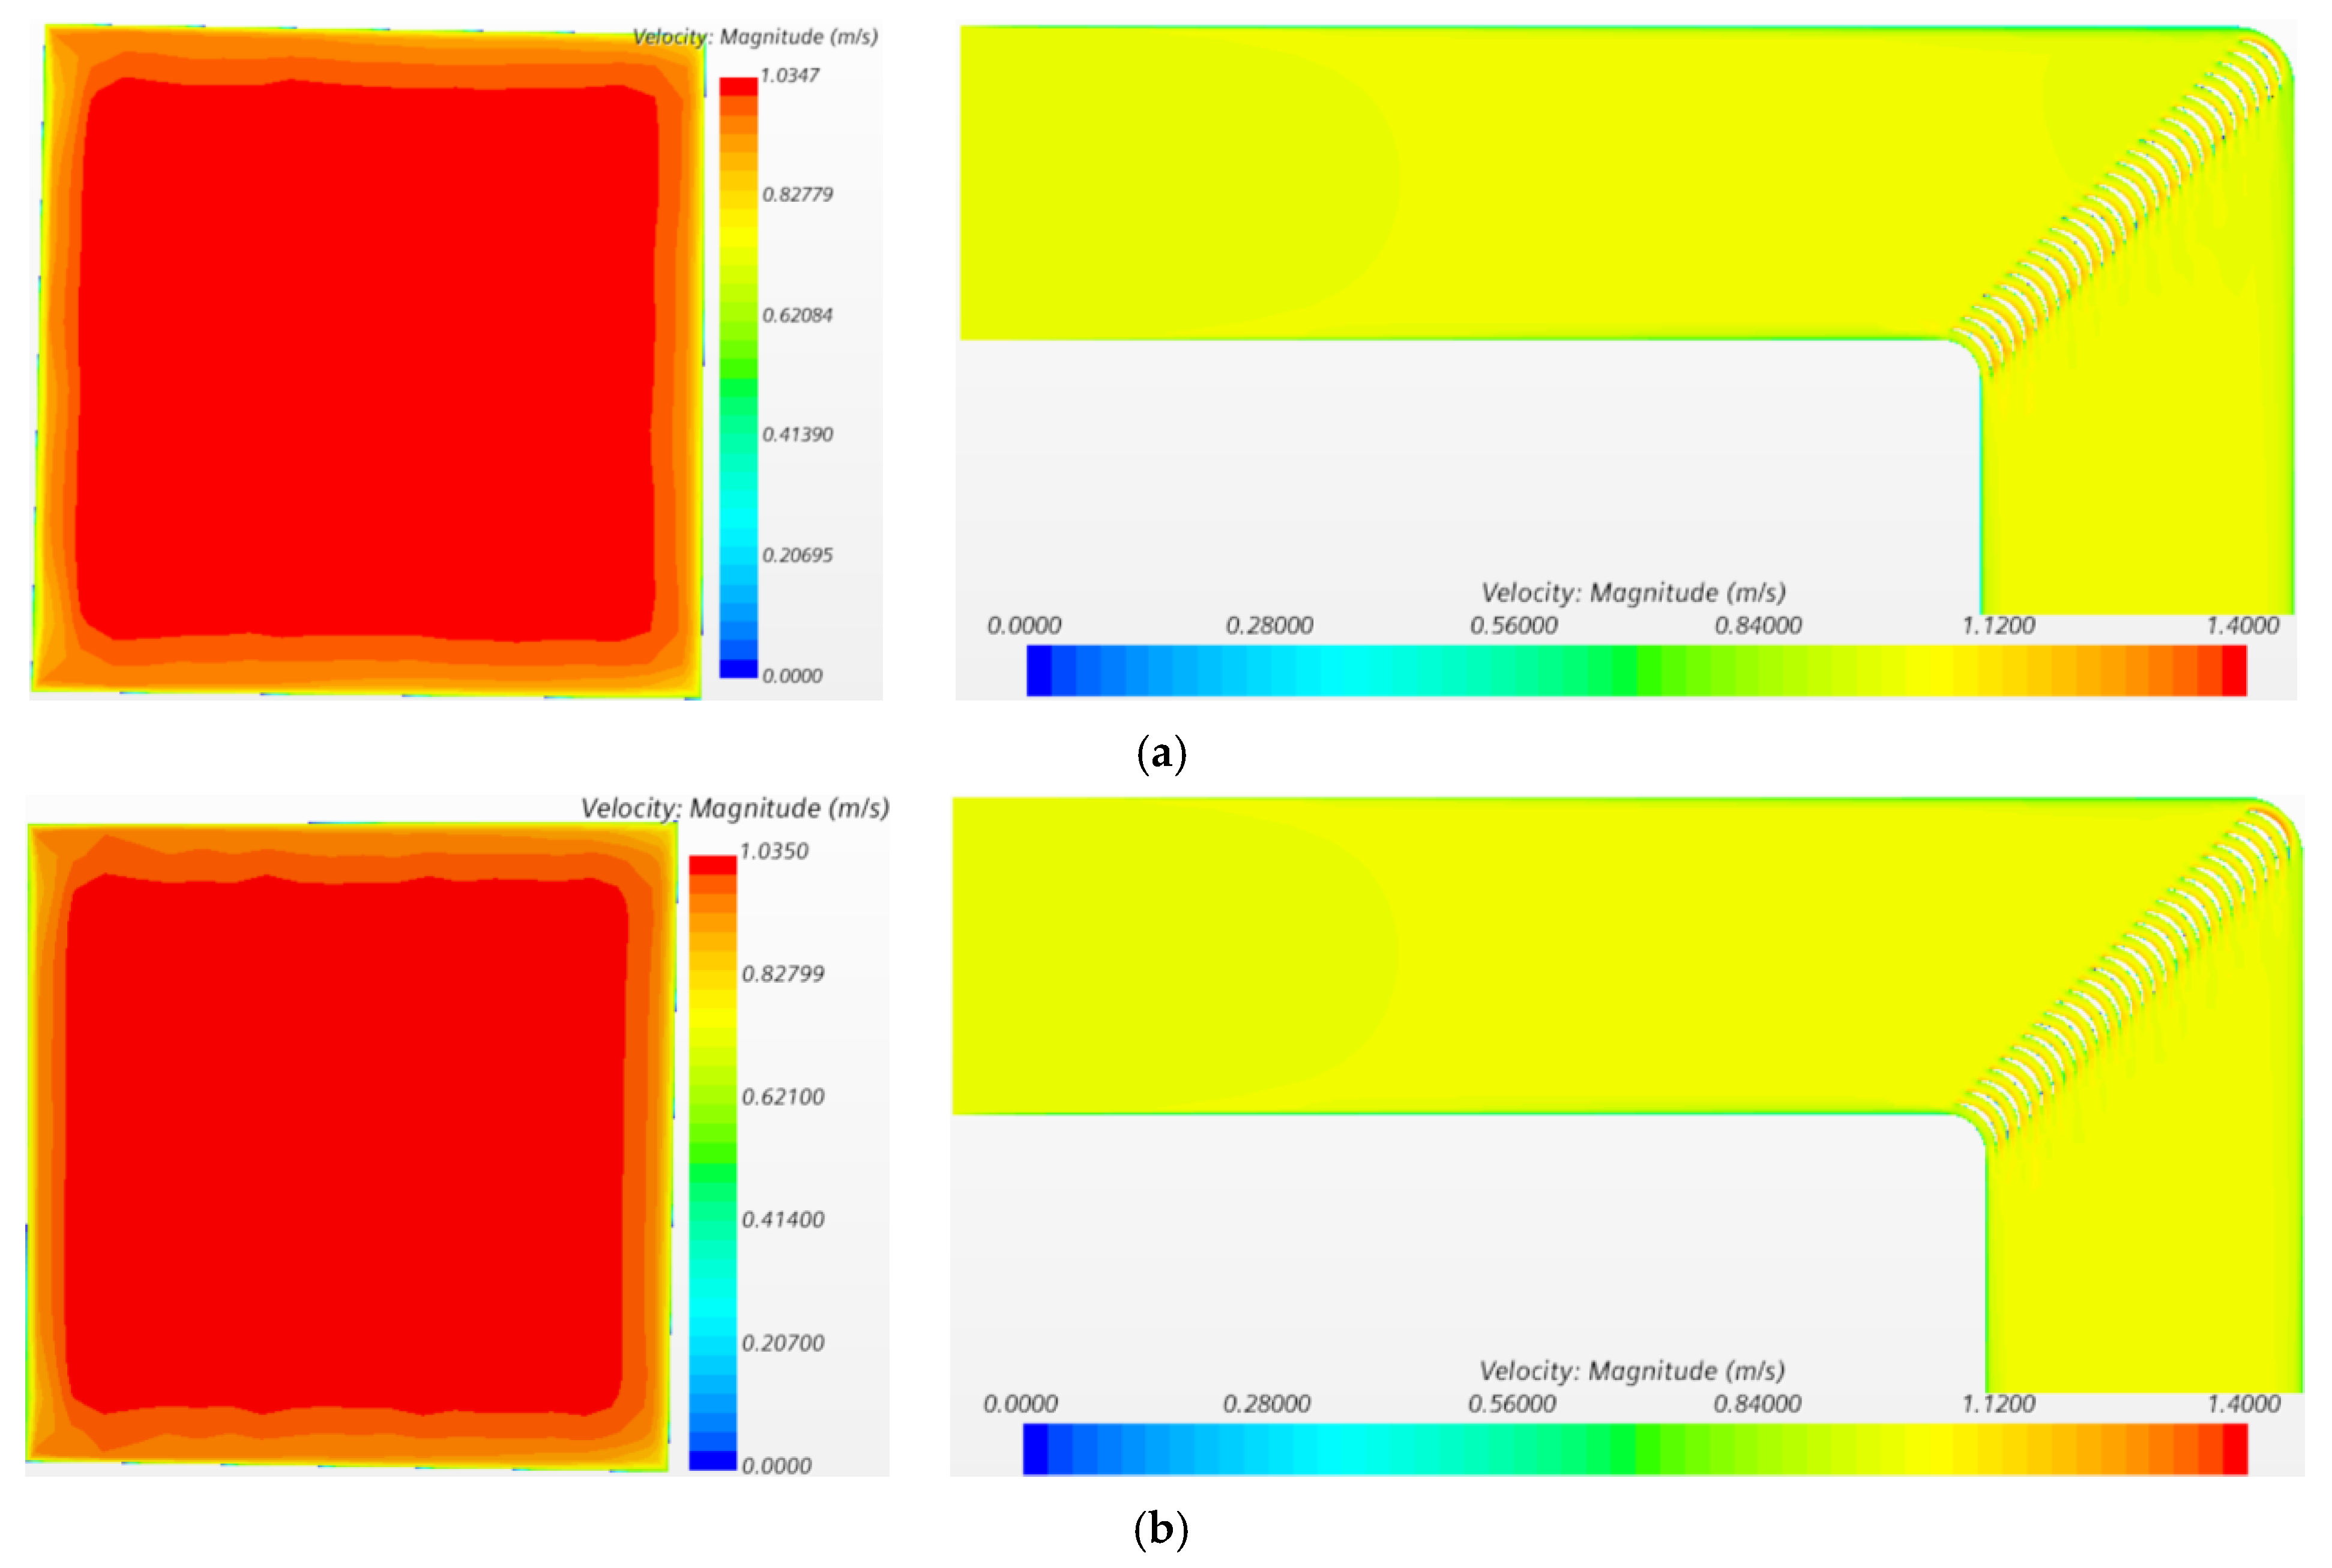
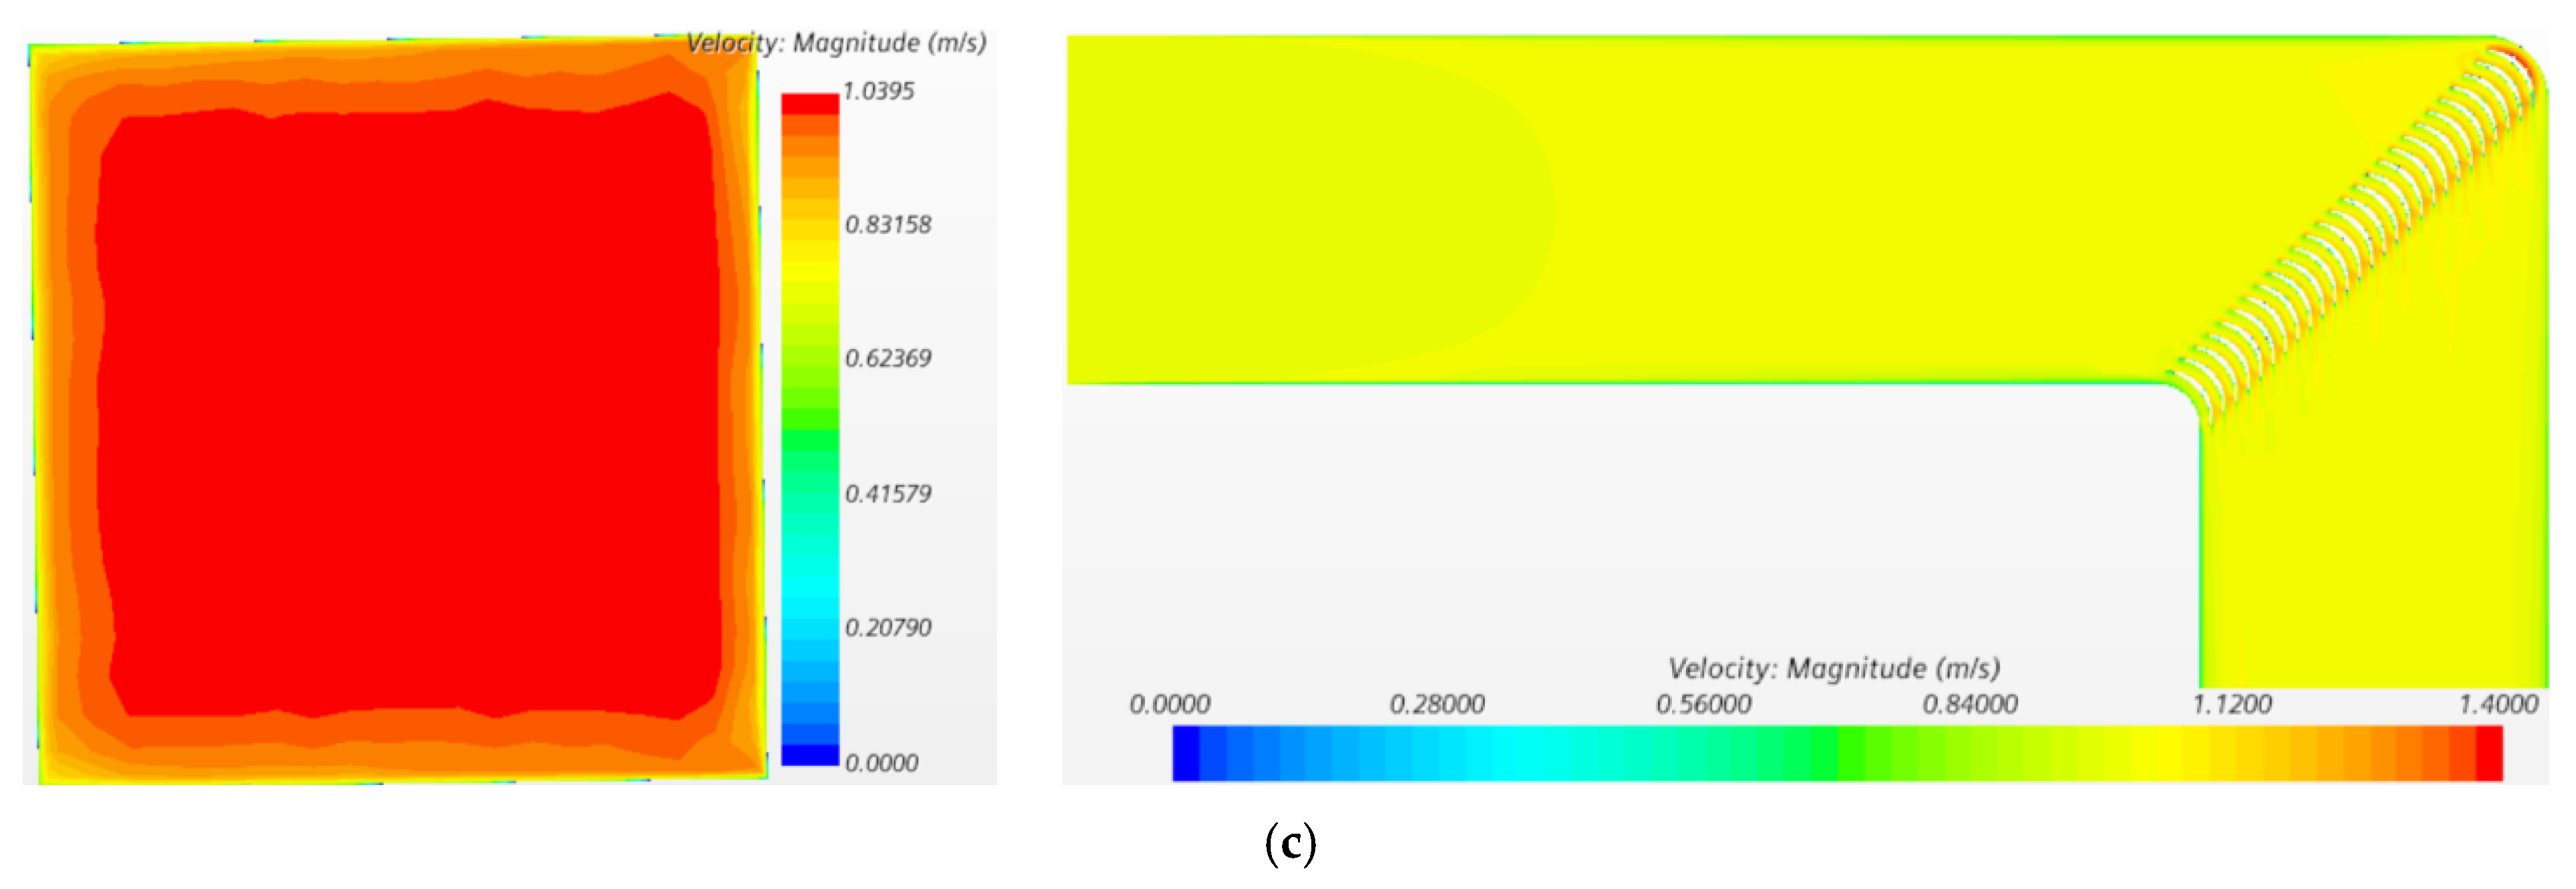
3.2. Effect of Extension Edge Length of Turning Vane

Based on the above analysis in Section 3.1, the optimal straight-edged wing profile turning vane was chosen in the numerical model for further study of the turning vane geometrical impacts. Due to the sensitivity of the turning vane shape on the flow velocity uniformity of the CWC, it is necessary to consider the influence of the straight edge length on the calculating field of the turning area subjected to current. Three selected wing straight-edged profile deflectors with straight side lengths of 150, 200, and 250 mm were simulated in the CWC model; the sketch of the turning vane is presented in Figure 7.
Figure 8 shows the velocity scalar field of the wing straight-side profile turning vanes with different straight-side lengths for the stable flow field. From the velocity scalar view, it can be seen that the turning vanes with a straight edge length of 200 mm achieved very good flow velocity uniformity at the area close to each flow guiding vane. It can also be seen that there is apparently an increase in the flow velocity occurring at the second half part close to each guiding vane for the case of d = 150 mm and d = 250 mm. Due to the straight-edged type that has been chosen for the optimal turning vane, the effect of the vane straight edge length could not be evaluated and observed in such a uniform flow field, especially for the flow velocity at the outlet cross-section.
In order to investigate the effect of the edge length of the wing straight-sided profile turning vanes on the uniformity of the water flow, nine monitoring points at the exit corner of the CWC were set and are presented in Figure 9a. The difference of the outlet section velocity with three straight edge lengths is shown in Figure 9b. It can be observed from Figure 9b that the turning vane with a straight-edge length of 200 mm resulted in a very uniform flow field, especially in the vertical direction and more stable than that of the case with d = 150 mm and d = 250 mm for the straight-edged length. The relative difference of the values of the flow velocity at each monitoring point is not significant thus the flow field of the turning section of the CWC is not sensitively affected by the turning vane straight-edged length, which could also be observed in Figure 8. Therefore, it can be concluded that an appropriate length of the straight-edged turning vane (d = 200 mm for this proposed type of vane) can further improve the water flow uniformity to pursue high-quality flow fields with the optimal turning vane type for the CWC device.

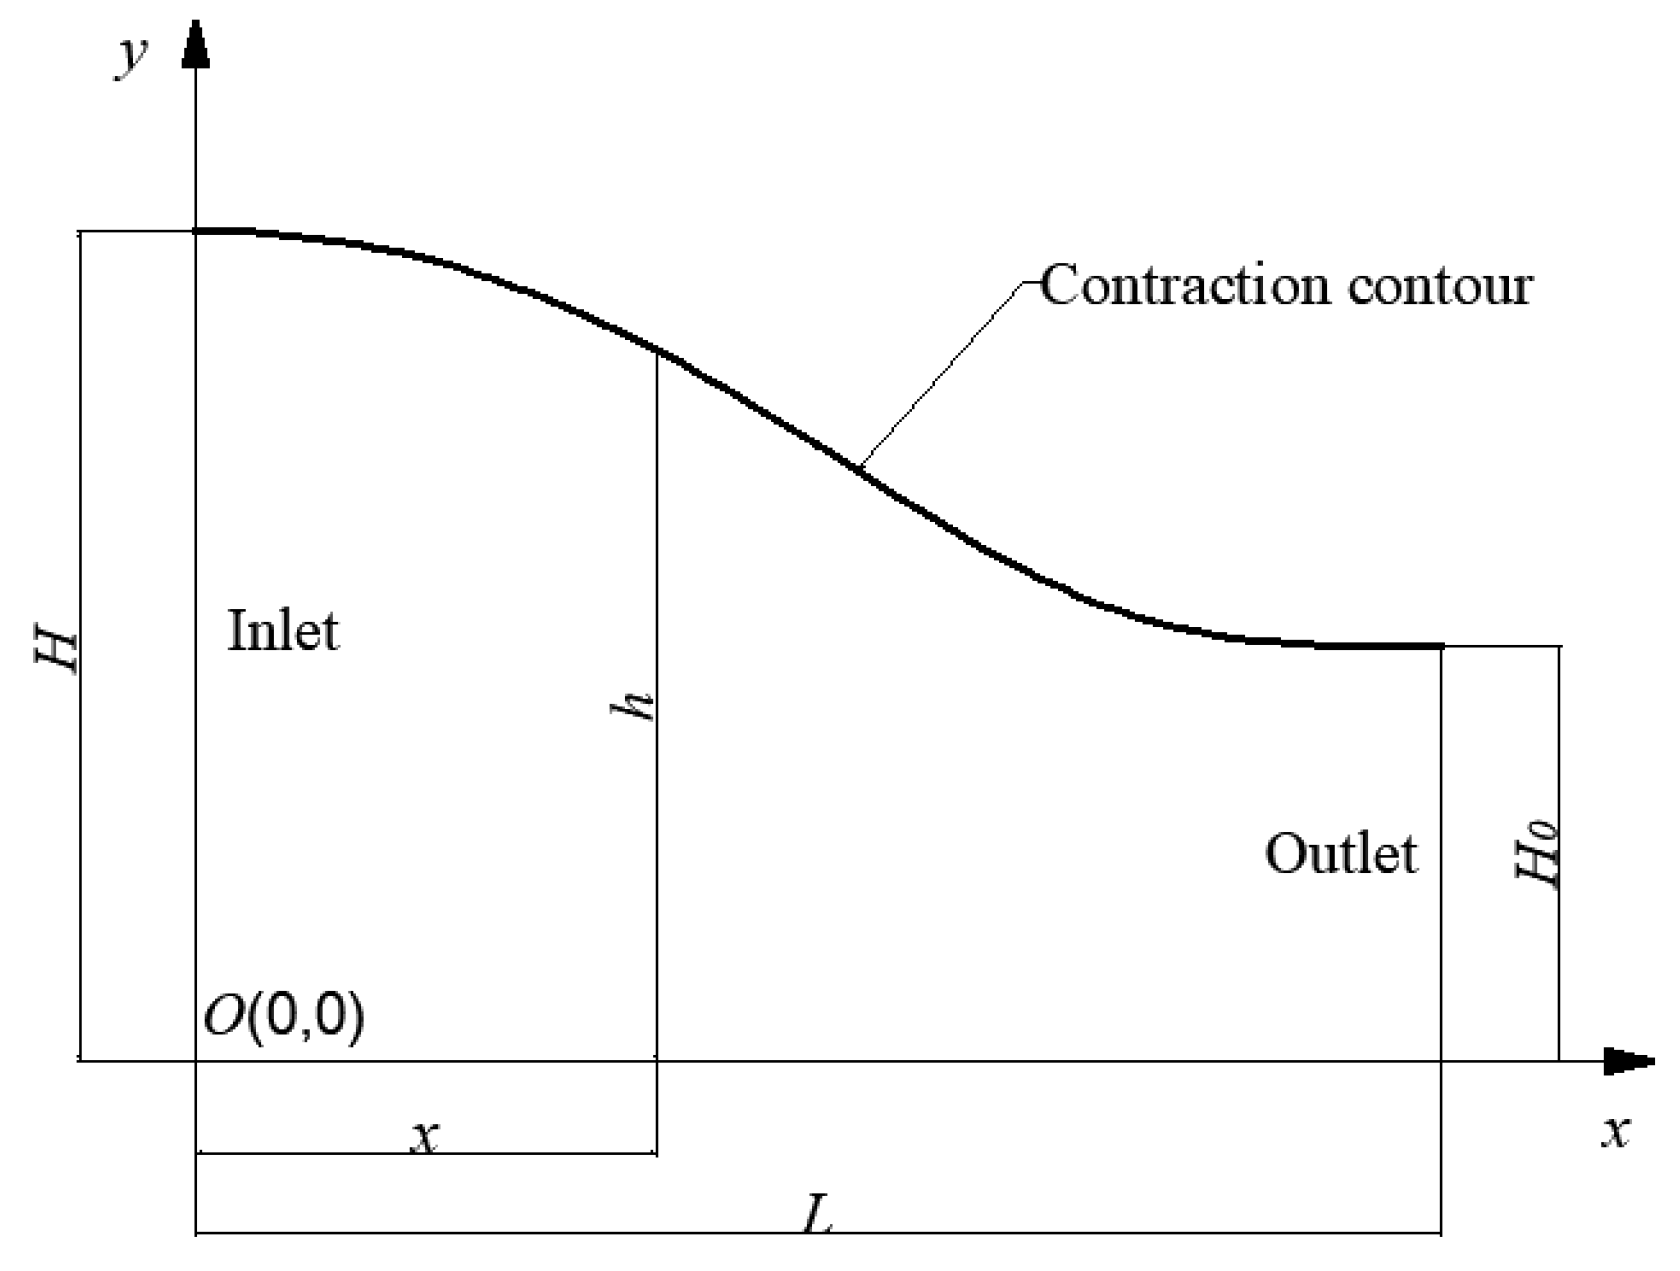
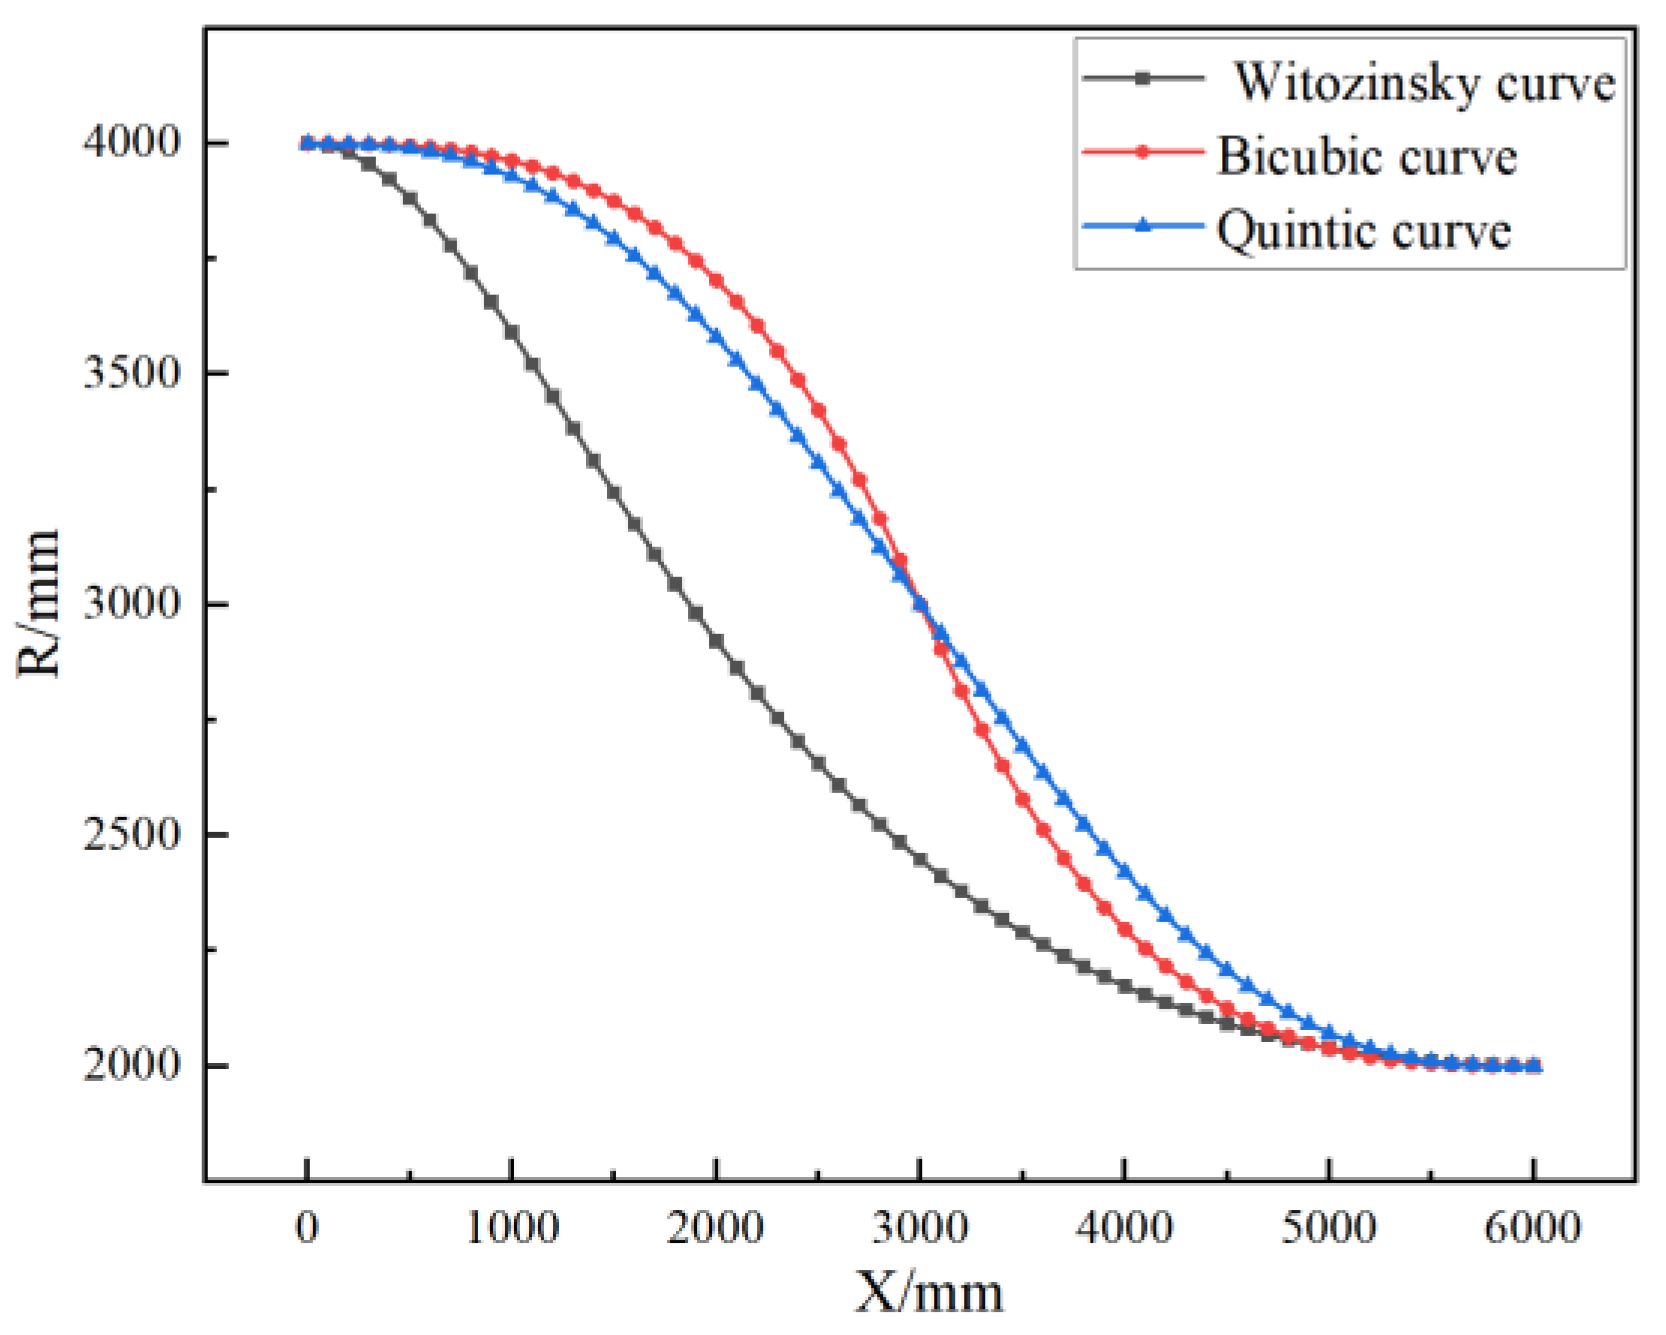
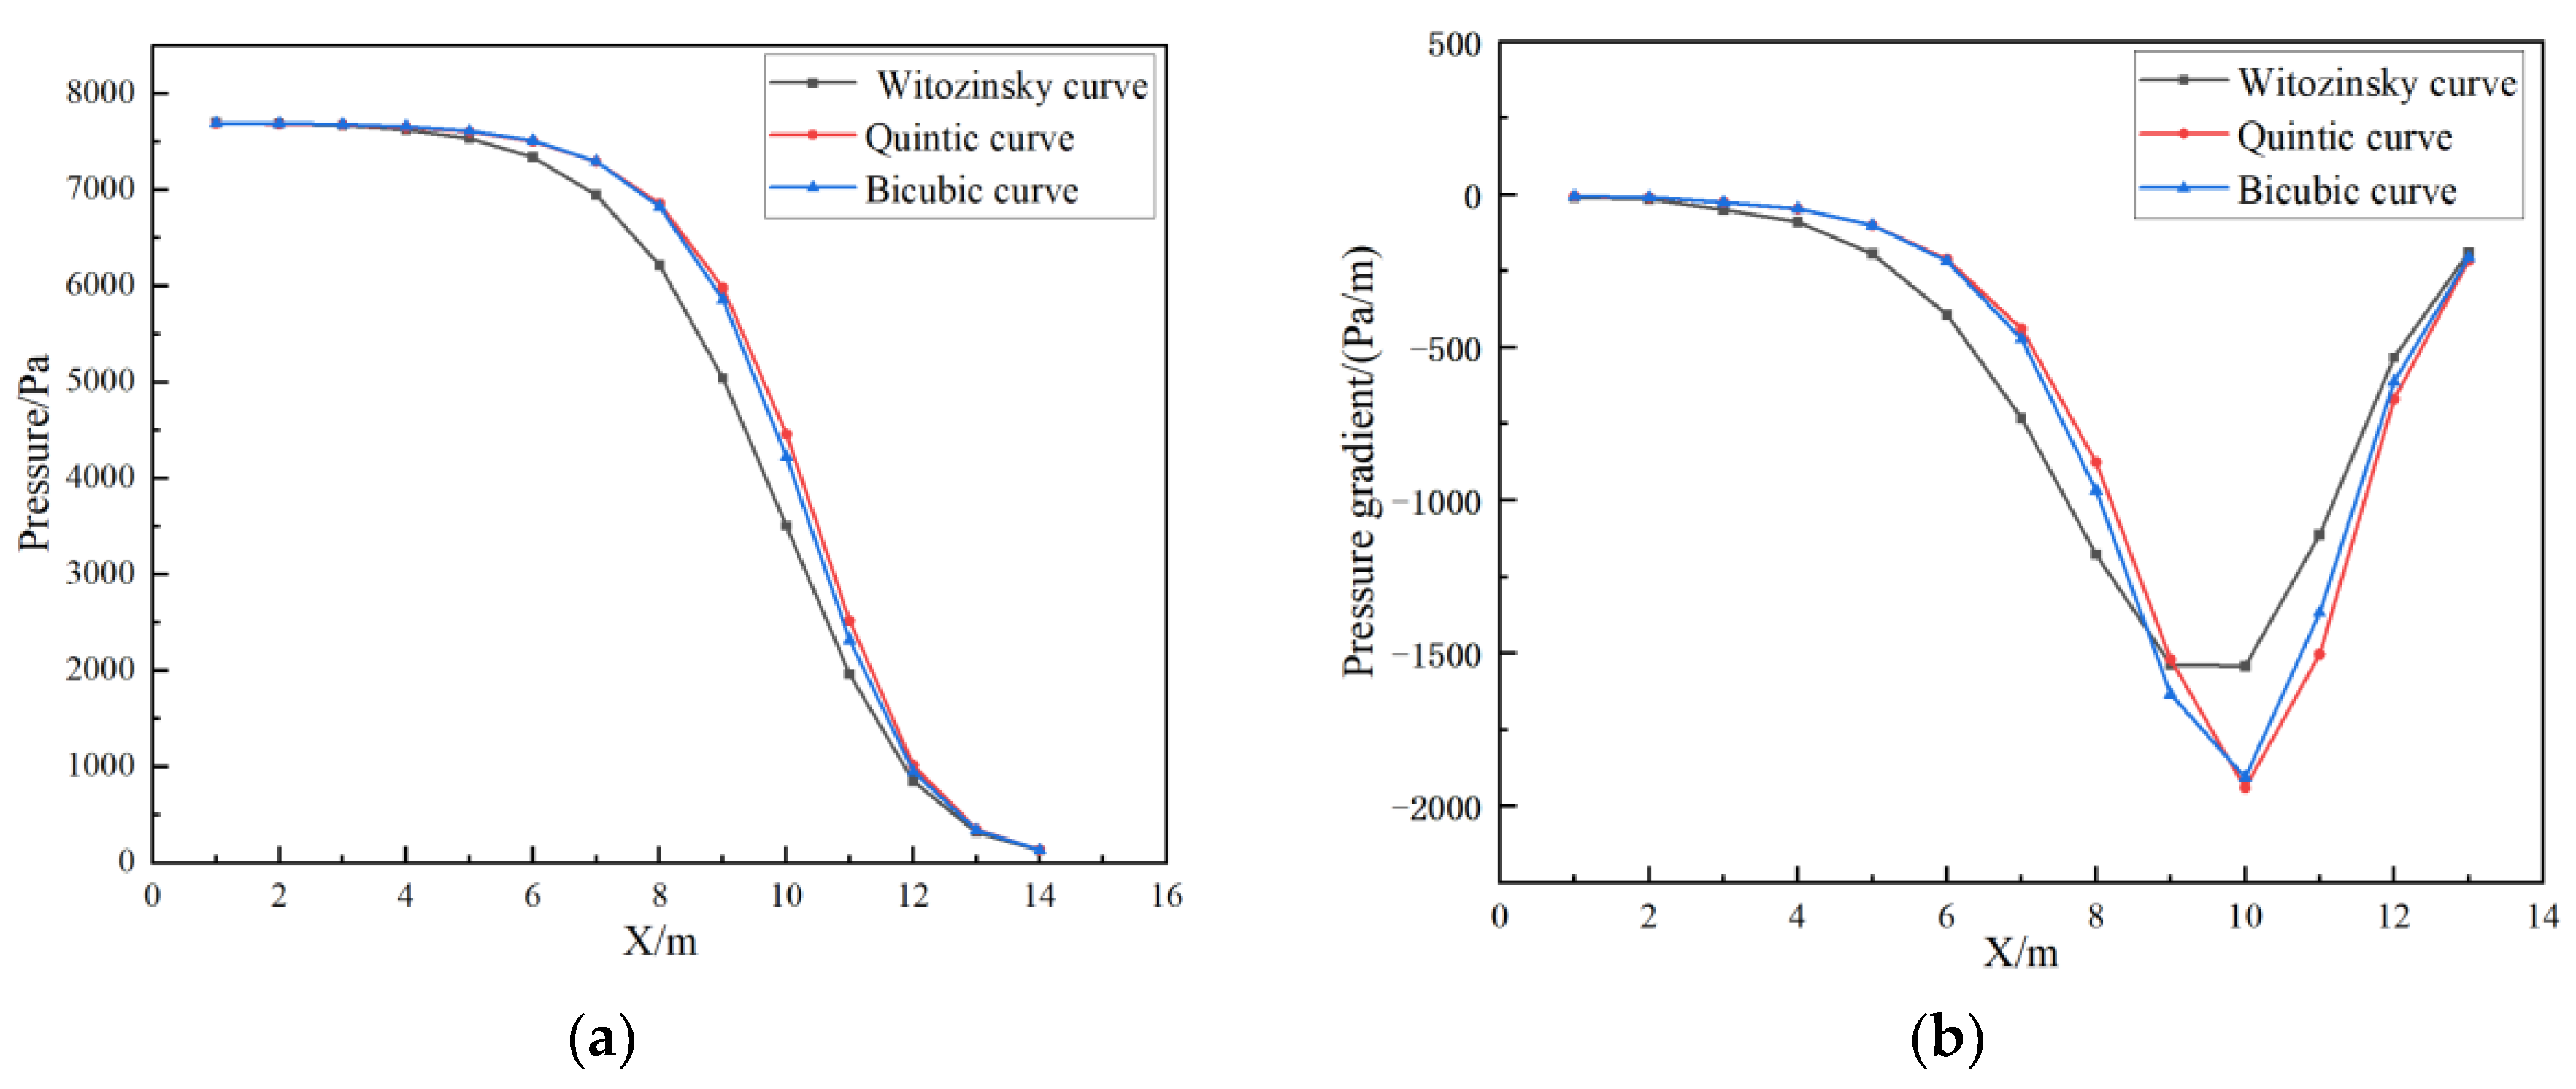
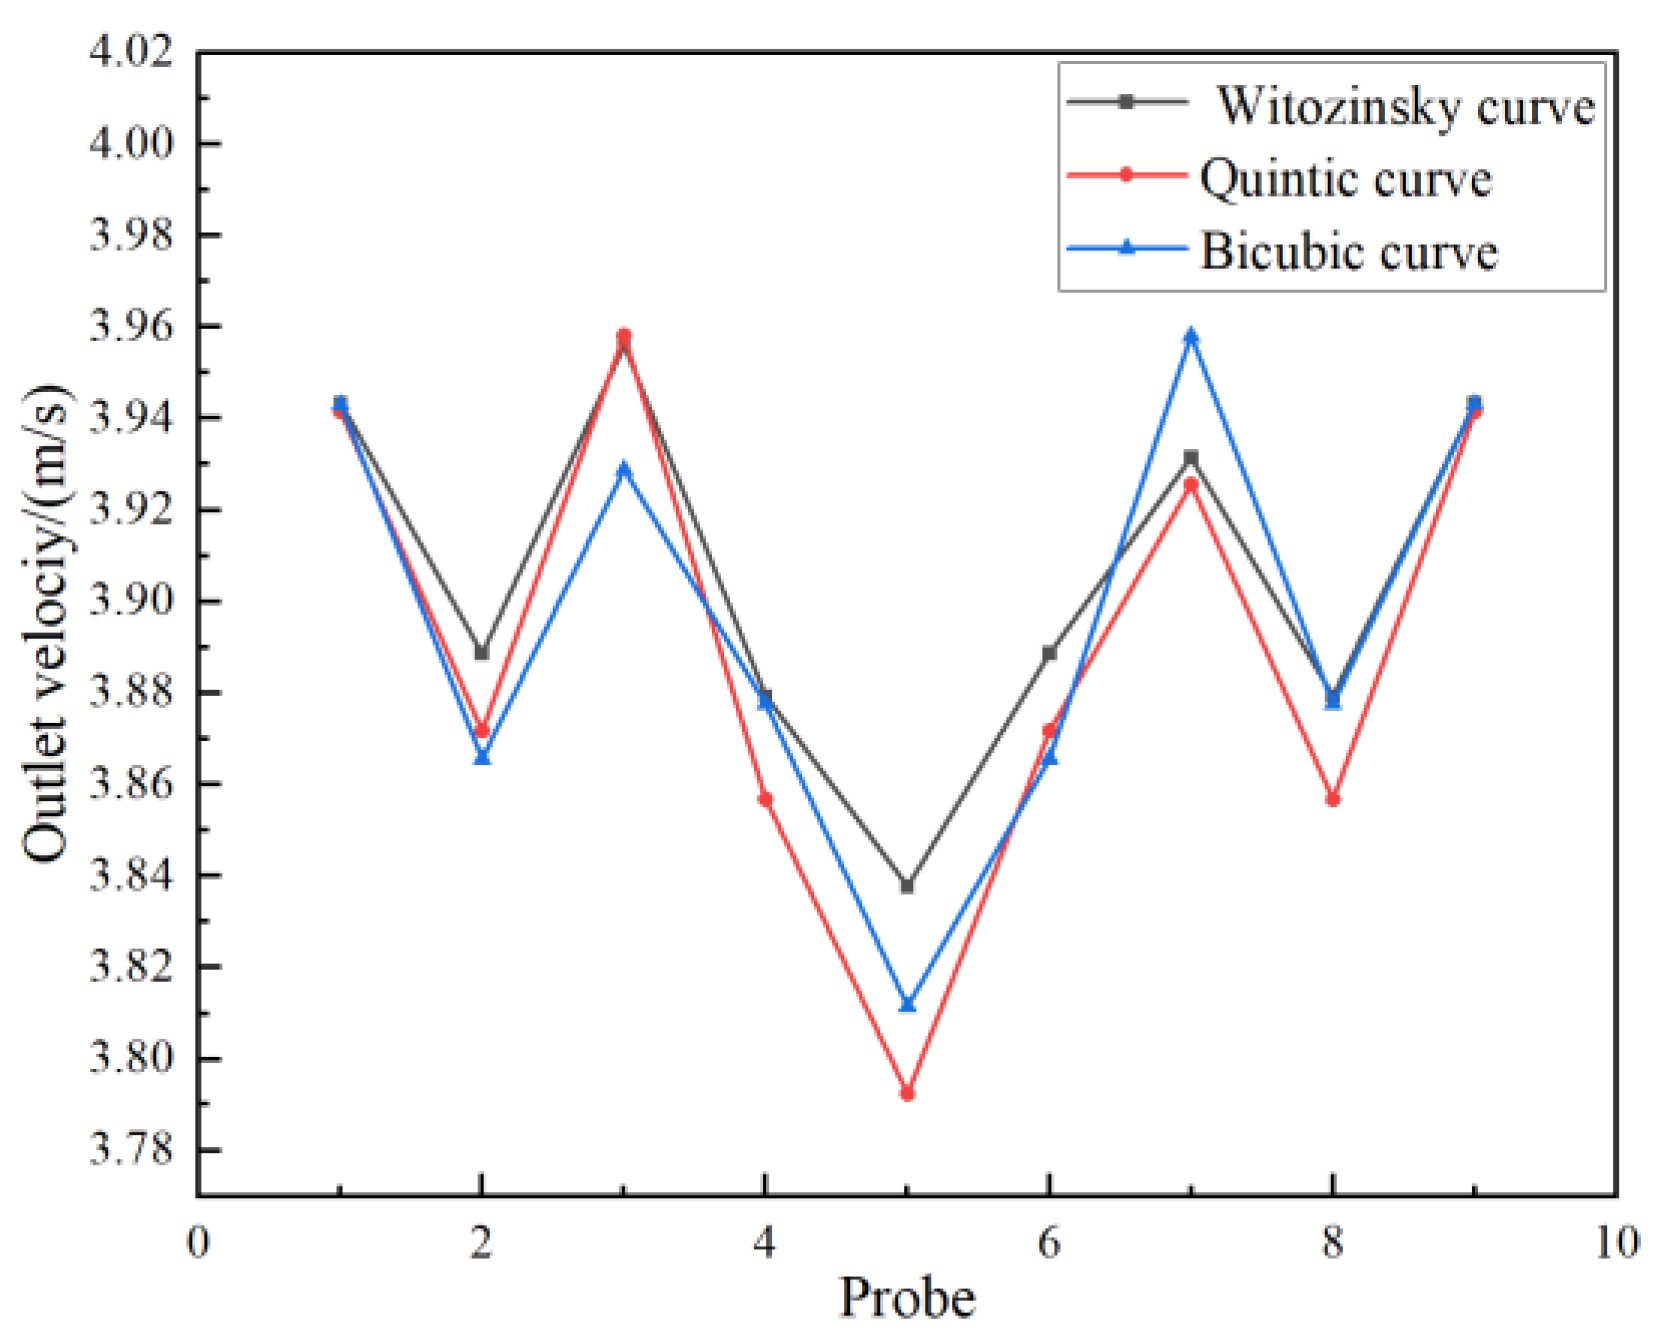
3.3. Effect of Contraction Transition Curve

The contraction section is one of the most important parts of the circulating water channel, which was first applied and used in wind tunnels. The main function of the contraction section in the CWC flume is to uniformly accelerate the incoming flow thus it is usually arranged at the front of the testing area. The velocity of the water flow increased uniformly along the wall curve of the contraction part, then the required flow rate in the test zone could be achieved after flowing through the contraction section. The generated flow performance of the contraction section in the CWC flume is mainly affected by the contraction transition curve and the geometry of the contraction part. In this section, the transition curve and the contraction section length will be focused on for optimization; the two main factors of the degree of pressure gradient relaxation and the uniformity of water flow at the outlet section are used to evaluate the contraction flow quality.
A proper contraction transition curve can improve the uniformity of water flow and have a great impact on the quality of the flow field in the test area. In this paper, three different contraction transition curves are selected: Witozinsky transition curve, quintic transition curve, and bicubic transition curve.
Corresponding to Figure 10, three contraction transition curves, including the Witozinsky curve [16], Quantic transition curve [17], and Bicubic transition curve [18], are given in order as follows:
y = H { 1 [ 1 ( x L ) 2 ] 2 [ 1 + α ( x L ) 2 ] 3 }
y = H [ 10 ( x L ) 3 15 ( x / L ) 4 + 6 ( x L ) 5 ]
y = { H ( x / L ) 3 ( x f / L ) 2   x x f H [ 1 ( 1 x / L ) 3 ( 1 x f / L ) 2 ]   x > x f  
where H is the height of contraction transition curve, L is the horizontal length of the transition curve, α is a constant coefficient that is equal to 1/3, and xf is the horizontal distance of the inflection point, which is taken as 0.5 here. The above three transition curves are drawn in Figure 11.
To compare the effects of the three types of contraction transition curves on the flow field quality of the CWC, shrinking sections with different linear types are used in the simulation by software STAR-CCM+. In the numerical model, the geometry parameters of the contraction section were set as: R1 = 4000 mm, R2 = 2000 mm, L = 6000 mm, C = 4, and the inlet flow velocity was set to v = 1 m/s. Figure 12a,b shows the characteristics of the pressure and pressure gradient of the CWC flow field with different contraction transition curves; the obtained values of the measured points were set on the symmetric central axis of the contraction section. It can be observed that the pressure of the flow in the front of the contraction part varied little with the three type curves, the pressure gradient of the flow at the same area basically remains zero. Then the pressure and the pressure gradient of the water decreased sharply when flowing through the middle part of the contraction section; apparently, the difference of the flow pressure performance can be observed at this stage. For the end part of the contraction section, the pressure decreased slowly whilst the pressure gradient of the flow increased inversely. For this proposed contraction structure of the CWC with these considered three transition curves, it can be found that the generated flow field of the contraction part with Witozinsky transition curve obtained the lowest pressure, allowing less pressure gradient variation of the flow field compared to the other two cases of Quintic and Bicubic curves (see Figure 12b). The variation of the velocity values of the outlet section after the contraction part is also given and shown in Figure 13. Nine points were set and marked at the outlet surface to monitor the flow velocity characteristics; the probes were located at the same position presented in Figure 6 and Figure 9. In Figure 13, it can also be seen that the values of the velocity at the outlet section oscillated shortly by the Witozinsky transition curve, which further verifies the conclusion obtained above, corresponding to the pressure performance with three types of contraction transition curves.
From the obtained results, the amplitude value of the flow velocity caused by the three contraction transition curves differs little, thus it is necessary to evaluate the uniformity of the contraction outlet velocity with different transition curves by involving the contraction transition coefficient Cv; here Cv is relative to the exit velocity at different positions of the contraction section and can be expressed as:
C v = S V ¯
S = 1 n 1 i = 1 n ( V i V ¯ ) 2
where S is the deviation of the exit velocity, V ¯ is the average value of the exit velocity, V i is the velocity of the i-th sampling point, and n is the number of the sampling point.
The calculation results of the contraction transition coefficient with the Witozinsky curve, Quintic curve, and Bicubic curve are shown in Table 3. To evaluate the uniformity of the exit velocity of the contraction section for different transition curves, the smaller Cv represents better uniformity of velocity. From the results of Cv, the contraction section with the Witozinsky curve performed the best and was followed by the Bicubic transition curve and the Quintic transition curve is larger. Therefore, combining both the flow uniformity and the pressure performance, it can be concluded that the contraction section with the Witozinsky transition curve can get a better flow field of this proposed CWC device for the optimal design.

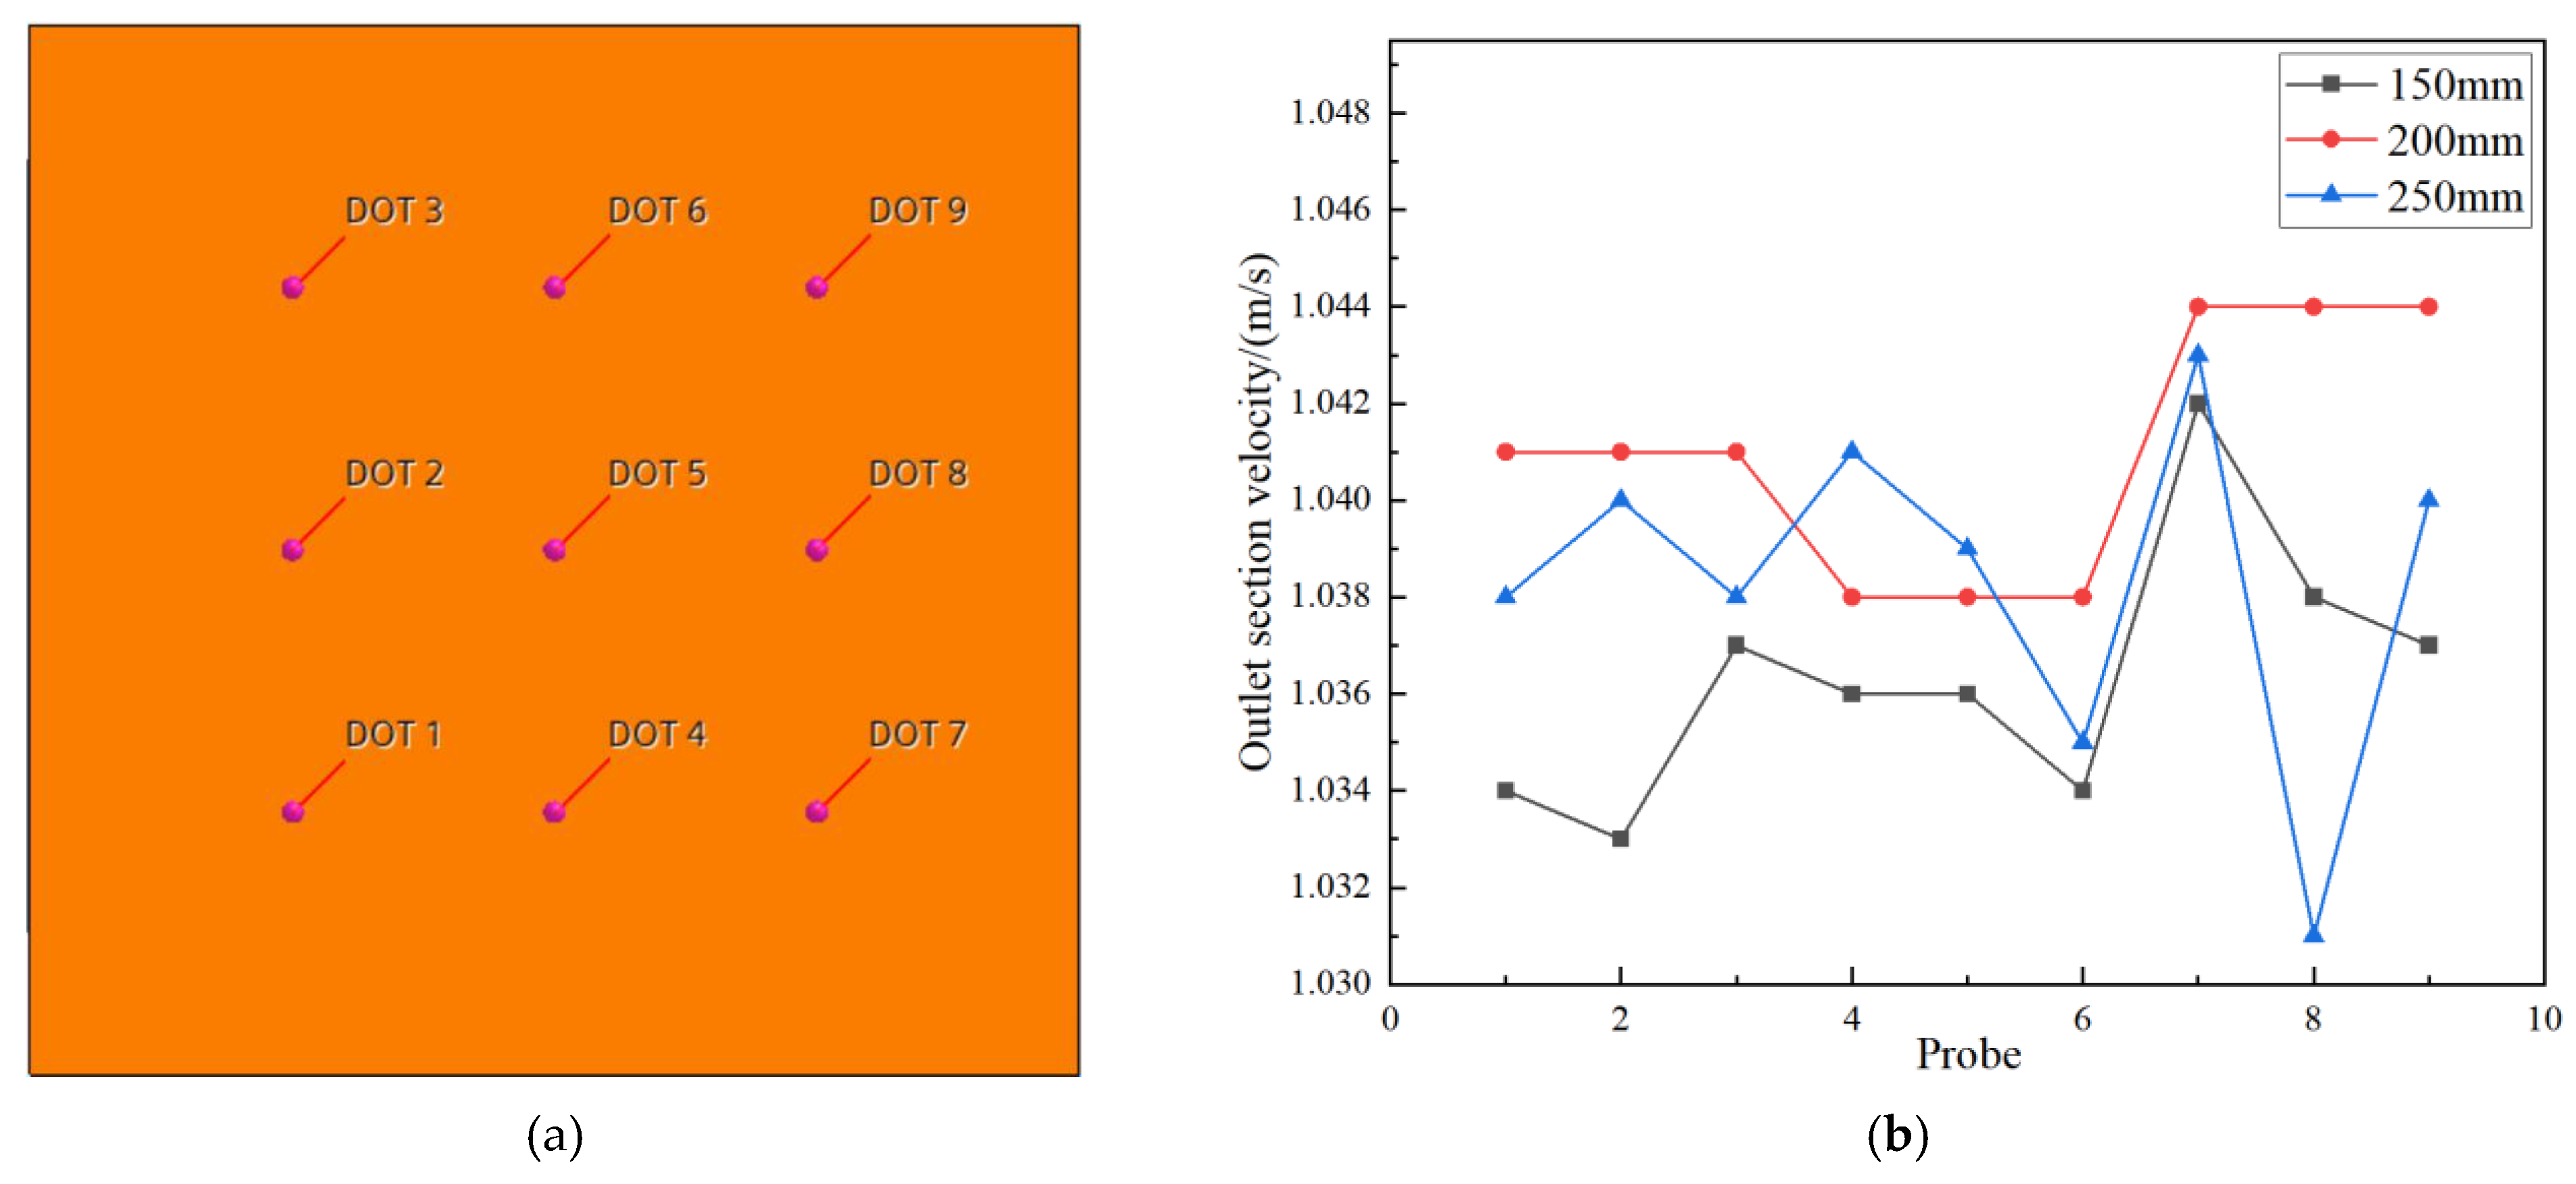
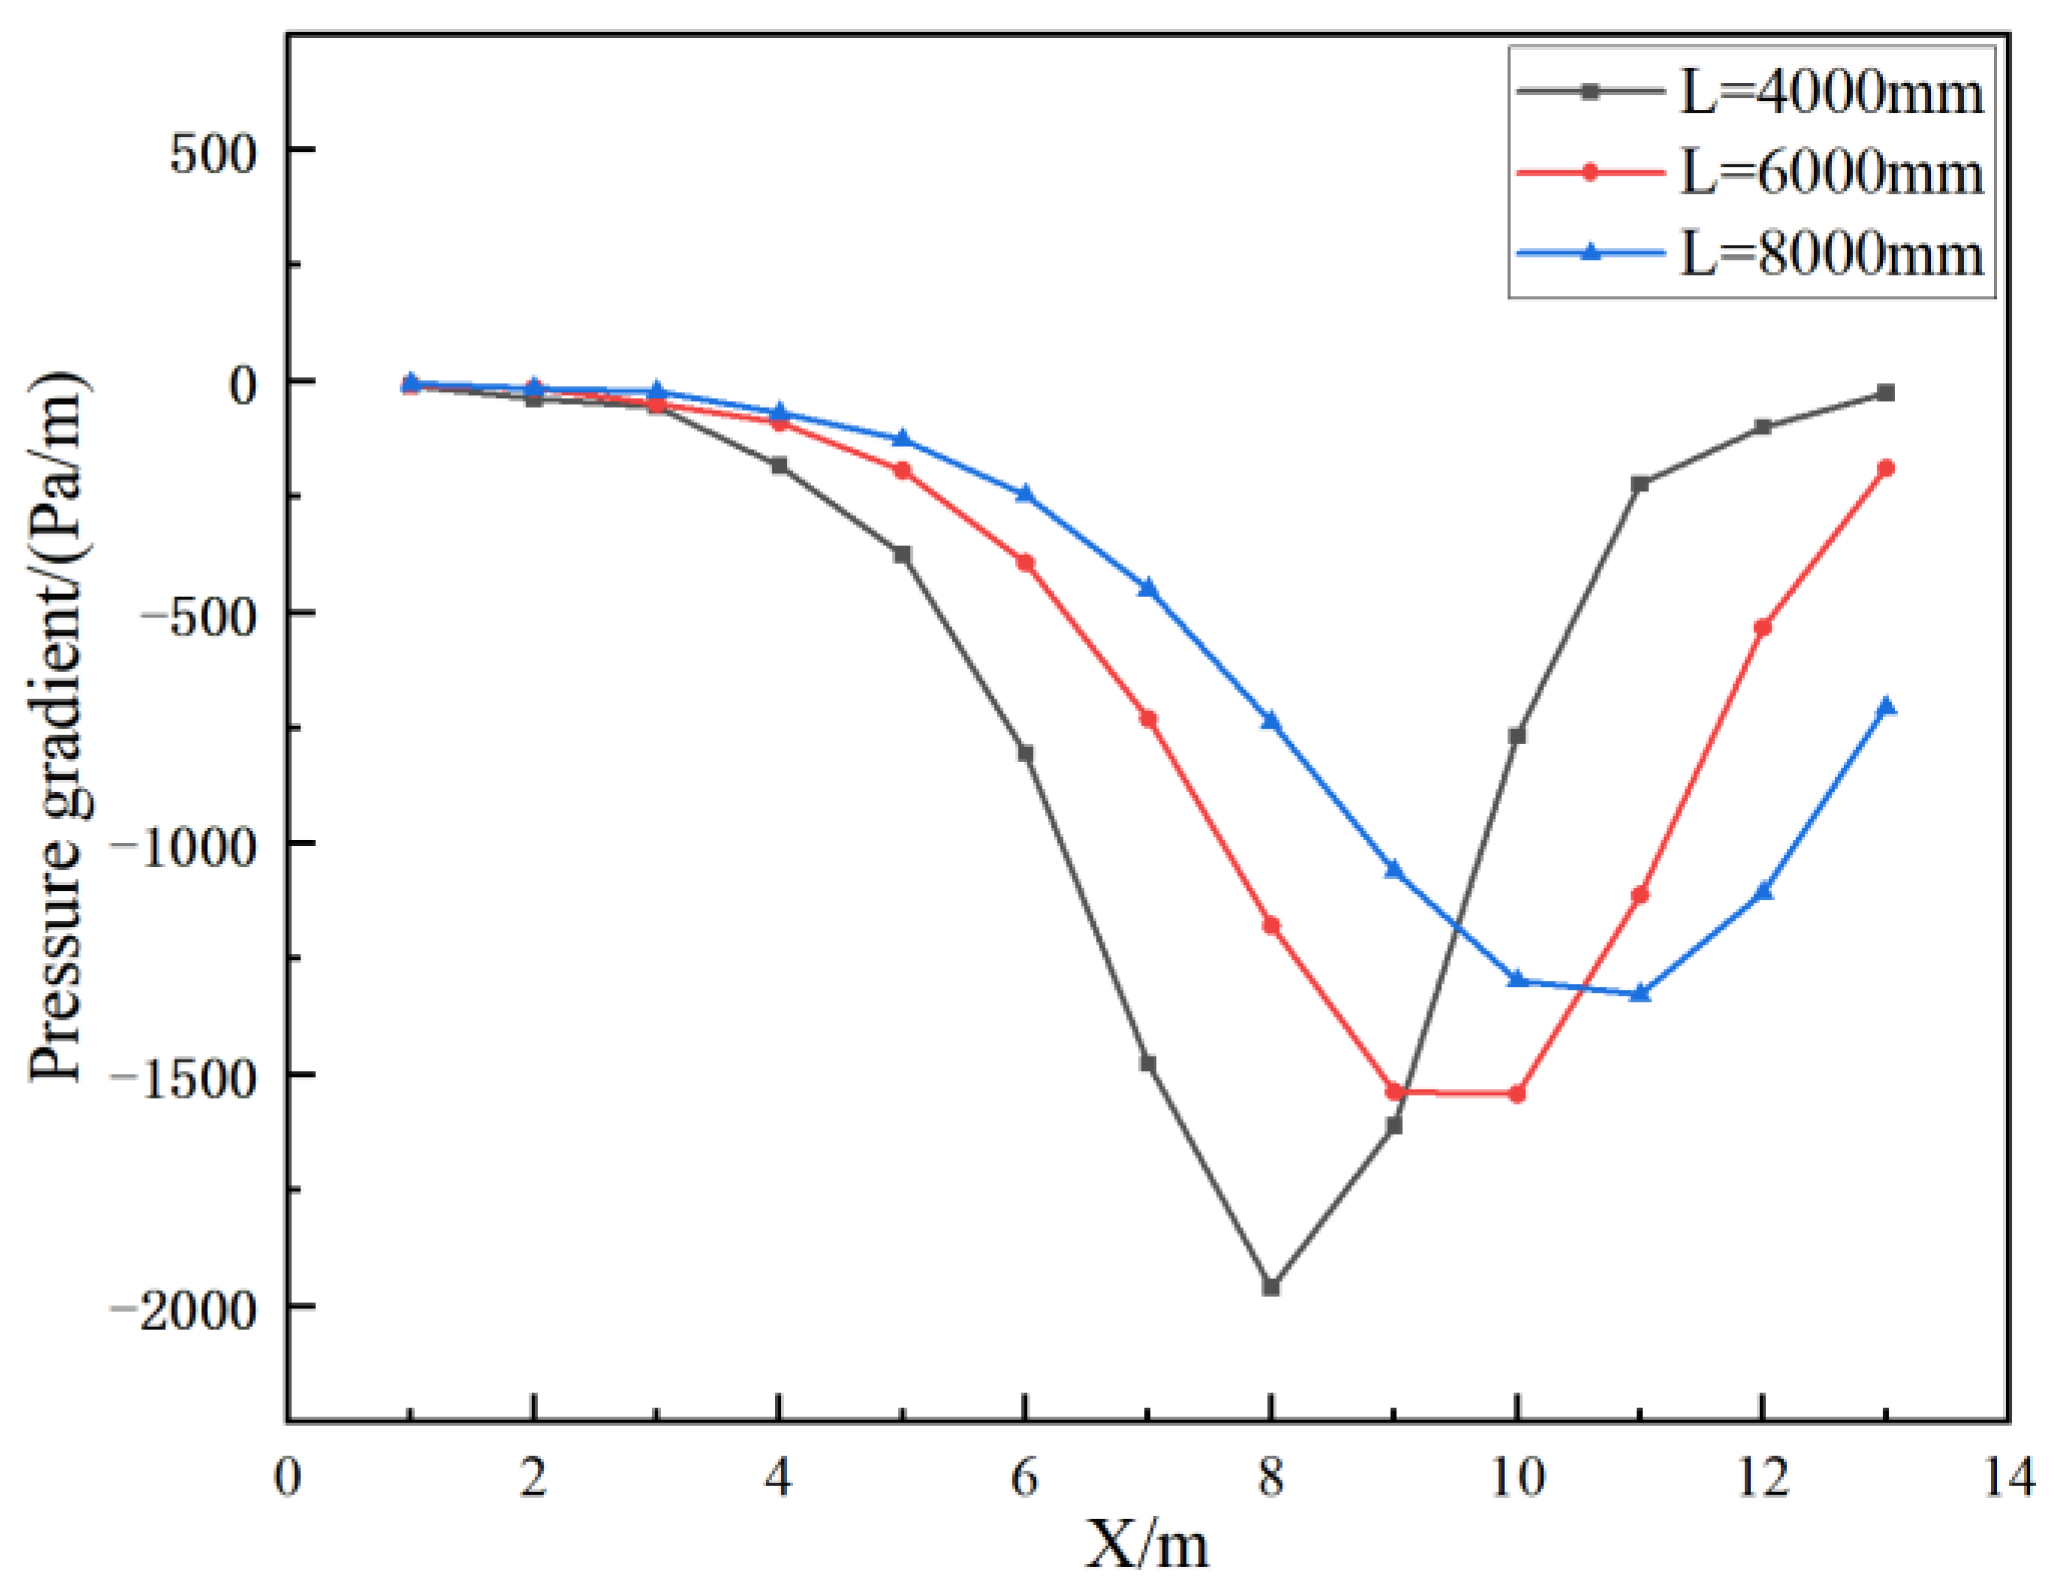
3.4. Effect of Contraction Section Length

The length of the contraction section plays an important role and usually refers to the acceleration distance of the water flow. An appropriate contraction section length could increase the thickness of the boundary layer, enlarge the installation space, and reduce the construction cost. Falling short of the contraction length will cause an increase in the possibility of the flow separation and lower the flow field uniformity.
To obtain the appropriate length of the contraction section and investigate the effects of the contraction section length on the flow performance of the CWC device, three cases in the numerical model are selected with different contraction lengths of L1 = 4000 mm, L2 = 6000 mm and L3 = 8000 mm. As the analysis discussed above, the Witozinsky transition curve of the contraction section is selected with the contraction ratio of C = 4, the velocity at the inlet is set to 1 m/s in the numerical model. The pressure gradient at the center of the contraction section and the uniformity of the velocity at the exit were measured separately, the same as previous studies. Figure 14 shows the pressure gradient of the flow field in the longitudinal direction from the contraction inlet of the CWC. It can be seen that at the inlet surface of the contraction section, the pressure gradient is equal to 0, and it gradually decreased with the flowing distance along the contraction part until it reaches a local valley peak then increased, the horizontal distance of this peak value increases with the increasing contraction length, it illustrates that the longer contraction length could provide a smoother transition of the pressure with a smaller pressure gradient amplitude in the flow field, and the rate of the decrease of the pressure gradient is greater for shorter contraction length.
Meanwhile, Table 4 gives the coefficient Cv at the exit position with different contraction section lengths. It shows that the coefficient Cv decreased with the increasing contraction length, which means that the flow field after the contraction section becomes more uniform and stable as the length of the contraction section increases. In general, a longer length of the contraction section can make a smooth transition of the flow with smaller pressure gradient variation, allowing more stable and uniform velocity generated in the flow field. Therefore, without any cost and space considerations, L = 8000 mm of this proposed CWC device is recommended for contraction section optimization.

4. Conclusions

In this paper, to achieve the high quality of the flow field for experimental tests, a CWC flume was numerically modeled, and the CWC design was improved by optimizing the turning vane and contraction parts. The flow characteristics were simulated and obtained based on the CFD flow theory and RNG turbulence model. The numerical model that can estimate the flow velocity and pressure performance with the existing published study was validated. By setting the three types of the flow guiding vane at the turning areas and optimizing the transition curves of the contraction section, the present model provides an improved design of the CWC device. With the validated numerical model, a detailed parametric investigation was conducted to study the effect of the current properties and configuration of the structural properties on the hydrodynamic performance of the CWC. The results show that the flow velocity and the pressure gradient are sensitive to the turning vane types and the contraction transition curve. The wing profile turning vane significantly influences the velocity uniformity of the flow and can achieve high flow quality with the wing straight-edged type turning vane. For this proposed CWC model, the turning vane straight edge length of l = 200 mm is suggested for improved design. Compared with the Quintic transition curve and the Bicubic transition curve, the Witozinsky transition curve has more advantages on the pressure gradient and velocity uniformity performance of the contraction section flow field. The longer length of the contraction section can make a smoother transition flow with smaller pressure gradient variation. However, the construction cost and the difficulty should also be considered jointly with this obtained optimal model, which would be helpful for an improved CWC design.

Author Contributions

C.Y. and Z.H. derived the numerical model. C.Y. and Z.H. wrote the original draft and conducted all the calculations. H.Y. and Z.S. conducted the data analysis. X.B., H.C. and L.J. reviewed the paper and contributed to the parametric analysis. All authors have read and agreed to the published version of the manuscript.

Funding

This paper is financially supported by the National Natural Science Foundation (Grant No.52101306), the Open Foundation of State Key Laboratory of Coastal and Offshore Engineering of Dalian University of Technology (LP2006), the National Science Foundation of Shandong Province (Grant No. ZR2021QE121), the National Science Foundation of Heilongjiang Province (Grant No. LH2021E049), the British Council (BRI JOINT project) and EPSRC ResIn project (EP/R007519/1) who part funded the corresponding author, and the China Scholarship Council (award to Yang Can for study abroad at the University of Exeter). Special thanks go to TORC and the anonymous reviewers for their careful reading of the manuscript and valuable comments.

Institutional Review Board Statement

Not applicable.

Informed Consent Statement

Informed consent was obtained from all subjects involved in the study.

Acknowledgments

In this section you can acknowledge any support given which is not covered by the author contribution or funding sections. This may include administrative and technical support, or donations in kind (e.g., materials used for experiments).

Conflicts of Interest

The authors declare no conflict of interest.

References

  1. Park, J.T.; Cutbirth, J.M.; Brewer, W.H. Experimental Methods for Hydrodynamic Characterization of a Very Large Water Tunnel. J. Fluids Eng. 2005, 127, 1210–1214. [Google Scholar] [CrossRef]
  2. Chen, Z.; Kurokawa, Y.; Hitoshi, N. CFD Application on the Development of Circulating Water Channel. In Proceedings of the Sixteenth International Offshore and Polar Engineering Conference, San Francisco, CA, USA, 28 May–2 June 2006. [Google Scholar]
  3. Pullinger, M.G.; Sargison, J.E. Using CFD to improve the design of a circulating water channel. In Proceedings of the 16th Australasian Fluid Mechanics Conference, Gold Coast, Australia, 3–7 December 2007. [Google Scholar]
  4. Yu, C.L.; Zhang, X.Q.; Nie, W.; Chu, G.N. Numerical Investigation of 3-D Curved Pipe and Guide Wanes’ Form of Circulation Water Channel. Ship Ocean Eng. 2010, 39, 21–24. [Google Scholar]
  5. Gucheng, Z.; Zuogang, C.; Yi, D. A numerical investigation on hydrodynamic characteristics of the circulating water channel. Ocean Eng. 2021, 236, 109564. [Google Scholar] [CrossRef]
  6. Mikhail, M.N. Optimum Design of Wind Tunnel Contractions. AIAA J. 1979, 17, 471–477. [Google Scholar] [CrossRef]
  7. Fang, F.-M.; Chen, J.C.; Hong, Y.T. Experimental and analytical evaluation of flow in a square-to-square wind tunnel contraction. J. Wind Eng. Ind. Aerodyn. 2001, 89, 247–262. [Google Scholar] [CrossRef]
  8. Wang, X.; Shen, X.; Tian, Y. Numerical Simulation on the Flow Field in Contraction Section of Precision Water Flume and Evaluation about the Contraction Curves. Metrol. Meas. Technol. 2015, 35, 24–28. [Google Scholar]
  9. Morel, T. Comprehensive Design of Axisymmetric Wind Tunnel Contractions. J. Fluids Eng. 1975, 97, 225–233. [Google Scholar] [CrossRef]
  10. Sargison, J.E.; Walker, G.J.; Rossi, R. Design and calibration of a wind tunnel with a two dimensional contraction. In Proceedings of the 15th Australasian Fluid Mechanics Conference, Sydney, Australia, 13–17 December 2004. [Google Scholar]
  11. Zhuang, L.; Yuan, S.; Ma, D.; Liu, C. Numerical Simulation of Flow Field for Two Typical Contraction Curves. Technol. Wind 2020, 2, 19–20. [Google Scholar]
  12. Ezhilsabareesh, K.; Suchithra, R.; Thandayutham, K.; Samad, A. Surrogate based optimization of a Bi-Directional impulse turbine for OWC-WEC: Effect of guide vane lean and stagger angle for pseudo-sinusoidal wave conditions. Ocean Eng. 2021, 226, 108843. [Google Scholar] [CrossRef]
  13. Yakhot, V.; Orszag, S.A.; Thangam, S.; Gatski, T.B.; Speziale, C.G. Development of turbulence models for shear flflows by a double expansion technique. Phys. Fluids A 1992, 4, 1510–1520. [Google Scholar] [CrossRef] [Green Version]
  14. Sean, T. Improvement of the Flow of Quality in the Australian Maritime College Circulating Water Channel; University of Tasmania: Hobart, Australia, 1995. [Google Scholar]
  15. Leifsson, L.; Koziel, S. Simulation-driven design of low-speed wind tunnel contraction. J. Comput. Sci. 2015, 7, 1–12. [Google Scholar] [CrossRef]
  16. Wolf, T. Design of a variable contraction for a full-scale automotive wind tunnel. J. Wind Eng. Ind. Aerodyn. 1995, 56, 1–21. [Google Scholar] [CrossRef]
  17. Bell, J.H.; Mehta, R.D. Contraction Design for Small Low-Speed Wind Tunnels. 1988. Available online: https://ntrs.nasa.gov/citations/19880012661 (accessed on 10 February 2022).
  18. Su, Y.-X. Flow analysis and design of three-dimensional wind tunnel contractions. AIAA J. 1991, 29, 1912–1920. [Google Scholar] [CrossRef]
Figure 1. Detailed illustration of the mesh structure. (a) The whole CWC; (b) The Turning vanes domain; (c) The Contraction section domain.
Jmse 10 00429 g001
Figure 2. Grid independence verification. (a) for turning vanes; (b) for contraction section.
Jmse 10 00429 g002
Figure 3. Comparison between the numerical and experimental results. (a) Comparison of turning vane section; (b) Comparison of contraction section.
Jmse 10 00429 g003
Figure 4. Profile sketch of the turning vanes.
Jmse 10 00429 g004
Figure 5. The velocity scalar field with three different types of turning vanes. (a) Arc profile turning vanes; (b) Wing profile turning vanes; (c) Wing profile straight turning vanes.
Jmse 10 00429 g005aJmse 10 00429 g005b
Figure 6. Comparisons of flow velocity with different types of turning vanes. (a) Sketch of probe positions; (b) Longitudinal velocity of turning vanes; (c) Monitoring point positions; (d) Outlet velocity of turning vanes.
Jmse 10 00429 g006
Figure 7. Sketch of the straight-edged turning vanes in the numerical model. (a) straight side lengths of 150 mm; (b) straight side lengths of 200 mm; (c) straight side lengths of 250 mm.
Jmse 10 00429 g007
Figure 8. Velocity scalar field of turning section with different straight edge lengths, d. (a) d = 150 mm; (b) d =200 mm; (c) d =250 mm.
Jmse 10 00429 g008aJmse 10 00429 g008b
Figure 9. Velocity variations of the turning vanes at the outlet monitoring point (a) Arrangement of monitoring points; (b) Outlet velocity of turning vanes.
Jmse 10 00429 g009
Figure 10. CWC contraction section.
Jmse 10 00429 g010
Figure 11. Comparison of three typical transition curves.
Jmse 10 00429 g011
Figure 12. Variation of pressure and pressure gradient of the flow field in the contraction section. (a) Pressure; (b) Pressure gradient.
Jmse 10 00429 g012
Figure 13. Variation of the outlet velocity with different contraction transition curves.
Jmse 10 00429 g013
Figure 14. Pressure gradient with different contraction section lengths.
Jmse 10 00429 g014
Table 1. Principal dimensions of the CWC.
SectionLong (m)Wide (m)Height (m)
The whole CWC83438
The turning vanes section21.5138
The contraction section1288
The test section2244
Table 2. List of mesh information.
Mesh DomainDetail DomainNumber of Elements (106)
Whole channelTotal domain20
Numerical simulation domainTurning vanes domain4.27
Contraction section domain0.4
Test sectionTest domain0.02
The total number of elements (106)-24.69
Table 3. Values of the contraction transition coefficient Cv.
LinearWitozinsky CurveQuintic CurveBicubic Curve
C v 0.0101730.0139690.012515
Table 4. Coefficient Cv with different contraction section lengths.
Contraction Section Length L/mmL = 4000L = 6000L = 8000
C v 0.0155520.0101730.005991
Publisher’s Note: MDPI stays neutral with regard to jurisdictional claims in published maps and institutional affiliations.

