Article

The Environmental Effects of the Innovative Ejectors Plant Technology for the Eco-Friendly Sediment Management in Harbors

1
Centro Interdipartimentale di Ricerca per le Scienze Ambientali, Alma Mater Studiorum Università di Bologna, 48123 Ravenna, Italy
2
Dipartimento di Scienze Biologiche, Geologiche e Ambientali, Alma Mater Studiorum Università di Bologna, 48123 Ravenna, Italy
3
Dipartimento di Beni Culturali, Alma Mater Studiorum Università di Bologna, 48121 Ravenna, Italy
4
Centro Interdipartimentale di Ricerca Industriale Fonti Rinnovabili, Ambiente, Mare ed Energia, Alma Mater Studiorum Università di Bologna, 48123 Ravenna, Italy
5
Consorzio Nazionale Interuniversitario per le Scienze del Mare, 00196 Roma, Italy
6
Istituto di Scienze Marine, Consiglio Nazionale delle Ricerche, 40129 Bologna, Italy
7
Department of Invertebrate Zoology and Hydrobiology, University of Lodz, 90-136 Lodz, Poland
8
Dipartimento di Ingegneria Industriale, Alma Mater Studiorum Università di Bologna, 40136 Bologna, Italy
*
Author to whom correspondence should be addressed.
J. Mar. Sci. Eng. 2022, 10(2), 182; https://doi.org/10.3390/jmse10020182
Submission received: 19 December 2021 / Revised: 20 January 2022 / Accepted: 26 January 2022 / Published: 28 January 2022

Abstract

:
A sediment bypassing plant based on innovative jet pump, ejectors, has been tested in the first-of-a-kind demo application at the harbor of Cervia (Italy, Northern Adriatic Sea). The ejector is a jet pump aimed to reduce sediment accumulation in navigation channels and coastal areas. Herein we present results of the first study assessing the potential ecological effects of the ejectors plant. Sediment characteristics, benthic, and fish assemblages before and after the plant activation have been analyzed in the putatively impacted (the sediment removal and discharge) areas and four control locations, one time before and two times after plant activation. Ejectors plant operation resulted in a reduction of the mud and organic matter content in the sediment, as well as in changes in shell debris amount in the impacted areas. Abundance and species richness of benthic macroinvertebrates, initially reduced in the impacted areas, probably due to the previous repeated dredging, returned to higher values during demo plant continuous operation. Higher diversity of fish fauna was observed in the study area during plant operation period. Observed dynamics of the ecological status of the marine habitat suggest that an ejectors plant could represent an eco-friendly solution alternative to dredging operations to solve harbor siltation problems.

1. Introduction

Sediment transport and accumulation close to the entrance and inside harbors and coastal channels, caused by waves, tides, and currents, reduce the water depth creating impediments to navigation. Traditionally, the siltation is addressed by periodic maintenance dredging, a consolidated and proven technology that involves removing sediment in its natural deposited condition by using either mechanical or hydraulic technologies [1]. Major drawbacks of dredging are the severe environmental impacts, obstruction of navigation during the operations, and the high costs [2]. Environmental consequences of dredging involve direct and indirect negative impacts on marine flora and fauna [3], the increasing of water turbidity [4], and the mobilization and diffusion of contaminants accumulated in sediments [5]. Moreover, disposal of dredged sediments carries technical, economic, and legislative issues, especially if the sediments are contaminated [6]. Thus, alternative sediment management methods in harbor and channel areas were developed over the years to minimize environmental and economic impacts. These include (1) anti-sedimentation structures, (2) remobilizing sediment systems, and (3) sand bypassing plants [7]. Recent comparative analysis of different sediment management techniques showed that a sand bypassing plant with jet pumps is one of the most effective and low-cost solutions in sediment management [7]. Sand bypassing plants are usually designed to perform an artificial transport of littoral materials across channel entrances, preventing sediment accumulation while dispersing sediments downstream. Since the sediment is removed directly from the water column before it settles down, this technology should have limited impacts on the surrounding environment. However, the environmental effects of sand bypassing systems have been poorly investigated.
In the frame of the LIFE MARINAPLAN PLUS project, an innovative sand bypassing technology, based on a patented jet pump called “ejector”, was constructed and tested at the entrance of the harbor of Cervia (Italy). The harbor of Cervia can be considered as a representative siltation case study for the Italian coast on the Adriatic Sea [8]: in fact, similar to many others in the area, it is a channel harbor affected by the formation of sandbanks at the entrance that hinders navigation. Until now, the sandbanks have been periodically removed by seasonal dredging and/or sand underwater resuspension using boat propellers. However, besides having high costs (from 2009 to 2015 mean yearly cost imputer to Cervia Municipality was EUR 185,000 [8]), these operations represented periodic obstruction to navigation, did not solve the siltation problem in the long term, and may have affected the quality of the surrounding marine environment.
The aim of this study was to analyze the potential ecological effects of the ejectors demo plant on sediment characteristics, benthic fauna, and fish assemblages, by following a specifically adapted “beyond-BACI” (before–after–control–impact) approach [9].

2. Materials and Methods

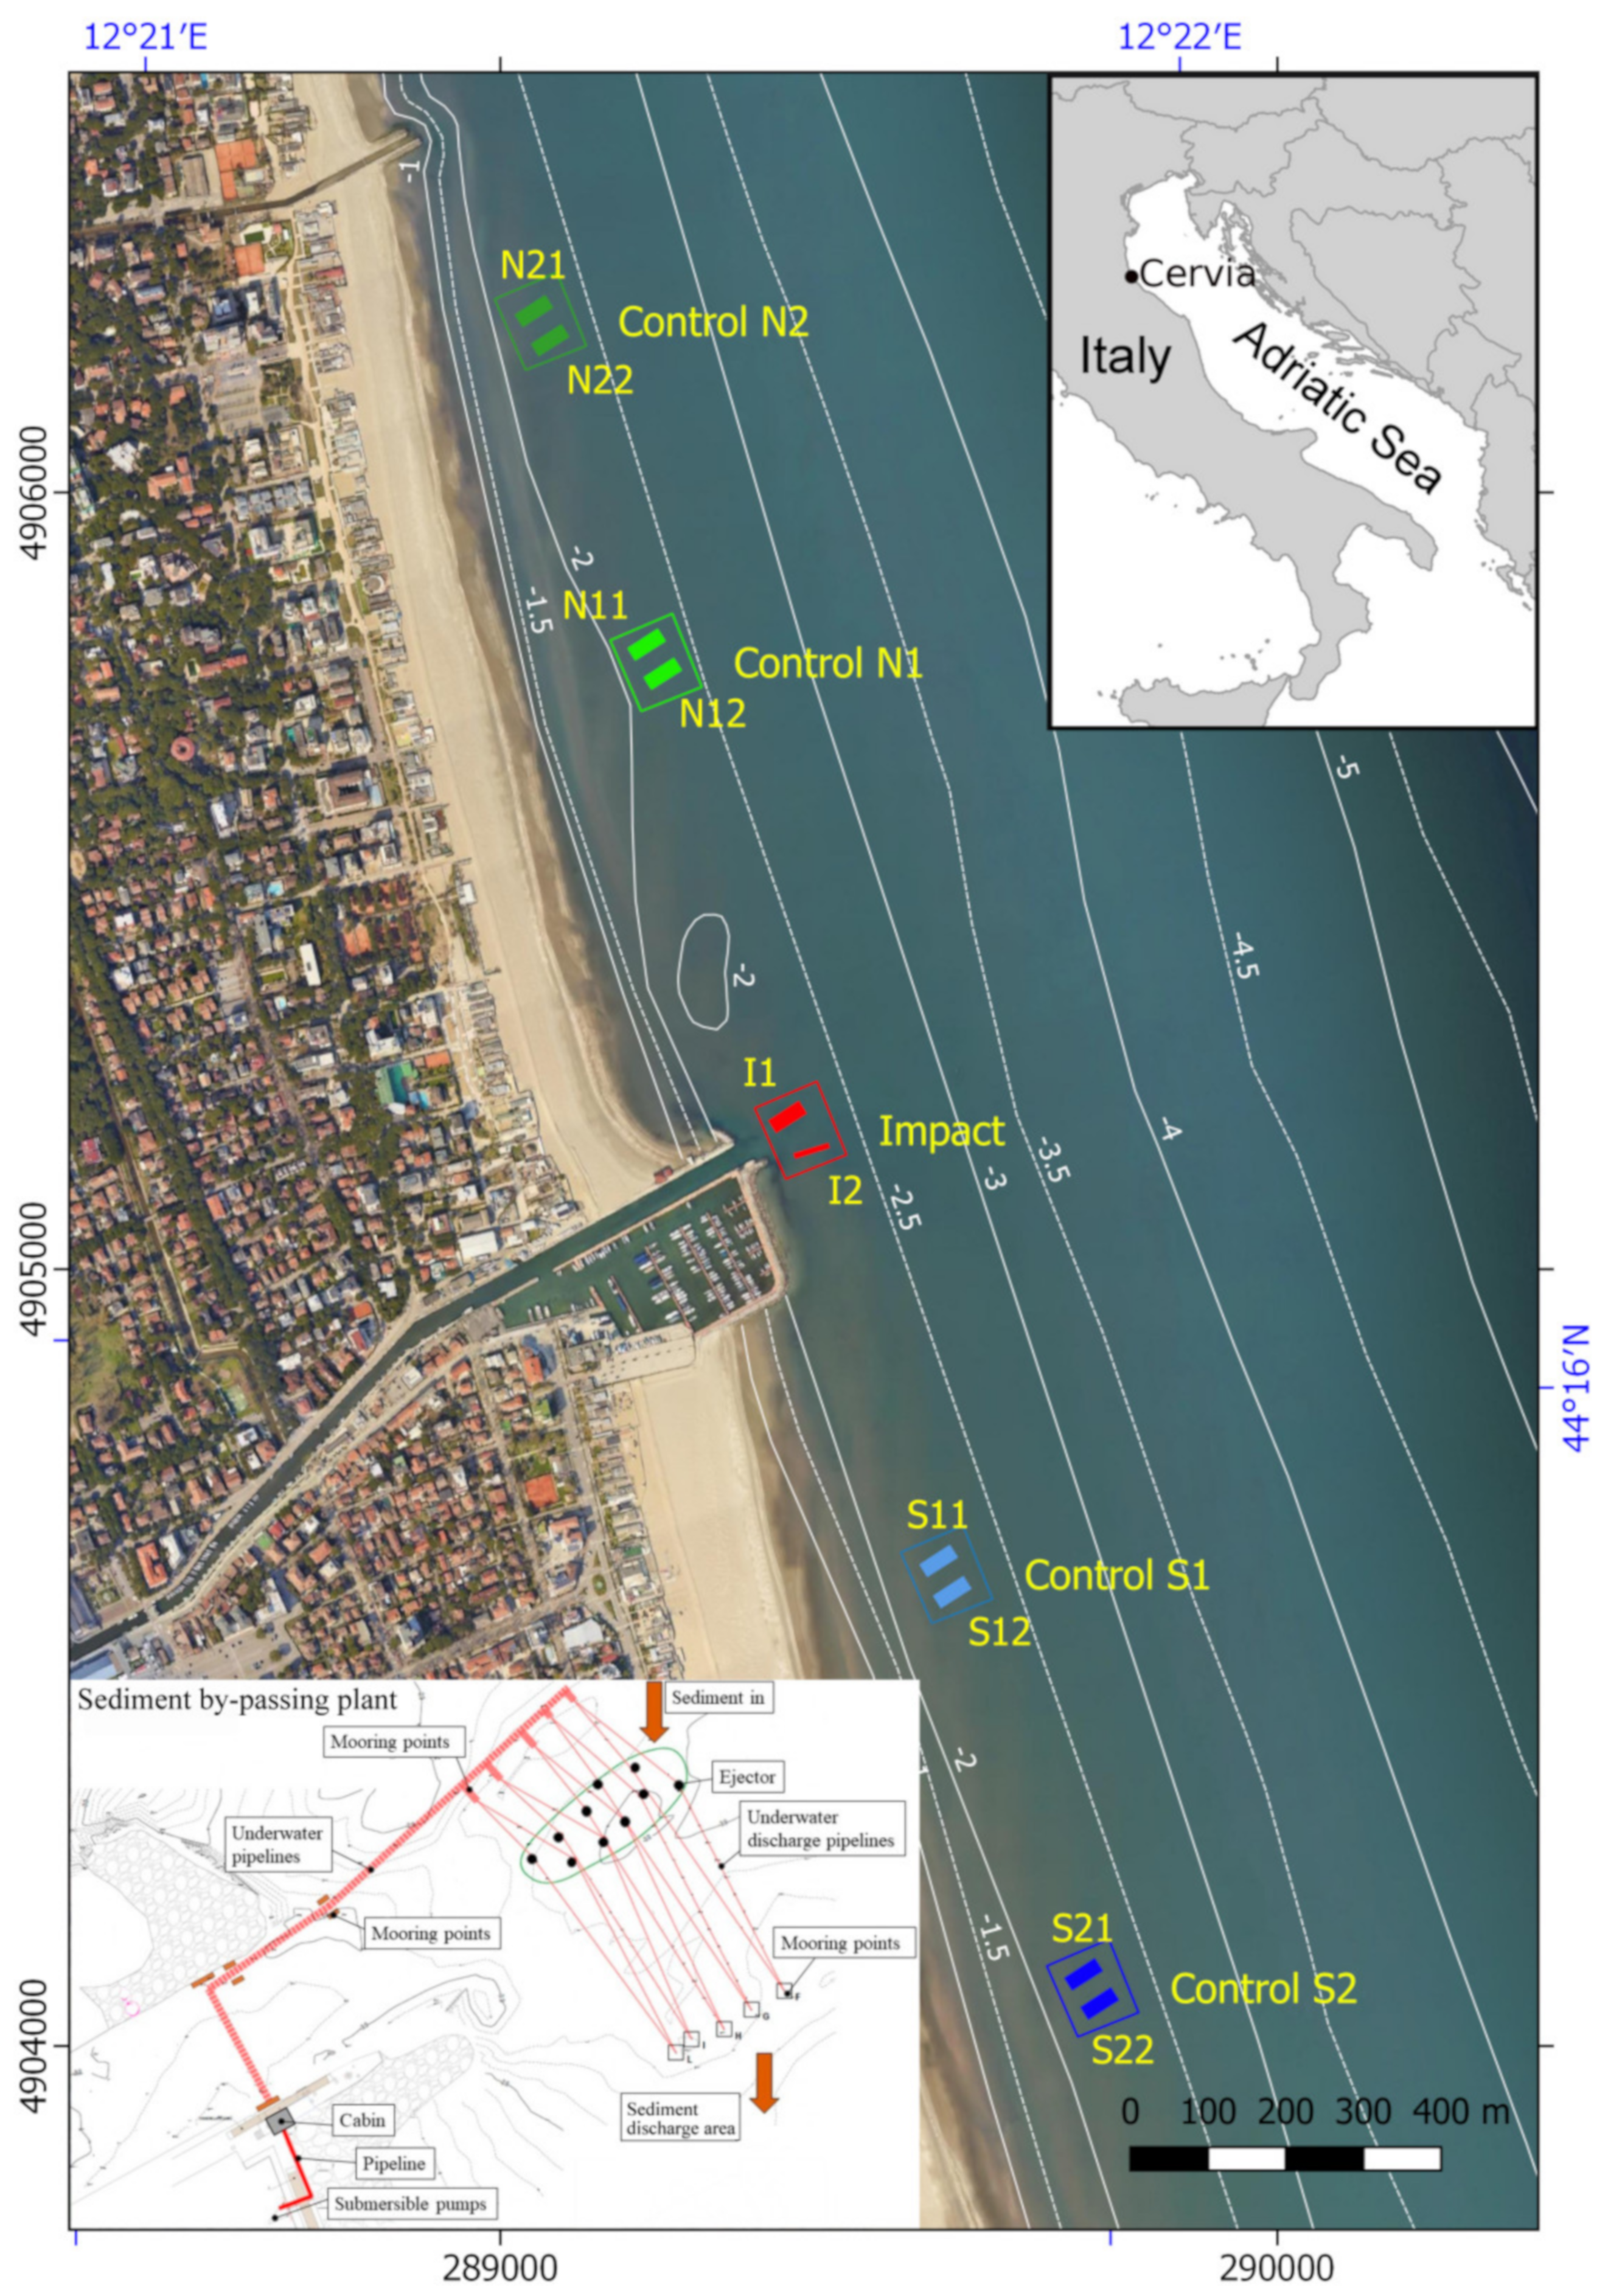
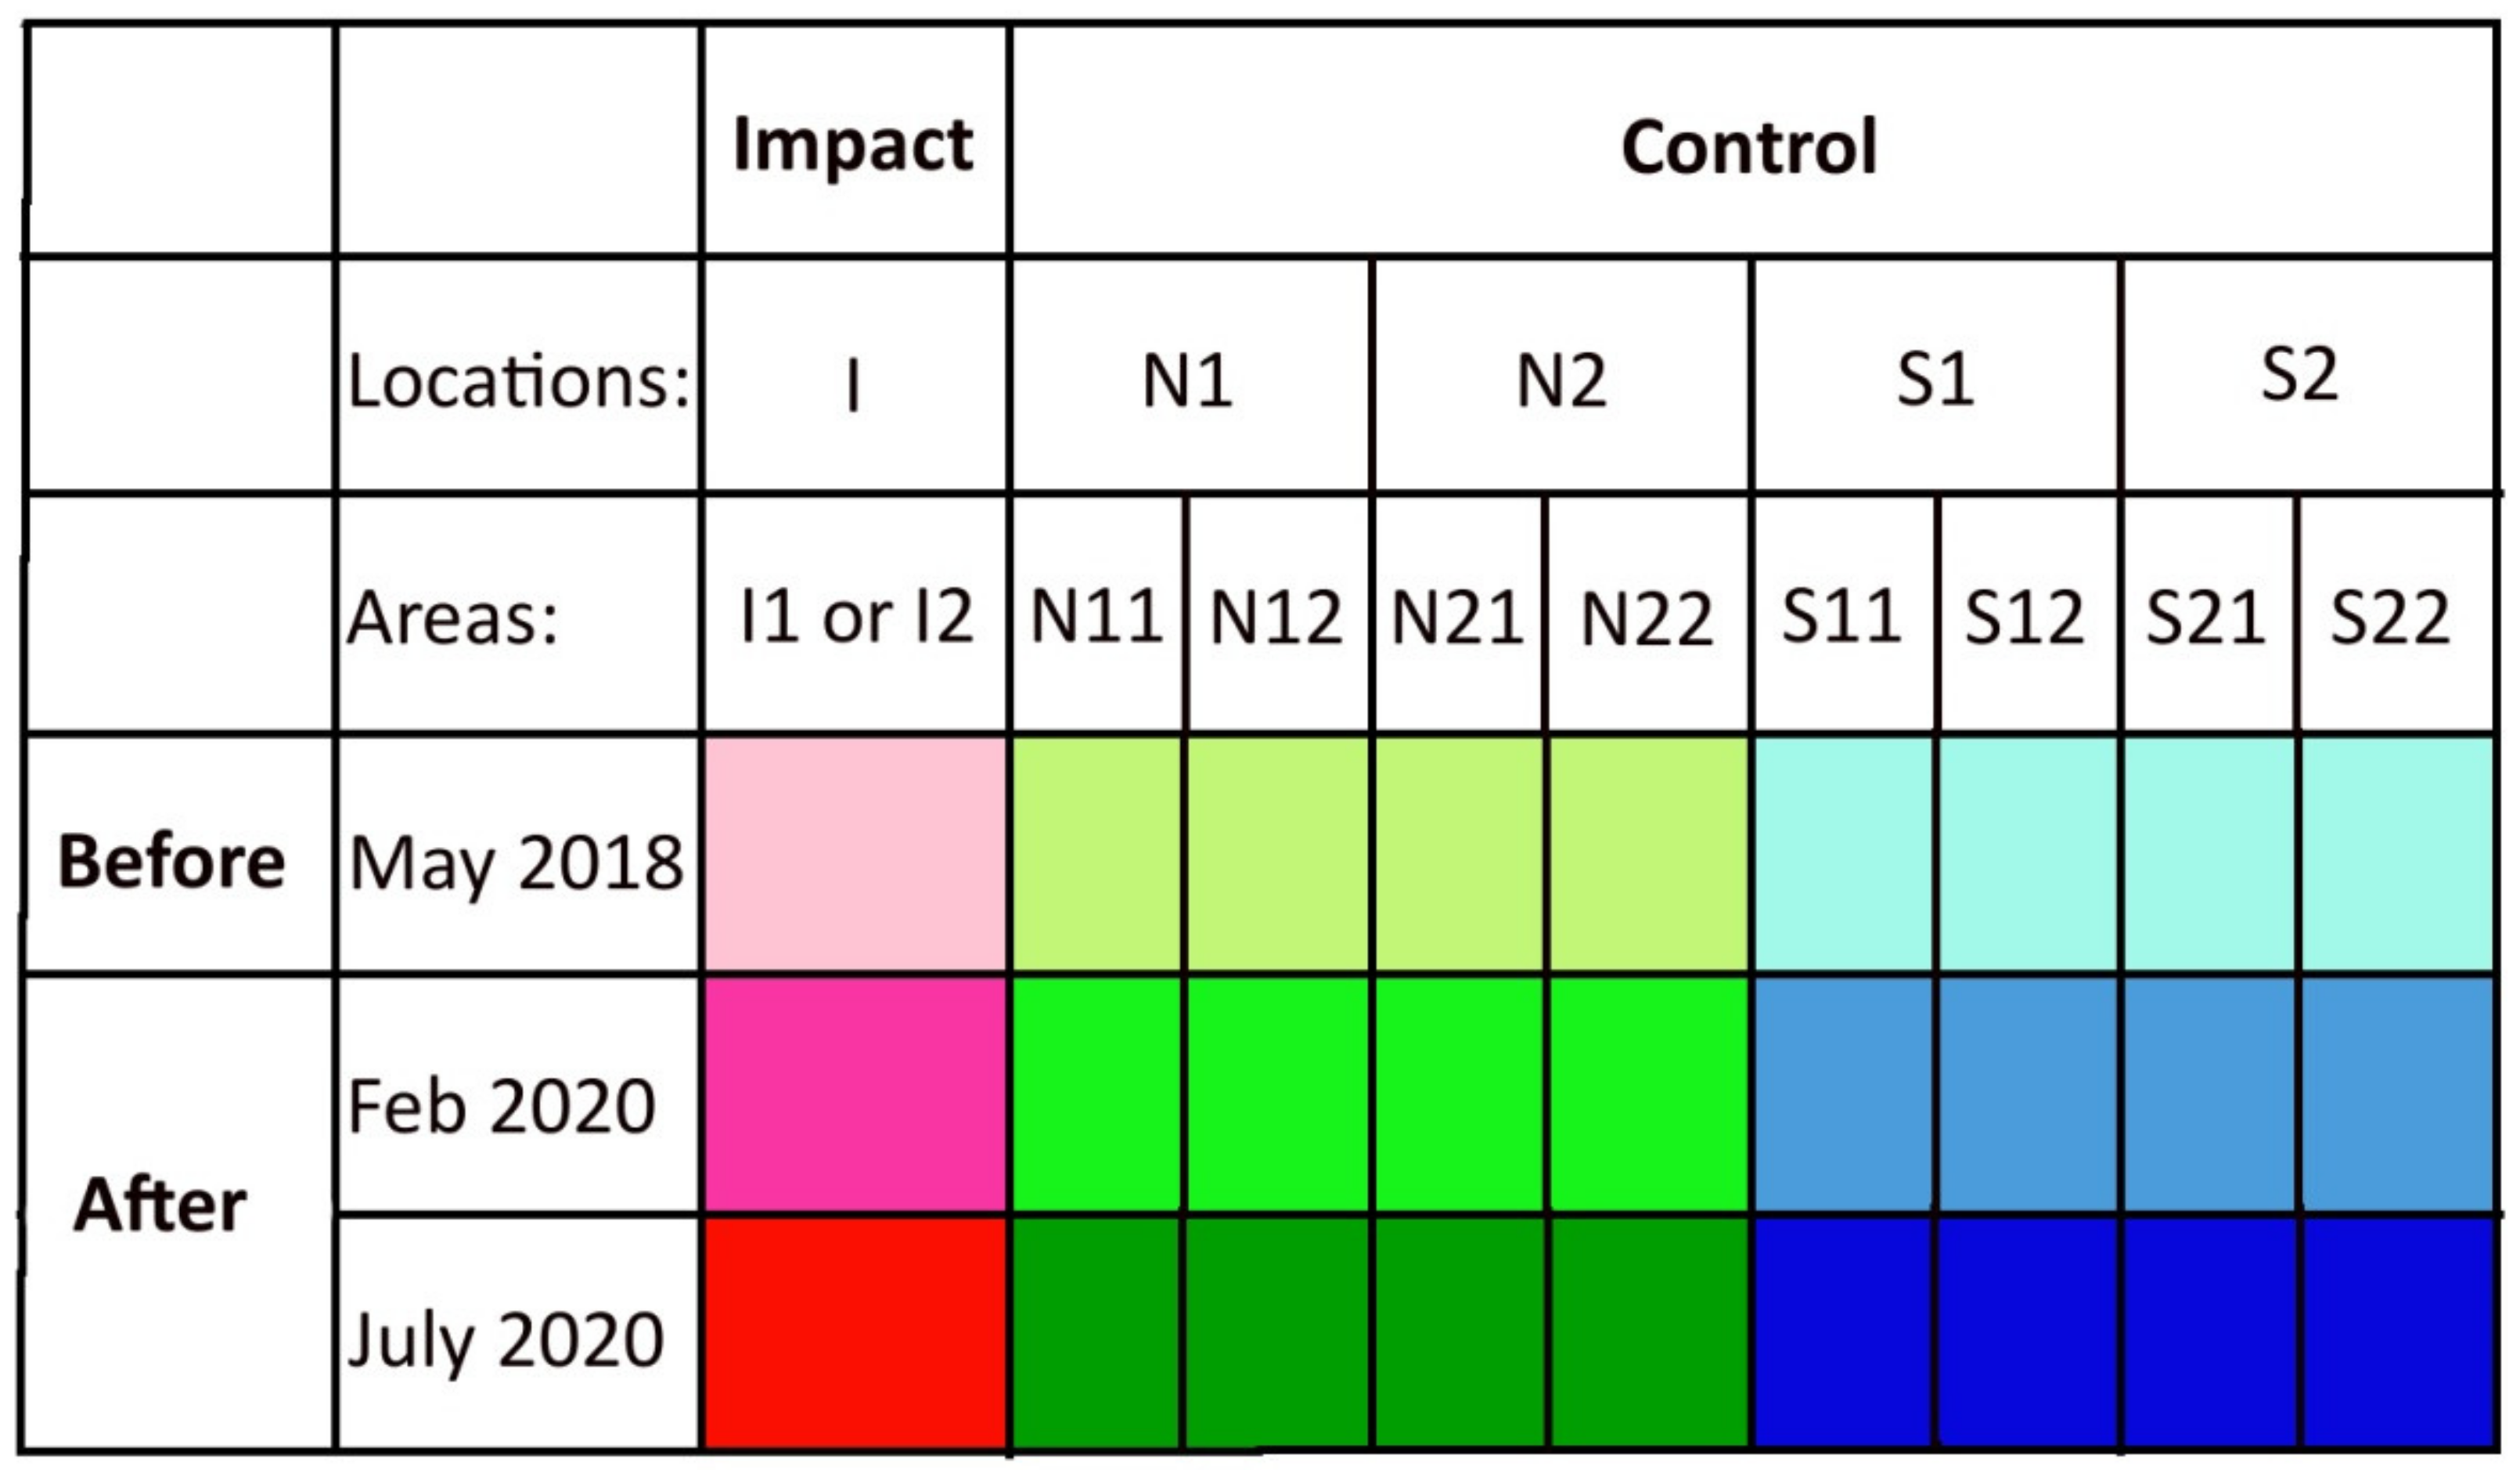
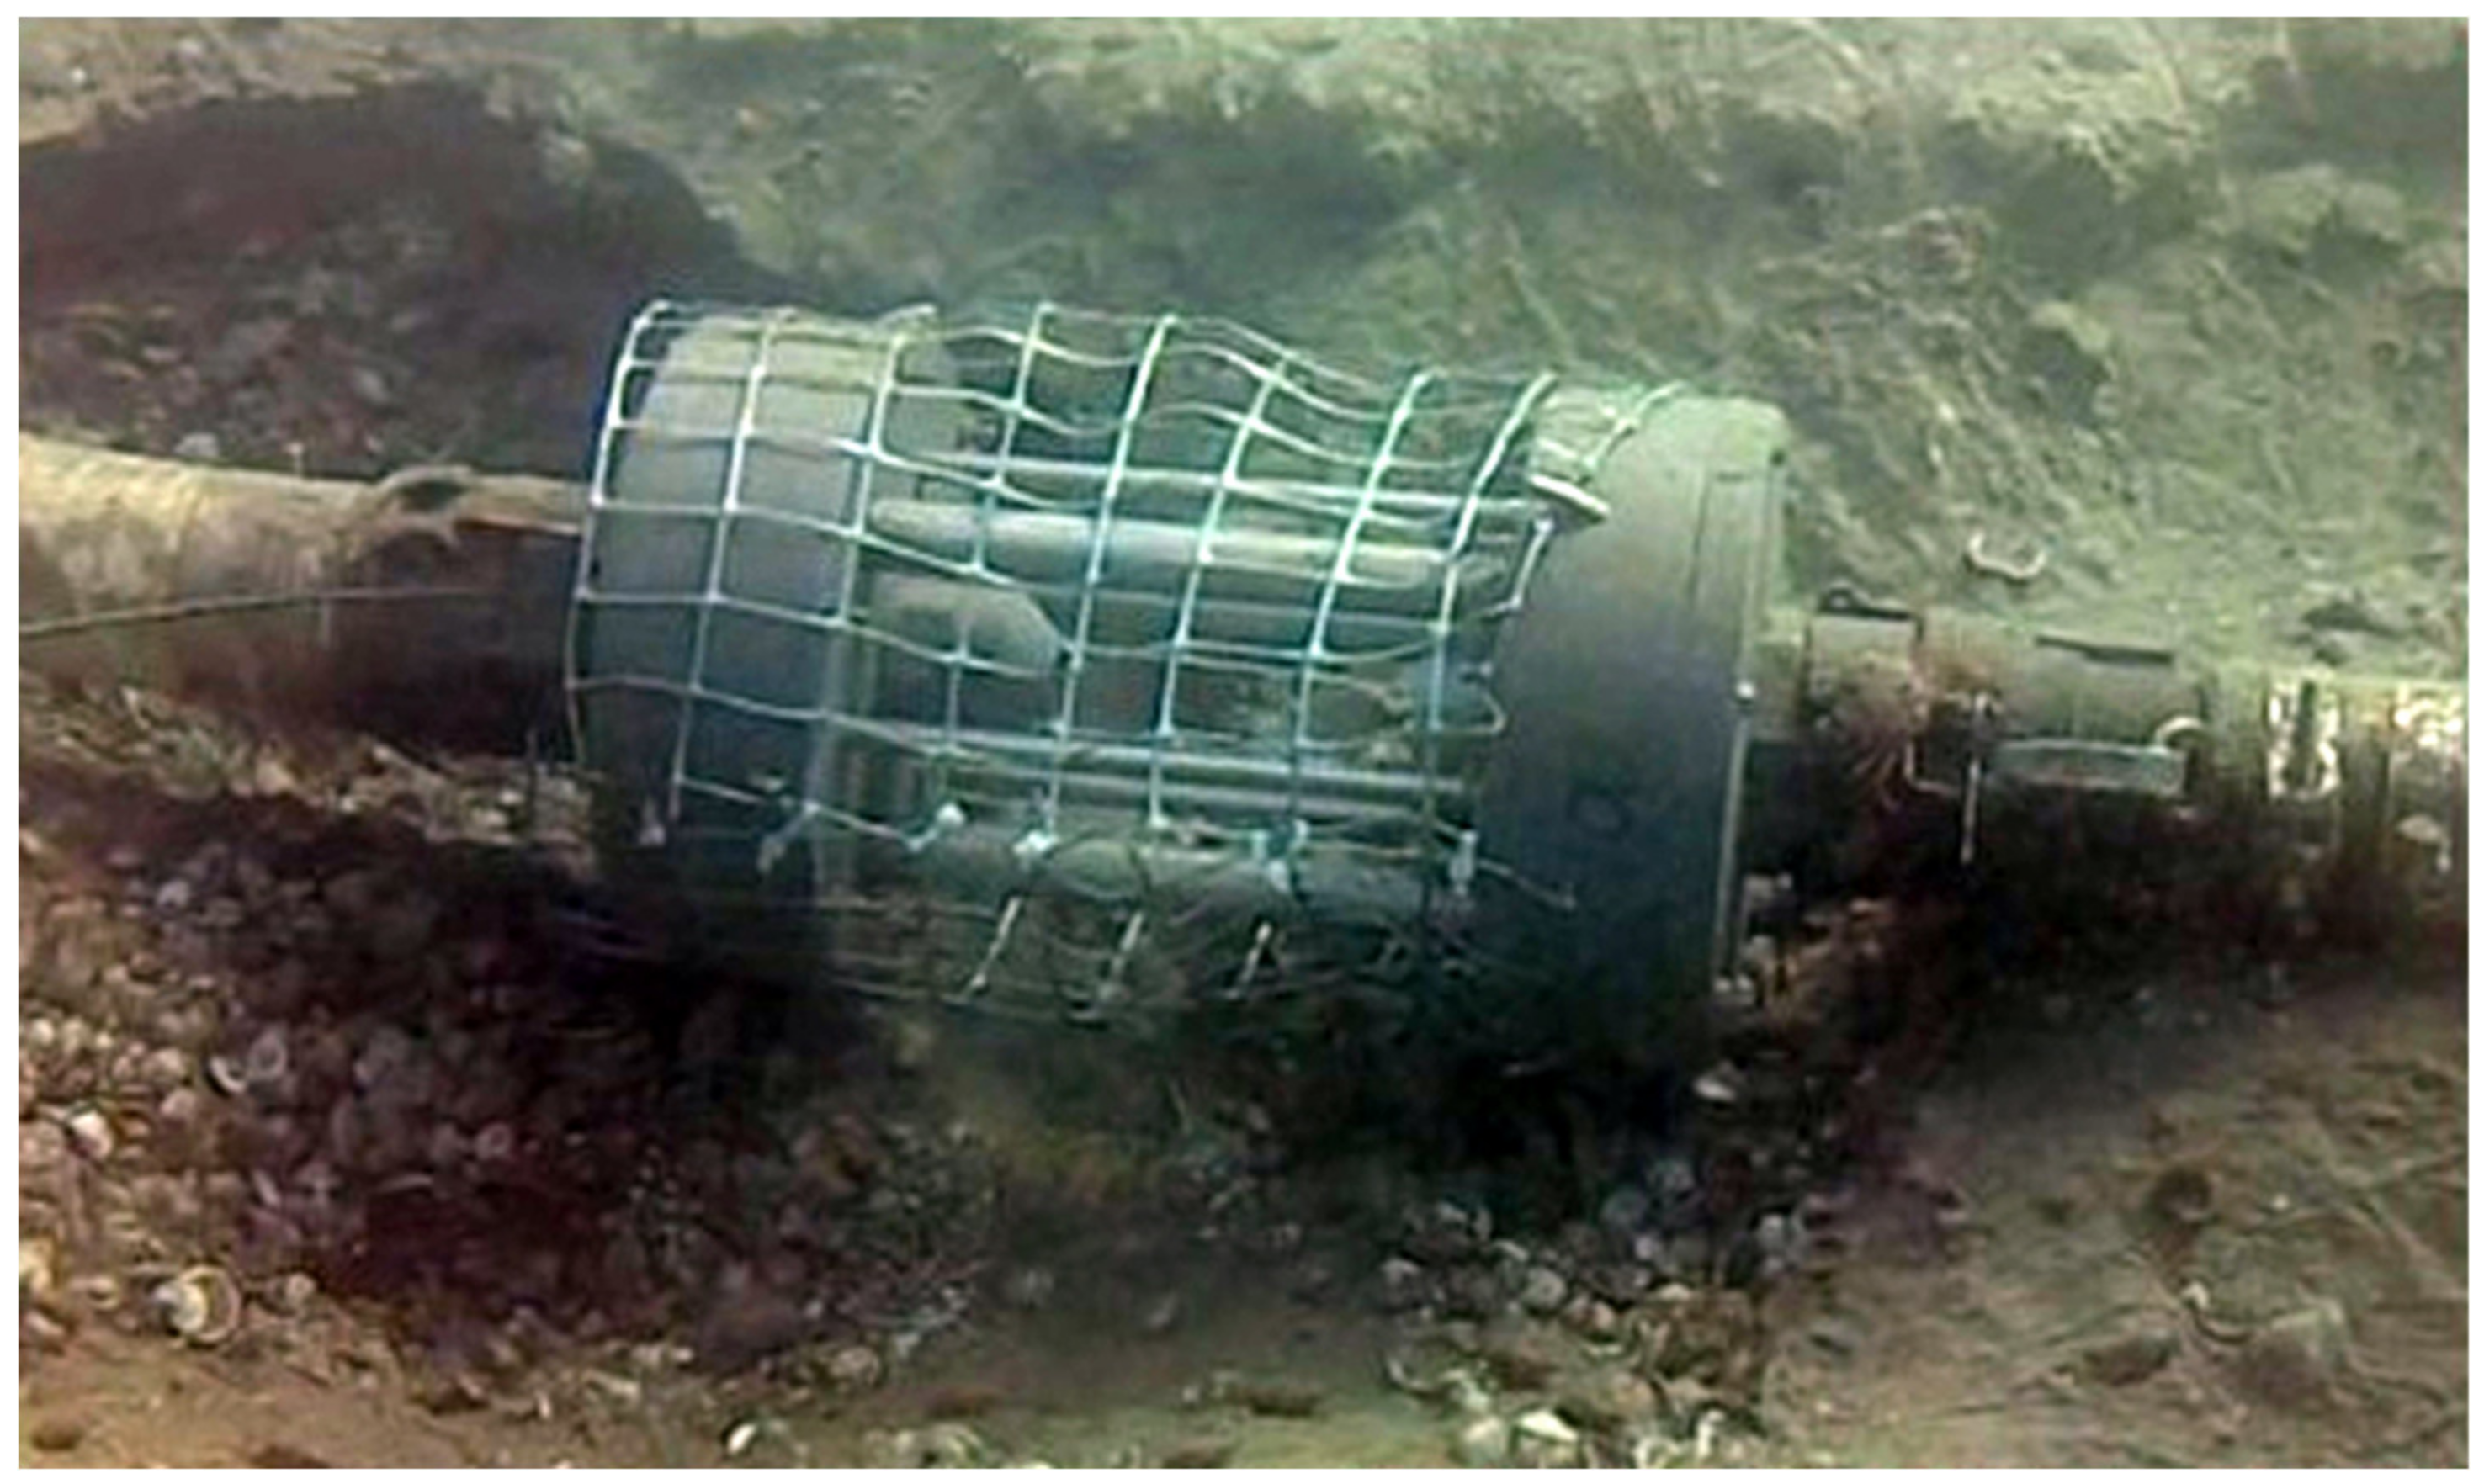
2.1. Description of the Study Area, Ejectors Demo Plant, and Sampling Design

Cervia is a small municipality (30,000 inhabitants) situated in the Emilia–Romagna region (Italy) on the northwestern Adriatic coast, with a port area of 43,000 m2, with a capacity of about 300 berths. The coast is characterized by the sandy beaches extending northwards and southwards of the harbor. Opposed longshore currents coming from the north and south of Cervia tend to meet and accumulate sediments in front of the harbor of Cervia [10]. The annual net longshore sediment transport in the area offshore the harbor of Cervia is estimated to be equal to zero [10]. Thus, Cervia is defined as a convergence point for the annual longshore sediment transport, with the convergence point position being affected by annual wave climate. The wave climate is characterized by severe storms mainly generated by northeasterly winds—bora; however, southeasterly winds—sirocco, may also have relevant seasonal impacts [11,12]. Sea storms are the most significant driving forces leading to sediment transport and coastal changes; therefore, the identification of each single sea storm (an event characterized by a significant wave height higher than 1.5 m and remaining over this value for at least 6 h) is necessary to assess the sediment management in Cervia harbor [13]. Data on the wave height and direction detected by the wave buoy can be retrieved from ARPAE [14]. In the period 2010–2020, the most energetic waves were up to 4.0 m in height, propagating from the sector 50–60° N; the most frequent conditions were with wave heights up to 1.0 m, coming from 90° N; the high-wave periods had values ranging from 9 to 11 s, coming from 90° N, while the most frequent values ranged from 5 to 7 s [13].
As a possible alternative solution to maintenance dredging (that is performed in the area two to three times a year), the ejectors plant was installed in front of the harbor inlet of Cervia and put into function in June 2019. Meteoclimatic analysis and analysis of water depth variation in the area affected by the ejectors plant were part of the plant effectiveness study and were performed in the period 2017–2020, including 15 consecutive months of operation of the ejectors demo plant [13]. The Cervia demo plant consists of 10 ejectors placed on the waterbed at the harbor entrance. The ejector (Figure 1) is an open jet pump (i.e., without a closed suction chamber and mixing throat) with a converging section instead of a diffuser and a series of nozzles positioned circularly around the ejector [13]. The ejector has a diameter of about 250 mm and a length of about 400 mm. Each ejector works on a limited circular area created by the pressurized water outgoing from the central and circular nozzles. The ejector transfers momentum from a high-speed primary water jet flow to a secondary flow that is a mixture of water and the surrounding sediment [15]. The sediment–water mixture is then conveyed through pipelines lying on the seabed and discharged in a location south of the Cervia harbor entrance channel, where the sediment can be picked up again from the main water current (Figure 2). The best discharge area was identified based on the sediment transport analysis [13]. Both water feeding and discharge pipelines are DN80 spiral tubes with external diameter of about 90 mm. The Cervia demo plant also includes a fully automated and remotely accessible pumping station equipped with auto-purging filters. The total installed power is about 80 kW. A local meteorological station measuring both wind speed and direction has been installed to relate plant operation with sea weather conditions. The value of the water flowrate feeding the ejectors can be adjusted in relation to the wind speed, in order to guarantee sufficient sediment suction and conveying capacity. A detailed description of the demo plant can be found in [13].
Ejectors and pipes represent very small artificial structures that offer no hindrance to navigation and little substrate for the settlement of sessile benthic species (e.g., filamentous algae, serpulid polychaetes, mussels, ascidians, and others); however, periodic cleaning and maintenance are required. Similar to other artificial substrates in the area, they also attract vagile benthic species, such as crabs and gastropods, including the nonindigenous veined rapa whelk, Rapana venosa (Valenciennes, 1846), observed laying eggs along the pipes (Figure 2a–d).
The environmental monitoring activities of the Cervia ejectors demo plant presented in this study encompassed the period from the end of May 2018 to the beginning of July 2020. Sampling was carried out in five locations: in the putatively impacted location in front of the harbor of Cervia (location I; 44°16.162′ N, 12°21.667′ E), two control locations 600 m (location N1; 44°16.484′ N, 12°21.512′ E) and 1200 m (location N2; 44°16.718′ N, 12°21.390′ E) north of the impact location, and two control locations 600 m (location S1; 44°15.857′ N, 12°21.822′ E) and 1200 m (location S2; 44°15.573′ N, 12°21.976′ E) south of the impact location (Figure 3). Control locations were chosen randomly and distributed symmetrically north and south of the impact, at the distance beyond which the impacts of the harbor and the effects of dredging are no longer present. Within every location, two sampling areas of about 800 m2 were considered, 20–30 m distance from each other. The two areas within the impact location represent the sediment removal area where ejectors are positioned (I1; previously dredged area) and the sediment discharge area (I2). Within study locations, water depth ranged from 2 to 2.5 m below mean lower low water.
Three sampling campaigns were carried out: one time before the ejectors plant activation (end of May 2018) and two times after (middle of February 2020 and beginning of July 2020). One month before the first campaign, an unscheduled dredging operation was carried out by the municipality. The experimental design includes five factors (Figure 4): before/after (BA), a two-levels fixed factor; time (Ti), as an asymmetrical random factor, with one level nested in before (May 2018) and two levels in after (February and July 2020); control/impact (CI), as a two-level fixed factor; location (Lo), as an asymmetrical random factor, with one level nested in impact (I1 or I2) and four levels in control (north—N1, N2; south—S1, S2); sampling area (Ar), as an asymmetrical random factor, with one level nested in the impact location and two levels in each control location. In each Area, four sediment replicate samples were analyzed. Since different disturbance sources were present in the two areas within the impact location (I1—ejectors/sediment removal, I2—sediment discharge), with possible different resulting impacts, they were separately analyzed and contrasted with all available control areas (as in [16]).

2.2. Field Work and Laboratory Analyses

Sampling operations were carried out by an inflatable boat equipped with a WAAS/EGNOS-enabled GPS ensuring a positioning estimated accuracy of 2–3 m. The operations were carried out with calm sea, wind from absent to light breeze, and clear or partly cloudy sky. Samples of sediment were manually collected by SCUBA divers using a plastic scoop within a surface of 23.5 × 13.5 cm2 and up to 10 cm depth (corresponding to a volume of about 3 L). From each sediment sample, a 50 mL subsample was stored in a labeled plastic container and frozen for later analyses of sediment grain size and organic matter. The remaining sample was sieved on board through 0.5 mm mesh screen, preserved in 90% alcohol, and stored in labeled plastic containers for macrofaunal sorting. For each sample, retained organisms were separated, counted, and identified to the lowest possible taxonomic level using stereoscope (Leica Wild M3B and Nikon SMZ1500) and light microscope (Nikon ECLIPSE 50i). The content of shell debris was determined as the weight of material remaining after the separation of organisms and drying at 70–80 °C for 24 h. Organic matter content in the sediment was determined as percentage loss of weight after ignition (LOI method) at 450 °C for 8 h, preceded by drying at 70–80 °C for 24 h (modified from [17]). Grain size analysis of the sediment considered the content of three size classes, mud (silt and clay; <63 μm), fine sand (63–250 μm), and medium sand (>250 μm), which were determined as dry weight percentage after (1) wet sieving (through 250 μm and 63 μm mesh), (2) rinsing and retaining each fraction by previously weighted Whatman qualitative filter paper (Grade 1, pore size 11 μm), and (3) drying for 24 h at 70–80 °C (as in [17]).
Fish assemblages were visually sampled before (May 2018) and after (July 2020) the ejectors plant activation, by GoPro Hero 5 video cameras randomly placed underwater within each study area. High-definition (full-HD, 1920 × 1080 pixels) thirty-minute digital videos were recorded during each deployment. Each video, lasting approximately 30 min, was divided into four 7 min sections, considered as four replicates. Mean abundance per minute of each fish species observed was calculated for each replicate.

2.3. Data Analysis

For each benthic macrofaunal sample, diversity indices were calculated: species richness (S), total abundance (N), Shannon species diversity index (H’, log e), and Pielou evenness index (J’). A distance-based permutational analysis of variance (PERMANOVA [18,19]) was performed to individually test for differences in environmental variables (the content of shell debris, organic matter, and granulometric fractions) and diversity indexes (S, N, H’, and J’) between before and after, control and impact, time within after, locations within control, and impact and areas within locations. PERMANOVA tests (α = 0.05) of univariate analyses were based on Euclidean distances of untransformed data. When the number of unique permutations available was less than 1000, asymptotic Monte Carlo p-values (P(MC)) were considered instead of permutational ones (P(perm)). Factor area and its interactions with other factors were pooled when resulting p-values were ≥0.25, since in those cases they represented a nonsignificant source of variation [20]. When appropriate, posteriori pairwise comparisons were performed in order to detect the source of significant variations. Mean values were always reported along with their standard errors (±SE). Analyses were performed using the software PRIMER v6 [21], including the package PERMANOVA+ [22].

3. Results

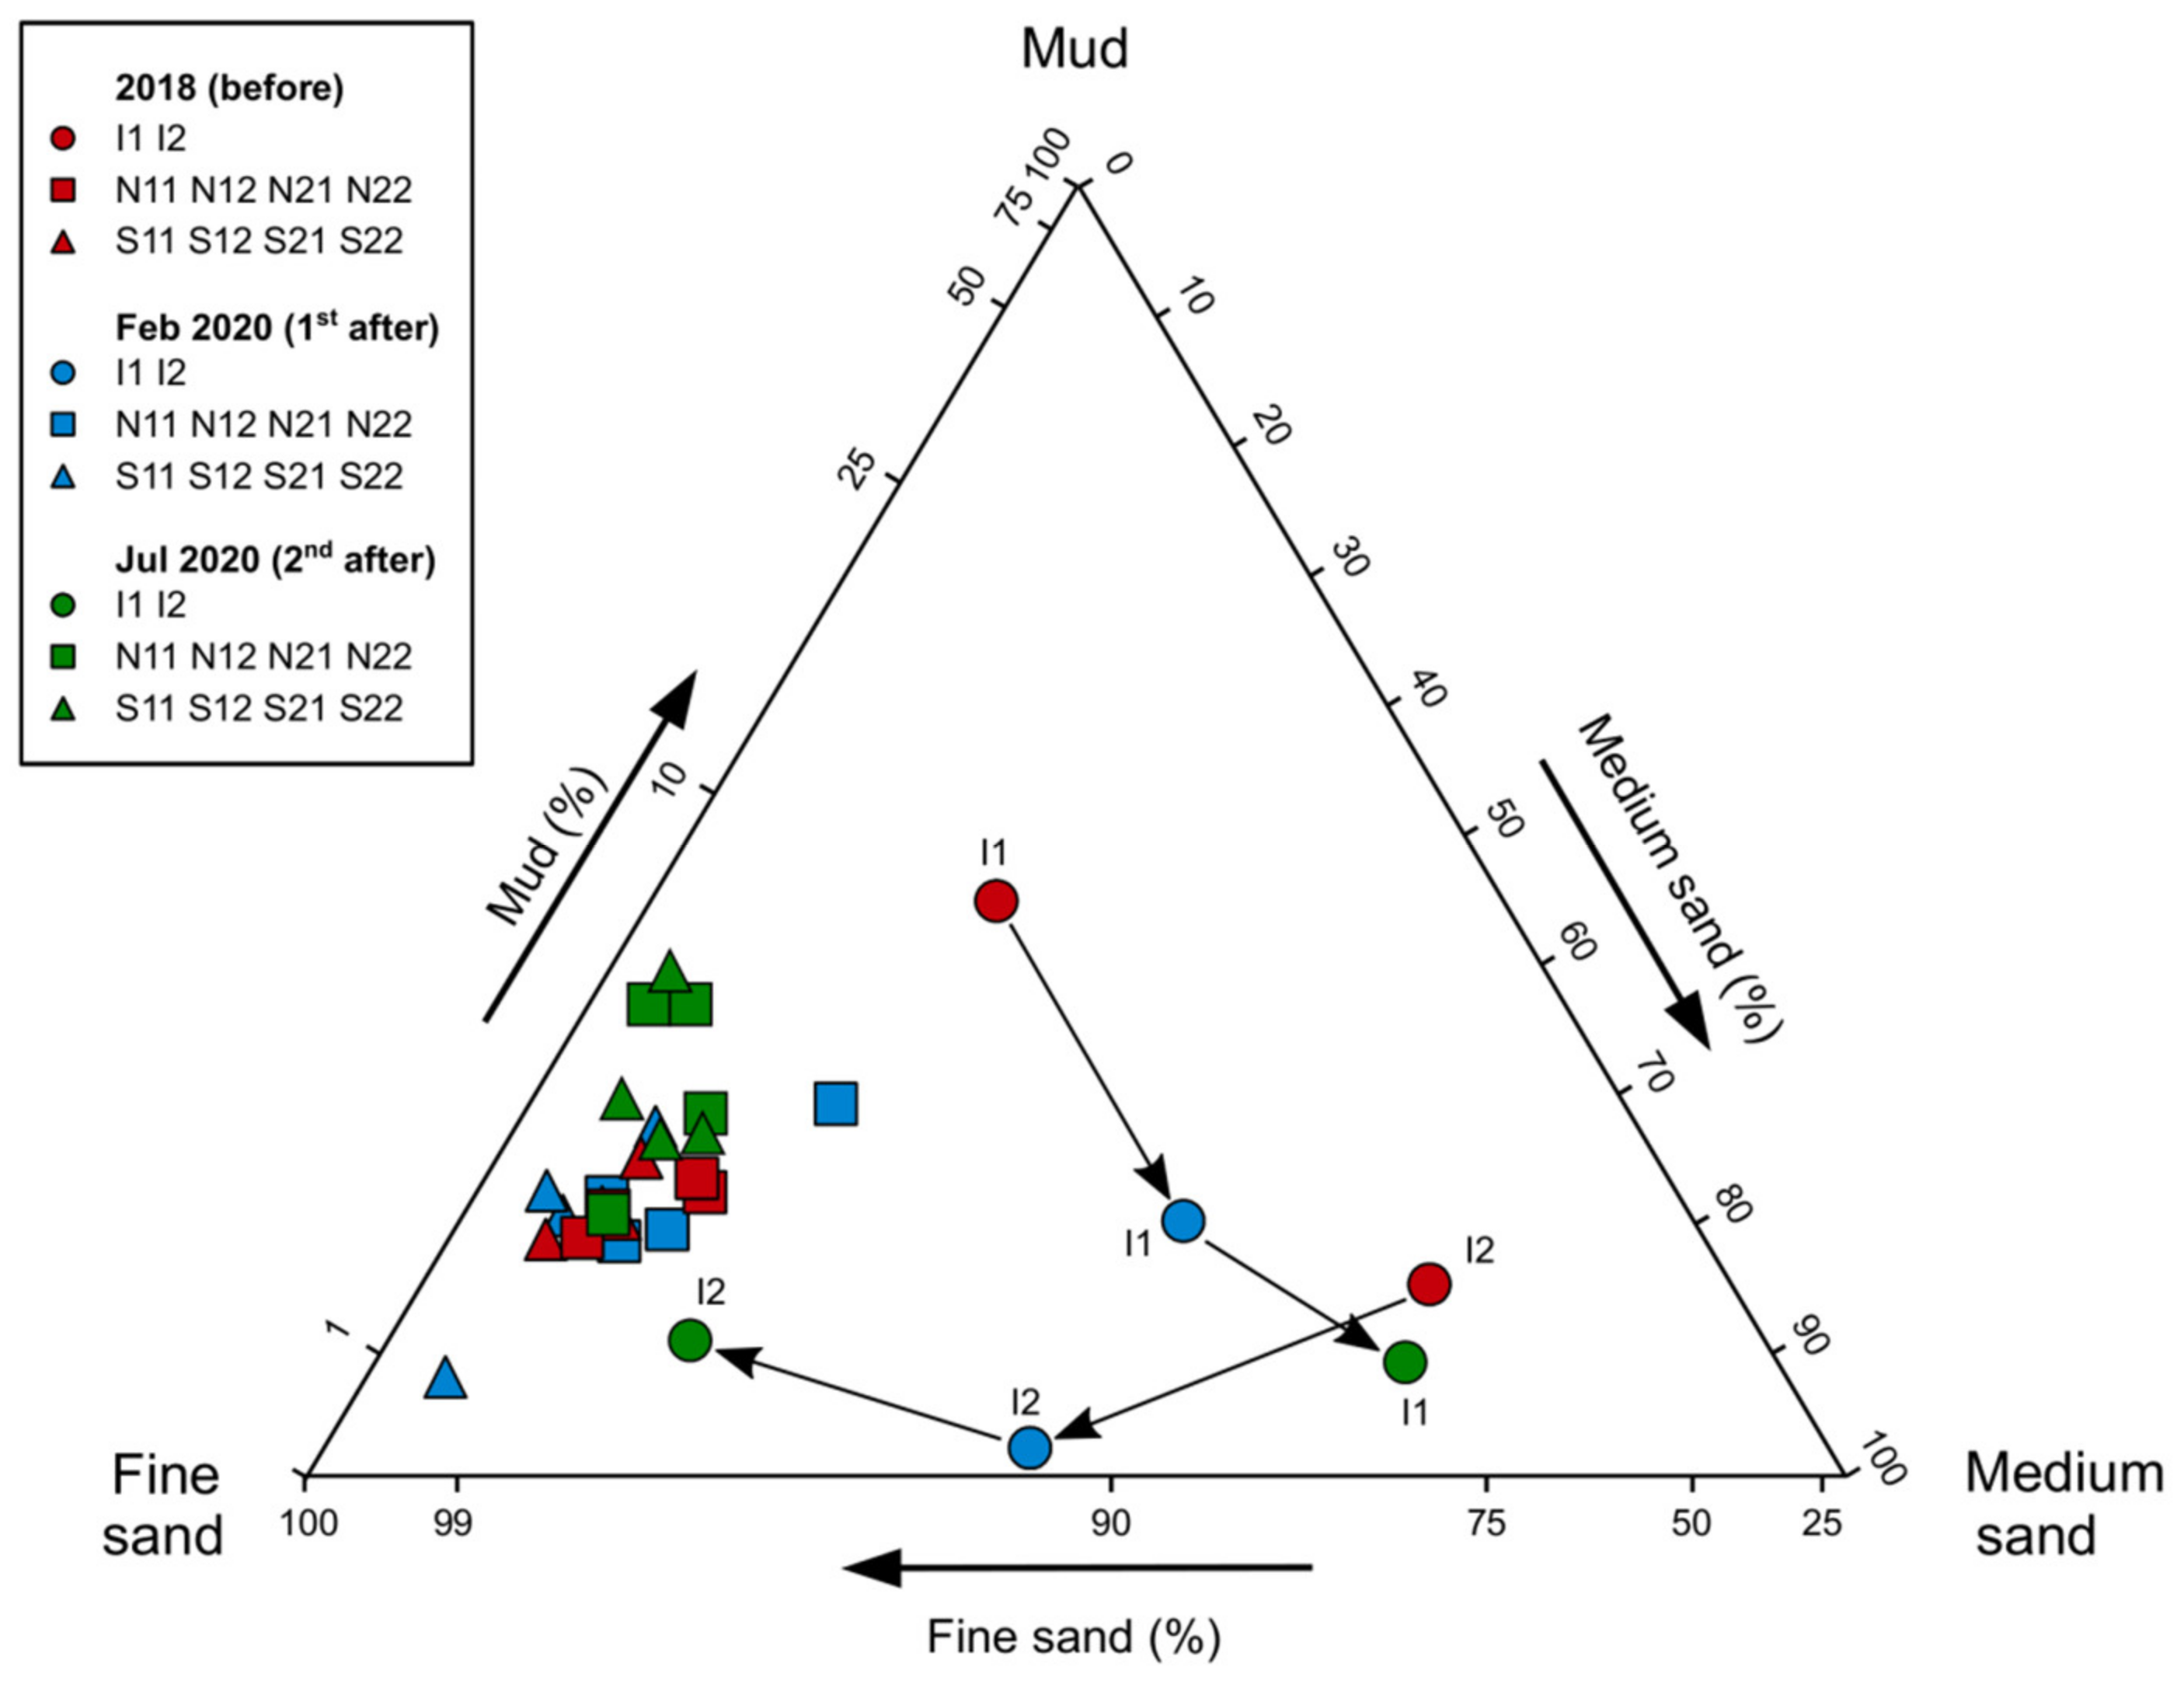
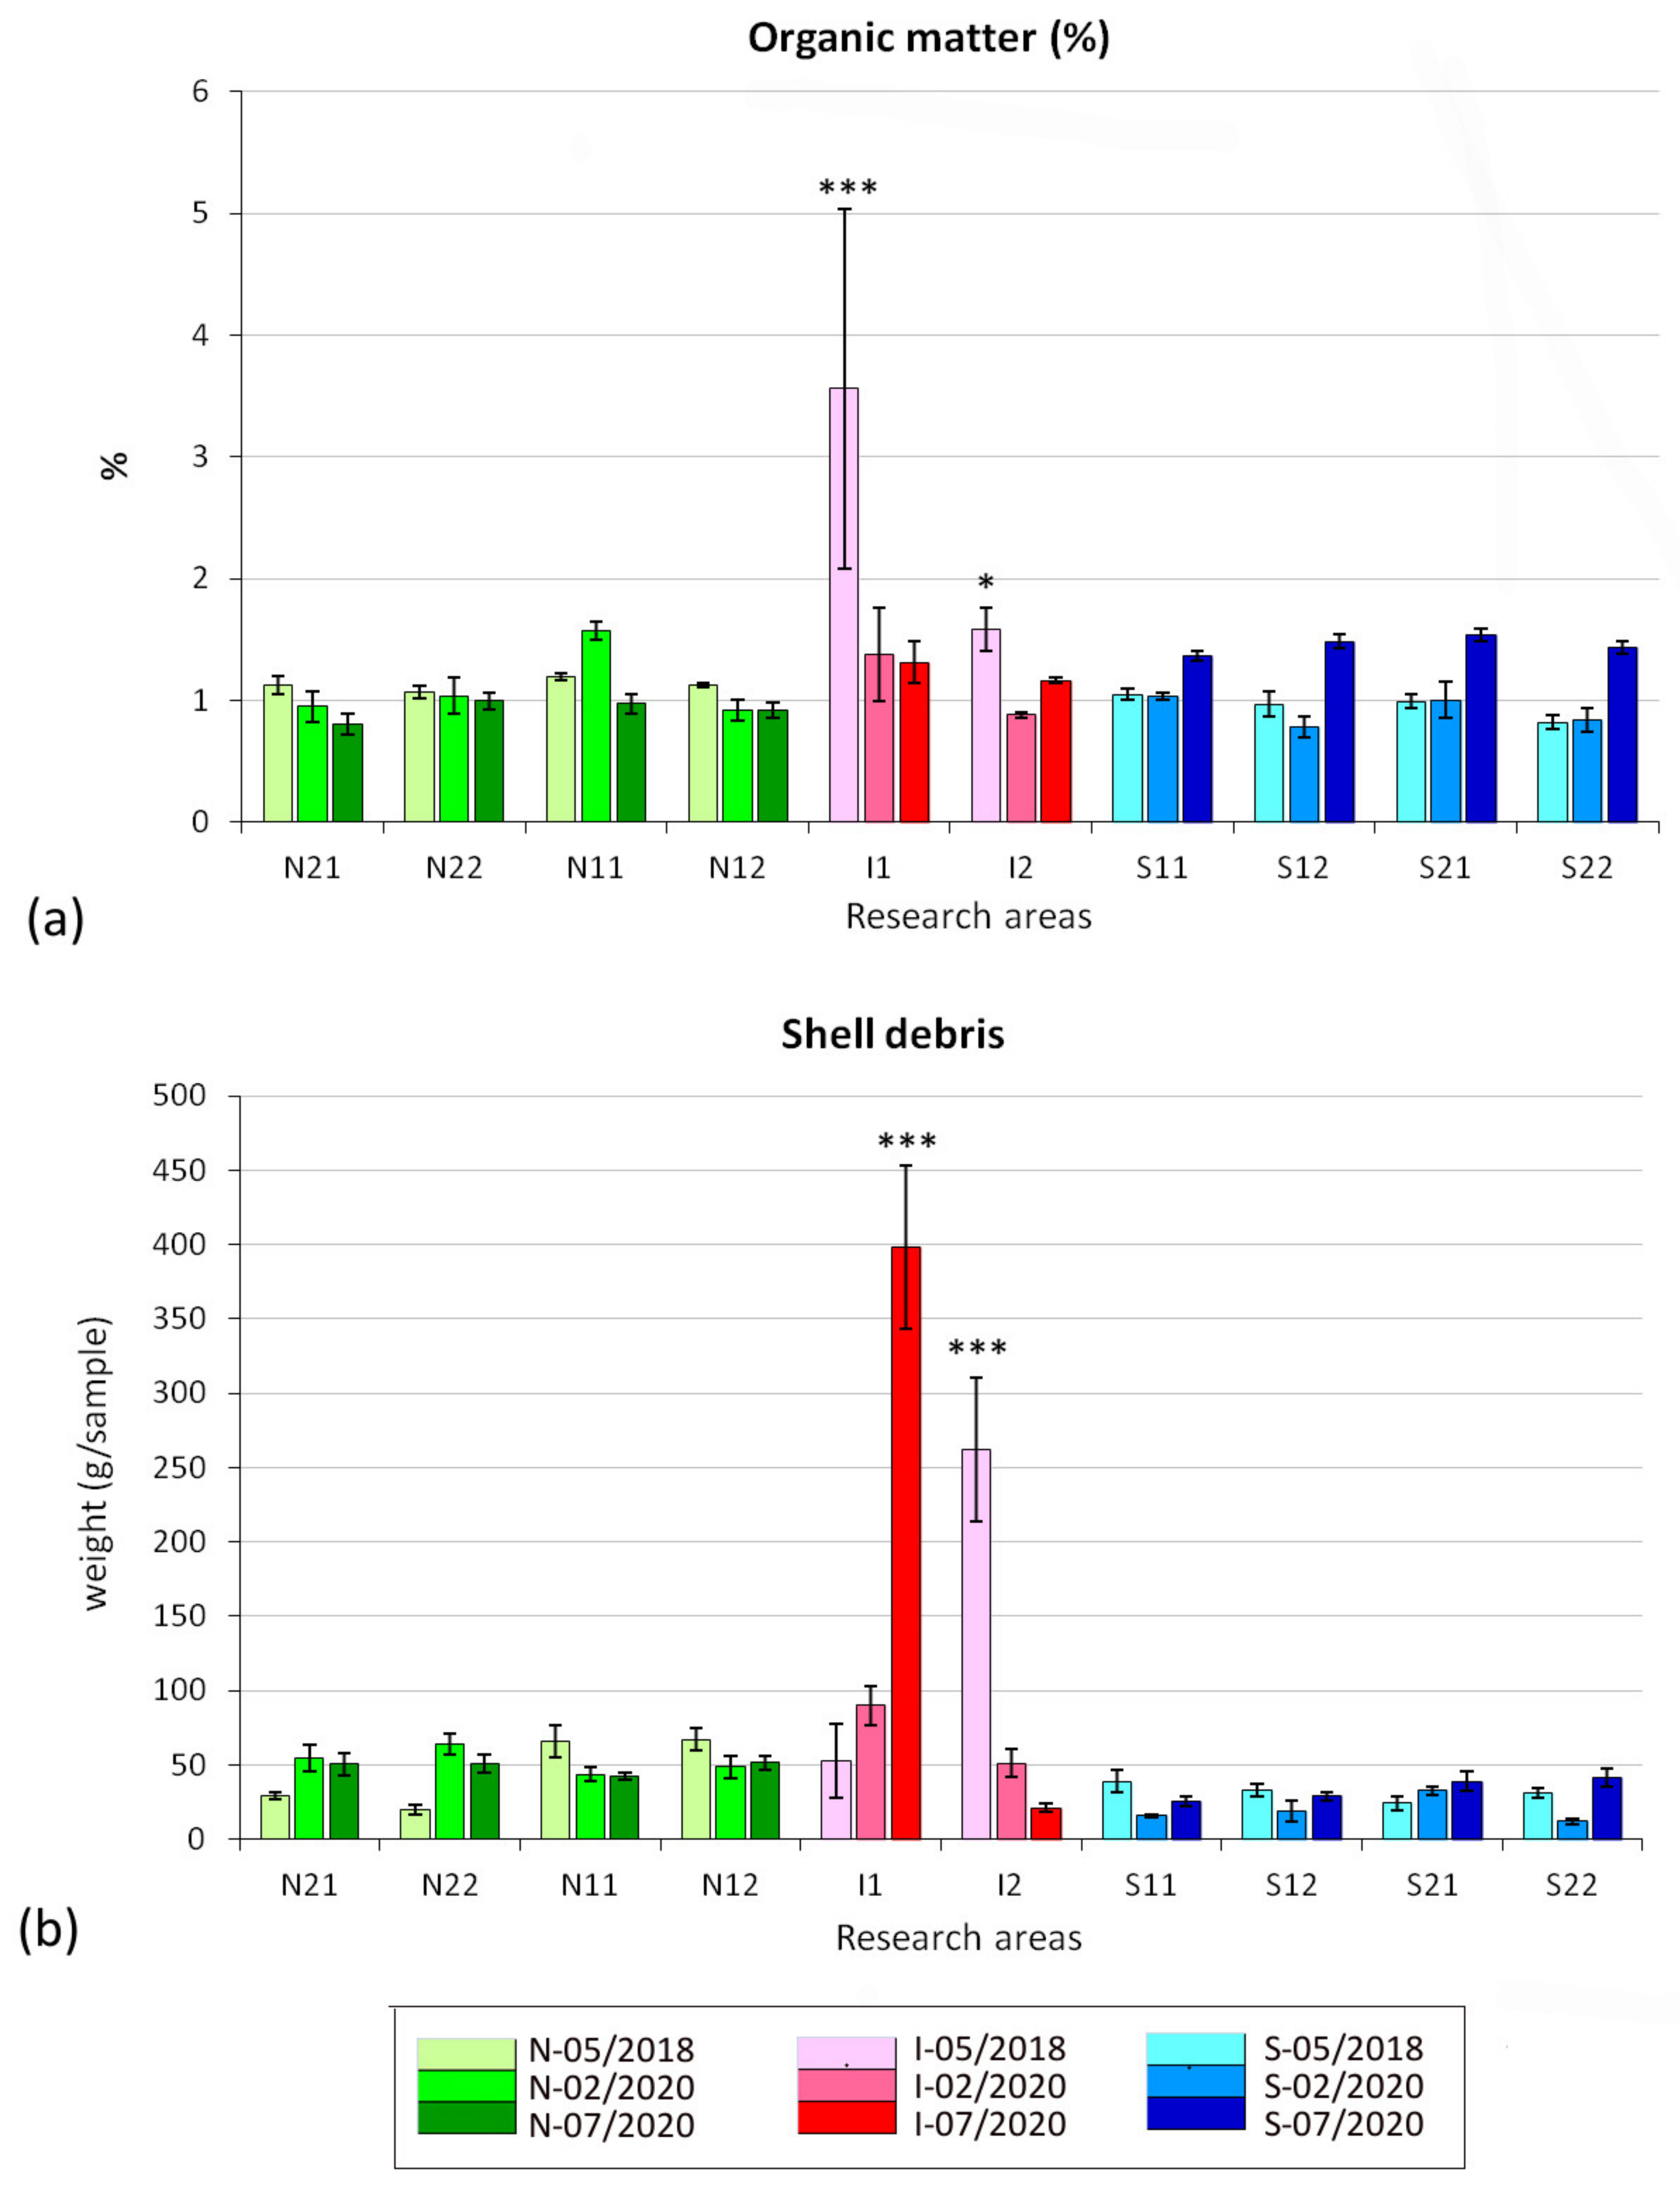
3.1. Effects on Sediment Features

Fine sand was the dominant fraction in all areas (from 70.98 ± 5.22% to 98.52 ± 0.29%), both before and after the ejectors plant activation. Data on sediment grain size composition throughout the research, showing trends in grain size changes in the impacted areas, are presented in a ternary diagram (Figure 5). In general, proportions of grain size fractions were almost stable in time in the control areas. Before the ejectors plant activation, the content of mud was, on average, significantly higher in both impacted areas (11.19 ± 5.22% in I1 and 5.34 ± 2.55% in I2), compared to the control ones (from 2.43 ± 0.12% to 3.55 ± 1.11%) (p = 0.0001 for I1; p = 0.0043 for I2). After the ejectors plant started operation, a trend in the decrease of the mud content was detected. Particularly, in the sediment removal area (I1), the mud content was drastically reduced in the first sampling date after the activation of the ejectors in comparison to the preactivation samples, and since then, no significant differences with controls were detected. In the disposal area (I2), the mud content decreased after the activation of ejectors, becoming similar to the controls (although still slightly different; p = 0.04).
Before the plant operation, the mean content of the medium sand fraction was significantly higher (p < 0.01) in both impacted areas (I1: 5.73 ± 1.45; I2: 23.68 ± 5.07) in comparison to the control ones (ranging from 0.85 ± 0.13% to 2.26 ± 0.49%). However, after the plant activation, it showed a contrasting trend in the two impacted areas: it was increasing at the sediment removal area (I1, up to 20.54 ± 1.68%), while it was decreasing at the sediment discharge area (I2: down to 2.69 ± 0.38%). The mean proportion of fine sand, being complementary to that of mud and medium sand, shows an intermediate trend. However, the only relevant significant difference (p = 0.0001) was a smaller proportion of fine sand in the discharge area (I2: 70.98 ± 5.22%) compared to controls (from 94.46 ± 0.55% to 96.80 ± 0.30%), only before the activation of the plant. Ultimately, considering the three particle size fractions together, following the activation of the plant, in the sediment removal area, the mud decreased, and the medium sand increased, while the discharge area, initially rich in medium sand, progressively conformed to controls.
The content of organic matter in the sediment was also affected by the ejectors plant. Before the plant activation, the content of organic matter was significantly higher in both putatively impacted areas (3.56 ± 1.48% in I1 and 1.58 ± 0.18% in I2) compared to control ones (from 0.97 ± 0.10% to 1.19 ± 0.03%) (p = 0.0002 for I1; p = 0.0152 for I2) (Figure 6a). After the plant activation, the mean content of organic matter significantly decreased (p = 0.0162) at the sediment removal area (I1: in February 2020, 1.37 ± 0.38% and in July 2020, 1.31 ± 0.17%), and no significant differences were found between impacted areas and controls (in February 2020, from 0.78 ± 0.09% to 1.57 ± 0.08%; in July 2020, from 0.81 ± 0.08% to 1.54 ± 0.05%).
The content of shell debris in the sediment was affected by plant operation: Before the activation, the mean content of shell debris was very similar between the sediment removal (I1: 52.71 ± 24.57 g sample−1) and control areas (from 19.45 ± 3.28 to 66.95 ± 7.36 g sample−1), while it was significantly higher (p = 0.0015) in the discharge area (I2: 261.92 ± 48.66 g sample−1), compared to the control ones (Figure 6b). After the plant activation, there was an increase of shell debris content in the sediment removal area (I1) and a simultaneous decrease in the discharge area (I2). In fact, one year after the start of plant operation (July 2020), the content of shell debris was significantly higher (p = 0.0001) in the sediment removal area (I1: 398.25 ± 54.60 g sample−1) compared to the control ones (from 25.51 ± 3.7 to 51.56 ± 4.77 g sample−1). Large accumulation of empty bivalve shells in the area within about 1 m from each ejector was also detected during the underwater field observation (Figure 7). Conversely, in the discharge area (I2), the shell debris content became similar (p > 0.05), on average, to that of the controls.

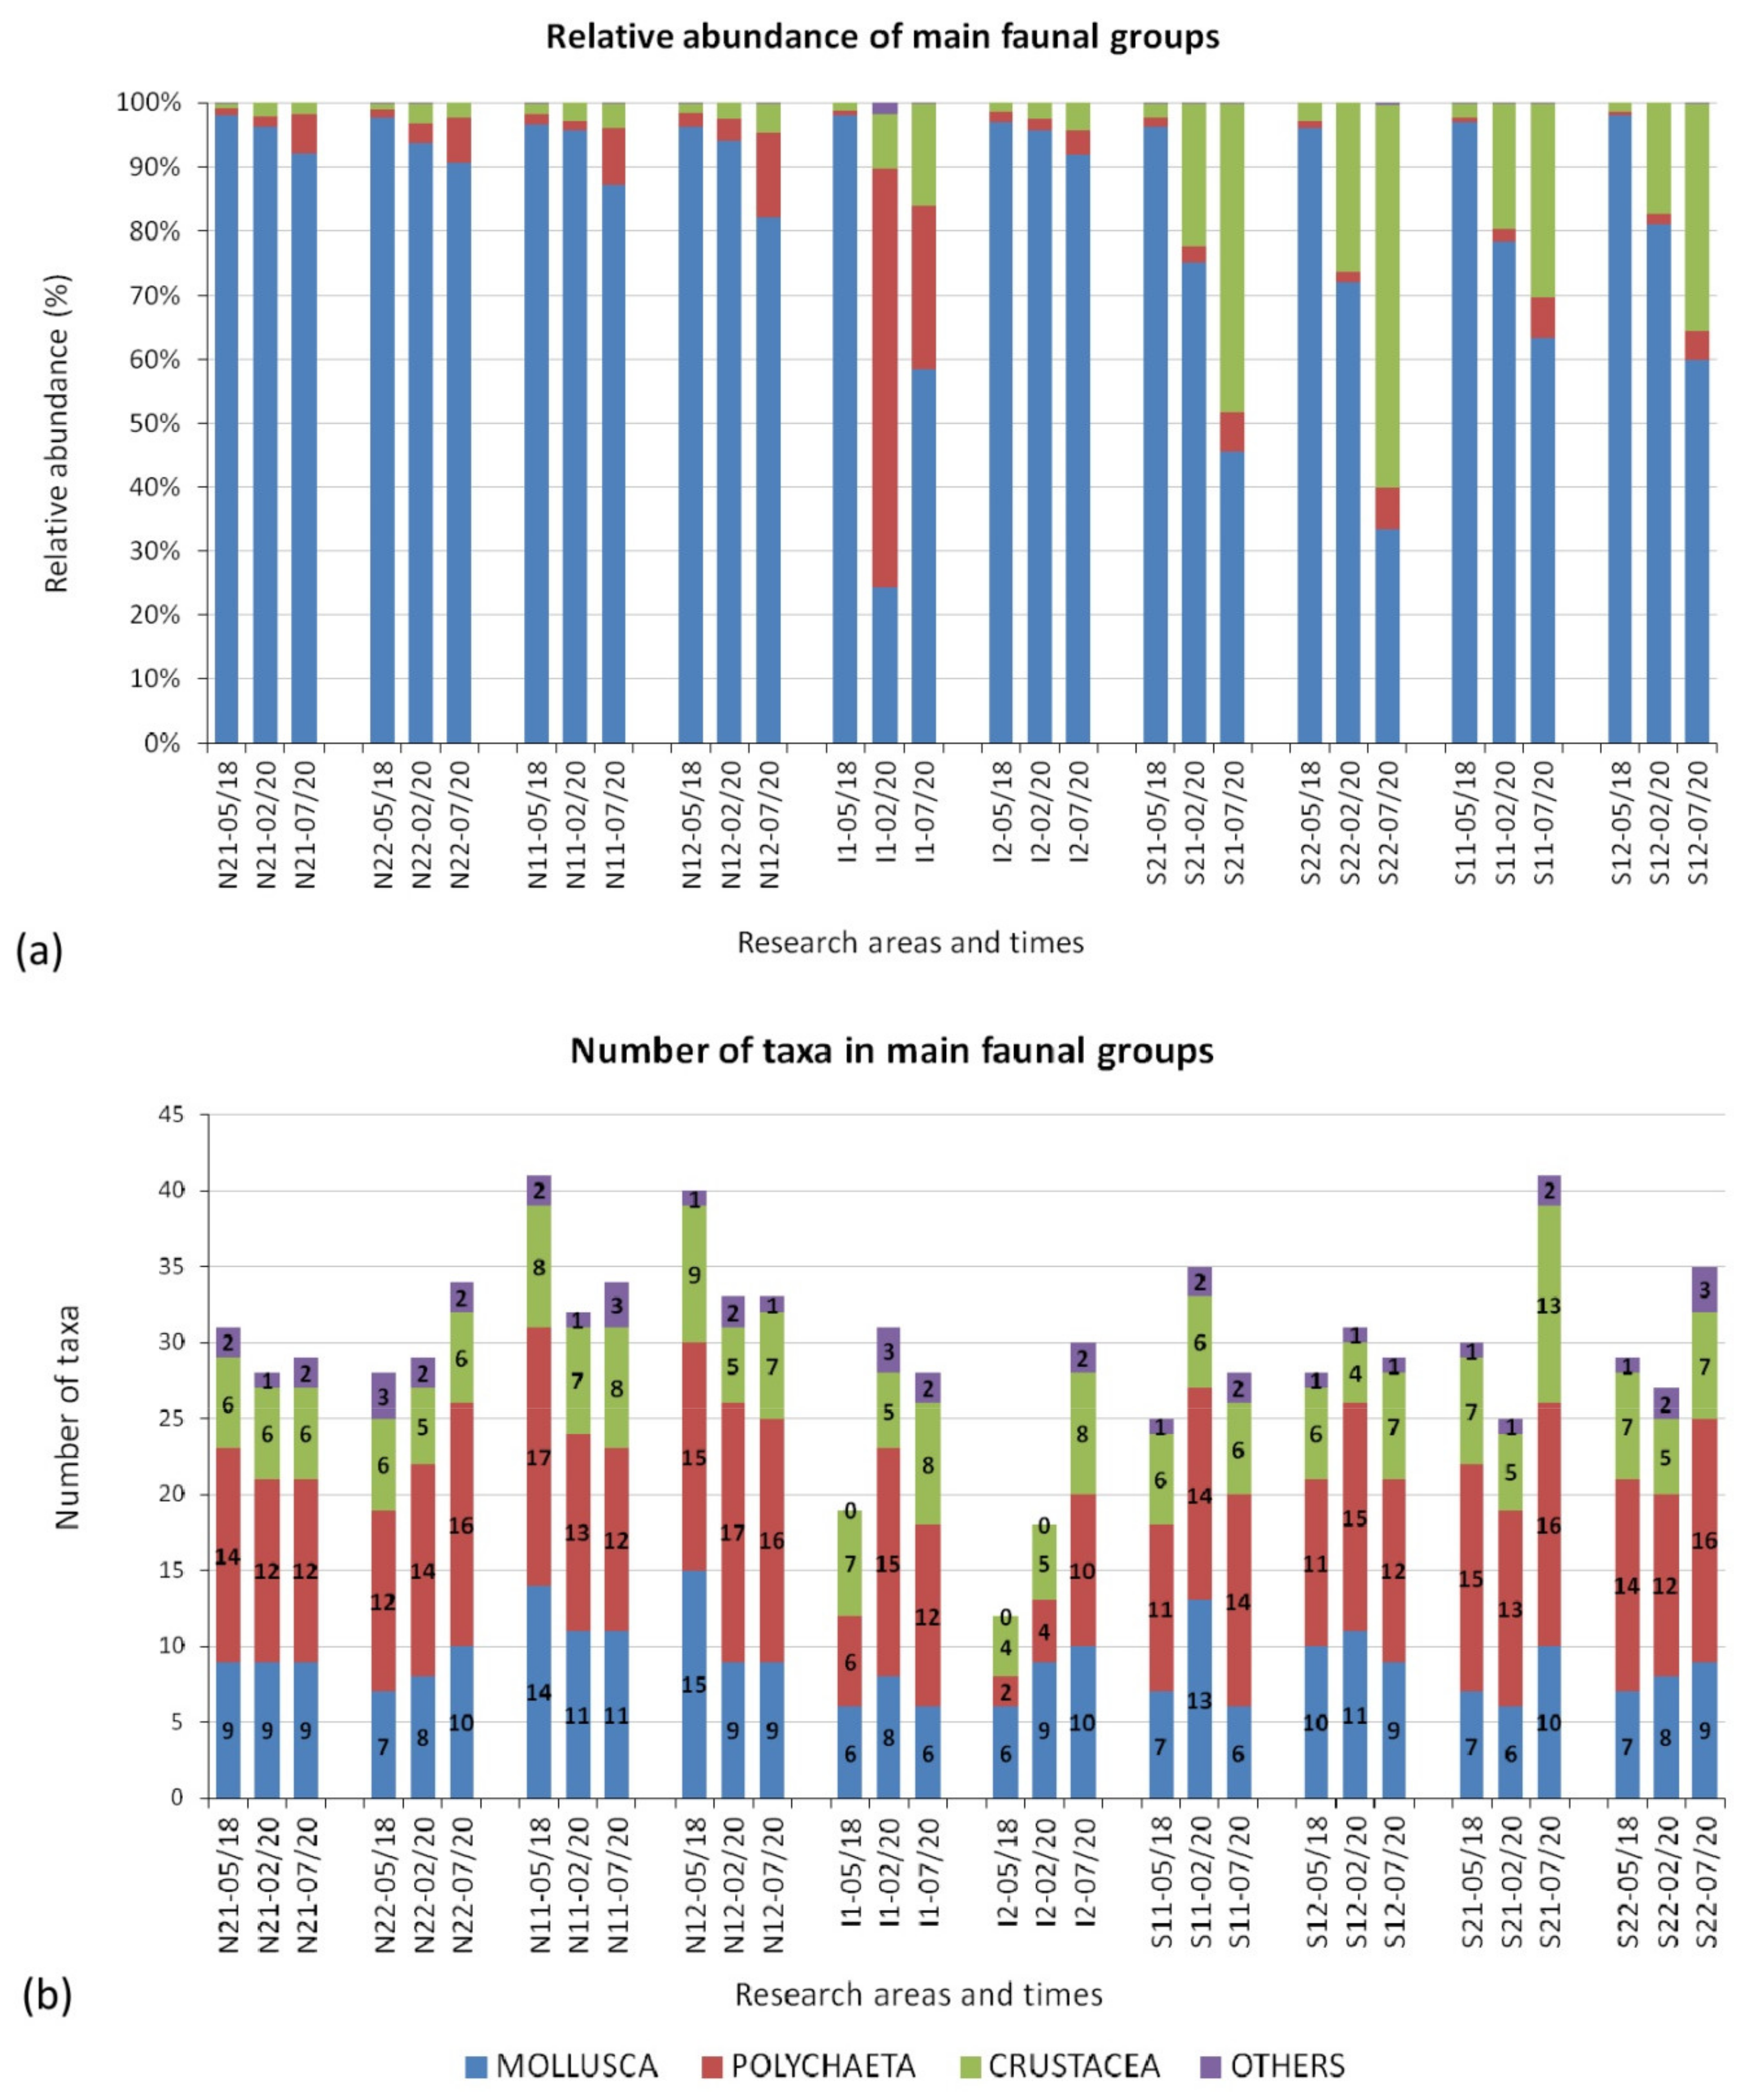
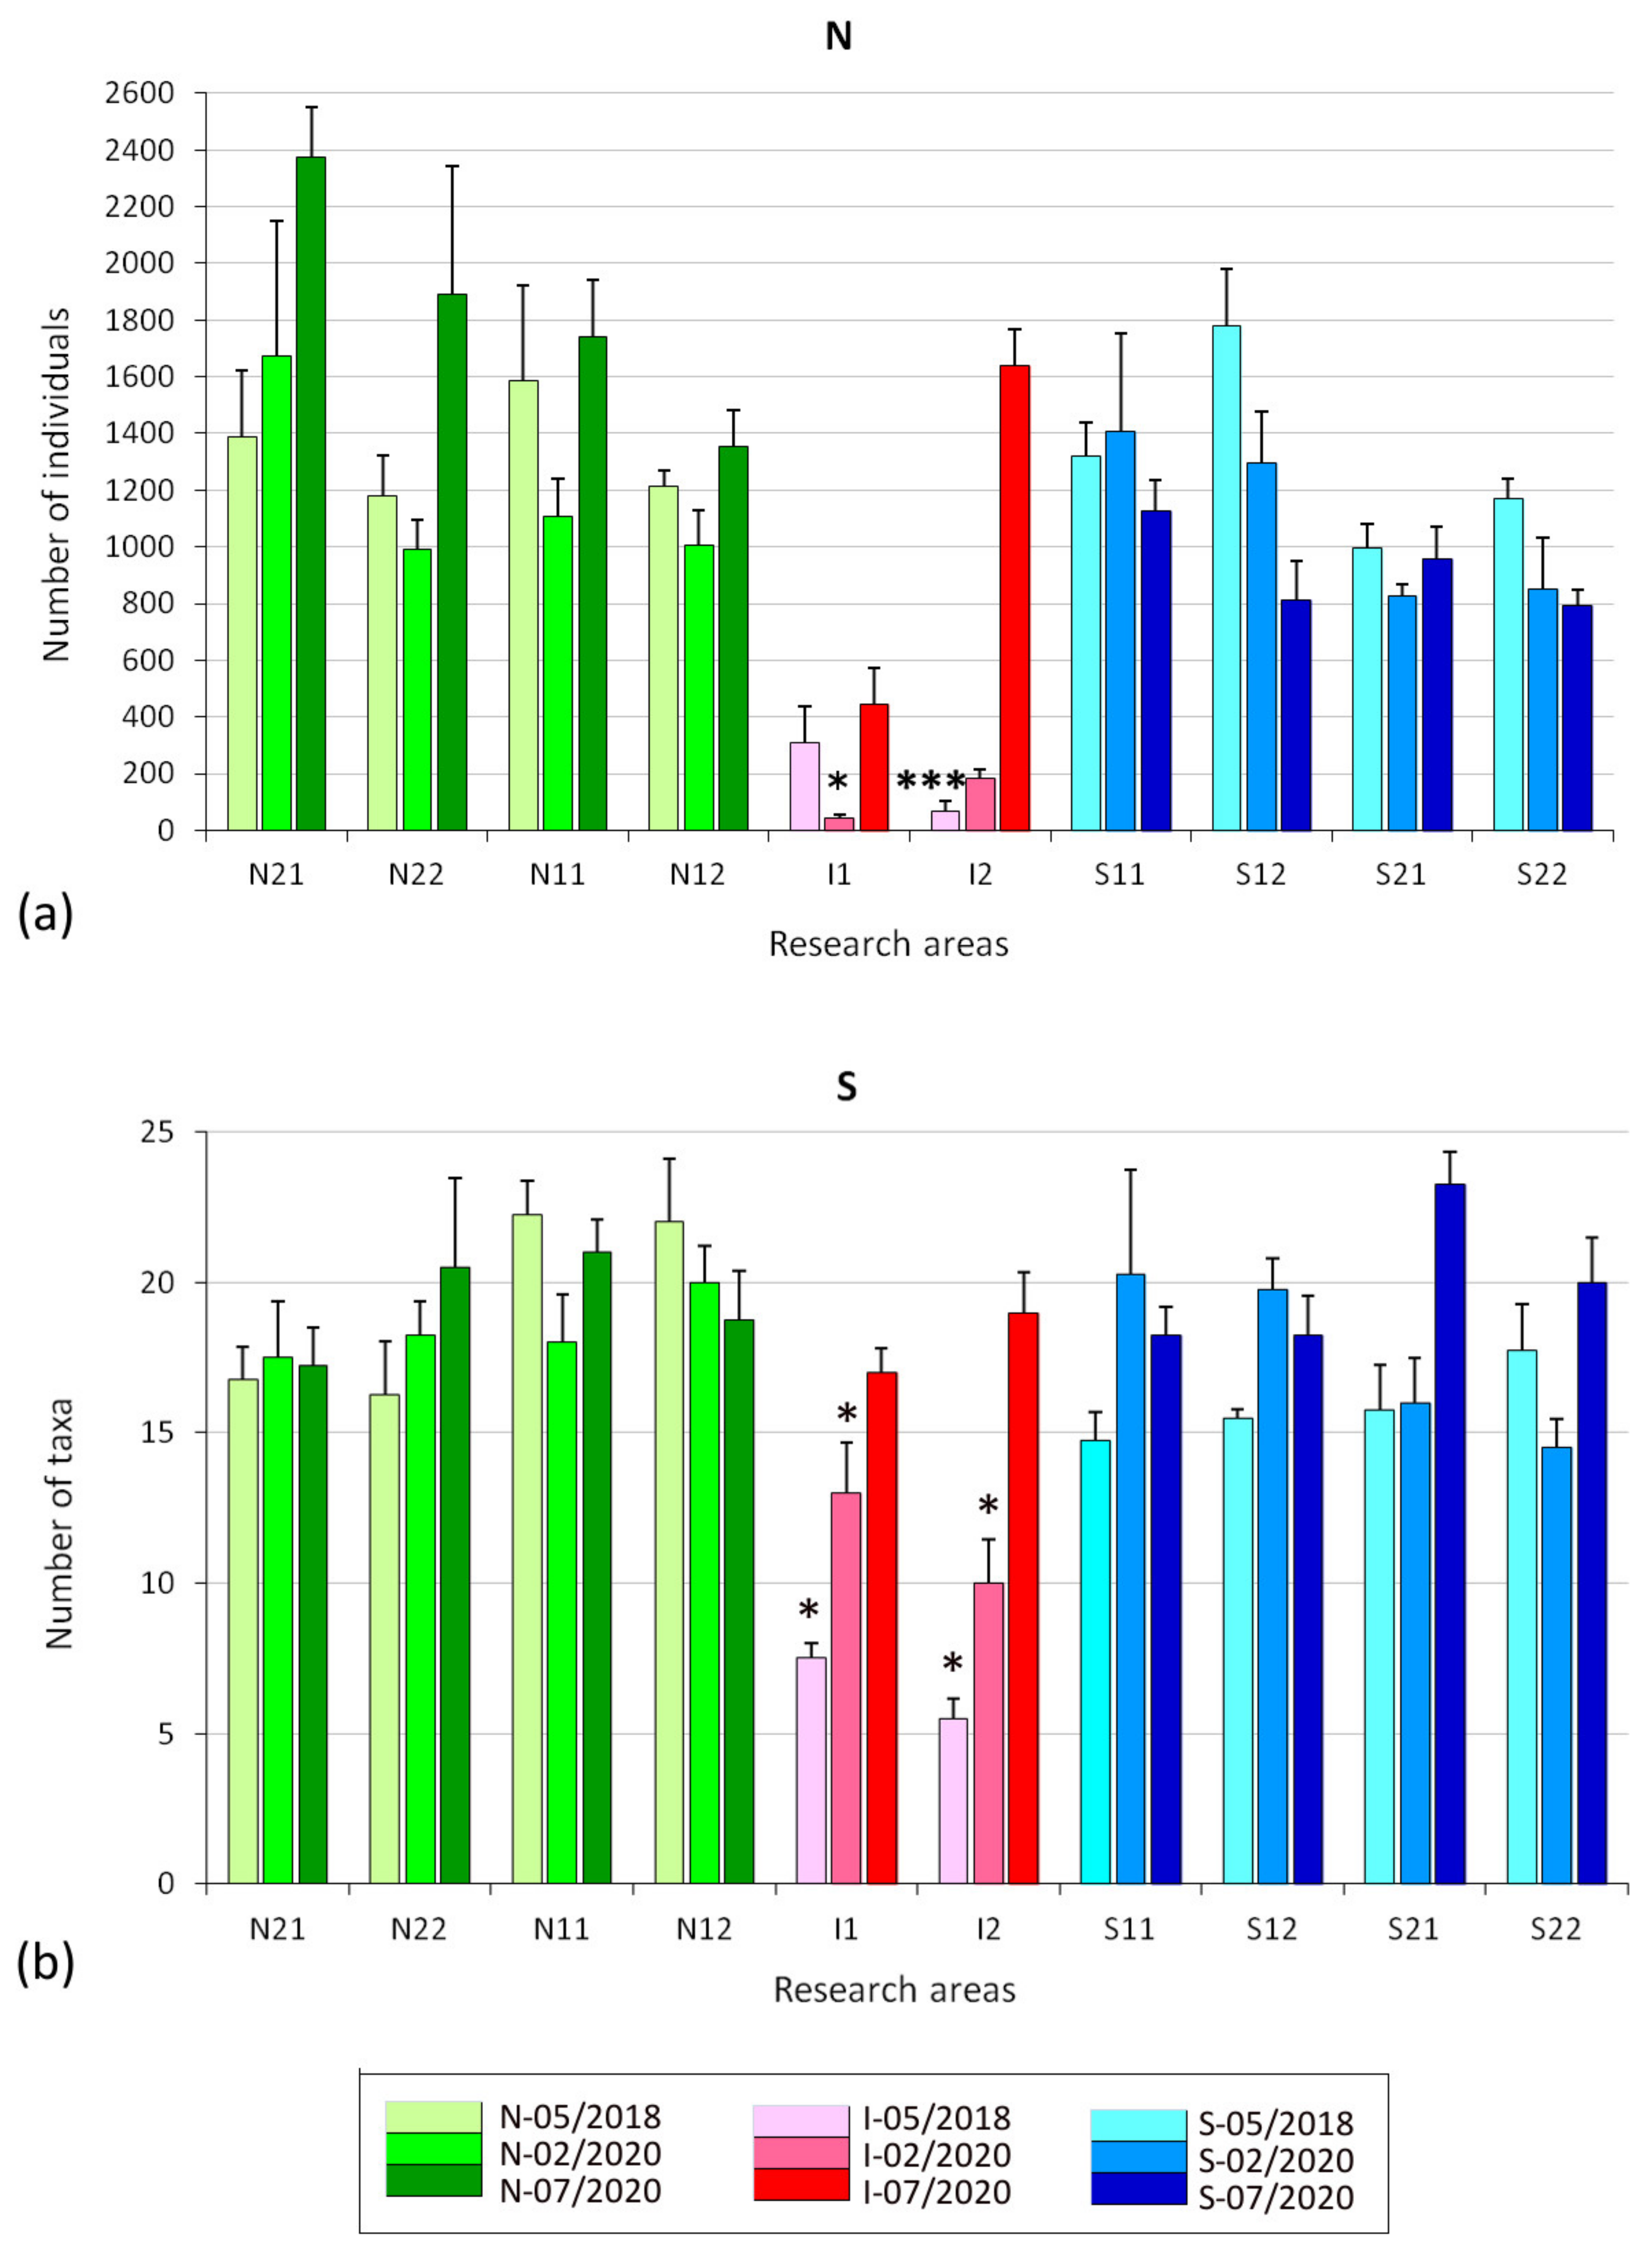
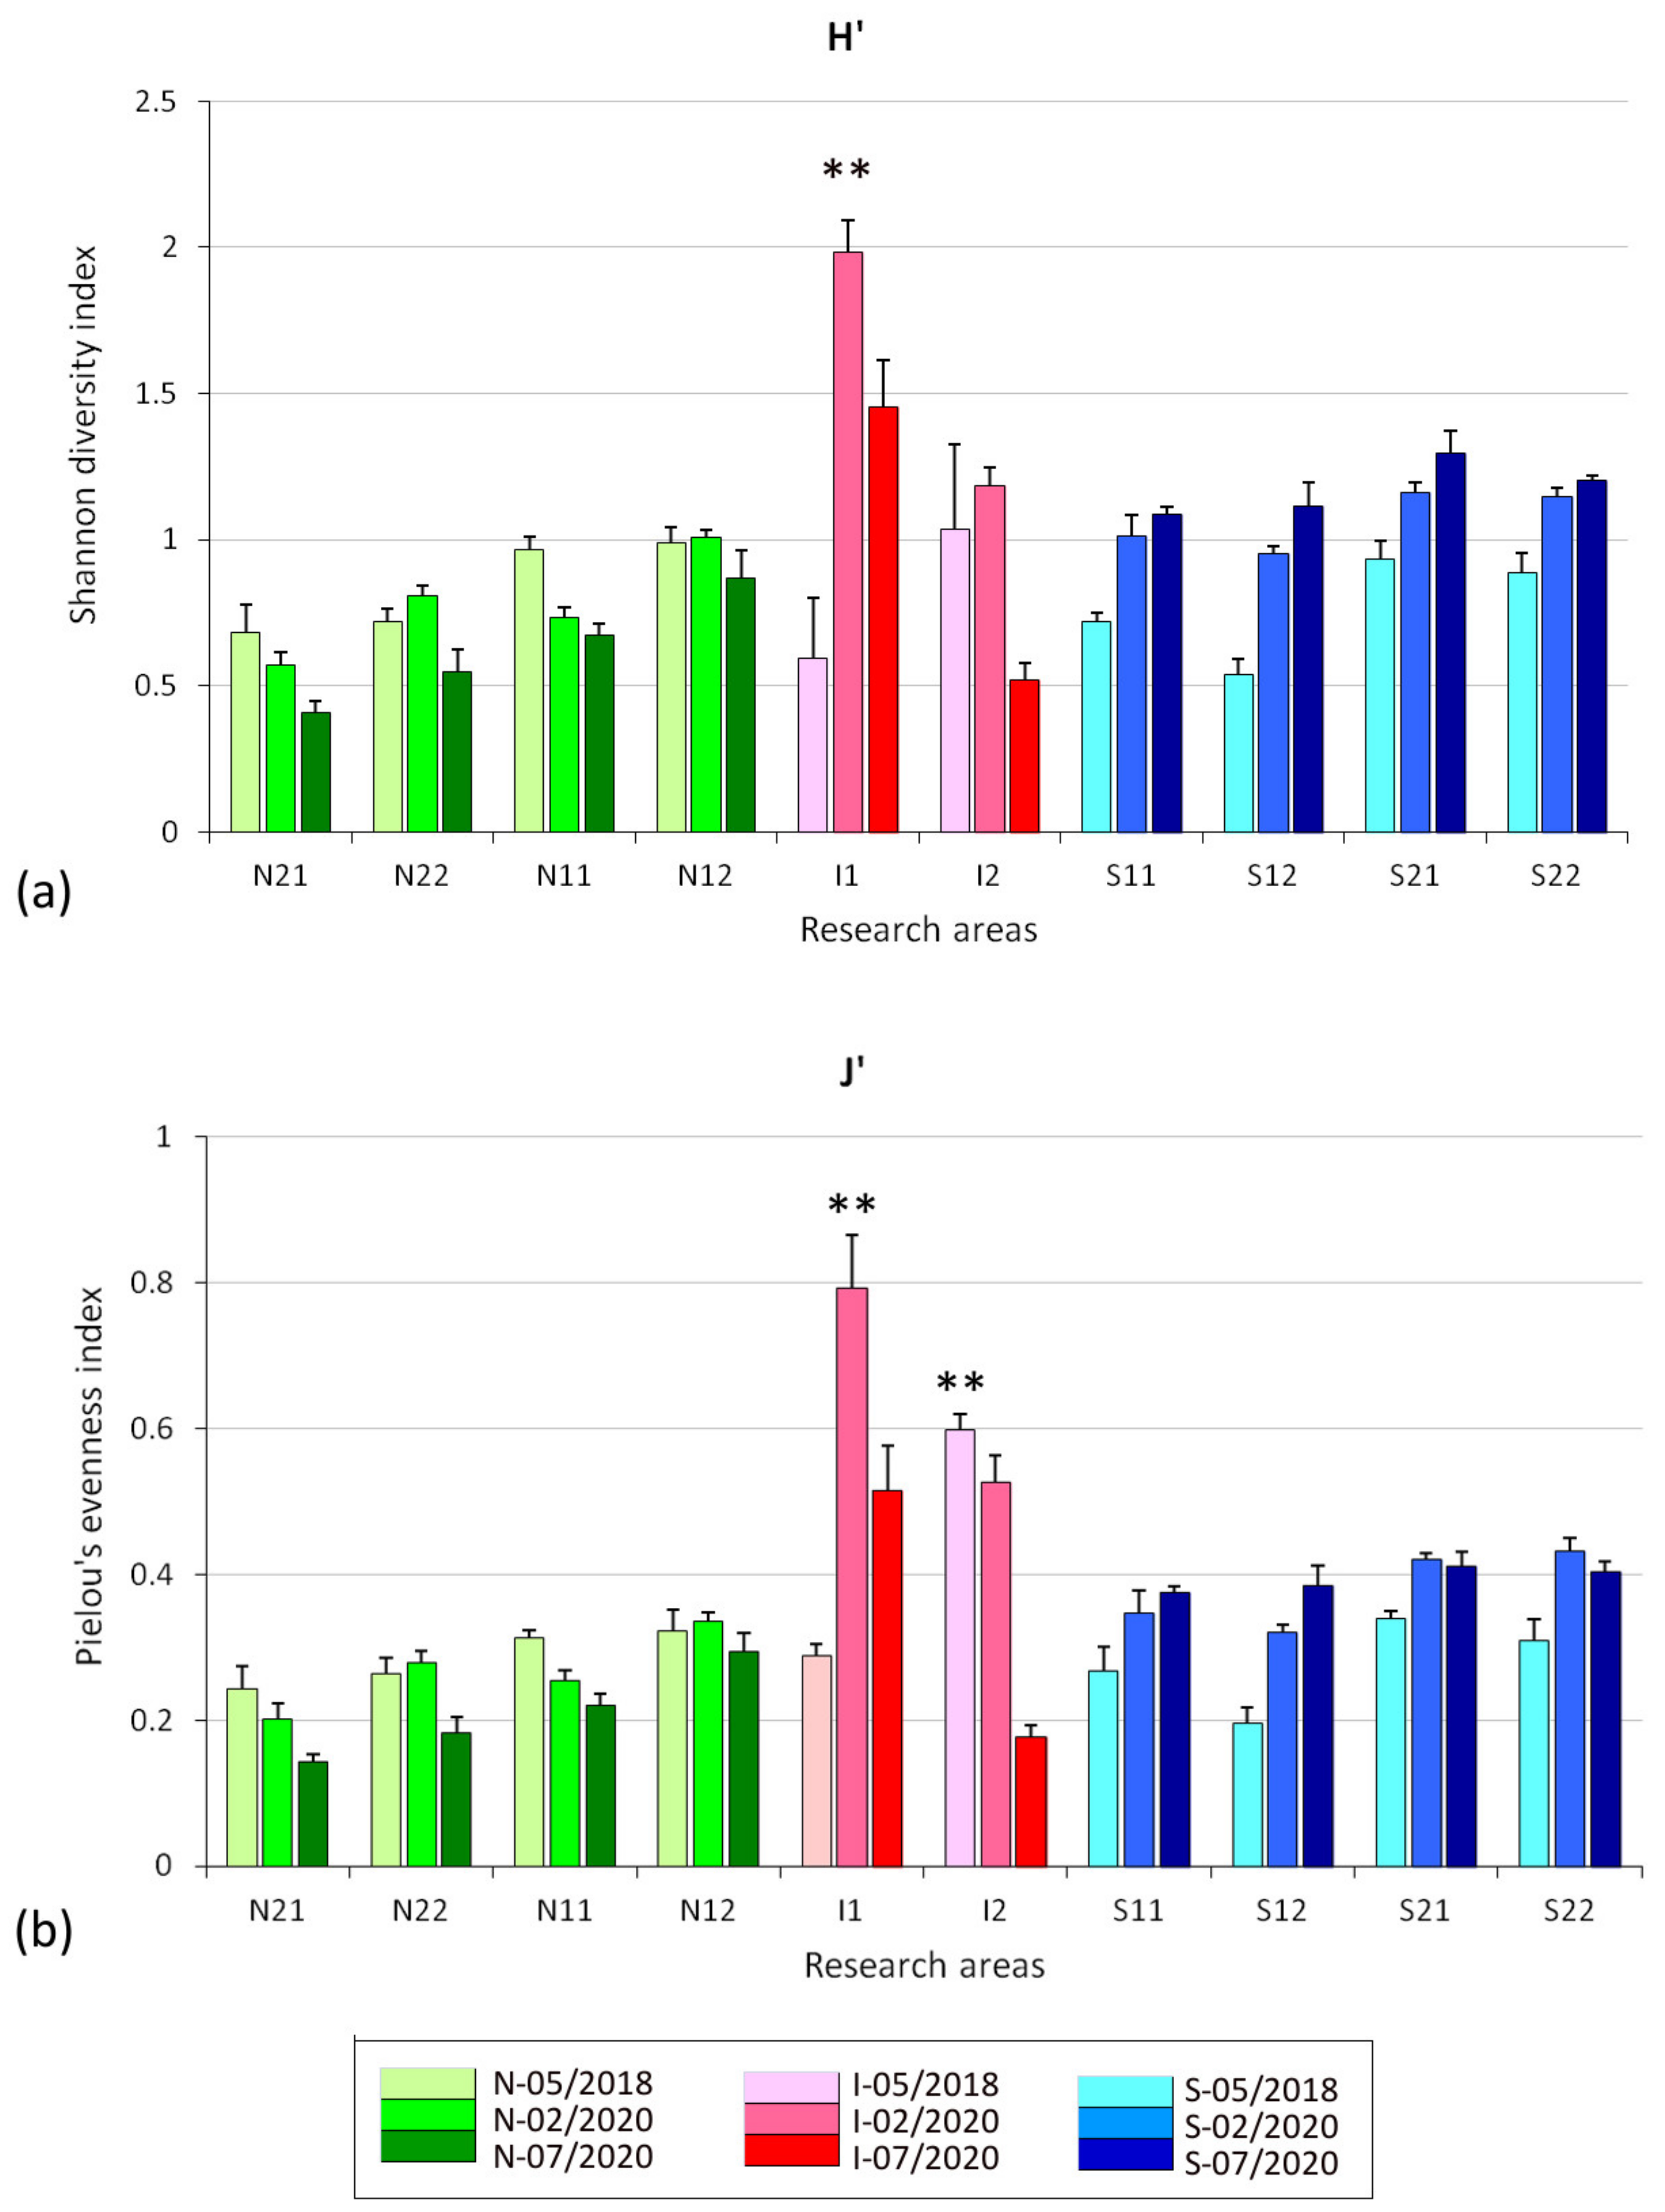
3.2. Effects on Benthic Assemblages

A total of 134,094 specimens of macrofaunal invertebrates, belonging to 114 taxa and to the phyla Annelida (Polychaeta 55 taxa and Oligochaeta 1 taxon), Mollusca (32), Arthropoda (21), Nemertea (1), Platyhelminthes (1), Echinodermata (1), Phoronida (1), and Cnidaria (1), were found in the collected samples. Polychaetes, crustaceans, and mollusks were the most abundant groups, accounting for 98–100% of the total macrofauna. Benthic communities in the study area were characterized by three bivalves, both regarding their abundance and frequency: Lentidium mediterraneum (O. G. Costa, 1830) (present in 119 out of 120 samples), Chamelea gallina (Linnaeus, 1758) (118/120 samples), and Donax semistriatus Poli, 1795 (111/120 samples). Very frequent were also the crustacean Apseudopsis mediterraneus (Bacescu, 1961) (112/120 samples), the gastropod Tritia neritea (Linnaeus, 1758) (95/120 samples), and the annelid polychaete Prionospio caspersi Laubier, 1962 (92/120). Mollusks were the most abundant macrobenthic group in almost all areas and times (constituting up to 98% of the total macrofaunal abundance) except at the sediment removal area (I1) in the first sampling time after plant activation, when polychaetes were the most abundant (65% of the total macrofaunal abundance), and at two control areas 1200 m south of the impact site (S21 and S22) in the second sampling time after activation of the plant, when crustaceans prevailed (48% and 60% of the total macrofaunal abundance, respectively) (Figure 8a). Polychaetes, crustaceans, and mollusks were also the most species-rich groups, with polychaetes being the most diverse group in all sampling periods and areas, except at the sediment discharge area (I2) where mollusks were the most diverse group throughout the research (Figure 8b).
Macrofaunal abundance varied significantly between locations and sampling times (for the term Ti(BA)xLo(CI), p < 0.01). Overall, the mean abundance of individuals at the sediment removal area (I1) remained significantly lower than in controls (p = 0.0277); however, a significant increase from the first (43 ± 13 ind. sample−1) to the second (445 ± 128 ind. sample−1) sampling time after plant activation was observed (p = 0.0231). In the same time interval, a larger increase of the abundance of individuals in the sediment discharge area (I2: from 184 ± 59 to 1637 ± 130 ind. sample−1) was observed (p = 0.0001), making it overall no different from the controls (Figure 9a).
Species richness also varied significantly between locations and sampling times (for the term Ti(BA)xLo(CI), p < 0.05). Overall, the mean species richness at the sediment removal area (I1) was significantly lower than in controls during all of the study period (p = 0.0297); however, an increase from before plant activation (7.5 ± 0.5 taxa in May 2018) to the first (13.0 ± 1.7 taxa in February 2020) and to the second (17.0 ± 0.8 taxa in July 2020) sampling during plant operation periods was observed (p < 0.05). A similar trend was observed at the sediment discharge area (I2: 5.5 ± 0.6 taxa in May 2018, 10.0 ± 1.5 taxa in February 2020, 19.0 ± 1.4 taxa in July 2020), where at the last sampling date, species richness was quite similar to the mean of the controls (19.7 ± 3.3 taxa in July 2020) (Figure 9b). The increase in species richness was mostly due to the increase of polychaete richness and, to a smaller extent, to the increase of mollusk and crustacean richness (Figure 8b). Both Shannon diversity and Pielou evenness indices varied significantly between locations and sampling times (p < 0.05). In the preactivation period, values of Shannon diversity index in both impacted areas (0.59 ± 0.21 at I1 and 1.03 ± 0.29 at I2) were similar (p > 0.05) to those observed in the control ones (from 0.53 ± 0.05 to 0.99 ± 0.05). In the first sampling after the activation of the plant, species diversity at the sediment removal area (I1) was significantly higher (p < 0.01) than at the control areas; however, this was a temporary increase, which was not observed in the second sampling. Conversely, in the sediment discharge area (I2), the diversity remained similar to controls (p > 0.05) even after the plant was activated (Figure 10a). Pielou evenness index at the sediment removal area (I1) followed the same trend of the Shannon index, with a temporary but significant increase (p < 0.01), compared to the controls, in the first sampling after plant activation. On the contrary, in the sediment discharge area (I2), species evenness was significantly higher (p < 0.01) than in the controls in the preactivation period, but not in the two sampling times after plant activation (Figure 10b).

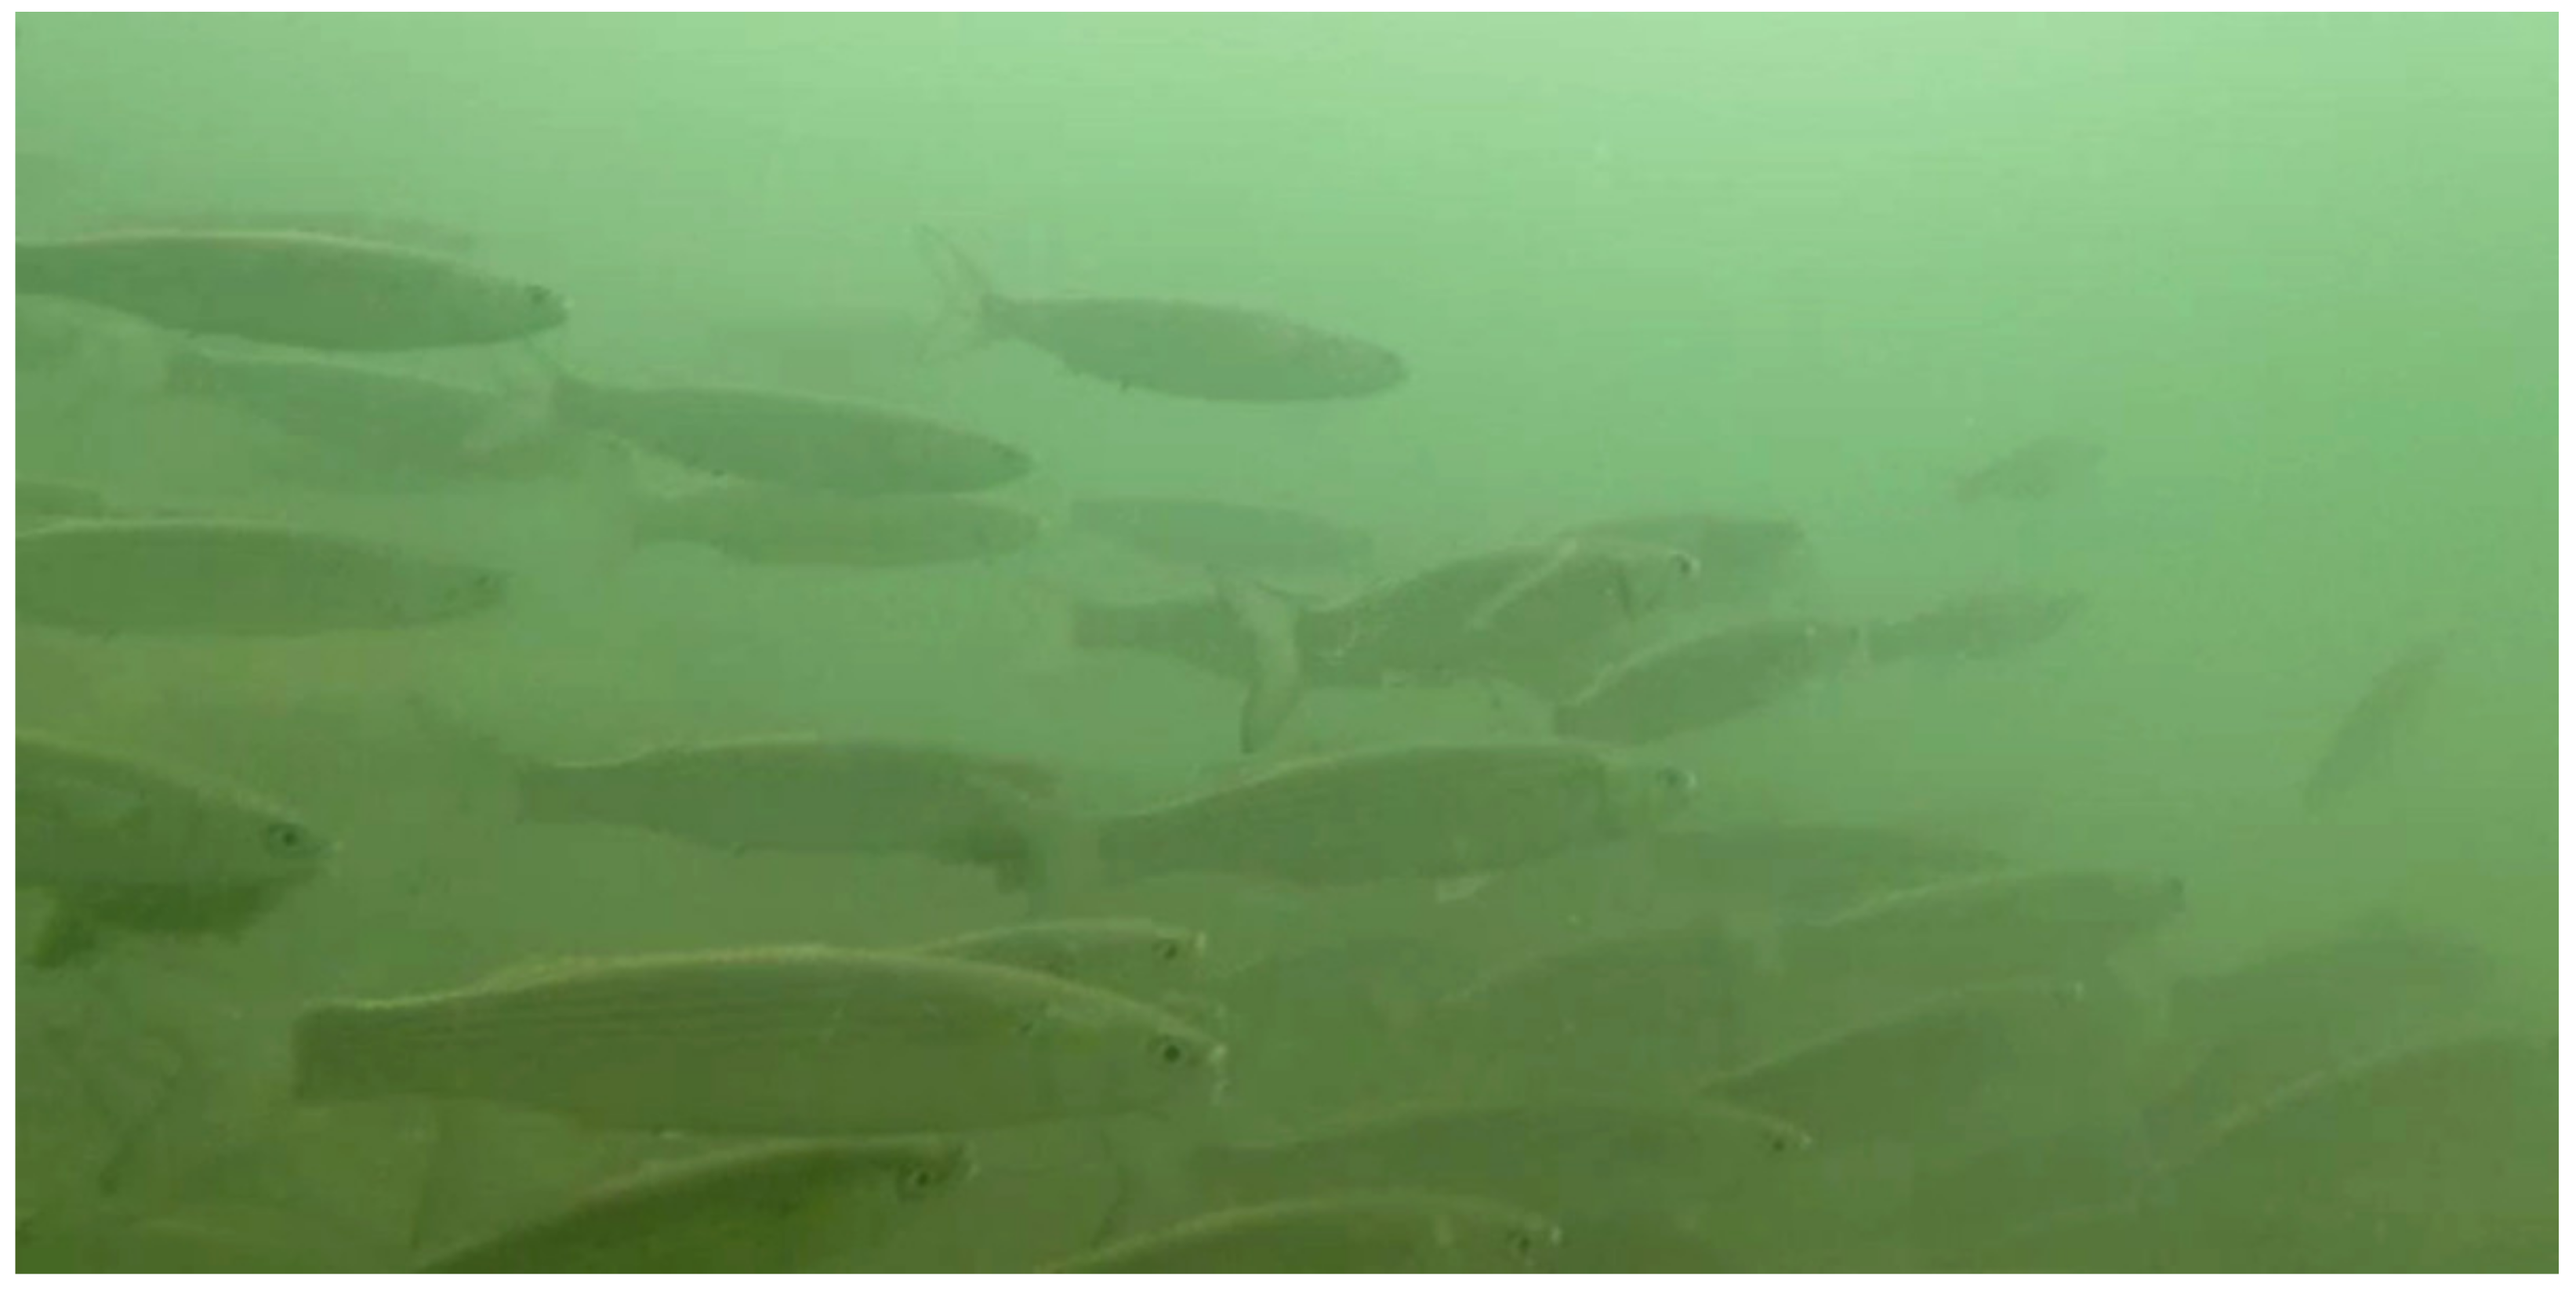
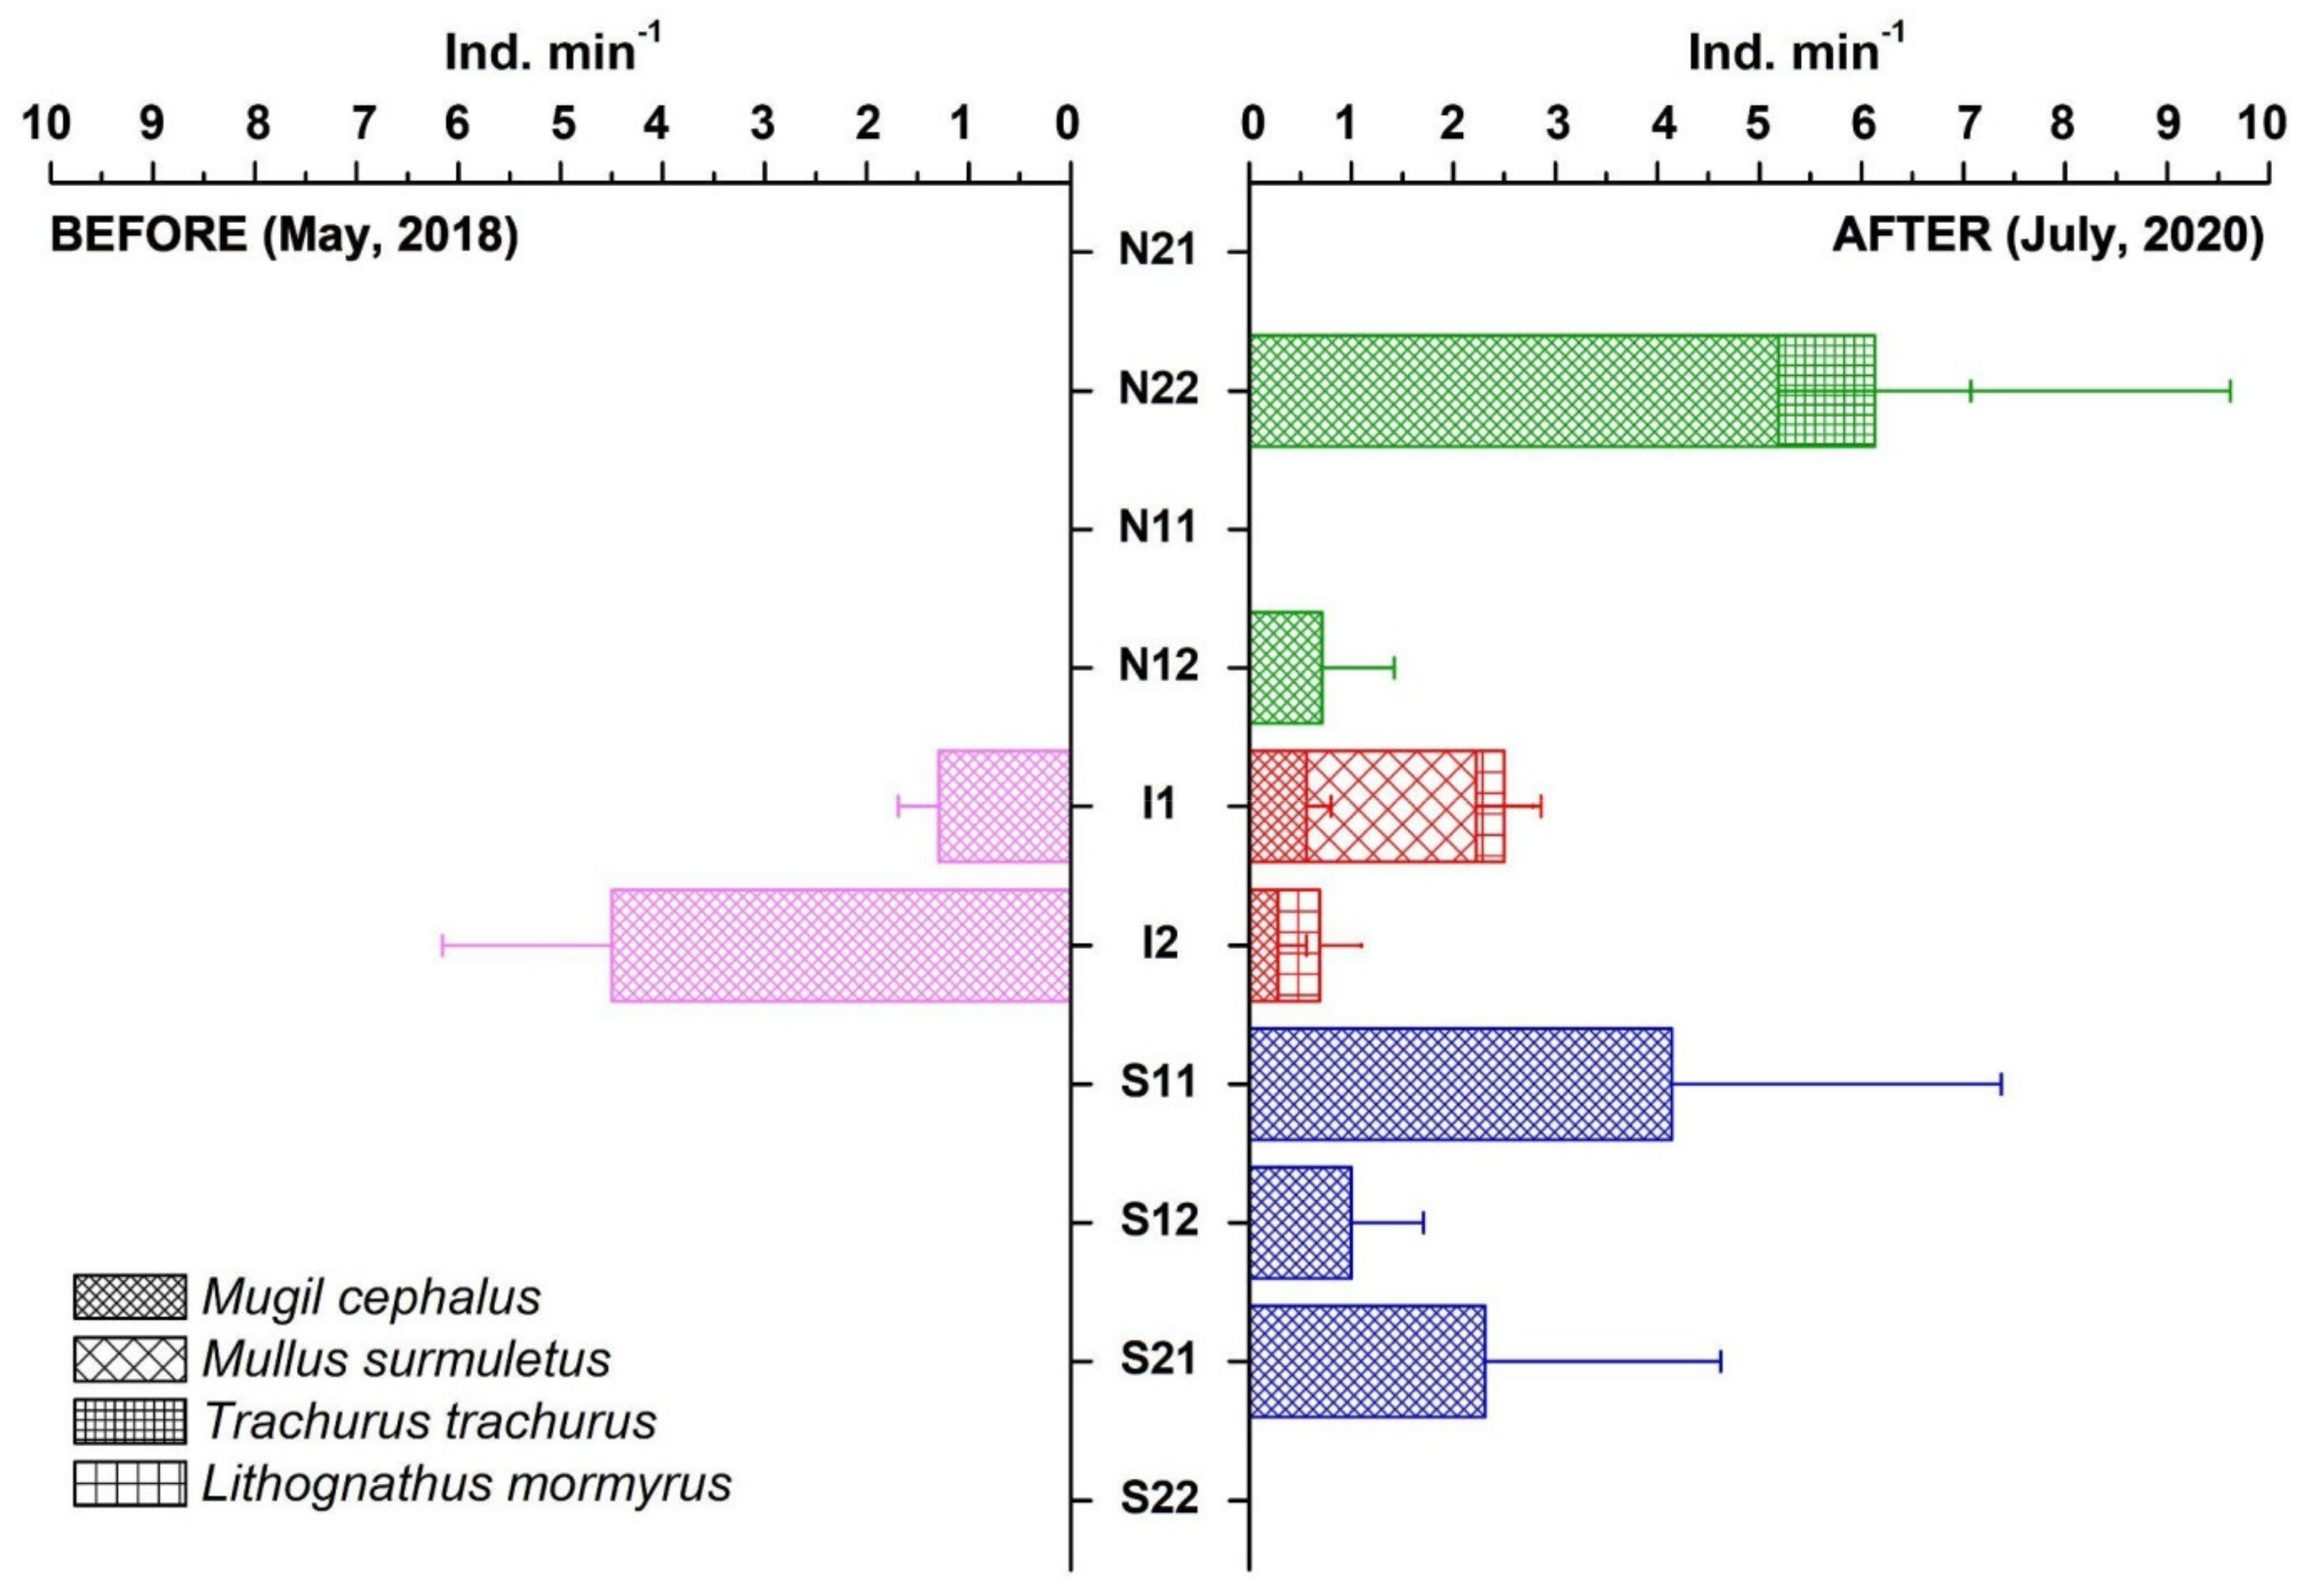
3.3. Effects on Fish Assemblages

Before the plant activation, the flathead grey mullet, Mugil cephalus Linnaeus, 1758, was the only fish species observed in recorded videos, found only in the impacted areas (I1, I2) (Figure 11 and Figure 12). In July 2020, one year after the activation of the plant, three more species were observed: the Atlantic horse mackerel, Trachurus trachurus (Linnaeus, 1758), sighted only in north control area N22, the sand steenbras, Lithognathus mormyrus (Linnaeus, 1758), and the surmullet, Mullus surmuletus Linnaeus, 1758. The last two species have been sighted at the sediment removal (I1) and discharge (I2) areas. Grey mullet was the most frequent and abundant species observed in both impacted areas (I1 and I2) as well as in most of the north (N22, N12) and south (S11, S12, S21) control areas. Overall, in the study area, the highest number of fish per minute was observed in July 2020, even if in I2 there was a decrease in fish abundance compared to May 2018.

4. Discussion

The present study provides the first assessment of the environmental effects of the innovative sand bypassing plant for sediment management in harbors. Analysis of sea bottom sediment grain size shows a decrease of mud and fine sand and an increase in the medium sand fraction in the ejectors area (I1) after the activation of the plant. An opposite trend was observed in the sediment discharge area (I2). This pattern could result from the greater efficiency of the ejectors in preventing deposition and transferring the finer particles from the removal to the discharge area. The higher percentage of mud in the impacted areas and, particularly, at the harbor entrance before the activation of the ejectors is probably caused by a previous dredging operation, which usually provokes an increase of the finest sediment fraction in the dredged and adjacent areas [3,17].
Percentages of organic matter in sea bottom sediment before the activation of the ejectors were significantly higher in both impacted areas compared to control ones. These high values could be related to the periodic dredging events as well as to an unnoticed emergency dredging operation in the area, carried out a few weeks before the first sampling. In fact, the increase in organic matter concentration as a consequence of dredging is widely reported [3,23,24], and it may be due to the release of organic matter previously accumulated and buried in the deeper sediment layers. On the other hand, in the two sampling times after plant activation, the percentage of organic matter in the impacted areas was not significantly different from the control ones, suggesting that ejectors action did not further alter the values, rather it allowed the restoration of the reference values.
The increase in shell debris abundance in the sediment removal area and its decrease in the discharge area can also be attributed to the ejectors’ activity. Indeed, ejectors are relatively inefficient in removing shells and large debris, which can accumulate around them and in the surrounding area, while dead shells and debris at the sediment discharge area tend to be gradually buried.
Benthic assemblages found in the study area correspond to the typical shallow soft-bottom communities reported along the northwestern Adriatic coast, dominated by the bivalve Lentidium mediterraneum and also characterized by the presence of the bivalves Donax semistriatus and Chamelea gallina, the gastropod Tritia neritea, the polychaete Prionospio caspersi, and the crustacean Apseudopsis latreilli [25,26]. Before the ejectors were activated, species abundance and richness of benthic invertebrates at the harbor entrance working areas were significantly lower than at the control ones, probably because of repeated previous dredging, as well as the recent most dredging operation carried out a few weeks before the first sampling, In fact, previous studies show that dredging is usually accompanied by a significant fall in species richness, population density, and biomass of benthic organisms [3]. After the activation of ejectors, a progressive increase in species richness in both working areas was observed, especially affecting the phylum Annelida and, to a lesser extent, Mollusca.
At the end of the study, 13 months after the plant went into operation, abundance and richness of species in the discharge area were similar to the control sites, but this was not the case in the sediment removal area. The reduced recovery noted in the sediment removal area could be attributed to the long-term dredging effects and slow recovery of benthic macrofauna typical of sandy bottom habitats. It could take several years to fully recover, depending on the combination of different physical, chemical, and biological parameters [3]. Recolonization of dredged area is initially by opportunistic species that have rapid rate of reproduction and growth, and the community is subsequently populated by the long-lived and slow-growing species that characterize stable undisturbed deposits [3]. Among the most abundant species that have shown the longest recovery times, especially at the ejector area, are the bivalves L. mediterraneum, C. gallina, and D. semistriatus. All three bivalves are sensitive to disturbance, and are characterized by relatively long life, slow growth, and high biomass [27].
Trends in Shannon diversity and Pielou evenness indices show a transient increase after the activation of the plant. This could be related to a pioneer recovery phase when species diversity is increased under intermediate disturbance and in the availability of space, as suggested in the intermediate disturbance theory [28]. In this phase, rapid colonization by mainly mobile species occurs, such as some polychaetes able to recolonize the deposits by migration of adults, and/or by high recruitment rates, as confirmed by our research [3]. On the other hand, in more stable conditions, a few dominant species remain. An increase in species evenness and diversity after dredging in the short-term period was also detected in other studies [29]. In the second sampling after the activation of the plant, the values of Shannon and Pielou evenness indices in the impacted areas were not significantly different than those in control ones, suggesting that ejectors plant activity did not further alter benthic assemblages; however, their recolonization and recovery were probably still in progress.
An increase in both abundance and number of fish species in the whole study was detected in July 2020 compared to the plant preactivation period. The grey mullet, Mugil cephalus, was the most abundant species. It can live in different coastal habitats as it can tolerate a wide range of salinity, turbidity, and dissolved oxygen levels [30]. Grey mullets are diurnal bottom feeders that feed on detritus, benthic microalgae, and meiofaunal invertebrates such as copepods and nematodes [31,32]. Thus, they are usually concentrated in front of and inside ports and marinas where they can find a higher amount of food. Grey mullets are an ecologically important link in the benthic–pelagic coupling in the nearshore marine ecosystems, contributing to organic matter recycling and sediment mixing. The turnover of detritus and higher percentages of organic matter in the impacted areas in the preactivation period, likely due to the dredging activities, might explain the concentration of mullets therein. On the other hand, after the activation of the plant, mullets were widely distributed in different control and impact areas along the study area. Other fish species found exclusively at the sediment removal and discharge areas in July 2020 were the sand steenbras, Lithognathus mormyrus, a strictly carnivorous soft bottom feeder [33], and the surmullet, Mullus surmuletus, a bottom-dwelling species that feeds mostly on decapod crustaceans [34]. The increase in abundance and species richness of benthic organisms at the sediment removal and discharge areas after the activation of the plant might have provided a suitable feeding ground for these species.

5. Conclusions

Harbor management and maintenance activities have effects on the marine environment, depending on their typology and how and when they are carried out. Maintaining access to the harbor through dredging, besides being very expensive, requires periodic interventions with interruption of access to the harbor, but also alteration of the seabed with resuspension of sediments and contaminants, and consequent negative impacts on the quality of sediments and marine life. Alternative engineering solutions, in addition to being efficient in pursuing their primary purposes, that is, maintaining safe and regular harbor operations, and economically sustainable, should also have limited environmental impacts (environment-friendly or green solutions). The results of the monitoring activities on the impact of the ejector plant in front of the harbor of Cervia showed a lack of impacts on the marine environment. Moreover, benefits, in terms of increased species richness and abundance, initially decreased likely as a result of previous dredging, were observed in the sediment removal and disposal sites. The ejectors demo plant was effective in guaranteeing navigability at the harbor inlet of Cervia for almost one year of operation [13], preventing the use of highly impacting dredging activities. Furthermore, the results of this study represent an important contribution to the validation of the ejector technology as an environmentally friendly alternative to maintenance dredging.

Author Contributions

Conceptualization, M.P. (Massimo Ponti), M.P. (Marco Pellegrini), C.S., M.A. (Marco Abbiati) and M.A.C.; Methodology, M.P. (Massimo Ponti), M.A. (Marco Abbiati), and M.A.C.; Formal Analysis, B.M., M.P. (Massimo Ponti), M.A.C., E.T., M.A. (Michele Adda) and A.D.; Investigation, B.M., M.P. (Massimo Ponti), E.T., M.A. (Michele Adda) and A.D.; Resources, M.A. (Marco Abbiati), M.P. (Marco Pellegrini), C.S. and M.A.C.; Data Curation, B.M., M.P. (Massimo Ponti), E.T., M.A. (Michele Adda) and A.D.; Writing—Original Draft Preparation, B.M., M.P. (Massimo Ponti), M.A. and M.A.C.; Writing—Review and Editing, all co-authors; Visualization, B.M. and M.P. (Massimo Ponti); Supervision, M.A. (Marco Abbiati) and M.P. (Massimo Ponti); Project Administration, M.A. (Marco Abbiati), M.P. (Marco Pellegrini), M.P. (Massimo Ponti) and C.S.; Funding Acquisition, M.A. (Marco Abbiati), M.P. (Marco Pellegrini), and C.S. All authors have read and agreed to the published version of the manuscript.

Funding

This research was funded by the European project LIFE MARINAPLAN PLUS (“Reliable and innovative technology for the realization of a sustainable marine and coastal seabed management plan”; LIFE15 ENV/IT/000391) for the period October 2016–December 2020. During the study, ET received a research grant from the project TAO (“Tecnologie per il monitorAggio cOstiero”) concerning innovation in shallow water coastal monitoring and funded by the European Regional Development Fund through the call POR FESR 2014–2020 axe 1, action 1.2.2 (PG/2018/629165).

Institutional Review Board Statement

Not applicable.

Informed Consent Statement

Not applicable.

Data Availability Statement

The data presented in this study are available on request from the corresponding author. The data are not publicly available due to project embargo reasons.

Acknowledgments

We would like to thank Paolo Zanni for the help in the determination of mollusks.

Conflicts of Interest

The authors declare no conflict of interest. The funders had no role in the design of the study; in the collection, analyses, or interpretation of data; in the writing of the manuscript, or in the decision to publish the results.

References

  1. Bray, R.N.; Bates, A.D.; Land, J.M. Dredging: A Handbook for Engineers; Butterworth-Heinemann: Oxford, UK, 1996; p. 448. [Google Scholar]
  2. Ezzeldin, M.M.; Rageh, O.S.; Saad, M.E. Navigation channel problems due to sedimentation. In Proceedings of the the International Maritime and Logistics Conference “Marlog 8”, Towards Global Competitiveness in Maritime Industry, “Investing in Ports” The Trends, The Future, Alexandria, Egypt, 17–19 March 2019; pp. 1–18. [Google Scholar]
  3. Newell, R.C.; Seiderer, L.J.; Hitchcock, D. The impact of dredging works in coastal waters: A review of the sensitivity to disturbance and subsequent recovery of biological resources on the sea bed. Oceanogr. Mar. Biol. Annu. Rev. 1998, 36, 127–178. [Google Scholar]
  4. Cutroneo, L.; Castellano, M.; Ferranti, M.P.; Povero, P.; Tucci, S.; Capello, M. Use of optical and acoustic instruments to study the turbid plumes generated by three different types of dredges during dredging activities inside and outside of a port. J. Soils Sediments 2013, 13, 1645–1654. [Google Scholar] [CrossRef]
  5. Torres, R.J.; Abessa, D.M.S.; Santos, F.C.; Maranho, L.A.; Davanso, M.B.; do Nascimento, M.R.L.; Mozeto, A.A. Effects of dredging operations on sediment quality: Contaminant mobilization in dredged sediments from the Port of Santos, SP, Brazil. J. Soils Sediments 2009, 9, 420–432. [Google Scholar] [CrossRef]
  6. Mali, M.; Dell’Anna, M.M.; Mastrorilli, P.; Damiani, L.; Piccinni, A.F. Assessment and source identification of pollution risk for touristic ports: Heavy metals and polycyclic aromatic hydrocarbons in sediments of 4 marinas of the Apulia region (Italy). Mar. Pollut. Bull. 2017, 114, 768–777. [Google Scholar] [CrossRef] [PubMed]
  7. Bianchini, A.; Cento, F.; Guzzini, A.; Pellegrini, M.; Saccani, C. Sediment management in coastal infrastructures: Techno-economic and environmental impact assessment of alternative technologies to dredging. J. Environ. Manag. 2019, 248, 109332. [Google Scholar] [CrossRef] [PubMed]
  8. Pellegrini, M.; Abbiati, M.; Bianchini, A.; Colangelo, M.A.; Guzzini, A.; Mikac, B.; Ponti, M.; Preda, G.; Saccani, C.; Willemsen, A. Sustainable sediment management in coastal infrastructures through an innovative technology: Preliminary results of the MARINAPLAN PLUS LIFE project. J. Soils Sediments 2020, 20, 2685–2696. [Google Scholar] [CrossRef]
  9. Underwood, A.J. Beyond BACI: The detection of environmental impacts on populations in the real, but variable, world. J. Exp. Mar. Biol. Ecol. 1992, 161, 145–178. [Google Scholar] [CrossRef]
  10. Aguzzi, M.B.F.; De Nigris, N.; Morelli, M.; Paccagnella, T.; Romagnoli, C.; Unguendoli, S. Stato del Litorale Emiliano-Romagnolo al 2012-Erosione e Interventi di Difesa; Arpae Emilia-Romagna: Bologna, Italy, 2016. [Google Scholar]
  11. Poulain, P.M.K.V.H.; Cushman-Roisin, B. Northern Adriatic Sea. In Physical Oceanography of the Adriatic Sea; Cushman-Roisin, B., Gačić, M., Poulain, P.M., Artegiani, A., Eds.; Springer: Dodrecht, The Netherlands, 2001. [Google Scholar]
  12. Lionello, P.; Cavaleri, L.; Nissen, K.M.; Pino, C.; Raicich, F.; Ulbrich, U. Severe marine storms in the Northern Adriatic: Characteristics and trends. Phys. Chem. Earth Parts A/B/C 2012, 40–41, 93–105. [Google Scholar] [CrossRef]
  13. Pellegrini, M.; Aghakhani, A.; Gaeta, M.G.; Archetti, R.; Guzzini, A.; Saccani, C. Effectiveness Assessment of an Innovative Ejector Plant for Port Sediment Management. J. Mar. Sci. Eng. 2021, 9, 197. [Google Scholar] [CrossRef]
  14. ARPAE. Available online: https://www.arpae.it/it/temi-ambientali/mare/dati-e-indicatori/dati-boa-ondametrica/dati-boa-ondametrica-di-cesenatico-fc (accessed on 15 July 2021).
  15. Gosline, J.E.; O’Brien, M.P. The Water Jet Pump; University of California Press: Berkeley, CA, USA, 1934; p. 24. [Google Scholar]
  16. Ponti, M.; Pasteris, A.; Guerra, R.; Abbiati, M. Impacts of maintenance channel dredging in a northern Adriatic coastal lagoon. II: Effects on macrobenthic assemblages in channels and ponds. Estuar. Coast. Shelf Sci. 2009, 85, 143–150. [Google Scholar] [CrossRef]
  17. Guerra, R.; Pasteris, A.; Ponti, M. Impacts of maintenance channel dredging in a northern Adriatic coastal lagoon. I: Effects on sediment properties, contamination and toxicity. Estuar. Coast. Shelf Sci. 2009, 85, 134–142. [Google Scholar] [CrossRef]
  18. Anderson, M.J. A new method for non-parametric multivariate analysis of variance. Austral Ecol. 2001, 26, 32–46. [Google Scholar] [CrossRef]
  19. McArdle, B.H.; Anderson, M.J. Fitting Multivariate Models to Community Data: A Comment on Distance-Based Redundancy Analysis. Ecology 2001, 82, 290–297. [Google Scholar] [CrossRef]
  20. Underwood, A.J. Experiments in Ecology: Their Logical Design and Interpretation Using Analysis of Variance; Cambridge University Press: Cambridge, UK, 1996; p. 524. [Google Scholar]
  21. Clarke, K.R.; Gorley, R.N. Primer V6: User Manual—Tutorial; PRIMER-E Ltd.: Plymouth, UK, 2006; p. 190. [Google Scholar]
  22. Anderson, M.J.; Gorley, R.N.; Clarke, K.R. PERMANOVA+ for PRIMER: Guide to Software and Statistical Methods; PRIMER-E Ltd.: Plymouth, UK, 2008; p. 214. [Google Scholar]
  23. Lomakin, P.D. Influence of dredging and dumping zones on the ecological situation in the Kerch Strait. Phys. Oceanogr. 2019, 26, 147–156. [Google Scholar] [CrossRef]
  24. Lu, X.; Zhou, F.; Chen, F.; Lao, Q.; Zhu, Q.; Meng, Y.; Chen, C. Spatial and Seasonal Variations of Sedimentary Organic Matter in a Subtropical Bay: Implication for Human Interventions. Int. J. Environ. Res. Public Health 2020, 17, 1362. [Google Scholar] [CrossRef] [PubMed] [Green Version]
  25. Ambrogi, R.; Bedulli, D.; Zurijni, G. Spatial and Temporal Patterns in Structure of Macrobenthic Assemblages. A Three-Year Study in the Northern Adriatic Sea in Front of the Po River Delta. Mar. Ecol. 1990, 11, 25–41. [Google Scholar] [CrossRef]
  26. Bertasi, F.; Colangelo, M.A.; Abbiati, M.; Ceccherelli, V.U. Effects of an artificial protection structure on the sandy shore macrofaunal community: The special case of Lido di Dante (Northern Adriatic Sea). Hydrobiologia 2007, 586, 277–290. [Google Scholar] [CrossRef]
  27. Simboura, N.; Zenetos, A. Benthic indicators to use in Ecological Quality classification of Mediterranean soft bottom marine ecosystems, including a new Biotic Index. Mediterr. Mar. Sci. 2002, 3, 77–111. [Google Scholar] [CrossRef] [Green Version]
  28. Huston, M. A General Hypothesis of Species Diversity. Am. Nat. 1979, 113, 81–101. [Google Scholar] [CrossRef]
  29. López-Jamar, E.; González, G.; Mejuto, J. Temporal changes of community structure and biomass in two subtidal macroinfaunal assemblages in La Coruña bay, NW Spain. Hydrobiologia 1986, 142, 137–150. [Google Scholar] [CrossRef]
  30. Whitfield, A.K.; Panfili, J.; Durand, J.D. A global review of the cosmopolitan flathead mullet Mugil cephalus Linnaeus 1758 (Teleostei: Mugilidae), with emphasis on the biology, genetics, ecology and fisheries aspects of this apparent species complex. Rev. Fish Biol. Fish. 2012, 22, 641–681. [Google Scholar] [CrossRef]
  31. Islam, R.; Hossain, M.B.; Das, N.G.; Rafi, R.U.N. Food and feeding behaviour of grey mullet, Mugil cephalus (L.), of Bangladesh coastal water. Bangladesh J. Progress. Sci. Technol. 2009, 7, 56–61. [Google Scholar]
  32. Mondal, A.; Chakravortty, D. Feeding Ecology and Prey Preference of Grey Mullet, Mugil cephalus (Linnaeus, 1758) in Extensive Brackish Water Farming System. J. Mar. Sci. Res. Dev. 2015, 6, 1000178. [Google Scholar] [CrossRef] [Green Version]
  33. Costa, C.; Cataudella, S. Relationship between shape and trophic ecology of selected species of Sparids of the Caprolace coastal lagoon (Central Tyrrhenian sea). Environ. Biol. Fishes 2006, 78, 115–123. [Google Scholar] [CrossRef]
  34. Labropoulou, M.; Eleftheriou, A. The foraging ecology of two pairs of congeneric demersal fish species: Importance of morphological characteristics in prey selection. J. Fish Biol. 1997, 50, 324–340. [Google Scholar] [CrossRef]
Figure 1. Schematization of ejector’s components and operation.
Jmse 10 00182 g001
Figure 2. Benthic organisms attached to the plant structures: (a) Filamentous algae; (b) the crab Liocarcinus vernalis (Risso, 1827) on the nonindigenous gastropod Rapana venosa; (c) the gastropod R. venosa laying eggs on a pipeline; (d) the ascidian (white arrow) and the serpulid polychaetes (black arrow).
Jmse 10 00182 g002
Figure 3. Map of the research area (Basemap Google Earth, image 3 April 2020—Projection UTM33/WGS84). N1 = control location 600 m north with related areas (N11 and N12), N2 = control location 1200 m north with related areas (N21 and N22), S1 = control location 600 m south with related areas (S11 and S12), S2 = control location 1200 m south with related areas (S21 and S22), I = impacted location with related areas (I1—sediment removal area and I2—sediment discharge area). The box in the lower left corner displays a scheme of the ejectors plant placed in the impacted location (I). The general bathymetric contours are reported; for detailed bathymetry in the intervention area, see [13].
Jmse 10 00182 g003
Figure 4. Sampling design scheme (colors are the same as those used in the graphs to facilitate understanding).
Jmse 10 00182 g004
Figure 5. Ternary diagram showing mean sediment grain size composition in research areas in three different sampling dates (see legend). N11 and N12 = areas within north 600 m, N21 and N22 = areas within north 1200 m, S11 and S12 = areas within south 600 m, S21 and S22 = areas within south 1200 m, I1 and I2 = areas within impact. Arrows indicate significant (p < 0.05) changes in time in the two plant areas, I1 and I2.
Jmse 10 00182 g005
Figure 6. Mean (±SE, n = 4) (a) percentage of organic matter and (b) weight of shell debris per sample (sampled surface 23.5 × 13.5 cm2) in the sediment at each research area, before (05/2018) and after (02/2020 and 07/2020) the plant activation. N11 and N12 = areas within north 600 m, N21 and N22 = areas within north 1200 m, S11 and S12 = areas within south 600 m, S21 and S22 = areas within south 1200 m, I1 and I2 = areas within impact. Significant p-values are represented by the * (p < 0.05—*, p < 0.01—**, p < 0.001—***).
Jmse 10 00182 g006
Figure 7. Empty mollusk shells accumulated in the depression of the seabed formed around a plant ejector.
Jmse 10 00182 g007
Figure 8. Total relative abundance (a) and number of taxa (b) of the four main macrobenthic groups (Mollusca, Polychaeta, Crustacea, and others) at each research area and time.
Jmse 10 00182 g008
Figure 9. Mean (±SE, n = 4) (a) macrofaunal abundance—N and (b) macrofaunal species richness—S index in each research area before (05/2018) and after (02/2020 and 07/2020) the plant activation. N11 and N12 = areas within north 600 m, N21 and N22 = areas within north 1200 m, S11 and S12 = areas within south 600 m, S21 and S22 = areas within south 1200 m, I1 and I2 = areas within impact. Significant p-values are represented by the * (p < 0.05—*, p < 0.01—**, p < 0.001—***).
Jmse 10 00182 g009
Figure 10. Mean (±SE, n = 4) (a) Shannon species diversity index—H’ (log e) and (b) Pielou evenness index—J’ in each research area before (05/2018) and after (02/2020 and 07/2020) the plant activation. N11 and N12 = areas within north 600 m, N21 and N22 = areas within north 1200 m, S11 and S12 = areas within south 600 m, S21 and S22 = areas within south 1200 m, I1 and I2 = areas within impact. Significant p-values are represented by the * (p < 0.05—*, p < 0.01—**, p < 0.001—***).
Jmse 10 00182 g010
Figure 11. Shoal of flathead grey mullet (Mugil cephalus) recorded in the sediment removal area (I1).
Jmse 10 00182 g011
Figure 12. Mean (±SE, n = 4) abundance of different fish species (individuals minute−1) at each sampling area, before (05/2018) and after (07/2020) the plant activation. N11 and N12 = areas within north 600 m, N21 and N22 = areas within north 1200 m, S11 and S12 = areas within south 600 m, S21 and S22 = areas within south 1200 m, I1 and I2 = areas within impact.
Jmse 10 00182 g012
Publisher’s Note: MDPI stays neutral with regard to jurisdictional claims in published maps and institutional affiliations.

