Article

Deep Water PAH Cycling in the Japan Basin (the Sea of Japan)

1
Pacific Oceanological Institute of Far Eastern Branch, Russian Academy of Sciences, Baltiyskaya Str. 43, 690041 Vladivostok, Russia
2
Low Level Radioactivity Laboratory, Institute of Nature and Environmental Technology, Kanazawa University, Nomi 923-1224, Japan
3
Division of Material Chemistry, Graduate School of Natural Science and Technology, Kanazawa University, Kanazawa 920-1192, Japan
*
Author to whom correspondence should be addressed.
J. Mar. Sci. Eng. 2022, 10(12), 2015; https://doi.org/10.3390/jmse10122015
Submission received: 13 October 2022 / Revised: 13 December 2022 / Accepted: 14 December 2022 / Published: 16 December 2022
(This article belongs to the Section Marine Pollution)

Abstract

:
A vertical pattern of fractionated polycyclic aromatic hydrocarbons (PAH) was studied in the Japan Basin in the Sea of Japan. The highest PAH concentration was found in the mesopelagic realm, possibly resulting from deep convection and/or subduction of intermediate water and its biogeochemical setting in the western Japan Basin. Using 226Ra and 228Ra as tracers revealed the PAH load in the open sea from the coastal polluted water. Dissolved PAHs (DPAH, fraction < 0.5 µm) were significantly prevalent particulate PAHs (PPAH, fraction > 0.5 µm) at all depths, associated with a predominance of dissolved organic carbon (DOC) over particulate organic carbon (POC). Hydrophobicity was more important for higher-molecular-weight PAHs to be distributed between particles and the solution, while the high Koc of low-molecular-weight PAHs indicated that their partitioning was driven by other factors, such as adsorbing of soot particles. PPAH and DPAH profiles differed from the POC and DOC profiles; nevertheless, a positive moderate correlation was found for DPAH and DOC for depths below the epipelagic, suggesting the similarity of the mechanisms of input of dissolved organic matter and DPAH into the deep interior of the Sea of Japan. The PAH flux calculations showed that biological pumps and overturning circulation contribute almost equally to removing PAHs from the bathypelagic waters of the Japan Basin.

1. Introduction

Polycyclic aromatic hydrocarbons (PAHs) are a class of widespread organic pollutants, whose structure consists of several fused aromatic rings. Because PAHs are toxic and some are carcinogenic, they are an environmental and human health concern [1,2]. Significant amounts of PAHs are released into the environment since they occur with the incomplete combustion of biomass and fossil fuels and PAHs are naturally part of crude oil and coals [3]. They also show environmental resistance due to their lack of functional groups and can be transported over long distances, and therefore, have been found in remote ocean interiors [4,5,6].
Once on the surface sea, depending on their hydrophobicity, PAHs are distributed between the water and particulate matter phases, which determines the patterns of their migration and fate in the marine environment. The biological pump, which is the process that converts inorganic carbon in the surface ocean into biomass and transports this to the deep ocean, is considered the major driver of organic pollutant export from the euphotic zone [7,8]. More hydrophobic PAHs tend to be sorbed on sinking organic particles, phyto- and zooplankton organisms [9]. Moreover, herbivorous and carnivorous zooplankton can consume PAH-contaminated food, and therefore, excrete fecal pellets with PAHs that encourage the efficiency of the PAH vertical transport [10,11]. Marine snow representing large aggregates formed of extracellular polymeric substances, detritus, living organisms, and inorganic matter is a component of the biological pump that is involved in the vertical transfer of PAHs as well. Marine snow aggregates sorb and scavenge predominantly high molecular weight PAHs (HMW PAHs) in the water column [12] and subsequently sink to the bottom thereby promoting HMW PAH enrichment in the underlying deep water realm or sediments [13].
Oceanic physical processes are another mechanism for pollutant transport and are believed to be more important for dissolved forms. Increased concentrations of dissolved PAHs (DPAHs) and other persistent organic pollutants were detected in the mesopelagic of the Tropical Atlantic site owing to pollutant input into deeper waters, which occurred alongside the sinking polluted water of the Mediterranean Sea [5]. Lohmann and coauthors [14] calculated that overall, in four regions of the Atlantic Ocean where water mass subduction occurs, polychlorinated biphenyls (PCBs) are removed at more than double the rate of them settling with particles. Furthermore, in the western South China Sea, upwelling and mesoscale eddy diffusion were found to influence the DPAH distribution in the water column [15]. Some authors have shown that water mass movement, including dense water cascading, is also significant for particulate PAH (PPAH) lateral/advective inputs in mesopelagic and bathypelagic waters [16], and in sedimentation of PAHs onto particles [17].
PAH ability to be degradable by photooxidation and bacteria dictates the PAH occurrence in the marine pelagic zone. Sunlight is an important factor affecting PAH degradation in the upper water column. Bacosa and coauthors [18] revealed individual PAHs with lower molecular weights were more sensitive to photooxidation than PAHs with heavier molecular weights. The efficiency of solar ultraviolet radiation-driven photooxidation in PAH removal can be significantly greater than that of biodegradation [19,20]. Moreover, sunlight can inhibit PAH biodegradation due to the negative effect on living cells by toxic reactive PAH species [21]. Bacterial destruction of PAH molecules is the major PAHs removal process in the deep water column. Together with the particulate organic matter (POM) and the dissolved organic matter (DOM), PAHs are subject to microbial mineralization, integrating the microbial loop. The biodegradation of PAHs by microorganisms has been extensively reviewed for both aerobic and anaerobic processes ([22] and references therein). There the diversity of PAH-degrading bacteria in the pelagic deep-sea was determined [23]; however, their activity is limited by various factors. Some bacterial consortia are able to utilize only low molecular weight PAHs (LMW PAHs) [24], while others degrade HMW PAHs cometabolically when LMW PAHs such as phenanthrene act as the primary substrate [23]. Apart from source materials, hydrographic conditions such as temperature [25] and dissolved oxygen [26] are important factors controlling heterotrophic bacterial activity.
The Sea of Japan (the East Sea) is a semi-closed marginal sea in the North Western Pacific with its own thermohaline circulation. Sea-ice production in the north-western part of the Sea of Japan makes it very well-ventilated at all depths, mainly through the process of deep convection or brine rejection [27]. The high hydrological dynamic of the Sea of Japan influences the occurrence and behavior of organic matter; for example, providing high concentrations of bioavailable amino acids and a slow degradation rate of DOM in the deep water [28,29]. To date, the spatial and temporal trends of PAHs in the surface waters of the open Sea of Japan have been described in a number of studies [30,31,32]. However, very little was known about the deep water cycling of PAHs and the processes influencing the vertical PAH pattern in the Sea of Japan [30,33]. Our research is focused on changes in fractionated PAHs (PPAHs (>0.5 µkm) and DPAHs (<0.5 µkm)) with depth in the deepest basin of the Sea of Japan (in the Japan Basin), their partitioning, the organic matter effect, and PPAH and DPAH mass fluxes and residence times in the bathypelagic.

2. Materials and Methods

2.1. Study Area

The Sea of Japan (the East Sea) is a semi-closed marginal sea surrounded by the East Asian continent and Japanese Islands in the North Western Pacific (Figure 1). Water exchange with the open ocean is very limited because the Sea of Japan is connected to the outside seas through four shallow straits which are shallower than 140 m. As a result of the influx of cold ice-laden waters from the Okhotsk Sea with the Liman Current in the north and warm water influx from the East China Sea in the south (Tsushima current) the Sea of Japan is a meeting place of cold and fresh subarctic waters and warm and salty subtropical waters that converge to form the Polar Front, also known as the Subpolar or Subarctic Front ([34] and references therein).
The Sea of Japan consists of three deep basins (>2000 m), including the Tsushima (Ulleung) Basin in the southwest, the Yamato Basin in the southeast, and the Japan Basin in the northern region. The latter is the deepest in the sea; its maximum depth is almost 4000 m. In general, the vertical structure of the Japan Sea concludes following water masses forming outside or inside the sea: Surface water (varied seasonally with a range of 0–200 m), Intermediate water (ca. mixed layer depth-300 m), Central water (ca. 300–1500 m), Deep water (ca. 1500–2500 m) and Bottom water (ca. 2500 m-bottom) [35]. The sinking of high-density surface seawater could occur in northern areas of the Japan Sea to transport oxygen-rich surface water to deep and bottom layers of the Japan Basin, and then to the Yamato and Tsushima Basins by southward bottom currents [36]. Tracer studies have shown that the turnover time of deep water is in the order of 100 years [37,38].
The atmospheric PAH deposition was considered a major contributor to the open Sea of Japan [39]. In the cold season, long-range PAH transport occurs from Northeast China over the Sea of Japan by the strong monsoon loaded with particulate matter emitted from the combustion of fossil fuels and/or biomass in China [40,41]. In the spring and summer, Siberian forest fires are another possible source of PAHs [42]. River discharge into the Sea of Japan is negligible and the main water exchange goes through the straits. It was found the southern Sea of Japan is impacted by PAH-rich summer continental-shelf water transported by the Tsushima Warm Current flowing from the East China Sea [43] which receives substantial contamination from the Chinese mainland [44]. There is currently no information on PAH pollution brought by currents to the northern Sea of Japan.

2.2. Sample Strategy

Water samples were collected at two stations located in the Japan basin (the Sea of Japan) aboard the R/V Akademik M.A.Lavrentyev during a December 2016 cruise. The sampling stations are labeled as St.21 (41°29.560′ N, 134°02.068′ E) and St.29 (41°27.647′ N, 131°46.128′ E) (Figure 1). At both stations, water samples for the PAHs, and organic carbon measurements were taken from 14 horizons and for Ra isotopes (226Ra and 228Ra) analysis water samples were taken from 11 horizons (Table 1). The vertical profiles of water column temperature and salinity were analyzed using an RBR-XRX620 sensor (RBR Ltd., Ottawa, ON, Canada).
The water samples were collected in standard 10 L Niskin bottles (model 1010). Water from the same Niskin bottle was divided for PAH (5 L), dissolved organic carbon (DOC) (0.2 L) and particulate organic carbon (POC) (4.8 L) analysis. Water from six Niskin bottles (60 L) taken from the same depth was combined and used for the radium isotopes analysis.

2.3. Sample Pretreatment and Measurements of PAHs

Immediately after collection, water for the PAH analysis was passed through glass fiber filters (GFF; pore size 0.5 µm, Advantec GC-50, Japan) in order to separate the dissolved and particulate phases. The dissolved phase in our study is defined as the sum of truly dissolved components, colloidal and very small, suspended particles (<0.5 µm). Dissolved PAHs (DPAHs) were concentrated on solid-phase extraction cartridges (Waters Sep-Pak C18, Cartridge, UK). For the quantification of individual compounds, all samples were spiked with a mixture of five surrogate standards prior to extraction (naphthalene-d8, acenaphthene-d10, phenanthrene-d10, pyrene-d10, benzo[a]pyrene-d12, Wako Pure Chemical Industries, Ltd., Osaka, Japan).
The sample pretreatment procedures were carried out as described in our previous studies [30,45]. Briefly, DPAHs were eluted from the C18 cartridges by dichloromethane. PAHs from the GFFs were extracted by sonication (benzene:ethanol (3:1, v/v), 30 min, twice). After reconstituting extracts in acetonitrile, PAHs were separated and characterized by HPLC-fluorescence analysis. Detailed information on HPLC methodology can be found in [46,47].
Supelco EPA 610 PAH Mix (Sigma-Aldrich, St. Louis, MO, USA) was used as the reference standard for the target PAHs. Five deuterated PAHs (Nap-d8, Aced10, Phe-d10, Pyr-d10 and BaP-d12) were purchased from Wako Pure Chemical (Osaka, Japan) as internal standards. A total of fifteen PAHs from the USEPA’s 16 priority PAHs list were quantified: the two-ring PAH was naphthalene (Nap); the three-ring PAHs were acenaphthene (Ace), fluorene (Fle), phenanthrene (Phe) and anthracene (Ant); the four-ring PAHs were fluoranthene (Flu), pyrene (Pyr), benz[a]anthracene (BaA) and chrysene (Chr); the five-ring PAHs were benzo[b]fluoranthene (BbF), benzo[k]fluoranthene (BkF), benzo[a]pyrene (BaP) and dibenz[a,h]anthracene (DBA); the six-ring PAHs were benzo[g,h,i]perylene (BPe) and indeno [1,2,3-cd]pyrene (IDP). An acenaphthylene does not fluoresce and was thus also excluded from the analysis. The analytical data of Nap and Phe were not reported due to the low recovery of Nap in the particulate phase and the imperfect resolution of Phe with interfering peaks for the dissolved phase.
The limits of detection (LOD) and quantification (LOQ) were evaluated based on signal-to-noise ratio cut-offs of 3 and 10, respectively. The LOD ranged between 0.04 pg/injection (Ant) and 2.86 pg/injection (IDP), and the LOQ varied between 0.06 ng/mL (Ant) and 0.48 ng/mL (IDP). Concentrations of BaP, DBA, BPe and IDP for the dissolved phase and BbF, BaP, DBA, BPe and IDP for the particulate phase were lower than the LOQ(LOD) and were not considered in this work.
The method of recovery was determined via the addition of surrogate standards. The recoveries were 73.7 ± 4.47 and 50.8 ± 7.25 for Ace-d10, 91.5 ± 9.92 and 65.6 ± 6.12 for Phe-d10, 89.5 ± 4.23 and 69.6 ± 7.89 for Pyr-d10, 99.8 ± 7.89 and 91.1 ± 9.19 for BaP-d12 for dissolved and particulate samples, respectively (n = 28 for each phase). Surrogate recoveries were used to correct analyte concentrations.
All solvents used were of analytical reagent grade. Field and laboratory blanks were processed in parallel to the samples during the analytical procedure. Some field blanks were found to be polluted with Ace, and concentrations higher than the LOQs were subtracted from Ace concentrations in the samples; laboratory blanks were found to be free of any detectable interference.

2.4. Precipitation and Determination of Ra Isotopes

The 226Ra and 228Ra activities were measured as a water mass tracer to determine the relationship between the water column structure and the change in the PAH profile as well as to calculate the renewal of bathypelagic waters. Detailed information on radium isotope precipitation methodology can be found in [48,49,50]. Briefly, after adjusting pH to 1 by concentrated HNO3, a minimally Ra-contaminated Ba-carrier was added to ~60 L of the water sample, and BaSO4 was precipitated with the Ra isotopes. Determination of the 226Ra and 228Ra activities in the samples was conducted by the low-background γ-spectrometry at the Ogoya Underground Laboratory, Japan. The method is described elsewhere [51,52]. The mean chemical yield of Ra isotopes was 85% based on the yield of the BaSO4 fraction.

2.5. Analysis of DOC and POC

Immediately after collection, water for POC (4.8 L) and DOC (0.2 L) analysis was passed through pre-combusted GFF (450 °C, 5 h). Filtered water for DOC measurement was acidified and kept at 4 °C until analysis; GFFs containing particles were kept at −18 °C. Analysis of DOC and POC was carried out on a TOC-VCPN Shimadzu analyzer with solid sample module SSM-5000A (Japan) by high-temperature catalytic oxidation, followed by the determination of the concentration of the CO2 by IR gas analysis [53].

2.6. Calculation

2.6.1. Partition Coefficient

The POC-normalized partition coefficients of PAHs between PAHs on particles and dissolved PAHs (Koc) were then calculated using the following equation:
Koc = Cpfoc/Cd
where Cp is the concentration of particulate matter normalized PPAHs (ng/kg), Cd is the DPAH concentration (ng/L) and foc is the fraction of organic carbon in particulate matter. The final units of the Koc are L/kg OC.

2.6.2. PAH Flux and Residence Time

Settling PPAH flux was calculated by multiplying the POC-normalized concentration PPAHs by the mean value of POC flux measured from the sediment trap in the western Japan Basin in December 2000 and 2001 reported in [54]. For depths where POC was not detected, POC values were taken equal to half of the detection level (0.01 mg/L). The PPAH flux calculation in the epi+mesopelagic realm (0–1000 m) was obtained using mean PPAH concentration (n = 7) within the depth 0–1000 m and settling POC flux observed at depth 927 m. The bathypelagic PPAH flux was calculated using mean PPAH concentration (n = 6) within the depth of 1000 m—bottom and POC flux observed at a depth of 2746 m.
The residence time of PPAHs and removal flux of DPAHs in the water column of the Japan Basin were determined using the following equation:
τ = M/F
where τ is the residence time of PPAHs or DPAHs (days or years); M is the total mass of PPAHs or DPAHs in the epi+mesopelagic or bathypelagic Japan Basin (tonn) derived from corresponding the mean PPAH or DPAH concentration multiplied by the epi+mesopelagic or bathypelagic volume of the Japan Basin; F is the total PPAH or DPAH removal flux in the epi+mesopelagic or bathypelagic realm of the Japan Basin (t/y). Calculating epi+mesopelagic or bathypelagic volume we used the depth of 1000 m and 2700 m, respectively, and the area of 280,446 km2 determined using the «General Bathymetric Chart of the Oceans (GEBCO). Available online http://www.gebco.net (accessed on 25 October 2019)». The residence time of DPAHs in the bathypelagic was assumed to be equal to the turnover time of deep water (1000 m-bottom) that we calculated using a steady state box model of 226Ra and 228Ra developed by [49] for the Sea of Japan (Supplementary Material, Section S1, Figure S1).

2.7. Data Analysis

Univariate statistical analyses and principal component analyses (PCA) were performed with STATISTICA Software (Version 10, StatSoft Inc., Tulsa, OK, USA). PCA is a multivariate statistical method for examining factors to reveal relationships and patterns within datasets. Data submitted to the analysis were arranged in a matrix composed of eight to nine variables (PAH compounds) and the appropriate number of sample sites. The sizes of the matrices were 9 × 28 and 8 × 28 for the dissolved and particulate phases, respectively. Prior to PCA, the original dataset of PAH concentrations was standardized by scaling the values to the mean and standard deviation. The results of the PCA are presented by loading and score plots.

3. Results and Discussion

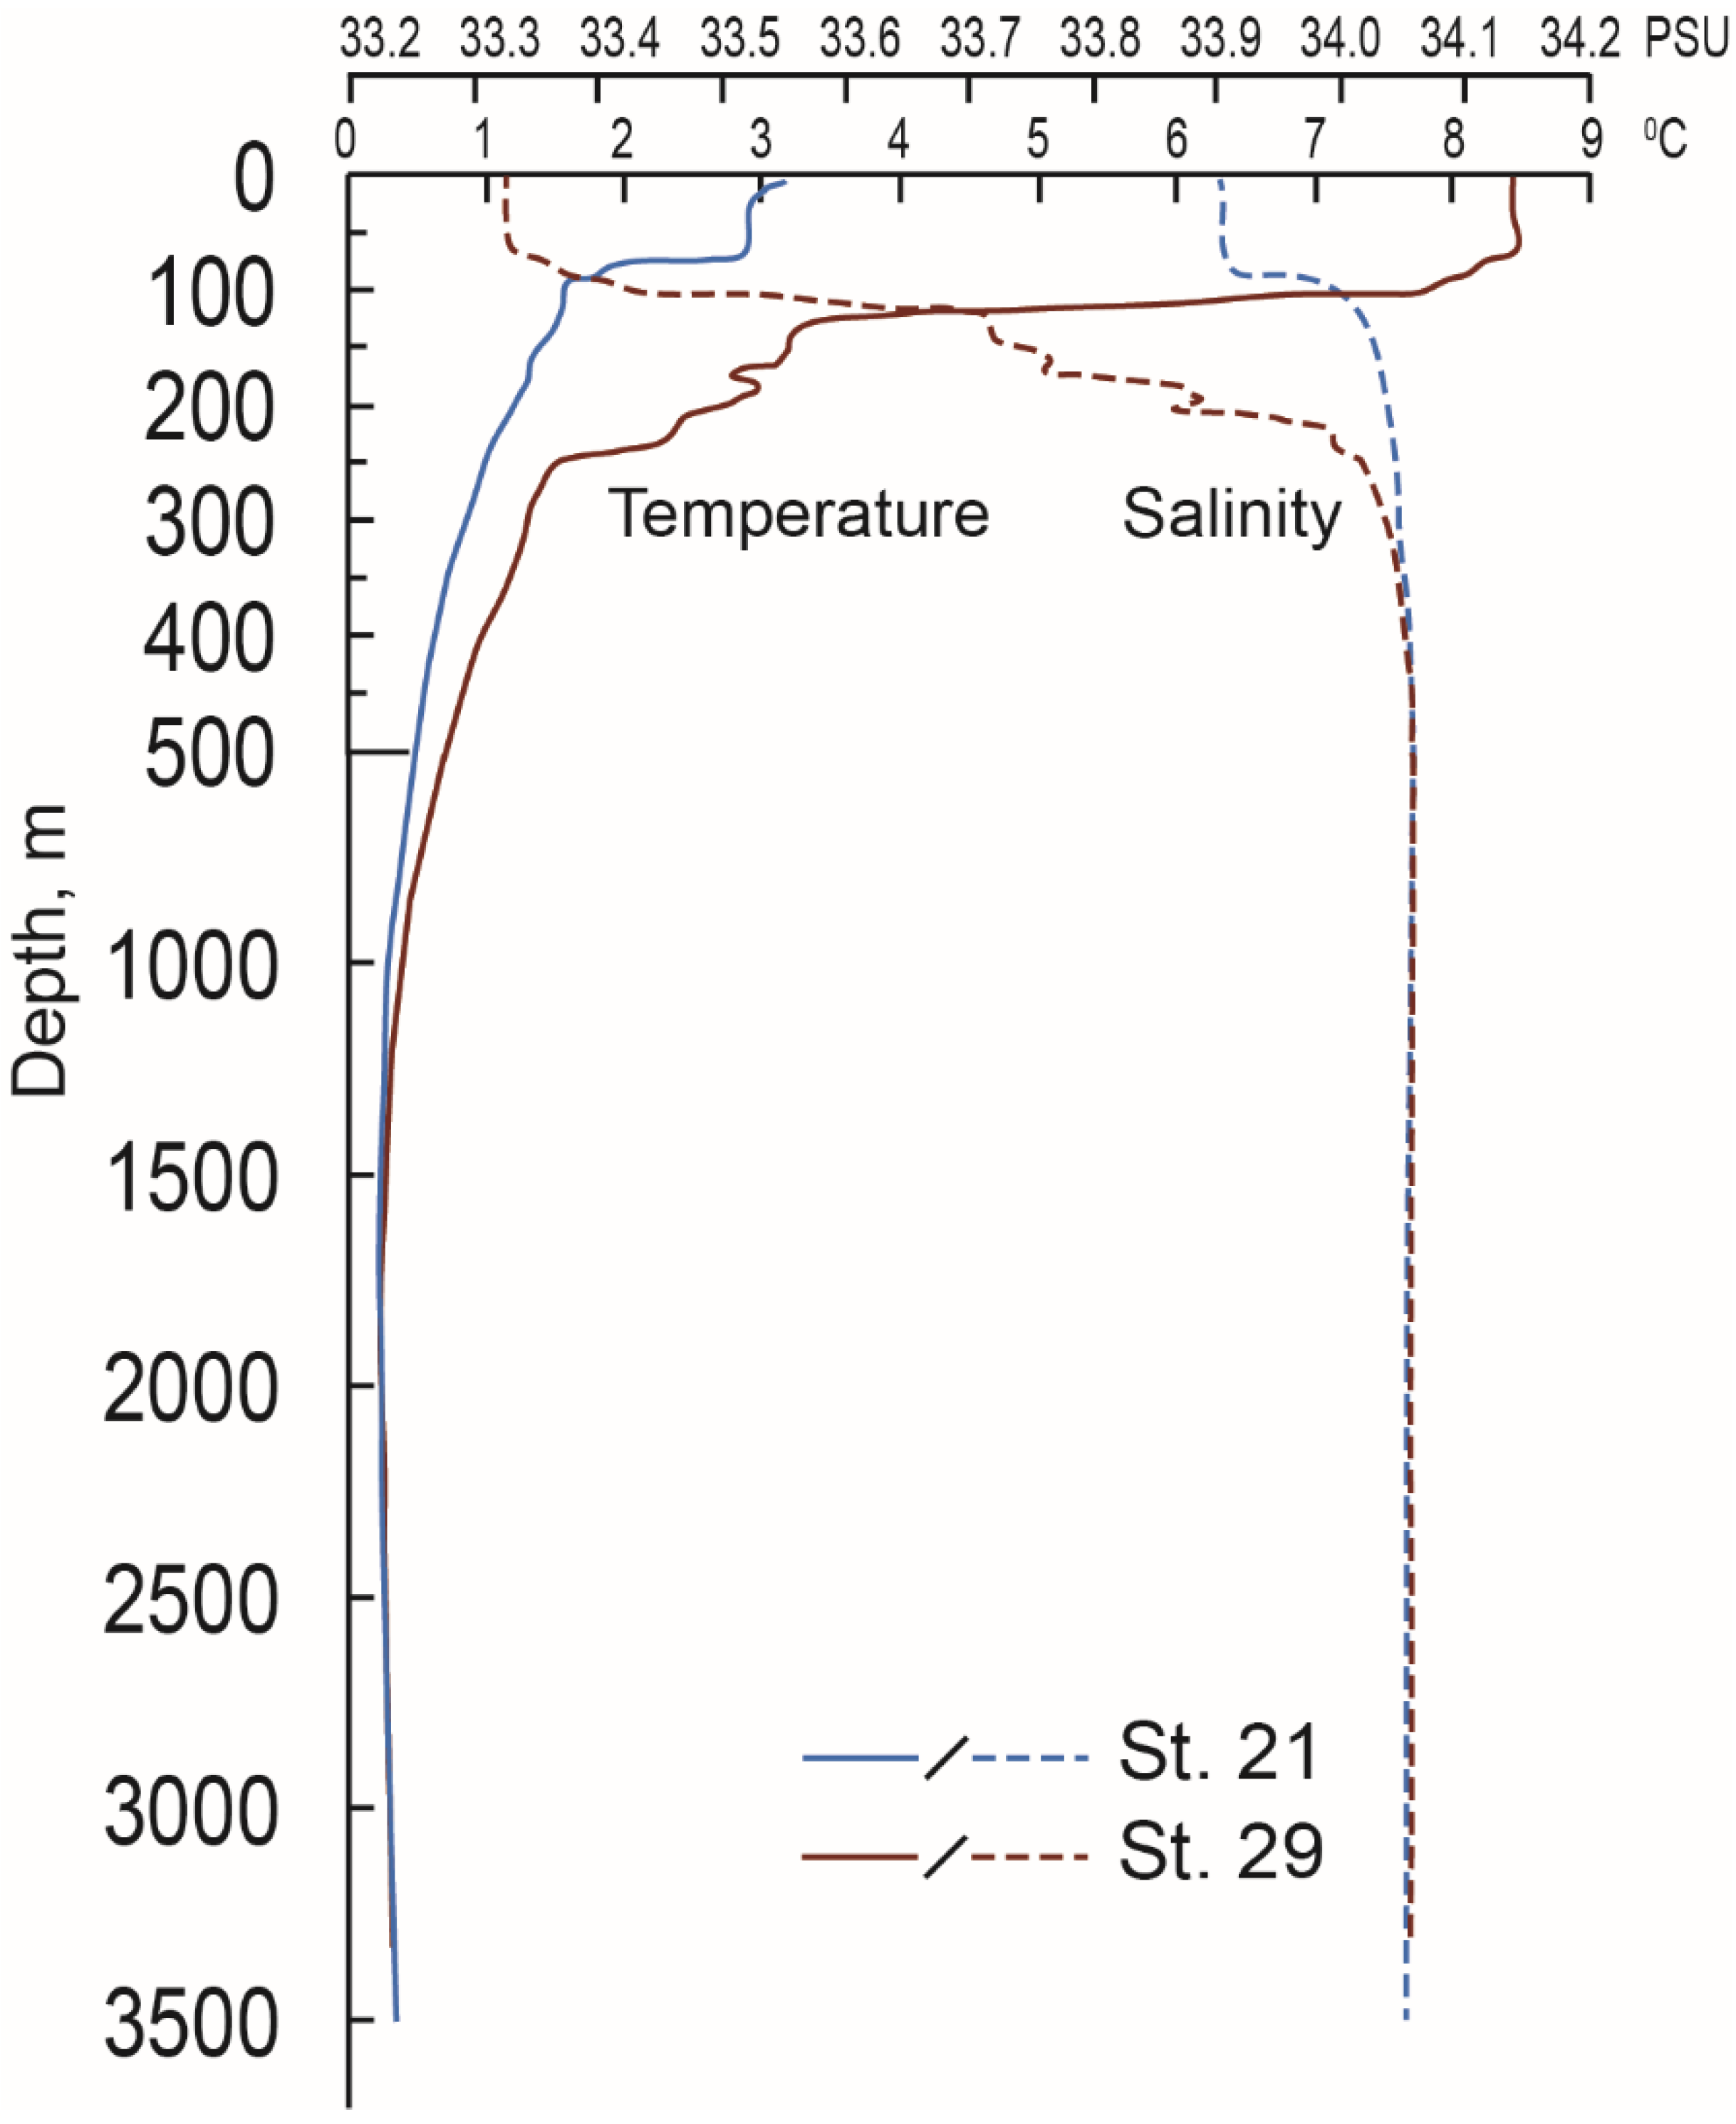
3.1. The Thermohaline and Radium Isotopes Profiles

Figure 2 shows the vertical profiles of temperature and salinity at St.21 and St.29. In general, the thermohaline structure was found to be as typical for the northern Sea of Japan in winter. At St.21, the surface mixed layer occupied a depth of 0–72 m, with a maximum of temperature 2.9 °C and a salinity of about 33.9 PSU (Figure 2). The seasonal and main thermoclines were observed and below them, there was no clear temperature fluctuation from 2400 m to the bottom. The surface mixed layer at St.21 differed from that at St.29. It was shallower from 0 to 58 m, with a higher temperature and lower salinity compared to St.21 (Figure 2). The trend of seasonal and main thermoclines, as well as the deep-water temperature and salinity at this station, were similar to St.21.
The results of 226Ra and 228Ra activities are presented in Figure 3 (with ±0.04SE). 226Ra ranged from 1.24 to 2.34 mBq/L at St.21 and from 1.4 to 2 mBq/L at St.29, with the highest values found in the bathypelagic, decreasing to the surface (Figure 3a). 226Ra activity at St.29 was clearly lower than at St.21 and previously detected in the Yamato and the eastern Japan basins [49]. 226Ra formed in the sediment is distributed to the ocean through porewater advection and diffusion across the sediment–water interface ([55] and references within). It is likely the difference in the 226Ra activity indicates the different structure and composition of the sediment influencing 226Ra input to the water body.
228Ra activity varied between 0.05 and 1 mBq/L at St.21 and between 0.1 and 1.47 mBq/L at St.29 (Figure 3b). The surface layer up to 30 m at St.21 and 50 m at St.29 were the most enriched in 228Ra. There was a sharp decrease in 228Ra in the deeper water, with a slight rise near the bottom. 228Ra values in the surface water at St.29 were similar to those observed in the Yamato and the eastern Japan Basins [49]; however, they were higher compared with the surface water at St.21. As 228Ra has a significantly shorter half-life than 226Ra, its content in the open sea is mainly dictated by connections with the coast and shelf, allowing the use of 228Ra as a tracer of shelf water ([55] and references within). Thus, higher 228Ra activity along with lower salinity at St.29 suggests shelf-derived water contributed to this area.

3.2. PPAH and DPAH Vertical Distribution

The total concentration of sum 8PPAH (Σ8PPAH) ranged from 0.91 to 1.71 ng/L at St.21 and from 0.87 to 1.68 ng/L at St.29 (Tables S1 and S2). The surface enrichment depth depletion trend was observed only for the PPAH profile at St.29, where PAH concentrations in the upper water column (0–200 m) clearly exceeded those in the underlying water layers (Figure 4a). The surface enrichment-depth depletion PAH profile is believed to result from the sorption of PAH molecules by phyto- and zooplankton biomass in the top meters of the water column and following degradation and/or transition of PAHs into the dissolved organic matter during particle sinking ([16] and references within). At St.29, an enrichment of PPAHs was observed in the area of maximal chlorophyll a fluorescence (Figure S2), implying PAH sorption into phytoplankton cells. Another PAH concentration rise was shown in the upper mesopelagic (200 m) and it was more prominent than that in the epipelagic realm. A similar sharp increase in PPAH concentrations in the mesopelagic was observed earlier in the Sea of Japan [30,33]. A possible reason for this is associated with thermohaline circulation in the Sea of Japan. Deep convection occurs in winter after freeze-up brine rejection makes coastal waters dense, such that they sink into the Japan Basin [27]. This cascading of shelf and coastal water contaminated with PAHs can carry PAHs into the deep sea interior. Moreover, the water layer occupying a depth between 200 m and 300 m is considered Japan Sea Intermediate Waters, and its formation and subduction can transport anthropogenic carbon dioxide into deeper water [56]. Although the thermohaline profiles did not reveal a clear presence of intermediate water in this survey, we believe that its subduction could produce mesopelagic PAH abundance. In addition, the Japan Sea Intermediate Waters contained the highest content of dissolved oxygen below the photic zone [56]. This potentially favors the aerobic decomposition of particulate organic matter by heterotrophic bacteria, resulting in the fragmenting of larger particles with PAHs into smaller particles. The decreasing of particles may in turn cause the slowing of the PAH sinking flux and hence PPAHs are accumulated, giving rise to the PAH concentrations in this layer.
At St.21, the PPAH profile did not show a pronounced surface enrichment-depth depletion pattern, and it was fairly uniform except for a PAH maximum at 1000 m. The difference in the PPAH profiles between St.21 and St.29 may have been due to the influence of different hydrological and biogeochemical factors at each sampling site. As mentioned above, an area of St.29 received the influx of surface shelf waters, which are enriched in nutrients from the upwelling [57] and winter convection, which is typical for the northwestern Sea of Japan in cold periods, can cause nutrients to rise from the shelf bottom [58]. The higher nutrient concentration contributes to higher biological productivity, resulting in the surface enrichment-depth depletion PAH pattern. In contrast, St.21 receives biomass-depleted waters, developing weak PAH accumulation in the upper water column. Another explanation for the relative homogeneity of the PPAH profile at St.21 is the mixing of water layers and the restriction of primary production by an anticyclonic mesoscale eddy, the remnants of which were observed during sampling (Figure S3).
The total concentration of the sum 9DPAH (Σ9DPAH) varied from 7.97 to 15.11 ng/L at St.21 and from 5.56 ng/L to 13.76 ng/L at St.29 (Tables S3 and S4). The DPAH vertical patterns at both stations were similar (Figure 4b). The minimal DPAHs were found in the surface waters (0–20 m,), then the PAH concentration increased to the middle mesopelagic, where the maximum was found at 300 m for St.21 and at 500 m for St.29, followed by a relatively uniform distribution of PAHs, with the exception of a concentration increase at a depth of 2500 m. It should be noted that the vertical pattern of DPAHs in the surface waters (up to 50 m) repeated that of 228Ra, which indicates the same transport pathway for these substances to the open sea.
In the mesopelagic zone, an increase in DPAHs was followed by maximal PPAHs with depth. Kannan and coauthors [59] found a similar mesopelagic increase for particulate and dissolved polychlorinated biphenyls (PCBs) and nonylphenols in the eastern Sea of Japan, and they suggested that this was a consequence of intermediate/deep water formation. Apart from DPAH input due to water mass circulation we suppose the higher mesopelagic DPAH could additionally have been caused by the biotransformation of sinking particles. The substrate (POM) decomposes by bacterial hydrolysis to DOM and CO2, with predominantly destructing labile organic molecules [60]. Unconsumed PAH molecules can transfer into solution or remain adsorbed on the freshly produced DOM.
The DPAH peak at a depth of 2500 m at both St. 21 and St. 29 was probably associated with lateral PAH input. There was observed cyclonic circulation along the basin periphery in the abyssal Japan basin [61], and apparently, the deep-water current transferred PAHs were resuspended from shelf slope sediments into the sampling area.

3.3. Comparison with Worldwide Deep Water Pollution

The PAH concentration in each ecological vertical zone in this study, and those reported in other marine areas globally, are presented in Table 2. Because it is difficult to compare reported PAH concentrations derived from different amounts of PAH compounds, we considered studies with a number of PAHs close to that of our study. In general, deep-sea PPAH and DPAH pollution in the Sea of Japan is higher than in the Mediterranean Sea, Tropical Atlantic, Prydz Bay, and Gerlache Inlet (Antarctica). Moreover, a survey in the Sea of Japan in the summer of 2010 detected that DPAH concentrations were in the same range as in our study, while PPAH concentrations were higher than the PPAH values reported here.
Comparing between ecologic realms, the mesopelagic in the Sea of Japan contained slightly more PAH compared to other realms. A similar PAH distribution was found in the summer of 2010 for the Sea of Japan (Table 2). Moreover, a higher mesopelagic PAH concentration was found in the Tropical Atlantic, Prydz Bay, and Gerlache Inlet (Antarctica). However, for the Gulf of Mexico, the Mediterranean Sea and the North Atlantic, the PAH content was abundant in the upper water column. The results indicated that the vertical PAH pattern is associated with hydrological and biogeochemical modes in the marine basin. The difference in such factors as deep ventilation, bioproductivity, zooplankton, and bacterioplankton community composition can provide different vertical PAH transfer to the deep sea, eventually concentrating PAHs in a particular marine vertical zone.

3.4. Relationship between PAHs and Organic Carbon

The POC concentration varied from a lower detection values level to 48.7 µg/L, and the DOC concentration was between 0.93 and 1.51 mg/L. The highest content of POC and DOC were found in the top meter of the water column, and then concentrations sharply decreased to the mesopelagic (Figure 4c,d). The organic carbon trend differed from the PAHs, increasing in the mesopelagic, and then in deep water, the organic carbon decreased while PAHs remained relatively constant to the bottom.
The dissimilarities in the PPAH and POC profiles in the epi- and mesopelagic were not consistent with the results obtained in the northern Gulf of Mexico, where the pattern of change in POC concentrations at the depth of 100–400 m was similar to that of PPAHs, though the latter was less pronounced [65]. Moreover, in general, PPAHs were found to be more resistant in comparison with POC during transport through the water column. In other words, when the labile OC fraction is removed by mineralization, PAHs are comprised of refractory organic matter in the deep ocean. To support this, a survey of organic matter settling flux using sedimentary traps found that, in the deep Japan Basin, allochthonous organic matter is more resistant than autochthonous matter [54], and PAHs of pyrogenic origin as in our study (See Supplementary Material, Section S2 and Figure S4) can be included in the former. Another factor preventing PAHs from degradation is that the temperature of cold subarctic waters can inhibit the bacterial ability to break down organic compounds [25], and, in the Sea of Japan, the persistence of DOM observed in the previous study [28] and PAHs in this work may be associated with low temperature in the deep water.
The correlation between PAHs and organic carbon suggests either similar or different biogeochemical pathways of PAHs and organic matter in the marine environment. There was no significant correlation between epipelagic POC and PPAHs in our study. This was not consistent with findings in the northern Gulf of Mexico, which suggested PPAHs and POC were very strongly positively correlated in the upper water column [65]. In the Gaoping Submarine Canyon located off the southwestern Taiwan coast, a study on PAH settling flux found a good relationship between PAHs and POC at a depth of 60 m [67]. However, there was no correlation at the depth of 280 m in the same work. This discrepancy was explained by PAHs attaching to different adsorbents, organic or soot carbons, dominant in either the surface or deeper water column. Indeed, a higher content of carbonaceous geosorbents (black carbon, unburned coal, etc.) in the sediment enhances PAH sorption coefficients by one to two orders of magnitude above predictions based on amorphous organic carbon partitioning alone [68]. As the main PAH sources in this study were believed to be combustion, some PAHs were likely sorbed onto soot particles, while other PAHs were sorbed onto biogenic carbon, which can disrupt the correlation of PAHs and POC.
As to DPAHs, they were moderately correlated with DOC in the water column below the epipelagic realm (200 m—bottom, r = 0.53 at St.21 and r = 0.57 at St.29, p = 0.05, n = 9), suggesting that DPAHs and DOM have partially similar sources to the deeper water. A proportion of DOM derives from the dissolution of sinking particles [69], and this potentially includes PAHs formation of DOM and DPAHs, which can occur at the same time. Furthermore, DPAHs may enter the deep water of the Sea of Japan along with DOM, which can be exported down into the ocean interior by overturning circulation [70].

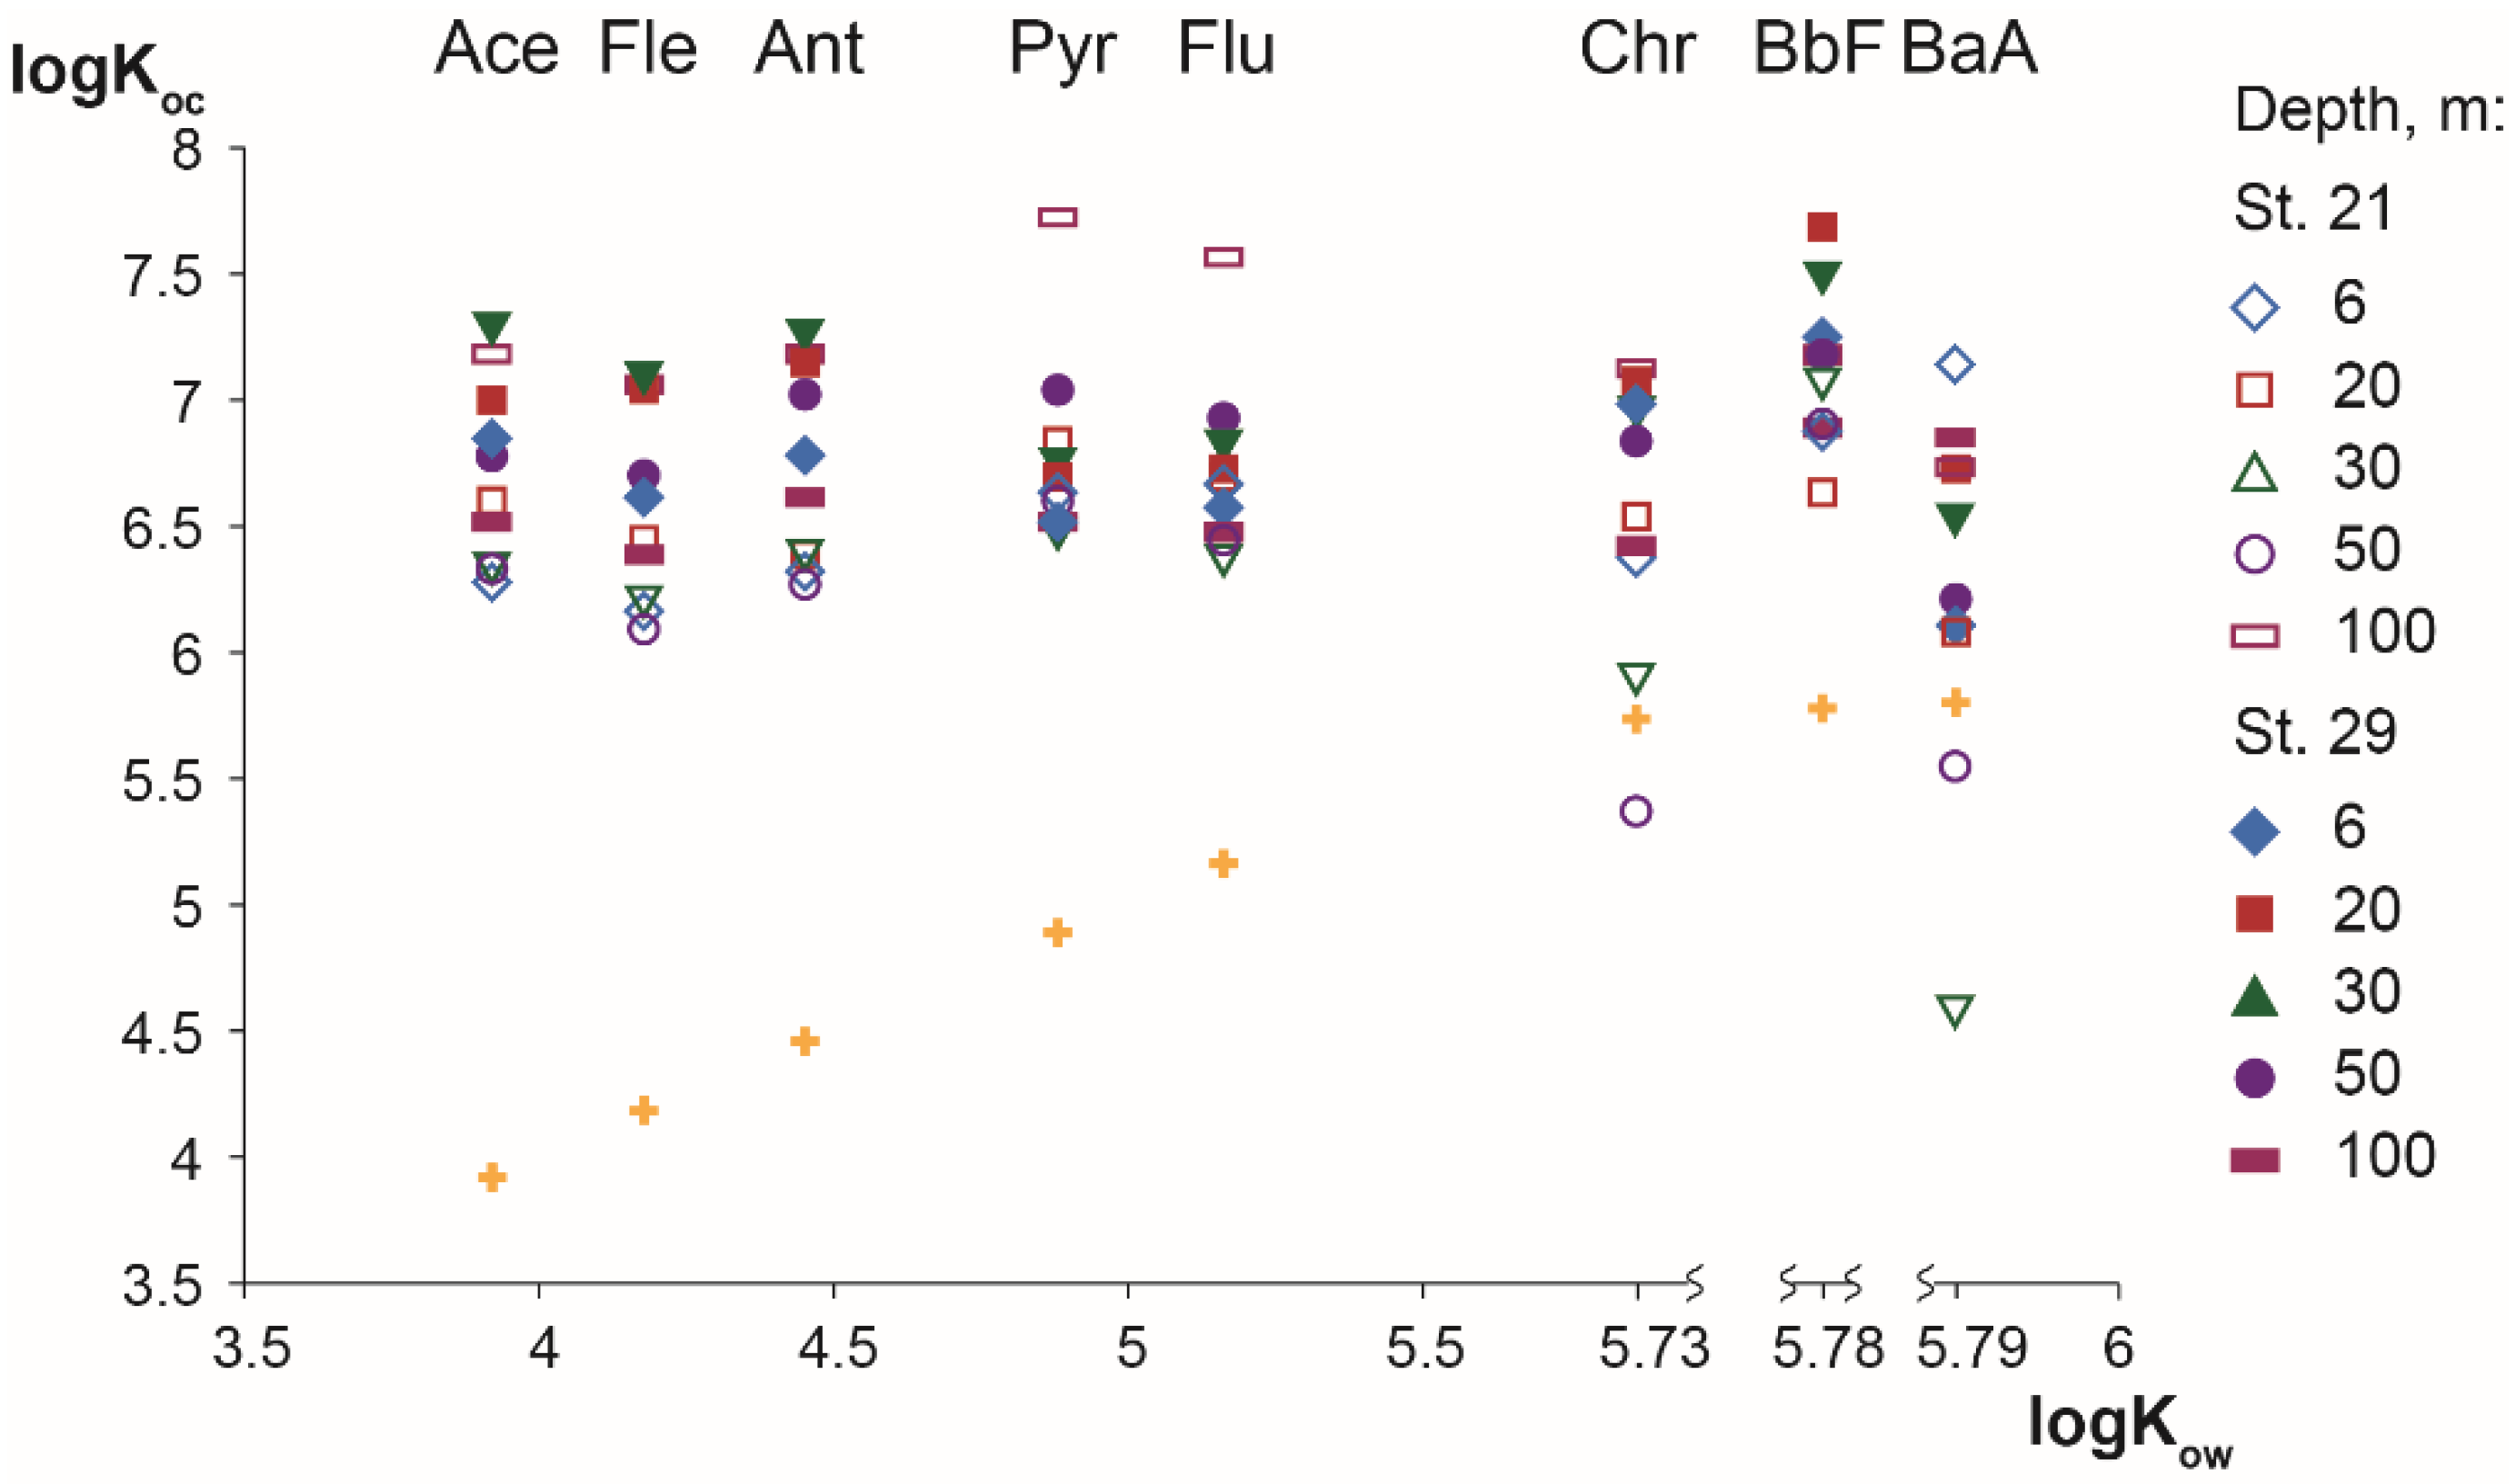
3.5. PAH Partitioning

In all samples, DPAH accounted for a significant proportion of the total PAHs. The mean percentage of PPAHs was 10.3 ± 2% at St.21 and 12.8 ± 3.2% at St.29. The similar strong predominance of the DPAH fraction over the PPAH fraction was reported in previous studies carried out in the northern South China Sea, the East China Sea, and the Yellow Sea [44]. As hydrophobic compounds, PAHs tend to associate with both particulate and dissolved organic compounds. In our study, we found that the concentration of dissolved carbon was at least two orders of magnitude higher than that of particulate carbon (Figure 4c,d). Thus, the observed distribution of PAHs between the dissolved and particulate phases obviously depended on the carbon content in the corresponding fraction. The DPAH and PPAH proportion was almost uniform from the top to bottom of the water column, except for a slight increase in the DPAH fraction in the upper mesopelagic (Figure 5), which confirmed the above assumption that the PPAHs are partially transitioned into a dissolved form there.
The partition coefficient Koc describes the PAH partitioning based on particulate organic carbon content. As we obtained POC results only for the top of the water column, applying Equation (1) we calculated the Koc of individual PAHs for depths from 0 to 100 m. Correlating log Koc with log Kow, we found no relationship between them for almost all depths (Figure 5). This result was not consistent with findings in the surface water of the northern South China Sea, the East China Sea, and the Yellow Sea in winter, where a moderate to strong positive relationship between Koc and Kow was observed [44]. The lack of correlation in our study was caused by the Koc values for three-ring PAHs, Flu, and Pyr being significantly higher than Kow whereas the Koc of more heavily weighted PAHs were closer (Figure 5). There could be several reasons for the enhanced Koc of lower molecular PAHs. As mentioned above, their attachment to soot particles can increase the content of PAHs in the particulate phase [68]. Furthermore, it is likely some proportion of the PAHs, during synthesis, can be rigidly included in the structure of soot particles [72]. If these particles eventually constitute a proportion of suspended matter in the marine environment, their PPAHs cannot be involved in the processes driving the particle–solution equilibrium.
Additionally, Equation (1) takes into account the association of PAHs only with particulate organics, whereas, in this study, the DPAH fraction included truly dissolved PAHs and PAHs associated with DOM. It was shown using a three-phase model that DOM can contribute to the nonlinearity between Koc and Kow [73]. It is possible in the sampling period in December when epipelagic biological activity was weak, to scavenge PAHs and repack them into the particles, as well as to produce enough detritus sorbing PAHs that the DOM played a more important role in PAH partitioning. Concerning the higher molecular PAHs (BaA, Chr and BbF), their Koc suggested that hydrophobicity is still a relevant factor for these PAHs as a driver of PAH distribution between the particles and solution, determining their pathways in the marine environment.

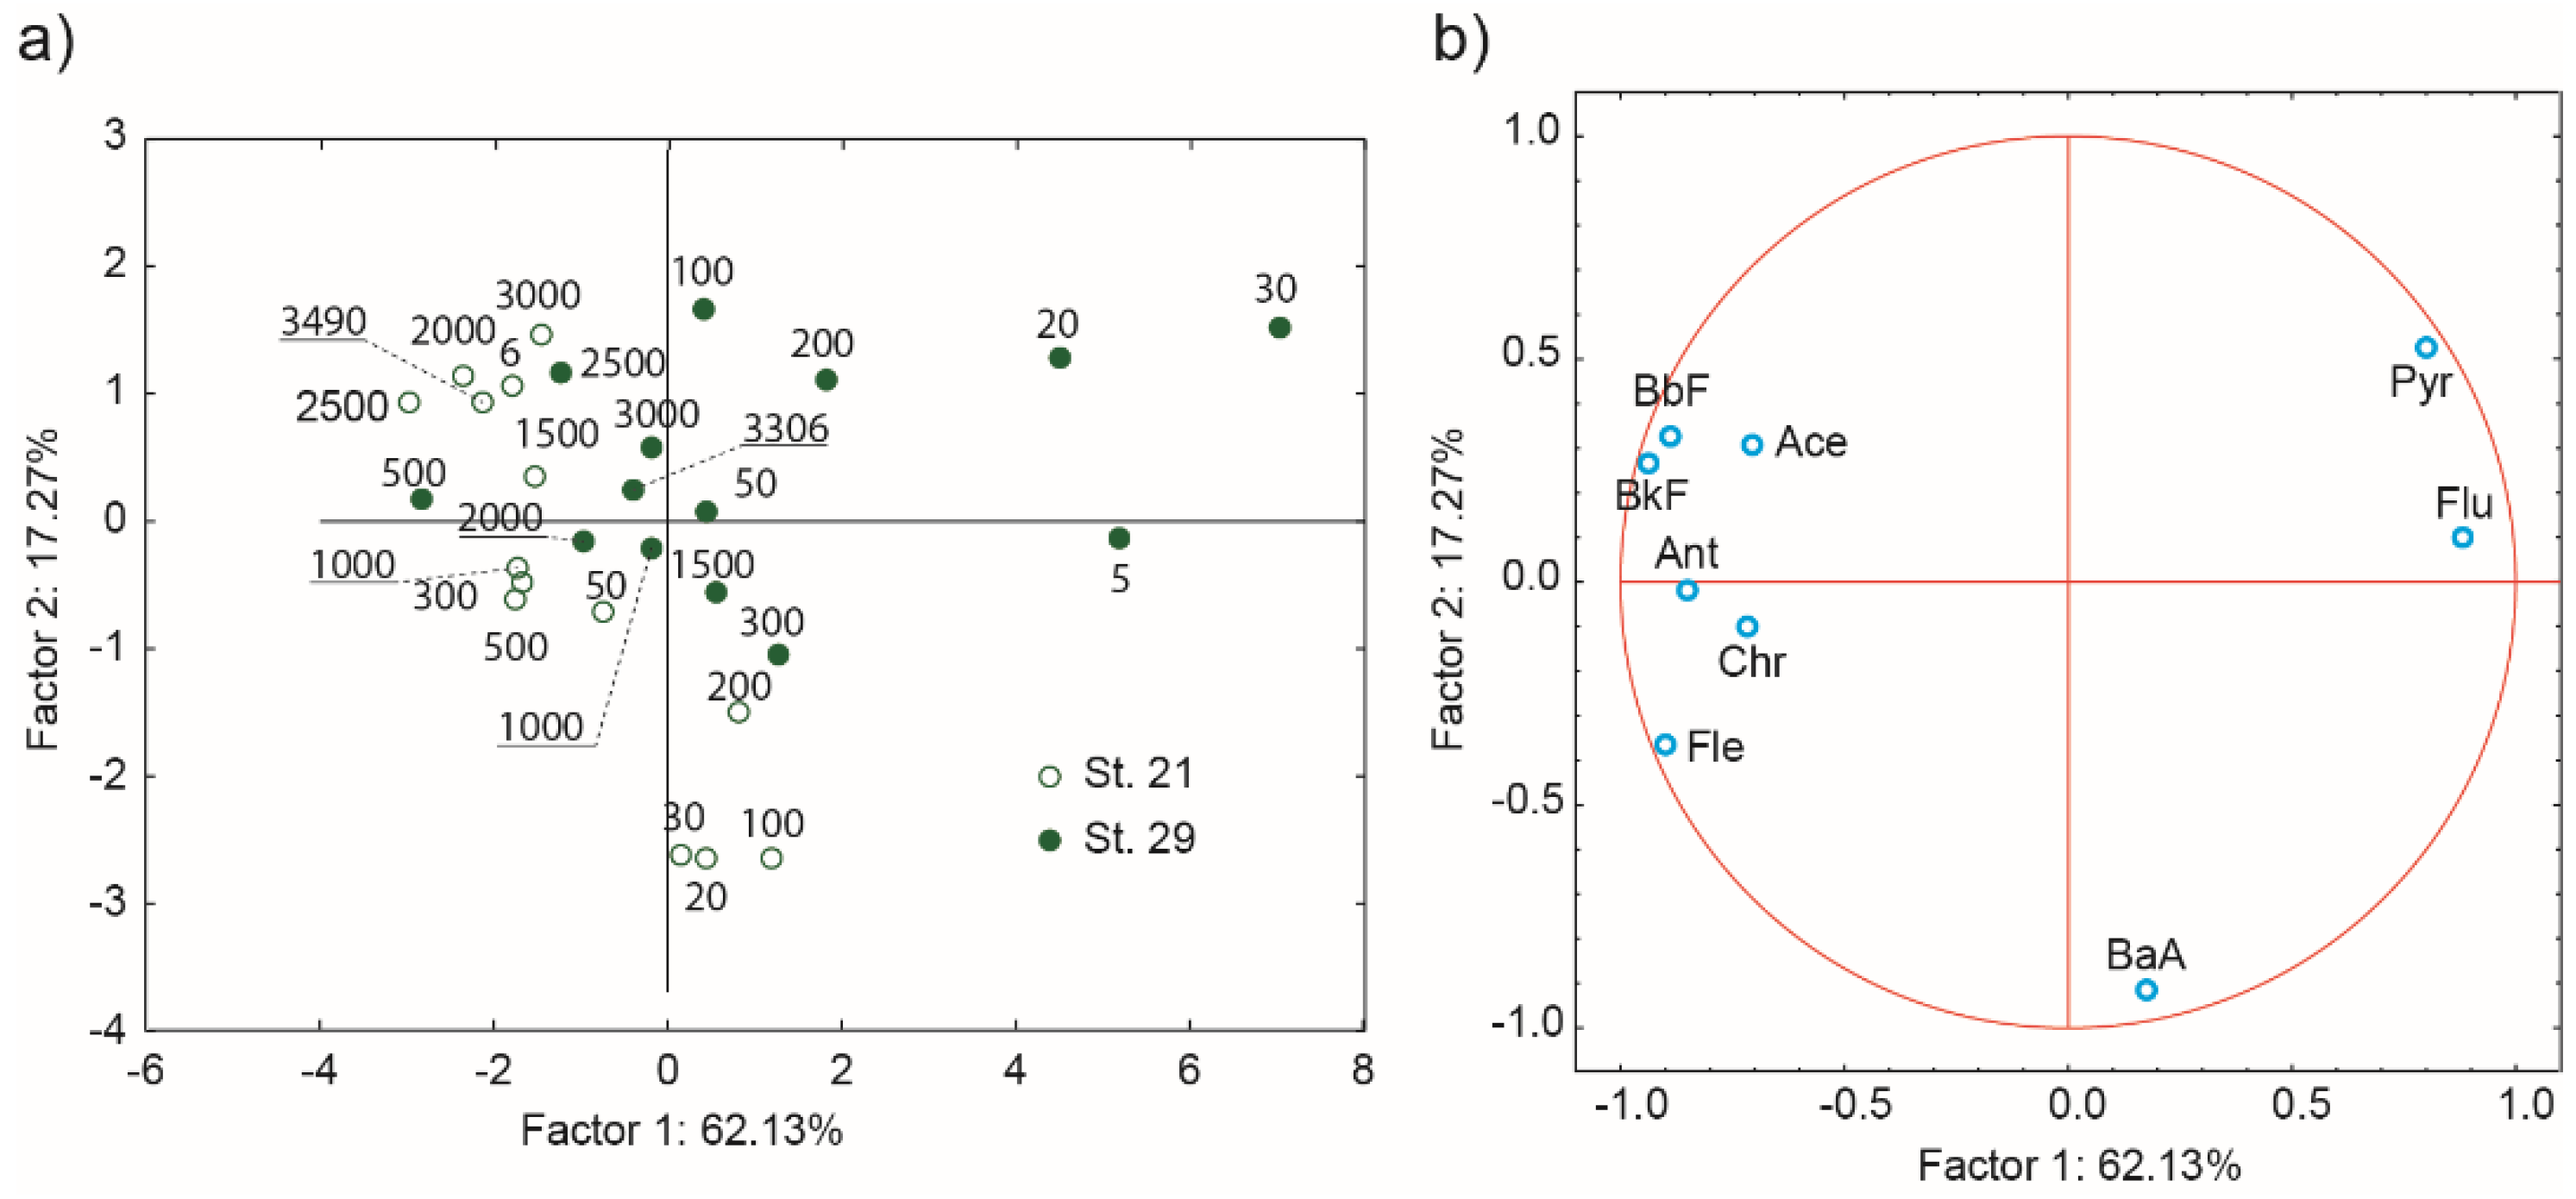
3.6. PAH Composition and PCA Analysis

Relative contributions of PAHs with different numbers of rings in all depth layers of two stations are shown in Figure 6. The most abundant PAHs were Fle, Ace, Flu, and Pyr, which accounted for 79–94%, and three-ring PAHs were strongly dominant in each sample except for PPAHs at a depth of 100 m and 1500 m at St.21, where the contribution of three-ring PAHs was similar to that of four-ring PAHs. The three-ring PAHs accounted for 43–84% of the dissolved and particulate phases. The strong predominance of three-ring PAHs is consistent with the results obtained for the water column of the South China Sea [44]. When considering the alteration of the PAH profile with depth, a higher relative abundance of four-ring DPAHs was found in the upper waters compared to the lower realms. A prominent increase in four-ring PAHs during the cold period is typical for the coastal waters of the north-western Sea of Japan. These PAHs enter the coastal environment via the atmosphere as a result of emissions from heating systems in the winter or with terrestrial runoff polluted after snow and ice melting [33,74]. Thus, the observed increase in four-ring PAHs in the open seawater column potentially indicated the PAHs contributed by coastal waters.
To provide additional information on factors influencing PAH composition changes with depth, PCA was performed for PPAHs and DPAHs. Figure 7a indicates that for DPAHs, PC1, which accounted for 62% of the total variance in the samples, was distributed like those from deep water on the negative axis to those from depths of 0–200 m on the positive side, whereas among the latter there was a clear grouping of samples at the depth 0–30 m from St.29 with the highest scores (Figure 7b). Kannan and coauthors [59], researching PCBs in the eastern Sea of Japan, revealed the samples on the PCA score plot were split into four groups that appeared to be identical to the water mass classification (Surface, Intermediate, Deep, and Bottom waters). However, in our study, the difference was manifested only between the mixing surface layer located on the positive side and other water masses located on the negative side. The positive axis had a strong loading of four-ring Flu and Pyr (Figure 7b). The result was consistent with the observed increased percentage of four-ring DPAHs in the upper waters. Moreover, the distinct separation of surface water samples at St.29 from those at St.21 was in agreement with results for 228Ra content showing that St.29 is considerably influenced by shelf waters in comparison with St.21. This result confirmed that the change in the DPAH composition through the water column is due to the influx of coastal polluted waters, and it follows that, potentially, four-ring DPAHs can be used as tracers to identify the origin and pathways of water masses in the Sea of Japan.
The PC2 is likely associated with the influence of the mesoscale eddy since it defined the separation of upper waters on St. 21 from the rest of the water masses. However, this separation is not clear, and therefore, it is difficult to really determine what factor is responsible for the difference in the PAH load in these waters.
The PCA performed for PPAHs did not reveal any distinct grouping of samples with the water mass structure. In general, there was a division between St.21 and St.29, probably due to changes in the PAH profiles for the atmospheric particles before the PAH input to the sea surface. More detailed information is described in (Supplementary Material, Section S3, Figure S5).

3.7. PAH Flux and Residence Time

In the epi+mesopelagic and bathypelagic zones, the PPAH flux calculated was 2108 ng/m2d and 1133 ng/m2d (total PPAH flux in the Japan Basin was 215.8 tonnes per year and 116 tonnes per year), and the residence times were 1.5 years and 6.8 years, respectively. Even though the bathypelagic PPAH flux showed double the decrease in the upper PPAH flux, its value was probably overestimated, because resuspended sedimentary PAHs are involved in the vertical PPAH flux. This was supported by Otosaka’s findings in the Sea of Japan, and in particular, in the Japan Basin, that aged POCs from the bottom nepheloid layer were advected by bottom currents and incorporated into sinking particles throughout the depth of the bathypelagic [54]. Obviously, sedimentary PAHs may be part of this age-related POC, and the value of bathypelagic PPAH flux came from resuspended sediment and laterally supplied PAHs, as well as PAHs sinking from upper layers, which led to misrepresentation of the estimation of the bathypelagic vertical PAH flux.
A comparison of PPAH flux in this study with PAH fluxes around the world is shown in Table 3. In general, the PAH flux in the Japan Basin was higher than the PAH flux in most of the studied marine areas. However, it was lower than the PAH flux reported in the Gaoping Submarine Canyon (the South China Sea) and in the same order of magnitude as those found for the East China Sea [75], Puget Sound (Salish Sea, Pacific Ocean), and Gulf of Lion (the northwestern Mediterranean Sea). In the latter case, the observed PPAH flux was enhanced due to the dense water cascading event. Similarly, the high value of the PPAH flux in our case was also related to the fact that the particle flux was increased in December, probably due to the deep convection originating from that sea-ice formation, which produces dense waters sinking to the abyssal ocean [27].
As we assumed that DPAH removal from the water column is more likely to be associated with deep water formation than with particle settling, we calculated the turnover time of the bathypelagic water in the Japan Basin using a steady state box model of 226Ra and 228Ra (Supplementary Material, Section S1). The resulting deep water turnover time and, thus, DPAH residence time was 82 years. Consequently, applying Equation (S5) (Supplementary Materials, Section S1), the total DPAH removal flux was 71.6 tonnes per year (699 ng/m2d). This value is one and a half times less than that of the total PPAH flux; however, given that the latter was overestimated, the values of both fluxes can be considered to be approximately at the same level. This differs from the Norwegian, Weddell, and Ross Seas, where it was calculated that the subduction flux of organic pollutants such as PCBs was two to seven times higher than their sinking flux with particles and is consistent with the results obtained for the Labrador Sea, where the subduction flux of most of the PCB congeners presented in the study was similar to that of the particulated PCBs [14]. The variability in the ratio of subduction PCB flux to particle flux among the seas was explained by the difference in the productivity of the waters of these seas. Obviously, in the Sea of Japan, despite the fact that PPAH concentrations were much lower than DPAH, high biological productivity results in similar contributions to PAH removal from both the biological pump and the deep overturning circulation.
In conclusion, the examination of PPAH and DPAH vertical patterns in the Japan Basin of the Sea of Japan revealed that they are mainly determined by the hydrological and biogeochemical modes of the study area. The highest PAH concentrations were found in the mesopelagic and are related to cascading polluted coastal-shelf-derived waters or the subduction of intermediate waters in the western Japan Basin. The PAHs were shown to be notably refractory when sinking from the surface to the bottom compared to most of the organic matter. In general, POM did not affect the vertical PAH distribution in the water column, while the DOM and DPAHs had a similar source below the epipelagic. Despite the fact that the DPAH concentration was several times higher than that of PPAHs, as a result of the dominance of DOM over POM, Koc indicated that PAHs were significantly more associated with POM than with DOM. Moreover, PAH removal from the water column via sedimentation on particles was as effective as removal via renewal of the water, which was probably due to the increased sedimentation of PAH flux by winter deep convection. Thus, this work elucidated the role of some factors controlling the biochemical cycle of PAHs in the marine environment; however, further research is needed on the processes affecting the partitioning, transport, and removal of PAHs in the water column.

Supplementary Materials

The following supporting information can be downloaded at: https://www.mdpi.com/article/10.3390/jmse10122015/s1, Figure S1: a simple two-box model for the delivery of 226Ra and 228Ra to the DPW; Table S1: the PPAHs concentrations (ng/L) at St.21 in the Japan Basin (Sea of Japan); Table S2: the PPAHs concentrations (ng/L) at St.29 in the Japan Basin (Sea of Japan); Table S3: the DPAHs concentrations (ng/L) at St.21 in the Japan Basin (Sea of Japan); Table S4: the DPAHs concentrations (ng/L) at St.29 in the Japan Basin (Sea of Japan); Figure S2: chlorophyll a vertical profiles at the sampling stations in the Japan Basin; Figure S3: water surface temperature of the Sea of Japan during the sampling period; Figure S4: Plots of PAH isomer pair ratio based on total PAH concentration (PPAH+DPAH); Figure S5: Principal component analysis of the deep water samples from the Japan Basin. Refs. [54,62,71,87,88,89,90,91] are cited in Supplementary File.

Author Contributions

Conceptualization, Y.K.; methodology, Y.K, T.C., M.I. and R.M.; validation, Y.K., T.C. and M.I.; formal analysis, Y.K. and T.C.; investigation, Y.K., T.C., M.I. and E.M.; resources, T.C., K.H. and S.N.; writing—original draft preparation, Y.K.; writing—review and editing, ALL; visualization, Y.K. and T.C.; project administration, K.H., S.N., Y.K. and T.C. All authors have read and agreed to the published version of the manuscript.

Funding

The investigations were supported by the Ministry of Science and Higher Education of the Russian Federation (grant 13.1902.21.0012, contract No 075-15-2020-796).

Institutional Review Board Statement

No applicable.

Informed Consent Statement

No applicable.

Data Availability Statement

No applicable.

Acknowledgments

The authors would like to thank A.F. Sergeev and his oceanographic group for providing the CTD and in situ chlorophyll fluorescence data.

Conflicts of Interest

The authors declare no conflict of interest.

References

  1. Honda, M.; Suzuki, N. Toxicities of Polycyclic Aromatic Hydrocarbons for Aquatic Animals. Int. J. Environ. Res. Public Health 2020, 17, 1363. [Google Scholar] [CrossRef] [PubMed] [Green Version]
  2. IARC Working Group on the Evaluation of Carcinogenic Risks to Humans. Some non-heterocyclic polycyclic aromatic hydrocarbons and some related exposures. IARC Monogr. Eval. Carcinog. Risks Hum. 2010, 92, 1–853. [Google Scholar]
  3. González-Gaya, B.; Fernández-Pinos, M.C.; Morales, L.; Méjanelle, L.; Abad, E.; Piña, B.; Duarte, C.M.; Jiménez, B.; Dachs, J. High Atmosphere-Ocean Exchange of Semivolatile Aromatic Hydrocarbons. Nat. Geosci. 2016, 9, 438–442. [Google Scholar] [CrossRef]
  4. Cai, M.; Liu, M.; Hong, Q.; Lin, J.; Huang, P.; Hong, J.; Wang, J.; Zhao, W.; Chen, M.; Cai, M.; et al. Fate of Polycyclic Aromatic Hydrocarbons in Seawater from the Western Pacific to the Southern Ocean (17.5° N to 69.2° S) and Their Inventories on the Antarctic Shelf. Environ. Sci. Technol. 2016, 50, 9161–9168. [Google Scholar] [CrossRef]
  5. Sun, C.; Soltwedel, T.; Bauerfeind, E.; Adelman, D.A.; Lohmann, R. Depth Profiles of Persistent Organic Pollutants in the North and Tropical Atlantic Ocean. Environ. Sci. Technol. 2016, 50, 6172–6179. [Google Scholar] [CrossRef] [Green Version]
  6. Ma, Y.; Halsall, C.J.; Xie, Z.; Koetke, D.; Mi, W.; Ebinghaus, R.; Gao, G. Polycyclic Aromatic Hydrocarbons in Ocean Sediments from the North Pacific to the Arctic Ocean. Environ. Pollut. 2017, 227, 498–504. [Google Scholar] [CrossRef] [Green Version]
  7. Galbán-Malagón, C.; Berrojalbiz, N.; Ojeda, M.J.; Dachs, J. The Oceanic Biological Pump Modulates the Atmospheric Transport of Persistent Organic Pollutants to the Arctic. Nat. Commun. 2012, 3, 862. [Google Scholar] [CrossRef] [Green Version]
  8. Nizzetto, L.; Gioia, R.; Li, J.; Borgå, K.; Pomati, F.; Bettinetti, R.; Dachs, J.; Jones, K.C. Biological Pump Control of the Fate and Distribution of Hydrophobic Organic Pollutants in Water and Plankton. Environ. Sci. Technol. 2012, 46, 3204–3211. [Google Scholar] [CrossRef]
  9. Berrojalbiz, N.; Lacorte, S.; Calbet, A.; Saiz, E.; Barata, C.; Dachs, J. Accumulation and Cycling of Polycyclic Aromatic Hydrocarbons in Zooplankton. Environ. Sci. Technol. 2009, 43, 2295–2301. [Google Scholar] [CrossRef]
  10. Prahl, F.G.; Carpenter, R. The Role of Zooplankton Fecal Pellets in the Sedimentation of Polycyclic Aromatic Hydrocarbons in Dabob Bay, Washington. Geochim. Cosmochim. Acta 1979, 43, 1959–1972. [Google Scholar] [CrossRef]
  11. Lipiatou, E.; Marty, J.-C.; Saliot, A. Sediment Trap Fluxes of Polycyclic Aromatic Hydrocarbons in the Mediterranean Sea. Mar. Chem. 1993, 44, 43. [Google Scholar] [CrossRef]
  12. Bacosa, H.P.; Kamalanathan, M.; Cullen, J.; Shi, D.; Xu, C.; Schwehr, K.A.; Hala, D.; Wade, T.L.; Knap, A.H.; Santschi, P.H.; et al. Marine Snow Aggregates Are Enriched in Polycyclic Aromatic Hydrocarbons (Pahs) in Oil Contaminated Waters: Insights from a Mesocosm Study. J. Mar. Sci. Eng. 2020, 8, 781. [Google Scholar] [CrossRef]
  13. Shi, D.; Jia, H. Transport and Behavior of Marine Oil Spill Containing Polycyclic Aromatic Hydrocarbons in Mesocosm Experiments. J. Oceanol. Limnol. 2022. [Google Scholar] [CrossRef]
  14. Lohmann, R.; Jurado, E.; Pilson, M.E.Q.; Dachs, J. Oceanic Deep Water Formation as a Sink of Persistent Organic Pollutants. Geophys. Res. Lett. 2006, 33, L12607. [Google Scholar] [CrossRef] [Green Version]
  15. Liu, M.; Hu, J.; Lin, Y.; Ke, H.; Lian, J.; Xu, Y.; Chen, K.; Zheng, H.; Chen, M.; Cai, M. Full-Depth Profiles of PAHs in the Western South China Sea: Influence of Upwelling and Mesoscale Eddy. Chemosphere 2021, 263, 127933. [Google Scholar] [CrossRef] [PubMed]
  16. Parinos, C.; Gogou, A. Suspended Particle-Associated PAHs in the Open Eastern Mediterranean Sea: Occurrence, Sources and Processes Affecting Their Distribution Patterns. Mar. Chem. 2016, 180, 42–50. [Google Scholar] [CrossRef]
  17. Salvadó, J.A.; Grimalt, J.O.; López, J.F.; Palanques, A.; Heussner, S.; Pasqual, C.; Sanchez-Vidal, A.; Canals, M. Transfer of Lipid Molecules and Polycyclic Aromatic Hydrocarbons to Open Marine Waters by Dense Water Cascading Events. Prog. Oceanogr. 2017, 159, 178–194. [Google Scholar] [CrossRef]
  18. Bacosa, H.P.; Erdner, D.L.; Liu, Z. Differentiating the Roles of Photooxidation and Biodegradation in the Weathering of Light Louisiana Sweet Crude Oil in Surface Water from the Deepwater Horizon Site. Mar. Pollut. Bull. 2015, 95, 265–272. [Google Scholar] [CrossRef]
  19. Vergeynst, L.; Christensen, J.H.; Kjeldsen, K.U.; Meire, L.; Malmquist, L.M.V.; Rysgaard, S. Oil Photooxidation Biofilm-Mediated Biodegradation Dissolution Oil-Coated Adsorbents; Elsevier Ltd.: Amsterdam, The Netherlands, 2018; ISBN 4587156698. [Google Scholar]
  20. Dutta, T.K.; Harayama, S. Fate of Crude Oil by the Combination of Photooxidation and Biodegradation. Environ. Sci. Technol. 2000, 34, 1500–1505. [Google Scholar] [CrossRef]
  21. Bertilsson, S.; Widenfalk, A. Photochemical Degradation of PAHs in Freshwaters and Their Impact on Bacterial Growth—Influence of Water Chemistry. Hydrobiologia 2002, 469, 23–32. [Google Scholar] [CrossRef]
  22. Duran, R.; Cravo-Laureau, C. Role of Environmental Factors and Microorganisms in Determining the Fate of Polycyclic Aromatic Hydrocarbons in the Marine Environment. FEMS Microbiol. Rev. 2016, 40, 814–830. [Google Scholar] [CrossRef] [PubMed]
  23. Yuan, J.; Lai, Q.; Sun, F.; Zheng, T.; Shao, Z. The Diversity of PAH-Degrading Bacteria in a Deep-Sea Water Column above the Southwest Indian Ridge. Front. Microbiol. 2015, 6, 853. [Google Scholar] [CrossRef] [PubMed] [Green Version]
  24. Kappell, A.D.; Wei, Y.; Newton, R.J.; van Nostrand, J.D.; Zhou, J.; McLellan, S.L.; Hristova, K.R. The Polycyclic Aromatic Hydrocarbon Degradation Potential of Gulf of Mexico Native Coastal Microbial Communities after the Deepwater Horizon Oil Spill. Front. Microbiol. 2014, 5, 205. [Google Scholar] [CrossRef] [PubMed]
  25. Yamada, N.; Fukuda, H.; Ogawa, H.; Saito, H.; Suzumura, M. Heterotrophic Bacterial Production and Extracellular Enzymatic Activity in Sinking Particulate Matter in the Western North Pacific Ocean. Front. Microbiol. 2012, 3, 379. [Google Scholar] [CrossRef] [Green Version]
  26. Maßmig, M.; Lüdke, J.; Krahmann, G.; Engel, A. Bacterial Degradation Activity in the Eastern Tropical South Pacific Oxygen Minimum Zone. Biogeosciences 2020, 17, 215–230. [Google Scholar] [CrossRef] [Green Version]
  27. Talley, L.D.; Lobanov, V.; Ponomarev, V.; Salyuk, A.; Tishchenko, P.; Zhabin, I.; Riser, S. Deep Convection and Brine Rejection in the Japan Sea. Geophys. Res. Lett. 2003, 30, 1159. [Google Scholar] [CrossRef] [Green Version]
  28. Kim, T.H.; Kim, G.; Lee, S.A.; Dittmar, T. Extraordinary Slow Degradation of Dissolved Organic Carbon (DOC) in a Cold Marginal Sea. Sci. Rep. 2015, 5, 13808. [Google Scholar] [CrossRef] [Green Version]
  29. Kim, T.H.; Kim, G.; Shen, Y.; Benner, R. Strong Linkages between Surface and Deep-Water Dissolved Organic Matter in the East/Japan Sea. Biogeosciences 2017, 14, 2561–2570. [Google Scholar] [CrossRef] [Green Version]
  30. Chizhova, T.; Hayakawa, K.; Tishchenko, P.; Nakase, H.; Koudryashova, Y. Distribution of PAHs in the Northwestern Part of the Japan Sea. Deep. Res. Part II Top. Stud. Oceanogr. 2013, 86–87, 19–24. [Google Scholar] [CrossRef]
  31. Hayakawa, K.; Makino, F.; Yasuma, M.; Yoshida, S.; Chondo, Y.; Toriba, A.; Kameda, T.; Tang, N.; Kunugi, M.; Nakase, H.; et al. Polycyclic Aromatic Hydrocarbons in Surface Water of the Southeastern Japan Sea. Chem. Pharm. Bull. 2016, 64, 625–631. [Google Scholar] [CrossRef] [Green Version]
  32. Nagato, E.G.; Makino, F.; Nakase, H.; Yoshida, S.; Hayakawa, K. Improvements in Polycyclic Aromatic Hydrocarbon Contamination in the Japan Sea: An Interannual Survey from 2008 to 2014. Mar. Pollut. Bull. 2019, 138, 333–340. [Google Scholar] [CrossRef] [PubMed]
  33. Chizhova, T.; Koudryashova, Y.; Tishchenko, P.; Lobanov, V. PAHs in the Northwestern Japan Sea. In Polycyclic Aromatic Hydrocarbons; Springer: Singapore, 2018; pp. 175–202. [Google Scholar]
  34. Johnson, D.R.; Boyer, T.P. Regional Climatology of the East Asian Seas: An Introduction; NOAA Atlas NESDIS 79; NOAA: Silver Spring, MD, USA, 2015; p. 37. [Google Scholar] [CrossRef]
  35. Chang, K.-I.; Zhang, C.-I.; Park, C.; Kang, D.-J.; Ju, S.-J.; Lee, S.-H.; Wimbush, M. Oceanography of the East Sea (Japan Sea); Springer: Berlin/Heidelberg, Germany, 2016. [Google Scholar]
  36. Gamo, T. Dissolved Oxygen in the Bottom Water of the Sea of Japan as a Sensitive Alarm for Global Climate Change. TrAC-Trends Anal. Chem. 2011, 30, 1308–1319. [Google Scholar] [CrossRef]
  37. Harada, K.; Tsunogai, S. 226Ra in the Japan Sea and the residence time of the Japan Sea water. Earth Planet. Sci. Lett. 1986, 77, 236–244. [Google Scholar] [CrossRef]
  38. Watanabe, Y.W.; Watanabe, S.; Tsunogai, S. Tritium in the Japan Sea and the Renewal Time of the Japan Sea Deep Water. Mar. Chem. 1991, 34, 97–108. [Google Scholar] [CrossRef]
  39. Ma, Y.; Xie, Z.; Yang, H.; Möller, A.; Halsall, C.; Cai, M.; Sturm, R.; Ebinghaus, R. Deposition of Polycyclic Aromatic Hydrocarbons in the North Pacific and the Arctic. J. Geophys. Res. Atmos. 2013, 118, 5822–5829. [Google Scholar] [CrossRef]
  40. Yang, X.Y.; Okada, Y.; Tang, N.; Matsunaga, S.; Tamura, K.; Lin, J.M.; Kameda, T.; Toriba, A.; Hayakawa, K. Long-Range Transport of Polycyclic Aromatic Hydrocarbons from China to Japan. Atmos. Environ. 2007, 41, 2710–2718. [Google Scholar] [CrossRef]
  41. Hayakawa, K. Environmental Behaviors and Toxicities of Polycyclic Aromatic Hydrocarbons and Nitropolycyclic Aromatic Hydrocarbons. Chem. Pharm. Bull. 2016, 64, 83–94. [Google Scholar] [CrossRef] [Green Version]
  42. Ding, X.; Wang, X.M.; Xie, Z.Q.; Xiang, C.H.; Mai, B.X.; Sun, L.G.; Zheng, M.; Sheng, G.Y.; Fu, J.M.; Pöschl, U. Atmospheric Polycyclic Aromatic Hydrocarbons Observed over the North Pacific Ocean and the Arctic Area: Spatial Distribution and Source Identification. Atmos. Environ. 2007, 41, 2061–2072. [Google Scholar] [CrossRef]
  43. Matsunaka, T.; Nagao, S.; Inoue, M.; Mundo, R.; Tanaka, S.; Tang, N.; Yoshida, M.; Nishizaki, M.; Morita, M.; Takikawa, T.; et al. Seasonal Variations in Marine Polycyclic Aromatic Hydrocarbons off Oki LaƟtude. Mar. Pollut. Bull. 2022, 180, 113749. [Google Scholar] [CrossRef]
  44. Ya, M.; Wang, X.; Wu, Y.; Li, Y.; Yan, J.; Fang, C.; Zhao, Y.; Qian, R.; Lin, X. Seasonal Variation of Terrigenous Polycyclic Aromatic Hydrocarbons along the Marginal Seas of China: Input, Phase Partitioning, and Ocean-Current Transport. Environ. Sci. Technol. 2017, 51, 9072–9079. [Google Scholar] [CrossRef]
  45. Chizhova, T.; Koudryashova, Y.; Prokuda, N.; Tishchenko, P.; Hayakawa, K. Polycyclic Aromatic Hydrocarbons in the Estuaries of Two Rivers of the Sea of Japan. Int. J. Environ. Res. Public Health 2020, 17, 6019. [Google Scholar] [CrossRef] [PubMed]
  46. Hayakawa, K.; Tang, N.; Nagato, E.G.; Toriba, A.; Sakai, S.; Kano, F.; Goto, S.; Endo, O.; Arashidani, K.-i.; Kakimoto, H. Long Term Trends in Atmospheric Concentrations of Polycyclic Aromatic Hydrocarbons and Nitropolycyclic Aromatic Hydrocarbons: A Study of Japanese Cities from 1997 to 2014. Environ. Pollut. 2018, 233, 474–482. [Google Scholar] [CrossRef] [PubMed]
  47. Mundo, R.; Matsunaka, T.; Iwai, H.; Ogiso, S.; Suzuki, N.; Tang, N.; Hayakawa, K.; Nagao, S. Interannual Survey on Polycyclic Aromatic Hydrocarbons (PAHs) in Seawater of North Nanao Bay, Ishikawa, Japan, from 2015 to 2018: Sources, Pathways and Ecological Risk Assessment. Int. J. Environ. Res. Public Health 2020, 17, 904. [Google Scholar] [CrossRef] [PubMed] [Green Version]
  48. Nakano, Y.; Inoue, M.; Komura, K. Simple Coprecipitation Method Combined with Low- Background γ-Spectrometry: Determination of 7Be, 137Cs, 210Pb, and Radium and Thorium Isotopes in Small- Volume Coastal Water Samples YUSUKE. J. Oceanogr. 2008, 64, 713–717. [Google Scholar] [CrossRef]
  49. Inoue, M.; Minakawa, M.; Yoshida, K.; Nakano, Y.; Kofuji, H.; Nagao, S.; Hamajima, Y.; Yamamoto, M. Vertical Profiles of 228Ra and 226Ra Activities in the Sea of Japan and Their Implications on Water Circulation. J. Radioanal. Nucl. Chem. 2015, 303, 1309–1312. [Google Scholar] [CrossRef]
  50. Inoue, M.; Shirotani, Y.; Morokado, T.; Hanaki, S.; Ito, M.; Kameyama, H.; Kofuji, H.; Okino, A.; Shikata, T.; Yoshida, M.-a.; et al. Kuroshio Fractions in the Southwestern Sea of Japan; Implications from Radium Isotopes. Cont. Shelf Res. 2021, 214, 104328. [Google Scholar] [CrossRef]
  51. Hamajima, Y.; Komura, K. Background Components of Ge Detectors in Ogoya Underground Laboratory. Appl. Radiat. Isot. 2004, 61, 179–183. [Google Scholar] [CrossRef]
  52. Inoue, M.; Hanaki, S.; Kameyama, H.; Kumamoto, Y.; Nagao, S. Spatial Distributions of 226Ra and 228Ra in the Indian and Southern Oceans in 2020 and Their Implications for Unique Currents. Res. Sq. 2021. [Google Scholar] [CrossRef]
  53. Sugimura, Y.; Suzuki, Y. A High-Temperature Catalytic Oxidation Method for the Determination of Non-Volatile Dissolved Organic Carbon in Seawater by Direct Injection of a Liquid Sample. Mar. Chem. 1988, 24, 105–131. [Google Scholar] [CrossRef]
  54. Otosaka, S.; Tanaka, T.; Togawa, O.; Amano, H.; Karasev, E.V.; Minakawa, M.; Shinichiro, N. Deep Sea Circulation of Particulate Organic Carbon in the Japan Sea. J. Oceanogr. 2008, 64, 911–923. [Google Scholar] [CrossRef]
  55. Mears, C.; Thomas, H.; Henderson, P.B.; Charette, M.A.; Macintyre, H.; Dehairs, F.; Monnin, C.; Mucci, A. Using 226 Ra and 228 Ra Isotopes to Distinguish Water Mass Distribution in the Canadian Arctic Archipelago. Biogeosciences 2020, 17, 4937–4959. [Google Scholar] [CrossRef]
  56. Kim, I.-N.; Min, D.-H.; Kim, D.H.; Lee, T. Investigation of the Physicochemical Features and Mixing of East/Japan Sea Intermediate Water: An Isopycnic Analysis Approach. J. Mar. Res. 2010, 68, 799–818. [Google Scholar] [CrossRef]
  57. Zhabin, I.A.; Dmitrieva, E.V.; Kil’matov, T.R.; Andreev, A.G. Wind Effects on the Upwelling Variability in the Coastal Zone of Primorye (the Northwest of the Sea of Japan). Russ. Meteorol. Hydrol. 2017, 42, 181–188. [Google Scholar] [CrossRef]
  58. Zuenko, Y.I.; Rachkov, V.I. Climatic Changes of Temperature, Salinity and Nutrients in the Amur Bay of the Japan Sea. Izv. TINRO 2015, 183, 186–199. [Google Scholar] [CrossRef]
  59. Kannan, N.; Yamashita, N.; Gert, P.; Duinker, J.C. Polychlorinated Biphenyls and Nonylphenols in the Sea of Japan. Environ. Sci. Technol. 1998, 32, 1747–1753. [Google Scholar] [CrossRef]
  60. Arnosti, C. Microbial Extracellular Enzymes and the Marine Carbon Cycle. Ann. Rev. Mar. Sci. 2011, 3, 401–425. [Google Scholar] [CrossRef]
  61. Senjyu, T.; Shin, H.R.; Yoon, J.H.; Nagano, Z.; An, H.S.; Byun, S.K.; Lee, C.K. Deep Flow Field in the Japan/East Sea as Deduced from Direct Current Measurements. Deep. Res. Part II Top. Stud. Oceanogr. 2005, 52, 1726–1741. [Google Scholar] [CrossRef]
  62. Dachs, J.; Bayona, J.M.; Raoux, C.; Albaigés, J. Spatial, Vertical Distribution and Budget of Polycyclic Aromatic Hydrocarbons in the Western Mediterranean Seawater. Environ. Sci. Technol. 1997, 31, 682–688. [Google Scholar] [CrossRef]
  63. Schulz-Bull, D.E.; Petrick, G.; Bruhn, R.; Duinker, J.C. Chlorobiphenyls (PCB) and PAHs in Water Masses of the Northern North Atlantic. Mar. Chem. 1998, 61, 101–114. [Google Scholar] [CrossRef]
  64. Fuoco, R.; Giannarelli, S.; Wei, Y.; Abete, C.; Francesconi, S.; Termine, M. Polychlorobiphenyls and Polycyclic Aromatic Hydrocarbons in the Sea-Surface Micro-Layer and the Water Column at Gerlache Inlet, Antarctica. J. Environ. Monit. 2005, 7, 1313–1319. [Google Scholar] [CrossRef]
  65. Adhikari, P.L.; Maiti, K.; Overton, E.B. Vertical Fluxes of Polycyclic Aromatic Hydrocarbons in the Northern Gulf of Mexico. Mar. Chem. 2015, 168, 60–68. [Google Scholar] [CrossRef]
  66. Cai, M.; Duan, M.; Guo, J.; Liu, M.; Qi, A.; Lin, Y.; Liang, J. PAHs in the Northern South China Sea: Horizontal Transport and Downward Export on the Continental Shelf. Mar. Chem. 2018, 202, 121–129. [Google Scholar] [CrossRef]
  67. Fang, M.-D.; Chang, W.K.; Lee, C.L.; Liu, J.T. The Use of Polycyclic Aromatic Hydrocarbons as a Particulate Tracer in the Water Column of Gaoping (Kaoping) Submarine Canyon. J. Mar. Syst. 2009, 76, 457–467. [Google Scholar] [CrossRef]
  68. Cornelissen, G.; Breedveld, G.D.; Kalaitzidis, S.; Christanis, K.; Kibsgaard, A.; Oen, A.M.P. Strong Sorption of Native PAHs to Pyrogenic and Unburned Carbonaceous Geosorbents in Sediments. Environ. Sci. Technol. 2006, 40, 1197–1203. [Google Scholar] [CrossRef]
  69. Follett, C.L.; Repeta, D.J.; Rothman, D.H.; Xu, L.; Santinelli, C. Hidden Cycle of Dissolved Organic Carbon in the Deep Ocean. Proc. Natl. Acad. Sci. USA 2014, 111, 16706–16711. [Google Scholar] [CrossRef] [Green Version]
  70. Hansell, D.A.; Orellana, M.V. Dissolved Organic Matter in the Global Ocean: A Primer. Gels 2021, 7, 128. [Google Scholar] [CrossRef]
  71. Mackay, D.; Ying Shiu, W.; Ma, K.-C.; Chi Lee, S. Handbook of Physical-Chemical Properties and Environmental Fate for Organic Chemicals, 2nd ed.; CRC Press: Boca Raton, FL, USA, 2006; Volume I–IV. [Google Scholar]
  72. An, Y.Z.; Teng, S.P.; Pei, Y.Q.; Qin, J.; Li, X.; Zhao, H. An Experimental Study of Polycyclic Aromatic Hydrocarbons and Soot Emissions from a GDI Engine Fueled with Commercial Gasoline. Fuel 2016, 164, 160–171. [Google Scholar] [CrossRef]
  73. Mitra, S.; Dickhut, R. Three-phase modeling of polycyclic aromatic hydrocarbon association with pore-water-dissolved organic carbon. Environ. Toxicol. Chem. Int. J. 1999, 18, 1144–1148. [Google Scholar] [CrossRef]
  74. Koudryashova, Y.; Chizhova, T.; Tishchenko, P.; Hayakawa, K. Seasonal Variability of Polycyclic Aromatic Hydrocarbons (PAHs) in a Coastal Marine Area in the Northwestern Region of the Sea of Japan/East Sea (Possiet Bay). Ocean Sci. J. 2019, 54, 635–655. [Google Scholar] [CrossRef]
  75. Lin, T.; Hu, L.; Guo, Z.; Zhang, G.; Yang, Z. Deposition Fluxes and Fate of Polycyclic Aromatic Hydrocarbons in the Yangtze River Estuarine-Inner Shelf in the East China Sea. Glob. Biogeochem. Cycles 2013, 27, 77–87. [Google Scholar] [CrossRef]
  76. Bates, T.S.; Hamilton, S.E.; Cline, J.D. Vertical Transport and Sedimentation of Hydrocarbons in the Central Main Basin of Puget Sound, Washington. Environ. Sci. Technol. 1984, 18, 299–305. [Google Scholar] [CrossRef] [PubMed]
  77. Broman, D.; Colmsjo, A.; Ganning, B.; Naf, C.; Zebuhr, U. A Multi-Sediment-Trap Study on the Temporal and Spatial Variability of Polycyclic Aromatic Hydrocarbons and Lead in an Anthropogenic Influenced Archipelago. Environ. Sci. Technol. 1988, 22, 1219–1228. [Google Scholar] [CrossRef] [PubMed]
  78. Dachs, J.; Bayona, J.M.; Fillaux, J.; Saliot, A.; Albaigés, J. Evaluation of Anthropogenic and Biogenic Inputs into the Western Mediterranean Using Molecular Markers. Mar. Chem. 1999, 65, 195–210. [Google Scholar] [CrossRef]
  79. Pettersen, H.; Näf, C.; Broman, D. Impact of PAH Outlets from an Oil Refinery on the Receiving Water Area—Sediment Trap Fluxes and Multivariate Statistical Analysis. Mar. Pollut. Bull. 1997, 34, 85–95. [Google Scholar] [CrossRef]
  80. Raoux, C.; Boyona, J.M.; Miquel, J.C.; Teyssie, J.L.; Fowler, S.W.; Albaigés, J. Particulate Fluxes of Aliphatic and Aromatic Hydrocarbons in Near-Shore Waters to the Northwestern Mediterranean Sea, and the Effect of Continental Runoff. Estuar. Coast. Shelf Sci. 1999, 48, 605–616. [Google Scholar] [CrossRef]
  81. Takada, H.; Farrington, J.W.; Bothner, M.H.; Johnson, C.G.; Tripp, B.W.; Takada, H.; Farrington, J.W.; Bothner, M.H.; Johnson, C.G.; Tripp, B.W.; et al. Transport of Sludge-Derived Organic Pollutants to Deep-Sea Sediments at Deep Water Dump Site 106. Environ. Sci. Technol. 1994, 28, 1062–1072. [Google Scholar] [CrossRef]
  82. Dachs, J.; Bayona, J.M.; Fowler, S.W.; Miquel, J.C.; Albaigés, J. Vertical Fluxes of Polycyclic Aromatic Hydrocarbons and Organochlorine Compounds in the Western Alboran Sea (Southwestern Mediterranean). Mar. Chem. 1996, 52, 75–86. [Google Scholar] [CrossRef]
  83. Palm, A.; Cousins, I.; Gustafsson, Ö.; Axelman, J.; Grunder, K.; Broman, D.; Brorström-Lundén, E. Evaluation of Sequentially-Coupled POP Fluxes Estimated from Simultaneous Measurements in Multiple Compartments of an Air–Water–Sediment System. Environ. Pollut. 2004, 128, 85–97. [Google Scholar] [CrossRef] [Green Version]
  84. Tsapakis, M.; Apostolaki, M.; Eisenreich, S.; Stephanou, E.G. Atmospheric Deposition and Marine Sedimentation Fluxes of Polycyclic Aromatic Hydrocarbons in the Eastern Mediterranean Basin. Environ. Sci. Technol. 2006, 40, 4922–4927. [Google Scholar] [CrossRef]
  85. Bouloubassi, I.; Méjanelle, L.; Pete, R.; Fillaux, J.; Lorre, A.; Point, V. PAH Transport by Sinking Particles in the Open Mediterranean Sea: A 1 Year Sediment Trap Study. Mar. Pollut. Bull. 2006, 52, 560–571. [Google Scholar] [CrossRef]
  86. Parinos, C.; Gogou, A.; Bouloubassi, I.; Stavrakakis, S.; Plakidi, E.; Hatzianestis, I. Sources and Downward Fluxes of Polycyclic Aromatic Hydrocarbons in the Open Southwestern Black Sea. Org. Geochem. 2013, 57, 65–75. [Google Scholar] [CrossRef]
  87. Tobiszewski, M.; Namieśnik, J. PAH Diagnostic Ratios for the Identification of Pollution Emission Sources. Environ. Pollut. 2012, 162, 110–119. [Google Scholar] [CrossRef] [PubMed]
  88. Yunker, M.B.; Macdonald, R.W.; Vingarzan, R.; Mitchell, R.H.; Goyette, D.; Sylvestre, S. PAHs in the Fraser River Basin: A Critical Appraisal of PAH Ratios as Indicators of PAH Source and Composition. Org. Geochem. 2002, 33, 489–515. [Google Scholar] [CrossRef]
  89. Thorsen, W.A.; Cope, W.G.; Shea, D.; Carolina, N. Bioavailability of PAHs: Effects of Soot Carbon and PAH Source. Environ. Sci. Technol. 2004, 38, 2029–2037. [Google Scholar] [CrossRef]
  90. Fu, F.; Tian, B.; Lin, G.; Chen, Y.; Zhang, J.; Fu, F.; Tian, B.; Lin, G.; Chen, Y. Chemical Characterization and Source Identification of Polycyclic Aromatic Hydrocarbons in Aerosols Originating from Different Sources Chemical Characterization and Source Identification of Polycyclic Aromatic Hydrocarbons in Aerosols Originating from Dif. J. Air Waste Manag. Assoc. 2010, 60, 1309–1314. [Google Scholar] [CrossRef] [Green Version]
  91. Dickhut, R.M.; Canuel, E.A.; Gustafson, K.E.; Liu, K.; Arzayus, K.M.; Walker, S.E.; Edgecombe, G.; Gaylor, M.O.; Macdonald, E.H. Automotive Sources of Carcinogenic Polycyclic Aromatic Hydrocarbons Associated with Particulate Matter in the Chesapeake Bay Region. Environ. Sci. Technol. 2000, 34, 4635–4640. [Google Scholar] [CrossRef]
Figure 1. Location of the sampling stations in the Sea of Japan.
Jmse 10 02015 g001
Figure 2. Salinity (PSU) and temperature (°C) vertical profiles at the sampling stations in the Japan Basin.
Jmse 10 02015 g002
Figure 3. Vertical profiles of 226Ra (a) and 228Ra (b) activities at the sampling stations in the Japan Basin.
Jmse 10 02015 g003
Figure 4. The deep water profiles of (a) ∑8PPAHs; (b) ∑9DPAHs; (c) POC and (d) DOC in the Japan Basin. POC at St.21 was not detected below the depth 200 m.
Jmse 10 02015 g004
Figure 5. log Koc versus log Kow of individual PAHs in the epipelagic of the Japan Basin (the Sea of Japan). The Kow values were taken from [71]. The yellow crosses mean value of log Kow vs. logKoc for the same PAH.
Jmse 10 02015 g005
Figure 6. The compositional profiles of (a) PPAHs and (b) DPAHs in the Japan Basin. Empty columns denote PAH composition at St.21; columns with strokes denote PAH composition at St.29.
Jmse 10 02015 g006
Figure 7. Principal component analysis of the deep water samples from the Japan Basin. (a) Score plot; (b) loading plot for DPAHs. The numbers correspond to the depth where the samples were taken.
Jmse 10 02015 g007
Table 1. Depths (m) where the samples for polycyclic aromatic hydrocarbon (PAHs), Ra isotopes and dissolved and particulate organic carbon (DOC and POC) analysis were taken.
Surface20305010020030050010001500200025003000Bottom *
PAH,
DOC,
POC
++++++++++++++
226Ra, 228Ra++++++++-+-+++
* 3300 and 3474 m—bottom depth at stations 29 and 21, respectively. The samples were taken at the depth marked “+”.
Table 2. PAH concentrations in the epipelagic, mesopelagic and bathypelagic realms in the present study and other locations worldwide.
LocationDepth, mCPAHs *, ng/LnNReferences
Western Mediterranean Sea15~0.47119 PPAHs[62]
1500~0.231
North Atlantic Oceansurface-2000.016–0.06521–6 DPAHs[63]
201–10000.005–0.0284
surface-2000.087–0.18043–6 PPAHs
201–10000.062–0.1444
1001-bottom0.021–0.0393
Gerlache Inlet,
Antarctica
surface-2000.09–0.41 (0.18)1214 TPAHs[64]
201-bottom0.10–0.30 (0.22)3
Sea of Japansurface-2007.8–8.8 (8.2)313 TPAHs [30]
201–10007.7–17.1 (11.0)3
1001-bottom7.1–7.6 (7.3)3
Northern Gulf of Mexico100–200~23–57 (40.7)1143 DPAHs[65]
250–900~25–55 (37)22
1100–1400~30–45 (35.4)7
100–150~0.3–0.92 (0.52)1243 PPAHs
250–350~0.3–0.9 (0.45)
Eastern Mediterranean Seasurface-2000.09–0.92 (0.28)1916 PPAHs [16]
201–10000.13–0.62 (0.22)17
1001-bottom0.09–0.36 (0.18)9
North Atlanticsurface0.14814 truly DPAHs [5]
201–10000.144–0.148 (0.146)2
1001-bottom0.010–0.060 (0.037)3
Tropical Atlanticsurface-2000.078–0.083 (0.081)36 truly DPAHs
201–10000.084–0.254 (0.169)2
1001-bottom0.2111
Prydz Bay, Antarcticasurface-200ND-14 (2.99)1079 DPAHs [4]
201–1000ND-9.4 (3.9)36
1001-bottomND-2.3 (1.2)11
Northwestern South China Seasurface0.98–11188–9 DPAHs[66]
surface0.39–2.148–10 PPAHs
Sea of Japansurface-2005.6–11.8 (9.0)129 DPAHsThis study
201–10007.4–15.1 (11.5)6
1001-bottom7.0–13.6 (9.5)10
surface-2000.87–1.64 (1.20)128 PPAHs
201–10000.91–1.71 (1.13)6
1001-bottom1.01–1.60 (1.22)10
*—mean values of PAH concentrations are presented in brackets; n—the number of samples collected; N—the number of studied PAHs; ND—not detected.
Table 3. The PAH fluxes in sinking particles in the different sea sites.
LocationYearDepths, mNFlux, ng m−2 d−1References
Puget Sound, Salish Sea, Pacific Ocean1980-8150–10096700[76]
Baltic Sea1985~15 m beneath the thermocline and ~15 m above soft bottoms18NA-35,479[77]
Ligurian
Sea
1987200
2000
16670–910
300–520
[11]
Western Arabian
Sea
1988-913039159–67[78]
Baltic Sea1989-90in the middle of the water mass under the thermocline152.7–101[79]
Monaco coast, Western Mediterranean1989-908025110–10,411[80]
Deep Water Dump Site 106, Atlantic Ocean1989-902409
2719
16370
400
[81]
Alboran Sea1992250
500
750
>15~170–250
~250–280
~190–630
[82]
Koster Fjord, North Sea1999–2001100–1306623[83]
Southern Ionian Sea2001250
1440
3528.20
22.66
[84]
Open Mediterranean Sea2001–2002250
2850
13
25
13
25
9–176 (49 ± 45)
16–239 (73 ± 58)
4–99 (33 ± 27)
6–150 (53 ± 39)
[85]
Gaoping submarine canyon, South China Sea200460
280
3112,000–54,000
36,000–273,000
[67]
Northern South China Sea200550
75
100
15195
125
42
[66]
Gulf of Lion, Mediterranean Sea2006300
1000
1500
1900
16260–28,000 (5850)
110–55,000 (4800)
60–14,000 (1100)
23–5300 (695)
[17]
East China Sea2006–2007-165205[75]
Southwestern Black Sea2007–2008200013
22
10.4–187
17.7–310
[86]
Sea of Japan20160–1000
1000-bottom
1000-bottom
8 PPAH
8 PPAH
9 DPAH
2108
1133
699
This study
N—the number of studied PAHs.
Publisher’s Note: MDPI stays neutral with regard to jurisdictional claims in published maps and institutional affiliations.

