Article

Framework for Process Analysis of Maritime Accidents Caused by the Unsafe Acts of Seafarers: A Case Study of Ship Collision

1
College of Transport & Communications, Shanghai Maritime University, Haigang Avenue 1550, Shanghai 201306, China
2
Shanghai Ship and Shipping Research Institute, Minsheng Road 600, Shanghai 200135, China
*
Author to whom correspondence should be addressed.
J. Mar. Sci. Eng. 2022, 10(11), 1793; https://doi.org/10.3390/jmse10111793
Submission received: 22 October 2022 / Revised: 14 November 2022 / Accepted: 15 November 2022 / Published: 21 November 2022
(This article belongs to the Topic Ship Dynamics, Stability and Safety)

Abstract

:
Accurately describing and evaluating the effects of unsafe acts on maritime accidents is critical to establishing practical accident prevention and control options. This paper proposes a framework for the probabilistic analysis of maritime accidents caused by seafarers’ unsafe acts by incorporating a navigation simulation and dynamic Bayesian network (DBN) modeling. First, the unsafe acts of seafarers are identified according to an in-depth analysis of global maritime investigation reports. Then, a navigation simulation experiment is designed to collect the ship-handling data of seafarers during hazardous accident scenarios. Consequently, a dynamic probabilistic model is proposed using a DBN to describe the phases of maritime accidents based on the navigation simulation experiment data. Furthermore, an evolution analysis of maritime accidents is conducted to explore the causal chain of such accidents through sensitivity analysis. The typical navigational accident-collision is chosen as the case to interpret the proposed framework, considering the formation process of ship collision risks, from the occurrence of ship collision risk (phase 1) to the close-quarters situation (phase 2) and to immediate danger (phase 3). This framework is applied to explore the causal chain of collision accidents caused by the unsafe acts of seafarers.

1. Introduction

Global maritime accidents have caused serious social and ecological damage. Studies have confirmed that human factors are the main causes of maritime accidents [1,2,3], especially those navigational accidents related to seafarers’ operations [4]. The British Maritime Investigation Bureau reported that 65% of ship collision accidents are caused by improper lookout, and 73% of collision accidents involve improper or poor use of radar [5]. Accurately describing and evaluating the effects of unsafe acts on maritime accidents is critical to making practical accident prevention and control options [6,7].
The human factor is an essential issue in safety management. Some classic approaches for human factor analysis include Skill-Rule-Knowledge (S-R-K) taxonomy [8], Generic Error Modeling System (GEMS) [8], Swiss Cheese Model (SCM) [9], Cognitive Reliability Error Analysis method (CREAM) [10], Human Factor Analysis, and Classification System (HFACS) [11]. Among them, Rasmussen’s S-R-K taxonomy and the Reason’s GEMS are the most typical ones that classify human factors at the individual level, Hollnagel’s CREAM focuses on human error in the work environment considering common performance conditions. HFACS is an integrated approach that considers the causation and the effects of unsafe acts under the organizational environment based on the SCM and Software, Hardware, Environment, and Liveware methods [12,13]. According to the development of the human factor analysis approaches, the studies have been conducted from human error gradually transferring into unsafe acts [13,14].
Unsafe acts, as a highly concerning human error, are closely related to maritime accidents [15,16]. The research on unsafe acts in maritime accidents has attracted significant attention from the marine industry and academic fields. International Maritime Organization (IMO) issued guidelines for the application of the human element analyzing for (HEAP) to the IMO rule-making process (MSC-MEPC.2/Circ.13). Academic research has been conducted into the unsafe acts of seafarers as a primary cause of maritime accidents [17]. For example, decision and skilled errors were considered the leading causes of collision and grounding accidents [18]. Some unsafe acts, such as lack of communication, fatigued ship handling, and collision regulation violations, were the important elements associated with higher collision occurrence rates for oil tankers [19]. Using the HFACS, Celik and Cebi [20] discovered that skill-based behavioral errors and poor communication by seafarers were the main factors leading to an accident in which a ship exploded. Akyuz and Celik [21] improved the HFACS analysis framework based on the Swiss cheese model and summarized ten types of frequent unsafe acts. Ung [22] and Yang et al. [23] used the CREAM to identify the working environments and individual factors most closely associated with hazards. Akhtar et al. [24] identified fatigued ship handling as the main cause of grounding accidents. In the causal analysis and research of maritime accidents, much research has focused on collision accidents as typical cases and identified the causes attributed to them [25,26]. These included unsafe human factors in collision accidents, especially unsafe acts [27], such as decision errors [12] and inappropriate lookout [28]. Reviewing the research as mentioned earlier, studies have focused mainly on describing the unsafe acts in maritime accidents. However, the dynamic evolution of unsafe acts to maritime accidents has not been comprehensively discussed.
Developing the evolutionary process of unsafe acts related to maritime accidents is a critical issue worthy of additional attention [29,30]. The Bayesian Network (BN) is a graphical technique expressing complex probabilistic relationships, especially in non-precise information estimates prone to uncertainty [31,32], it is widely used in the probabilistic occurrence estimation and quantitative risk assessment of maritime accidents or incidents [33,34,35,36,37,38,39]. The BN can be incorporated with systematic approaches for processing the evolution, dynamic variation, and complex dependencies of maritime accidents, such as Accident Map (AcciMap) [34], System Theoretic Process Analysis (STPA) [40,41], and Functional Resonance Analysis Method (FRAM) [28,42]. Moreover, a Dynamic Bayesian Network (DBN) is an improved technique for modeling a time series or dynamic process by expanding BNs [43,44,45]. Combined with the advantage of BN, the DBN can (1) combine graph theory with probability theory to form the topological structure of causal links and achieve a graphical and intuitive description of the breeding, germination, and development of maritime accidents [43]; (2) obtain a posteriori probability within a context of information uncertainty by updating the prior probability after obtaining some data information in the case of limited accident sample data and asymmetric information, thus realizing the identification of critical causes of maritime accidents; (3) learn the data parameters to fit the network structure that most conforms to the data logic, and realize the deduction and decision-making of the accident process [44] under the condition of having a large number of historical accident data samples.
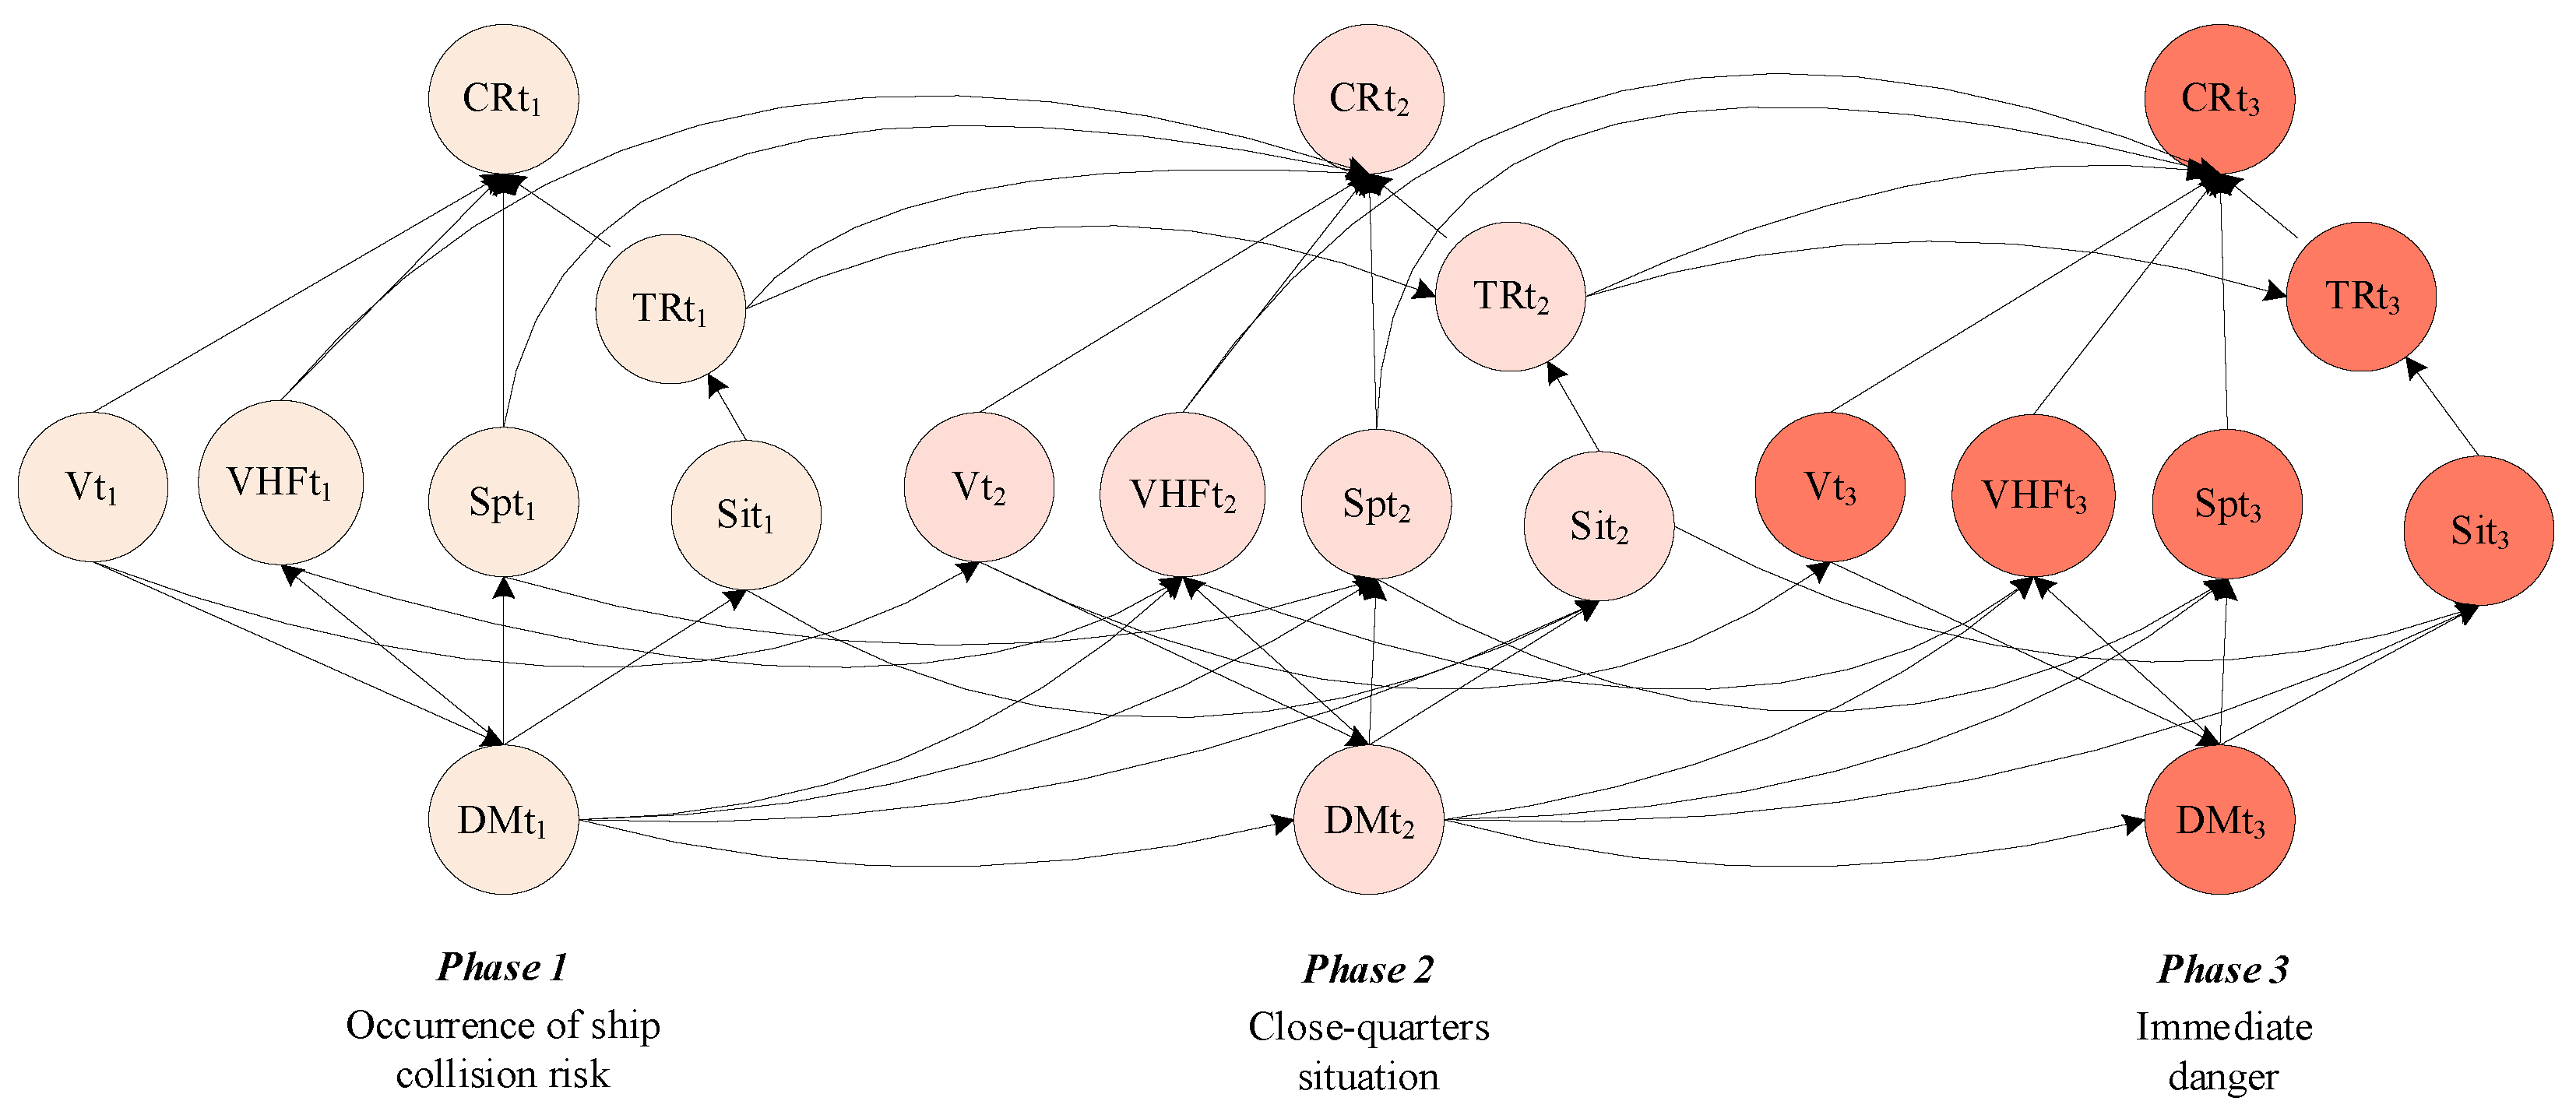
The aim of this study is to propose a framework for the probabilistic analysis of maritime accidents caused by the unsafe acts of seafarers by incorporating navigation simulation and DBN modeling. The typical navigational accident-collision is chosen as the case to interpret the proposed framework. The formation process of ship collision risk has been decomposed into three phases: the occurrence of ship collision risk (phase 1), close-quarters situation (phase 2), and immediate danger (phase 3). First, we investigated the unsafe acts most likely to have caused collision accidents from 207 global collision accident investigation reports by using the text mining technique. Second, we designed a simulation experiment to collect data on the navigation ship-handling behaviors of the simulator during the process of ship collision risks from the occurrence of ship collision risk (phase 1) to the close-quarters situation (phase 2) and immediate danger (phase 3). Then, we proposed a probabilistic model using DBN to describe the three phases of the ship collision risks concerning the navigation simulation experiment data. Furthermore, we explored the accident causal chain related to ship collision accidents by sensitivity analysis. The proposed framework can be used (1) to describe the process by which the seafarer’s behavior can cause maritime accidents; and (2) to address the bottleneck in related research caused by a lack of data on the acts of seafarers.
The remainder of this paper is organized as follows. Section 2 introduces the framework and associated methods for probabilistic analysis of ship collision risk caused by the unsafe acts of seafarers. 
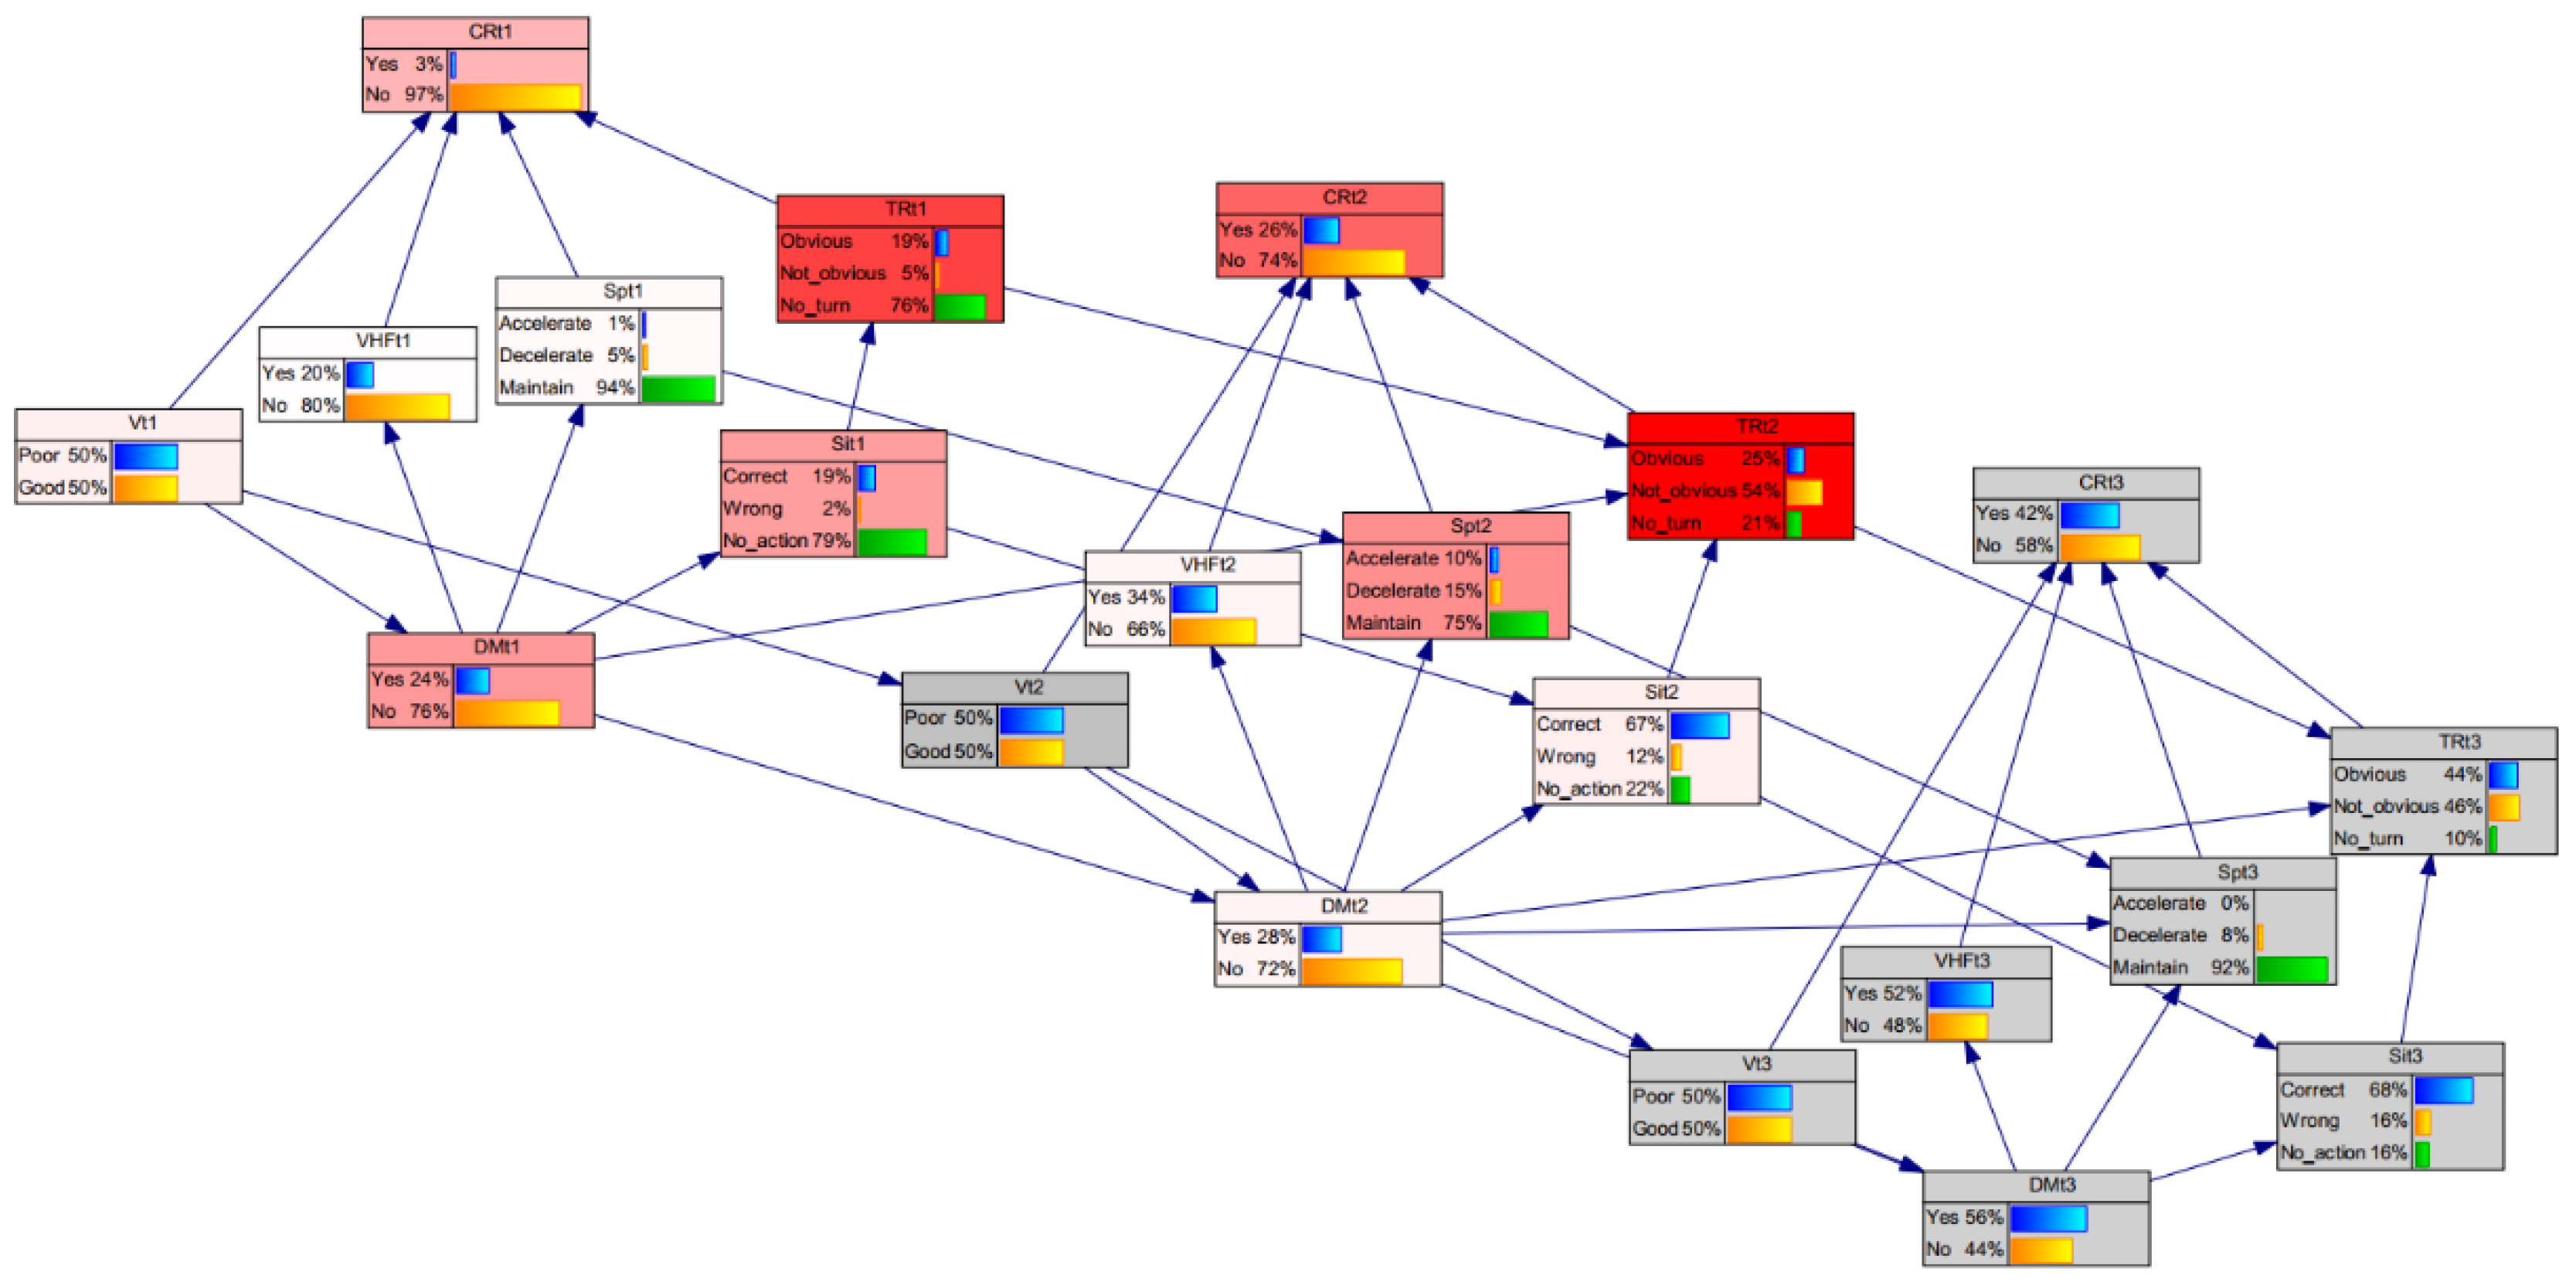
Section 3 interprets the probabilistic ship collision risk modeling process by a DBN. 
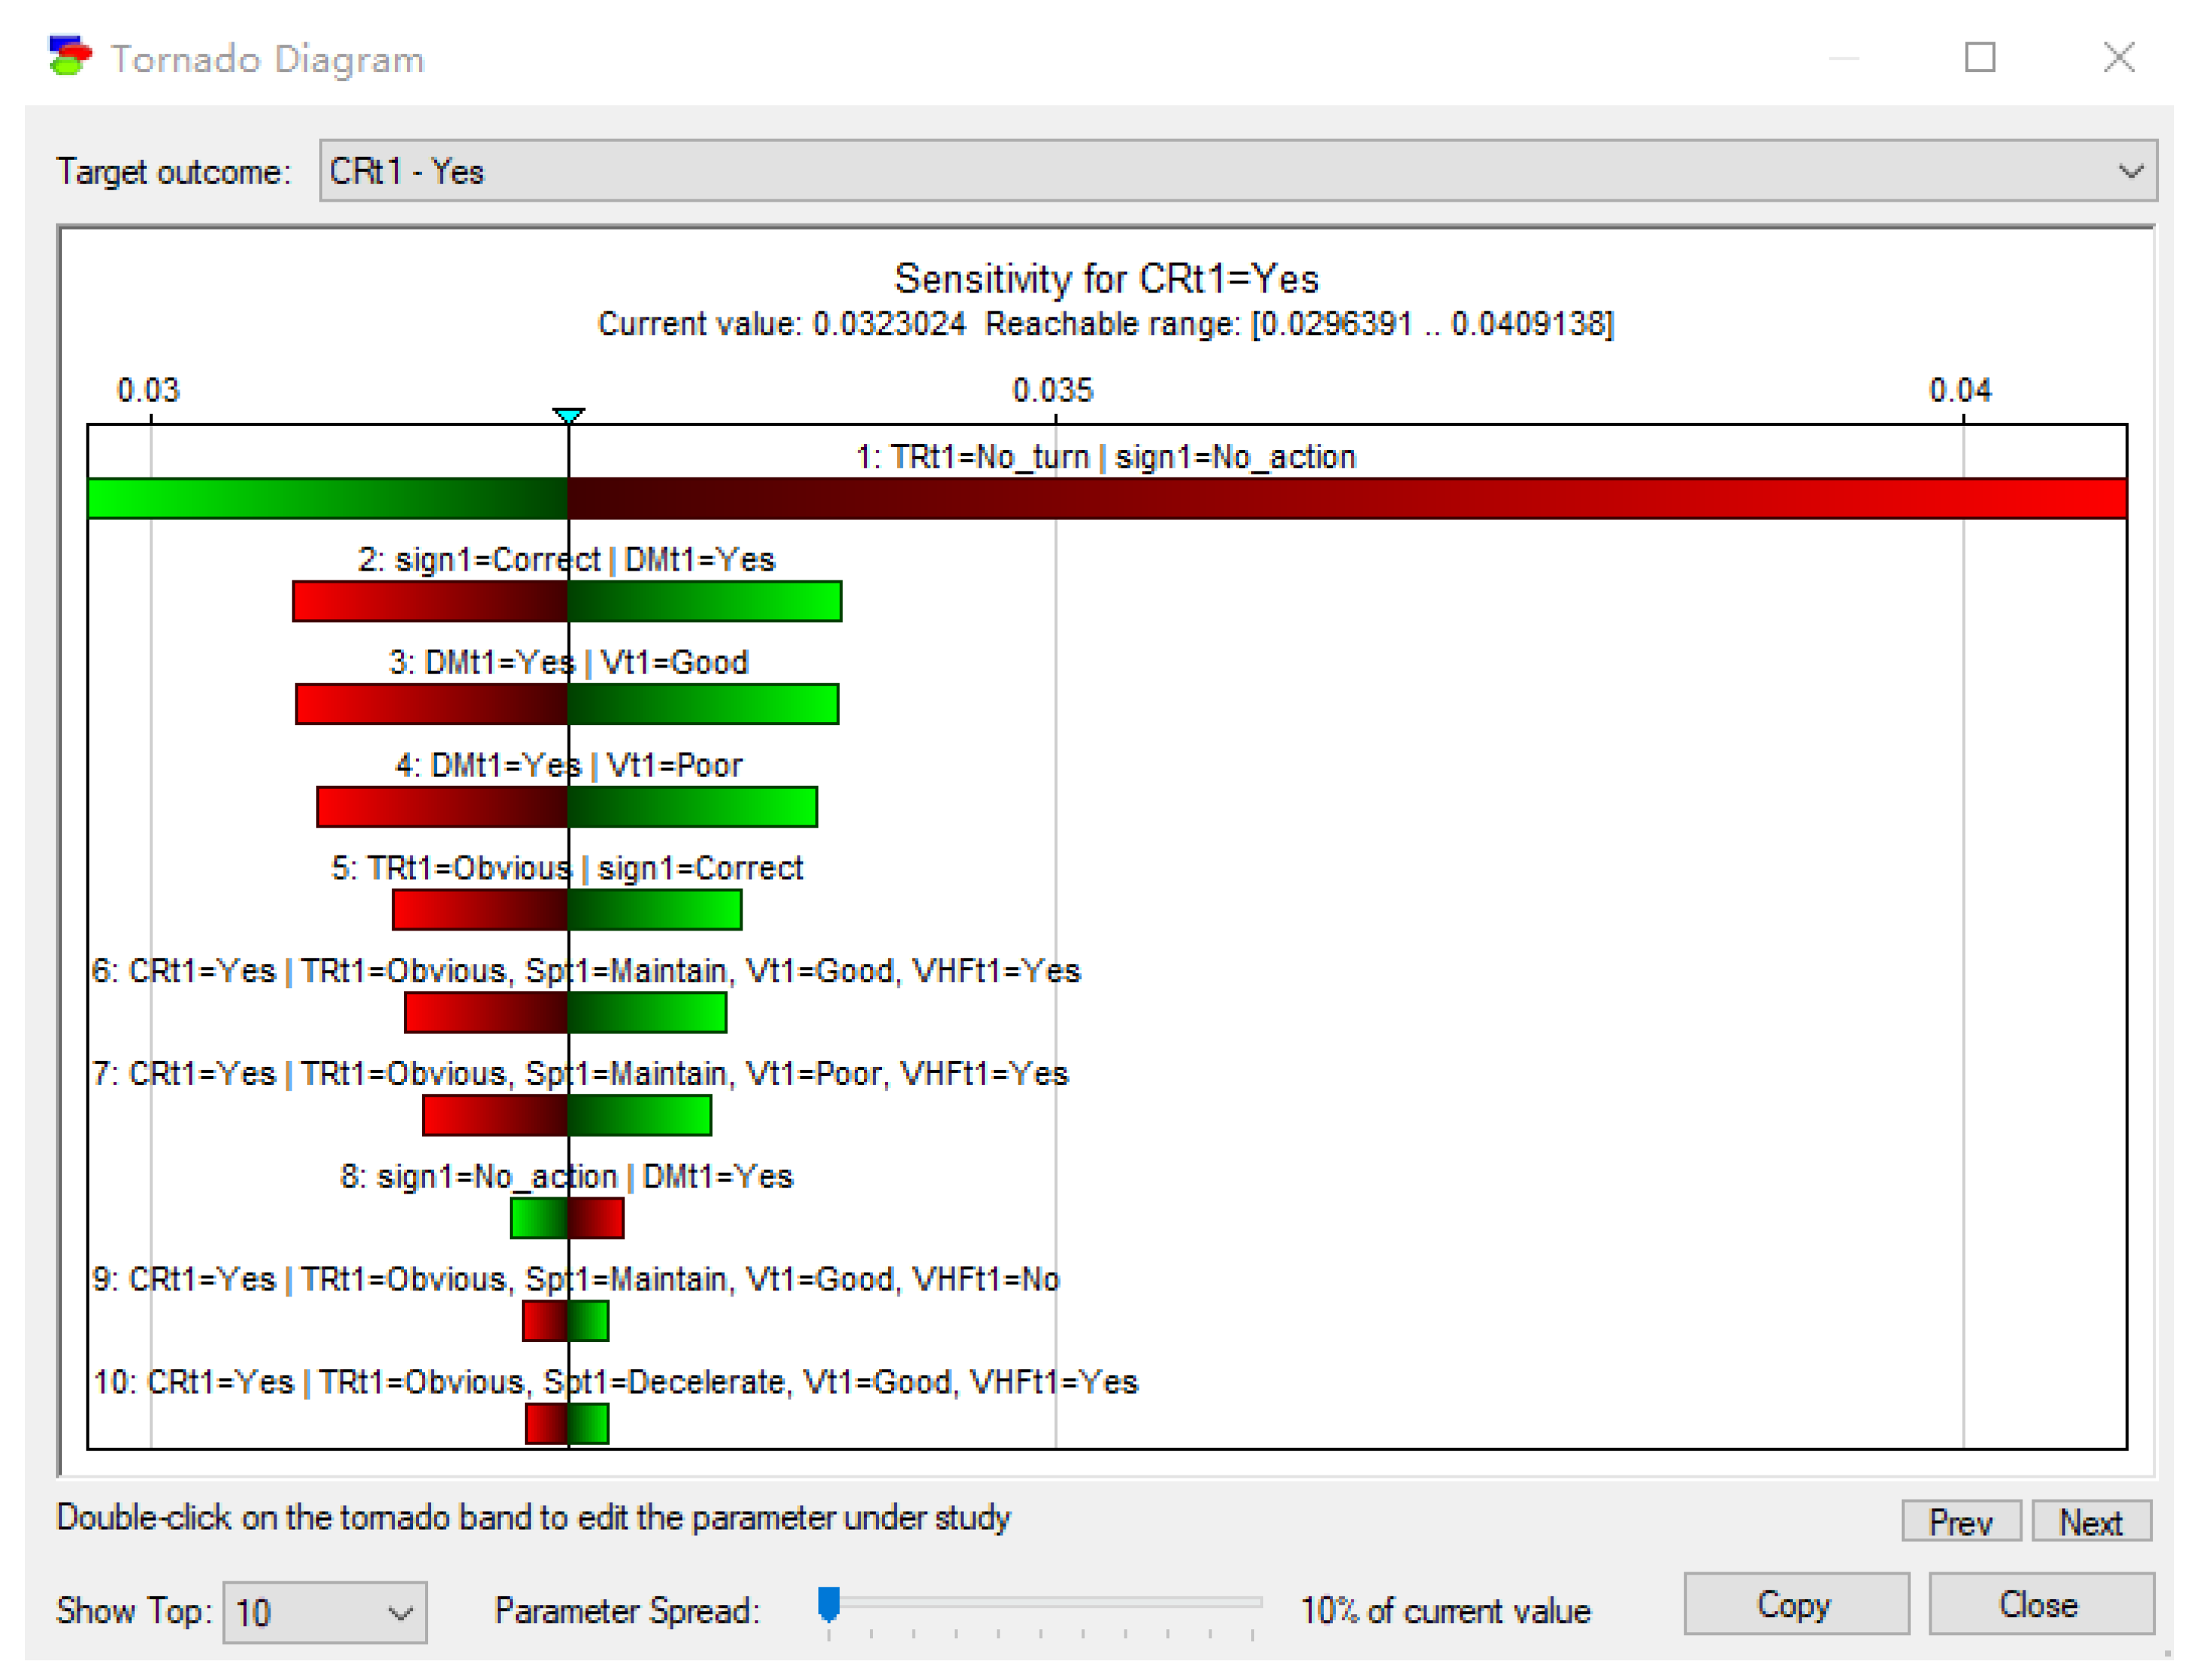
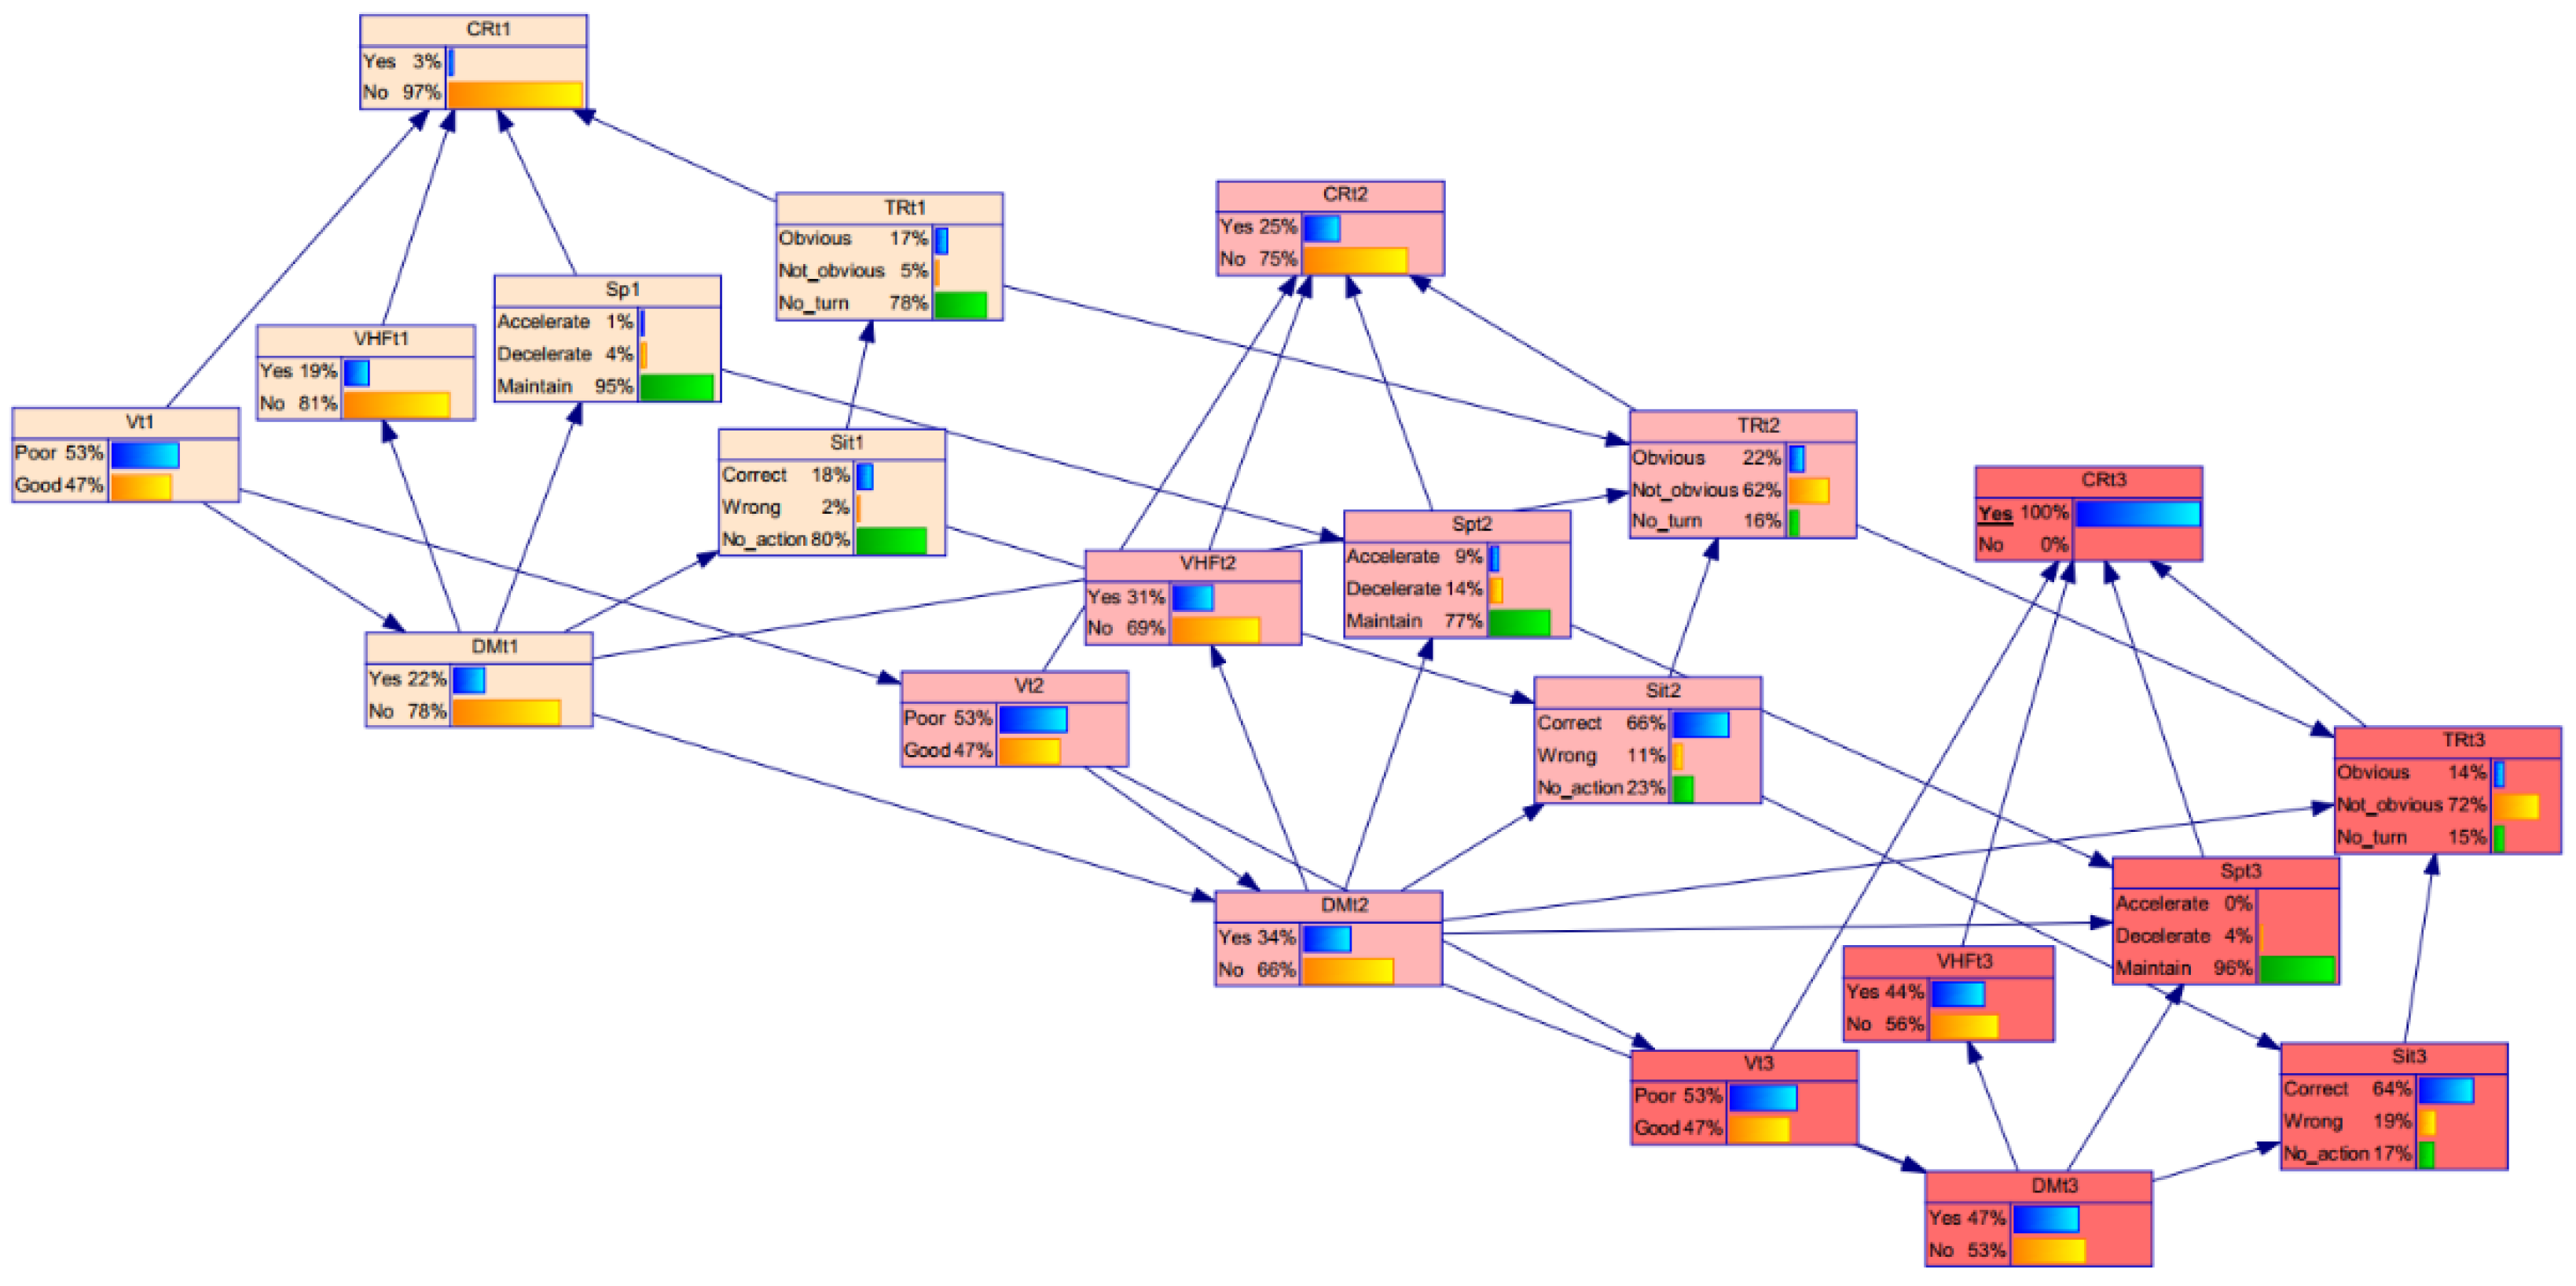
Section 4 discusses the causal chain of ship collision accidents. Finally, Section 5 summarizes this study and proposes relevant conclusions.

2. Methods

2.1. Framework

The proposed framework for the probabilistic analysis of maritime accidents caused by the unsafe acts of seafarers incorporates a navigation simulation and a DBN for exploring the causal chain of collision accidents caused by seafarers’ unsafe acts. The process includes four steps, as shown in Figure 1.
Step 1: Identification of unsafe acts: An in-depth investigation of global maritime investigation reports is conducted to identify the critical seafarers’ unsafe acts that induce maritime accidents.
Step 2: Simulation experiment: Following the process of Step 1, a ship-maneuvering simulator experiment is designed to effectively collect the ship-handling data of seafarers during hazardous accident scenarios.
Step 3: Process risk modeling: A dynamic probabilistic model is proposed using a DBN to describe the dynamic process phases of maritime accidents sourced from the navigation simulation experiment data collected under Step 2.
Step 4: Evolution analysis. Under the DBN model of Step 3, the proposed DBN model is further validated and used to explore the causal chain of maritime accidents by sensitivity analysis, thus revealing the occurrence and evolution mechanisms of maritime accidents through reverse reasoning.

2.2. Simulation Experiment

A navigation simulation experiment designed to explore the unsafe behaviors of seafarers under the ship encounter phases can be decomposed into four coherent phases relative to ship collision risk [46], as shown in Figure 2.
  • Phase 0: Free navigation—In this phase, the risk of ship collision can be omitted.
  • Phase 1: Occurrence of ship collision risk—In this phase, the risk of ship collision is low.
  • Phase 2: Close-quarters situation—In this phase, the risk of ship collision is moderate.
  • Phase 3: Immediate danger—In this phase, the risk of ship collision is high.
In the experiment, a 360° stereoscopic ship-maneuvering simulator was used to collect ship-handling behavior data from seafarers. The details of the simulation experiment can be found in [47]. The seafarers were required to sail from the initial position to a specific destination under random visibility and form a small-angle intersection with a stand-on vessel driven by a navigation instructor, as shown in Figure 3. Then, the seafarers were given a series of tasks for navigating the give-way vessel and preventing collision, including channel crossing, speed, collision avoidance range, and collision avoidance opportunity selection.

2.3. Dynamic Bayesian Network

A DBN is an uncertainty modeling method that expresses the logical relationship between variables and captures the dynamic (temporal) aspects of the variables through a probabilistic graphical model [28], including node analysis, structure analysis, and conditional probability tables (CPTs) estimation, as follows:
  • Node analysis: Each node in the DBN represents a variable or a variable attribute, which has obvious time-varying relationships and significantly influences the research content.
  • Structure analysis: DBNs are constructed from a set of BNs that express the instantaneous relationships between variables [32]. As shown in Figure 4, DBNs are defined as   B 1 ,   B , where B 1 is a BN composed of an initial network (Figure 4a) and a transition network (Figure 4b), and B   is a BN containing multiple time slices (Figure 4c), in which X 1 ti ,   X 2 ti ,   and   X 3 ti are the respective node variables in the i-th time slice.
  • CPTs estimation: The quantification of a DBN is to determine the conditional probability distribution of nodes in the network under the premise of a given network structure. Each node is associated with a probability table indicating the probability of the variable with respect to its possible states. According to the initial and conditional probability distributions, a dynamic Bayesian network can be expanded to the t-th time slice to obtain a joint probability distribution spanning multiple time slices. The conditional distribution between the variables of two adjacent time slices is determined using Equation (1):
    P Z t | Z t 1 = i = 1 N P ( Z t i | P a ( Z t i ) ) ,  
    where   Z t i is the i-th node on the t-th time slice, and   P a ( Z t i ) is the parent node of Z t i . Each node has a conditional probability distribution   P ( Z t i | P a ( Z t i ) ) in each time slice. The details of the three types of probability distributions for a DBN can be found in [48].
Consequently, sensitivity analysis is conducted to rank the individual variables with respect to their contributions to the overall system (as the output) variability and then identify the key factor path that affects the whole system. The details of the model validation method for a DBN can be found in [44].

3. Case Study

In this paper, the typical navigational accident-collision is chosen as the case to interpret the proposed framework, considering the formation process of ship collision risks from the occurrence of ship collision risk (phase 1) to the close-quarters situation (phase 2), and to immediate danger (phase 3). The framework is applied to explore the causal chain of collision accidents caused by the unsafe acts of seafarers.

3.1. Step 1: Identification of Unsafe Acts

The Maritime Accident/Incident Investigation Report (MAIR) is a significant data source for maritime safety analysis, recording the involved ships, the details of maritime accidents, and the detailed causes of the accidents [34,49,50]. In light of this, we investigated global MAIRs for collision accidents from 2000 to 2019 as reported by 9 organizations or institutions. The collection of the MAIRs is based on two criteria: (1) the report is written in English or Chinese so that we can understand clearly, and (2) the report describes the detailed information of the collision accidents, including the causes, evolution process, and consequences. A total of 207 global collision accident investigation reports were obtained, and the data source of these MAIRs is shown in Table 1.
Before text mining the collected 207 MAIRs of global collision accidents, we identified the potential risk factors of collision accidents with respect to the identified factors in the existing publications. Then, the potential risk factors were coded for deep excavating in the 207 MAIRs by using Nvivo software. Suppose one risk factor is recognized as the cause of the collision accident. In that case, we count 1, no matter how many times the factor exists in the MAIRs. Next, the critical risk factors were obtained according to the frequency of each factor in the 207 MAIRs. Subsequently, based on the frequency statistics of specific unsafe acts of seafarers which led to collision accidents extracted from the 207 MAIRs, the ship-handling acts whose frequency is higher than 50 and can be reflected by the navigation simulator are selected. Finally, five critical unsafe acts were identified related to the frequency of occurrence in these collision accident investigation reports, as shown in Table 2.
It is noteworthy that severe weather, sea conditions, and the condition of the ship were also important, influential risk factors which induced collision accidents [52,56], which are considered in the simulation experiment and process risk modeling steps.

3.2. Step 2: Simulation Experiment

In this step, a simulation experiment was designed to further explore the evolution of unsafe behavior of seafarers from ship encounter phases, considering the identified critical unsafe acts by the seafarers from global collision accident investigation reports.

3.2.1. Experiment Participants

In total, 169 participants were recruited, comprising 75 senior students majoring in marine technology and 94 seafarers with sailing experience. The students and seafarers participated in the experiment from 19 November 2017 to 23 April 2018. All participants were required to hold a crew certificate before participation. All participants were men, with an average age of 27.4 years (range: 21–39 years, standard deviation (SD) = 6.2) and average sailing history of 70.8 months (range: 18–204 months, SD = 4.6). The ranks of seafarers ranged from third officer to captain.

3.2.2. Experimental Procedure

Before conducting the experiment, participants were asked to familiarize themselves with the basic operations of the simulator, such as docking, deceleration, course alteration, and course- and speed-change integration. The experimental simulation time ranged from 15 to 20 min, and the voyage distance was approximately 4 nautical miles. Ship A was driven by a participant, and Ship B, piloted by a nautical teacher, was required to sail from the initial position to the North Passage of the Yangtze Estuary. A crossing situation was devised in which the participant, unaware of the intention of ship B and piloting the vessel required to give way, was required to undertake a series of actions to prevent a collision. The initial distance between the two ships was four nautical miles. Figure 5 depicts the vessel track map used in the experiment.
The navigation experiment simulation overview and the resulting data on behavior are listed in Table 3 and Table 4, respectively.

3.3. Step 3: Process Risk Modeling

According to the ship encounter phases shown in Figure 2, the DBN model can be divided into three time slices based on the distance for collision avoidance: the occurrence of ship collision risk (phase 1), close-quarters situation (phase 2), and immediate danger (phase 3). The data on unsafe acts were collected through experiments conducted on the navigation simulator. Table 5 shows the states and related explanations of each network node, where state i (i = 1, 2, or 3) represents the i-th state of the node. The values for state 1, state 2, and state 3 are binary, given as [0, 1], indicating the probability of each state.
As the navigation simulation experiment data on the ship-handling behaviors during collision avoidance include proper very high frequency (VHF) communication, appropriate issuance of maneuvering and warning signals, and course change speed and turning range, the above-mentioned behaviors were used as the nodes in each time slice, and a discrete DBN composed of 21 nodes was created, as shown in Figure 6.
Figure 6 displays the prior probability distribution determined by the percentages of collected samples of the seafarers’ actions. The conditional probability of each child node is consistent with the definition of CPTs, which measures the probability of the child node occurring given that the parent node has already occurred. Based on the behavioral data obtained from the experiment and the relevant environmental information (Table 3 and Table 4), the probability distribution of the state of each node in Figure 5 was derived through the reasoning process described in Section 2.3. The BN development software GeNIe was used to calculate the network probability propagation based on the prior probability distribution of the maritime accident network. Figure 7 displays the resulting posterior probability distribution of the DBN model.
Table 6 displays the relative error between the posterior probability (predicted value) and the sample probability (true value) of the target node at each phase.
The data in Table 6 show that the predicted results of the target node were consistent with the experimental data. More than 80% of the relative error values were below 0.05, indicating that the network model was reasonable and effective.

4. Discussion

A sensitivity analysis was used to compare changes in the probability values of a target node’s associated nodes to identify the nodes that had the greatest effect on the target node. Mutual information was the main indicator to measure the degree of association between random variables in the sensitivity analysis [57]. The larger the value of mutual information, the greater the degree of association between the variables. To identify the dynamic causal chain of ship collision accidents, this study conducts sensitivity analysis on the respective three ship encounter phases to identify the key unsafe acts that affect ship safety in each phase.

4.1. Phase 1: Occurrence of Ship Collision Risk

The sensitivity analysis of output nodes under the influence of the low collision risk (CRt1) node in the occurrence of ship collision risk phase is shown in Figure 8. The tornado diagram with “CRt1” as the target variable for sensitivity analysis is shown in Figure 9.
The influence analysis was carried out in the software GeNIe to examine the validity of the DBN model. It can be seen from Figure 8 and Figure 9 that when the node (variable) CRt1 is used as the sensitivity analysis target, the important effects are TRt1, Sit1, and DMt1, which shows that that failure to undertake a substantial alteration of course in time, issuance of maneuvering and warning signals failure, and a failure to make early decisions are the critical factors that fail to detect the danger of collision and avoid the occurrence of collision in time.

4.2. Phase 2: Close-Quarters Situation

The sensitivity analysis of output nodes under the influence of the medium collision risk (CRt2) node in the occurrence of the ship collision risk phase is shown in Figure 10. The tornado diagram depicting the full range analysis of the sensitivity of the DBN model with the node of medium collision risk “CRt2” as the target variable of the sensitivity analysis is shown in Figure 11.
The influential degree of each act factor shows an increasing trend with time. It can be seen from Figure 10 and Figure 11 that the most prominent factors are TRt2, TRt1, Sit1, DMt1, VHFt1, and Spt2, noting that their mutual information values were all higher than 0.01. Compared with phase 1, the collision risk in phase 2 is not only related to the avoidance range (in phases 1 and 2), the issuance of warning signals (in phase 1), and early decision-making (in phase 1) but also related to whether VHF communication had been carried out in time (in phase 1) and whether unsafe speed had been used (in phase 2).

4.3. Phase 3: Immediate Danger

In the same way, the sensitivity analysis results with CRt3 (high collision risk) used as the target node are shown in Figure 12 and Figure 13, respectively.
The important effects of TRt3, TRt2, VHFt3, DMt3, Spt3, DMt2, and Vt3 and their resultant statistical sensitivity numerical values are shown in Table 7.
Table 7 shows that the mutual information value of the avoidance range in the immediate danger phase was the largest, reaching 0.2091. The second largest was that for the avoidance range in the close-quarters situation phase, with a mutual information value of 0.0351. The third largest was that for VHF communication in the immediate danger phase, with a mutual information value of 0.0336. The mutual information values of the other nodes were relatively small. These results indicate that improper maintenance of the avoidance range was the primary act leading to a collision.

4.4. Reverse Reasoning

The high collision risk of the CRt3 node in the final phase was used as the starting point, and the state of collision (Yes = 100%) was used as the evidence node to identify the causal probability of the seafarers’ acts and the nodes with the maximum posterior probability through reverse reasoning. Figure 14 shows the reverse reasoning diagram of the DBN model.
Figure 14 demonstrates that in the occurrence of ship collision risk (phase 1), the posterior probability values for failing to turn to avoid collision, maintaining speed, failing to perform VHF communication, failing to make decisions, and poor visibility were 77.7%, 94.5%, 81.2%, 77.9%, and 52.6%, respectively. In the close-quarters situation (phase 2), the probability values for failing to turn to avoid collision, maintaining speed, failing to perform VHF communication, and poor visibility were 62%, 77%, 68.8%, and 52.6%, respectively. In the immediate danger (phase 3), the probability of being unaware of the avoidance range, failing to perform VHF communication, failing to make decisions as soon as possible, maintaining speed, and having a poor navigational environment rose from 46.4%, 47.9%, 44.5%, 92.2%, and 49.7 % to 71.6%, 56.2%, 52.5%, 96.3%, and 52.6%, respectively. Furthermore, the causal chain of accidents was identified by analyzing changes in the probabilities of the aforementioned nodes. When the high collision risk of CRt3 reached 100%, the parent node with the maximum posterior probability was identified downward, and the state was the most likely path (causal chain) to a collision. Table 8 shows the maximum posterior probability distribution of the behavior nodes.
Table 8 indicates that collisions occurred more frequently during poor visibility conditions. A total of 52.5% of the collisions resulted from the following chain of events: poor visibility→ no avoidance decision in the occurrence of ship collision risk (phase 1)→no avoidance decision in the close-quarters situation (phase 2)→no avoidance decision in the immediate danger (phase 3)→collision. A total of 47.5% of the collisions resulted from the following chain of events: poor visibility→ no avoidance decision in the occurrence of ship collision risk (phase 1) or the close-quarters situation (phase 2)→making an avoidance decision in the immediate danger (phase 3)→failure to perform VHF communication→ failure to decelerate→ unclear turning range→ collision.

5. Conclusions

This paper proposes a framework for probabilistic analysis of maritime accidents caused by the unsafe acts of seafarers by incorporating navigation simulation and dynamic Bayesian network modeling. Ship collision is chosen as the case for multiple analyses of the causal networks of collisions caused by seafarers’ unsafe acts, which revealed the occurrence of collision accidents and their evolutionary mechanisms. Based on data analyzed in historical collision accident investigation reports, the acts of seafarers collected through a navigation simulator, and a dynamic Bayesian model, this study analyzes the key unsafe acts and dynamic causal processes that affect ship safety and yielded notable results.
The framework is applied to explore the causal chain of collision accidents caused by the unsafe acts of seafarers. Results demonstrate that poor navigation environment (poor visibility) and unsafe seafarers’ acts were the primary causes of collisions. The acts–accident causal chain reveals that failure to undertake a substantial alteration of course (turning range >30°), failure to perform VHF communication, failure to decelerate, and in particular, unawareness of the avoidance turning range, which had been rarely mentioned in the literature, were the main causes of the collision. This study has practical importance for the prevention of maritime accidents. According to the findings, further research can be conducted on topics such as differences in behavior across various experimental conditions and the outcomes of interventions to reduce the unsafe acts of seafarers. For example, by changing the scenes of the simulation experiment, such as in narrow or open waters, it can be recognized whether there are differences in the seafarers’ ship-handling behaviors under different scenes. In addition, the relationship between individual characteristics and unsafe behaviors can be determined by combining corresponding psychological tests in subsequent experiments.
Improvements can also be made in future experiments. First, the navigation simulator can effectively reproduce the navigation risk situation to collect data of seafarers’ ship handling behaviors under the risk situation, but can only reproduce a limited number of scenes, such as some specific ship types and tonnage, as well as specific waterways. Secondly, only seafarers’ unsafe acts and visibility in navigation are considered in this paper. In further study, other factors such as insufficient management and ship equipment failures mentioned in the maritime accident investigation reports can be considered to improve the causal chain. Moreover, the validity of DBNs depends on the reliability of prior knowledge given to them, and minor mistakes in the prior knowledge may distort the results of the entire network. Collecting more experimental sample data is necessary to obtain more reliable prior beliefs in future modeling.

Author Contributions

Conceptualization, methodology, data curation, software, writing—original draft, Y.W.; conceptualization, validation, writing—review and editing, S.F. All authors have read and agreed to the published version of the manuscript.

Funding

This research was supported by the National Natural Science Foundation of China under Grants 71573172 and Shanghai Rising-Star Program 22QC1400600.

Institutional Review Board Statement

Not applicable.

Informed Consent Statement

Not applicable.

Data Availability Statement

Not applicable.

Conflicts of Interest

We declare that we have no financial and personal relationships with other people or organizations that can inappropriately influence our work, there is no professional or other personal interest of any nature or kind in any product, service and/or company that could be construed as influencing the position presented in, or the review of, the manuscript entitled, ‘Framework for process analysis of maritime accidents caused by the unsafe acts of seafarers: A case study of ship collision’.

References

  1. Graziano, A.; Teixeira, A.P.; Soares, C.G. Classification of human errors in grounding and collision accidents using the TRACEr taxonomy. Saf. Sci. 2016, 86, 245–257. [Google Scholar] [CrossRef]
  2. Shi, X.; Zhuang, H.; Xu, D. Structured survey of human factor-related maritime accident research. Ocean Eng. 2021, 237, 109561. [Google Scholar] [CrossRef]
  3. Yildiz, S.; Uğurlu, Ö.; Wang, J.; Loughney, S. Application of the HFACS-PV approach for identification of human and organizational factors (HOFs) influencing marine accidents. Reliab. Eng. Syst. Saf. 2021, 208, 107395. [Google Scholar] [CrossRef]
  4. Qiao, W.; Liu, Y.; Ma, X.; Liu, Y. Human Factors Analysis for Maritime Accidents Based on a Dynamic Fuzzy Bayesian Network. Risk Anal. 2020, 40, 957–980. [Google Scholar] [CrossRef] [PubMed]
  5. Branch, M.A.I.; House, C.; Place, C. Bridge Watchkeeping Safety Study; Marine Accident Investigation Branch: Southampton, UK, 2004. [Google Scholar]
  6. Lan, H.; Ma, X.; Qiao, W.; Yang., L. A methodology to assess the causation relationship of seafarers’ unsafe acts for ship grounding accidents based on Bayesian SEM. Ocean Coast. Manag. 2022, 225, 106189. [Google Scholar] [CrossRef]
  7. Lan, H.; Ma, X.; Qiao, W.; Ma, L. On the causation of seafarers’ unsafe acts using grounded theory and association rule. Reliab. Eng. Syst. Saf. 2022, 223, 108498. [Google Scholar] [CrossRef]
  8. Rasmussen, J. Human errors. A taxonomy for describing human malfunction in industrial installations. J. Occup. Accid. 1982, 4, 311–333. [Google Scholar] [CrossRef] [Green Version]
  9. Reason, J.T. Managing the Risks of Organizational Accidents; Ashgate: Aldershot, Hants, UK, 1997; p. 252. [Google Scholar]
  10. Hollnagel, E. Cognitive Reliability and Error Analysis Method (CREAM), 1st ed.; Elsevier: Oxford, UK, 1998; p. 287. [Google Scholar]
  11. Wiegmann, D.A.; Shappell, S.A. Human error analysis of commercial aviation accidents: Application of the Human Factors Analysis and Classification system (HFACS). Aviat. Space Environ. Med. 2001, 72, 1006–1016. [Google Scholar]
  12. Chauvin, C.; Lardjane, S.; Morel, G.; Clostermann, J.; Langard, B. Human and organisational factors in maritime accidents: Analysis of collisions at sea using the HFACS. Accid. Anal. Prev. 2013, 59, 26–37. [Google Scholar] [CrossRef]
  13. Hulme, A.; Stanton, N.A.; Walker, G.H.; Waterson, P.; Salmon, P.M. What do applications of systems thinking accident analysis methods tell us about accident causation? A systematic review of applications between 1990 and 2018. Saf. Sci. 2019, 117, 164–183. [Google Scholar] [CrossRef]
  14. Uğurlu, Ö.; Yıldız, S.; Loughney, S.; Wang, J. Modified human factor analysis and classification system for passenger vessel accidents (HFACS-PV). Ocean Eng. 2018, 161, 47–61. [Google Scholar] [CrossRef]
  15. Cordon, J.R.; Mestre, J.M.; Walliser, J. Human factors in seafaring: The role of situation awareness. Saf. Sci. 2017, 93, 256–265. [Google Scholar] [CrossRef]
  16. Zhang, Y.; Sun, X.; Chen, J.; Cheng, C. Spatial patterns and characteristics of global maritime accidents. Reliab. Eng. Syst. Saf. 2021, 206, 107310. [Google Scholar] [CrossRef]
  17. Wróbel, K. Searching for the origins of the myth: 80% human error impact on maritime safety. Reliab. Eng. Syst. Saf. 2021, 216, 107942. [Google Scholar] [CrossRef]
  18. Yıldırım, U.; Başar, E.; Uğurlu, Ö. Assessment of collisions and grounding accidents with human factors analysis and classification system (HFACS) and statistical methods. Saf. Sci. 2019, 119, 412–425. [Google Scholar] [CrossRef]
  19. Ung, S. Evaluation of human error contribution to oil tanker collision using fault tree analysis and modified fuzzy Bayesian Network based CREAM. Ocean Eng. 2019, 179, 159–172. [Google Scholar] [CrossRef]
  20. Celik, M.; Cebi, S. Analytical HFACS for investigating human errors in shipping accidents. Accid. Anal. Prev. 2009, 41, 66–75. [Google Scholar] [CrossRef]
  21. Akyuz, E.; Celik, M. Utilisation of cognitive map in modelling human error in marine accident analysis and prevention. Saf. Sci. 2014, 70, 19–28. [Google Scholar] [CrossRef]
  22. Ung, S. A weighted CREAM model for maritime human reliability analysis. Saf. Sci. 2015, 72, 144–152. [Google Scholar] [CrossRef]
  23. Yang, Z.L.; Bonsall, S.; Wall, A.; Wang, J.; Usman, M. A modified CREAM to human reliability quantification in marine engineering. Ocean Eng. 2013, 58, 293–303. [Google Scholar] [CrossRef]
  24. Akhtar, M.J.; Utne, I.B. Human fatigue’s effect on the risk of maritime groundings—A Bayesian Network modeling approach. Saf. Sci. 2014, 62, 427–440. [Google Scholar] [CrossRef]
  25. Lan, H.; Ma, X.; Qiao, W.; Deng, W. Determining the critical risk factors for predicting the severity of ship collision accidents using a data-driven approach. Reliab. Eng. Syst. Saf. 2022, 230, 108934. [Google Scholar] [CrossRef]
  26. Gil, M.; Kozioł, P.; Wróbel, K.; Montewka, J. Know your safety indicator—A determination of merchant vessels Bow Crossing Range based on big data analytics. Reliab. Eng. Syst. Saf. 2022, 220, 108311. [Google Scholar] [CrossRef]
  27. Xu, D.; Wang, Y. Exploring the Effect of Timely Reminder on Maritime Unsafe Acts. Transp. Res. Rec. J. Transp. Res. Board 2020, 2674, 850–860. [Google Scholar] [CrossRef]
  28. Guo, Y.; Jin, Y.; Hu, S.; Yang, Z.; Xi, Y.; Han, B. Risk evolution analysis of ship pilotage operation by an integrated model of FRAM and DBN. Reliab. Eng. Syst. Saf. 2022, 229, 108850. [Google Scholar] [CrossRef]
  29. Ma, X.; Deng, W.; Qiao, W.; Lan, H. A methodology to quantify the risk propagation of hazardous events for ship grounding accidents based on directed CN. Reliab. Eng. Syst. Saf. 2022, 221, 108334. [Google Scholar] [CrossRef]
  30. Shi, X.; Xu, D.; Zhuang, H.; Liu, C. How unsafe acts occur: An automatic text mining study. Marit. Policy Manag. 2022, 49, 820–830. [Google Scholar] [CrossRef]
  31. Li, H.; Ren, X.; Yang, Z. Data-driven Bayesian network for risk analysis of global maritime accidents. Reliab. Eng. Syst. Saf. 2022, 230, 108938. [Google Scholar] [CrossRef]
  32. Zhang, K.; Collette, M. Predicting growth and interaction of multiple cracks in structural systems using Dynamic Bayesian Networks. Mar. Struct. 2022, 86, 103271. [Google Scholar] [CrossRef]
  33. Fu, S.; Zhang, D.; Montewka, J.; Yan, X.; Zio, E. Towards a probabilistic model for predicting ship besetting in ice in Arctic waters. Reliab. Eng. Syst. Saf. 2016, 155, 124–136. [Google Scholar] [CrossRef] [Green Version]
  34. Fu, S.; Yu, Y.; Chen, J.; Xi, Y.; Zhang, M. A framework for quantitative analysis of the causation of grounding accidents in arctic shipping. Reliab. Eng. Syst. Saf. 2022, 226, 108706. [Google Scholar] [CrossRef]
  35. Goerlandt, F.; Montewka, J. A framework for risk analysis of maritime transportation systems: A case study for oil spill from tankers in a ship–ship collision. Saf. Sci. 2015, 76, 42–66. [Google Scholar] [CrossRef]
  36. Hänninen, M.; Kujala, P. Influences of variables on ship collision probability in a Bayesian belief network model. Reliab. Eng. Syst. Saf. 2012, 102, 27–40. [Google Scholar] [CrossRef]
  37. Xu, S.; Kim, E.; Haugen, S.; Zhang, M. A Bayesian network risk model for predicting ship besetting in ice during convoy operations along the Northern Sea Route. Reliab. Eng. Syst. Saf. 2022, 223, 108475. [Google Scholar] [CrossRef]
  38. Zhang, D.; Yan, X.P.; Yang, Z.L.; Wall, A.; Wang, J. Incorporation of formal safety assessment and Bayesian network in navigational risk estimation of the Yangtze River. Reliab. Eng. Syst. Saf. 2013, 118, 93–105. [Google Scholar] [CrossRef]
  39. Goerlandt, F.; Montewka, J. A probabilistic model for accidental cargo oil outflow from product tankers in a ship–ship collision. Mar. Pollut. Bull. 2014, 79, 130–144. [Google Scholar] [CrossRef] [PubMed]
  40. Chaal, M.; Bahootoroody, A.; Basnet, S.; Valdez Banda, O.A.; Goerlandt, F. Towards system-theoretic risk assessment for future ships: A framework for selecting Risk Control Options. Ocean Eng. 2022, 259, 111797. [Google Scholar] [CrossRef]
  41. Gil, M.; Wróbel, K.; Montewka, J. Toward a Method Evaluating Control Actions in STPA-Based Model of Ship-Ship Collision Avoidance Process. J. Offshore Mech. Arct. Eng. 2019, 141, 051105. [Google Scholar] [CrossRef]
  42. Fu, S.; Yu, Y.; Chen, J.; Han, B.; Wu, Z. Towards a probabilistic approach for risk analysis of nuclear-powered icebreakers using FMEA and FRAM. Ocean Eng. 2022, 260, 112041. [Google Scholar] [CrossRef]
  43. Khan, B.; Khan, F.; Veitch, B. A Dynamic Bayesian Network model for ship-ice collision risk in the Arctic waters. Saf. Sci. 2020, 130, 104858. [Google Scholar] [CrossRef]
  44. Li, Z.; Hu, S.; Gao, G.; Yao, C.; Fu, S.; Xi, Y. Decision-making on process risk of Arctic route for LNG carrier via dynamic Bayesian network modeling. J. Loss Prevent. Proc. 2021, 71, 104473. [Google Scholar] [CrossRef]
  45. Zinetullina, A.; Yang, M.; Khakzad, N.; Golman, B.; Li, X. Quantitative resilience assessment of chemical process systems using functional resonance analysis method and Dynamic Bayesian network. Reliab. Eng. Syst. Saf. 2021, 205, 107232. [Google Scholar] [CrossRef]
  46. Cheng, Z.; Li, Y.; Wu, B. Early Warning Method and Model of Inland Ship Collision Risk Based on Coordinated Collision-Avoidance Actions. J. Adv. Transport. 2020, 2020, 1–14. [Google Scholar] [CrossRef]
  47. Wang, Y.; Shi, X.; Xu, D. Relationship between Overconfidence and Risky Behavior among Ship Crew. Transp. Res. Rec. J. Transp. Res. Board 2020, 2674, 500–510. [Google Scholar] [CrossRef]
  48. Neapolitan, R.E.; Jiang, X. Chapter 5—Decision Analysis Fundamentals. In Probabilistic Methods for Financial and Marketing Informatics; Neapolitan, R.E., Jiang, X., Eds.; Morgan Kaufmann: Burlington, MA, USA, 2007; pp. 177–228. [Google Scholar]
  49. Mazaheri, A.; Montewka, J.; Nisula, J.; Kujala, P. Usability of accident and incident reports for evidence-based risk modeling—A case study on ship grounding reports. Saf. Sci. 2015, 76, 202–214. [Google Scholar] [CrossRef]
  50. Bye, R.J.; Aalberg, A.L. Maritime navigation accidents and risk indicators: An exploratory statistical analysis using AIS data and accident reports. Reliab. Eng. Syst. Saf. 2018, 176, 174–186. [Google Scholar] [CrossRef]
  51. LUO, M.; SHIN, S. Half-century research developments in maritime accidents: Future directions. Accid. Anal. Prev. 2019, 123, 448–460. [Google Scholar] [CrossRef]
  52. Weng, J.; Yang, D. Investigation of shipping accident injury severity and mortality. Accid. Anal. Prev. 2015, 76, 92–101. [Google Scholar] [CrossRef]
  53. Qu, X.; Meng, Q.; Suyi, L. Ship collision risk assessment for the Singapore Strait. Accid. Anal. Prev. 2011, 43, 2030–2036. [Google Scholar] [CrossRef] [Green Version]
  54. Sotiralis, P.; Ventikos, N.P.; Hamann, R.; Golyshev, P.; Teixeira, A.P. Incorporation of human factors into ship collision risk models focusing on human centred design aspects. Reliab. Eng. Syst. Saf. 2016, 156, 210–227. [Google Scholar] [CrossRef]
  55. Weng, J.; Yang, D.; Chai, T.; Fu, S. Investigation of occurrence likelihood of human errors in shipping operations. Ocean Eng. 2019, 182, 28–37. [Google Scholar] [CrossRef]
  56. Zhang, G.; Thai, V.V. Expert elicitation and Bayesian Network modeling for shipping accidents: A literature review. Saf. Sci. 2016, 87, 53–62. [Google Scholar] [CrossRef]
  57. Gómez-Villegas, M.A.; Main, P.; Viviani, P. Sensitivity to evidence in Gaussian Bayesian networks using mutual information. Inform. Sci. 2014, 275, 115–126. [Google Scholar] [CrossRef]
Figure 1. Research framework.
Jmse 10 01793 g001
Figure 2. Ship encounter phases.
Jmse 10 01793 g002
Figure 3. Experimental scenarios for visibility.
Jmse 10 01793 g003
Figure 4. Dynamic Bayesian networks.
Jmse 10 01793 g004
Figure 5. Experiment area with the tracks of ship A and ship B.
Jmse 10 01793 g005
Figure 6. The structure of the DBN model.
Jmse 10 01793 g006
Figure 7. Posterior probability distribution of the DBN model.
Jmse 10 01793 g007
Figure 8. Node influence degree under the low collision risk (CRt1) in the DBN model.
Jmse 10 01793 g008
Figure 9. Tornado diagram with “CRt1” as the target variable for sensitivity analysis.
Jmse 10 01793 g009
Figure 10. Node influence degree under the medium collision risk (CRt2) in the DBN model.
Jmse 10 01793 g010
Figure 11. Tornado diagram with “CRt2” as the target variable for sensitivity analysis.
Jmse 10 01793 g011
Figure 12. Node influence degree under the high collision risk (CRt3) in the DBN model.
Jmse 10 01793 g012
Figure 13. Tornado diagram with “CRt3” as the target variable for sensitivity analysis.
Jmse 10 01793 g013
Figure 14. Reverse reasoning for the DBN model.
Jmse 10 01793 g014
Table 1. Sources of the 207 global collision accident investigation reports.
NoSourceNumber of ReportsLink
1Marine Accident Investigation Branch (MAIB)58https://www.gov.uk/government/organisations/marine-accident-investigation-branch (accessed on 1 October 2022)
2Australian Transport Safety Bureau (ATSB)22http://www.atsb.gov.au (accessed on 1 October 2022)
3Transport Accident Investigation Commission (TAIC)8https://www.taic.org.nz (accessed on 1 October 2022)
4Transportation Safety Board of Canada (TSB)15https://www.canada.ca/en/transportation-safety-board.html (accessed on 1 October 2022)
5Swedish Accident Investigation Authority (SHK)5https://www.havkom.se/en (accessed on 1 October 2022)
6National Transport Safety Board (NTSB)34https://www.ntsb.gov/safety/Pages/default.aspx (accessed on 1 October 2022)
7Maritime Safety Administration of the People’s Republic of China (MSA)62https://www.msa.gov.cn/page/html/shiguyufang.jsp (accessed on 1 October 2022)
9Dutch Transportation Safety Board (DTSB)3https://www.onderzoeksraad.nl/en/page/12025/investigations (accessed on 1 October 2022)
Total207
Table 2. Critical unsafe acts of seafarers in the 207 collision accidents.
NoUnsafe ActFrequencyPercentage *ExplanationReference
1Unsafe speed6029.0%Failure to maintain a safe speed for collision avoidance[51,52,53]
2Issuance of maneuvering and warning signals failure5526.6%Failure to issue maneuvering and warning signals or issue wrong signals[1,54]
3Improper decision making7234.8%Take avoiding action too late[51,55]
4Improper collision-avoiding action7837.7%Turning range in the alteration of the ship’s course < 30°[51,52,53]
5Inadequate VHF communication12761.4%Failure to communicate with VHF (very high frequency)[1,19,54]
* Percentage of times mentioned in the cause of collision in the 207 MAIRs.
Table 3. Simulation overview.
Parameter 1Scenario
Location of ExperimentWaters near the north passage of the Yangtze Estuary
Experimental ConditionsGood visibility (>10 nautical miles), poor visibility (foggy; <2 nautical miles)
Duration of Experiment15–20 min, voyage distance of approximately 4 nautical miles
1 Data source: [47].
Table 4. Crew behavior when preventing collisions on a navigation simulator during the ship encounter phase.
No.VisibilityDecision-MakingVHF CommunicationIssuance of Maneuvering and Warning SignalsSpeedTurning RangeShip Status
1GoodNo—No—YesNo—No—YesNo action—No action—CorrectMaintain speed—Maintain speed—Maintain speed/—/—15Collision
2PoorYes—No—NoYes—No—NoCorrect—No action—No actionDecelerate—Maintain speed—Maintain speed32—/—/Safety
3PoorYes—No—NoYes—No—NoCorrect—No action—No actionMaintain speed—Maintain speed—Maintain speed32—/—/Safety
…………………………………………
169GoodNo—Yes—YesNo—Yes—YesNo action—Wrong—WrongMaintain speed—Maintain speed—Maintain speed/—15—25Collision
Data source: [47].
Table 5. Definitions and states of the DBN nodes.
PhaseNodeSymbolState 1 (S1)State 2 (S2)State 3 (S3)
Occurrence of ship collision riskLow collision risk t1CRt1YesNo
Decision making t1DMt1YesNo
Visibility t1Vt1PoorGood
Adequate VHF communication t1VHFt1YesNo
Speed t1Spt1AccelerateDecelerateMaintain
Maneuvering and warning signals t1Sit1CorrectWrongNo_action
Turning range t1TRt1ObviousNot_obviousNo_turn
Close-quarters situationMedium collision risk t2CRt2YesNo
Decision making t2DMt2YesNo
Visibility t2Vt2PoorGood
Adequate VHF communication t2VHFt2YesNo
Speed changing t2Spt2AccelerateDecelerateMaintain
Maneuvering and warning signals t2Sit2CorrectWrongNo_action
Turning range t2TRt2ObviousNot_obviousNo_turn
Immediate dangerHigh collision risk t3CRt3YesNo
Decision making t3DMt3YesNo
Visibility t3Vt3PoorGood
Adequate VHF communication t3VHFt3YesNo
Speed changing t3Spt3AccelerateDecelerateMaintain
Maneuvering and warning signals t3Sit3CorrectWrongNo_action
Turning range t3TRt3ObviousNot_obviousNo_turn
Table 6. Model validity analysis of the ship status node in the three phases.
PhaseShip StateFrequency/NumberDistribution ProbabilityPosterior Probability DistributionRelative Error
Immediate danger (t3)No9858.0%58.3%0.0052
Yes7142.0%41.7%0.0071
Close-quarters situation (t2)No4526.6%25.6%0.0386
Yes12473.4%74.4%0.0140
Occurrence of ship collision risk (t1)No31.8%3.2%0.8258
Yes16698.2%96.8%0.0150
Note: “No” in phases t1 and t2 refers to a state in which seafarers were not required to take avoidance measures in subsequent phases to avoid a collision, and “Yes” refers to a state in which seafarers either were required to take avoidance measures or caused collisions after failing to such take measures.
Table 7. Sensitivity analysis results.
NodeMutual InformationPercentage
CRt30.9802100%
TRt30.209121.30%
TRt20.03513.92%
VHFt30.03363.44%
DMt30.01361.39%
Spt30.01291.31%
DMt20.01081.11%
Vt30.00901.03%
Table 8. Maximum posterior probability distribution of act nodes.
Vt1DMt1DMt2DMt3VHFt3Spt3Sit3TRt3
PoorNo (77.9%)No (66%)No (52.5%)
No (77.9%)No (66%)Yes (47.5%)No (56.2%)Maintain (96.3%)Correct (64%)Not_obvious (71.6%)
Publisher’s Note: MDPI stays neutral with regard to jurisdictional claims in published maps and institutional affiliations.

