
Assessing Coastal Flood Risk in a Changing Climate for Dublin, Ireland
 ,
,
Abstract
:1. Introduction
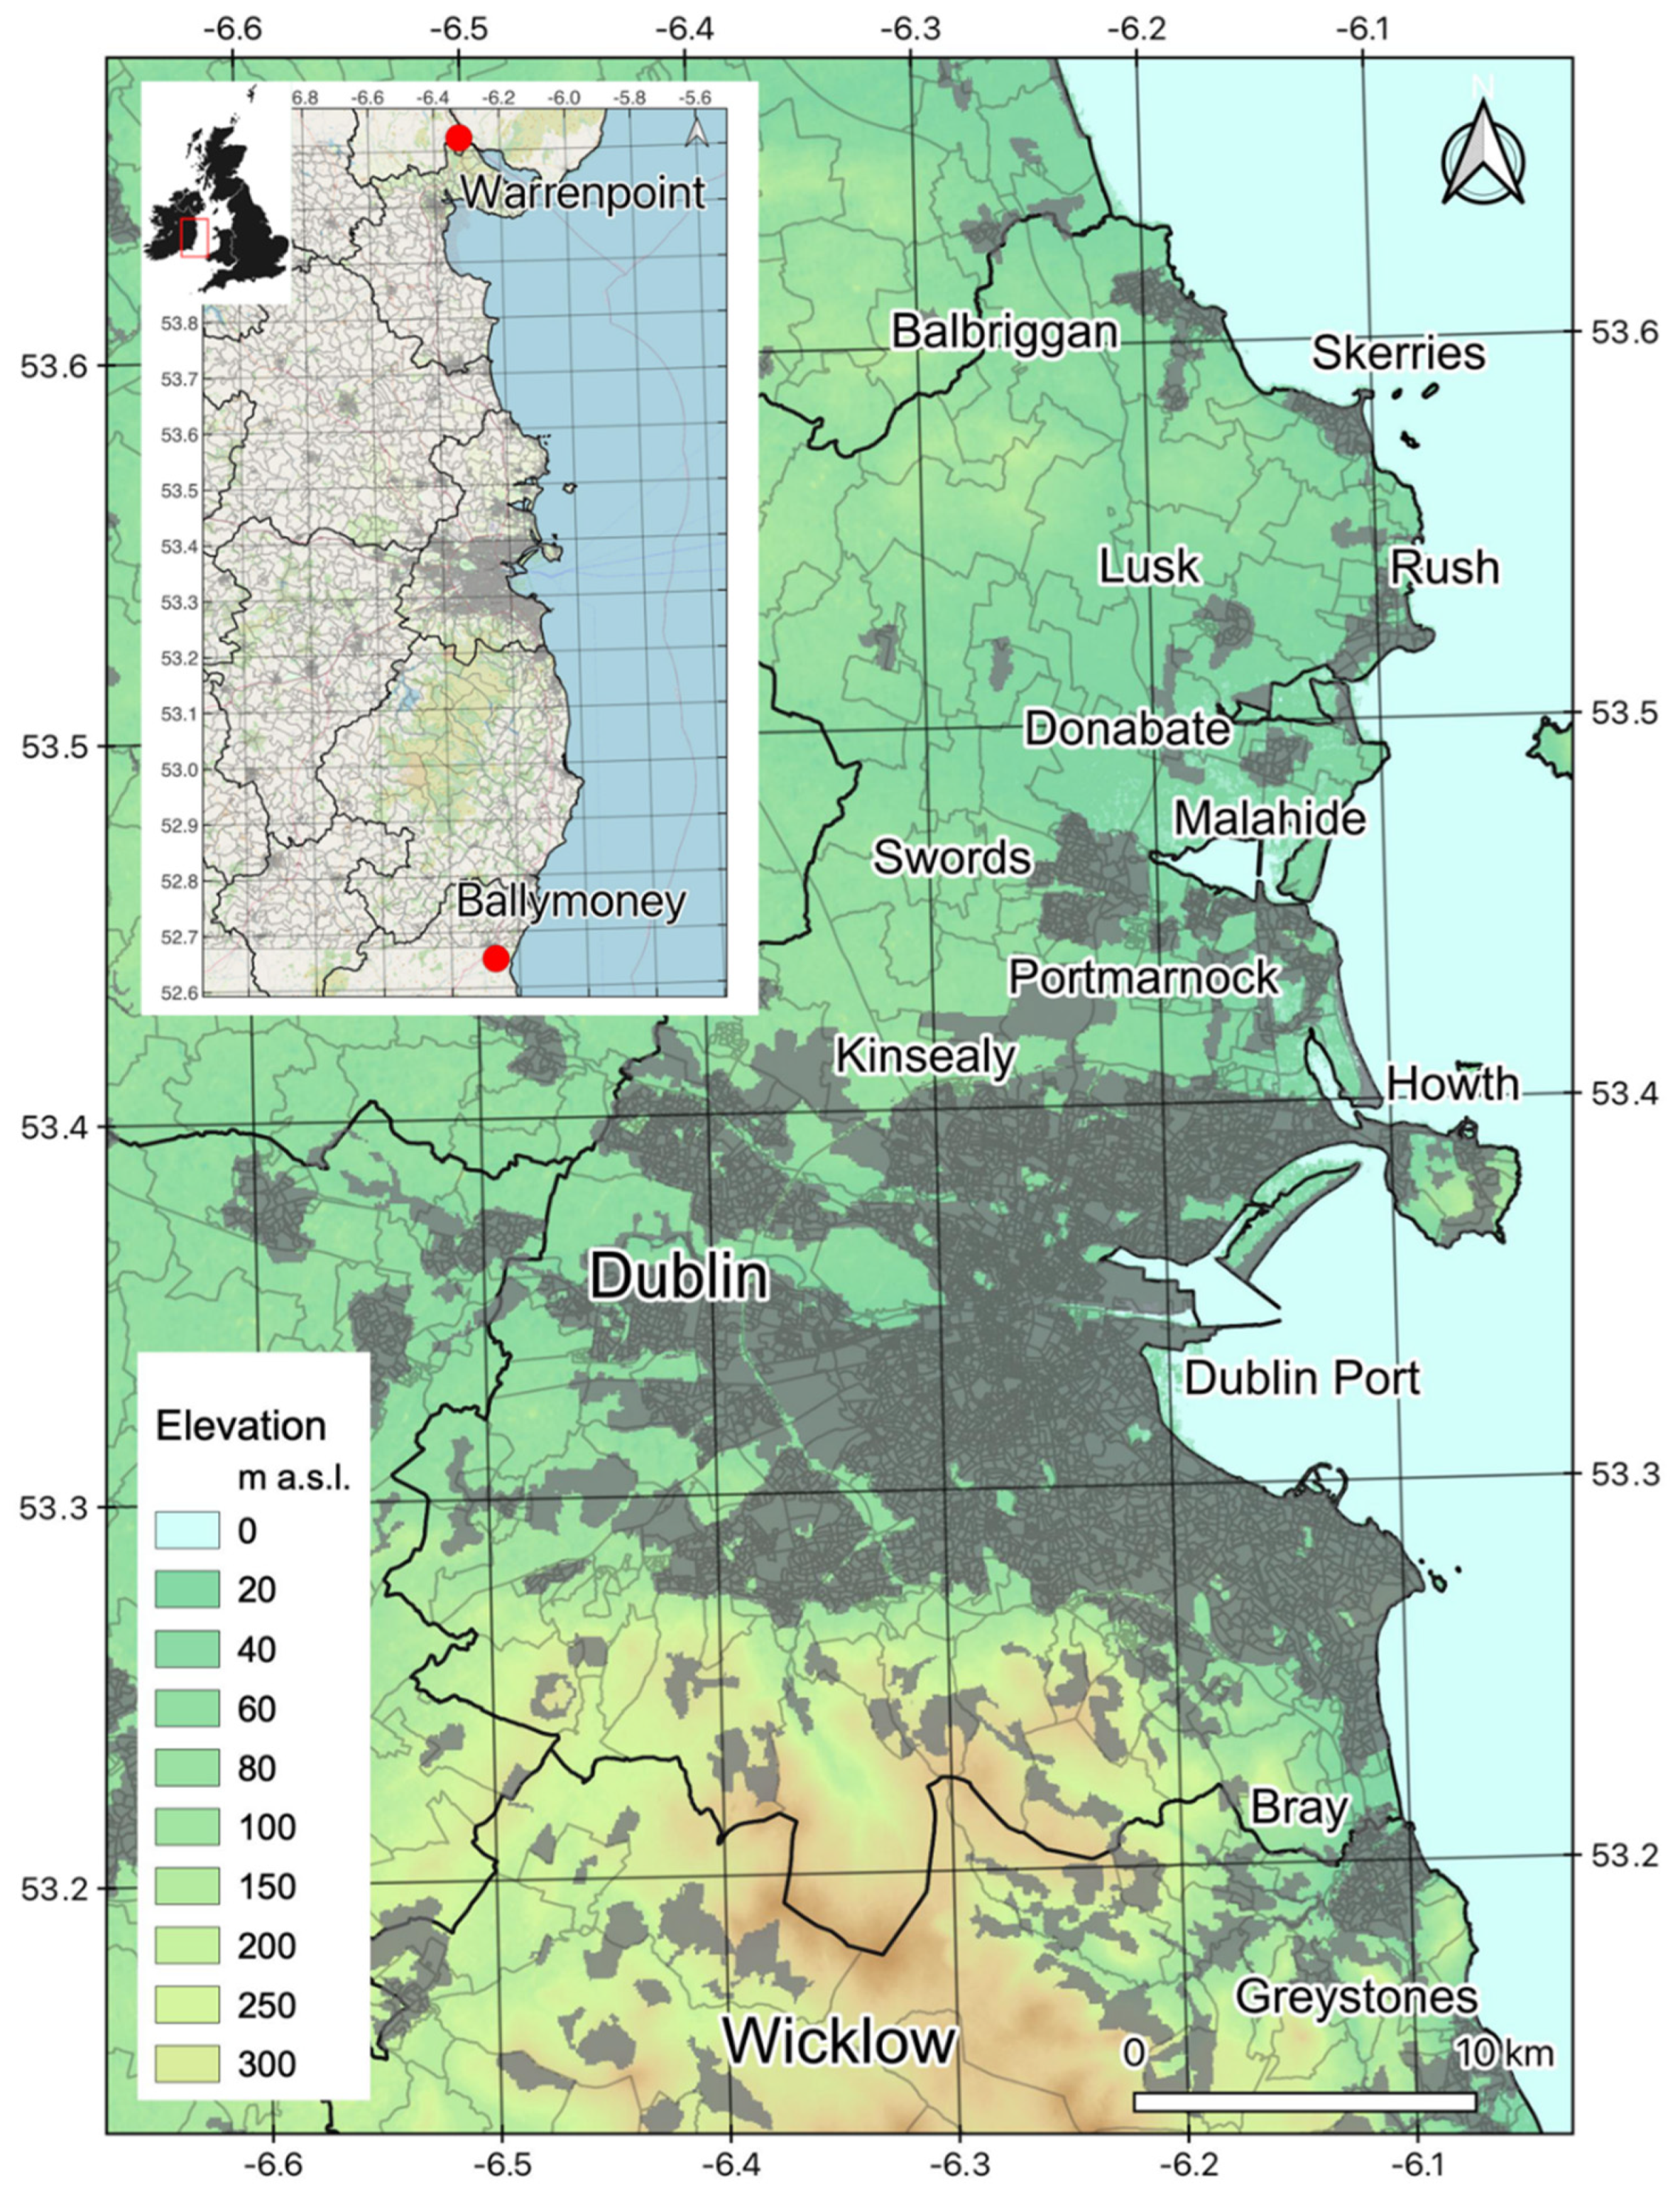
2. The Study Area
3. Data and Methods
3.1. Coastal Inundation Modelling
3.2. Exposure to Coastal Flood
3.3. Vulnerability to Coastal Flooding
- (i)
- Since it is likely that strong correlations exist among socioeconomic variables, a Pearson correlation matrix was computed to assess the degree of pair-wise association among the considered variables.
- (ii)
- In order to minimize the number of variables involved, an orthogonal varimax rotation method has been used. This enables a simpler structure to emerge where each variable is loading on as few components as possible and to maximize the correlation to one principal component at a time, increasing the interpretability.
- (iii)
- The final selection of the principal components has been based on a set of requirements, namely: (i) the Kaiser criterion retaining components with eigenvalues greater than one [75], (ii) total explained variance above 70 % and (iii) variables loading on multiple components have been removed from the analysis.
- (iv)
- The component scores are the scores of each SA on each principal component (Equation (1)). This is calculated by considering the SA’s standardized value on each variable, multiplying this by the corresponding loading of the variable for the given principal component factor and summing these products [76].
- (v)
- The composite vulnerability index score for each SA is computed by summing the products of each factor score weighted (Equation (1)) by the corresponding variance explained by each principal component. The weighted approach allows for the consideration of the different contributions of the principal components to explain the spatial patterns of vulnerability to coastal flooding [77].
3.4. Coastal Flood Risk Assessment
4. Results
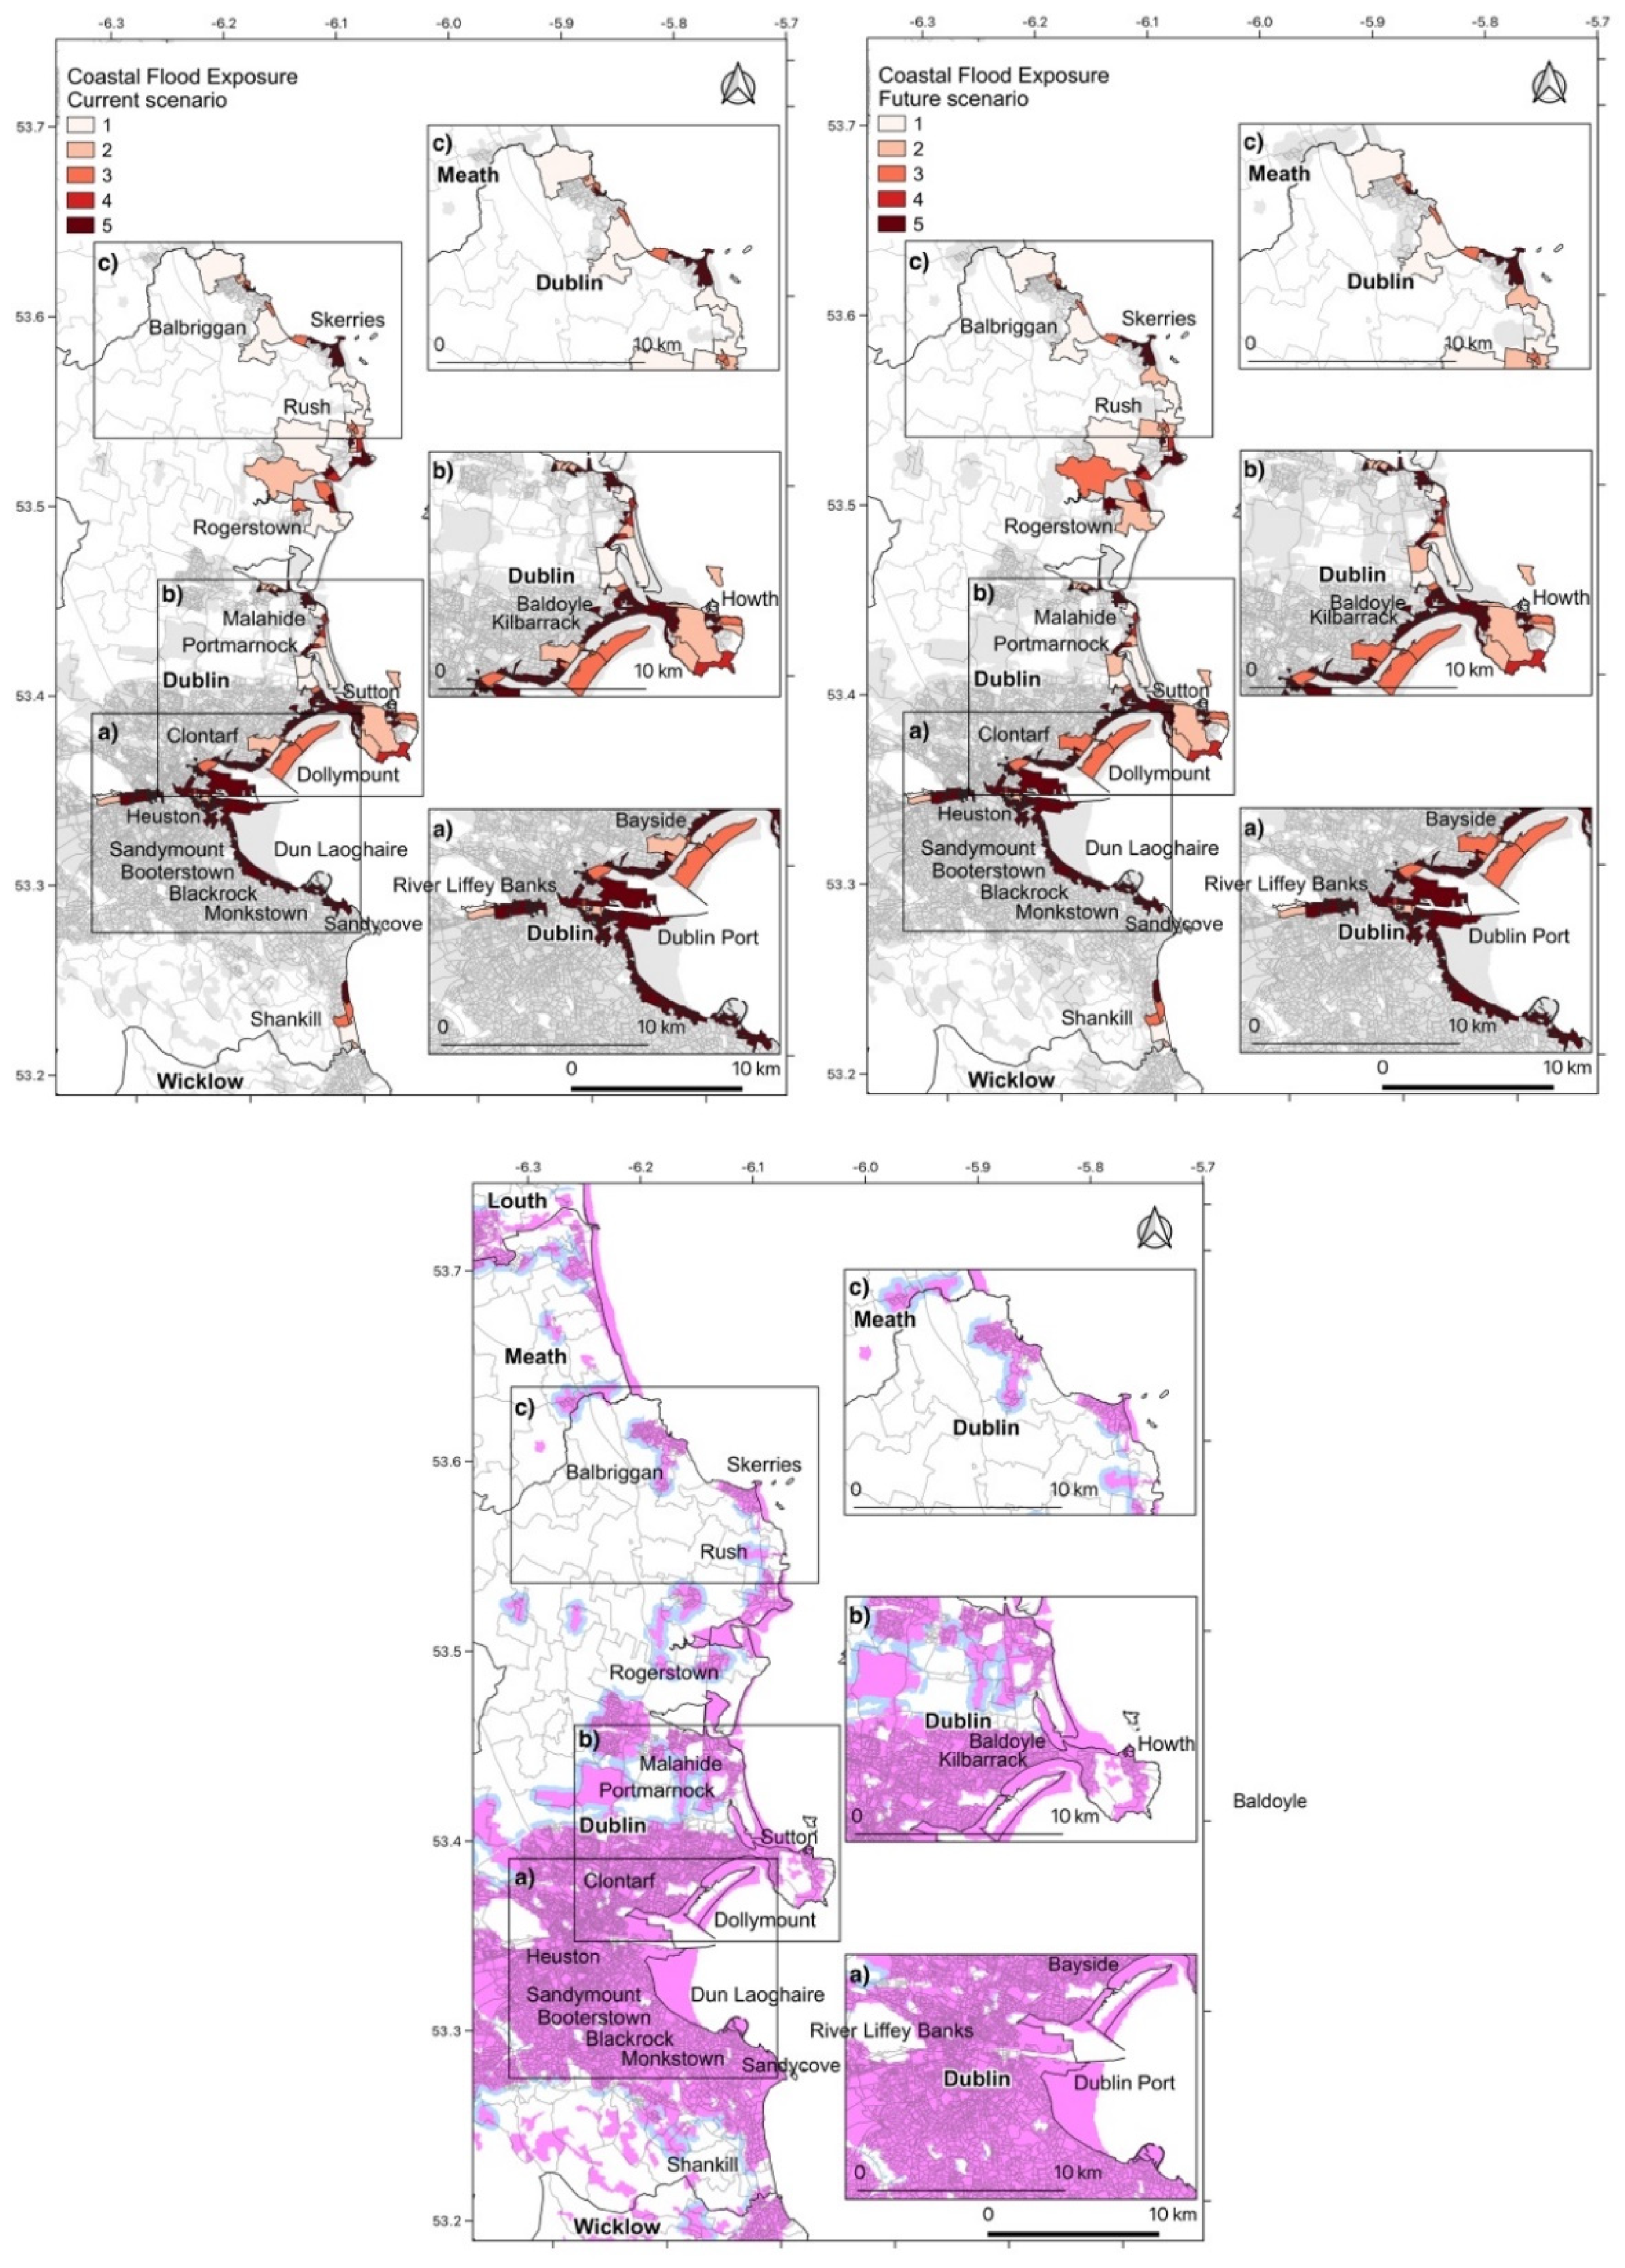
4.1. Projections of Coastal Flood Hazard and Exposure
4.2. Vulnerability to Coastal Flooding
4.3. Coastal Flood Risk Projections
5. Discussion
6. Conclusions
Author Contributions
Funding
Institutional Review Board Statement
Informed Consent Statement
Data Availability Statement
Acknowledgments
Conflicts of Interest
References
- Paranunzio, R.; Ceola, S.; Laio, F.; Montanari, A. Evaluating the effects of urbanization evolution on air temperature trends using nightlight satellite data. Atmosphere 2019, 10, 117. [Google Scholar] [CrossRef] [Green Version]
- Sweet, W.V.; Park, J. Earth’s Future From the extreme to the mean: Acceleration and tipping points of coastal inundation from sea level rise. Earth’s Futur. 2014, 2, 579–600. [Google Scholar] [CrossRef]
- Seto, K.C.; Fragkias, M.; Güneralp, B.; Reilly, M.K. A Meta-Analysis of Global Urban Land Expansion. PLoS ONE 2011, 6, e23777. [Google Scholar] [CrossRef]
- Kulp, S.A.; Strauss, B.H. New elevation data triple estimates of global vulnerability to sea-level rise and coastal flooding. Nat. Commun. 2019, 10, 1–12. [Google Scholar] [CrossRef] [Green Version]
- Hauer, M.E.; Fussell, E.; Mueller, V.; Burkett, M.; Call, M.; Abel, K.; McLeman, R.; Wrathall, D. Sea-level rise and human migration. Nat. Rev. Earth Environ. 2020, 1, 28–39. [Google Scholar] [CrossRef] [Green Version]
- Langsdorf, S.; Löschke, S.; Möller, V.; Okem, A. Climate Change 2022 Impacts, Adaptation and Vulnerability Working Group II Contribution to the Sixth Assessment Report of the Intergovernmental Panel on Climate Change; Cambridge University Press: Cambridge, UK; New York, NY, USA, 2022. [Google Scholar] [CrossRef]
- IPCC. IPCC Technical Summary. In The Ocean and Cryosphere in a Changing Climate; IPCC: Geneva, Switzerland, 2022; pp. 39–70. [Google Scholar] [CrossRef]
- CSO Census of Population 2022-Preliminary Results-CSO-Central Statistics Office. Available online: https://www.cso.ie/en/releasesandpublications/ep/p-cpr/censusofpopulation2022-preliminaryresults/ (accessed on 4 July 2022).
- CSO. Regional Population Projections 2017-2036-CSO-Central Statistics Office; CSO: Dublin, Ireland, 2022. [Google Scholar]
- Devoy, R.J.N. Coastal Vulnerability and the Implications of Sea-Level Rise for Ireland. J. Coast. Res. 2008, 242, 325–341. [Google Scholar] [CrossRef]
- Flood, S.; Sweeney, J. Quantifying Impacts of Potential Sea-Level Rise Scenarios on Irish Coastal Cities; Springer: Dordrecht, The Netherlands, 2012; pp. 37–52. [Google Scholar]
- O’Brien, L.; Renzi, E.; Dudley, J.M.; Clancy, C.; Dias, F. Catalogue of extreme wave events in Ireland: Revised and updated for 14ĝ€680 BP to 2017. Nat. Hazards Earth Syst. Sci. 2018, 18, 729–758. [Google Scholar] [CrossRef] [Green Version]
- Cámaro García, W.C.A.; Dwyer, N.; Gault, J. Climate Status Report for Ireland 2020; EPA: Dublin, Ireland, 2021. [Google Scholar]
- Nejad, A.S.; Parnell, A.C.; Greene, A.; Thorne, P.; Kelleher, B.P.; Devoy, R.J.N.; Mccarthy, G. A newly reconciled dataset for identifying sea level rise and variability in Dublin Bay. Ocean Sci. 2022, 18, 511–522. [Google Scholar] [CrossRef]
- Orford, J.; Murdy, J. Presence and possible cause of periodicities in 20th-century extreme coastal surge: Belfast Harbour, Northern Ireland. Glob. Planet. Change 2015, 133, 254–262. [Google Scholar] [CrossRef]
- DCC Dublin City Council. Climate Change Action Plan, 2019–2024; DCC Dublin City Council: Dublin, Ireland, 2017; pp. 1–8. [Google Scholar]
- OPW Home. Floodinfo.ie. Available online: https://www.floodinfo.ie/ (accessed on 11 July 2022).
- Vousdoukas, M.I.; Mentaschi, L.; Voukouvalas, E.; Verlaan, M.; Feyen, L. Extreme sea levels on the rise along Europe’s coasts. Earth’s Futur. 2017, 5, 304–323. [Google Scholar] [CrossRef]
- Nolan, P.; Flanagan, J. High-Resolution Climate Projections for Ireland—A Multi-Model Ensemble Approach; EPA: Dublin, Ireland, 2020. [Google Scholar]
- Desmond, M.; O’brien, P.; Mcgovern, F. A Summary of the State of Knowledge on Climate Change Impacts for Ireland; EPA: Dublin, Ireland, 2017. [Google Scholar]
- Lowe, J.A.; Howard, T.P.; Pardaens, A.; Tinker, J.; Holt, J.; Wakelin, S.; Milne, G.; Leake, J.; Wolf, J.; Horsburgh, K.; et al. UK Climate Projections Science Report: Marine and Coastal Projection; Technical Report; Met Office Hadley Centre: Exeter, UK, 2009. [Google Scholar]
- Carter, J.; Cavan, G.; Connelly, A.; Guy, S. Climate Change and the City: Building Capacity for Urban Adaptation; Elsevier: Amsterdam, The Netherlands, 2015. [Google Scholar]
- Lhomme, S.; Laganier, R.; Diab, Y.; Serre, D. The resilience of the city of Dublin to flooding: From theory to practice. Cybergeo Eur. J. Geogr. 2019. [Google Scholar] [CrossRef]
- Caloca-Casado, S. Coastal Vulnerability Assessment of Co. Dublin and Co. Wicklow to Impacts of Sea-Level Rise. Ph.D. Thesis, National University of Ireland, Maynooth, Ireland, 2018. [Google Scholar]
- Yanes Luque, A.; Rodríguez-Báez, J.A.; Máyer Suárez, P.; Dorta Antequera, P.; López-Díez, A.; Díaz-Pacheco, J.; Pérez-Chacón, E. Marine storms in coastal tourist areas of the Canary Islands. Nat. Hazards 2021, 109, 1297–1325. [Google Scholar] [CrossRef]
- Luque, P.; Gómez-Pujol, L.; Marcos, M.; Orfila, A. Coastal Flooding in the Balearic Islands During the Twenty-First Century Caused by Sea-Level Rise and Extreme Events. Front. Mar. Sci. 2021, 8, 676452. [Google Scholar] [CrossRef]
- Scicchitano, G.; Scardino, G.; Monaco, C.; Piscitelli, A.; Milella, M.; De Giosa, F.; Mastronuzzi, G. Comparing impact effects of common storms and Medicanes along the coast of south-eastern Sicily. Mar. Geol. 2021, 439, 106556. [Google Scholar] [CrossRef]
- Rizzo, A.; Vandelli, V.; Buhagiar, G.; Micallef, A.S.; Soldati, M. Coastal Vulnerability Assessment along the North-Eastern Sector of Gozo Island (Malta, Mediterranean Sea). Water 2020, 12, 1405. [Google Scholar] [CrossRef]
- McEvoy, S.; Haasnoot, M.; Biesbroek, R. How are European countries planning for sea level rise? Ocean Coast. Manag. 2021, 203, 105512. [Google Scholar] [CrossRef]
- de Sherbinin, A.; Bukvic, A.; Rohat, G.; Gall, M.; McCusker, B.; Preston, B.; Apotsos, A.; Fish, C.; Kienberger, S.; Muhonda, P.; et al. Climate vulnerability mapping: A systematic review and future prospects. Wiley Interdiscip. Rev. Clim. Change 2019, 10, 1–23. [Google Scholar] [CrossRef]
- Adnan, S.G.; Kreibich, H. An evaluation of disaster risk reduction (DRR) approaches for coastal delta cities: A comparative analysis. Nat. Hazards 2016, 83, 1257–1278. [Google Scholar] [CrossRef]
- Flood, S.; Schechtman, J. The rise of resilience: Evolution of a new concept in coastal planning in Ireland and the US. Ocean Coast. Manag. 2014, 102, 19–31. [Google Scholar] [CrossRef]
- Kantamaneni, K.; Phillips, M.; Thomas, T.; Jenkins, R. Assessing coastal vulnerability: Development of a combined physical and economic index. Ocean Coast. Manag. 2018, 158, 164–175. [Google Scholar] [CrossRef]
- Balica, S.F.; Wright, N.G.; van der Meulen, F. A Flood Vulnerability Index for Coastal Cities and Its Use in Assessing Climate Change Impacts. Nat. Hazards 2012, 64, 73–105. [Google Scholar] [CrossRef] [Green Version]
- Hadipour, V.; Vafaie, F.; Deilami, K. Coastal flooding risk assessment using a GIS-based spatial multi-criteria decision analysis approach. Water 2020, 12, 2379. [Google Scholar] [CrossRef]
- Vousdoukas, M.I.; Mentaschi, L.; Voukouvalas, E.; Bianchi, A.; Dottori, F.; Feyen, L. Climatic and socioeconomic controls of future coastal flood risk in Europe. Nat. Clim. Change 2018, 8, 776–780. [Google Scholar] [CrossRef]
- Hardy, R.D.; Hauer, M.E. Social vulnerability projections improve sea-level rise risk assessments. Appl. Geogr. 2018, 91, 10–20. [Google Scholar] [CrossRef] [Green Version]
- Depietri, Y.; Dahal, K.; McPhearson, T. Multi-hazard risks in New York City. Nat. Hazards Earth Syst. Sci. 2018, 18, 3363–3381. [Google Scholar] [CrossRef] [Green Version]
- Percival, S.; Teeuw, R. A methodology for urban micro-scale coastal flood vulnerability and risk assessment and mapping. Nat. Hazards 2019, 97, 355–377. [Google Scholar] [CrossRef] [Green Version]
- Koks, E.E.; Jongman, B.; Husby, T.G.; Botzen, W.J.W.W. Combining hazard, exposure and social vulnerability to provide lessons for flood risk management. Environ. Sci. Policy 2015, 47, 42–52. [Google Scholar] [CrossRef]
- Stevens, A.J.; Clarke, D.; Nicholls, R.J.; Wadey, M.P. Estimating the long-term historic evolution of exposure to flooding of coastal populations. Nat. Hazards Earth Syst. Sci. 2015, 15, 1215–1229. [Google Scholar] [CrossRef]
- Wu, T. Quantifying coastal flood vulnerability for climate adaptation policy using principal component analysis. Ecol. Indic. 2021, 129, 108006. [Google Scholar] [CrossRef]
- Sorg, L.; Medina, N.; Feldmeyer, D.; Sanchez, A.; Vojinovic, Z.; Birkmann, J.; Marchese, A. Capturing the multifaceted phenomena of socioeconomic vulnerability. Nat. Hazards 2018, 92, 257–282. [Google Scholar] [CrossRef] [Green Version]
- IPCC Climate Change 2022 Impacts, Adaptation, and Vulnerability. Available online: https://www.ipcc.ch/report/ar6/wg2/ (accessed on 31 May 2022).
- Giannakidou, C.; Diakoulaki, D.; Memos, C.D. Implementing a Flood Vulnerability Index in urban coastal areas with industrial activity. Nat. Hazards 2019, 97, 99–120. [Google Scholar] [CrossRef]
- Anderson, C.C.; Renaud, F.G.; Hagenlocher, M.; Day, J.W. Assessing Multi-Hazard Vulnerability and Dynamic Coastal Flood Risk in the Mississippi Delta: The Global Delta Risk Index as a Social-Ecological Systems Approach. Water 2021, 13, 577. [Google Scholar] [CrossRef]
- UN/ISDR. Living with Risk: A Global Review of Disaster Reduction Initiatives; UNDRR: New York, NY, USA; Geneva, Switzerland, 2004; Volume 1, ISBN 92-1-101050-0. [Google Scholar]
- Walz, Y.; Janzen, S.; Narvaez, L.; Ortiz-Vargas, A.; Woelki, J.; Doswald, N.; Sebesvari, Z. Disaster-related losses of ecosystems and their services. Why and how do losses matter for disaster risk reduction? Int. J. Disaster Risk Reduct. 2021, 63, 102425. [Google Scholar] [CrossRef]
- OPW. Flood Risk Management Plan; OPW: Dublin, Ireland, 2018; p. 245. [Google Scholar]
- EUMETSAT Storm Xaver batters Europe. Available online: https://www.eumetsat.int/storm-xaver-batters-europe (accessed on 17 August 2022).
- Kettle, A.J. Storm Xaver over Europe in December 2013: Overview of energy impacts and North Sea events. Adv. Geosci. 2020, 54, 137–147. [Google Scholar] [CrossRef]
- Janjić, J.; Gallagher, S.; Dias, F. Case study of the winter 2013/2014 extreme wave events off the west coast of Ireland. Adv. Sci. Res. 2018, 15, 145–157. [Google Scholar] [CrossRef]
- Paranunzio, R.; O’Dwyer, B.; Alexander, P.J.; Guerrini, M.; Dwyer, N.; Gault, J. Assessing Vulnerability to Climate Change: An Approach Illustrated through Large Urban Scale Adaptation (Urb-ADAPT); EPA: Dublin, Ireland, 2020. [Google Scholar]
- Infomar Home|Infomar. Available online: https://www.infomar.ie/ (accessed on 31 May 2022).
- Paranunzio, R.; Dwyer, E.; Fitton, J.M.; Alexander, P.J.; Dwyer, B.O. Assessing current and future heat risk in Dublin city, Ireland. Urban Clim. 2021, 40, 100983. [Google Scholar] [CrossRef]
- OPW RPS. Irish Coastal Protection Strategy Study Phase 2-South East Coast Work Packages 2, 3 & 4A-Technical Report; OPW/CFRAM Programme: Dublin, Ireland, 2011. [Google Scholar]
- ABPmer. SEASTATES North West European Continental Shelf Tide and Surge Hindcast Database, Model Validation Report; ABPmer Report No. R.2784; ABPmer: Southampton, UK, 2017. [Google Scholar]
- Copernicus Land Monitoring Service CORINE Land Cover—Copernicus Land Monitoring Service. Available online: https://land.copernicus.eu/pan-european/corine-land-cover (accessed on 29 March 2021).
- Eastman, J.R.; Toledano, J. A Short Presentation of the Land Change Modeler (LCM). In Geomatic Approaches for Modeling Land Change Scenarios. Lecture Notes in Geoinformation and Cartography; Camacho Olmedo, M., Paegelow, M., Mas, J.F., Escobar, F., Eds.; Springer: Cham, Switzerland, 2018. [Google Scholar] [CrossRef]
- Alexander, P.J.; Mills, G. Local climate classification and Dublin’s urban heat island. Atmosphere 2014, 5, 755–774. [Google Scholar] [CrossRef]
- Stewart, I.D.; Oke, T.R. Local climate zones for urban temperature studies. Bull. Am. Meteorol. Soc. 2012, 93, 1879–1900. [Google Scholar] [CrossRef]
- Patel, P.; Karmakar, S.; Ghosh, S.; Niyogi, D. Improved simulation of very heavy rainfall events by incorporating WUDAPT urban land use/land cover in WRF. Urban Clim. 2020, 32, 100616. [Google Scholar] [CrossRef]
- Demuzere, M.; Kittner, J.; Bechtel, B. LCZ Generator: A web application to create Local Climate Zone maps. Front. Environ. Sci. 2020, 9, 637455. [Google Scholar] [CrossRef]
- CSO Census 2016 Small Area Population Statistics-CSO-Central Statistics Office. Available online: https://www.cso.ie/en/census/census2016reports/census2016smallareapopulationstatistics/ (accessed on 7 January 2019).
- OSI Ordnance Survey Ireland-National Mapping Agency. Available online: https://www.osi.ie/ (accessed on 20 August 2019).
- Government of Ireland Data.gov.ie. Available online: https://data.gov.ie/ (accessed on 11 July 2022).
- Tate, E.; Rahman, A.; Emrich, C.T.; Sampson, C.C. Flood exposure and social vulnerability in the United States. Nat. Hazards 2021, 106, 435–457. [Google Scholar] [CrossRef]
- Ellena, M.; Ricciardi, G.; Barbato, G.; Buffa, A.; Villani, V.; Mercogliano, P. Past and future hydrogeological risk assessment under climate change conditions over urban settlements and infrastructure systems: The case of a sub-regional area of Piedmont, Italy. Nat. Hazards 2020, 102, 275–305. [Google Scholar] [CrossRef]
- Cutter, S.L.; Boruff, B.J.; Shirley, W.L. Social Vulnerability to Environmental Hazards. Soc. Sci. Q. 2003, 84, 242–261. [Google Scholar] [CrossRef]
- Emrich, C.T.; Tate, E.; Larson, S.E.; Zhou, Y. Measuring social equity in flood recovery funding. Environ. Hazards 2020, 19, 228–250. [Google Scholar] [CrossRef] [Green Version]
- Wolff, C.; Nikoletopoulos, T.; Hinkel, J.; Vafeidis, A.T. Future urban development exacerbates coastal exposure in the Mediterranean. Sci. Rep. 2020, 10, 14420. [Google Scholar] [CrossRef]
- Di Paola, G.; Rizzo, A.; Benassai, G.; Corrado, G.; Matano, F.; Aucelli, P.P.C. Sea-level rise impact and future scenarios of inundation risk along the coastal plains in Campania (Italy). Environ. Earth Sci. 2021, 80, 1–22. [Google Scholar] [CrossRef]
- Török, I. Qualitative Assessment of Social Vulnerability to Flood Hazards in Romania. 2018. Sustainability 2018, 10, 3780. [Google Scholar] [CrossRef]
- Rasch, R.J. Assessing urban vulnerability to flood hazard in Brazilian municipalities. Environ. Urban. 2016, 28, 145–168. [Google Scholar] [CrossRef] [Green Version]
- Kaiser, H.F. The Application of Electronic Computers to Factor Analysis. Educ. Psychol. Meas. 1960, 20, 141–151. [Google Scholar] [CrossRef]
- Nardo, M.; Saisana, M.; Saltelli, A.; Tarantola, S.; Hoffman, A.; Giovannini, E. Handbook on Constructing Composite Indicators: Methodology and User Guide; OECD: Paris, France, 2008. [Google Scholar]
- Hua, J.; Zhang, X.; Ren, C.; Shi, Y.; Lee, T.C. Spatiotemporal assessment of extreme heat risk for high-density cities: A case study of Hong Kong from 2006 to 2016. Sustain. Cities Soc. 2021, 64, 102507. [Google Scholar] [CrossRef]
- Okaka, F.O.; Odhiambo, B.D.O. Households’ perception of flood risk and health impact of exposure to flooding in flood-prone informal settlements in the coastal city of Mombasa. Int. J. Clim. Chang. Strateg. Manag. 2019, 11, 592–606. [Google Scholar] [CrossRef]
- Jiang, L.; O’Neill, B.C. Global urbanization projections for the Shared Socioeconomic Pathways. Glob. Environ. Change 2017, 42, 193–199. [Google Scholar] [CrossRef] [Green Version]
- Ku, H.; Kim, T.; Song, Y.-I. Coastal vulnerability assessment of sea-level rise associated with typhoon-induced surges in South Korea. Ocean Coast. Manag. 2021, 213, 105884. [Google Scholar] [CrossRef]
- Pobal Pobal Maps Portal-by Compass Informatics. Available online: https://maps.pobal.ie/ (accessed on 22 January 2019).
- Sweeney, J. Climate Change in Ireland: Science, Impacts and Adaptation. Irel. Clim. Cris. 2020, 15–36. [Google Scholar] [CrossRef]
- Devoy, R.; Cummins, V.; Brunt, B.; Bartlett, D.; Kandrot, S. The Coastal Atlas of Ireland; Cork University Press: Cork, Ireland, 2021; ISBN 97811782054092. [Google Scholar]
- C3S Coastal Flooding in Ireland|Copernicus. Available online: https://climate.copernicus.eu/coastal-flooding-ireland (accessed on 7 October 2022).
- Lawrence, J.; Stephens, S.; Blackett, P.; Bell, R.G.; Priestley, R. Climate Services Transformed: Decision-Making Practice for the Coast in a Changing Climate. Front. Mar. Sci. 2021, 8, 1–14. [Google Scholar] [CrossRef]
- Sánchez-García, E.; Rodríguez-Camino, E.; Bacciu, V.; Chiarle, M.; Costa-Saura, J.; Garrido, M.N.; Lledó, L.; Navascués, B.; Paranunzio, R.; Terzago, S.; et al. Co-design of sectoral climate services based on seasonal prediction information in the Mediterranean. Clim. Serv. 2022, 28, 100337. [Google Scholar] [CrossRef]
- Ghosh, S.; Mistri, B. Assessing coastal vulnerability to environmental hazards of Indian Sundarban delta using multi-criteria decision-making approaches. Ocean Coast. Manag. 2021, 209, 105641. [Google Scholar] [CrossRef]
- Cannon, C.; Gotham, K.F.; Lauve-Moon, K.; Powers, B. The climate change double whammy: Flood damage and the determinants of flood insurance coverage, the case of post-Katrina New Orleans. Clim. Risk Manag. 2020, 27, 100210. [Google Scholar] [CrossRef]
- Gotham, K.F.; Campanella, R.; Lauve-Moon, K.; Powers, B. Hazard Experience, Geophysical Vulnerability, and Flood Risk Perceptions in a Postdisaster City, the Case of New Orleans. Risk Anal. 2018, 38, 345–356. [Google Scholar] [CrossRef]
- Bigi, V.; Comino, E.; Fontana, M.; Pezzoli, A.; Rosso, M. Climate Flood Vulnerability Analysis in Urban Context: A Socioeconomic Sub-Indicators Overview. Climate 2021, 9, 12. [Google Scholar] [CrossRef]
- Savić, S.; Kalfayan, M.; Dolinaj, D. Precipitation spatial patterns in cities with different urbanisation types: Case study of Novi Sad (Serbia) as a medium-sized city. Geogr. Pannonica 2020, 24, 88–99. [Google Scholar] [CrossRef]
- Bucherie, A.; Hultquist, C.; Adamo, S.; Neely, C.; Ayala, F.; Bazo, J.; Kruczkiewicz, A. A comparison of social vulnerability indices specific to flooding in Ecuador: Principal component analysis (PCA) and expert knowledge. Int. J. Disaster Risk Reduct. 2022, 73, 102897. [Google Scholar] [CrossRef]
- O’Neill, B.C.; Kriegler, E.; Riahi, K.; Ebi, K.L.; Hallegatte, S.; Carter, T.R.; Mathur, R.; van Vuuren, D.P. A new scenario framework for climate change research: The concept of shared socioeconomic pathways. Clim. Change 2014, 122, 387–400. [Google Scholar] [CrossRef] [Green Version]
- Kc, B.; Shepherd, J.M.; King, A.W.; Johnson Gaither, C. Multi-hazard climate risk projections for the United States. Nat. Hazards 2021, 105, 1963–1976. [Google Scholar] [CrossRef]
- Abadie, L.M.; Jackson, L.P.; Sainz de Murieta, E.; Jevrejeva, S.; Galarraga, I. Comparing urban coastal flood risk in 136 cities under two alternative sea-level projections: RCP 8.5 and an expert opinion-based high-end scenario. Ocean Coast. Manag. 2020, 193, 105249. [Google Scholar] [CrossRef]
- Jeffers, J.M. Integrating vulnerability analysis and risk assessment in flood loss mitigation: An evaluation of barriers and challenges based on evidence from Ireland. Appl. Geogr. 2013, 37, 44–51. [Google Scholar] [CrossRef]
- OPW. National Coastal Flood Hazard Mapping 2021 Flood Mapping Methodology Report; OPW/CFRAMS: Dublin, Ireland, 2021. [Google Scholar]
- DHPLG National Marine Planning Framework. Available online: https://www.gov.ie/en/publication/a4a9a-national-marine-planning-framework/ (accessed on 26 July 2022).
- Dublin City Council Dublin City Council. Available online: https://www.dublincity.ie/residential/environment (accessed on 13 July 2022).


| MAE | RMSE | Bias | ubRMSE | Scatter Index | r | |
|---|---|---|---|---|---|---|
| Dublin Port | 0.1367 | 0.1793 | 0.0289 | 0.1770 | 0.146 | 0.9906 |
| Howth | 0.1087 | 0.1323 | 0.0507 | 0.1222 | 0.0978 | 0.9974 |
| Skerries | 0.0612 | 0.0797 | 0.0069 | 0.0795 | 0.0566 | 0.9985 |
| Dimension | Proxy Variables | Rationale and References |
|---|---|---|
| Urbanization | Population density per km2 | Proxy of urbanicity [42] |
| Housing | % population without house ownership | Proxy of deprivation [55] |
| Housing | % of old buildings (<1980) | The quality of a home could determine the susceptibility of the dwellings to flood damage [40,74] |
| Social isolation | % population with one-person households | This is a proxy of social isolation [38] |
| Low income | % population with income below poverty level (unemployed residents having lost job or due to sickness) | Low income is a proxy of deprivation which could impact negatively on the capacity to adapt and react to hazardous events [67] |
| Disability | % population with disability | It hampers the ability to react and recover from a flood event [34,78] |
| Health status | % population with poor health (self-reported health status “not good”) | This is a proxy of deterioration of health and difficulties to recover from hazardous events [67,78] |
| Extreme ages | % population with age <15 or >65 years (extreme ages) | Mobility constraints hamper the ability to evacuate [35,67,69] |
| Low education | % population with less than a secondary school diploma (low-level education) | It affects the adaptive capacity of and ability to respond and mitigate [74] |
| Information access | % population with internet access | It influences the ability to access to hazard-related information [74] |
| Language isolation | % population with a low level of English | Language barriers could affect the ability to catch weather alerts [38,39] |
| Travel | % population without a car | Owning a car is indicative of mobility and easier access to services [79] |
| Network | Roads, Rails, Bicycle network density per km2 | Transportation infrastructure has clear implication for susceptibility of the urban areas [42,46] |
| Critical facilities | No. of facilities: energy (e.g., power plants currently in operation), transport (e.g., airports, ports, bus stations), social services (e.g., nursing homes, children centres, etc.) water and wastewater infrastructure, education (e.g., schools, universities, etc.), hospitals and clinics, public administration, security services (e.g., police, firefighters’ stations), industrial and leisure facilities | These are key public and economic services and potentially susceptible to flooding [46,74] |
| Variables | Low Income | No Car | Not a Property Owner | Social Isolation | Low Education | Social Language Isolation | People with Disability | Poor Health Status | Extreme Ages | Old Buildings | Transport Network | Critical Facilities |
|---|---|---|---|---|---|---|---|---|---|---|---|---|
| Low income | 1 | 0.40 | 0.28 | 0.16 | 0.76 | 0.26 | 0.63 | 0.60 | 0.00 * | 0.06 * | 0.05 * | 0.07 * |
| No car | 1 | 0.79 | 0.53 | 0.17 | 0.05 * | 0.14 | 0.32 | −0.60 | −0.16 | −0.16 | −0.10 | |
| Not a property owner | 1 | 0.38 | −0.10 * | 0.05 * | −0.07 | 0.14 | −0.70 | −0.50 | −0.16 | −0.09 * | ||
| Social isolation | 1 | 0.06 * | 0.05 * | 0.34 | 0.33 | −0.15 | 0.16 | −0.12 | −0.07 * | |||
| Low education | 1 | 0.18 | 0.68 | 0.56 | 0.30 | 0.33 | 0.14 | 0.11 | ||||
| Social language isolation | 1 | 0.16 | 0.19 | −0.02 * | −0.06 * | 0.07 * | 0.09 * | |||||
| People with disability | 1 | 0.68 | 0.37 | 0.41 | 0.08 * | 0.10 | ||||||
| Health status | 1 | 0.15 | 0.21 | 0.03 * | 0.07 * | |||||||
| Extreme ages | 1 | 0.50 | 0.09 * | 0.08 * | ||||||||
| Old buildings | 1 | 0.03 * | −0.03 * | |||||||||
| Transport Network | 1 | 0.79 | ||||||||||
| Critical facilities | 1 |
| Variables | PC1 | PC2 | PC3 | PC4 |
|---|---|---|---|---|
| Low income | −0.49 * | −0.12 | 0.02 | −0.23 |
| No car | −0.14 | −0.50 * | 0.03 | 0.18 |
| Not a property owner | −0.02 | −0.55 * | 0.01 | −0.02 |
| Social isolation | −0.11 | −0.27 | −0.01 | 0.59 * |
| Low education | −0.48 * | 0.09 | −0.01 | −0.12 |
| Social language isolation | −0.24 | −0.03 | 0.02 | −0.51 * |
| People with disability | −0.46 * | 0.08 | −0.01 | 0.17 |
| Poor health status | −0.43 * | −0.06 | 0.00 | 0.09 |
| Extreme ages | −0.15 | 0.49 * | 0.03 | 0.10 |
| Old buildings | −0.15 | 0.31 | 0.04 | 0.48 * |
| Transport Network | 0.00 | 0.02 | −0.70 * | 0.00 |
| Critical facilities | −0.01 | −0.02 | −0.71 * | 0.00 |
| Variance explained | 28.8% | 24.9% | 14.8% | 9% |
| Eigenvalues | 3.5 | 2.9 | 1.8 | 1.1 |
| Current Scenario | 2100—RCP 4.5 | 2100—RCP 8.5 | ||||||||
|---|---|---|---|---|---|---|---|---|---|---|
| V | H | E | R | H | E | R | H | E | R | |
| 1 | 8 | 332 | 23 | 68 | 277 | 19 | 60 | 196 | 19 | 59 |
| 2 | 21 | 45 | 20 | 279 | 80 | 22 | 240 | 135 | 22 | 164 |
| 3 | 53 | 4 | 16 | 5 | 17 | 17 | 10 | 42 | 17 | 22 |
| 4 | 105 | 1 | 9 | 13 | 7 | 9 | 12 | 8 | 9 | 35 |
| 5 | 195 | 0 | 314 | 17 | 1 | 315 | 48 | 1 | 315 | 80 |
Publisher’s Note: MDPI stays neutral with regard to jurisdictional claims in published maps and institutional affiliations. |
© 2022 by the authors. Licensee MDPI, Basel, Switzerland. This article is an open access article distributed under the terms and conditions of the Creative Commons Attribution (CC BY) license (https://creativecommons.org/licenses/by/4.0/).
Share and Cite
Paranunzio, R.; Guerrini, M.; Dwyer, E.; Alexander, P.J.; O’Dwyer, B. Assessing Coastal Flood Risk in a Changing Climate for Dublin, Ireland. J. Mar. Sci. Eng. 2022, 10, 1715. https://doi.org/10.3390/jmse10111715
Paranunzio R, Guerrini M, Dwyer E, Alexander PJ, O’Dwyer B. Assessing Coastal Flood Risk in a Changing Climate for Dublin, Ireland. Journal of Marine Science and Engineering. 2022; 10(11):1715. https://doi.org/10.3390/jmse10111715
Chicago/Turabian StyleParanunzio, Roberta, Marco Guerrini, Edward Dwyer, Paul J. Alexander, and Barry O’Dwyer. 2022. "Assessing Coastal Flood Risk in a Changing Climate for Dublin, Ireland" Journal of Marine Science and Engineering 10, no. 11: 1715. https://doi.org/10.3390/jmse10111715