Article

Estimation of Marine Macroalgal Biomass Using a Coverage Analysis

1
Department of Ecology and Conservation, National Marine Biodiversity Institute of Korea, Seocheon 33662, Korea
2
Department of Ecological Engineering, Pukyong National University, Busan 48513, Korea
*
Author to whom correspondence should be addressed.
J. Mar. Sci. Eng. 2022, 10(11), 1676; https://doi.org/10.3390/jmse10111676
Submission received: 12 October 2022 / Revised: 29 October 2022 / Accepted: 3 November 2022 / Published: 7 November 2022
(This article belongs to the Special Issue Ecology and Physiology of Seaweeds and Their Response to Changes)

Abstract

:
This study was conducted to assess the feasibility of biomass estimation by non-destructive sampling, determine whether the results derived from various types of marine macroalgae are reliable, and a newly proposed method. A quantitative survey was conducted on marine macroalgae communities distributed in the subtidal zone in 67 coastal regions in Korea. Regression analyses were conducted on 11,642 fresh weight datasets covering of 135 species of marine macroalgae. The linear function was FW = 17.721C (adj r2 = 0.745, p < 0.001) and the power function was FW = 4.48C1.251 (adj r2 = 0.891, p < 0.001). Our analysis accounted for the fact that there were three vertically distributed layers of a marine macroalgal assemblages with various shapes (i.e., the Ecklonia complex, the Sargassum and Undaria complex, and the understory complex). For the Ecklonia complex, the linear function was FW = 27.360C (adj r2 = 0.886, p < 0.001) and the power function was FW = 9.626C1.223 (adj r2 = 0.909, p < 0.001). For the Sargassum and Undaria complex, the linear function was FW = 18.389C (adj r2 = 0.916, p < 0.001) and the power function was FW = 6.567C1.255 (adj r2 = 0.942, p < 0.001). For the understory complex, the linear function was FW = 10.419C (adj r2 = 0.737, p < 0.001) and the power function was FW = 4.377C1.182 (adj r2 = 0.871, p < 0.001). Our findings demonstrated that the proposed method can accurately estimate the primary productivity of a wide range of coastal ecosystems based on remote sensing and non-destructive surveys of small-scale marine macroalgal communities.

1. Introduction

The marine macroalgal community analysis biomass, coverage, density, etc. by quantitative survey using a quadrat, and analyzes the community characteristics based on quantitative value [1,2]. Biomass is used as a major research method to identify community characteristics such as succession and change from the surrounding environment [3,4], and productivity is used in research in various fields such as biofuel [5,6,7], bioremediation [8,9], food and biomedicine [10,11,12].
Quantitative surveys to measure biomass are easily accessible methods for ecological studies, but they can cause ecosystem disturbances by sampling [13]. Recently, the distribution of marine macroalgal communities has been decreasing worldwide due to barren grounds, and various studies are being conducted on the status, transplantation, management, and monitoring of marine macroalgal communities to preserve marine macroalgae [14,15,16,17,18]. Ecosystem disturbance by quantitative sampling, which is a destructive investigation, in such ecological studies or habitats with poor marine macroalgal community conditions, can play a significant role [19].
Non-destructive research is widely used to study large brown algae (kelp) populations that are easy to analyze [20,21], such as individual density and length, and for reason such as speed, efficiency, and prevention of ecosystem disturbance [20,22,23], it is used for biological population surveys, extensive marine macroalgal distribution and eco-mapping studies [24]. However, non-destructive research has the disadvantage of not being able to analyze biomass, so biomass is estimated through regression analysis and derivation of relational expressions on the relationship between biomass and parameters such as lengh, width, and surface area for each species. To date, both in-lab studies [25,26] and field work studies at the individual and population level in field studies [4,27,28,29,30] and some studies related to meaningful results were derived. Biomass estimation by a non-destructive method can be calculated only by measuring the length that can be analyzed for each marine macroalgal species when conducting research on a wide range of research areas, habitats in various conditions, and communities with different species composition acts as a disadvantage. Therefore, there is a need for a comprehensive biomass estimation method that uses less time-consuming and cost-effective, and can be widely applied to various types of marine macroalgae, along with the development of a methodology that can compensate for these shortcomings. Recent research trends show that non-destructive sampling will be of high value in future ecological studies as it has many advantages, such as sustainable preservation of healthy ecosystems, protection of useful marine macroalgae communities, and prevention of anthropogenic disturbance of marine ecosystems [4,28,29,30].
Recently, marine macroalgae has become an issue in various fields, such as the effect of macroalgal blooms (like golden tide, green tide), its role as a primary producer (carbon sink) related to blue carbon, and community change due to global climate change and reginal environmental pollution, so extensive surveys and biomass estimation methods using them are absolutely necessary [23,24,25,26,27,28,29,30,31,32]. In general, ecological community studies generate data through quantitative sampling. However, if macroalgal biomass data can be obtained by qualitative sampling, it is thought that it will be possible to prevent disturbance of the marine ecosystem, which is a disadvantage of quantitative survey, and to be free from damage caused by quantitative survey. This study was conducted to examine whether biomass estimation by non-destructive sampling is possible, whether the results of analysis on marine macroalgae with various types are reliable, and to analyze the future use value of this research method. Therefore, a study was conducted on the development of a methodology that can be easily applied, high accuracy, and capable of estimating biomass in a large-scale marine macroalgae habitat without artificial disturbance, and biomass estimation according to marine macroalgae coverage.

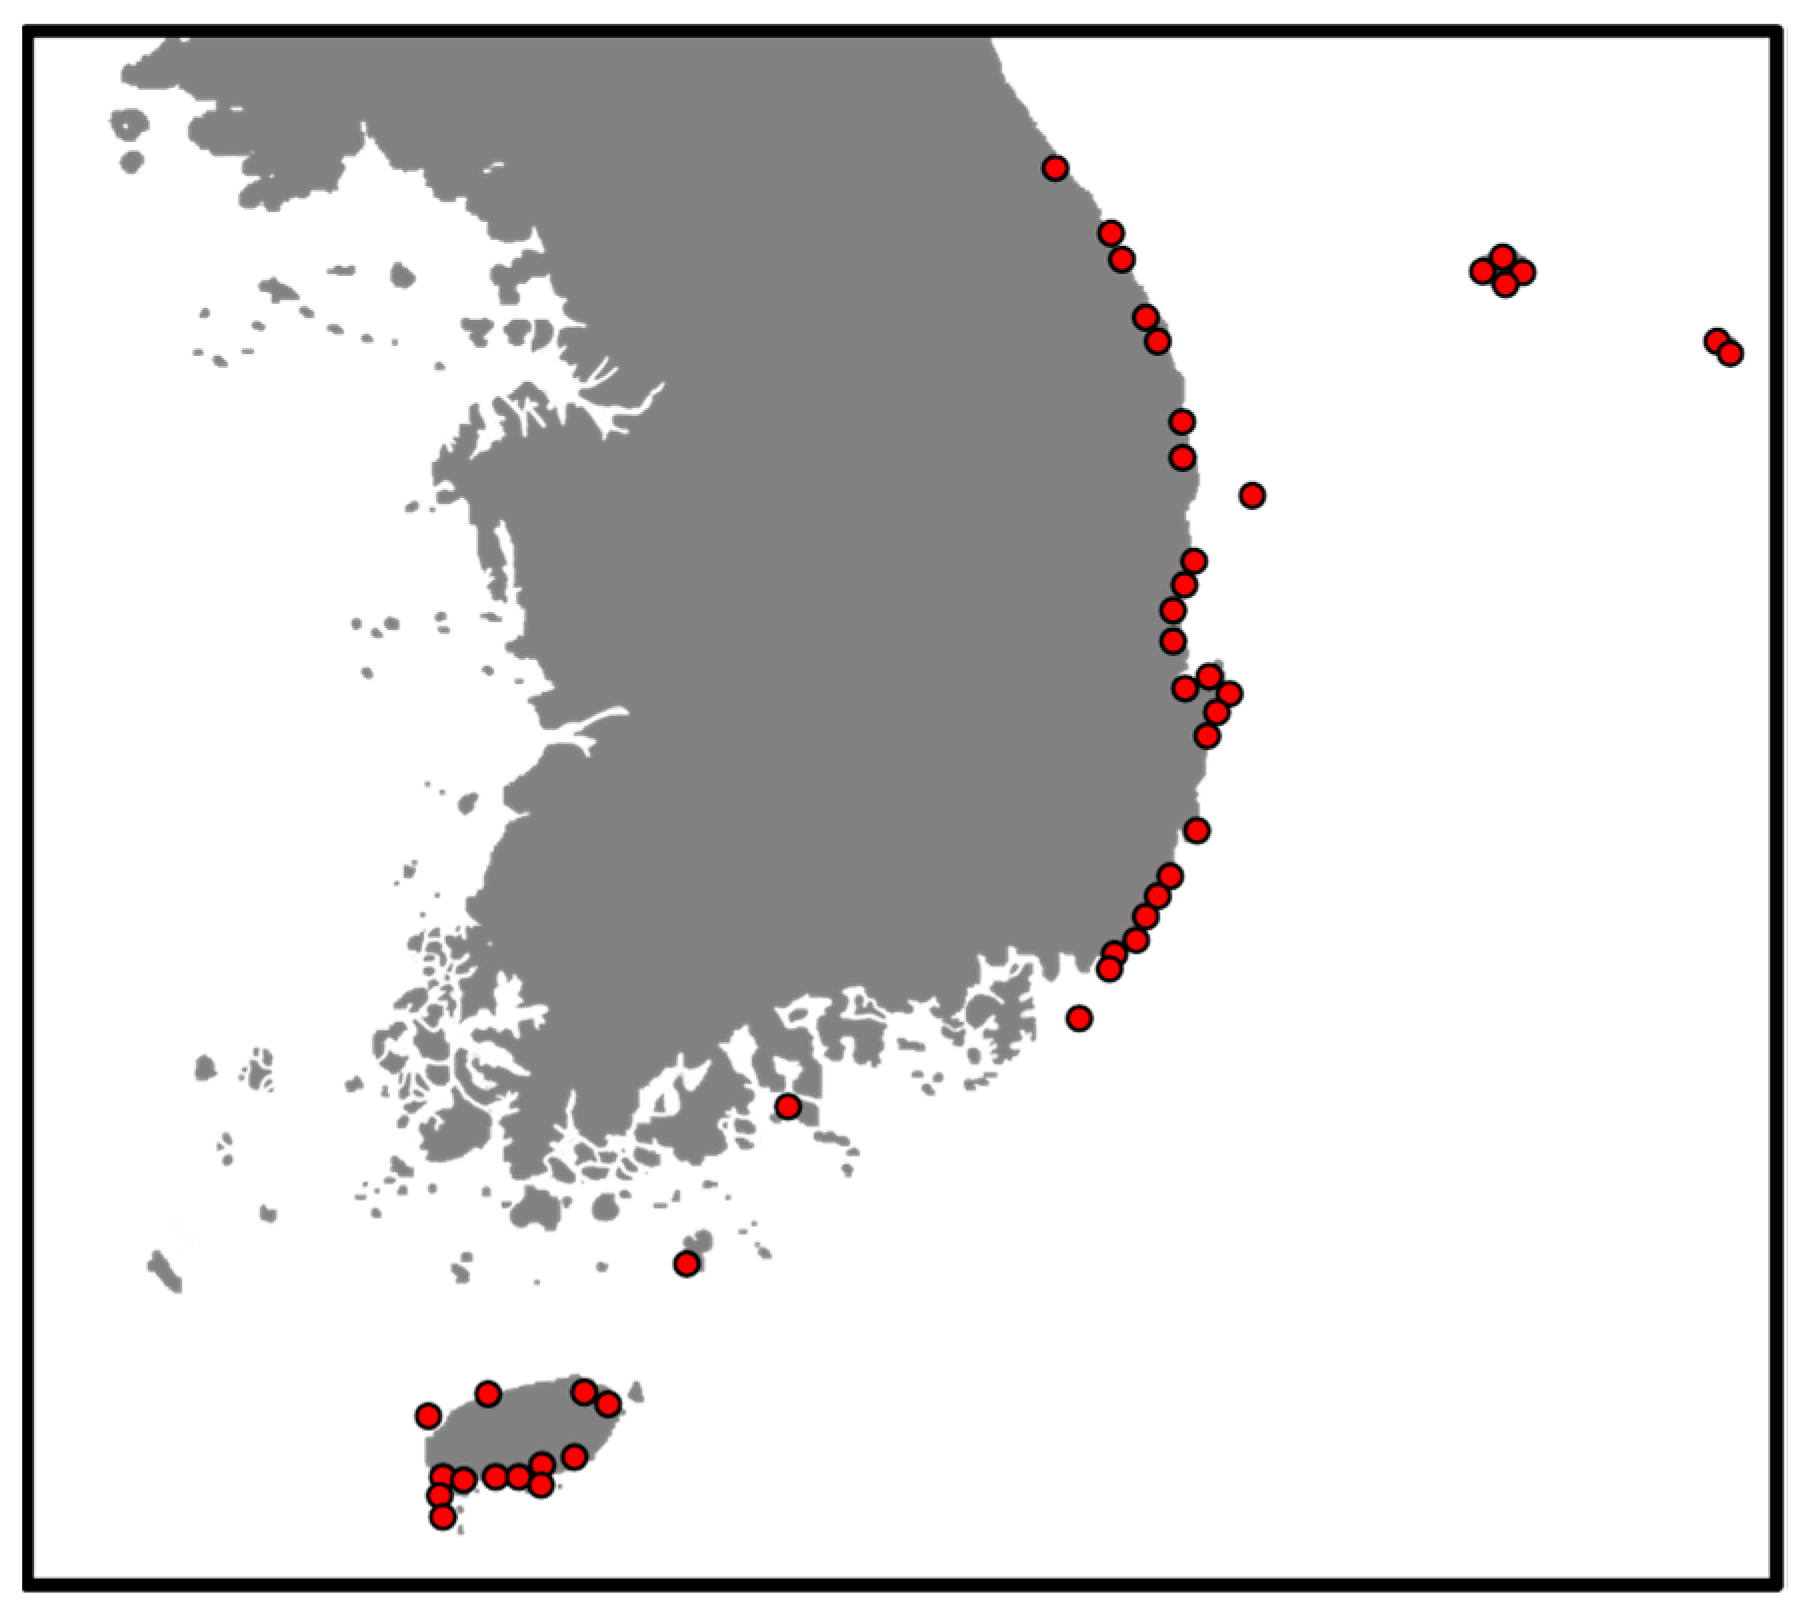
2. Materials and Methods

A quantitative survey was conducted on marine macroalgae communities distributed in the subtidal zone in 67 coastal regions along the East Sea, South Sea, and Jeju coast in Korea (Figure 1). The marine macroalgal coverage (%) was recorded while sequentially collecting for each layer, such as upper, second, and lower layers after installing a quadrat, and photography was taken simultaneously using an underwater camera (Sony a7mIII, Tokyo, Japan). Later, the field records and the photographed photos were compared and verified, and it was converted into coverage rate per unit area (%/m2). The collected samples were thoroughly washed with fresh water to remove impurities, and then observed with the naked eye and a microscope (Olympus SZX9, Olympus BX50, Tokyo, Japan), classified and identified. For the samples identified by species, all surface moisture was removed with a towel, and fresh weight was measured up to 0.01 g using an electronic scale (CAS, CBL3200H, Korea), and it was converted into fresh weight per unit area (g/m2).
When applying the regression function to the relationship between coverage and fresh weight for each species, several functions such as linear function (y = ax + b), quadratic function (y = ax + bx2 + c), and power function (y = axb) can be considered. For linear function and quadratic function, when the value of the x-axis is small due to a constant term (or y-intercept), the y-axis shows a negative value, or the sum of the residuals does not become 0, so the coefficient of determination (R2) is a problem that you cannot use [13]. The function considers the equation passing through the origin, because the biomass shows a negative value when the coverage approaches zero. Therefore, a total of six regression analyzes were performed depending on whether the constant term was removed for the linear function, quadratic function, and power function. Among them, we would like to suggest the power function (FW = aCb), which had a relatively high coefficient of determination (r2) while passing through the origin, and the linear function (FW = aC) by removing the constant term (y-intercept) (FW is fresh weight, C is coverage, a and b are constants). In addition, for simple and broad application, marine macroalgae was divided into several groups and an estimation formula for each group was calculated. Due to the nature of using coverage in the regression equation, it was approached from the perspective of the vertical layer of marine macroalgal assemblage when classifying groups [33,34]. IBM SPSS Statistics 27 was used for statistical processing and relational expression calculation. The AlgaeBase of Guiry and Guiry [35] was referenced for marine algal species.

3. Results

3.1. Regression of Marine Algae Data Set

As a result of regression analysis on 11,642 fresh weight data sets coverage of 135 marine algae (12 green, 38 brown, and 85 red), the linear function was FW = 17.721C (adj r2 = 0.745, p < 0.001), power function was FW = 4.48C1.251 (adj r2 = 0.891, p < 0.001), and the coefficient of determination of power function was the highest (Supplementary Table S1, Figure 2).

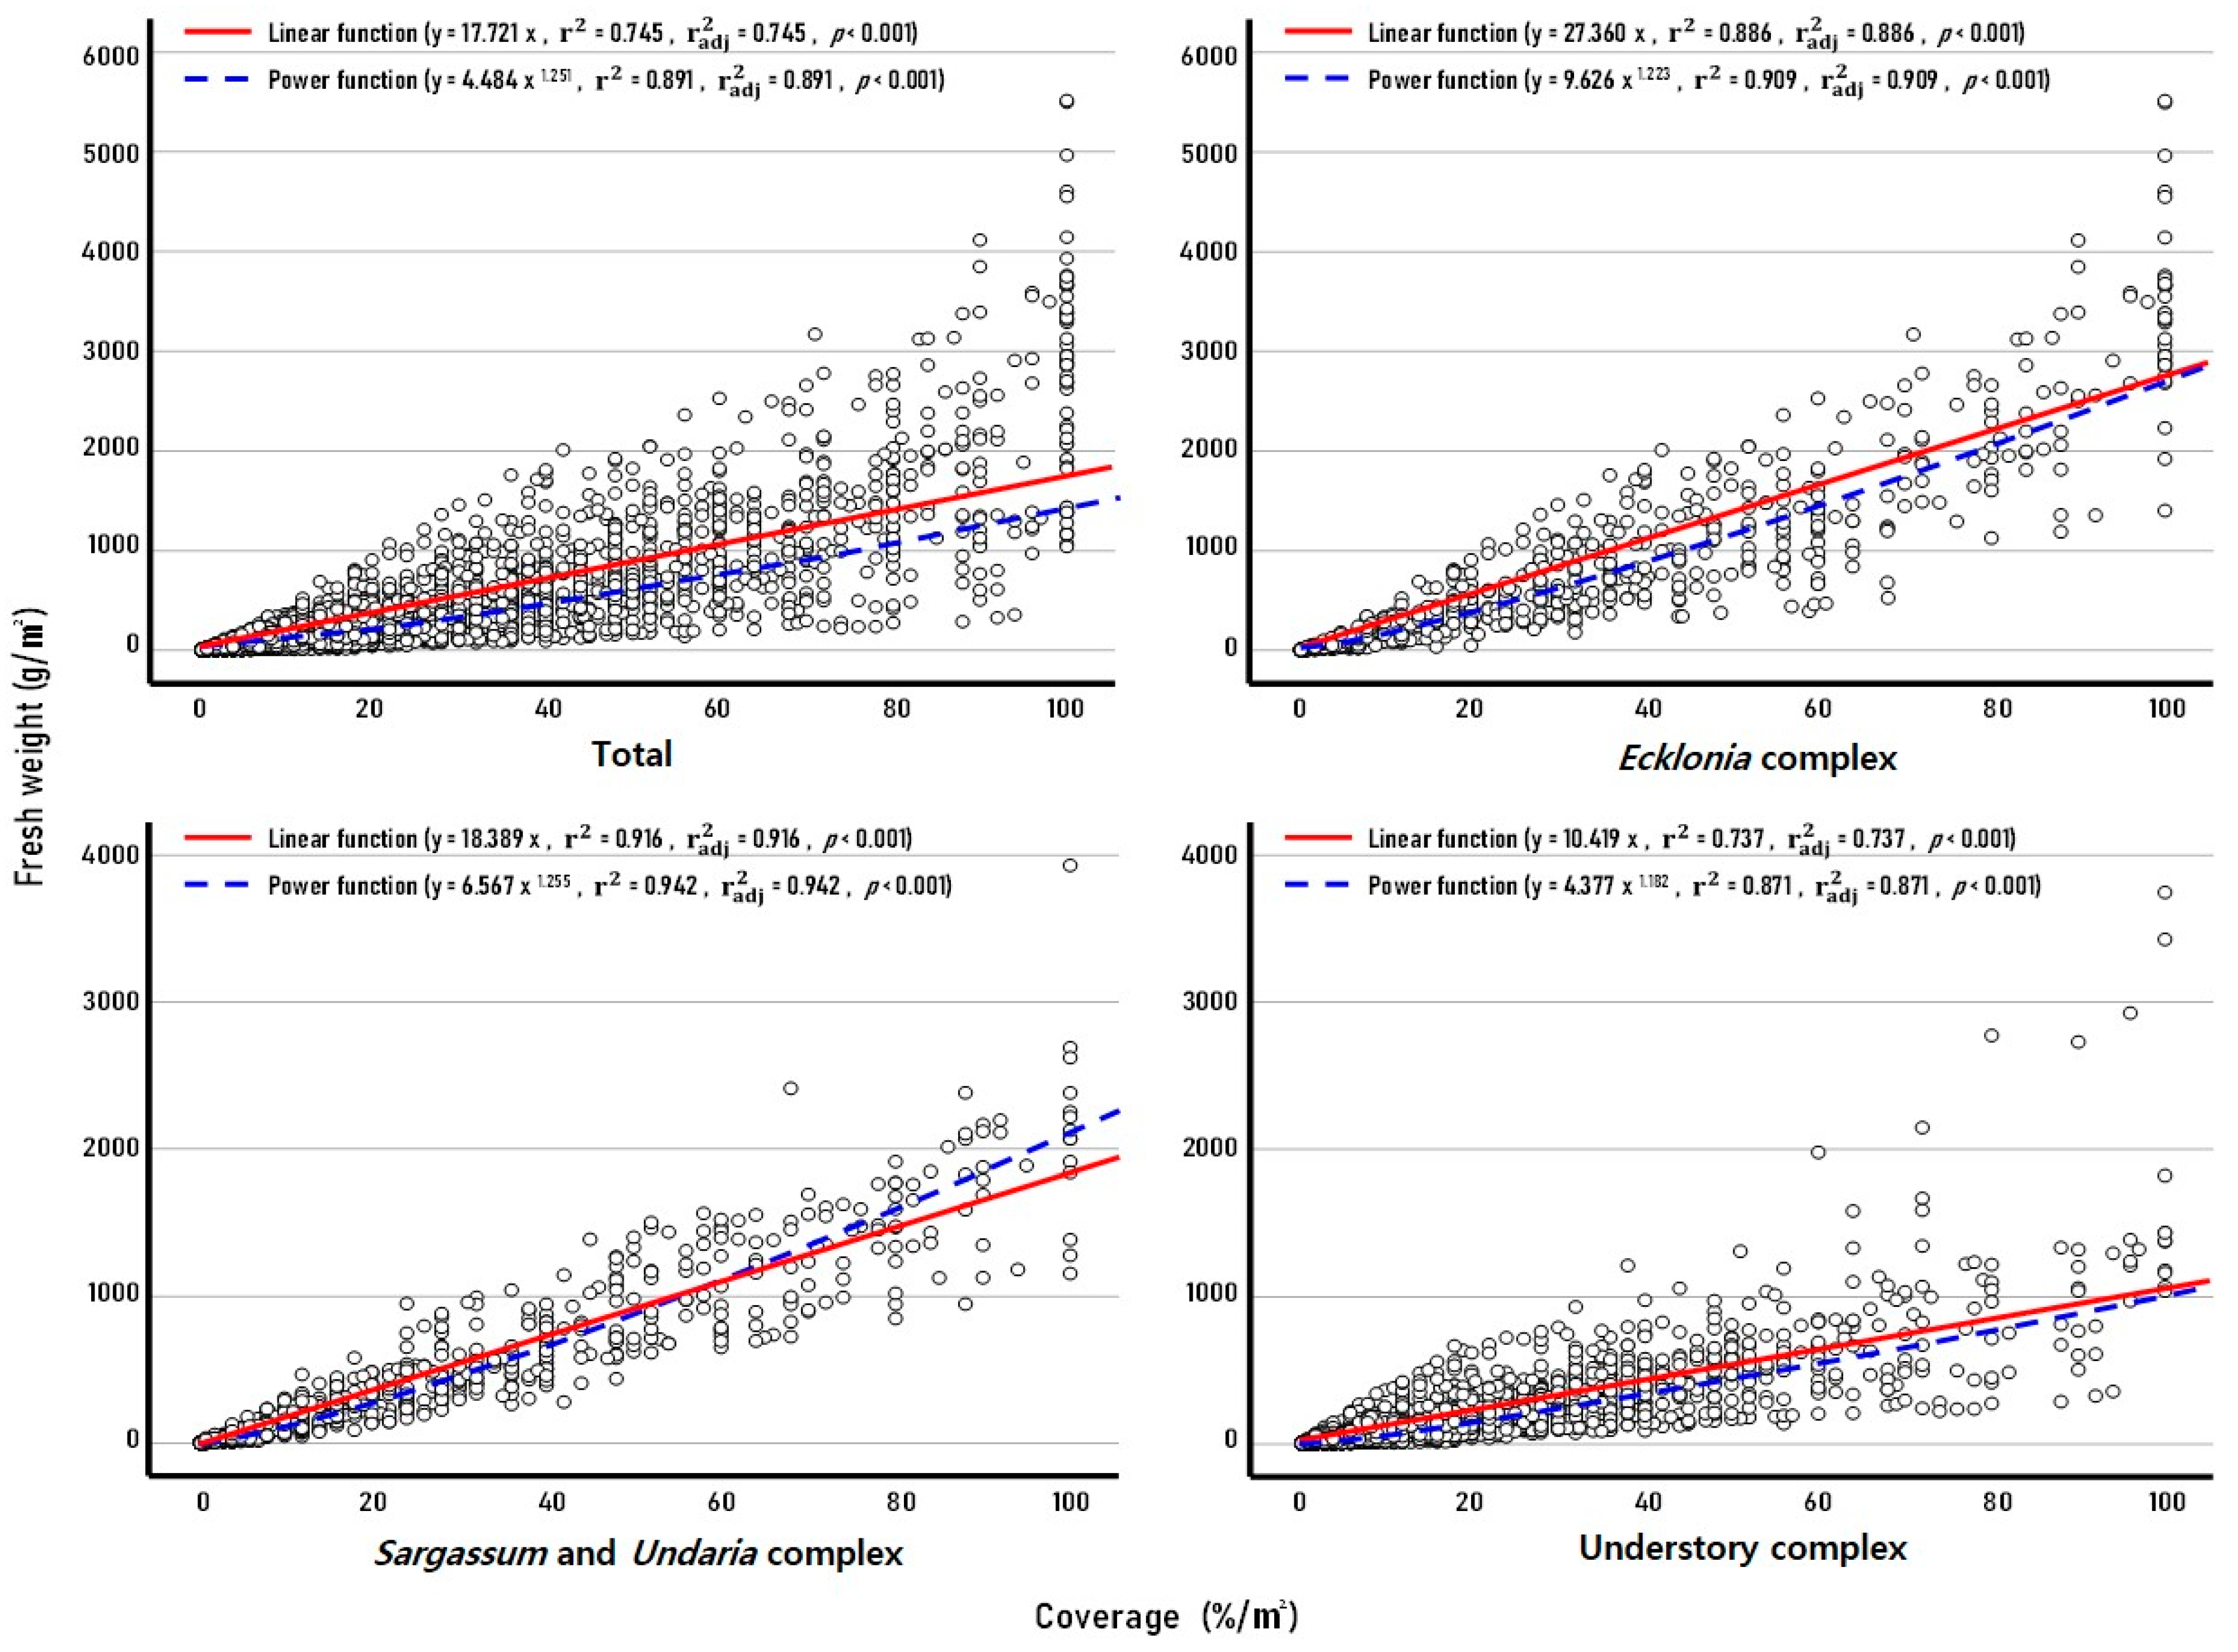
3.2. Regression of Marine Algae Form (Complex)

The concept of a vertical layer of marine macroalgal assemblage with various shapes was applied to the analysis. A perennial large brown algae, canopy-forming year-round, with little seasonal variation in biomass, Ecklonia complex (3 species, n = 702), perennial or annual large brown algae, canopy-forming according to seasons, and large biomass fluctuations, Sargassum and Undaria complex (15 species, n = 1056), and the rest of the understory species complex (117 species, n = 9866) were divided into three groups and regression analysis was performed. For the Ecklonia complex, the linear function is FW = 27.360C (adj r2 = 0.886, p < 0.001), the power function is FW = 9.626C1.223 (adj r2 = 0.909, p < 0.001), and for the Sargassum and Undaria complex, the linear function is FW = 18.389C (adj r2 = 0.916, p < 0.001), the power function is FW = 6.567C1.255 (adj r2 = 0.942, p < 0.001), and for the understory complex, the linear function is FW = 10.419C (adj r2 = 0.737, p < 0.001), and the power function was analyzed as FW = 4.377C1.182 (adj r2 = 0.871, p < 0.001), so the power function application was more suitable for all three groups (Supplementary Table S1, Figure 2).

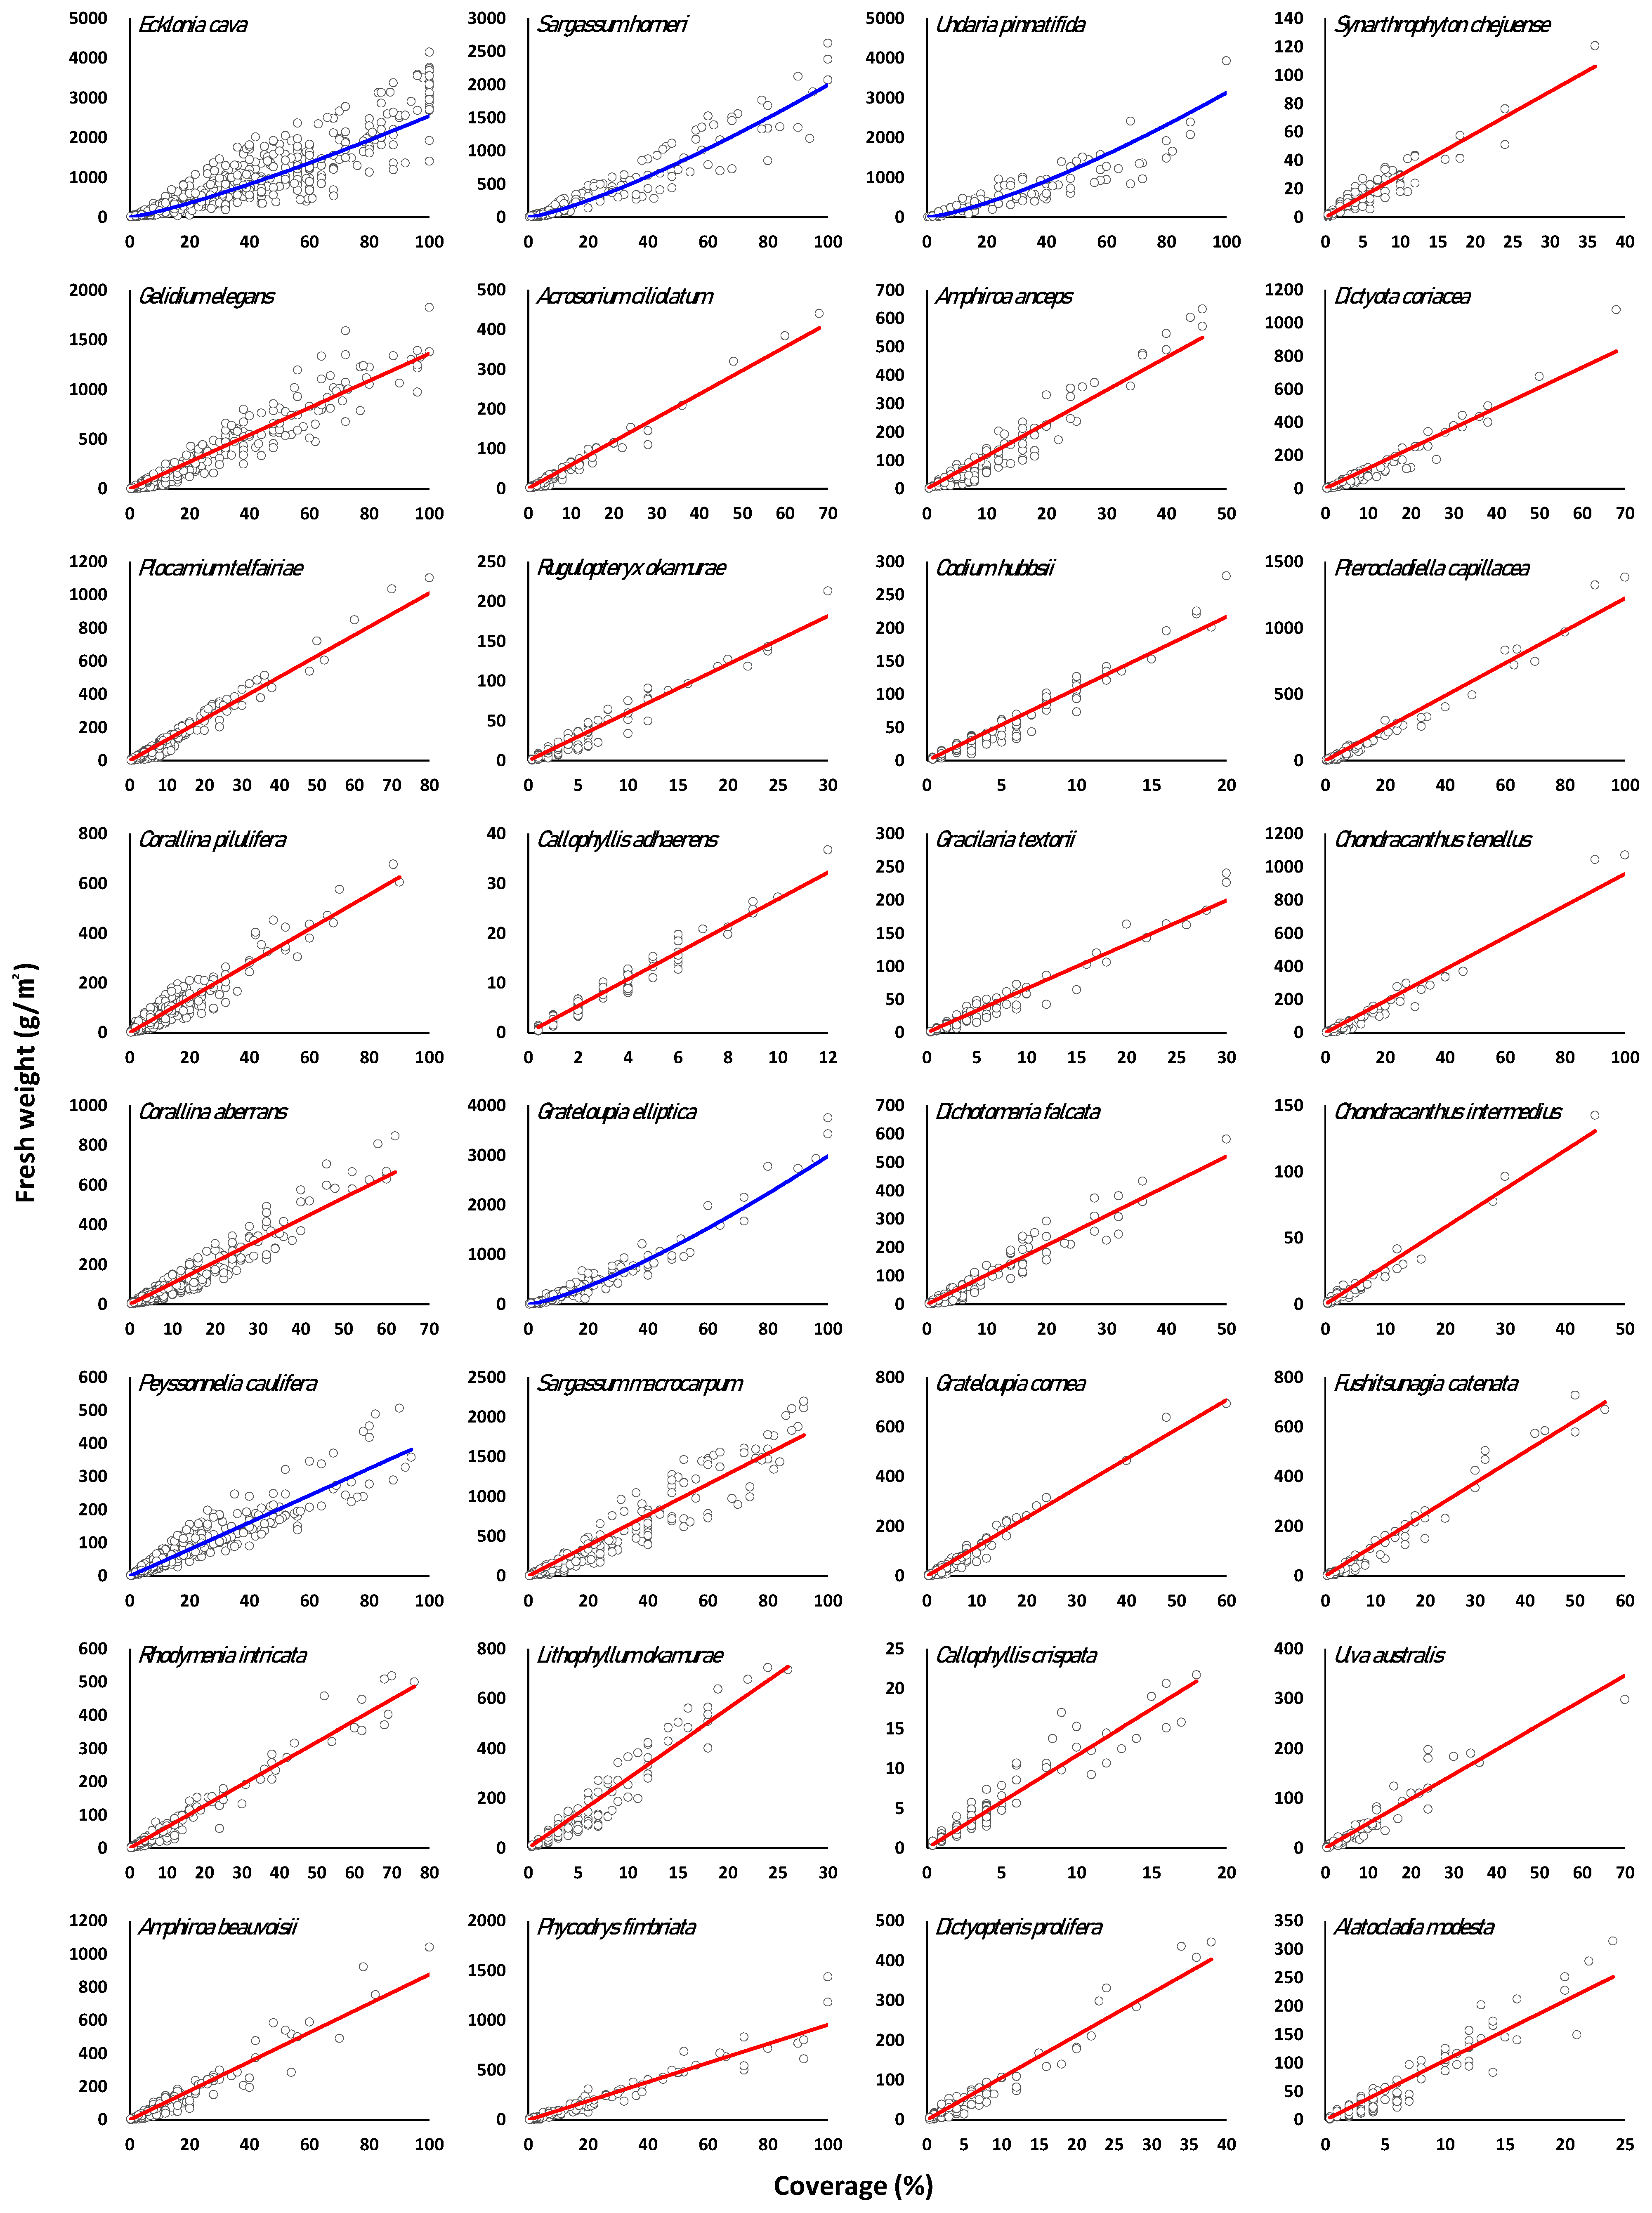
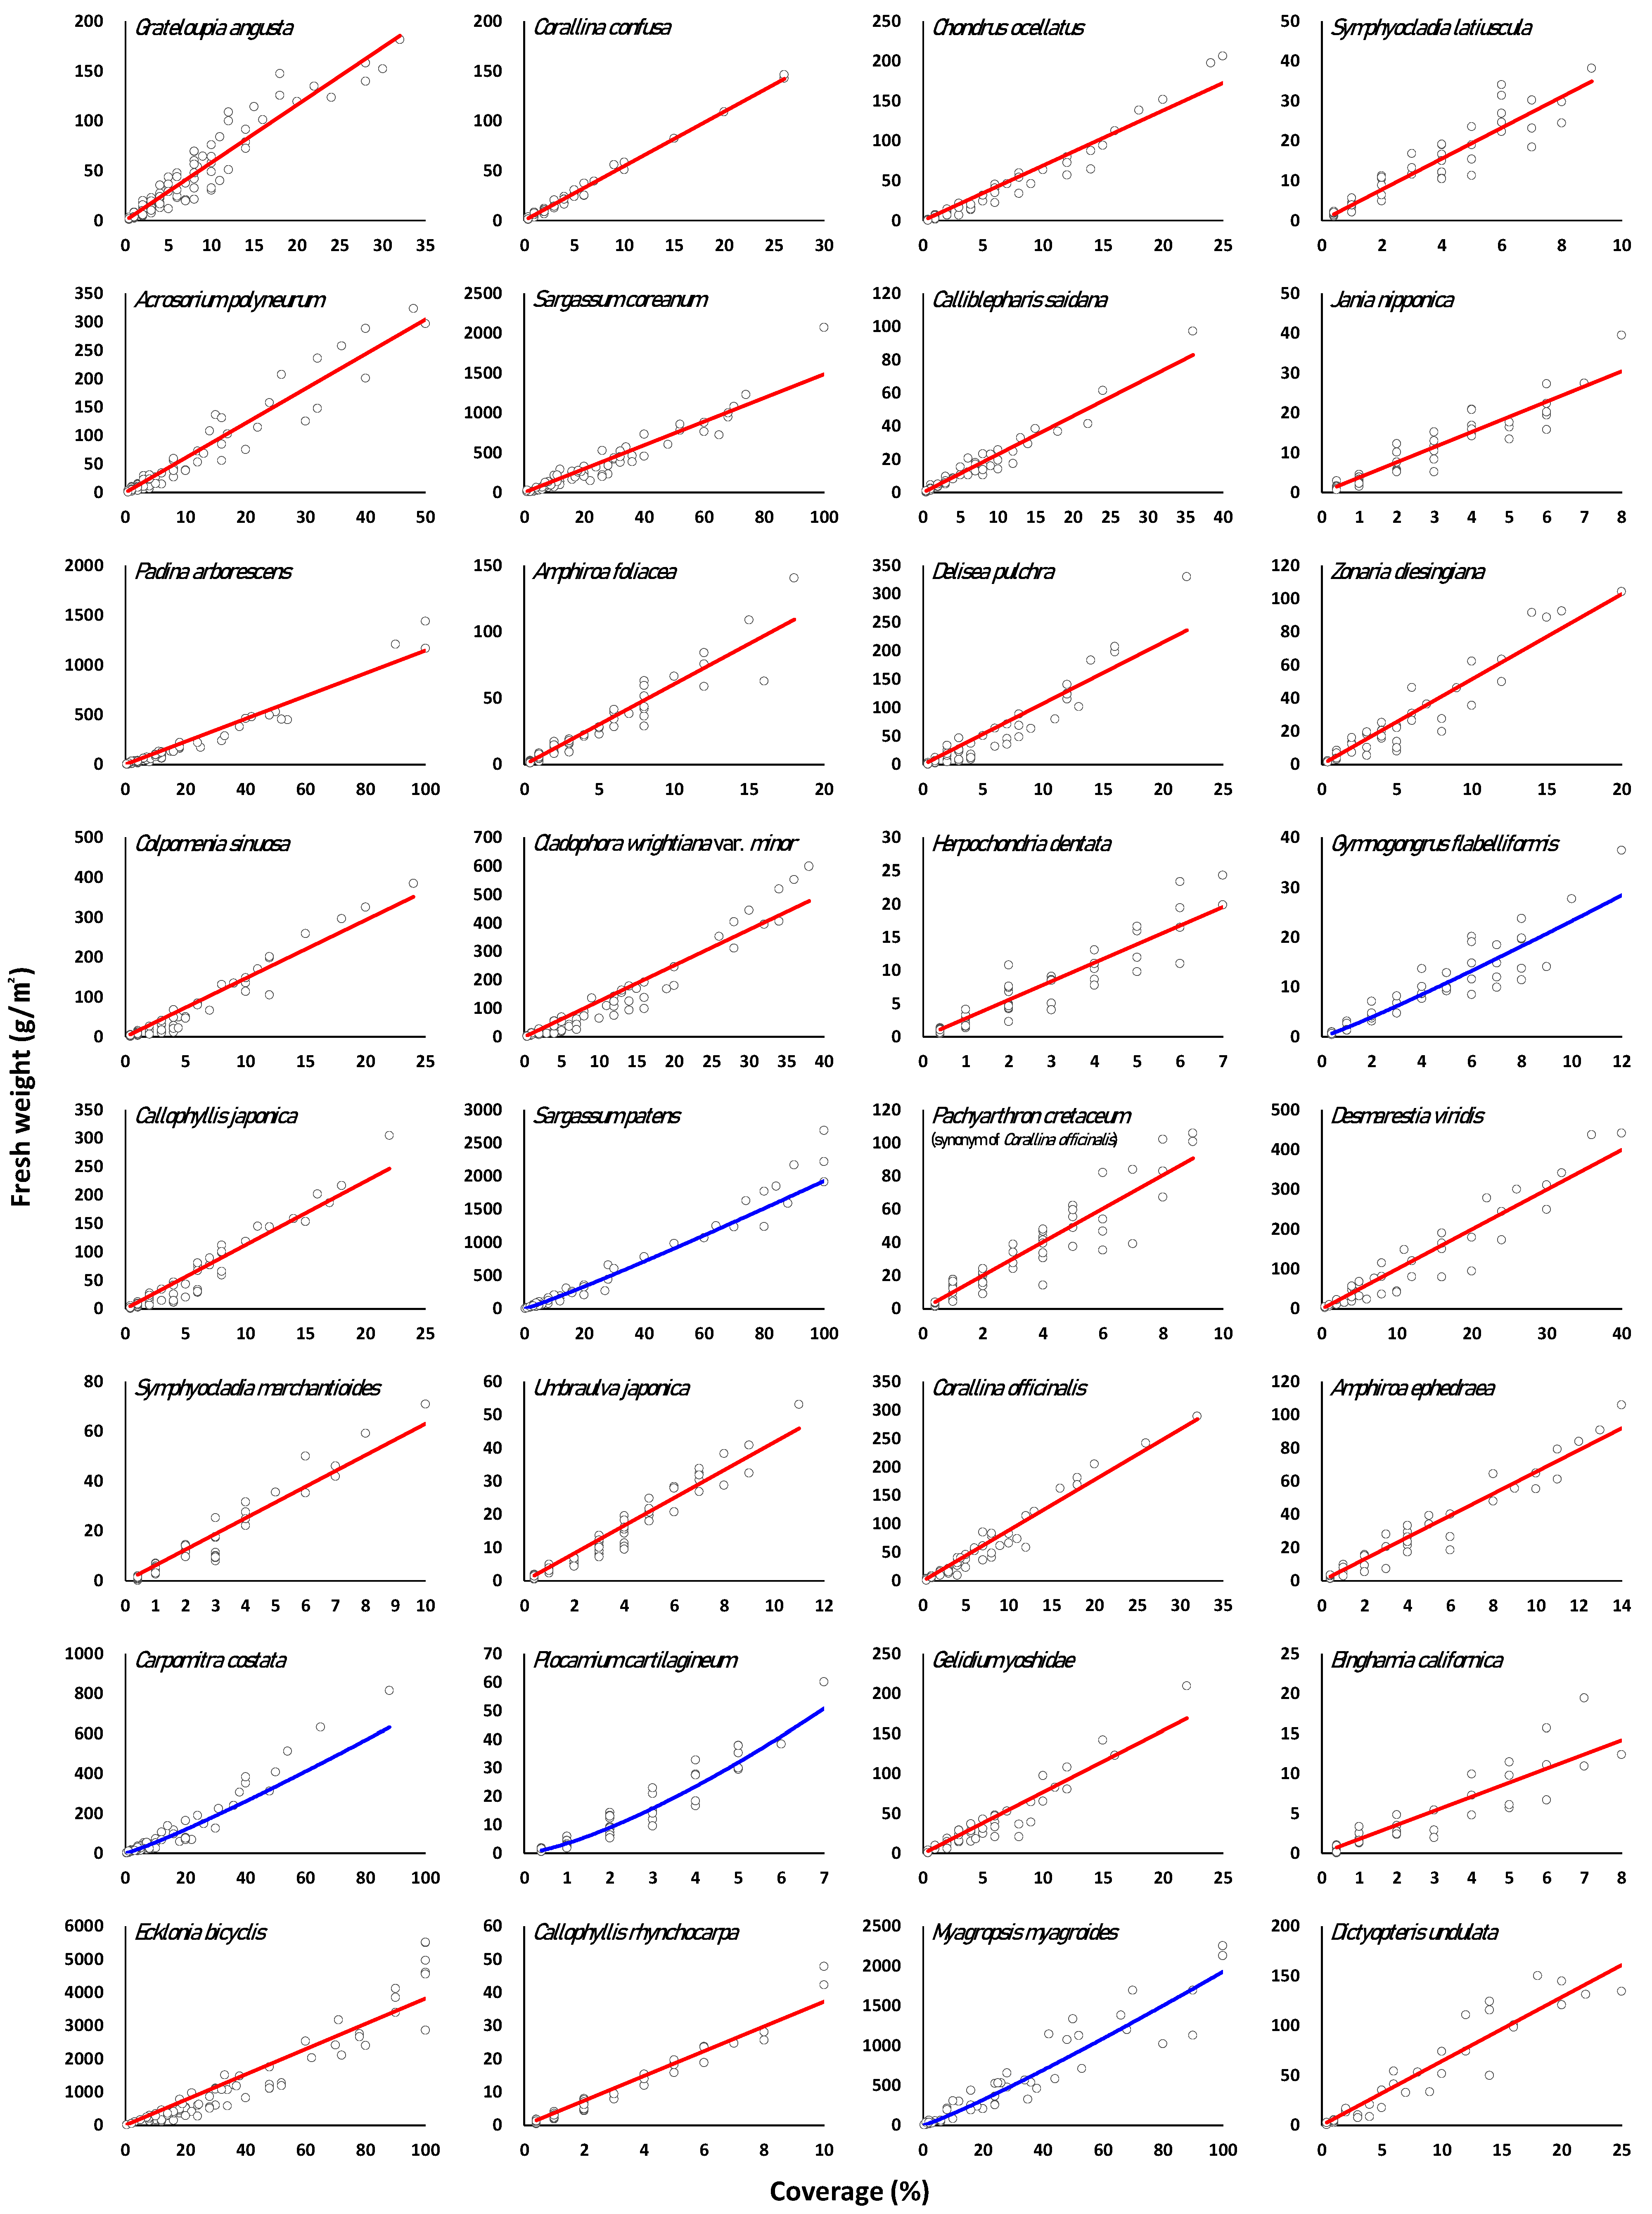
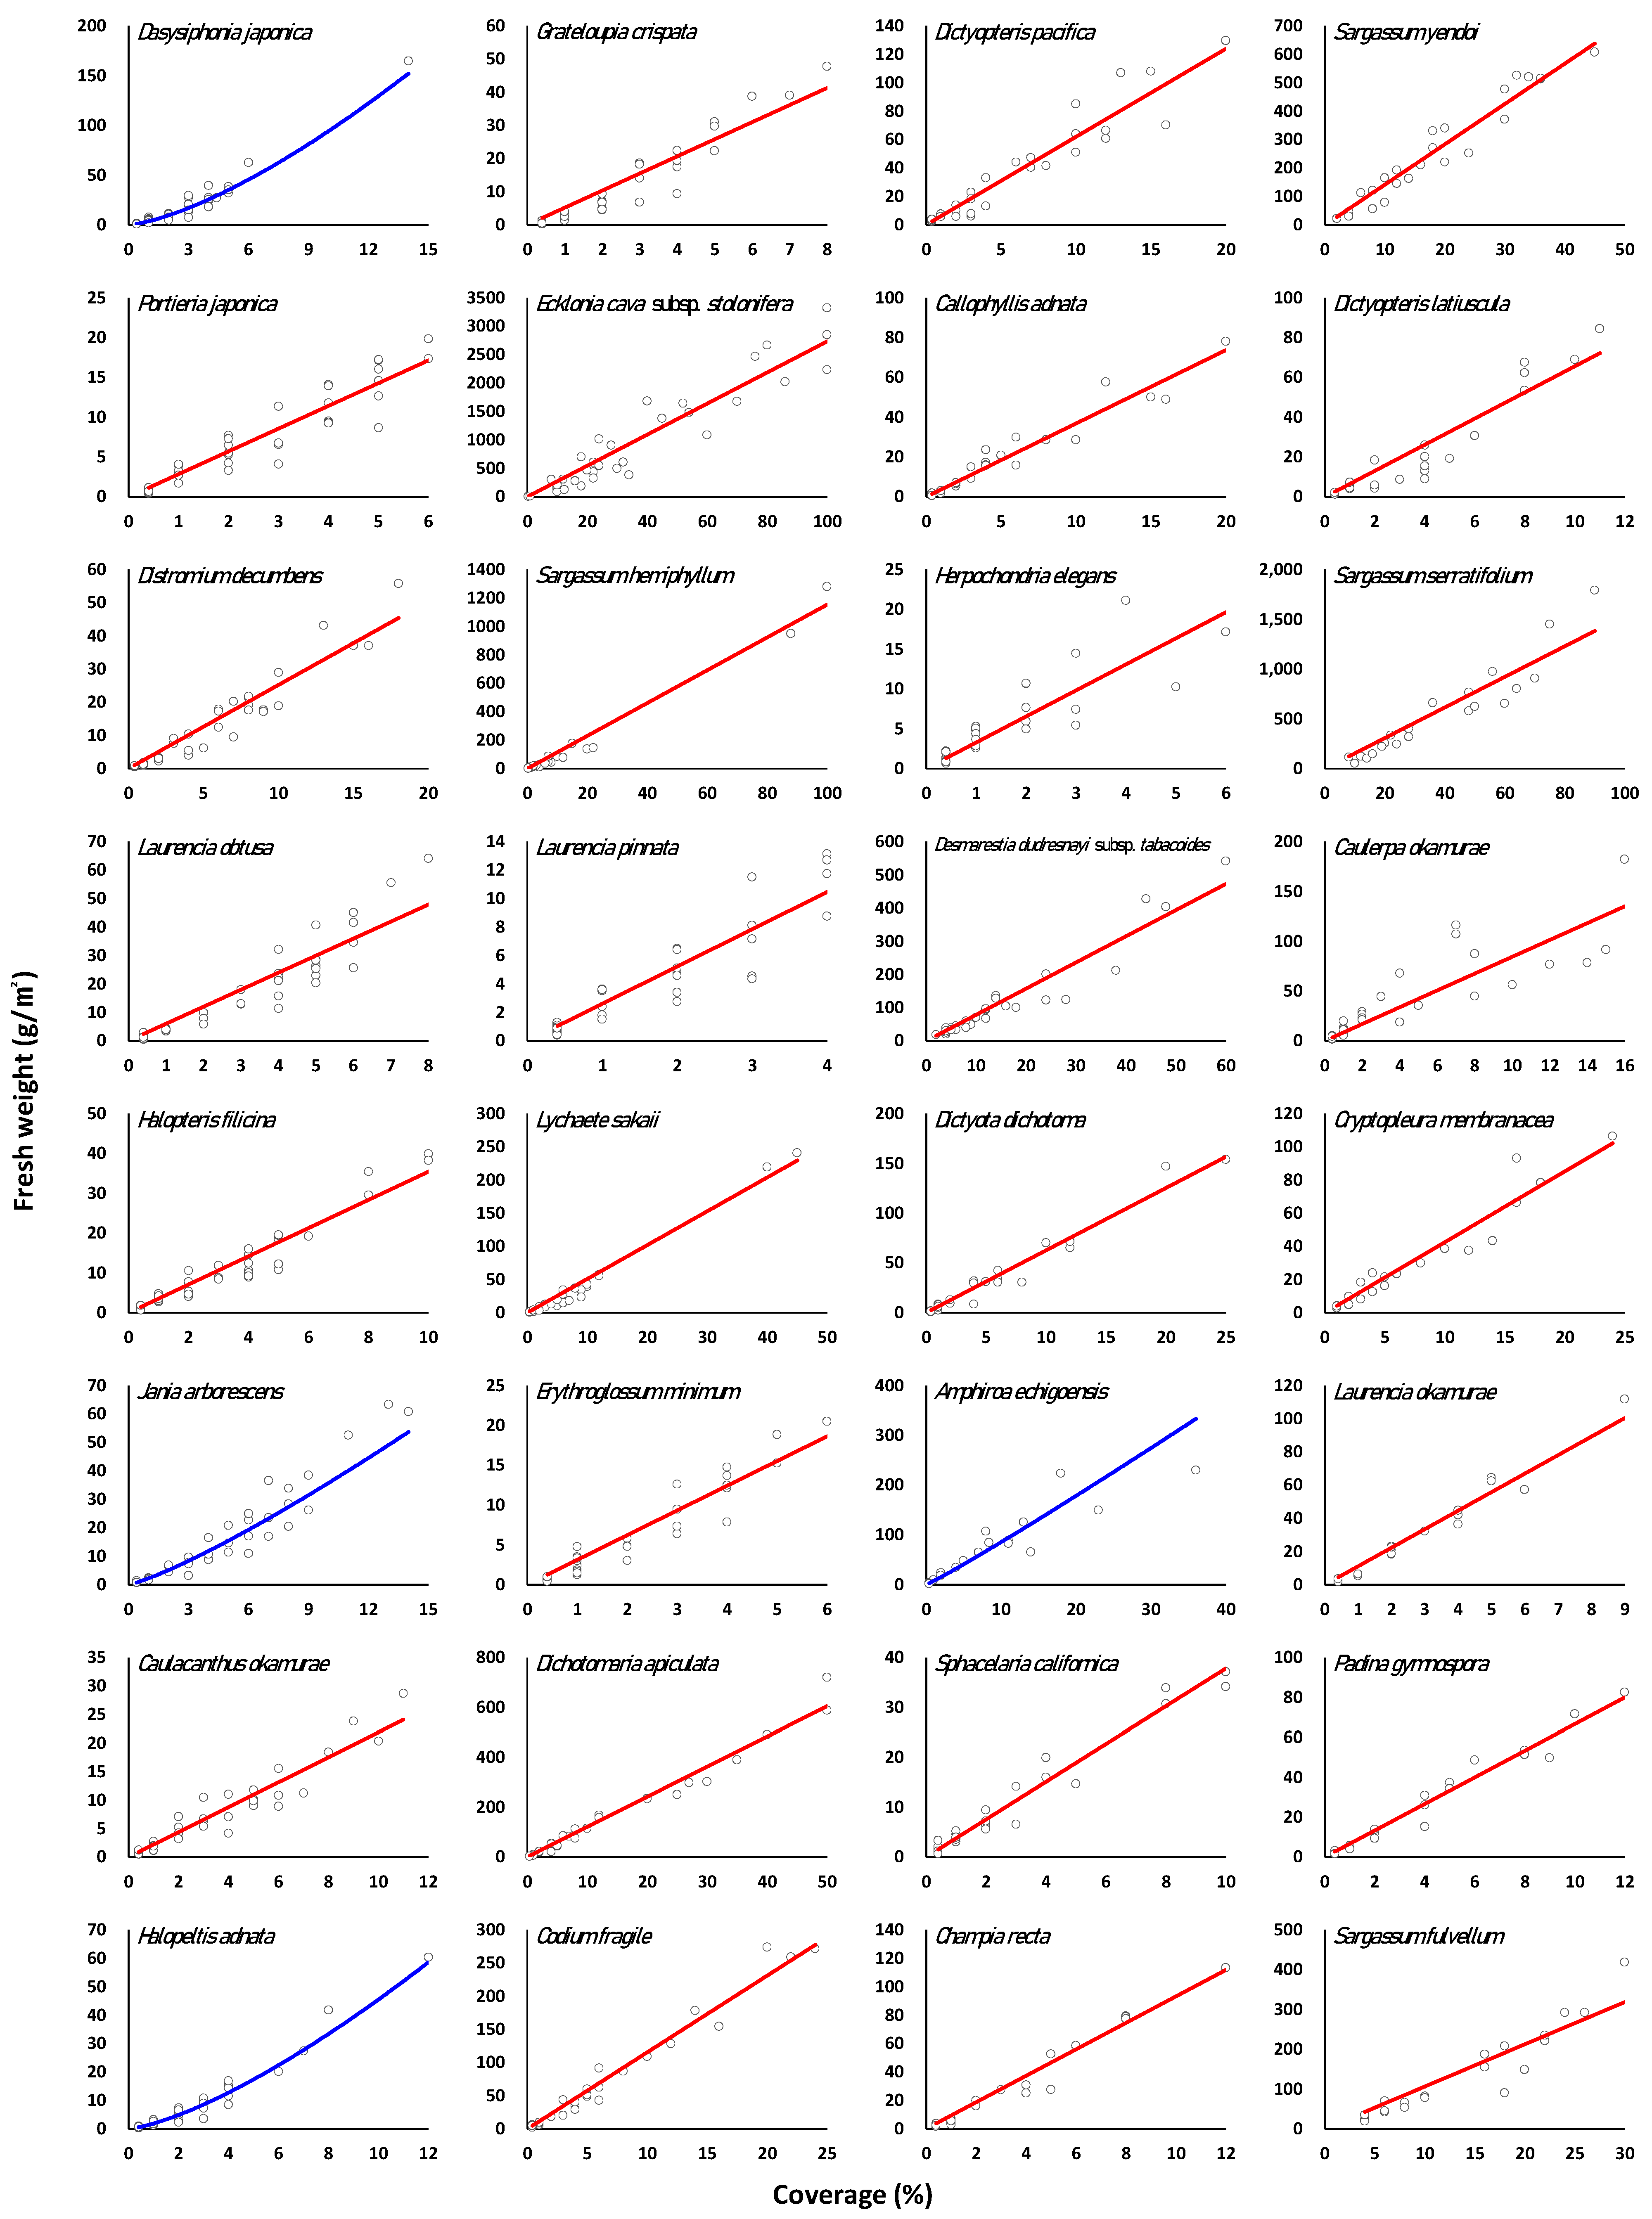
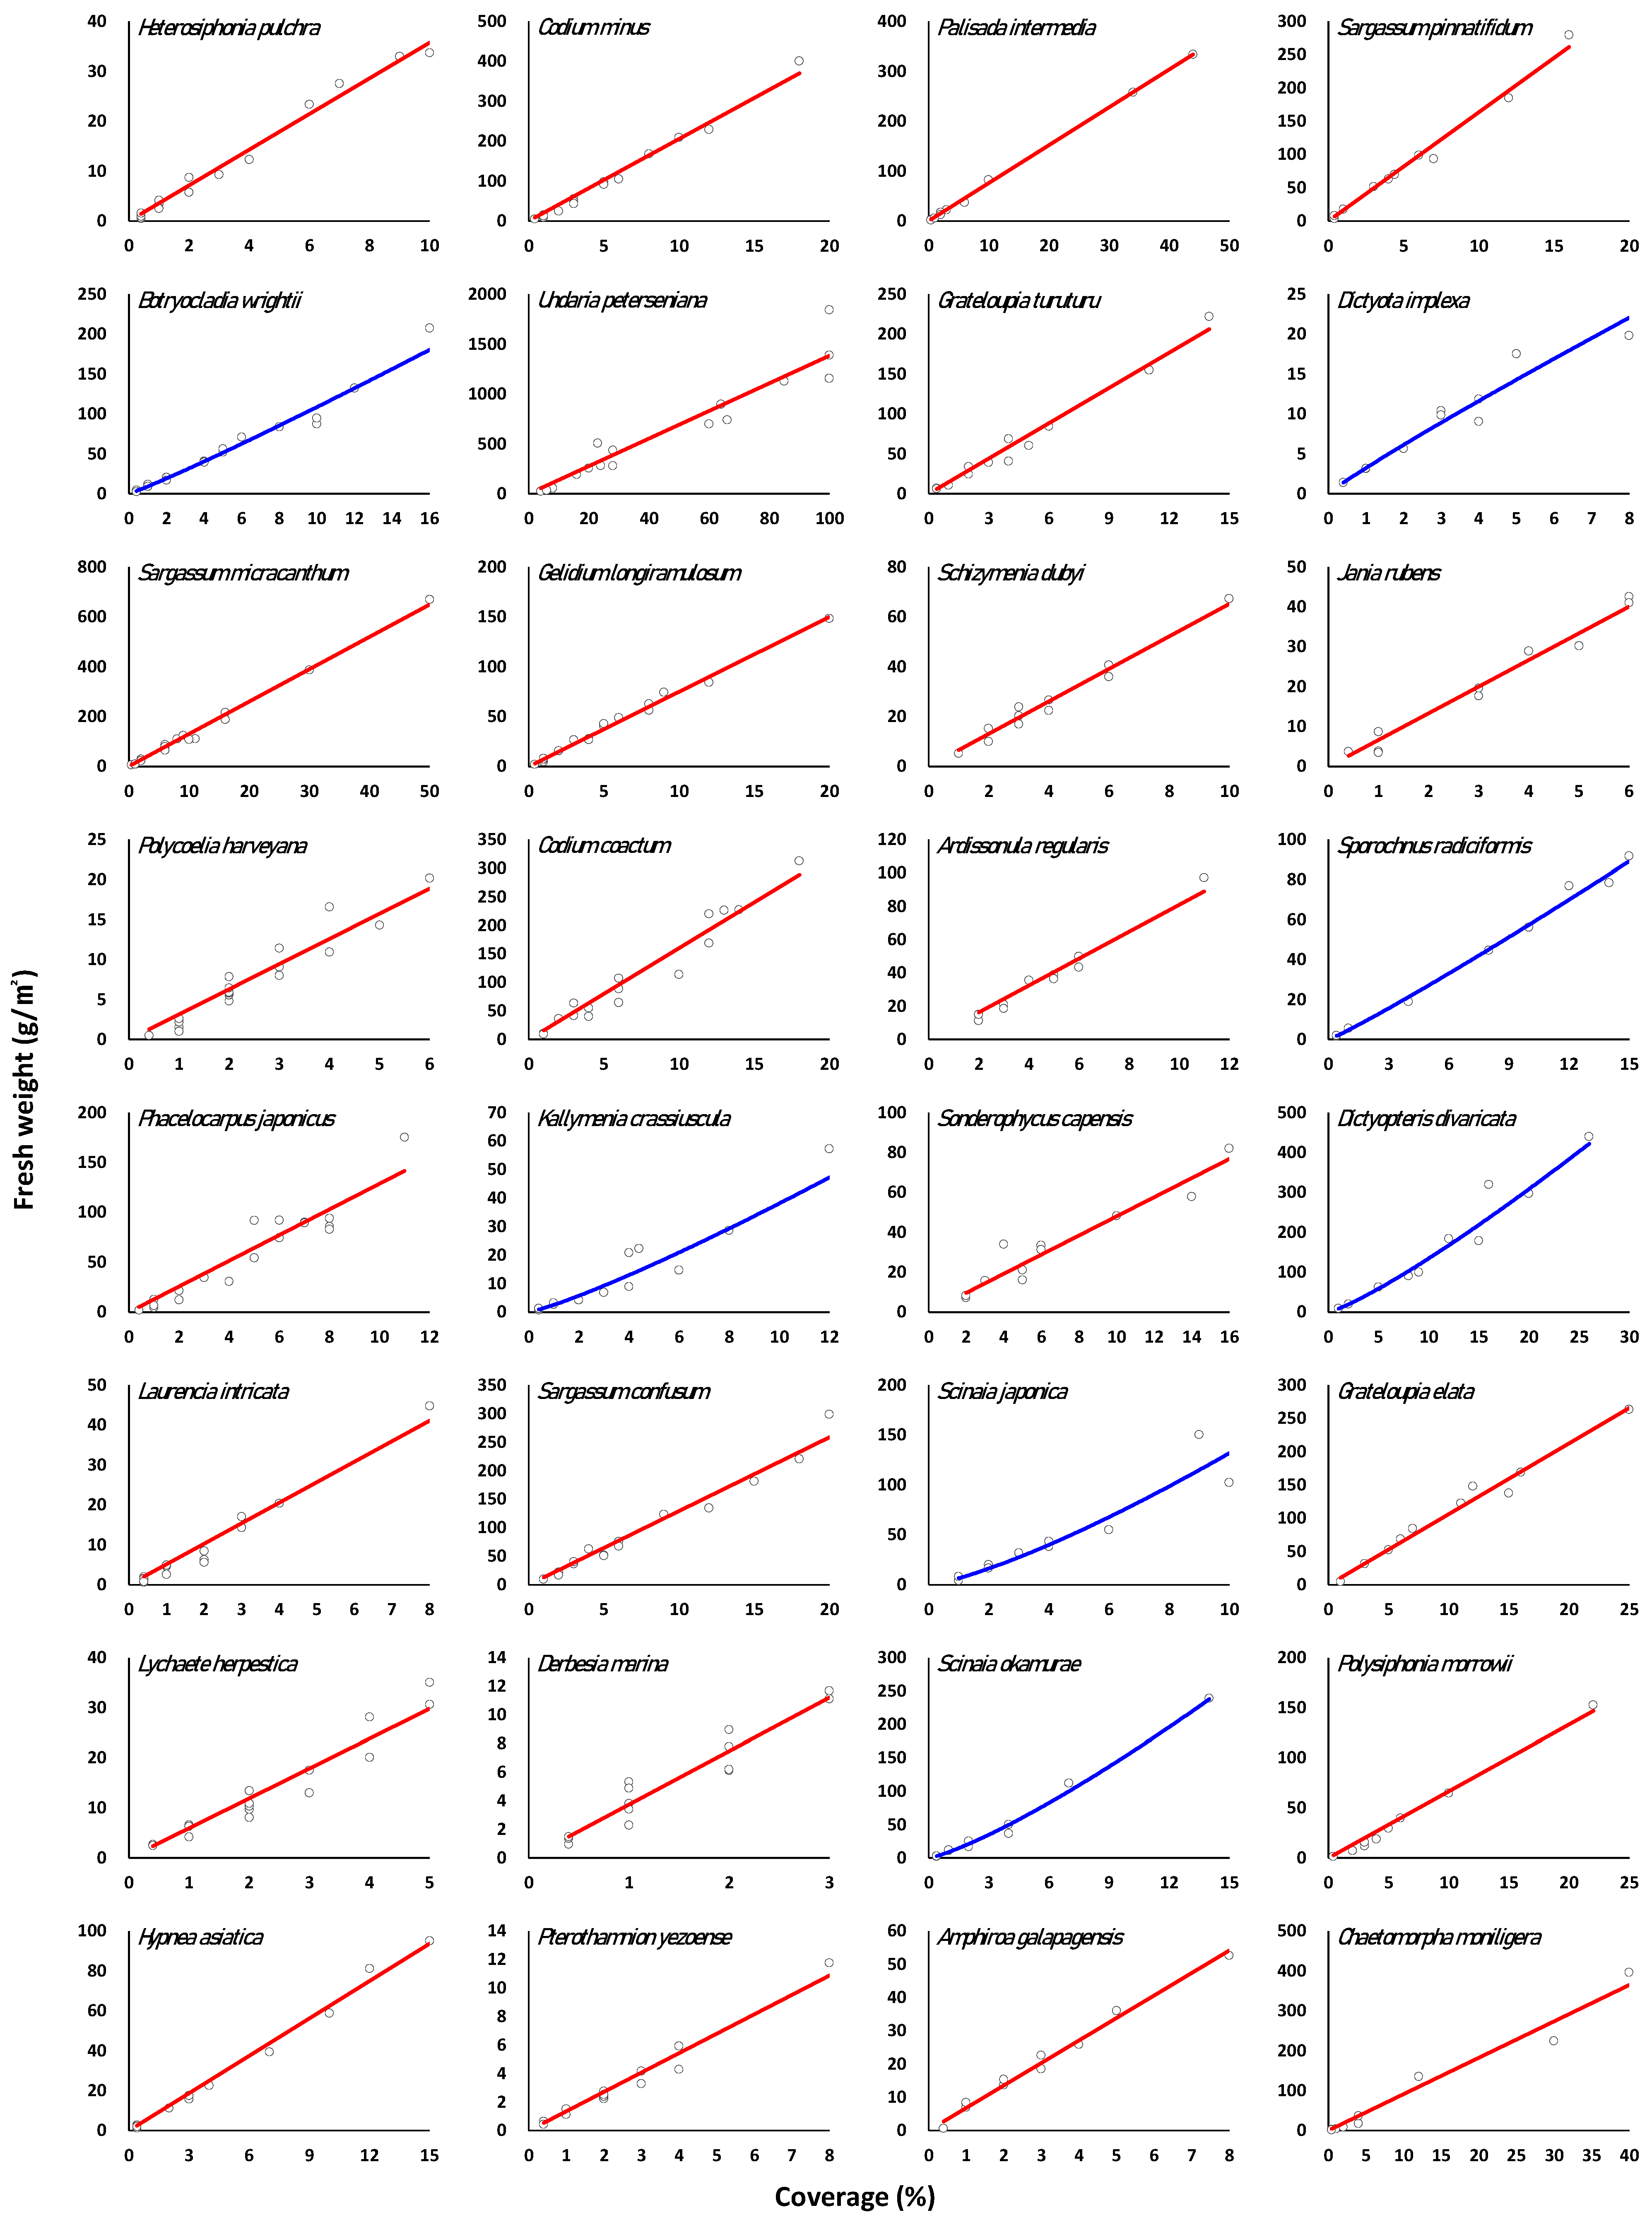
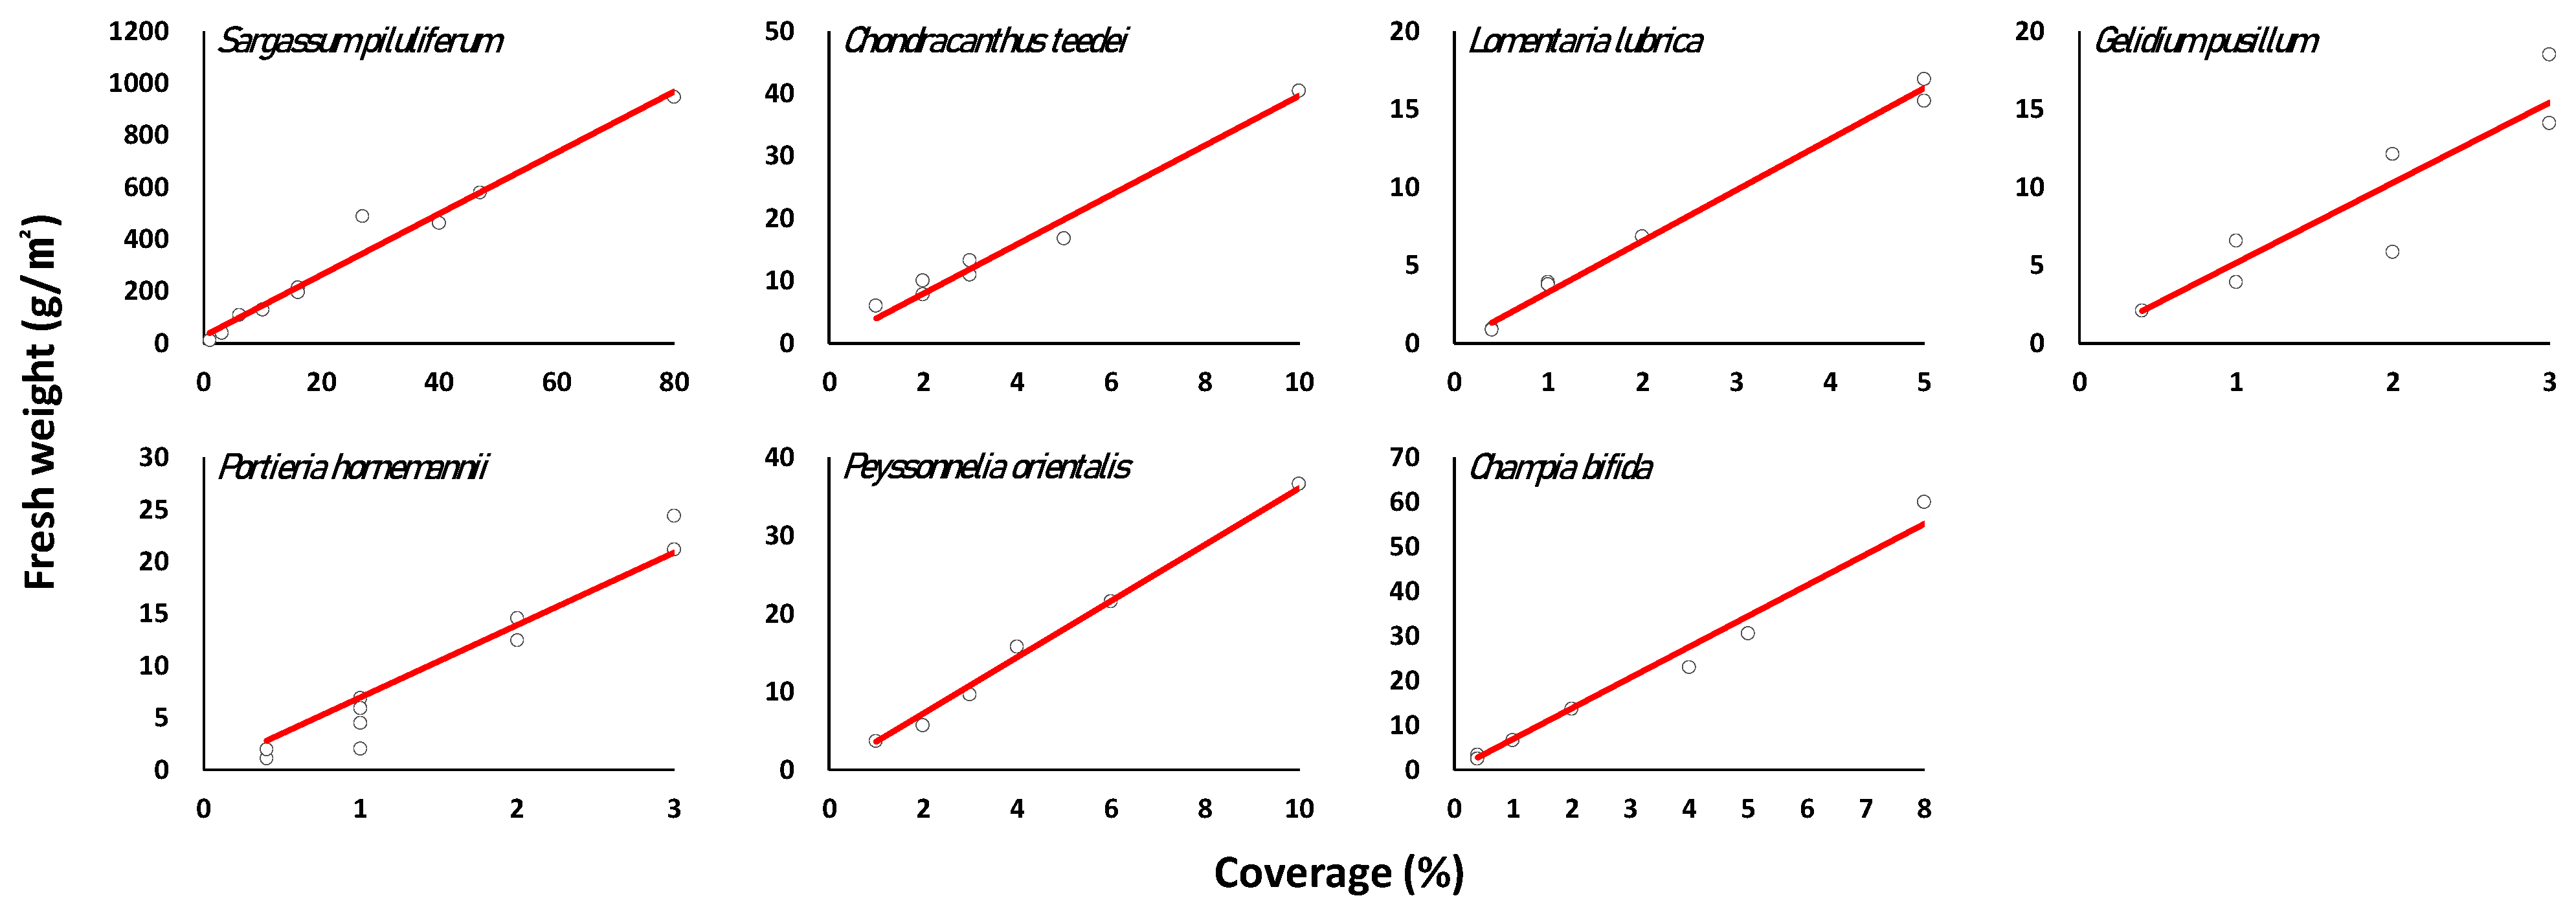
3.3. Regression of Marine Macroalgae Species

The mean ratio of fresh weight and standard error (SE), linear function FW = aCb (r2 = 0.873–0.999), and power function FW = aCb (r2 = 0.799–0.997) for coverage were analyzed by marine macroalgal type, and significance was high (p < 0.001) in all results. The regression analysis results for each species were arranged in the largest number of samples (Supplementary Table S1, Figure 3).
Marine macroalgal species with a high ratio of fresh weight to coverage (linear function, power function) are mainly Phaeophyceae, Laminariales, Lessoniaceae (Ecklonia bicyclis, E. cava, E. stolonifera), and Alariaceae (Undaria peterseniana, U. pinnatifida), in the order Fucales, Sargassaceae (Sargassum spp.), Lithophyllum okamurae (Corallinaceae), Grateloupia elliptica (Halymeniaceae), Scinaia spp. (Scinaiaceae), Gelidium elegans (Gelidiaceae), Pterocladiella capillacea (Pterocladiaceae) in Florideophyceae, in Ulvophyceae, Codium spp. (Codiaceae), and Caulerpa okamurae (Caulerpaceae).
When comparing the linear function and power function of each marine macroalgal species, Dictyota linearis, Dictyopteris divaricata, Myagropsis myagroides, Sargassum horneri, S. patens, U. pinnatifida, E. cava, Carpomitra costata, Sporochnus radiciformis, Amphiroa echigoensis, Jania arborescens, Scinaia japonica, S. okamurae, Dasysiphonia japonica, Kallymenia crassiuscula, Gymnogongrus flabelliformis, Grateloupia elliptica, Peyssonnelia caulifera, Plocamium uncinatum, Botryocladia wrightii, and Halopeltis adnata had a higher coefficient of determination for power function; however, the other species had a higher coefficient of determination of the linear function and the difference was small. The difference in the coefficient of determination between the function of each species was in the range of 0.001–0.146 (Supplementary Table S1).

4. Discussion

The biological estimation method combines the estimation formula for a specific species and the coverage rate to estimate the total biological volume of the target area, and if research on large areas is conducted simultaneously using satellite data, aerial photography, and multi-beam, it can be used more efficiently [3,31,36,37]. However, the remote sensing method still has difficulty in identifying species that grow in the subtidal zone [36,38]. Accordingly, as a result of conducting a regression analysis on 11,642 data sets of 135 species of marine macroalgae for the application of a wide and simple estimation equation, the significance and determination coefficient showed a high level of reliability. When regression analysis was conducted by classifying by layer (Ecklonia complex, Sargassum and Undaria complex, Understory complex 3 group), both functions showed high coefficients of determination (adj r2 = 0.886–0.909, p < 0.001). In the understory species complex containing various species, the coefficient of determination was relatively low (adj r2 = 0.737–0.871, p < 0.001), but it was determined to be sufficient to estimate the fresh weight of the whole macroalgal mat.
Since marine macroalgae exhibits a wide variety of morphological characteristics, from microscopic filaments to macroscopic kelp reaching several meters in size, regression analysis was performed at the species level [39,40]. As a result of the regression analysis by species, the species with a high fresh weight to epidermis ration had large length and volume growth, a dense and hard cellular structure in terms of species characteristics, or a characteristic high moisture or calcium carbonate content (thick leathery, sponge-like, crustose and lumpy coralline, mucilage-rich, densely branched, and branched in three dimensions). Species with a low fresh weight ratio to coverage generally exhibited small or thin characteristics (with one to several cell layer, filamentous, sheet-like, rarely branched, and branched in two dimensions).
Species with a large standard error of the fresh weight estimate (slope of linear function, power of function, mean ratio of fresh weight/coverage ratio) are large brown algae or relatively large species, and are considered to be due to differences in species characteristics, timing, and growth areas. For example, large brown algae such as Ecklonia spp. are characterized by distinct differences in shape, size, and biomass between young thallus and adult thallus individuals [41,42]. Therefore, in these species, the difference in biomass is inevitably large between young thallus dominates and adult thallus dominates depending on the survey time or region, and the differences in biomass will also increase as the coverage increases. In the same way in the coverage and biomass estimation using other parameters as well, the error increases as the individual size increases [27]. Therefore, when using the biomass estimation method of this study, it can be analyzed by considering the error when the coverage value of large brown algae is large, or by applying the error to the constant of the estimation formula when the individual size of the target area is identified. For example, in Ecklonia cava, a biomass of 301.29~21,502.82 g/m2 is estimated when an error is applied to the power function when the coverage is 100%/m2. Therefore, it is necessary to develop various methodologies to reduce the error in the future.
In the wet weight estimation model using the coverage presented in this study, an estimation formula based on the fresh weight of each species was obtained for a number of species. This method is expected to be able to estimate and change the primary production of a wide range of coastal ecosystems based on remote sensing as well as non-destructive survey of small-scale marine macroalgal communities using quadrat. As interest in the carbon sequestration potential of the macroalgal community in relation to the current blue carbon increases [43,44,45], it will be possible to estimate even a wide range of carbon sequestration when combined with the carbon content data [46,47,48,49] by marine macroalgal species in the wet weight estimation equation [50,51]. In particular, it is considered that the Ecklonia complex can be sufficiently applied to Ecklonia spp. and Eisenia spp., which are kelp that are globally distributed and have high productivity and are very similar in shape [15,35,52]. If the results of this study are widely used in similar studies such as biomass estimation, calculation, and securing a blue carbon sink, more valuable results can be derived if more accurate estimation formulas are developed for more diverse species through additional research.

5. Conclusions

This study has conducted to assess the feasibility of biomass estimation by non-destructive sampling and a newly proposed method. Regression analyses were conducted on 11,642 fresh weight datasets covering of 135 species of marine algae. The linear function was FW = 17.721C (adj r2 = 0.745, p < 0.001) and the power function was FW = 4.48C1.251 (adj r2 = 0.891, p < 0.001). For the Ecklonia complex, the linear function was FW = 27.360C (adj r2 = 0.886, p < 0.001) and the power function was FW = 9.626C1.223 (adj r2 = 0.909, p < 0.001). For the Sargassum and Undaria complex, the linear function was FW = 18.389C (adj r2 = 0.916, p < 0.001) and the power function was FW = 6.567C1.255 (adj r2 = 0.942, p < 0.001). For the understory complex, the linear function was FW = 10.419C (adj r2 = 0.737, p < 0.001) and the power function was FW = 4.377C1.182 (adj r2 = 0.871, p < 0.001). Our findings demonstrated that the proposed method can accurately estimate the primary productivity of a wide range of coastal ecosystems based on remote sensing and non-destructive surveys of small-scale marine macroalgal communities.

Supplementary Materials

The following supporting information can be downloaded at: https://www.mdpi.com/article/10.3390/jmse10111676/s1, Table S1: Relation expression between marine macroalgal coverage and fresh weight.

Author Contributions

S.W.J., C.G.C. conserved, designed, and performed the experiments; S.W.J. analyzed the data; C.G.C. wrote and edited the manuscript. We confirm this manuscript and data are original and have not been previously published or considered elsewhere. All authors have read and agreed to the published version of the manuscript.

Funding

This research was supported by Korea Institute of Marine Science & Technology Promotion (KIMST) funded by the Ministry of Oceans and Fisheries (20220254, 20220537) and the Korea Institute of Ocean Science & Technology Project (PEA0016).

Institutional Review Board Statement

Not applicable.

Informed Consent Statement

Not applicable.

Data Availability Statement

Not applicable.

Conflicts of Interest

The authors declare no conflict of interest.

References

  1. De Wreede, R.E. Destructive (harvest) sampling. In Handbook of Phycological Methods: Ecological Field Methods: Macroalgae; Littler, M.M., Littler, D.S., Eds.; Cambridge University Press: Cambridge, UK, 1985; pp. 147–160. [Google Scholar]
  2. Littler, M.M.; Littler, D.S. Nondestructive sampling. In Handbook of Phycological Methods: Ecological Field Methods: Macroalgae; Cambridge University Press: Cambridge, UK, 1985; pp. 161–175. [Google Scholar]
  3. Gundersen, H.; Rinde, E.; Bekkby, T.; Hancke, K.; Gitmark, J.K.; Christie, H. Variation in population structure and standing stocks of kelp along multiple environmental gradients and implications for ecosystem services. Front. Mar. Sci. 2021, 8, 578629. [Google Scholar] [CrossRef]
  4. Mulas, M.; Silverman, J.; Rilov, G. Biomass calibration of nine dominant native and non-native Levantine seaweeds. Aquat. Bot. 2022, 178, 103496. [Google Scholar] [CrossRef]
  5. del Río, P.G.; Gomes-Dias, J.S.; Rocha, C.M.R.; Romaní, A.; Garrote, G.; Domingues, L. Recent trends on seaweed fractionation for liquid biofuels production. Bioresour. Technol. 2020, 299, 122613. [Google Scholar] [CrossRef] [PubMed] [Green Version]
  6. Thakur, N.; Salama, E.-S.; Sharma, M.; Sharma, P.; Sharma, D.; Li, X. Efficient utilization and management of seaweed biomass for biogas production. Mater. Today Sustain. 2022, 18, 100120. [Google Scholar] [CrossRef]
  7. Ashour, M.; Alprol, A.E.; Heneash, A.M.M.; Saleh, H.; Abualnaja, K.M.; Alhashmialameer, D.; Mansour, A.T. Ammonia bioremediation from aquaculture wastewater effluents using Arthrospira platensis NIOF17/003: Impact of biodiesel residue and potential of ammonia-loaded biomass as Rotifer feed. Materials 2021, 14, 5460. [Google Scholar] [CrossRef]
  8. Figueira, M.M.; Volesky, B.; Ciminelli, V.S.T.; Roddick, F.A. Biosorption of metals in brown seaweed biomass. Water Res. 2000, 34, 196–204. [Google Scholar] [CrossRef]
  9. Znad, H.; Awual, M.R.; Martini, S. The utilization of algae and seaweed biomass for bioremediation of heavy metal-contaminated wastewater. Molecules 2022, 27, 1275. [Google Scholar] [CrossRef]
  10. Lerat, Y.; Cornish, M.L.; Critchley, A.T. Applications of algal biomass in global food and feed markets: From traditional usage to the potential for functional products. In Blue Biotechnology: Production and Use of Marine Molecules; Bare., S.L., Bates, S.S., Eds.; Wiley-VCH Verlag GmbH & Co. KGaA: Weinheim, Germany, 2018; pp. 143–189. [Google Scholar]
  11. Cotas, J.; Leandro, A.; Pacheco, D.; Gonçalves, A.M.M.; Pereira, L. A comprehensive review of the nutraceutical and therapeutic applications of red seaweeds (Rhodophyta). Life 2020, 10, 19. [Google Scholar] [CrossRef] [Green Version]
  12. Abdelrhman, A.M.; Ashour, M.; Al-Zahaby, M.A.; Sharawy, Z.Z.; Nazmi, H.; Zaki, M.A.A.; Ahmed, N.H.; Ahmed, S.R.; El-Haroun, E.; Doan, H.V.; et al. Effect of polysaccharides derived from brown macroalgae Sargassum dentifolium on growth performance, serum biochemical, digestive histology and enzyme activity of hybrid red tilapia. Aquac. Rep. 2022, 25, 101212. [Google Scholar] [CrossRef]
  13. Ko, Y.W.; Sung, G.H.; Kim, J.H. Estimation for seaweed biomass using regression: A methodological approach. Algae 2008, 23, 289–294. [Google Scholar] [CrossRef]
  14. Choi, C.G.; Ohno, M.; Sohn, C.H. Algal succession on different substrata covering the artificial iron reef at Ikata in Shikoku, Japan. Algae 2006, 21, 305–310. [Google Scholar] [CrossRef] [Green Version]
  15. Wernberg, T.; Coleman, M.A.; Babcock, R.C.; Bell, S.Y.; Bolton, J.J.; Connell, S.D.; Hurd, C.L.; Johnson, C.R.; Marzinelli, E.M.; Shears, N.T.; et al. Biology and ecology of the globally significant kelp Ecklonia radiata. Oceanogr. In Oceanography and Marine Biology; Oxford University Press: Oxford, UK, 2019; Volume 57, pp. 265–324. [Google Scholar]
  16. Layton, C.; Coleman, M.A.; Marzinelli, E.M.; Steinberg, P.D.; Swearer, S.E.; Vergés, A.; Wernberg, T.; Johnson, C.R. Kelp forest restoration in Australia. Front. Mar. Sci. 2020, 7, 74. [Google Scholar] [CrossRef] [Green Version]
  17. Cebrian, E.; Tamburello, L.; Verdura, J.; Guarnieri, G.; Medrano, A.; Linares, C.; Hereu, B.; Garrabou, J.; Cerrano, C.; Galobart, C.; et al. A roadmap for the restoration of mediterranean macroalgal forests. Front. Mar. Sci. 2021, 8, 709219. [Google Scholar] [CrossRef]
  18. Fragkopoulou, E.; Serrão, E.A.; De Clerck, O.; Costello, M.J.; Araújo, M.B.; Duarte, C.M.; Krause-Jensen, D.; Assis, J. Global biodiversity patterns of marine forests of brown macroalgae. Glob. Ecol. Biogeogr. 2022, 31, 636–648. [Google Scholar] [CrossRef]
  19. Mansour, A.T.; Ashour, M.; Alprol, A.E.; Alsaqufi, A.S. Aquatic plants and aquatic animals in the context of sustainability: Cultivation techniques, integration, and blue revolution. Sustainability 2022, 14, 3257. [Google Scholar] [CrossRef]
  20. Preskitt, L.B.; Vroom, P.S.; Smith, C.M. A rapid ecological assessment (REA) quantitative survey method for benthic algae using photoquadrats with scuba. Pac. Sci. 2004, 58, 201–209. [Google Scholar] [CrossRef] [Green Version]
  21. Sedano, F.; Pavón-Paneque, A.; Navarro-Barranco, C.; Guerra-García, J.M.; Digenis, M.; Sempere-Valverde, J.; Espinosa, F. Coastal armouring affects intertidal biodiversity across the Alboran Sea (Western Mediterranean Sea). Mar. Environ. Res. 2021, 171, 105475. [Google Scholar] [CrossRef]
  22. Ko, Y.W.; Choi, H.-G.; Lee, D.S.; Kim, J.H. 30 years revisit survey for long-term changes in the Antarctic subtidal algal assemblage. Sci. Rep. 2020, 10, 8481. [Google Scholar] [CrossRef]
  23. Bravo, G.; Livore, J.P.; Bigatti, G. Monitoring rocky reef biodiversity by underwater geo-referenced photoquadrats. Underw. Technol. 2021, 38, 17–24. [Google Scholar] [CrossRef]
  24. Chennu, A.; Färber, P.; Death, G.; de Beer, D.; Fabricius, K.E. A diver-operated hyperspectral imaging and topographic surveying system for automated mapping of benthic habitats. Sci. Rep. 2017, 7, 7122. [Google Scholar] [CrossRef]
  25. Robbins, B.D.; Boese, B.L. Macroalgal volume: A surrogate for biomass in some green algae. Bot. Mar. 2002, 45, 586–588. [Google Scholar] [CrossRef]
  26. Kim, S.; Youn, S.-H. Estimating the individual dry weight of sheet form macroalgae for laboratory studies. J. Korean Soc. Mar. Environ. Saf. 2019, 25, 244–250. [Google Scholar] [CrossRef]
  27. Kim, S.; Kang, Y.H.; Kim, T.-H.; Lee, H.J.; Park, S.R. Use of morphological characteristics for calculating individual biomass in the kelp Ecklonia cava. J. Appl. Phycol. 2017, 29, 2587–2593. [Google Scholar] [CrossRef]
  28. Campbell, J.; Starko, S. Allometric models effectively predict Saccharina latissima (Laminariales, Phaeophyceae) fresh weight at local scales. J. Appl. Phycol. 2020, 33, 491–500. [Google Scholar] [CrossRef]
  29. Scrosati, R.A.; MacDonald, H.L.; Córdova, C.A.; Casas, G.N. Length and biomass data for Atlantic and Pacific seaweeds from both hemispheres. Front. Mar. Sci. 2020, 7, 592675. [Google Scholar] [CrossRef]
  30. Van Son, T.C.; Nikolioudakis, N.; Steen, H.; Albretsen, J.; Furevik, B.R.; Elvenes, S.; Moy, F.; Norderhaug, K.M. Achieving reliable estimates of the spatial distribution of kelp biomass. Front. Mar. Sci. 2020, 7, 107. [Google Scholar] [CrossRef] [Green Version]
  31. Xiao, Y.; Zhang, J.; Cui, T.; Gong, J.; Liu, R.; Chen, X.; Liang, X. Remote sensing estimation of the biomass of floating Ulva prolifera and analysis of the main factors driving the interannual variability of the biomass in the Yellow Sea. Mar. Pollut. Bull. 2019, 140, 330–340. [Google Scholar] [CrossRef]
  32. Che, S.; Du, G.; Wang, N.; He, K.; Mo, Z.; Sun, B.; Chen, Y.; Cao, Y.; Wang, J.; Mao, Y. Biomass estimation of cultivated red algae Pyropia using unmanned aerial platform based multispectral imaging. Plant Methods 2021, 17, 12. [Google Scholar] [CrossRef]
  33. Dayton, P.K.; Currie, V.; Gerrodette, T.; Keller, B.D.; Rosenthal, R.; Ven Tresca, D. Patch dynamics and stability of some California kelp communities. Ecol. Monogr. 1984, 54, 253–289. [Google Scholar] [CrossRef]
  34. Benes, K.M.; Carpenter, R.C. Kelp canopy facilitates understory algal assemblage via competitive release during early stages of secondary succession. Ecology 2015, 96, 241–251. [Google Scholar] [CrossRef]
  35. Guiry, M.D.; Guiry, G.M. AlgaeBase. World-Wide Electronic Publication. National University of Ireland: Galway, Ireland. Available online: https://www.algaebase.org (accessed on 16 February 2022).
  36. Webster, T.; MacDonald, C.; McGuigan, K.; Crowell, N.; Lauzon-Guay, J.-S.; Collins, K. Calculating macroalgal height and biomass using bathymetric LiDAR and a comparison with surface area derived from satellite data in Nova Scotia, Canada. Bot. Mar. 2019, 63, 43–59. [Google Scholar] [CrossRef]
  37. Johnson, M.P. Estimating intertidal seaweed biomass at larger scales from quadrat surveys. Mar. Environ. Res. 2020, 156, 104906. [Google Scholar] [CrossRef]
  38. Montes-Herrera, J.C.; Cimoli, E.; Cummings, V.; Hill, N.; Lucieer, A.; Lucieer, V. Underwater hyperspectral imaging (UHI): A review of systems and applications for proximal seafloor ecosystem studies. Remote Sens. 2021, 13, 3451. [Google Scholar] [CrossRef]
  39. Kain (Jones), J.M. Morphology and growth of the giant kelp Macrocystis pyrifera in New Zealand and California. Mar. Biol. 1982, 67, 143–157. [Google Scholar] [CrossRef]
  40. Steneck, R.S.; Dethier, M.N. A functional group approach to the structure of algal-dominated communities. Oikos 1994, 69, 476–498. [Google Scholar] [CrossRef] [Green Version]
  41. Hwang, E.-K.; Gong, Y.-G.; Ha, D.-S.; Park, C.-S. Nursery and main culture conditions for mass cultivation of the brown alga, Ecklonia cava Kjellman. Korean J. Fish. Aquat. Sci. 2010, 43, 687–692. [Google Scholar] [CrossRef] [Green Version]
  42. Kawai, H.; Akita, S.; Hashimoto, K.; Hanyuda, T. A multigene molecular phylogeny of Eisenia reveals evidence for a new species, Eisenia nipponica (Laminariales), from Japan. Eur. J. Phycol. 2020, 55, 234–241. [Google Scholar] [CrossRef]
  43. Duarte, C.M.; Wu, J.; Xiao, X.; Bruhn, A.; Krause-Jensen, D. Can seaweed farming play a role in climate change mitigation and adaptation? Front. Mar. Sci. 2017, 4, 100. [Google Scholar] [CrossRef] [Green Version]
  44. Krause-Jensen, D.; Lavery, P.; Serrano, O.; Marbà, N.; Masque, P.; Duarte, C.M. Sequestration of macroalgal carbon: The elephant in the blue carbon room. Biol. Lett. 2018, 14, 20180236. [Google Scholar] [CrossRef] [Green Version]
  45. Raven, J. Blue carbon: Past, present and future, with emphasis on macroalgae. Biol. Lett. 2018, 14, 20180336. [Google Scholar] [CrossRef]
  46. Lapointe, B.E.; Littler, M.M.; Littler, D.S. Nutrient availability to marine macroalgae in siliciclastic versus carbonate-rich coastal waters. Estuaries 1992, 15, 75–82. [Google Scholar] [CrossRef]
  47. Gevaert, F.; Davoult, D.; Creach, A.; Kling, R.; Janquin, M.-A.; Seuront, L.; Lemoine, Y. Carbon and nitrogen content of Laminaria saccharina in the eastern English Channel: Biometrics and seasonal variations. J. Mar. Biol. Assoc. UK 2001, 81, 727–734. [Google Scholar] [CrossRef]
  48. Choi, S.K.; Oh, H.-J.; Yun, S.-H.; Lee, H.J.; Lee, K.; Han, Y.S.; Kim, S.; Park, S.R. Population dynamics of the ‘golden tides’ seaweed, Sargassum horneri, on the Southwestern coast of Korea: The extent and formation of golden tides. Sustainability 2020, 12, 2903. [Google Scholar] [CrossRef] [Green Version]
  49. Olsson, J.; Toth, G.B.; Albers, E. Biochemical composition of red, green and brown seaweeds on the Swedish west coast. J. Appl. Phycol. 2020, 32, 3305–3317. [Google Scholar] [CrossRef]
  50. Filbee-Dexter, K.; Wernberg, T. Substantial blue carbon in overlooked Australian kelp forests. Sci. Rep. 2020, 10, 12341. [Google Scholar] [CrossRef] [PubMed]
  51. Laurens, L.M.L.; Lane, M.; Nelson, R.S. Sustainable seaweed biotechnology solutions for carbon capture, composition, and deconstruction. Trends Biotechnol. 2020, 38, 1232–1244. [Google Scholar] [CrossRef] [PubMed]
  52. Wernberg, T.; Krumhansl, K.; Filbee-Dexter, K.; Pedersen, M.F. Status and trends for the world’s kelp forests. In World Seas: An Environmental Evaluation, 2nd ed.; Sheppard, C., Ed.; Elsevier: Amsterdam, The Netherlands, 2019; pp. 57–78. [Google Scholar]
Figure 1. Map of study sites each area of Korea.
Jmse 10 01676 g001
Figure 2. Regression analysis shown in data set from the marine macroalgal group.
Jmse 10 01676 g002
Figure 3. The regression line between marine macroalgal coverage and fresh weight of each species. The linear regression is the red line and power regression is the blue line.
Jmse 10 01676 g003aJmse 10 01676 g003bJmse 10 01676 g003cJmse 10 01676 g003dJmse 10 01676 g003e
Publisher’s Note: MDPI stays neutral with regard to jurisdictional claims in published maps and institutional affiliations.

