Article

A Multi-Criteria Approach for Evaluating a Sustainable Intermodal Transport Chain Affected by the COVID-19 Pandemic

Faculty of Maritime Studies and Transport, University of Ljubljana, Pot Pomorščakov 4, 6320 Portorož, Slovenia
*
Author to whom correspondence should be addressed.
J. Mar. Sci. Eng. 2022, 10(11), 1644; https://doi.org/10.3390/jmse10111644
Submission received: 8 September 2022 / Revised: 21 October 2022 / Accepted: 29 October 2022 / Published: 3 November 2022
(This article belongs to the Special Issue Sustainable Maritime Transportation Systems)

Abstract

:
The sustainable performance of the intermodal transport chain has gained popularity in recent decades, especially due to climate change and numerous European laws aimed at minimizing the negative impacts of transport. In this paper, we have developed a novel three-phase, two-stage approach that is a combination of distance-based analytic hierarchy process/data envelopment analysis (AHP-DEA). The added value of this multi-criteria approach is in evaluating a sustainable intermodal transport chain, with prioritization of the most efficient combinations of transport in accordance with the weights derived from its users. Instead of the classic pairwise comparison, the weights of the criteria were determined using a new distance-based AHP method in which respondents were asked to sort the criteria (transportation time, price, emissions, and variability) pre-selected from the literature in order of greatest importance. Therefore, the approach determines the most efficient transport chain in the transportation corridor. Since a transportation corridor was previously defined, the settings for this corridor were set to constant initial variables. In this way, the above criteria were chosen as inputs, with DEA aimed at minimizing these variables and presenting the results in ranks from highest to lowest efficiency. The potential of our approach was presented in a case study, where the most efficient of the selected transport chains between Asia and the northern Adriatic were chosen. The results show that there are different intermodal transport chains, each of which consists of either maritime and rail transport or maritime and road transport. The paper concludes that the presented multicriteria approach has greater discriminatory power than the current DEA, as well as greater flexibility, since the weights can be derived faster and more effortlessly than is typical. Therefore, this method can help transportation organizers to determine which intermodal transportation chain is the most efficient or sustainable in any given situation.

1. Introduction

Sustainable development has become an extremely important factor in organizing transport processes, and it also affects intermodal transport chains. At the same time, intermodal transport chains, if wisely organized, represent an efficient tool for extending the concept of sustainability in transport and logistics [1]. On the other hand, organizing a more sustainable intermodal transport chain increases the complexity of managing the transport process. Consequently, the transport operator faces difficult decisions when designing a transport chain. Furthermore, the transportation sector, like many other industries, is subject to a variety of changes at the organizational, technical, regulatory, and, above all, environmental levels. Although it is designed precisely to transport goods over long distances, its operation has a negative impact on the environment through air pollution, marine pollution, and especially climate change, which requires rapid reform of legislation and regulations regarding sustainability criteria. Transport in Europe is responsible for about 23% of greenhouse gas (GHG) emissions, making it the second-largest emitter of GHGs after the energy sector [2]. On a global scale, container shipping provides the cost-efficient and reliable transport of goods, and it is the mode of transport for a total of 80% of goods traded worldwide [3]. Consequently, CO2 emissions from international shipping represent 3–4% of total CO2 emissions in the EU [4], while global shipping emissions represented 2.89% of anthropogenic emissions in 2018 [5].
Calls for “greener” container transport have increased significantly over the last decade. Since the Paris Agreement [6] in 2015, maritime transport has also been included in the low-emission mobility strategy. After years of considering whether shipping should contribute to global efforts to minimize emissions, the International Maritime Organization (IMO) and the European Commission agreed in 2018 to reduce total annual GHG emissions from international shipping by at least 50% by 2050, using 2008 as the baseline year. A target was also set to reduce the carbon intensity of international shipping by at least 40% by 2030 and total annual emissions by at least 50% by 2050, compared to 2008. The EU is closely involved in the work of developing measures to achieve these targets at the IMO level, as shipping remains an essentially global business [7]. In addition, the IMO introduced a carbon intensity indicator in 2021, the shortcomings of which have been discussed by Wang et al. [8], who demonstrated the need to develop a more advanced model. Moreover, Sirotić et al. [9] stated in their study that there are opportunities to adapt new organizational approaches in transport systems. This highlights the need for better insight into the sustainability of the relationship between shippers and logistics service providers (LSPs). For example, many transportation organizers are faced with a range of alternatives from which to choose, including selecting the most environmentally friendly transport mode or route of transportation.
Since there are several criteria to choose from and all alternatives exhibit different levels of performance, formal methods are required to ensure structured decision making. In the literature, many methods such as the analytic hierarchy process (AHP), data envelopment analysis (DEA), and other combinations, including fuzzy AHP, are used to address multi-criteria decision making. As a multi-criteria decision-making method, fuzzy AHP was used in a study by Yayla et al. [10] as a support tool for the selection of LSP. Celik and Akyuz [11] combined AHP and TOPSIS to select the appropriate shiploader type because time at the terminal has a significant impact on the cost of providing the shipping service. Shakourloo et al. [12] and Awasthi et al. [13] used fuzzy AHP and fuzzy AHP-VIKOR, respectively, for supplier selection in a supply chain.
Vukić et al. [14] found DEA to be a useful method for determining the optimal green transport route among alternatives in maritime transport. Jugović et al. [15] focused on the multicriteria optimization of transport corridors (motorways of the sea) with the objective of environmental protection. A paper by Wiegmans and Janic [16] presented a methodology for evaluating the performance of long-distance intermodal freight transport corridors between China and Europe as part of the Belt and Road Initiative. In addition, Panagakos and Psaraftis [17] proposed a methodology for evaluating freight corridors using key performance indicators. Performance indicators are usually relevant decision criteria in multi-criteria assessment. Gohari et al. [18] analyzed the key decision criteria for intermodal freight transportation and found that the most commonly used decision criteria are cost, CO2 emissions, delivery time, safety, reliability, flexibility, and frequency. A time, cost, capacity, and environmental index was also used in the multi-criteria analysis of Neumann [19], which was concerned with deciding which type of transport to choose for a given route between Poland and China, where the weighting of the criteria also depended on the shipment size. In addition, there are other studies that deal with the choice of mode between cross-border land and sea transport. The authors Feo et al. [20] and Arencibia et al. [21] applied a discrete choice model to determine freight shippers’ preferences based on attributes such as cost, transit time, punctuality, and service frequency, which led to the development of explanatory variables for the different transport modes.
In addition to price, transportation time, and cost, several authors studied the reliability factor and its impact on intermodal transportation. Reis et al. [22] used a model to investigate the influence of mode choice variables on a short or medium land distance. The model showed that only price provides an advantage for intermodal transport compared to road transport, which is also more reliable. Reliability improvements in intermodal rail-truck transportation in China and its impact on network benefits were studied by Zhang et al. [23], who developed a method to estimate the change in reliability of the entire intermodal transport chain based on improvements in individual parts of the chain. Kramarz et al. [24] studied the reliability of the intermodal rail network and found that there is a need to develop a coherent system for collecting data on disruptions, which would form the basis of a disruption knowledge management model and help improve the reliability of the network. Interestingly, Hrušovský et al. [25] studied the reduced reliability of intermodal transport chains in case of disruptions and presented a real-time decision support system as a solution, suggesting the best rescheduling policy for all affected services. Although the aforementioned studies consider the variability of intermodal transport chains, these studies are mainly related to land transportation. Studies rarely address the variability of maritime transport because it did not pose major risks to on-time delivery in global supply chains, but its reliability changed significantly during the COVID-19 period.
Despite the growing interest in green practices among LSPs, Multaharju et al. [26] and Wolf and Seuring [27] note in their studies that green criteria are a prerequisite for LSPs to achieve a certain level of environmental performance, while other conventional performance factors, such as price, quality, on-time delivery, and capacity, play a larger role in LSP selection. Lammgård [28] finds out that the demand for green logistics services has become stronger and therefore, has created uneven pressures on LSPs. This also explains the findings of Bask et al. [29] and Björklund and Forslund [30], who found that green measures mostly serve as order qualifiers for the next round of decision making and are not later included in contracts, mainly because of the lack of methods to measure the cost–benefit of environmental initiatives. Similar findings were made by Jazairy [31], who found that green measures are listed in the contract, but then not implemented during execution. Despite the inconsistent demand for green logistics services, several studies found that LSPs are more committed to environmental protection, even when there are no requirements from shippers [32,33]. In this way, both buyers of transportation services and logistics companies incorporate information about environmental efficiency into their decision-making process to choose the most environmentally friendly transportation mode and route.
In the literature, we have also found several combinations of AHP-DEA with applications in different fields. Lei et al. [34] found that the AHP-DEA model has higher discriminatory power than the baseline DEA model in evaluating airport efficiency. Kaewfak et al. [35] used a two-stage fuzzy model AHP-DEA with the aim of optimizing a risky route for a multimodal freight transportation system. Koohathongsumrit and Meethom [36] used a combination of AHP-DEA for route selection in multimodal supply chains between Thailand and Vietnam. In addition, Kengpol et al. [37] developed a route selection framework for multimodal transportation with the expected results of reducing cost, lead time risk, and CO2 emissions.
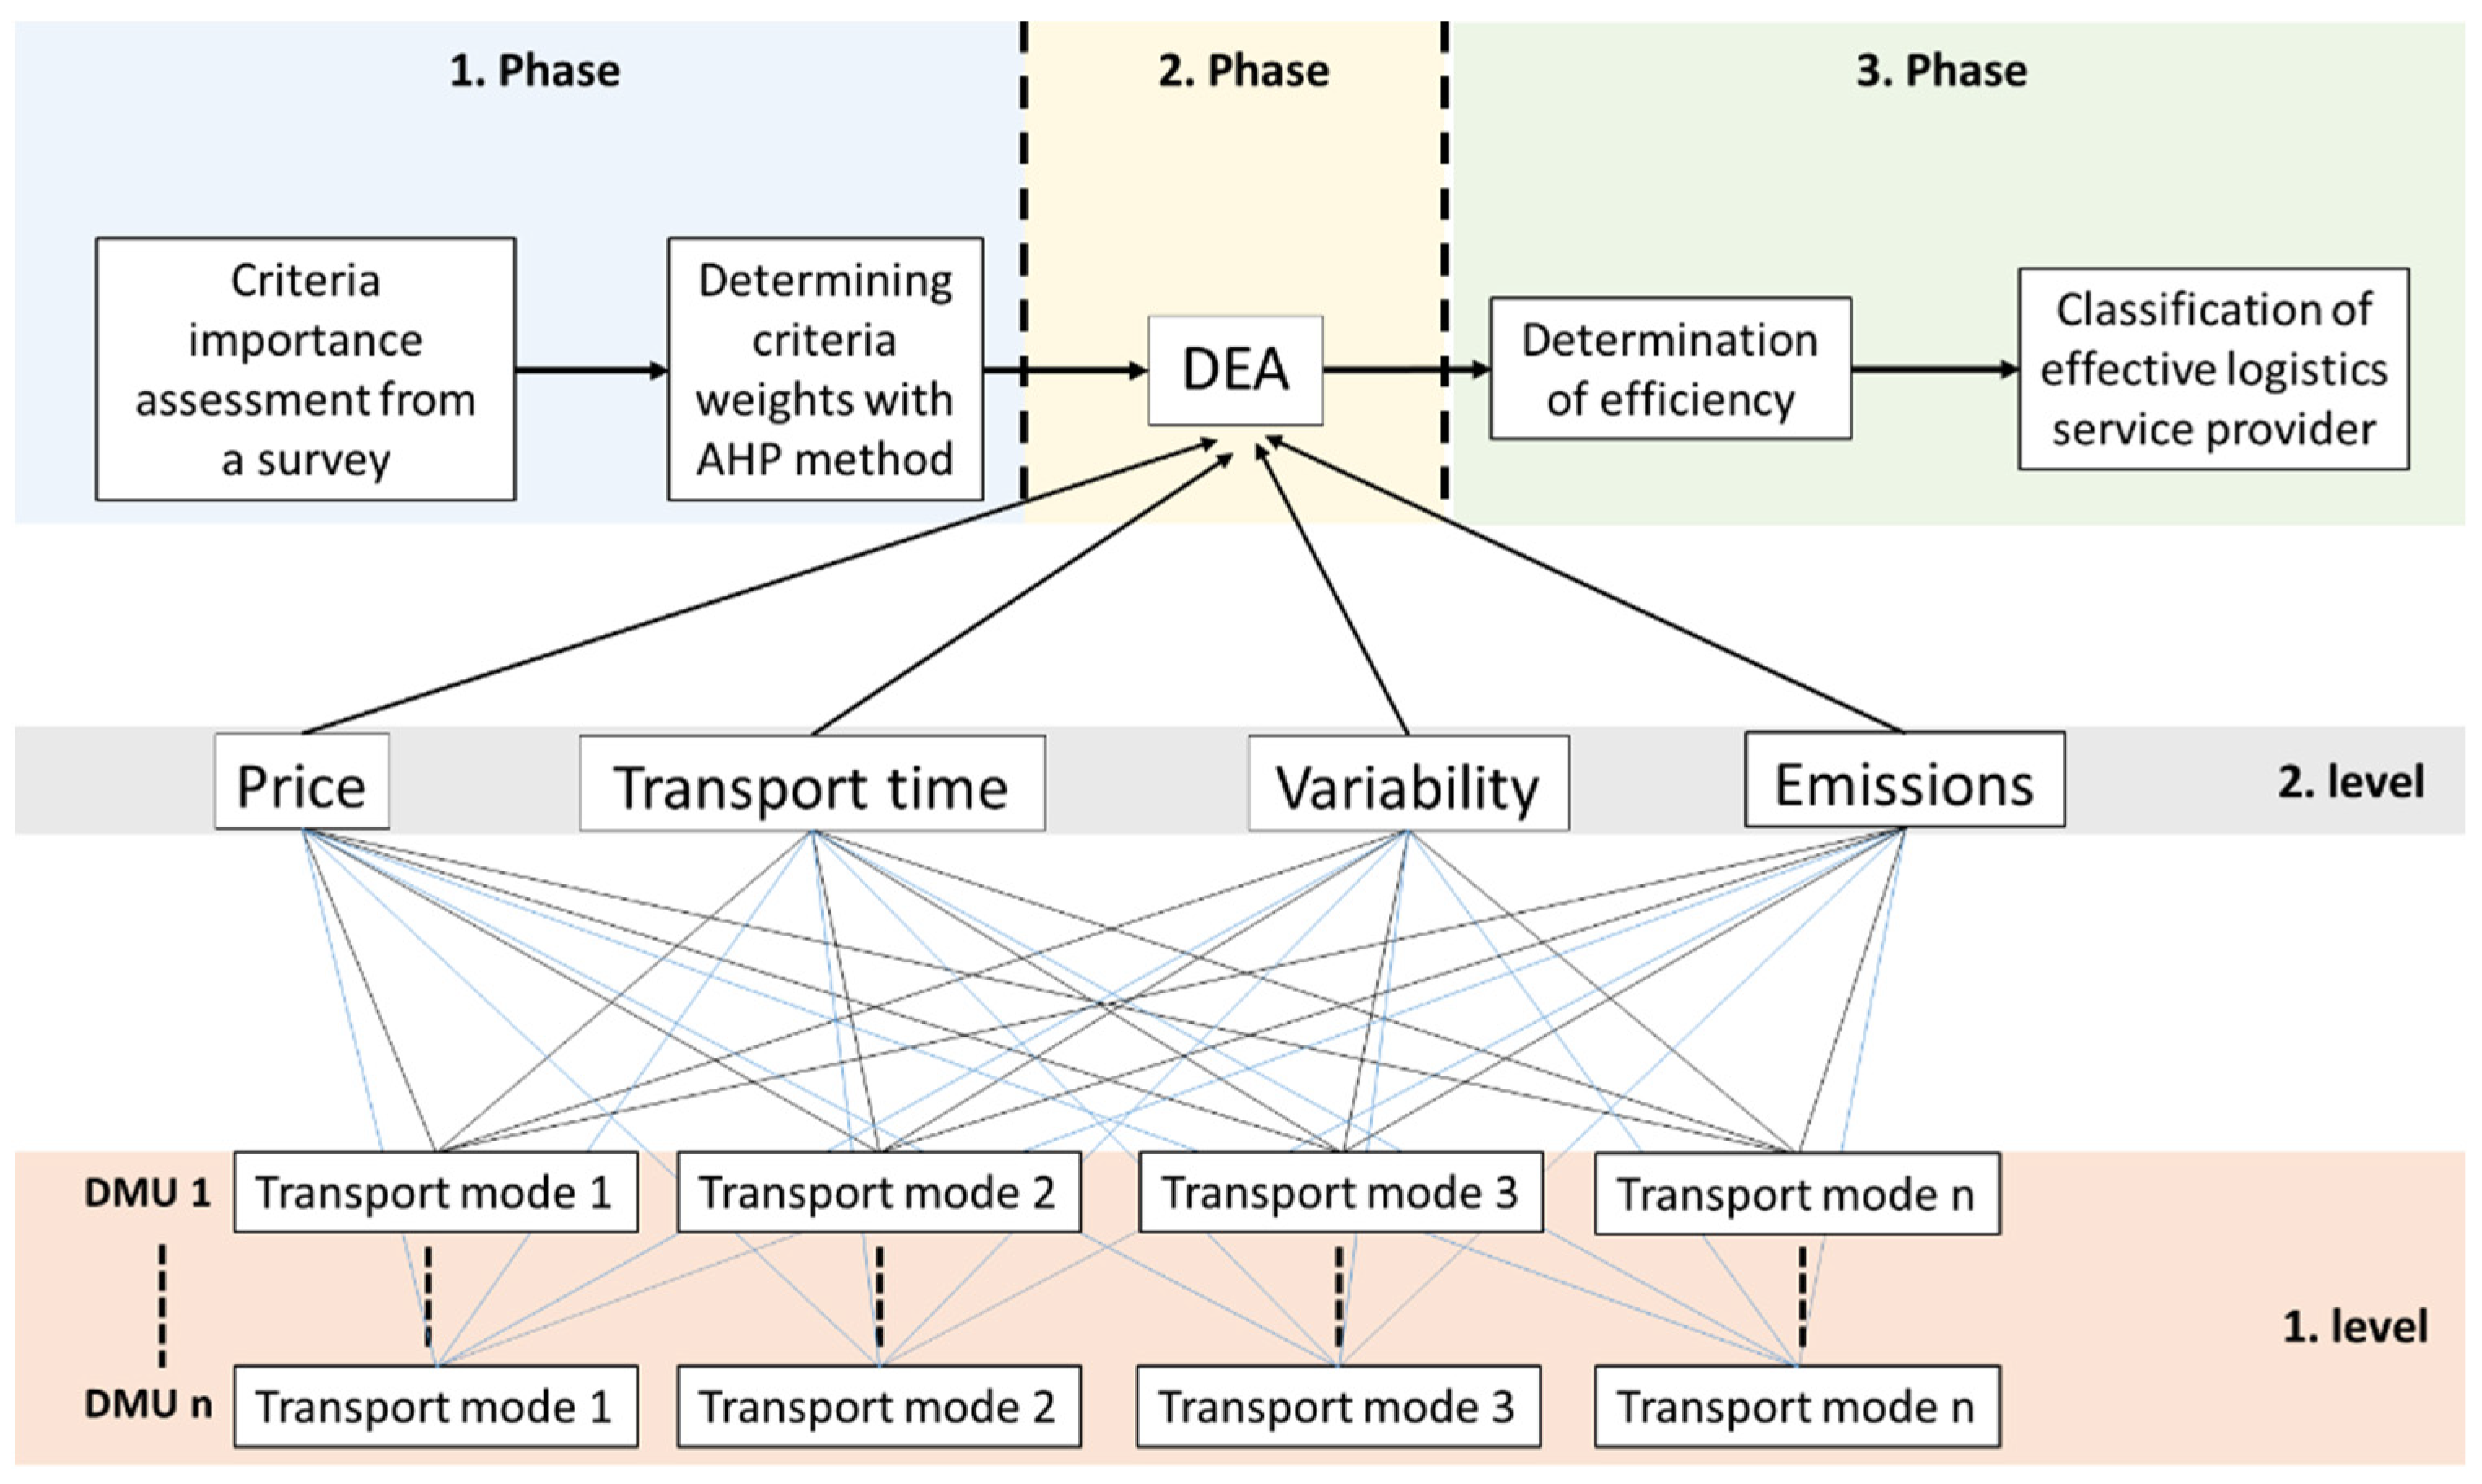
Based on the facts presented in this paper and the fact that we did not find any study combining the AHP-DEA method to select the most efficient intermodal transport chain in a given transport corridor, we decided to investigate the environmental, economic, and time competitiveness of LSPs in intermodal freight transport (maritime-road or maritime-rail) considering the differences in direct and indirect maritime services. As a novel approach, a three-level, two-stage model is used, which is a combination of distance-based analytical hierarchy process/data envelopment analysis (AHP-DEA) that considers several variables based on their relative efficiency. As a case study, data on intermodal transport chains from the Far East to European hinterland markets via the Port of Koper are analyzed and compared. Both quantitative and qualitative methods were used to collect data from the LSP. Combining the results from the survey with the distance-based, integrated AHP-DEA (data enveloped analysis) multi-criteria method provides a deeper understanding of existing market conditions, with suggestions for further research.
In the following section, the research methods and parameter settings of DEA are introduced, followed by the presentation of the case study and the results. The final section discusses the results, with key findings and recommendations for further research.

2. Materials and Methods

2.1. A Multi-Criteria Approach by Using AHP-DEA Methods

Although the environmental criteria in the decision process regarding the use of a transport mode and optimal transport routes have been the subject of some scientific articles [32], we have not found one that also considers the reliability of the service and the possibility of entering the ratio of the importance of the criteria. Therefore, we propose a novel approach that fills the aforementioned gap and provides users with information about the most efficient intermodal transport chain. Moreover, the input of the different criteria ratios opens different perspectives on certain priorities (environmental, economic, temporal) under which a given intermodal transport chain can be considered and aligned with the policy of the company purchasing the transport services.
The approach presented (Figure 1) is divided into three phases and two levels. The first phase consists of two steps. In the first step, the importance of the criteria must be determined based on the quantitative analysis of a survey. A distance-based analytical hierarchy process with data envelopment analysis (AHP-DEA) has been employed. This approach, proposed in the study by Bajec [38], is user-friendly and reliable, requiring much less effort from respondents in regards to sorting the predefined criteria in descending order than do pairwise comparisons. Moreover, this method is clear and easy to understand, since it is based on Saaty’s systematic AHP tree structure [39]. In the second step of the first phase, the AHP method is used to obtain criteria weights which are later used in the second phase to reduce the low discriminatory power of the DEA method. In addition to the proposed approach, the method preserves the AHP consistency of the maximum eigenvalues. To verify the respondents’ results, a consistency ratio (CR) must be calculated to evaluate the transitivity of the order of criteria preferences. The consistency ratio is a tool used to evaluate the transitivity of the criteria preference order, which is closely related to the knowledge of the experts and, at the same time, their objectivity in decision making. The consistency ratio is calculated as the quotient between the consistency index and the randomness index. In the case of consistency, CR must be equal to or less than 0.1.
The second phase consists of two levels of inputs that form the basis for the DEA analysis. At the first level, several intermodal transport chains are selected, consisting of different combinations of transport modes, to be compared in terms of their relative efficiency. At the second level, these intermodal chains are considered with respect to the criteria of price (P), transportation time (TT), variability (R), and emissions (E), forming the basis for the analysis of DEA, and usually referred to as decision making units (DMU). Some of them are interdependent, which means that a shorter time increases emissions in the case of a higher sailing speed, while, on the other hand, a longer transport time offered by maritime transport companies could provide greater reliability. Emissions are calculated for each segment of the intermodal transport chain, in our case, using EcoTransIT World (ETW) software. Although there are other environmental calculators on the market, during the testing phase of the last two years, we came to the conclusion that ETW provides consistent, detailed, and reliable results, while also being easy to use. The basis for calculating emissions in the ETW calculator is the standard guideline EN 16528 [40]. The ETW calculator provides values for the environmental impact of transport in terms of CO2 emissions, GHG emissions as CO2 equivalent and other pollutants.
In the third phase, the determination of efficiency for individual intermodal transport chains, from the most to the least efficient transport chain, is shown and classified. The final result of the DEA analysis is the provision of a scale from the most efficient to the relatively least efficient transport chain, taking into account the combination of variables (P, E, TT, V).

2.2. DEA Parameters Analysis

Since the product in the transportation service must overcome the distance, it can be considered as the initial value in the DEA parameter settings. In order to perform the DEA analysis, it is necessary to define the boundary conditions with the connections between the input and output variables based on the characteristics of the transportation services. One of the boundary conditions that must be satisfied is isotonicity, i.e., that a positive change in the inputs is reflected in a positive change in the outputs, or that the outputs rtetain at least the same value. The interpretation of this condition is inconsistent with the objective of this study, since from this perspective, an increase in transportation time, variability in transportation output, emissions, and price translates into an increase in transportation distance. Considering this concept, the dependent and independent variables were exchanged. This was easy to accomplish, since DEA is a nonparametric analysis, but such an operation would not be possible in a statistical analysis. The explanation for these operations lies in an input-oriented DEA model and the unchangeable constant variable of output. The input-oriented DEA model attempts to accomplish as much as possible with as few resources as feasible. Since transportation successfully combines multiple modes of transportation into a route, a transportation route could be considered an output with a fixed variable. The transport route can also affect the production value of the transported goods, as a longer transport route leads to larger inventories and consequently, lower revenues, which was also found in a study by Milewski [40].
From the tests with DEA, it can be concluded that the efficiency is the same regarding the selected routes, and that the main differences in efficiency are in emissions, price, transportation time and variability of transportation times for the selected intermodal transport chain combinations. Consequently, the main objective is to minimize all inputs on a transportation route to a given destination. Since all routes attempt to travel the shortest distance and consequently minimize energy consumption, which is inevitably connected with emissions, a real value with a positive constant greater than 0 could be used. For our DEA analysis, we used a uniform output with output = 1. Considering it as a constant and unique output variable that cannot be affected by any other output variable because it is the same value, the relationship between variable input and constant output depends solely on the inputs. Moreover, using 1 as a positive constant for the output does not affect the isotonicity rule. The distance specified as a fixed value means that the efficiency test method, which seeks the shortest possible distance between the starting point and the ending point, including intermodal nodes, focuses on the objective of minimizing the input data obtained by appropriate combinations of inputs (price, emissions, transportation time, variability). Therefore, the DEA settings can be represented by the following expression:
D   P ,   E ,   TT ,   V
where it is valid:
-
the set distance D is an output divided with the following inputs: price (P), emissions (E), transportation time (TT), and variability (V).
The classical DEA method usually assumes that all inputs and outputs are discretionary (controlled) and can be changed at the discretion of the managers. However, in transportation, there are issues that often involve non-discretionary inputs or outputs that are beyond the control of DMU management or decision makers in the transport chain, but at the same time, should be considered in the performance evaluation to ensure fair comparisons. To better understand the options of the software in defining features for calculating the DEA analysis, we describe below which variables we treat as discretionary and which we treat as non-discretionary. There are several variables whose magnitude can be influenced by the capabilities of the decision maker/transport planner. The price of transportation (P) is the input value that depends heavily on negotiation skills, business experience, internal agreements, information, and experience in selecting the transportation company in the transportation services market, and is therefore a controlled value. An additional controlled input is the emissions (E) generated during the execution of the transport, which are influenced by the decision maker through the choice of the appropriate mode of transport and possible route. Transportation time (TT) depends on the transport modality and route and is controlled, to some extent, by the decision maker with the goal of choosing the optimal route to minimize costs and emissions. However, the decision maker has no control over unexpected events that may occur along the route, increasing the duration of the transport (e.g., the blockage of the Suez Canal in 2021). Although TT is a contractual arrangement, there is no guarantee that it will actually be implemented as specified in the contract, despite the positive intent of the carrier, and thus it is considered an uncontrolled input variable. Moreover, as an uncontrolled input variable, TT has less impact on the calculation of final efficiency than other input variables. Similarly related to TT is variability (V), which tells us how large the average deviation of the actual TT is from the one estimated. The data on V are calculated based on the reliability of the transportation route previously used by each carrier, which are publicly available, e.g., on the Sea-Intelligence website [41]. The higher the reliability value, the more reliable or on-time the company is. However, since we minimize inputs in the DEA method, we introduced a V factor that has an inverse correlation with reliability, i.e., the lower the value, the more reliable the service. Consequently, the decision maker can influence the magnitude of V at his discretion by choosing a smaller value for the carrier, which is why this input is referred to as a controlled value. Another limitation in performing the analysis is the variable specifics. Since a higher speed reduces TT and causes higher GHG emissions, some variables could be directly dependent. However, a shorter TT can also be achieved by reducing the number of ports in a maritime transport loop, whereby the sailing speed can be lower. Such operational and commercial data are not directly available to the LSPs. Moreover, Beškovnik, and Golnar [42] highlighted that the maritime transport price does not depend on the distance, but is mainly determined by the availability and accessibility of the ship’s space. Therefore, the correlation between price and distance in maritime transport is much lower than in road or rail transport, where this correlation is very high. Therefore, the AHP-DEA method for analyzing selected variables allows for evaluation in a more user-friendly format.

2.3. Case Study: Intermodal Chains Analysis from the Far East to Central Europe via the North Adriatic

The case study concerns a very important transport route between Asia and Europe, passing through the northern Adriatic Sea. Indeed, many important global supply chains to the markets of Central Europe pass through this route. Consequently, this study investigates the environmental, economic, and temporal competitiveness of intermodal transport routes, all from the port of loading (POL) in Shanghai (CNSHA) to the port of discharge (POD) in Koper (SIKOP) and the hinterland terminal (HT) in Dunajská Streda (Slovakia), by using a multi-criteria approach AHP-DEA to evaluate a sustainable intermodal transport chain. As input for the calculation of AHP weights, a questionnaire was prepared and sent to 85 LSPs in Slovenia. The questionnaire was available on the web questionnaire platform 1ka.si [43] for three months (March to May 2022). In the meantime, 40 responses were received, with 14 respondents fully completing the questionnaire. In the questionnaire, respondents had to sort four given criteria into descending order: price (C1), transportation time (C2), emissions (C3), and variability (C4). The rating of the criteria by importance, using weights, was calculated based on the distance-based analytical hierarchy process proposed in the study by Bajec [38].
To conduct a DEA analysis, 11 intermodal transport chains were studied and are shown on Table 1.
The different modes of the intermodal transport chain were selected based on origin and destination. The selected routes include different combinations (Figure 2) combining direct and indirect maritime transport (via the hubs of Piraeus/Greece, Freeport/Malta, and Damietta/Egypt) with rail or road transport offered by different transport companies. The objective is to identify the most efficient combination of intermodal transport chains, using the evaluation criteria of P, E, TT, and V. The analysis of these criteria is based on a comparison of GHG (greenhouse gases) emissions, transportation time, and transport costs. GHG emissions are presented in calculation results as an equivalent emission of CO2 (CO2). The calculation of emissions was performed for the transport of a container weighing 14 t/TEU (transport equivalent unit). For the determination of the transport route and price, FOB Incoterms terms and conditions were used up to the intermodal terminal in the hinterland, excluding the last mile of delivery from the HT by truck to the consignee.
The calculation of emissions did not take into account the pre-carriage to the POL and the last mile from the HT to the recipients. Despite the mentioned adjustment, the emissions generated at the transshipment points were taken into account. This adjustment allows us to obtain more comparable and realistic values that are not biased by the values of congested road traffic in Asia that occur when goods are delivered to the POL. The calculation of the total intermodal transport chain was split between direct or indirect maritime transport and road or rail transport for land transport from the POD to the HT. The unit emissions for maritime transport refer to the ship used and its capacity, i.e., an ultra large container vessel (ULCV) of >14.5 K TEU and a Suezmax ship of >7 K TEU for direct maritime transport to POD Koper and to the transshipment ports of Damietta, Freeport, and Piraeus. A feeder vessel was selected for feeder traffic from the Mediterranean sea hub to the POD, as smaller container vessels are currently used in the Adriatic loop. The selection of these ships was based on software possibilities, taking into account that the cargo space of the ship is used most economically and that the emission calculation for the selected port is available (slow speed 20%, fully loaded). This means that the selected ship can dock at the port. The calculation of emissions for rail transport was calculated with the following parameters for a container train of 1000 t, using electricity of class EU UIC 2, with a load factor of 80%, and 0% empty trip. Similarly, for the calculation of emissions in road transport, a diesel truck with the emission standard EURO 6 was chosen, with a load factor of 80%, and 0% empty trip.
All transportation pricing was obtained in November 2021 with requests to CLs and LSPs for the intermodal transportation of containers with general commodities from the POL to the POD, with on-carriage by rail and truck to the HT. Ocean transportation costs fluctuate throughout the year, reflecting the current demand for shipping space during the COVID-19 pandemic. The outbreak of the global pandemic COVID-19 had several impacts on transportation services, mainly disrupting established transport flows and demand. As a result, maritime transport prices increased 7 to 10 times compared to pre-pandemic prices. Rail and road prices did not increase as much, so their impact on the overall price was less pronounced. TT was determined from schedules on transportation company websites and from quotes received. The variability factor was calculated using the reliability of schedules from the Sea-Intelligence report [41].

3. Results

According to the results of a questionnaire, respondents sorted four predefined criteria in descending order: price (C1), transportation time (C2), emissions (C3), and variability (C4). The evaluation of the criteria according to importance and weighting is shown in Table 2. In order to fully trust the obtained weights of the criteria, the consistency of the answers was checked. The calculated value of the consistency index is CR = 0.39, which is higher than 0.1, indicating greater inconsistency among respondents. CR may be higher because respondents may have different views of the problem, different expertise, or a lack of objectivity in working under difficult market conditions. Another possible explanation could be that all criteria are nearly equally important, while the environment is of least importance to the respondents.
The results of the analysis using DEA can be presented as a percentage of technical efficiency (Table 3). DEA results also provide an overview of the improvements needed regarding each variable compared to efficient DMUs. The analysis consists of several variables from the environmental, temporal, financial, and variability factors used as inputs. It also satisfies the rule that the number of DMUs must be at least 2 times higher than the sum of the inputs and outputs. Since the analysis meets both conditions, it can be concluded that it is a reliable source of information.
The analysis of the presented case study on transport routes to Dunajská Streda using DEA revealed four optimal, efficient combinations of direct/indirect maritime transport in combination with rail or road transport. A closer look at the results shows that the other DMUs are not far from efficient, with the worst efficiency achieved by DMU 6, with 79.29%. As can be seen, three input values (E, P, and V) need to be improved to a relatively high extent (29.79%, 20.71%, and 20.71%, respectively) to achieve full efficiency, while TT needs to be improved to a lesser extent (1.86%). The second-worst performing intermodal transport chain is DMU 7, which achieves an overall efficiency of 86.71%, with TT needing to be reduced by 6.55%, V by 13.29%, E by 20.04%, and P by 13.29%. Emissions could be reduced either by technical efficiency measures on a current ship or by increasing the already implemented slow steaming from 20% to 30% or more, but this would involve a change in TT that would eliminate a service provider from the competition. In general, TT could also be reduced by shortening the transportation routes, but in this case, the optimum has already been reached. DMU 2 performs the third worst, with 87.96% overall efficiency, requiring an improvement in both E and P by 12.04%, while V needs to be reduced by 14.93% to be competitive with other efficient counterparts. DMU 8 performs the fourth worst, needing to improve TT by 9.09%, while P and E must be decreased by 4.93% and 32.10%, respectively. The V of DMU 8 needs to be improved by 1.96%. This means that ship’s efficiency needs to be improved, and TT needs to be shortened by about 3 days, while minimizing delays in the estimated time of arrival.
DMU 9 and DMU 11 perform the fifth-worst service, both achieving an overall efficiency of 98.12%. To become more efficient, DMU 9 should decrease TT by 0.53% and both P and V by 1.88%. The E value should be reduced by slightly more than a quarter of the current emissions (27.44%). To become an efficient transport chain, DMU 11 needs to reduce E by 20.18%, P and V by 1.88%, and TT by 11.58%, which is equal to approximately 4 days. DMU 4 is very competitive with the efficiency of DMU 1, DMU 3, DMU 5, and DMU 10, which have been recognized as efficient intermodal transport chains. This DMU has an overall efficiency of 99.35%, which requires a reduction in E by 5.87% and P by 0.65% while reducing TT by 9.43%, or approximately 3.5 days.

4. Discussion

The results, obtained using a multi-criteria approach with the AHP-DEA method, represent a list of efficient transport chains that can be used as a decision support tool for decision makers when considering transport chains from different perspectives (environmental, economic, temporal, variability). Therefore, the approach promotes the principle of minimum input as the ultimate goal of all criteria in the design of intermodal transport chains. Moreover, the optimal intermodal transport chain selected by the model is characterized as the most efficient or sustainable one. The results of the analysis using the integrated method approach AHP-DEA can be presented in the form of a technical efficiency percentage plot (Table 3). Although the “rule of thumb” often used in the DEA method is satisfied with twice as many DMUs as the sum of inputs and outputs, we add additional theoretical DMU12 that could serve as a representative of the intermodal transport chain in the period following the COVID-19 pandemic market revival and the simultaneous enactment of stricter environmental legislation. As a result, the following criteria for E were established, where a 10% improvement represents 1 [T] of GHG emissions as CO2 equivalent. In terms of TT, not much can be done, since slow steaming and the shortest possible route is already in place; therefore, a minimum TT of DMUs was chosen for comparison, at 30 days. The price of transportation services was projected to decrease by 50% in the average of DMUs in the comparison, as we assume that the market will normalize and prices will decrease accordingly. Considering the V (reliability) of maritime transport providers, it is expected to decrease from the current average of 72% to at least 50%. Maritime transport typically did not pose any major on-time delivery risks in global supply chains. For comparison, according to the Sea-Intelligence website, the average V (reliability) in the pre-COVID-19 situation (2019 and 2020) was 0.22 and 0.36, respectively.
Analysis of the results using the multi-criteria integrated approach AHP-DEA and the applied weighting (Table 4) shows that the greatest improvements need to be made in reducing the P of the service, followed by service V and E. To be efficient, all DMUs would need to reduce V between 22.96% and 40.33% and P between 41.76% and 60.28%. Given the current geopolitical situation and the current decline in global transport demand, we expect V to continue to decline and stabilize by the end of 2022 and into 2023. As a result, prices are expected to decline, but are less likely to reach pre-pandemic levels. Almost all compared DMUs need to improve their emissions, in a range of from 9.09% to 43.18%. The fastest action to reduce E could be to continue to use the slow-speed strategy. In addition to the possible strategies of ship decarbonization, Bortuzzo et al. [43] mention the energy efficiency existing ship index (EEXI), which was introduced by the IMO and presents a new technical measure for existing ships measured in grams of CO2 per transport trip. In that way, every vessel is individually considered according to its operating profile in terms of which technical solutions could be applied to improve their EEXI. With further slow-steaming strategies, TT would increase, negatively impacting longer supply chains. This is somewhat related to the need to reduce TT between 9.09 and 16.67%. In practice, this corresponds to a shorter TT by about 3 to 4 days, which would not be achievable with additional slow steaming. Of course, a shorter TT can be achieved at the transshipment points by faster processes.
By incorporating the criteria weights identified by the AHP method, the multi-criteria approach could provide results from different perspectives, e.g., more price-oriented or environmentally oriented, thus expanding the possibilities of its application to all stakeholders in the intermodal transport chain, or the needs of end customers at the given time. It should be noted that due to the fact that CR is 0.39, indicating greater inconsistency among respondents, these results should be considered as a guide for experts in decision making. The reasons for such CR could be the representativeness of the sample, which does not consist of enough experts, or the fact that in our study case, the criteria are equally important. The selection of criteria included in the multi-criteria approach depends on the current post-pandemic situation in the market, market needs, and stakeholders. Therefore, the application of criteria other than those used in this study is possible. In a similar DEA model, Vukić et al. [14] also chose distance for an output, as we did in our study, and set the output to a constant value of 1 when determining the optimal green transport route. Similarly, Alves Junior et al. [39] also chose a unitary output (output = 1), where the efficiency was used as a main criterion for routing. Clearly, both studies were input oriented. Of the other criteria, the distance criterion varies the least because the constraints of the case study limit the model to transport to the port of Koper and define the corridor in which routes are generated. Therefore, the multi-criteria approach serves as a guide for decision makers to find the most sustainable solution for the organization of the transport chain, also considering strategic and financial consequences.
A limitation of the study could be in the application of the DEA method, since it provides the best results when the analysis of technical efficiency is performed for decision-making units (DMUs) that are comparable to each other, i.e., compared in the same class. Another limitation relates to the weighting of the E, TT, and P data, which can vary greatly from decision maker to decision maker, therefore adding burden/complexity when used as a tool for day-to-day operational decisions. Another limitation is found in the use of an emissions calculator and its ability to provide as much detailed data as possible regarding emissions, transshipment combinations, etc. The modularity of the multi-criteria approach allows for the use of a different calculation tool if a more advanced tool is found in the future. Other limitations could also be the traffic-related uncertainties that may occur due to bad weather conditions, traffic congestion, and accidents (e.g., the Suez Canal blockage in March 2021), which are difficult to predict. These imponderables mainly affect the transportation time and are usually not taken into account in the ETA (estimated time of arrival) of the LSP schedules. Considering all the uncertainties and the use of the same transport corridor through the Suez Canal to the port of Koper, it was assumed that all compared intermodal transport chains provide approximately the same quality of transport. Consequently, the transportation time variable in DEA was characterized as uncontrolled, meaning that it has a lower impact than other inputs. In addition to reduce uncertainty, the criterion of variability was also introduced to evaluate the efficient DMUs according to their consistency rate. Consistency in logistics chains also means sustainability, as shipments are regular, and thus, there is no need to increase inventory levels.
Consequently, environmental sustainability plays an important role in selecting the most efficient transport chain. The European Union, through its regulations, is pushing more and more for the reduction in emission levels, as well as the inclusion of all the negative effects of transport, presented as external costs. These costs are usually indirectly passed on to the customer, but such an implementation of environmental sustainability could lead to more environmentally friendly transport services, as more companies will see this as a business advantage.

5. Conclusions

The question of how many emissions are generated in the intermodal transport chain is becoming increasingly important. Considering the environmental impact of the transport chain, along with the traditional decision factors, could present the transport chain organizer with the problem of choosing the most efficient route yielding the shortest possible time. To solve this problem, we developed a new three-phase multi-criteria approach with two levels, which is a combination of distance-based analytical hierarchy process/data envelopment analysis (AHP-DEA) that considers multiple variables based on their relative efficiency and ranks them from highest to lowest efficiency. The added value of this multi-criteria approach is that the weighting of the criteria is based on the collected opinions of the LSPs regarding the realistic market demand during the COVID-19 pandemic, especially because opinions are retrieved only via sorting the criteria from most to least important. In the presented approach, four main variables were used: price, emissions, transportation time, and service variability. Among the mentioned variables, the use of the variability factor brings a new perspective to the classic decision-making process, as it has proven to be indispensable, especially in the recent COVID-19 period, when supply chains (maritime-land) have been heavily disrupted. In principle, our multi-criteria approach favors a more efficient, sustainable, and more reliable intermodal transport chain within a transportation corridor.
In the case study presented, the results show that the most efficient combination on the important transport corridor from China through the Suez Canal and on to the northern Adriatic Sea to the final destination of Dunajská Streda is the intermodal transport chain of DMU 1, consisting of direct sea transport and rail, DMU 3, involving indirect sea transport and rail, DMU 5, consisting of direct sea transport and roads, and DMU 10, consisting of indirect sea transport and roads. It can be seen that indirect maritime transport services, with additional transshipment, can be competitive with direct maritime transport services when different variables are taken into account. This is also true for road and rail transport, as both options are present in the most efficient intermodal transport chain. Other combinations of the intermodal transport chain (DMU 2, DMU 4, DMU 6, DMU 7, DMU 8, DMU 9, DMU 11) were inefficient, with a 1–20% probability of improving their efficiency. The results of applying our multi-criteria approach highlight the scientific and professional contribution to the analysis and selection of the most sustainable intermodal transport chain. Due to the usability and simplicity of the approach, it could help decision makers in their operational choices. In this way, a professional contribution is achieved. The scientific contribution is evident in the new approach of combining different methods in multi-criteria analysis. It can be concluded that the presented approach of distance-based AHP-DEA shows a greater discriminating power than conventional DEA and greater agility in day-to-day work, as the weights can be derived more quickly and effortlessly than by using the current methods.
The limitations of the presented approach lie in the weighting of inputs, which must either be determined by questionnaires from representatives of the transport industry, with a sufficiently low consistency rate, or carefully selected by experts in the field. The data-based model is not limited to either freight volume or transportation route. The present scientific approach can be further elaborated by further evaluations at the level of sustainable intermodal transport chains. This will be done as part of future project work regarding the evaluation of sustainable transport chains.

Author Contributions

Conceptualization, M.G.; methodology, M.G. and B.B.; validation, B.B.; for-mal analysis, M.G.; investigation, M.G. and B.B.; resources, M.G.; data curation, M.G.; writing—original draft preparation, M.G.; writing—review and editing, M.G. and B.B.; visualization, M.G.; supervision, M.G. and B.B. All authors have read and agreed to the published version of the manuscript.

Funding

The research received no external funding.

Institutional Review Board Statement

Not applicable.

Informed Consent Statement

Not applicable.

Data Availability Statement

Not applicable.

Acknowledgments

The authors would like to thank third-party logistics service providers who respond to price queries for selected routes and other stakeholders who took the time to complete the questionnaires.

Conflicts of Interest

The authors declare no conflict of interest.

References

  1. Abbasi, M.; Nilsson, F. Developing Environmentally Sustainable Logistics. Transp. Res. Part D Transp. Environ. 2016, 46, 273–283. [Google Scholar] [CrossRef]
  2. European Strategy for Low-Emission Mobility; European Commission: Brussels, Belgium, 2016.
  3. López-Bermúdez, B.; Freire-Seoane, M.J.; Pais-Montes, C.; Lesta-Casal, E. Port-City Development: The Spanish Case. Trans. Marit. Sci. 2020, 9, 82–89. [Google Scholar] [CrossRef] [Green Version]
  4. 2020 Annual Report from the European Commission on CO2 Emissions from Maritime Transport; European Commission: Brussels, Belgium, 2021; p. 80.
  5. Fourth IMO GHG Study 2020 Full Report; International Maritime Organization (IMO): London, UK, 2020; p. 524.
  6. Paris Agreement. In Proceedings of the Report of the Conference of the Parties to the United Nations Framework Convention on Climate Change (21st Session), Paris, France, 11 December 2015; Volume 4, p. 2017.
  7. Evaluation of White Paper Roadmap to a Single European Transport Area—Towards a Competitive and Resource Efficient Transport System; European Commission: Brussels, Belgium, 2020; p. 108.
  8. Wang, S.; Psaraftis, H.N.; Qi, J. Paradox of International Maritime Organization’s Carbon Intensity Indicator. Commun. Transp. Res. 2021, 1, 100005. [Google Scholar] [CrossRef]
  9. Sirotić, M.; Žuškin, S.; Rudan, I.; Stocchetti, A. Methodology for the Sustainable Development of the Italy-Croatia Cross-Border Area: Sustainable and Multimodal/Cross-Border Passenger Services. Sustainability 2021, 13, 11895. [Google Scholar] [CrossRef]
  10. Yayla, A.Y.; Oztekin, A.; Gumus, A.T.; Gunasekaran, A. A Hybrid Data Analytic Methodology for 3PL Transportation Provider Evaluation Using Fuzzy Multi-Criteria Decision Making. Int. J. Prod. Res. 2015, 53, 6097–6113. [Google Scholar] [CrossRef]
  11. Celik, E.; Akyuz, E. An Interval Type-2 Fuzzy AHP and TOPSIS Methods for Decision-Making Problems in Maritime Transportation Engineering: The Case of Ship Loader. Ocean. Eng. 2018, 155, 371–381. [Google Scholar] [CrossRef]
  12. Shakourloo, A.; Kazemi, A.; Javad, M.O.M. A New Model for More Effective Supplier Selection and Remanufacturing Process in a Closed-Loop Supply Chain. Appl. Math. Model. 2016, 40, 9914–9931. [Google Scholar] [CrossRef]
  13. Awasthi, A.; Govindan, K.; Gold, S. Multi-Tier Sustainable Global Supplier Selection Using a Fuzzy AHP-VIKOR Based Approach. Int. J. Prod. Econ. 2018, 195, 106–117. [Google Scholar] [CrossRef] [Green Version]
  14. Vukić, L.; Poletan Jugović, T.; Guidi, G.; Oblak, R. Model of Determining the Optimal, Green Transport Route among Alternatives: Data Envelopment Analysis Settings. J. Mar. Sci. Eng. 2020, 8, 735. [Google Scholar] [CrossRef]
  15. Jugović, A.; Cukrov, M.; Poletan Jugović, T. Multi-Criteria Optimization of Motorways of the Sea in the Function of the Environment Protection: Case Study of Croatia. Promet-Traffic Transp. 2017, 29, 463–468. [Google Scholar] [CrossRef]
  16. Wiegmans, B.; Janic, M. Analysis, Modeling, and Assessing Performances of Supply Chains Served by Long-Distance Freight Transport Corridors. Int. J. Sustain. Transp. 2019, 13, 278–293. [Google Scholar] [CrossRef] [Green Version]
  17. Panagakos, G.; Psaraftis, H.N. Model-Based Corridor Performance Analysis—An Application to a European Case. Eur. J. Transp. Infrastruct. Res. 2017, 17, 225–247. [Google Scholar] [CrossRef]
  18. Gohari, A.; Ahmad, A.B.; Balasbaneh, A.T.; Gohari, A.; Hasan, R.; Sholagberu, A.T. Significance of Intermodal Freight Modal Choice Criteria: MCDM-Based Decision Support Models and SP-Based Modal Shift Policies. Transp. Policy 2022, 121, 46–60. [Google Scholar] [CrossRef]
  19. Neumann, T. Comparative Analysis of Long-Distance Transportation with the Example of Sea and Rail Transport. Energies 2021, 14, 1689. [Google Scholar] [CrossRef]
  20. Feo, M.; Espino, R.; García, L. An Stated Preference Analysis of Spanish Freight Forwarders Modal Choice on the South-West Europe Motorway of the Sea. Transp. Policy 2011, 18, 60–67. [Google Scholar] [CrossRef]
  21. Arencibia, A.I.; Feo-Valero, M.; García-Menéndez, L.; Román, C. Modelling Mode Choice for Freight Transport Using Advanced Choice Experiments. Transp. Res. Part A Policy Pract. 2015, 75, 252–267. [Google Scholar] [CrossRef] [Green Version]
  22. Reis, V. Analysis of Mode Choice Variables in Short-Distance Intermodal Freight Transport Using an Agent-Based Model. Transp. Res. Part A Policy Pract. 2014, 61, 100–120. [Google Scholar] [CrossRef]
  23. Zhang, R.; Jian, W.; Tavasszy, L. Estimation of Network Level Benefits of Reliability Improvements in Intermodal Freight Transport. Res. Transp. Econ. 2018, 70, 1–8. [Google Scholar] [CrossRef]
  24. Kramarz, M.; Przybylska, E.; Wolny, M. Reliability of the Intermodal Transport Network under Disrupted Conditions in the Rail Freight Transport. Res. Transp. Bus. Manag. 2022, 44, 100686. [Google Scholar] [CrossRef]
  25. Hrušovský, M.; Demir, E.; Jammernegg, W.; Van Woensel, T. Real-Time Disruption Management Approach for Intermodal Freight Transportation. J. Clean. Prod. 2021, 280, 124826. [Google Scholar] [CrossRef]
  26. Multaharju, S.; Lintukangas, K.; Hallikas, J.; Kähkönen, A.-K. Sustainability-Related Risk Management in Buying Logistics Services: An Exploratory Cross-Case Analysis. Int. J. Logist. Manag. 2017, 28, 1351–1367. [Google Scholar] [CrossRef]
  27. Wolf, C.; Seuring, S. Environmental Impacts as Buying Criteria for Third Party Logistical Services. Int. J. Phys. Dist. Log. Manag. 2010, 40, 84–102. [Google Scholar] [CrossRef] [Green Version]
  28. Lammgård, C. Intermodal Train Services: A Business Challenge and a Measure for Decarbonisation for Logistics Service Providers. Res. Transp. Bus. Manag. 2012, 5, 48–56. [Google Scholar] [CrossRef]
  29. Bask, A.; Rajahonka, M.; Laari, S.; Solakivi, T.; Töyli, J.; Ojala, L. Environmental Sustainability in Shipper-LSP Relationships. J. Clean. Prod. 2018, 172, 2986–2998. [Google Scholar] [CrossRef]
  30. Björklund, M.; Forslund, H. The Inclusion of Environmental Performance in Transport Contracts. Manag. Environ. Qual. 2013, 24, 214–227. [Google Scholar] [CrossRef]
  31. Jazairy, A. Aligning the Purchase of Green Logistics Practices between Shippers and Logistics Service Providers. Transp. Res. Part D Transp. Environ. 2020, 82, 102305. [Google Scholar] [CrossRef]
  32. Björklund, M.; Forslund, H. Challenges Addressed by Swedish Third-Party Logistics Providers Conducting Sustainable Logistics Business Cases. Sustainability 2019, 11, 2654. [Google Scholar] [CrossRef] [Green Version]
  33. Jazairy, A.; von Haartman, R. Analysing the Institutional Pressures on Shippers and Logistics Service Providers to Implement Green Supply Chain Management Practices. Int. J. Logist. Res. Appl. 2020, 23, 44–84. [Google Scholar] [CrossRef] [Green Version]
  34. Lai, P.; Potter, A.; Beynon, M.; Beresford, A. Evaluating the Efficiency Performance of Airports Using an Integrated AHP/DEA-AR Technique. Transp. Policy 2015, 42, 75–85. [Google Scholar] [CrossRef]
  35. Kaewfak, K.; Huynh, V.-N.; Ammarapala, V.; Ratisoontorn, N. A Risk Analysis Based on a Two-Stage Model of Fuzzy AHP-DEA for Multimodal Freight Transportation Systems. IEEE Access 2020, 8, 153756–153773. [Google Scholar] [CrossRef]
  36. Koohathongsumrit, N.; Meethom, W. Route Selection in Multimodal Transportation Networks: A Hybrid Multiple Criteria Decision-Making Approach. J. Ind. Prod. Eng. 2021, 38, 171–185. [Google Scholar] [CrossRef]
  37. Kengpol, A.; Tuammee, S.; Tuominen, M. The Development of a Framework for Route Selection in Multimodal Transportation. Int. J. Logist. Manag. 2014, 25, 581–610. [Google Scholar] [CrossRef]
  38. Bajec, P.; Tuljak-Suban, D.; Zalokar, E. A Distance-Based AHP-DEA Super-Efficiency Approach for Selecting an Electric Bike Sharing System Provider: One Step Closer to Sustainability and a Win–Win Effect for All Target Groups. Sustainability 2021, 13, 549. [Google Scholar] [CrossRef]
  39. Alves Junior, P.N.; Bartholomeu, D.B.; Cruz, J.C.; Caixeta-Filho, J.V.; Alves Junior, P.N.; Bartholomeu, D.B.; Cruz, J.C.; Caixeta-Filho, J.V. Efficiency as a Criterion for Optimizing Routes: A Two-Stage DEA-Routing Approach. In Proceedings of the 2019 Annual Meeting, Atlanta, GA, USA, 21–23 July 2019. [Google Scholar] [CrossRef]
  40. Milewski, D. Simulation as a Way of Optimizing a Delivery Size: Impact on the Profitability of an Enterprise. In 59 Scientific Journals of the Maritime University of Szczecin; Maritime University of Szczecin: Szczecin, Poland, 2019; Volume 131, pp. 92–99. [Google Scholar] [CrossRef]
  41. Sea-Intelligence. Available online: https://www.sea-intelligence.com/press-room (accessed on 29 June 2022).
  42. Beškovnik, B.; Golnar, M. Evaluating the Environmental Impact of Complex Intermodal Transport Chains. Environ. Eng. Manag. J. 2020, 19, 1131–1141. [Google Scholar] [CrossRef]
  43. Bortuzzo, V.; De Domenico, M.; Bucci, V. Strategies for Ship Decarbonisation: Technical Measure for Reducing Energy Efficiency Existing Ship Index. In Progress in Marine Science and Technology; Rizzuto, E., Ruggiero, V., Eds.; IOS Press: Amsterdam, The Netherlands, 2022; ISBN 978-1-64368-296-9. [Google Scholar]
Figure 1. Flowchart methodology.
Jmse 10 01644 g001
Figure 2. Overview of direct and indirect maritime transport in the Mediterranean area.
Jmse 10 01644 g002
Table 1. Composition overview of 11 intermodal transport chains studied.
Dunajská Streda ViaSea LegLand Leg
DMU 1KoperDirect (ULCV)Rail
DMU 2KoperDirect (Suezmax)Rail
DMU 3Piraeus-KoperIndirect (ULCV + Suezmax)Rail
DMU 4Damietta (Alexandria)-KoperIndirect (ULCV + Intercontinental)Rail
DMU 5KoperDirect (ULCV)Road
DMU 6KoperDirect (Suezmax)Road
DMU 7Piraeus-KoperIndirect (ULCV + Suezmax)Road
DMU 8Damietta (Alexandria)-KoperIndirect (ULCV + Intracontintal)Road
DMU 9KoperDirect (Suezmax)Road
DMU 10Malta-KoperIndirect (Suezmax + Intra-contninental)Road
DMU 11Malta-KoperIndirect (Suezmax + Intra-contninental)Rail
Table 2. Matrix of the pairwise comparison of intermodal transport criteria with the calculated weights.
C1C2C3C4Criteria Weights [%]
C1139 1 2 34.8
C2 1 3 18534.5
C3 1 9 1 8 1 1 9 2.9
C42 1 5 9127.8
Table 3. Results of DEA analysis, without applied AHP weights.
Potential Improvement
Overall EfficiencyGHG as CO2 Equiv.PriceTransport Time (Mari. + Rail/Road)Variability
DMU 1100%0%0%0%0%
DMU 287.96%−12.04%−12.04%0%−14.93%
DMU 3100%0%0%0%0%
DMU 499.35%−5.87%−0.65%−9.43%−0.65%
DMU 5100%0%0%0%0%
DMU 679.29%−29.79%−20.71%−1.86%−20.71%
DMU 786.71%−20.04%−13.29%−6.55%−13.29%
DMU 898.04%−32.10%−4.93%−9.09%−1.96%
DMU 998.12%−27.44%−1.88%−0.53%−1.88%
DMU 10100%0%0%0%0%
DMU 1198.12%−20.18%−1.88%−11.58%−1.88%
Table 4. Results with integrated DEA-AHP approach, with weights applied.
Potential Improvement
Overall EfficiencyGHG as CO2 Equiv.PriceTransport Time (Mari. + Rail/Road) Variability
DMU 160.42%−9.09%−55.40%0%−22.96%
DMU 247.06%−28.06%−56.07%−9.09%−40.33%
DMU 350.37%−18.03%−49.67%−14.29%−35.15%
DMU 454.50%−20.0%−52.77%−11.76%−24.47%
DMU 558.92%−31.97%−59.73%3.45%−22.96%
DMU 645.65%−43.18%−60.28%−6.25%−40.33%
DMU 747.96%−37.11%−55.12%−11.76%−35.15%
DMU 852.53%−38.27%−57.60%−9.09%−24.47%
DMU 957.47%−43.18%−48.94%−6.25%−26.69%
DMU 1060.45%−28.06%−41.76%−9.09%−26.69%
DMU 1152.23%−37.50%−48.94%−16.67%−26.69%
DMU 12100%0%0%0%0%
Publisher’s Note: MDPI stays neutral with regard to jurisdictional claims in published maps and institutional affiliations.

