Article

Estimation of the Benthic Habitat Zonation by Photo-Quadrat Image Analysis along the Fringing Reef of Weno Island, Chuuk, Micronesia

1
Jeju Marine Research Center, Korea Institute of Ocean Science & Technology, Jeju 63349, Korea
2
Marine Bio-Resources Research Unit, Korea Institute of Ocean Science & Technology, Busan 49111, Korea
3
Marine Security and Safety Research Center, Korea Institute of Ocean Science & Technology, Busan 49111, Korea
4
Marine Bigdata Center, Korea Institute of Ocean Science & Technology, Busan 49111, Korea
*
Author to whom correspondence should be addressed.
J. Mar. Sci. Eng. 2022, 10(11), 1643; https://doi.org/10.3390/jmse10111643
Submission received: 30 September 2022 / Revised: 19 October 2022 / Accepted: 27 October 2022 / Published: 3 November 2022
(This article belongs to the Special Issue Benthic Species and Habitats)

Abstract

:
Benthic habitat zonation is described from in situ observations and seabed photographs taken from the coastal area of Weno Island, Chuuk, Micronesia. Habitat groups, types, and boundaries are defined by visible substratum characteristics (i.e., in situ and by digital imaging of photo-quadrats along transect lines), and by cluster and ordination analyses using relative coverage percentage of identified classification categories. The statistical similarity between habitat groups is determined by Analysis of similarity (ANOSIM). Benthic habitat groups with significant influence on the determination of habitat type are isolated by the similarity percentage (SIMPER) test. In addition to the standard practices of using transect lines and collecting data in accordance with the already well-implemented and thoroughly-tested benthic habitat classification scheme for tropical reef monitoring, we applied simple statistics that enable comparative data interpretation. Our simple, repeatable methods provide a framework for benthic habitat-related monitoring research that allows the comparison of results across regions.

1. Introduction

Benthic habitat zonation is an important factor to consider in biodiversity assessments of coastal ecosystems, as the biogeography of habitats determines their structural complexity. This, in turn, influences the availability of nutritional resources and refuge, which leads to a distinct zonation of faunal assemblages, as well as the density and diversity of marine organisms [1,2]. Therefore, habitat zonation indirectly influences key drivers of community structure such as competitive biotic interactions (e.g., predator-prey, spatial competition). It may also mediate the impact of physical stressors, such as hydrodynamics or UV exposure [2]. Nevertheless, habitat zones are reciprocally linked by a functional and ecological interconnection. Therefore, understanding coastal habitats as interconnected unity, rather than an assortment of disparate, independent habitats, and knowing the dynamics of this interconnectivity, are essential to (1) ensure representative biodiversity results featuring good quality data, (2) determine how stressors may reconfigure coastal marine ecosystems [2], and (3) ensure conservation effectiveness through functional zoning [3].
Additionally, comprehensive data treatment that takes into account this mosaic nature of ecosystems is imperative to ensure successful assessments, which build the base for valid interpretations. Although a few studies have applied integrated habitat classification schemes that do consider the reciprocal linkage of habitats [4,5,6], generally, tropical marine research still tends to focus on each habitat separately (e.g., mangrove forests, seagrass beds, coral reefs), which greatly limits our understanding of ecological processes at the scale of seascapes [5]. Besides, standardized in situ approaches to data collection, storage, and appropriate statistical analyses are currently lacking.
Seagrass beds and coral reefs are biodiverse and highly productive marine ecosystems. Seagrass beds, by providing nursery and feeding grounds, as well as permanent habitat and refuge from predators, are indispensable for the survival of numerous commercially and recreationally important fish and invertebrates at some phase in their lives [7,8]. Additionally, seagrass metabolism modifies oxygen concentration [9], carbon flux [10], and detritus cycle [11,12] of their environment in a way that supports a fauna high in abundance and diversity. Similar to seagrass beds, coral reefs pay a substantial contribution to global biodiversity and productivity. They provide crucial cultural-ecological services, such as shoreline protection, substrate formation, and the creation of numerous jobs amounting to an immense ecological and socio-economic value [13].
In recent years, these coastal habitats have become increasingly threatened by anthropogenic activities, such as pollution, coastal development, and overfishing, as well as by the effects of global climate change [14,15,16]. The Federated States of Micronesia (FSM) is threatened by natural phenomena, such as tropical storms and climate change-related rise in sea level, as well as by a variety of anthropogenic activities, including inadequate waste management, poor land use practices, overfishing and overharvesting, environmentally harmful fishing methods, and a general lack of policies and regulations [17]. Thus, in order to track the changes and pinpoint the threats to coastal benthic habitats, it is imperative to implement long-term monitoring schemes that use a methodology, which concurrently considers habitat zonation and its reciprocal, functional, and ecological linkages. Although a monitoring program was implemented in the FSM in 1994 [17], it does not consider coral and seagrass communities as a mosaic of patches, which is necessary for the implementation of a successful conservation and management plan of its coastal benthic habitats.
Here, we developed a conceptually straightforward methodology that supports transparent interpretation with the goal of facilitating comparative studies of integrated ecosystems. Our simple, repeatable methods provide a framework for benthic habitat-related monitoring research that allows the comparison of results across regions. Although this study focuses solely on the zonation of coral reefs and seagrass beds, it nevertheless presents a significant step towards a better understanding of coastal ecosystems and seascapes. The two major research objectives here are (1) the development of a comprehensive, comparative methodology for the assessment of coral reef and seagrass bed as a joined habitat, and (2) the definition and comparison of the vertical zonation patterns of benthic habitat from the coast to the reef edge of the fringing reef around Weno Island, Chuuk, FSM.
Fringing reefs are typically located upwards and outwards near the shore in the tropics. There are three main characteristics of a fringing reef, (1) a flat morphology in shallow water, where corals and seagrass communities outcompete for space, (2) the reef crest in the wave break zone, and (3) the reef slope facing the open ocean, dominated by corals [17]. Three sites on the northeastern coast of Weno Island were sampled. Spatial distribution, community structure, and topographical zonation of benthic habitats along the fringing reef were investigated.

2. Materials and Methods
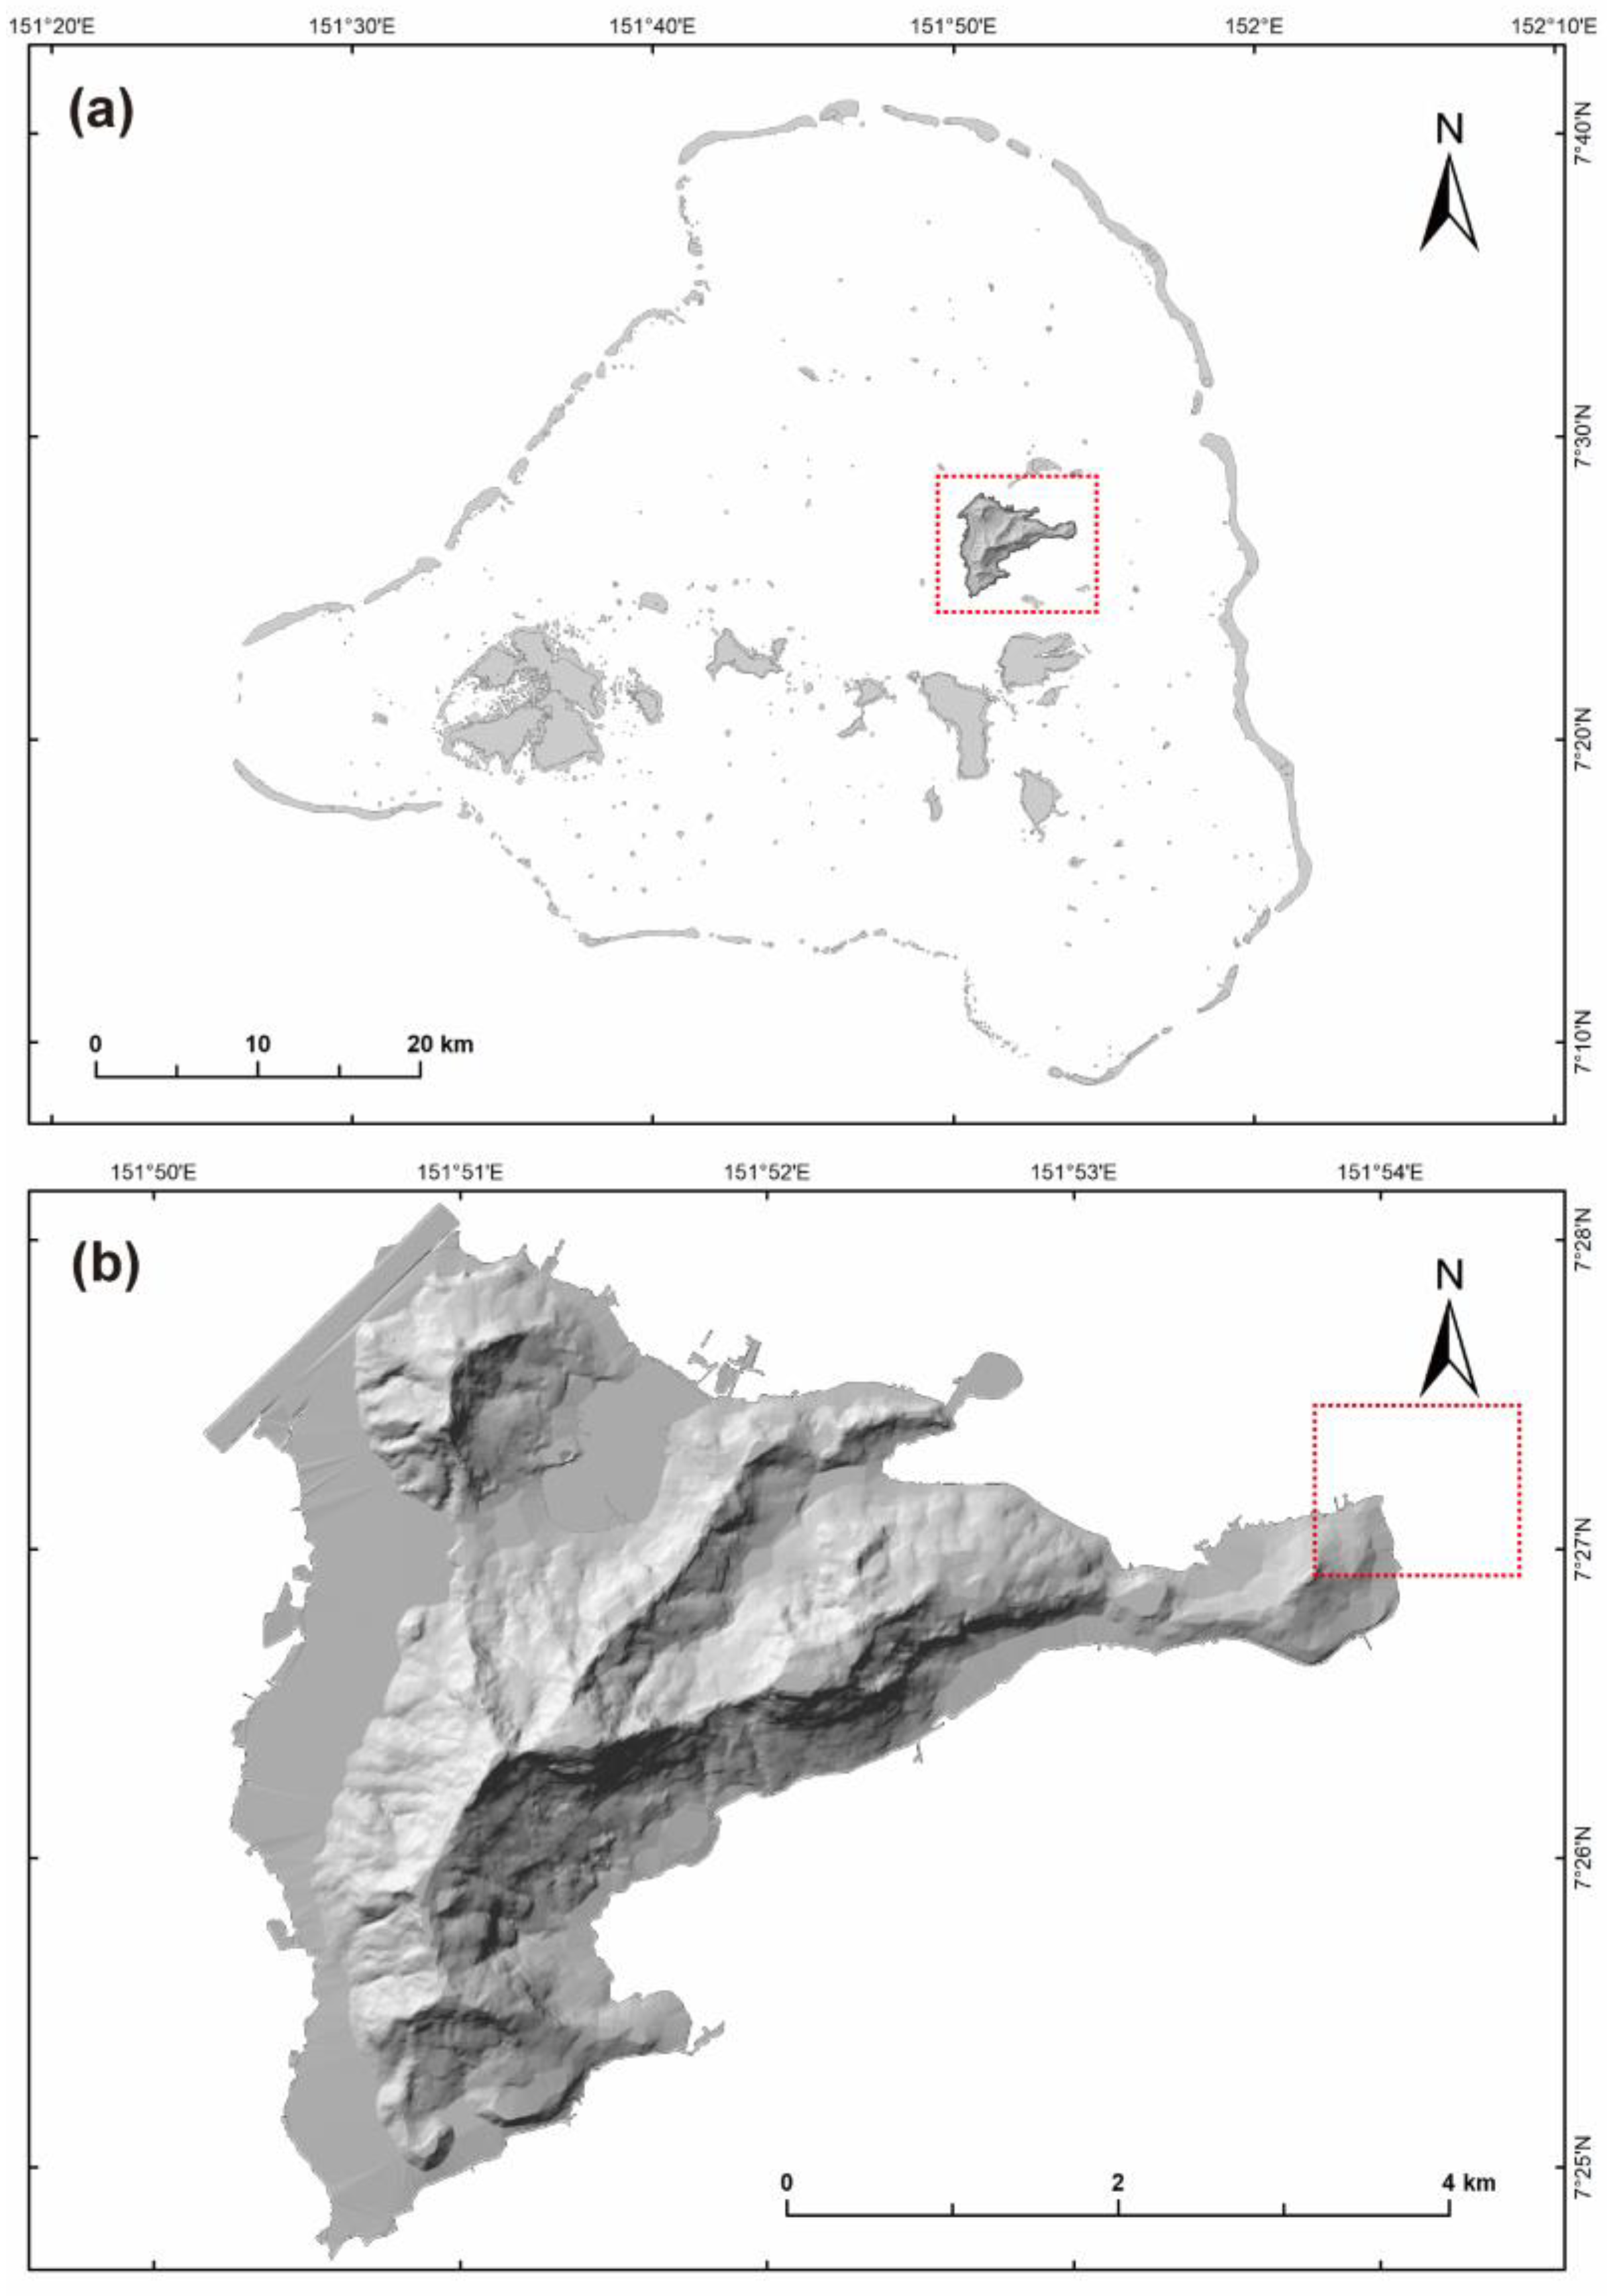
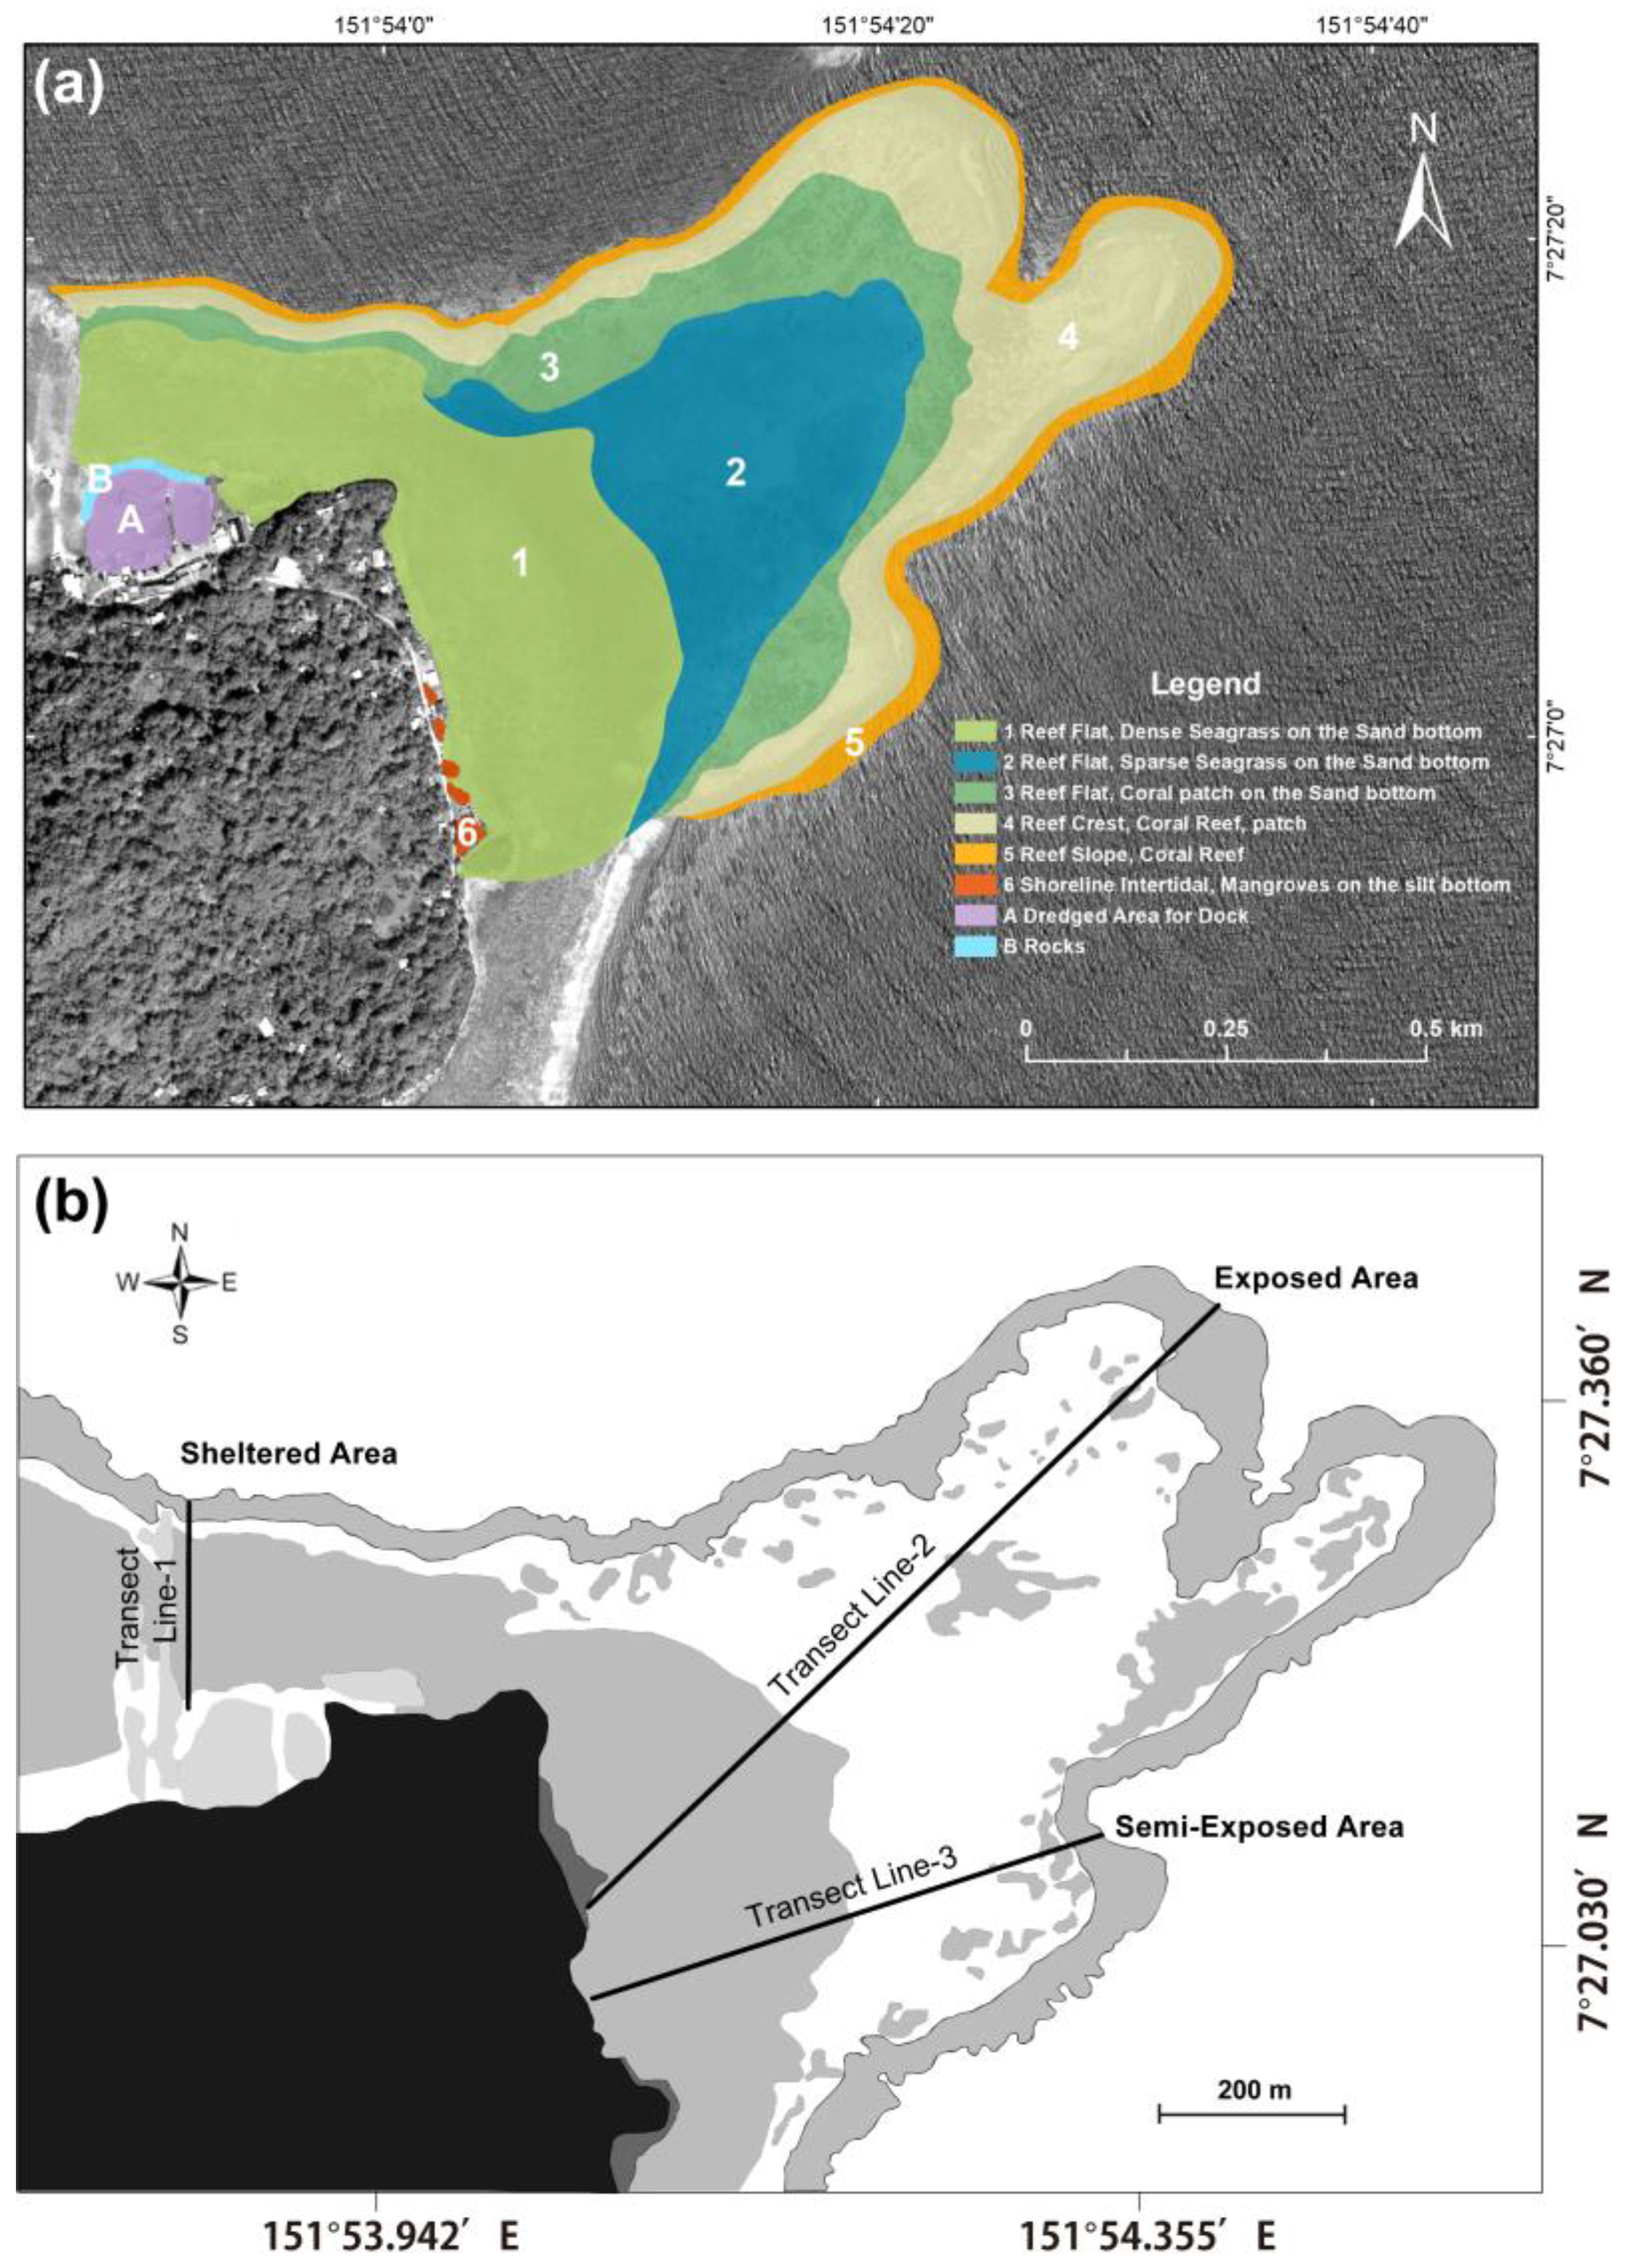
2.1. Study Site

The Federated States of Micronesia (FSM) is an island country in the western Pacific Ocean that contains 607 volcanic and coralline islands scattered within an area of approximately 1.6 million km2 [17]. The islands belong to four states, Kosrae, Pohnpei, Chuuk, and Yap. The total land area covered amounts to 702 km2 [17]. The Chuuk state consists of approximately 290 islands, 96 of which are coralline, and 19 of volcanic origin. The volcanic islands are remains of a shield volcano that originated over a hot spot about 1500 km southeast of their current position, roughly 14–8 million years ago during the Miocene [17]. Chuuk is the largest atoll within the FSM and is home to about half of the country’s population [17] (Figure 1a). The capital of Chuuk is Weno Island, one of the state’s 19 volcanic islands (Figure 1b). The coastal zone of Weno Island displays the typical topography of a fringing reef with a seaward gradient from reef flat, reef crest, to reef slope. Mangrove forests are well developed near the shore but, due to a small tidal range, their expansion is restricted, thus they occur densely in narrow widths. The mangrove zone is followed first by seagrass beds and then coral reefs.

2.2. Mapping and Transect Lines Installation
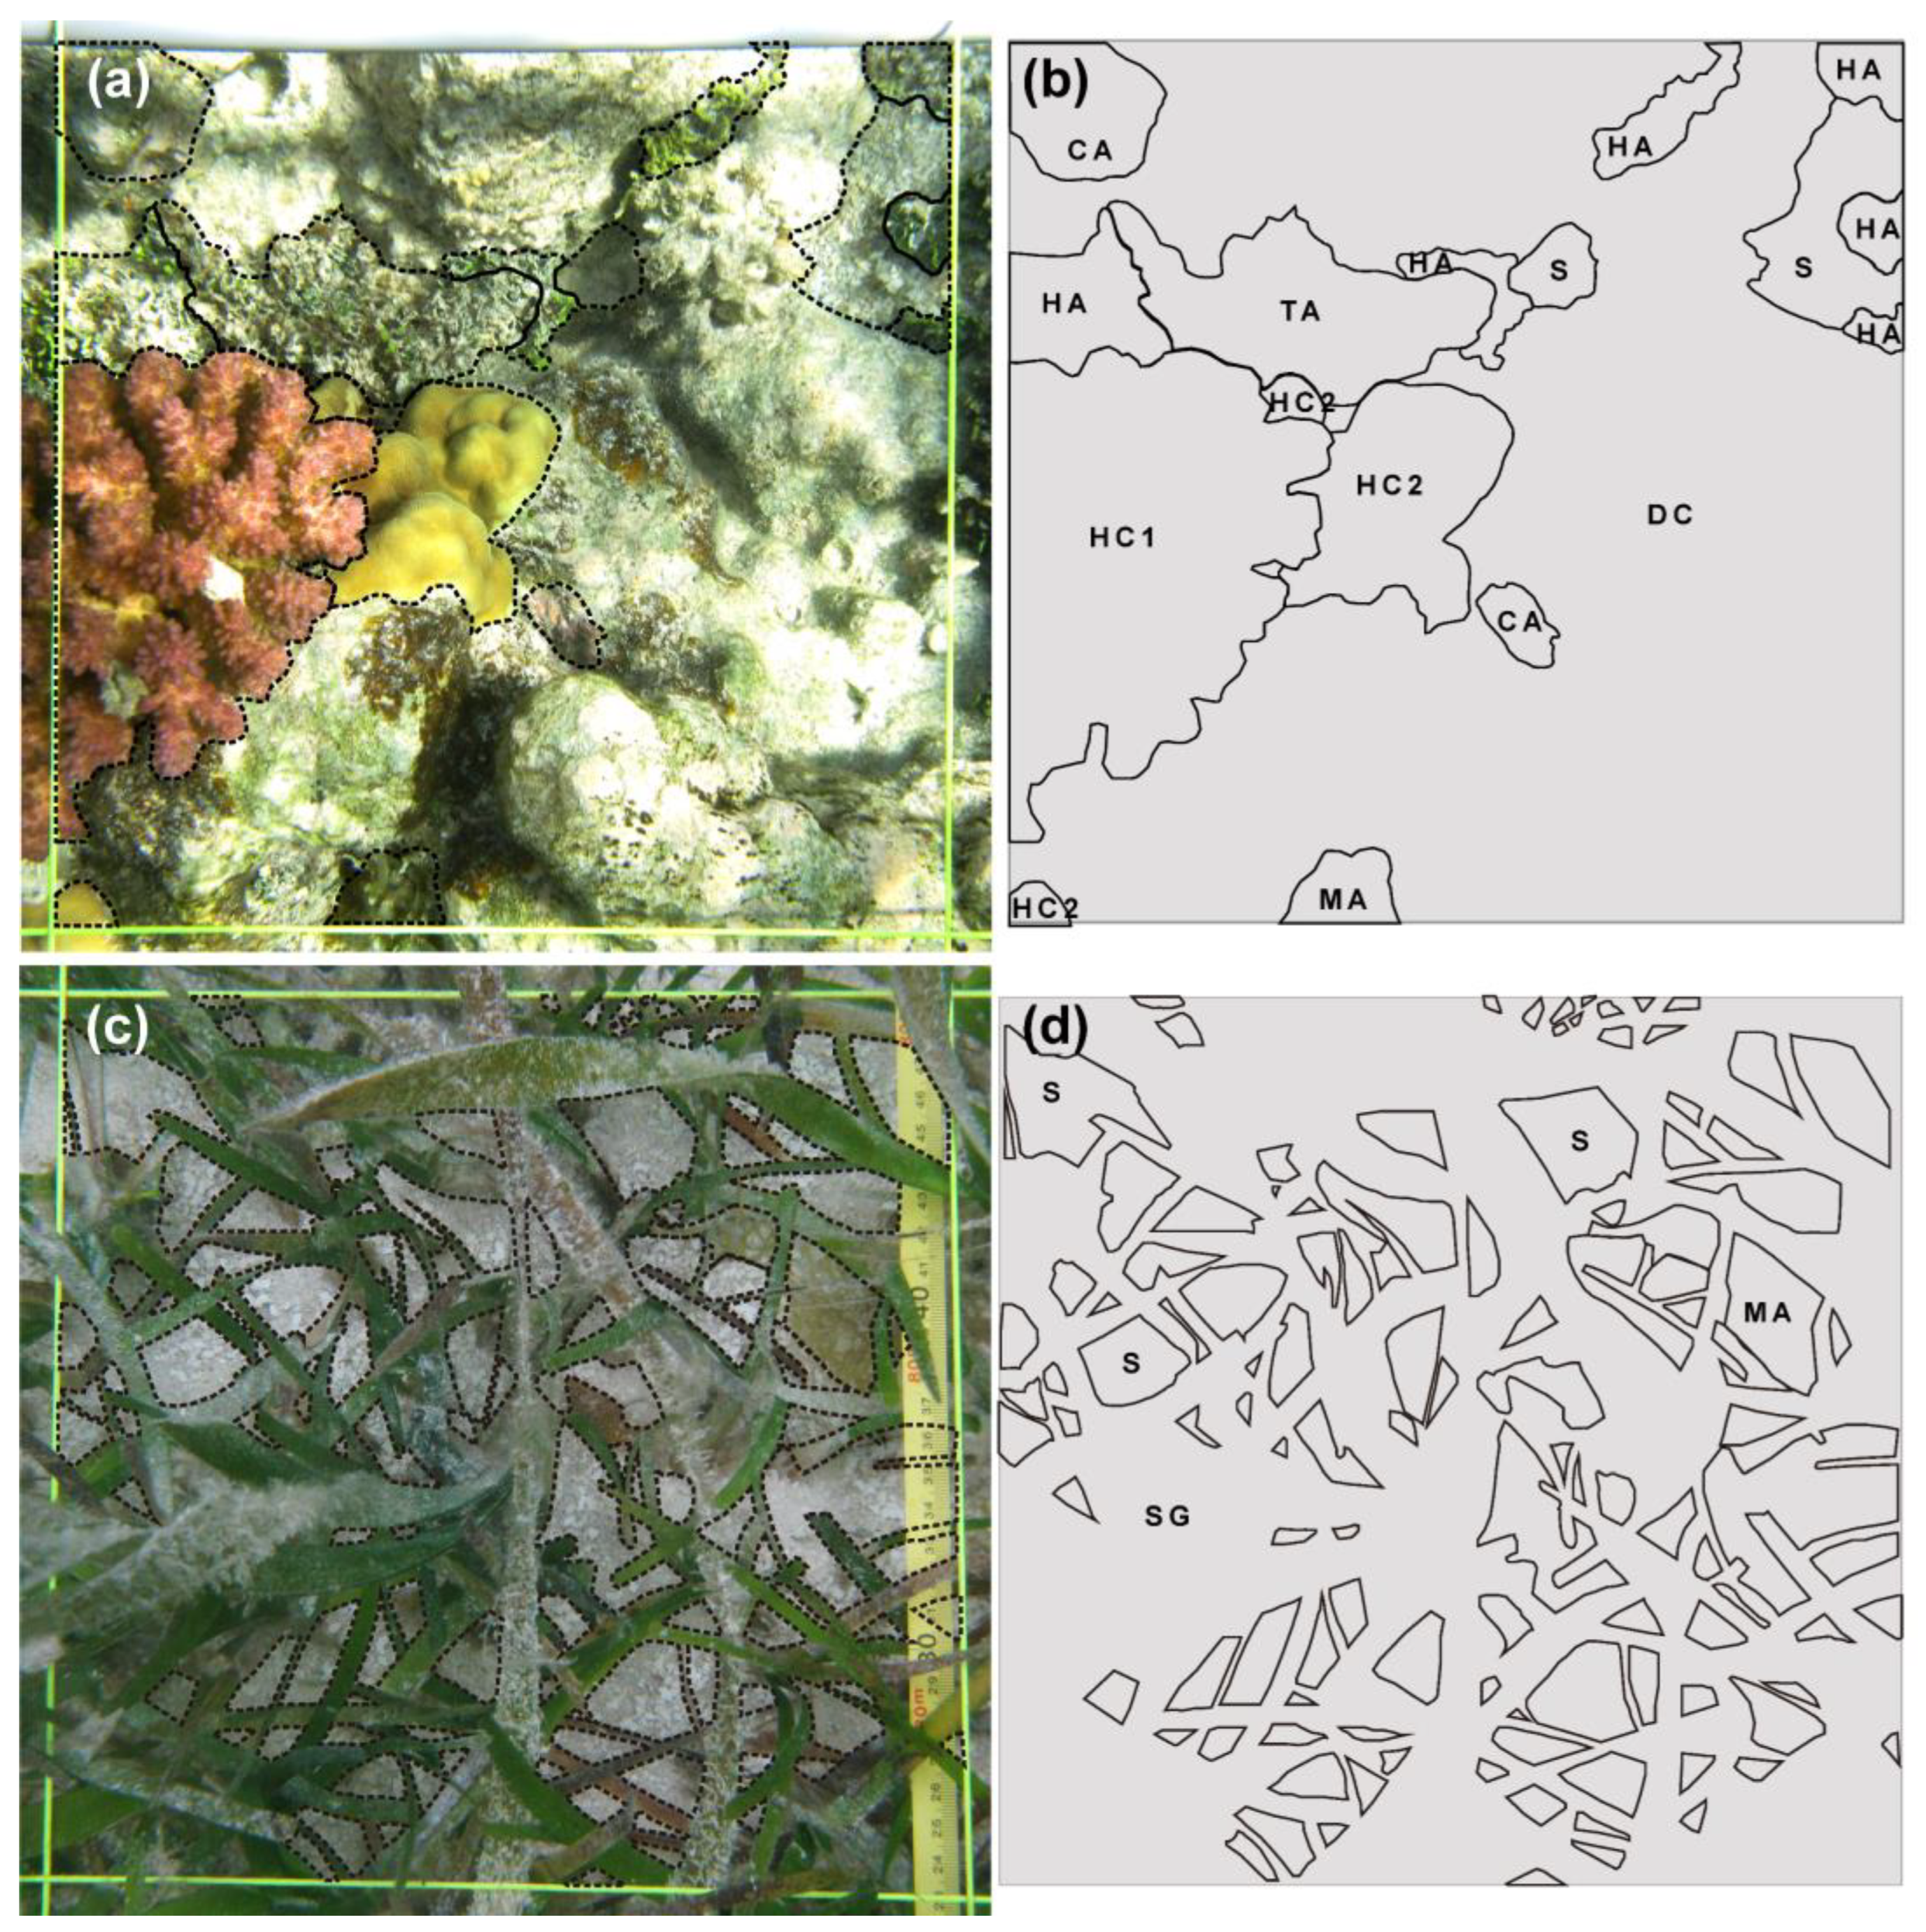
The geographical position and extent of benthic habitats were determined by walking, snorkeling, or scuba diving with a scooter (depending on water depth) along habitat boundaries while collecting the GPS coordinates with a GPS tracking device (Oregon 600, Garmin Ltd., Olathe, KS, USA). Based on these GPS coordinates, habitat zones were mapped with the software ArcGIS version 10.8.2 (Esri, Redlands, CA, USA) (Figure 2a). Detailed spatial distribution of benthic habitats and coral reef topography was investigated along vertical transect lines (TL). Three transect lines (TL-1, TL-2, TL-3) were laid perpendicular to the shore, from the coast to the reef edge, at the northeastern part of Weno Island (Figure 2b). The total lengths of transects TL-1, TL-2, and TL-3 were 235.6 m, 963.1 m, and 482.7 m, respectively. The permanent photo-quadrat method as described in “Methods for Ecological Monitoring of Coral Reefs” [18] was adapted to identify benthic habitats and determine bottom coverage. Every 10–15 m, a 1.0 m × 1.0 m quadrat (i.e., sampling point) was fixed on the TL, and four photographs were taken at a height of 1 m above the TL (Canon G10, Canon S100, SEA and SEA YS110-a strobe, underwater light, waterproof housing) so that each picture covered 1/4th of the 1 m2 quadrat; then, the four images were merged to fit the quadrat into a single frame. A total of 167 sampling points (SP) were recorded along TL-1 (25 SP), TL-2 (93 SP), and TL-3 (49 SP).

2.3. Photo Analysis

Photographs were digitalized and analyzed visually to classify habitats (Image-Pro PLUS software; Media Cybernetics, Inc., Rockville, MD, USA) (Figure 3). To estimate the coverage of each benthic habitat type, the digital images of each quadrat were first transformed into simple outline drawings (Figure 3a,c). Subsequently, each polygon was determined based on benthic habitat group classification (Figure 3b,d). Area values were automatically measured and exported into Microsoft Excel by the Image-Pro PLUS computer software package. The values were manually summed by the group in Microsoft Excel. Benthic habitat composition was plotted for each TL separately based on the area values. The total coverage (%) of each habitat category was calculated by dividing the sum of each category by the total area of the quadrat and multiplying the result by 100 to get the percentage value. Depth profiles and topographical zonation of each TL were visualized.

2.4. Habitat Classification

Benthic habitat was classified into groups of benthic structures (abiotic or dead) and life forms, respectively (Table 1). Modified versions of the “Standard Operation Procedures for Long-term Monitoring of the Great Barrier Reef” [19], and the “Survey Manual for Tropical Resources” [19], both developed by the Australian Institute of Marine Science, were applied in consideration of unique regional features. Our adapted classification scheme of benthic habitat included the following 12 groups of benthic structures and life forms: sand (S), rubbles (R), dead corals (DC), rock (RK), hard corals (HC), soft corals (SC), macroalgae (MA), coralline algae (CA), turf algae (TA), Halimeda (HA), seagrass (SG), macrofauna (MF), and indeterminate (IN) (Table 1).
R is defined as fragments of dead hard corals with a size of >0.5 cm and <15 cm in diameter, which are not consolidated into a hard substrate and not colonized by turf algae [19], whereas DC are recently dead corals that are also not colonized by turf algae but still attached to their substrate. The HC group includes living species of hard coral (Cnidaria: Anthozoa: Hexacorallia: Scleractinia) and was subdivided into Acropora and non-Acropora, as Acropora is the dominant species around Weno Island. Furthermore, we differentiated between specific morphology, such as bottlebrush, branching, digitate, tabulate, encrusting, and submassive with respect to the Acropora group, and branching, encrusting, foliaceous, massive, mushroom, solitary, and submassive with respect to the non-Acropora group (Table 1, Figure 4). SC includes living species of soft corals (Cnidaria: Anthozoa: Octocorallia: Alcyonacea).
MA was subdivided into brown macroalgae (Phaeophyceae), red macroalgae (“Rhodophyta”, except coralline forms), and green macroalgae (except Halimeda, which has its own group, HA) based on color and size. CA (“Rhodophyta”: Corallinales) are red algae featuring a calcareous thallus. TA are microalgae and juvenile stages of macroalgae (vertical height between 1 mm and 2 cm), featuring species of red, green, and brown algae, coralline algae, Cyanobacteria, diatoms (i.e., Bacillariophyceae), and detritus [20]. SG describes species of marine angiosperms (Angiospermae: Alismatales).
MF was subdivided into sponges (Porifera), fire coral (Cnidaria: Hydrozoa: Milleporidae), blue coral (Cnidaria: Anthozoa: Octocorallia: Helioporacea: Heliopora coerulea (Pallas, 1766)), tunicates (Tunicata), echinoderms (Echinodermata), arthropods (Arthropoda), mollusks (Mollusca), and zoanthids (Cnidaria: Anthozoa: Hexacorallia: Zoantharia). IN is used when the benthos cannot be identified because of insufficient image quality, indeterminate substrate, or obstruction by divers or equipment [19].

2.5. Statistical Analysis

Non-metric multidimensional scaling (nMDS) cluster analysis was applied to show how benthic habitat types (S, R, DC, R, HC, SC, MA, CA, TA, HA, SG, MF) determine the grouping of habitat zones (SP along the TL). The nMDS was run on the Bray-Curtis similarity matrix of the square-root transformed relative coverage data of each habitat type per each SP (i.e., photo-quadrat). Subsequent ordination was applied to visualize how isolated these habitat zone groups are from one another. Analysis of similarity (ANOSIM) was applied to investigate the differences in habitat composition among nMDS groupings (i.e., habitat zone groups). The similarity percentage (SIMPER) test, based on the Bray-Curtis similarity matrix, was used to identify the benthic habitat groups with significant influence on the determination of habitat type. The computer software package PRIMER ver. 6 (PRIMER-e Ltd., Auckland, New Zealand) [21] was used to perform all multivariate analyses.

3. Results

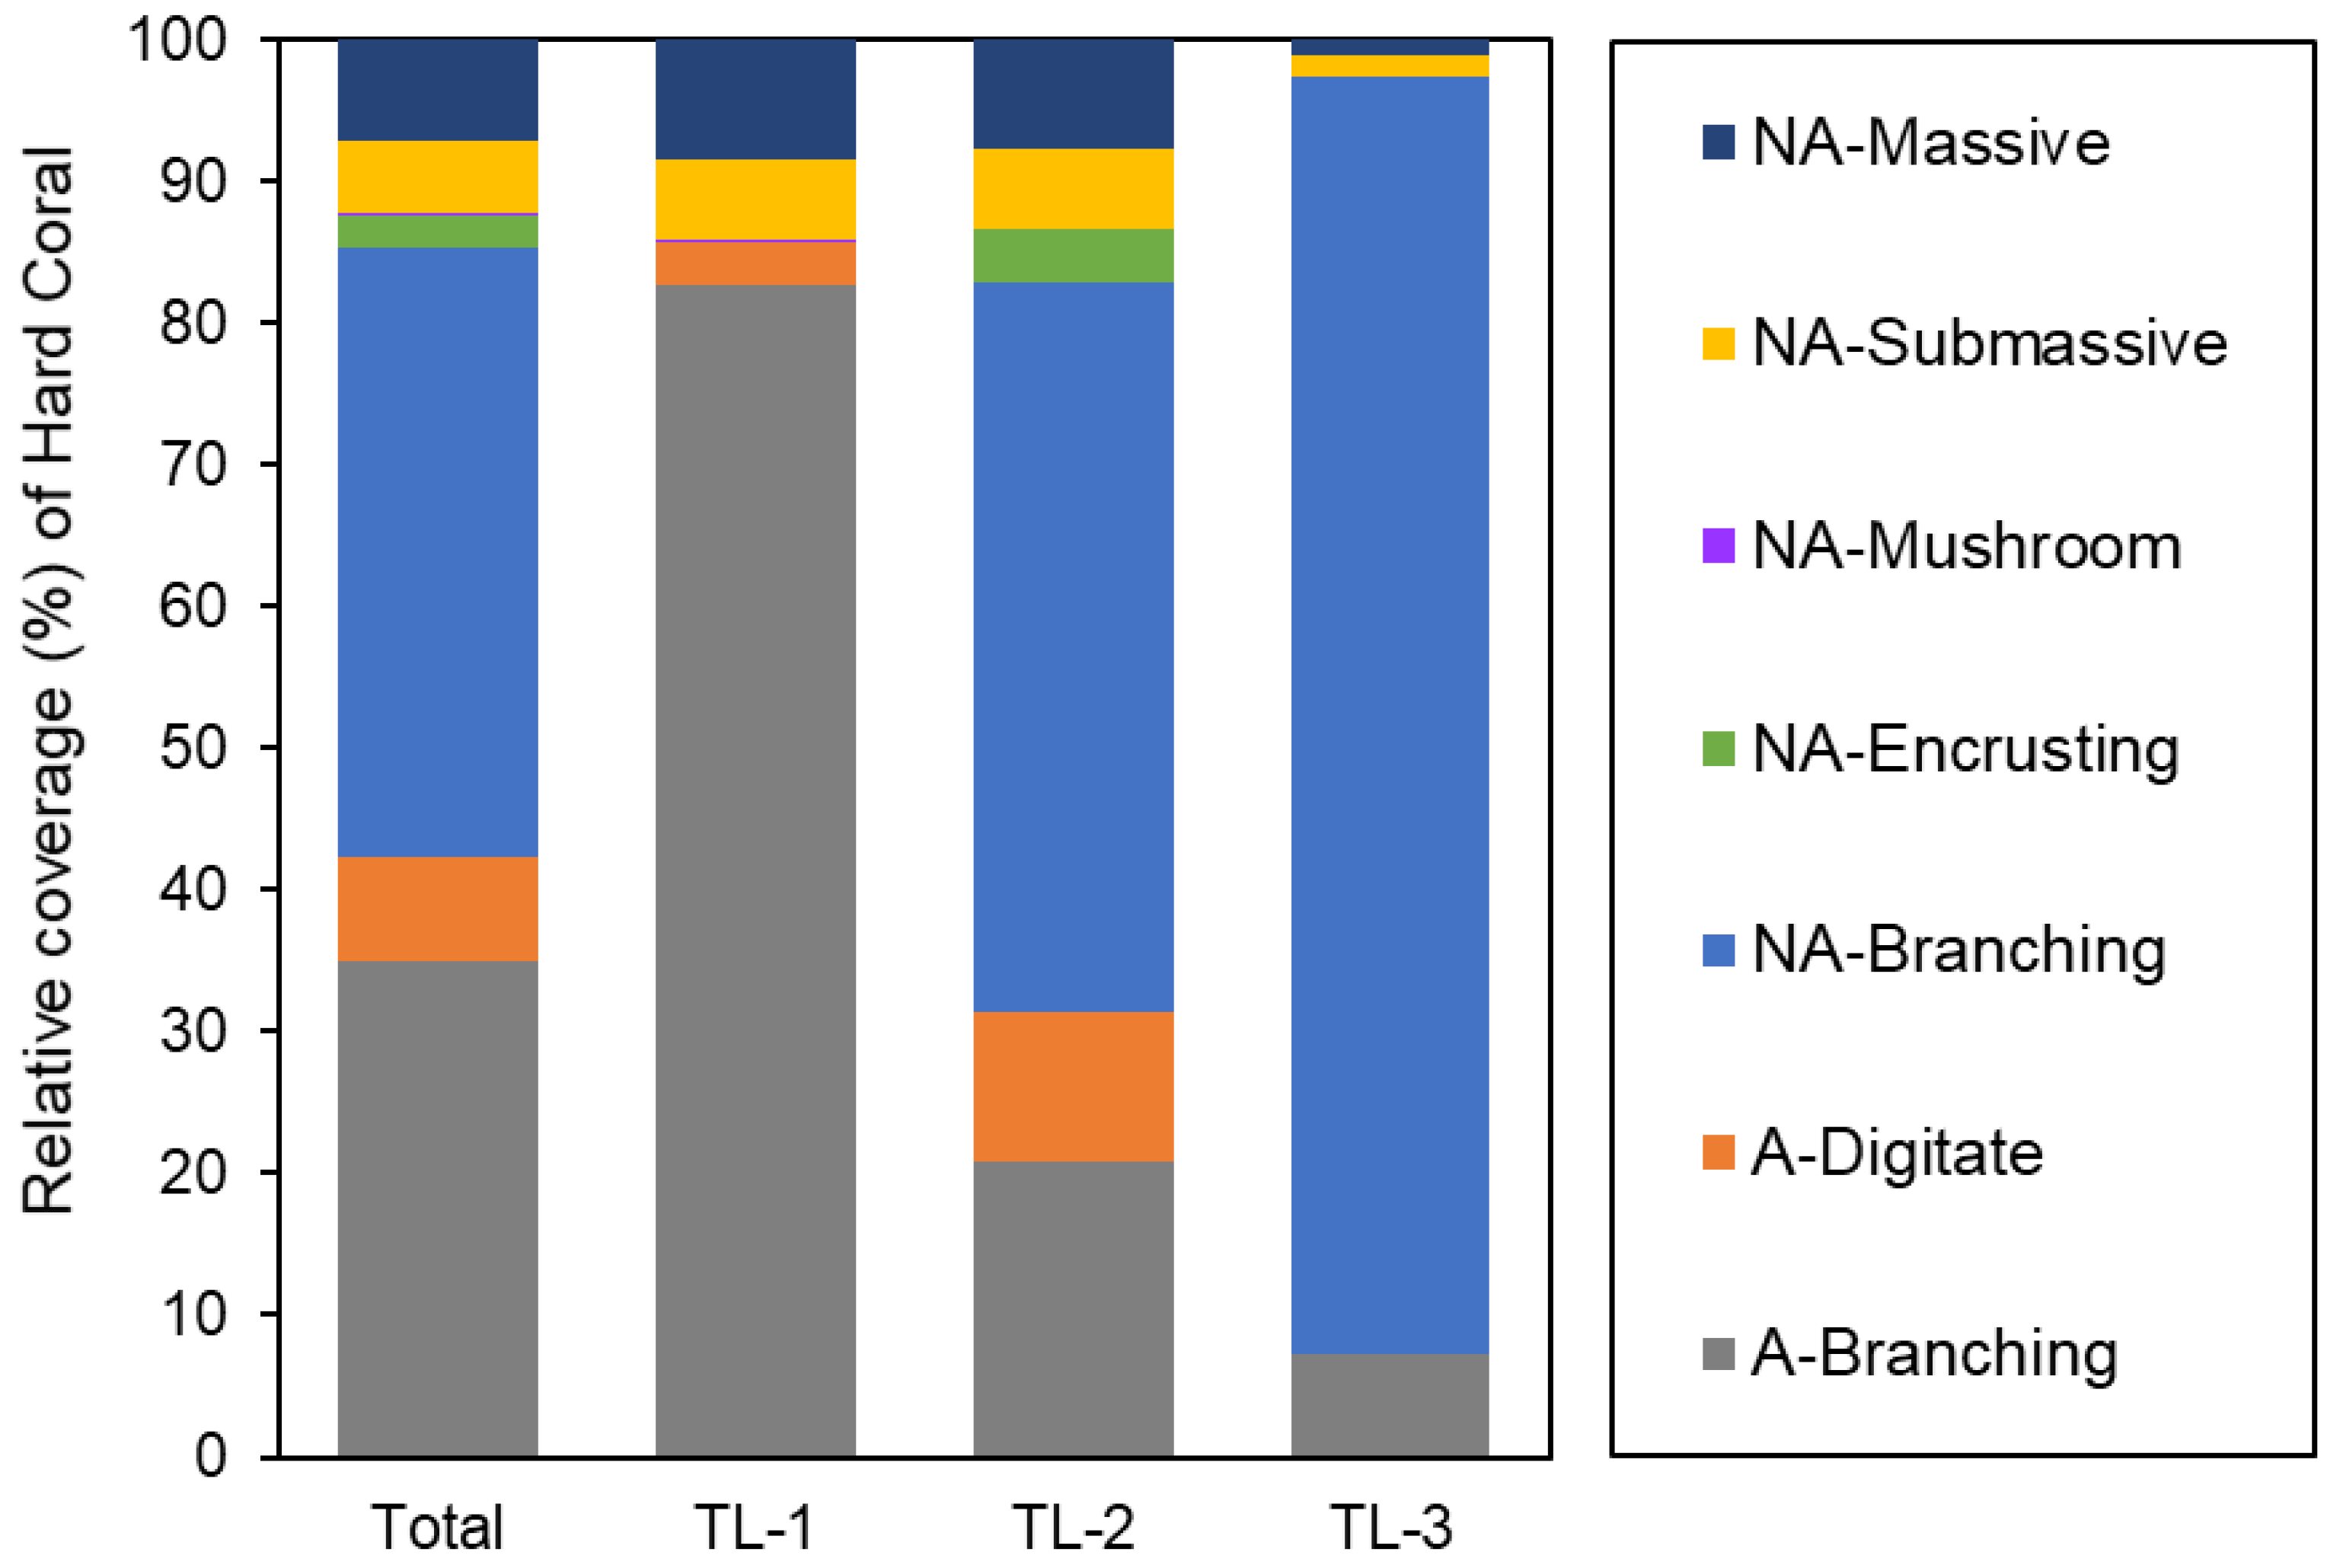
3.1. Overall Distribution of Benthic Habitat

Our habitat map based on GPS tracking revealed a clear gradient of habitat zonation and reef topography along the fringing reef of the northeastern part of Weno Island (Figure 2a). These zonation patterns were confirmed by benthic habitat compositions and statistical approaches (Figure 5, Figure 6, Figure 7, Figure 8, Figure 9 and Figure 10). Reef flats are relatively shallow (around 3 m water depth; see depth profiles Figure 5a, Figure 7a and Figure 9a), submerged, sandy bottoms, with most of the area covered by seagrass (Figure 5, Figure 7 and Figure 9). Reef crests are largely exposed during low tides. Reef slopes are steep and mainly covered by corals. We determined the relative coverage of habitat type and group for each TL and the results showed that the overall benthos around Weno Island (based on the three TL) is composed of 52.8% abiotic materials (S 42.4%, R 8.9%, DC 1.5%, RK 0%), 41.1% algae (MA 2.7%, CA 1.4%, TA 6.0%, HA 4.9%, SG 26.1%), 6.1% corals (HC 3.5%, SC 2.6%), and 0.1% macrofauna (MF 0.1%) (Table 2). No section of the benthos was classified as indeterminate (IN 0%) (Table 2).
The reef flats and coastal habitats (excluding reef crests and reef slopes) are dominated by S (42.4%) and SG (26.1%) (Figure 5, Figure 7 and Figure 9). HC and SC accounted for 3.5% and 2.6%, respectively, of the total survey area. Within coral-dominated areas, species composition and density differ between reef flats, reef crests, and reef slopes. Reef crests and back reefs are primarily inhabited by hard and soft corals, but their distribution is patchy. HC, Acropora (1.5%), and Non-Acropora (2.0%) species share relatively similar portions of the species composition (Table 2). In particular, Acropora nobilis (0.7%) and Porites cylindrica (1.2%) are dominating the sites. HC patches comprising of Porites divaricata and Acropora nobilis are sparsely distributed on the reef flats within the sand zones, whereas massive Porites lutea is intermittently distributed. Along the back reefs, however, a variety of Acropora spp., Pocillopora spp., Pavona spp., and Montipora spp. mixed coral communities are found where the wave energy starts to decline. Porites cylindrica and Porites spp. display patchy distributions along the reef slopes to the reef crests. Generally, Weno Island’s fringing reef comprises of slightly more than 40% of Acropora species (Figure 4).
Relative coverage of HC along TL-1 was dominated by Acropora species (>85%), whereas TL-3 was dominated by hard corals of the non-Acropora group (>90%) (Figure 4). The highest and lowest densities of branching hard corals were recorded along TL-3 (>95%) and TL-2 (>70%), respectively (Figure 4). Generally, 78% of the hard coral cover along Weno’s fringing reef exhibited the branching morphotype, followed by digitate and massive, respectively (~7% each) (Figure 4). Submassive (~5%) and encrusting (~2%) growth forms occurred only rarely (Figure 4). TL-2 was comprised of roughly 30% Acropora species, 20% branching and 10% with digitate morphotype, and nearly 70% of non-Acropora species (Figure 4). The non-Acropora group was dominated by branching growth forms, followed by massive, submassive, and encrusting, in order of descending abundance (Figure 4).
With respect to habitat type SC, we only found two species inhabiting the benthic habitat around Weno Island: Alcyonium sp. and Sinularia sp. All surveyed SC communities are dominated by Alcyonium sp. (Table 2). R made up 8.9% of the total area, mainly found at reef crests. With respect to the algal group, habitat types MA (2.7%), TA (6.0%), and HA (4.9%) appear scattered within the entire coastal zones (from coastlines to reef slopes). Contrary, CA (1.4%) is distributed extensively on both sides of the back reefs and reef crests.
Although the general zonation pattern was comparable between the three TL, multivariate analyses revealed that detailed habitat zonation based on specific habitat types was different between the three TL (Figure 6, Figure 8 and Figure 10). TL-1 showed three statistically distinct habitat zones, an SG and S zone closest to the shore, followed by an HC and algae (MA, CA, TA, HA) zone, and closest to the open ocean, a zone dominated by R (Figure 6). TL-2 showed five statistically distinct habitat zones, again an SG and S zone closest to the shore, then an S zone, an S and SC zone, an S and HC zone, and finally, an R zone again closest to the open ocean (Figure 8). TL-3 showed four statistically distinct habitat zones, again an SG and S zone closest to the shore, then an S zone, an S and HC zone, and again an R zone off the reef slope (Figure 10). Detailed results for each TL are described below.

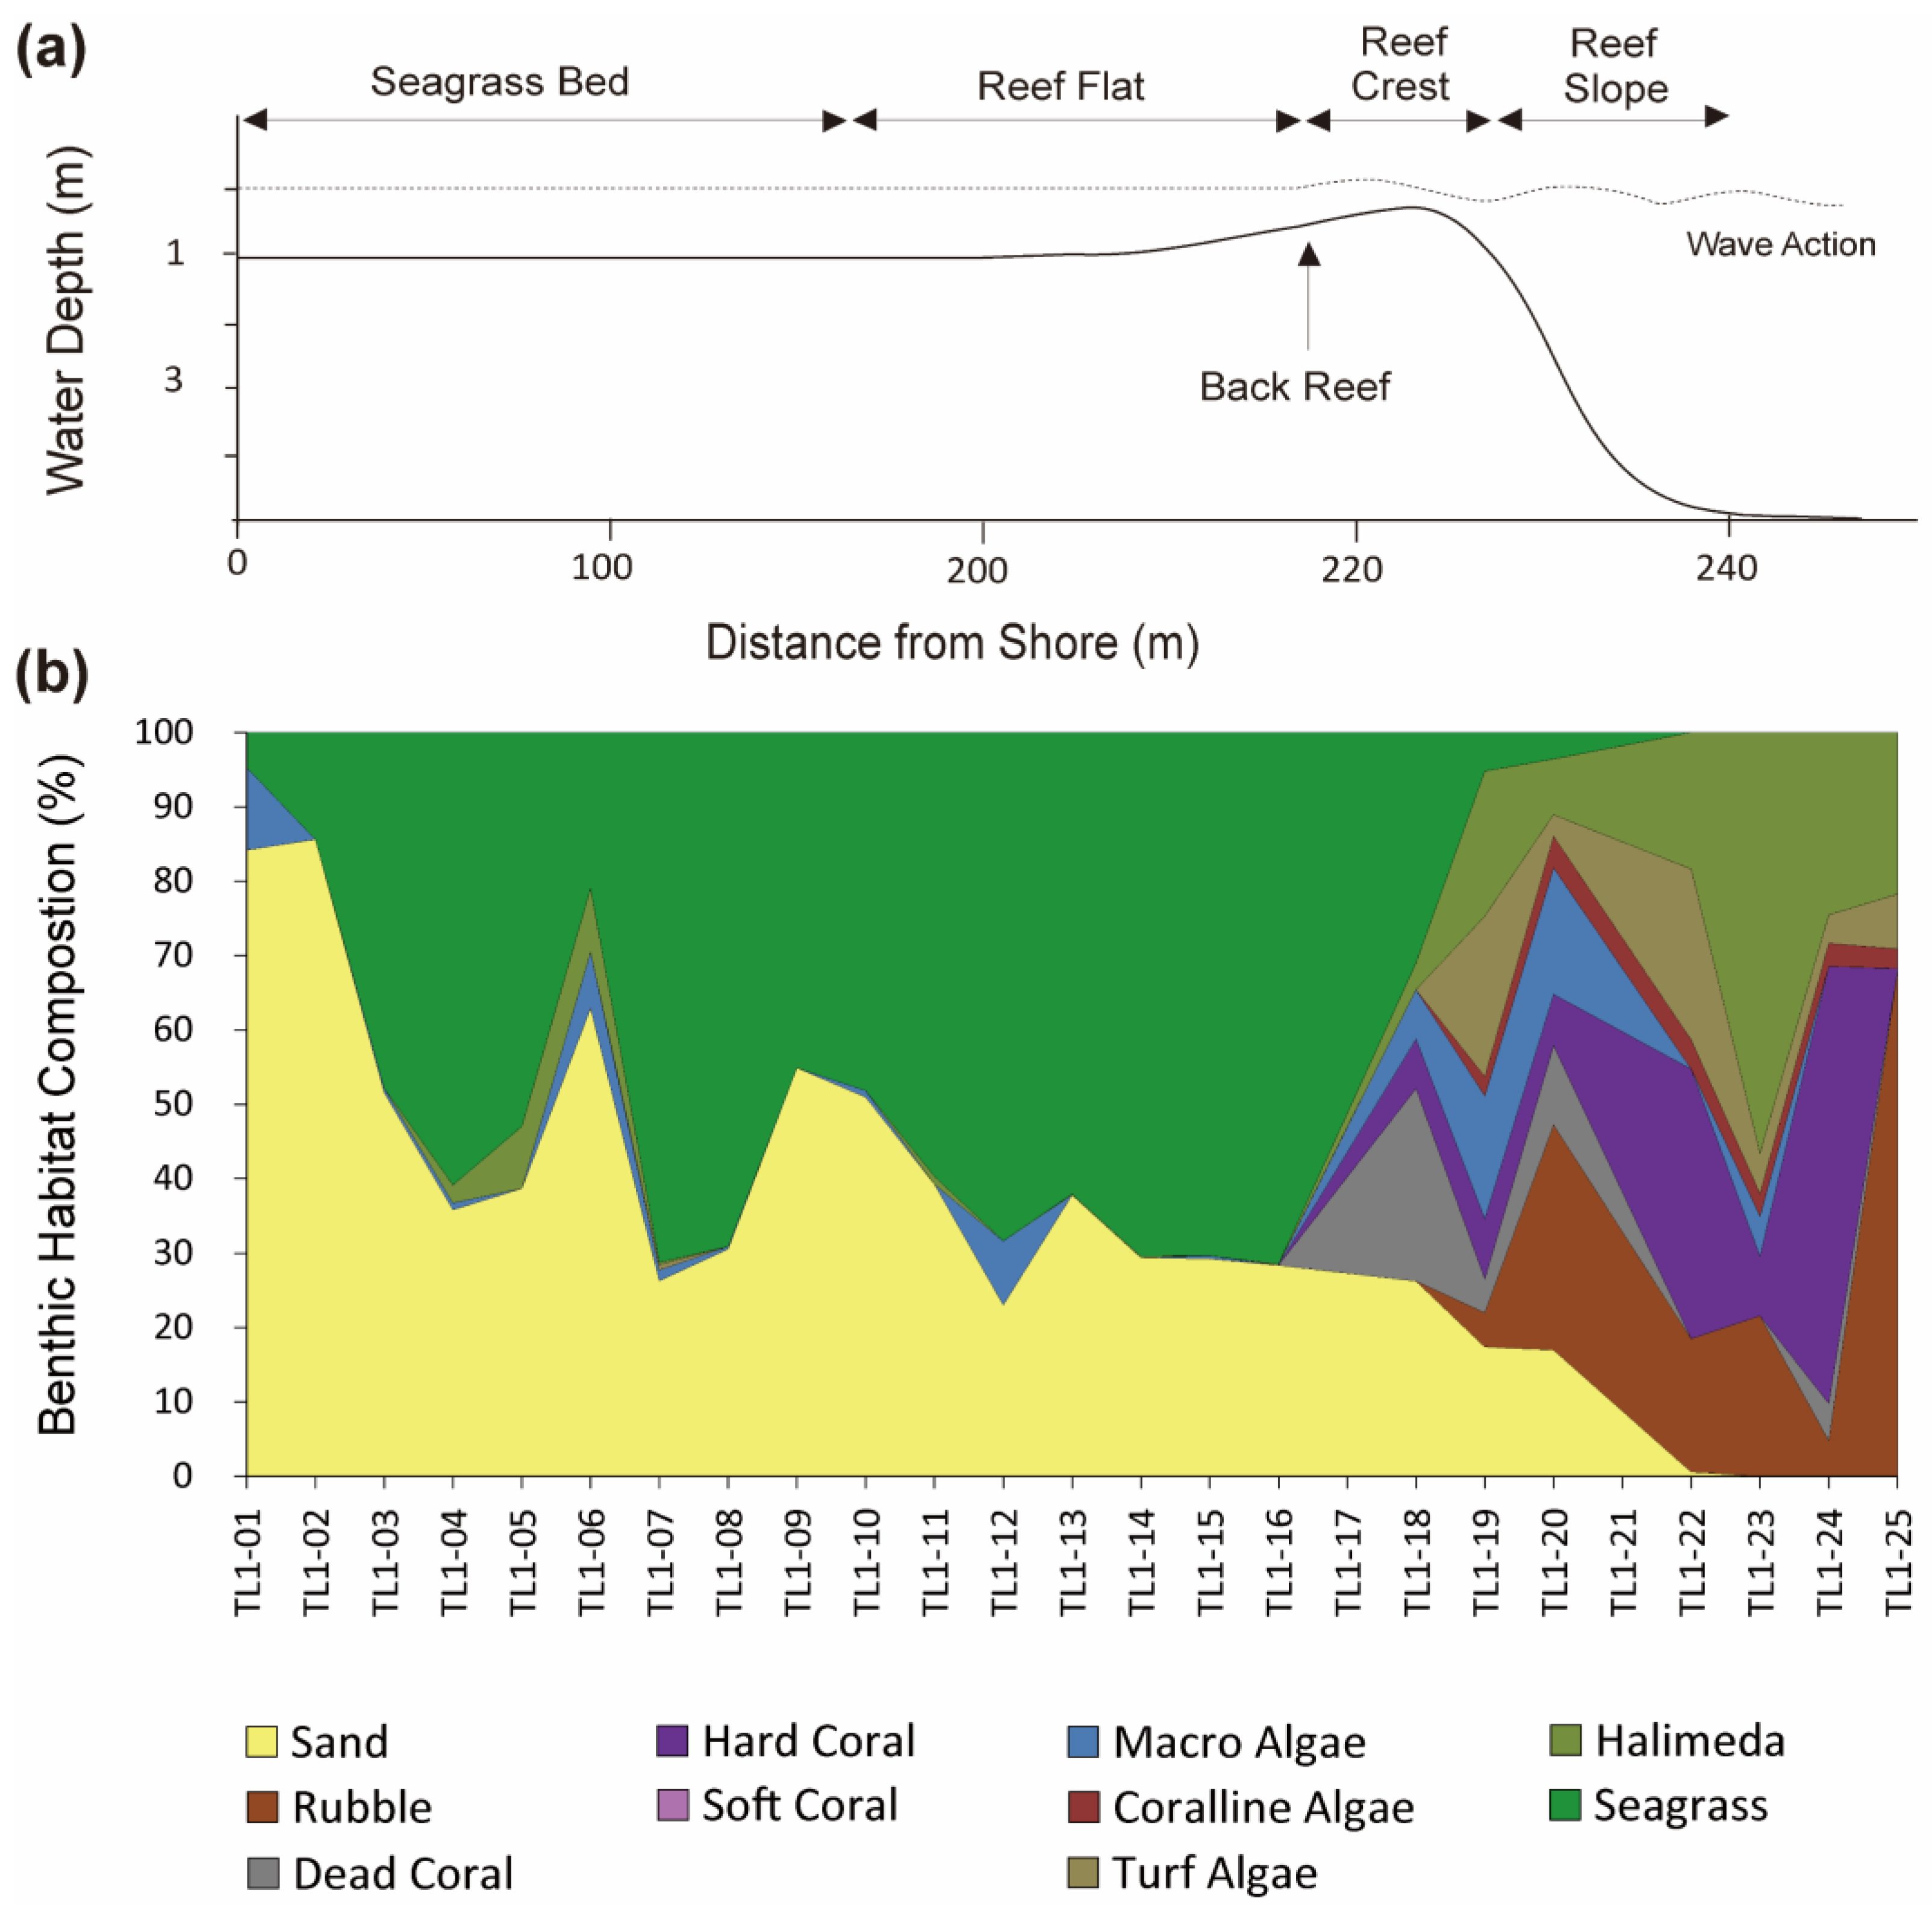
3.2. Transect Line-1 (TL-1)

The following relative coverages by benthic habitat types were determined in order of highest to lowest: SG: 37.2%; S: 32.2%; HA: 7.5%; R: 6.8%; HC: 6.0%; MA: 3.6%; TA: 3.1%; DC: 2.6%; CA: 0.9%; and MF: 0.1% (Table 2). S and SG account for more than a quarter of benthic habitat coverage, 32.2%, and 37.2%, respectively. The transect line started off near the KSORC dock within high turbidity waters. SP-1 and SP-2 were located near the dock where the sand bottom dominates. SG coverage rapidly increases from SP-3 towards the reef flat (Figure 5b). HC is first observed at SP-17 and its relative coverage gradually increases seaward. Similarly, HA is also first observed at SP-17. Its relative coverage increases quickly, peaking at SP-23 (Figure 5b). SC colonies are not observed along TL-1. R is frequently found on the reef crest and its relative coverage further increases along the reef slope. TA is mostly found near the reef crest and along the reef slope. CA is mainly observed around DC colonies or R on the reef crest (Figure 5). Except for a very low abundance of Porifera, no MF was recorded (Table 2).
Cluster analysis recognized three distinct benthic habitat zones, a seagrass bed and reef flat zone (group A), a back reef zone (group B), and a reef crest and slope zone (group C) along TL-1 (Figure 6). The nMDS showed distinct, isolated separation of these habitat zones (Figure 6b), supporting the result of clustering (Figure 6a). Group A contains the first 18 SP, which show a similarity of more than 66% (Figure 6a; Table S1) and include the habitat types from the shoreline to the far end of the reef flat (Figure 5). Group B is comprised of the three SPs on the back reef. This group shows >80% similarity according to the nMDS clustering (Figure 6a). The final 4 SP of TL-1, spanning from the reef crest to the reef slope, cluster together as group C. The similarity percentage of this group is around 60 (Figure 6a). The habitat zones are distinguishable by their specific composition of habitat types (one-way ANOSIM, global R = 0.991, p = 0.001) (Table S2). In particular, the habitat types contained in groups A and B, and groups B and C were significantly different (p = 0.002 and p = 0.001, respectively). SG and S are the defining factors in benthic habitat zone A (i.e., group A of the nMDS cluster), each contributing 48.9% and 46.0%, respectively, according to SIMPER analysis (Table S1). Group B is defined by algae and HC (44.7% and 11.6%, respectively), growing on S and R (14.4% and 13.2%, respectively). Similarity within group C is defined by algae (mainly HA, 51.6%), R (23.6%), and HC (15.4%) (Table S1).
Figure 5. Benthic habitat evaluation results for the first transect line (TL-1). (a) Depth profile and topographical zonation from the shoreline to the reef edge. (b) Benthic habitat composition of the 25 sampling points (i.e., photo-quadrats) along TL-1.
Jmse 10 01643 g005
Figure 6. Multivariate analyses of the first transect line (TL-1). (a) Dendrogram of cluster analysis. (b) Non-metric multidimensional scaling ordination results. Analyses based on square root transformed coverage data of benthic habitat types as determined by digital imaging analysis of the 25 photo-quadrats (i.e., sampling points) along TL-1.
Jmse 10 01643 g006

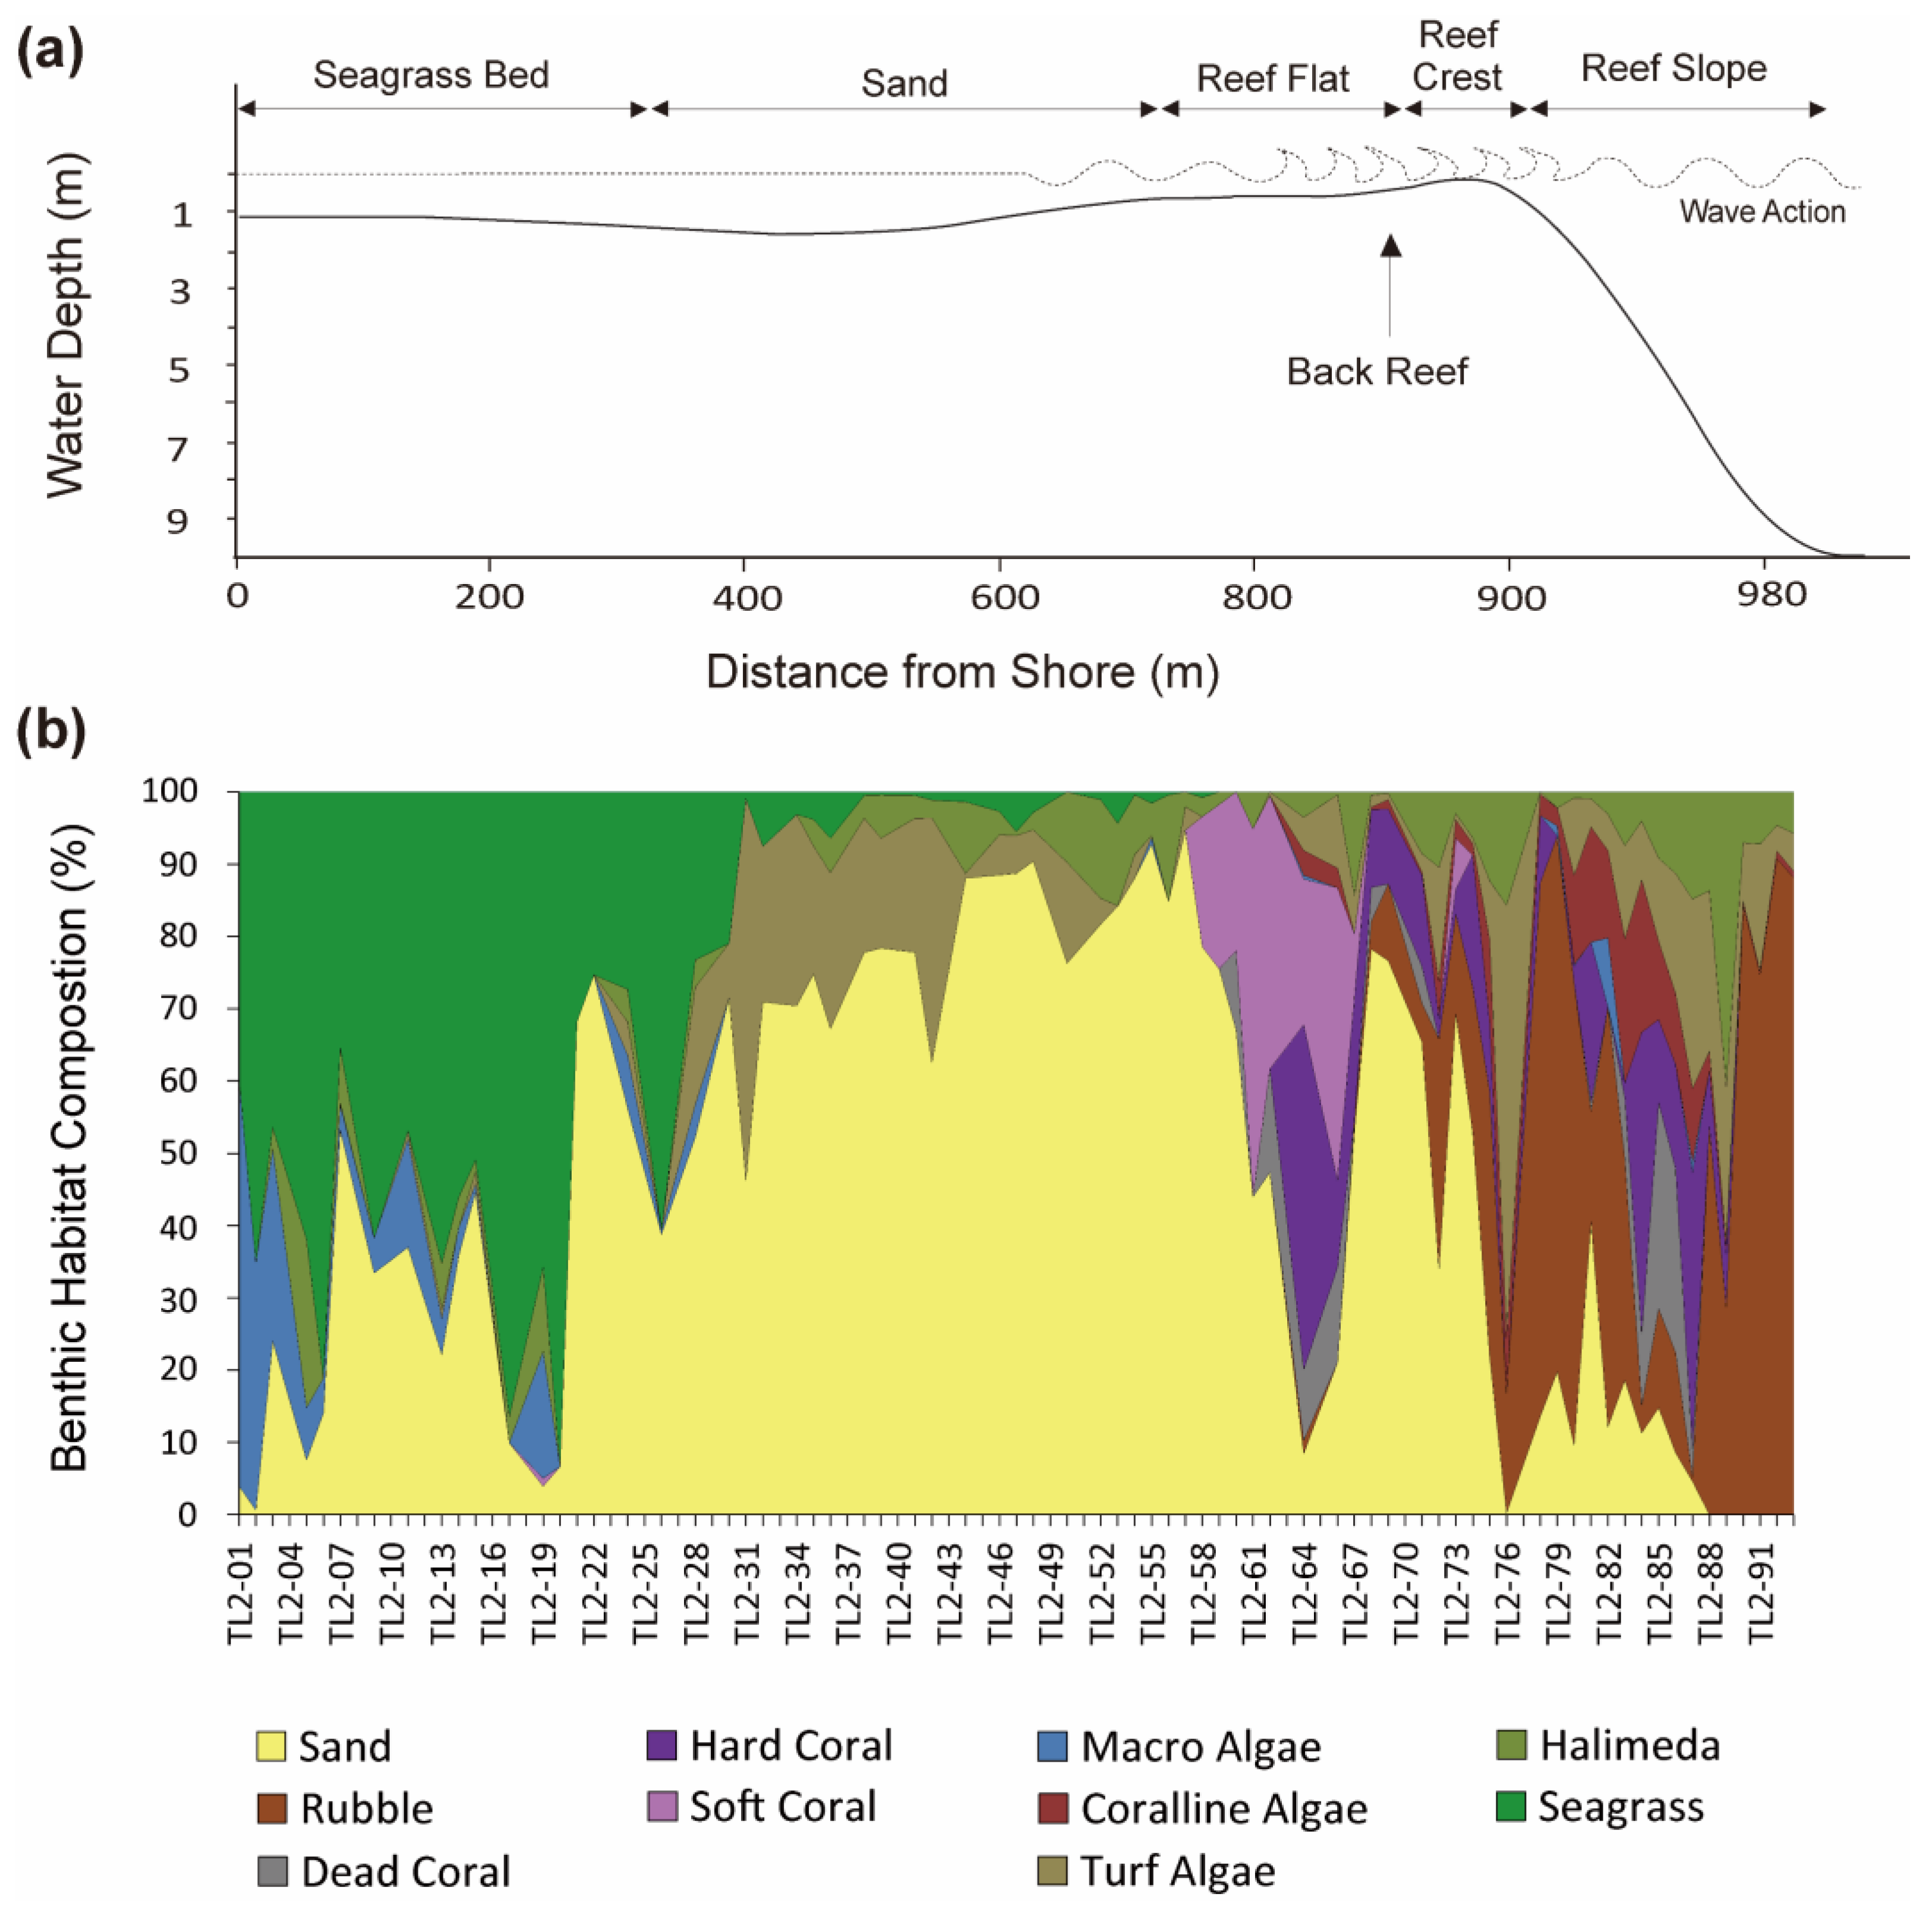
3.3. Transect Line-2 (TL-2)

The following relative coverages by benthic habitat types were determined in order of highest to lowest: S: 45.5%; SG: 17.1%; R: 10.4%; TA: 8.1%; HA: 5.2%; HC: 4.0%; SC: 3.1%; MA: 2.9%; CA: 1.9%; DC: 1.7%; and MF: 0.1% (Table 2). Relative coverage of S (45.5%) in TL-2 is higher than the general mean of S of all three TL (42.4%). On the other hand, the relative SG coverage (17.1%) is the lowest among the three TL. TA coverage (8.1%) is higher than those of TL-1 and TL-3 (3.1% and 3.4%, respectively). Generally, TL-2 is largely covered by MA, with its total coverage of MA being higher than that of the other TL. Most SP up to the SP-27 are densely covered with SG (Figure 7b). Beyond SP-27, TA coverage replaces SG coverage, until SG disappears at SP-32. SC colonies are first observed at SP-58 and their coverage gradually increases. HC colonies are occasionally observed beyond SP-63, displaying a patchy distribution. This patchy distribution of HC colonies extends until the back reef, where abundant R and HC colonies cover the bottom (Figure 7). R coverage (10.4%) is the highest among all TL, and most R is found along the reef slope. DC colonies are observed intermittently on the reef crest, yet do not show a spatial pattern. HA is evenly distributed throughout the SP, but the highest coverage is found on the reef crest, similar to TL-1. CA and HC colonies are most abundant on the reef crest where high wave action occurs (Figure 7). Except for a very low abundance of Porifera, no MF was recorded (Table 2).
Figure 7. Benthic habitat evaluation results for the second transect line (TL-2). (a) Depth profile and topographical zonation from the shoreline to the reef edge. (b) Benthic habitat composition of the 93 sampling points (i.e., photo-quadrats) along TL-2.
Jmse 10 01643 g007
Figure 8. Multivariate analyses of the second transect (TL-2). (a) Dendrogram of cluster analysis. (b) Non-metric multidimensional scaling ordination results. Analyses based on square root transformed coverage data of benthic habitat types as determined by digital imaging analysis of the 93 photo-quadrats (i.e., sampling points) along TL-2.
Jmse 10 01643 g008
Cluster analysis recognized five benthic habitat zones, a seagrass zone (group A), a sand zone (group B), a soft coral zone along the reef flat (group C), patchy hard coral on the sand zones (group D), and a rubble and algae zone (group E) along TL-2 (Table S3). The nMDS showed a distinct separation of these habitat zones (Figure 8b), supporting the result of clustering (Figure 8a). The five benthic habitat clusters show a similarity of more than 66% (Table S3; Figure 8). Group A consists of the first 30 SP and includes shallow habitat types along the shoreline. This group shows a similarity of nearly 73%. Group B includes the following 27 SP up to the reef flat. This group shows a similarity of nearly 84%, the highest among the groups. Group C includes the following two SPs at the beginning of the reef flat. This group shows a similarity of nearly 79%. Group D is composed of habitat patches within the reef flat, crest, and slope. This group shows the lowest similarity among the groups roughly 67%. Group E includes habitat patches within the reef crest and reef slope. This group shows a similarity of nearly 69%. The habitat zones are distinguishable by their specific composition of habitat types (one-way ANOSIM, global R = 0.89, p = 0.001) (Table S4). SG and S are the defining factors for benthic habitat zone A, each contributing 49.4% and 33.0%, respectively, according to SIMPER analysis (Table S3). S (66.0%) is the most defining factor for group B. Group C is categorized by a mixed contribution from S (57.2%) and SC (36.8%). Group D is defined by S (29.4%) and HC (23.0%), followed by TA, R, and HA (10.1%, 10.0%, and 8.9%, respectively). Similarity within Group E is defined by R (78.8%) and algae (TA 16.6%, HA 14.0%, CA 10.3%) (Table S3).

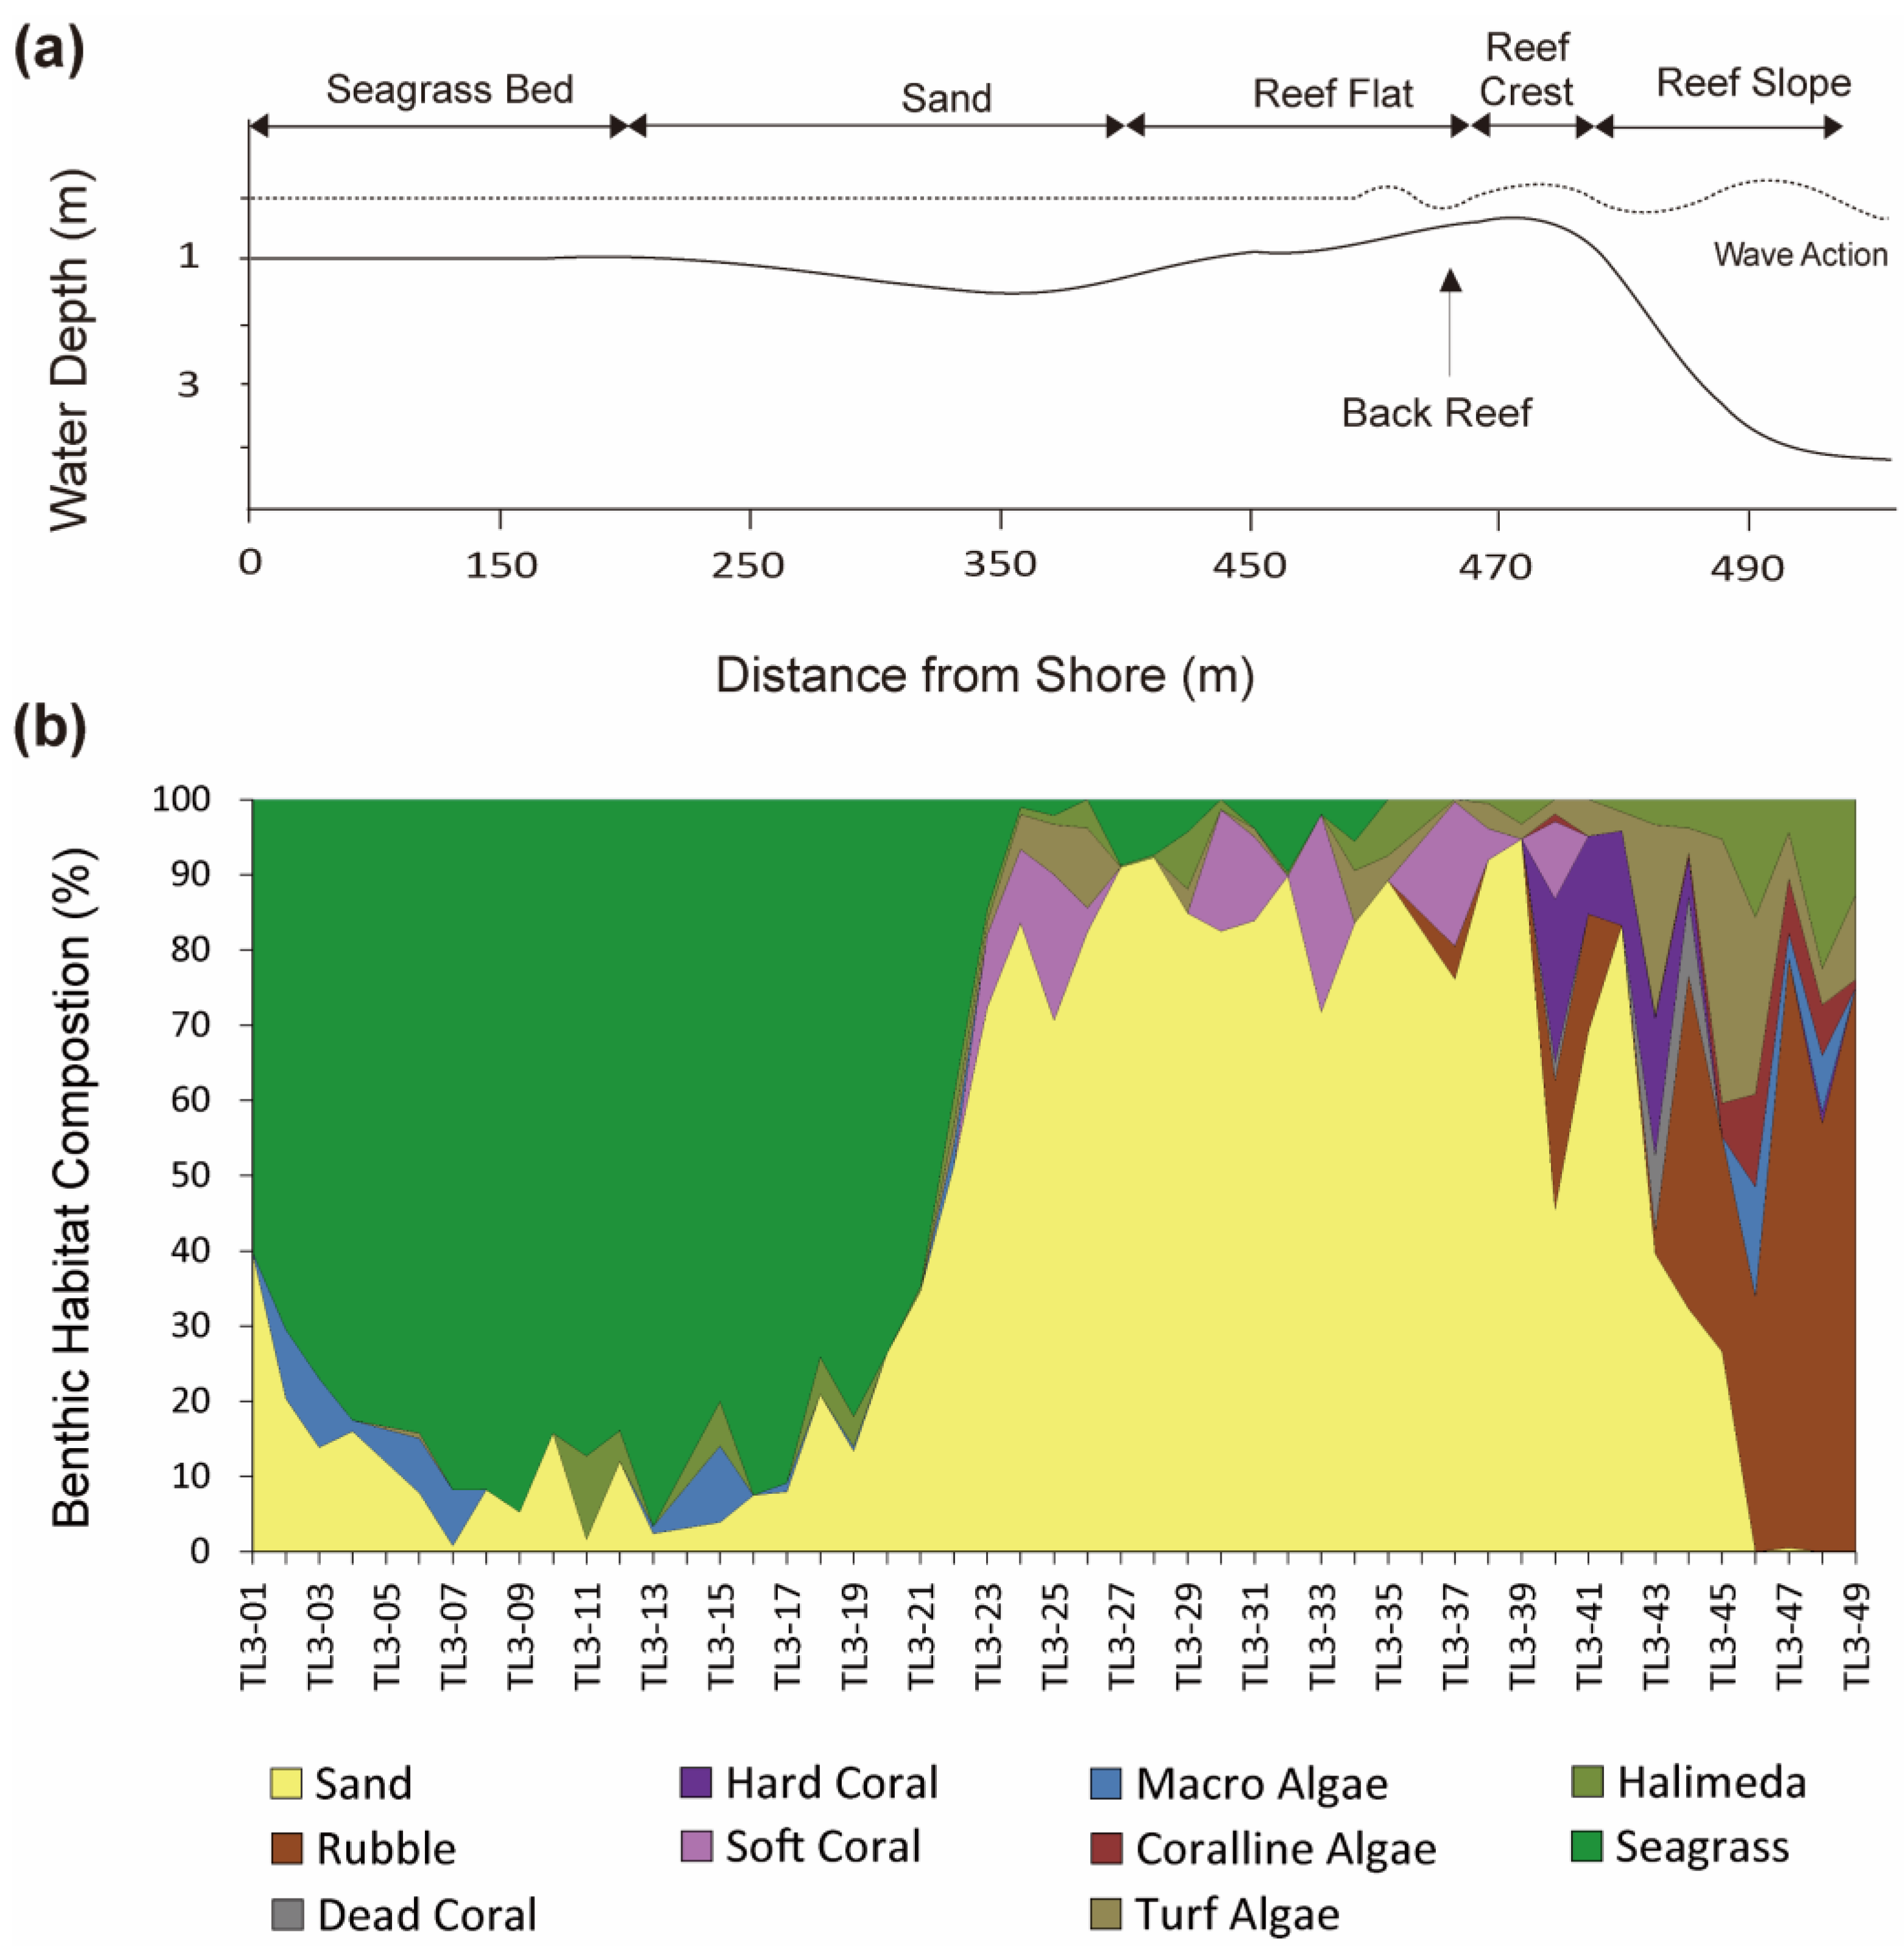
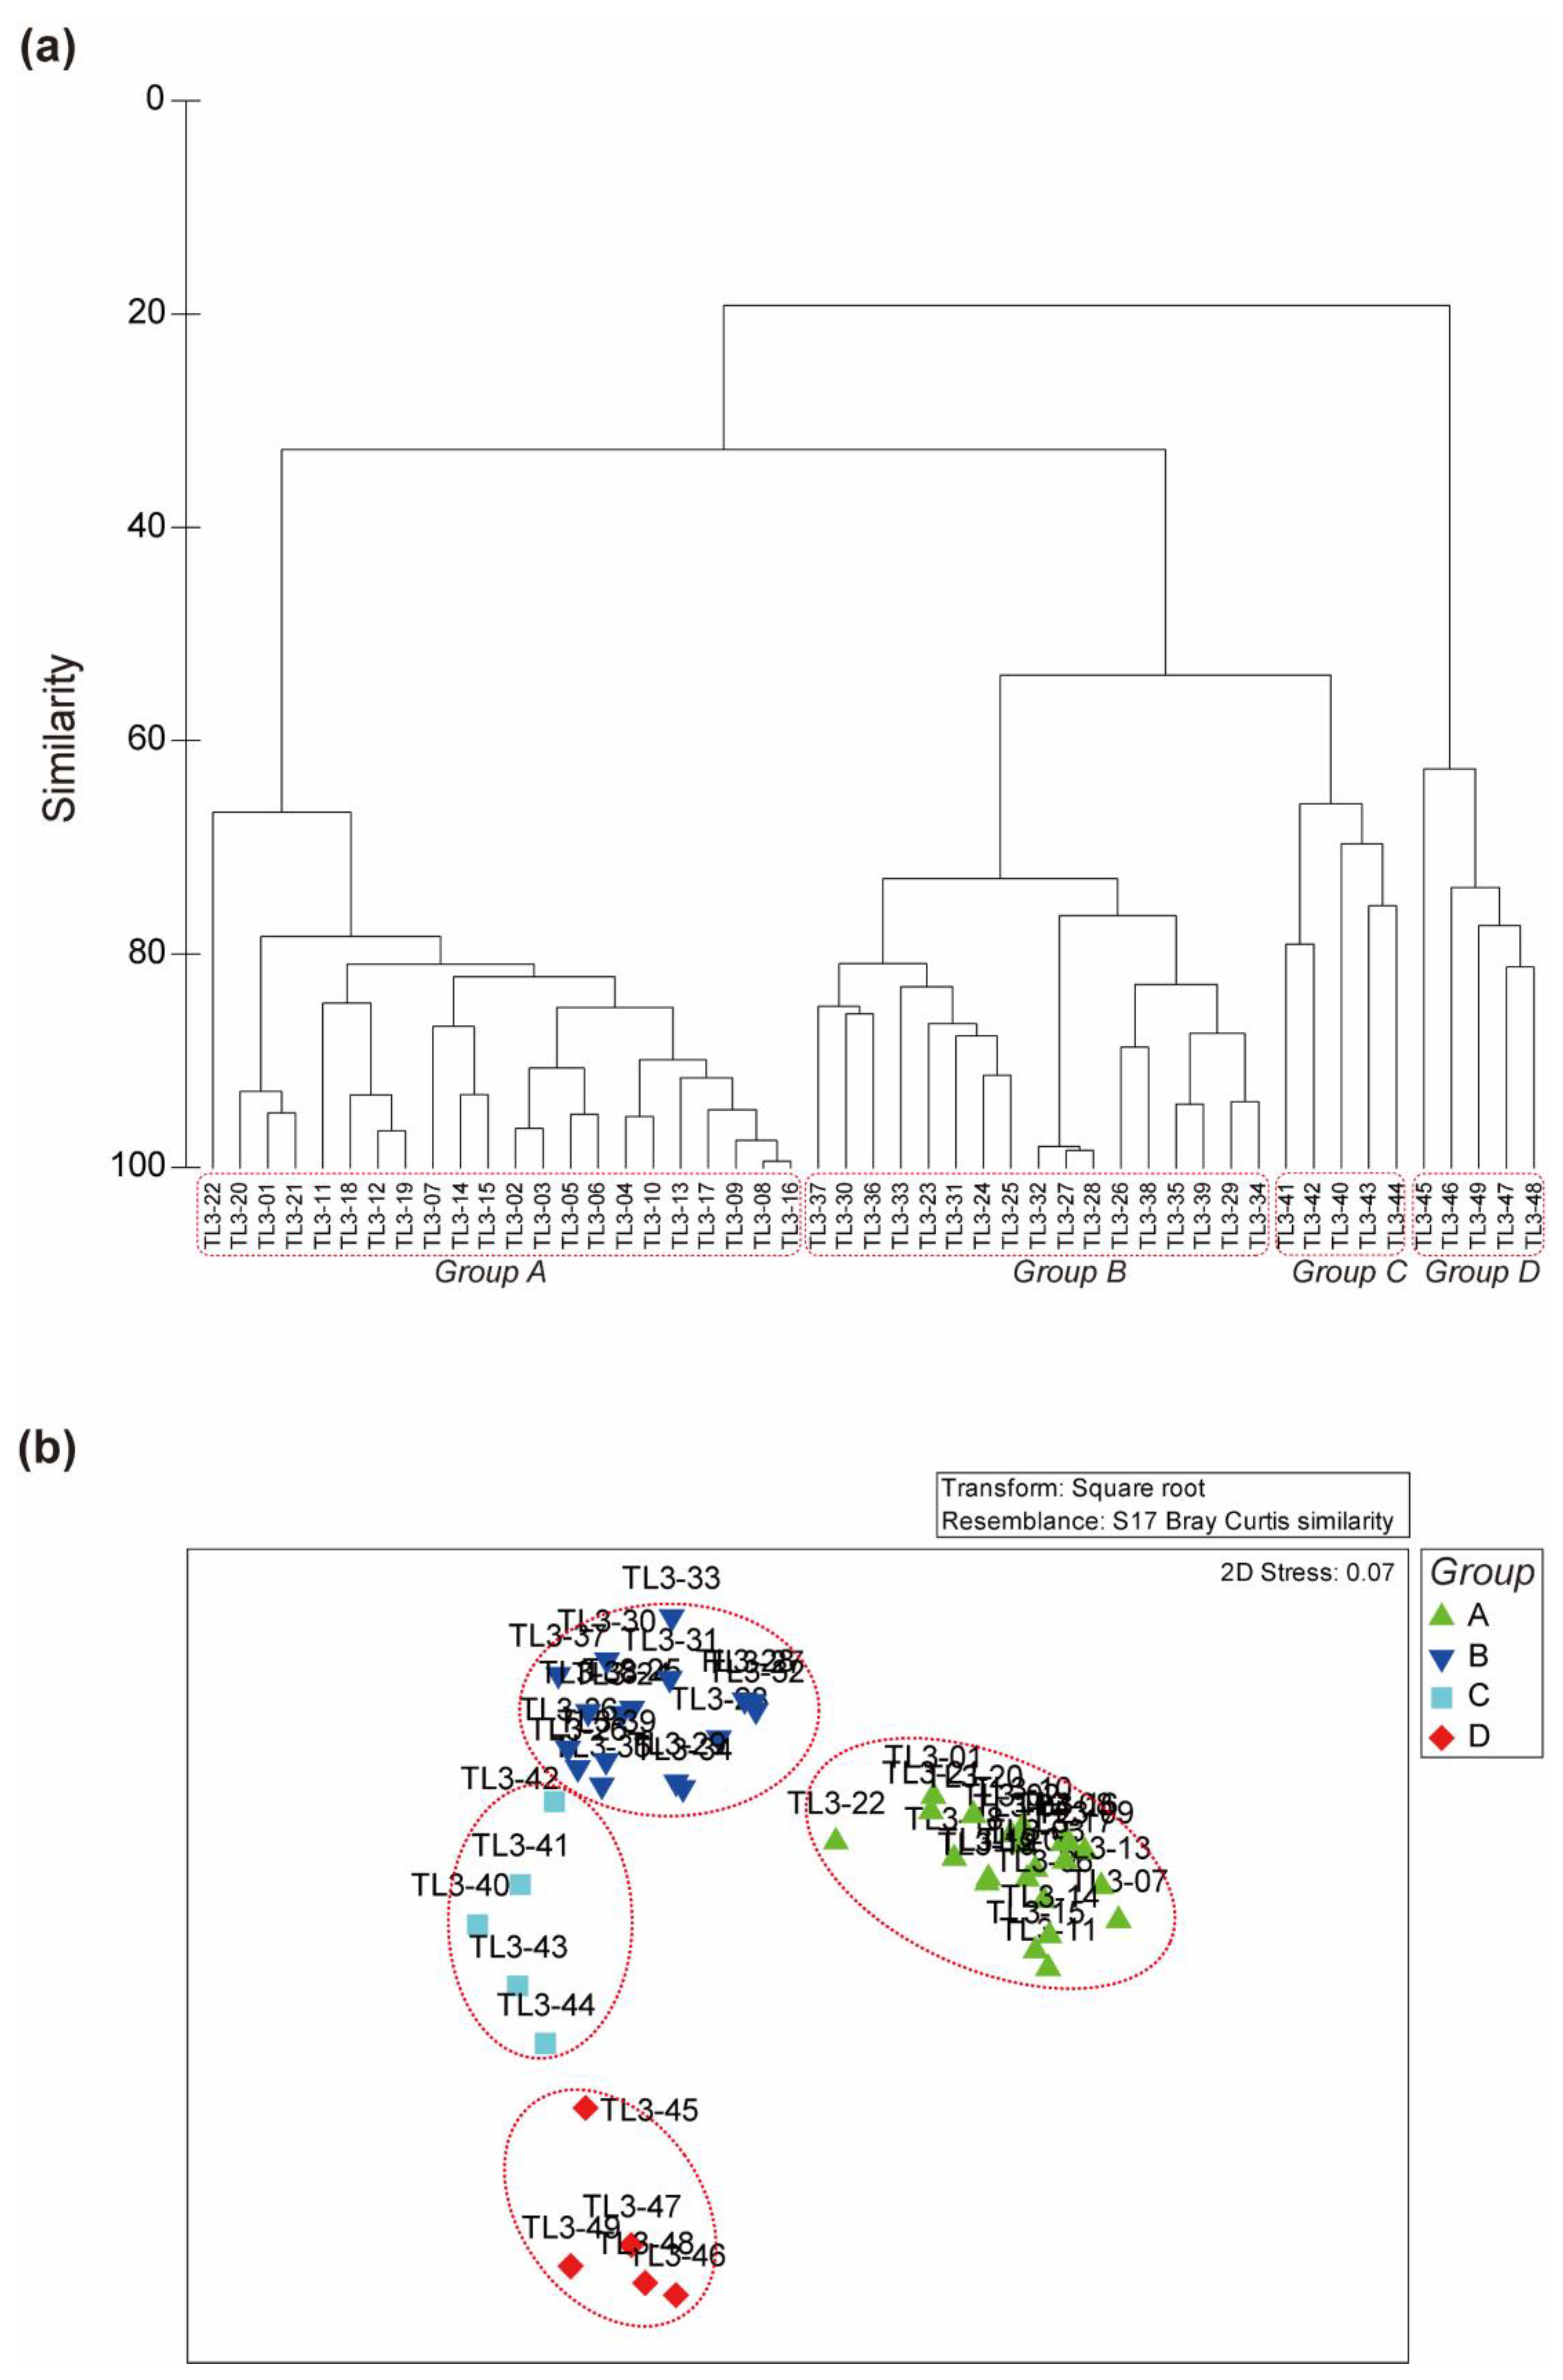
3.4. Transect Line-3 (TL-3)

The following relative coverages by benthic habitat types were determined in order of highest to lowest: S: 41.8%; SG: 37.4%; R: 7.3%; TA: 3.4%; HA: 2.9%; SC: 2.8%; MA: 1.7%; HC: 1.4%; CA: 0.7%; and DC: 0.5% (Table 2). S coverage (41.8%) in TL-3 is similar to the general mean of S of all three TL (42.4%). SG coverage (37.4%) is similar to that of TL-1 (37.2%) but higher than TL-2 (17.1%). SG is abundant, densely covering the bottom up to SP-23 (Figure 9b). SG coverage decreases after SP-23 and is largely substituted by TA and S, which increase in coverage from SP-21 seaward. SC communities are observed sporadically from SP-23, exhibiting a patchy distribution. HC colonies first appear at SP-36 but with relatively low coverage and patchy distribution. HC colonies are most abundant at the back reef and often co-occur with R. R is most abundant along the reef slope. CA coverage coincides with R coverage. HA is evenly distributed throughout the SPs, yet shows the highest coverage on the reef crest (Figure 9). Except for a very low abundance of Porifera, no MF was recorded (Table 2).
Cluster analysis recognized four benthic habitat zones, a seagrass in the sand zone (group A), a soft coral in the sand zone (group B), a hard coral in the sand zone (group C), and an algae-on-rubble zone (group D) along TL-3 (Table S5). The nMDS showed a distinct, isolated separation of these habitat zones (Figure 10b), supporting the result of clustering (Figure 10a). The four benthic habitat clusters show a similarity of more than 68% (Table S5; Figure 10). Group A includes the first 22 SP from the shoreline along the reef flat adjacent to the shore. This group shows a similarity of more than 81%, the highest similarity among the four groups (Table S5). Group B contains the following 17 SP of the reef flat. This group shows a similarity of more than 77%. Group C contains the SP on the back reef. This group shows a similarity of nearly 69%. Group D includes the SP from reef crest to reef slope. This group shows a similarity of nearly 71%. The habitat zones are distinguishable by their specific composition of habitat types (one-way ANOSIM, global R = 0.982, p = 0.001) (Table S6). The result of the SIMPER analysis shows that SG and S are defining factors for benthic habitat types in Group A, each contributing 73.2% and 21.5% in SIMPER analysis. Group B is defined mainly by S (76.2%). Group C is characterized by S (46.2%) and HC (21.8%). Group D shows distinct R (44.0%) coverage, followed by TA, HA, and CA (19.3%, 18.3%, 12.6%, respectively) (Table S5).

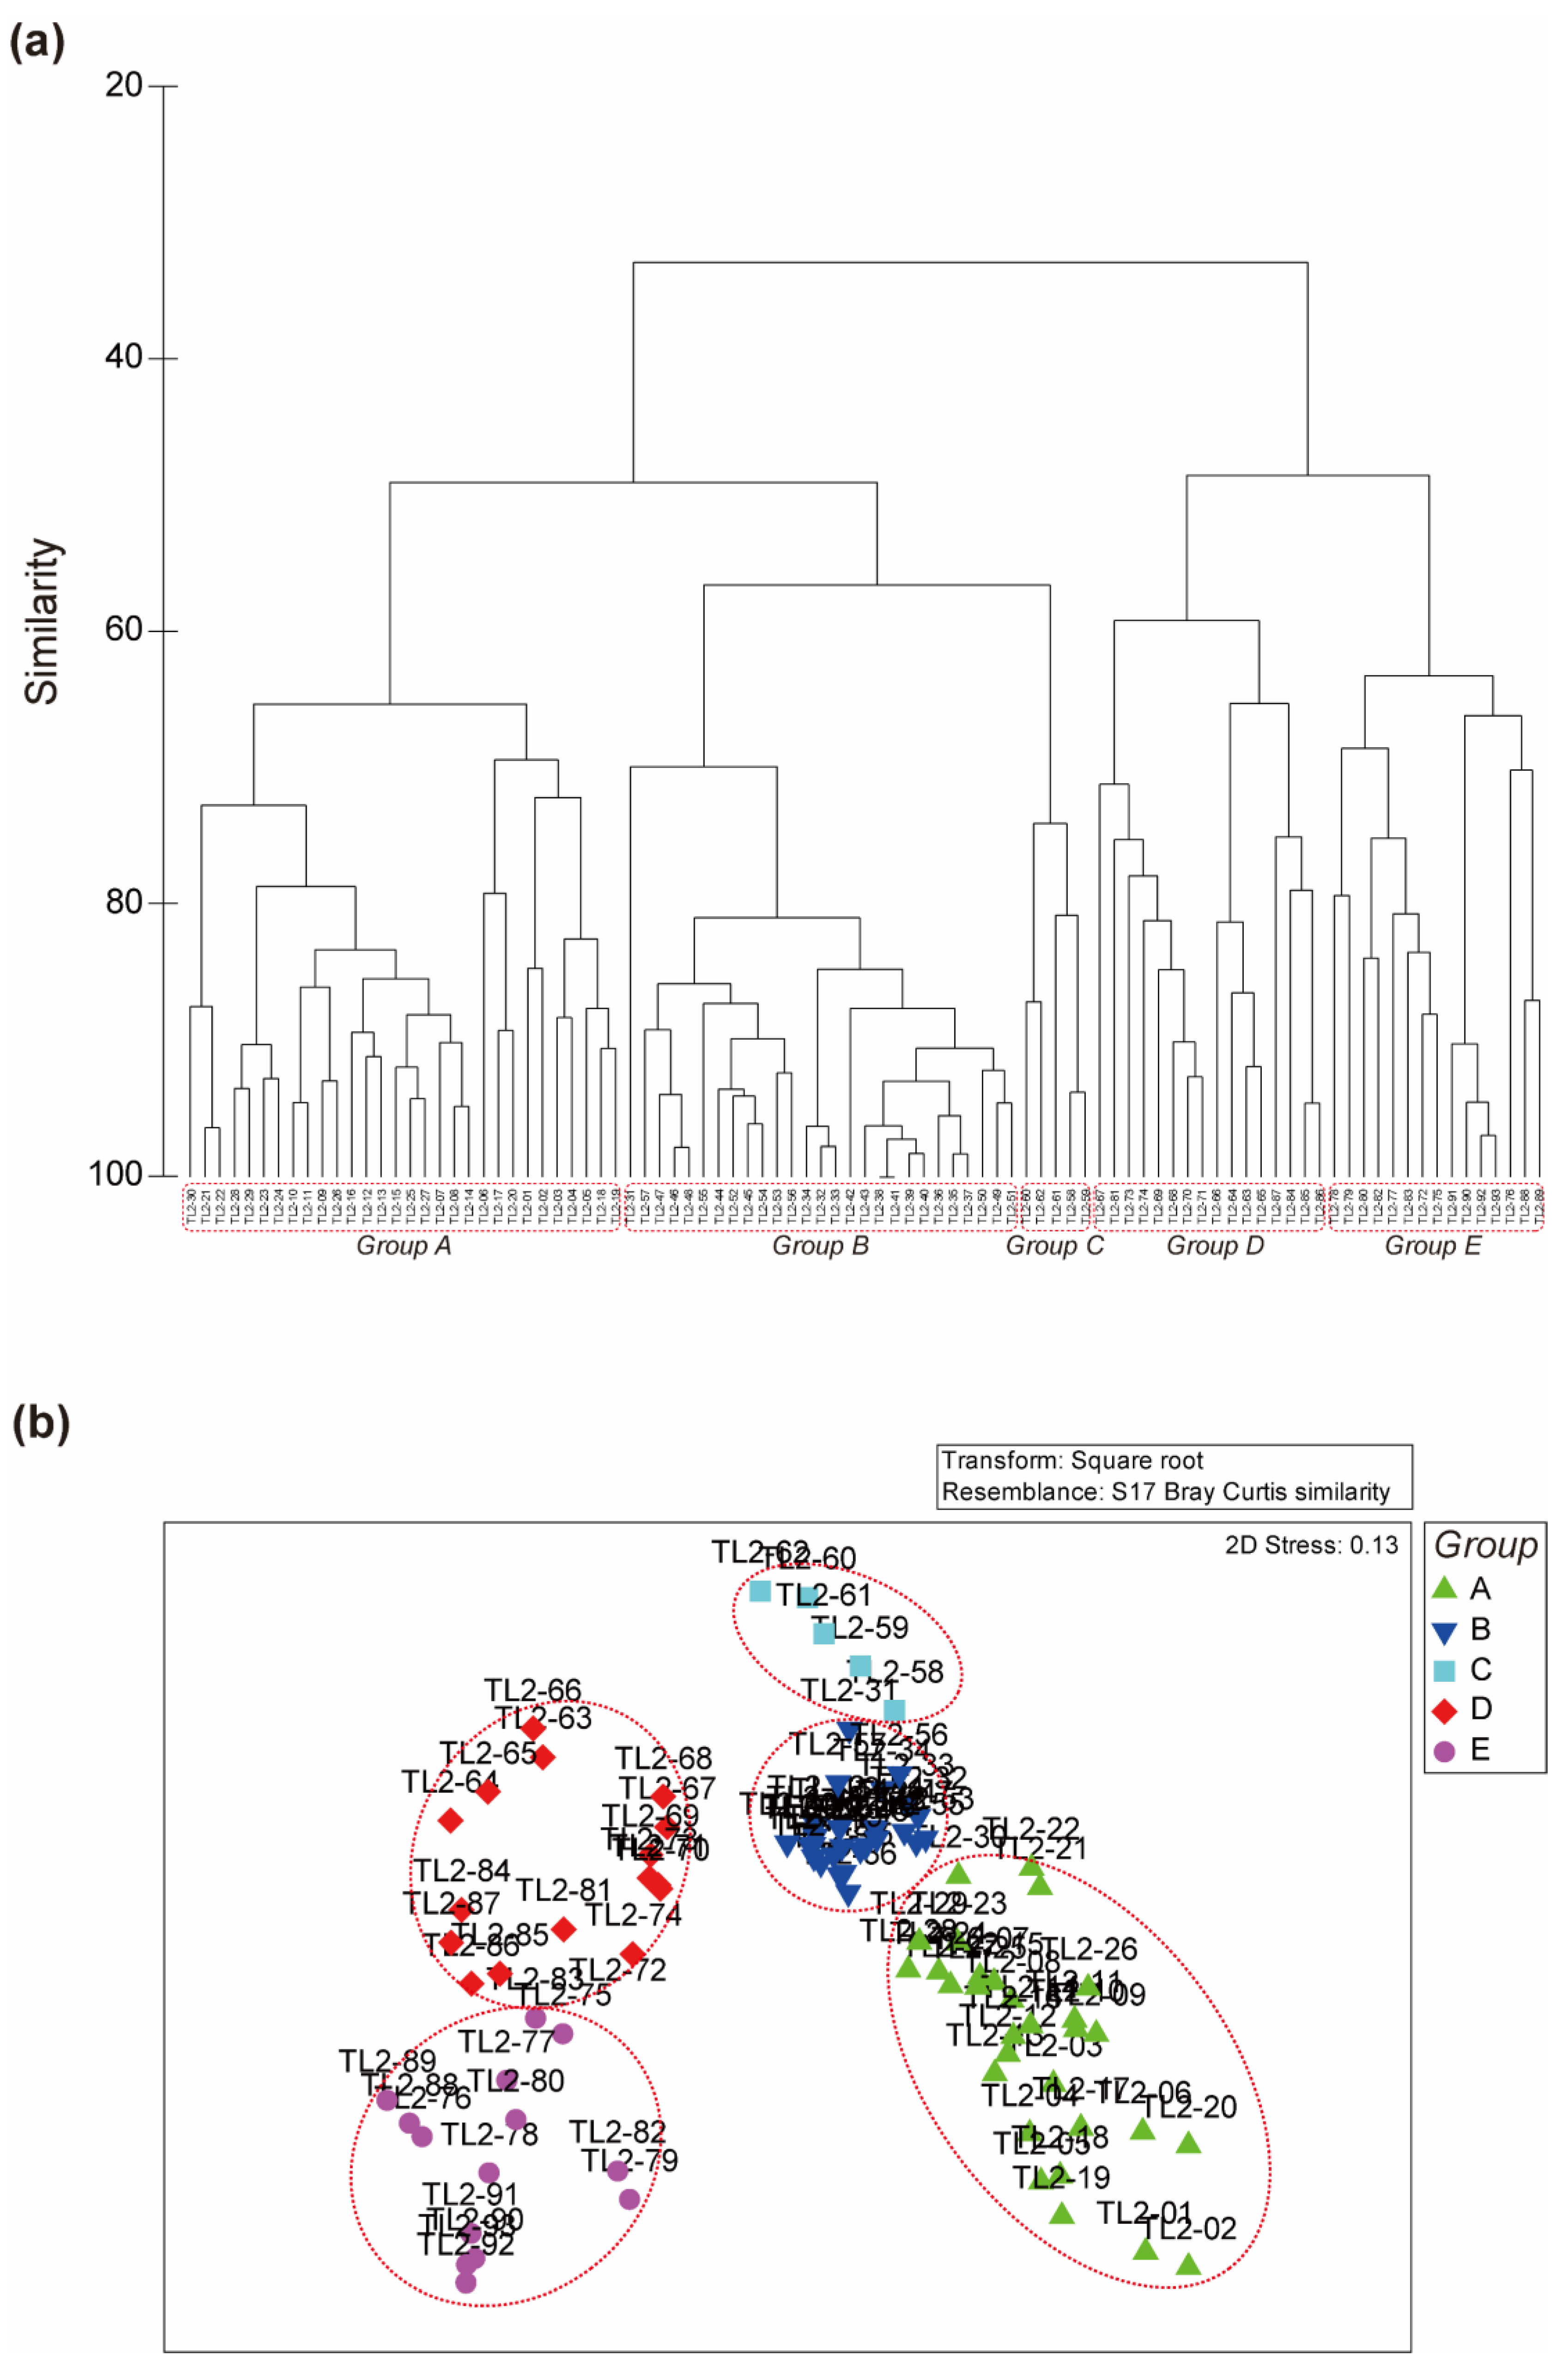
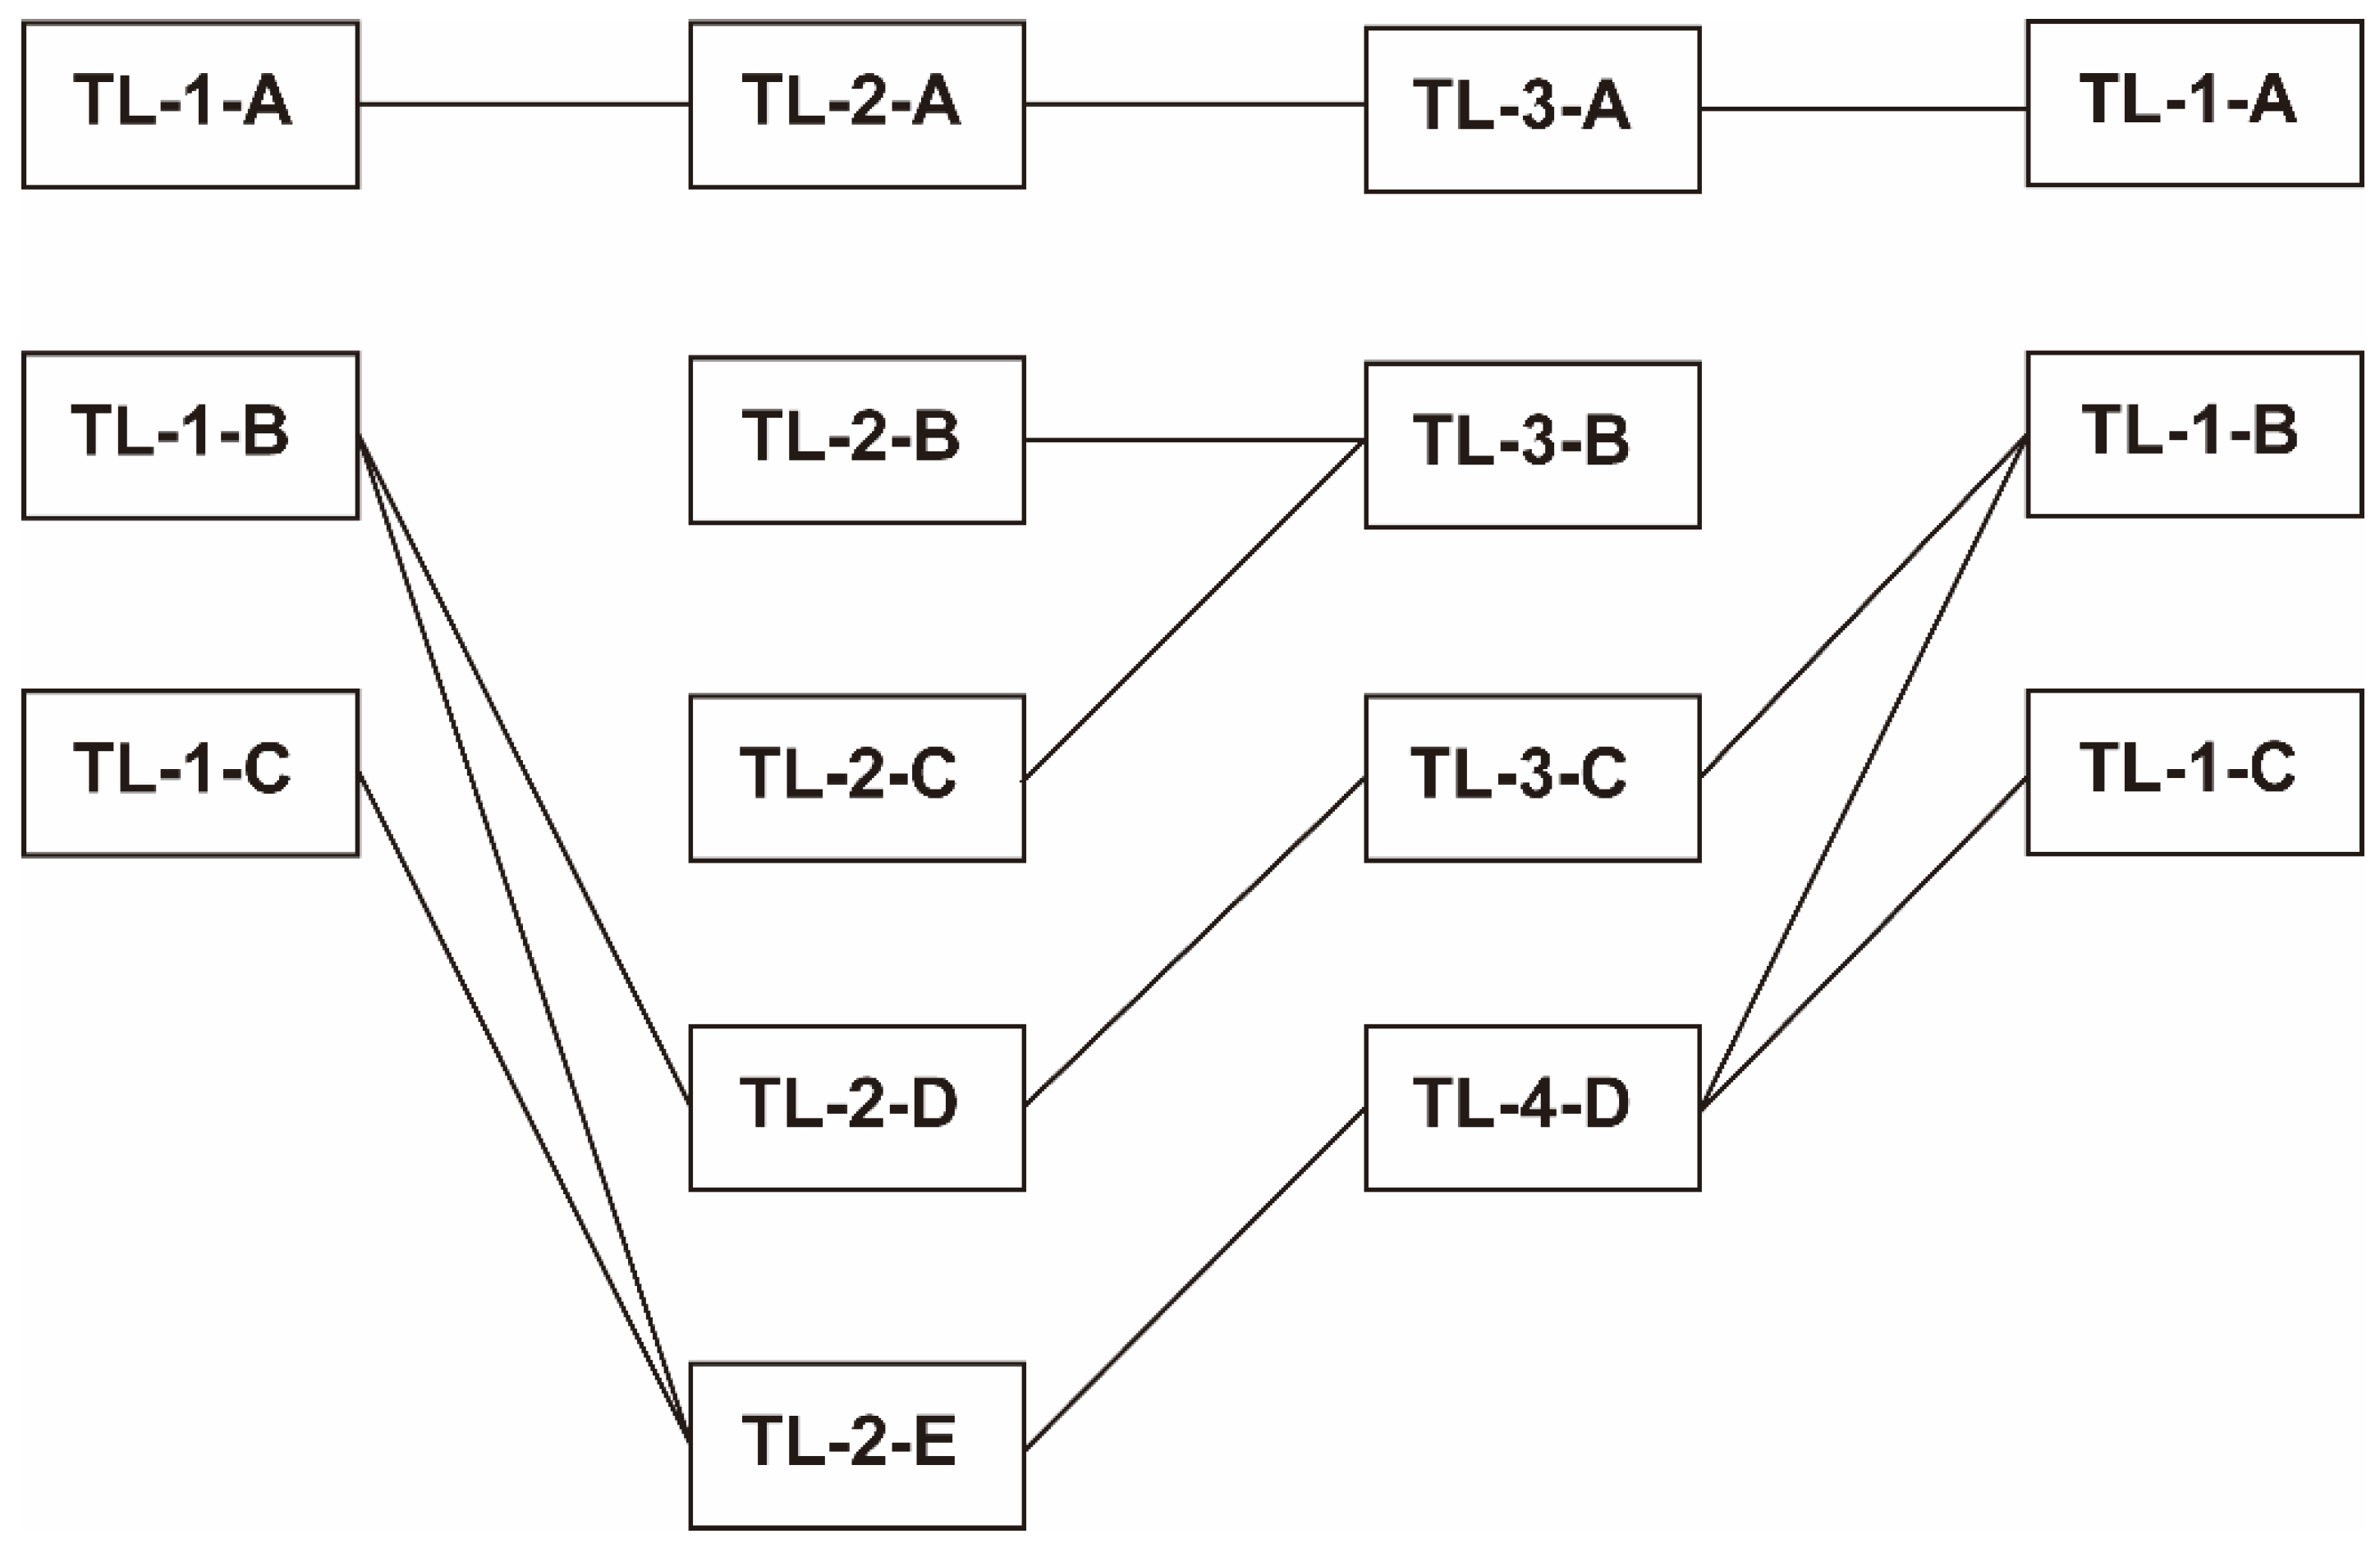
3.5. Comparison of Inter-Group Distance between the Three Transects

Inter-group distance (square root distance after attribute-standardization) was calculated between every ordination group of each TL for comparison (Figure 11). The level of comparative similarity defined that the distance is greater than the mean (Bray Curtis similarity) and standard deviation. The first group (TL-1-A group, TL-2-A group, TL-3-A group) of each TL is statistically similar. TL-2-B and C groups are similar to the TL-3-B group. The other ordination groups show similarities with several different groups of different TLs. TL-1-B is similar to either of the following three sets of groups: (1) TL-2-D, TL-3-C, TL-1-B; (2) TL-2-E, TL-4-D, TL-1-B; (3) TL-2-E, TL-4-D, TL-1-C. TL-1-C is similar to either of the following two sets of groups: (1) TL-2-E, TL-4-D, TL-1-B; (2) TL-2-E, TL-4-D, TL-1-C.
Figure 9. Benthic habitat evaluation results for the third transect line (TL-3). (a) Depth profile and topographical zonation from the shoreline to the reef edge. (b) Benthic habitat composition of the 49 sampling points (i.e., photo-quadrats) along TL-3.
Jmse 10 01643 g009
Figure 10. Multivariate analyses of the third transect (TL-3). (a) Dendrogram of cluster analysis. (b) Non-metric multidimensional scaling ordination results. Analyses based on square root transformed coverage data of benthic habitat types as determined by digital imaging analysis of the 49 photo-quadrats (i.e., sampling points) along TL-3.
Jmse 10 01643 g010
Figure 11. Statistical similarity between habitat groups along the three transect lines. Statistical similarity symbolized by the solid line: Mean − SD < Bray Curtis similarity < Mean + SD.
Jmse 10 01643 g011

4. Discussion

4.1. Assessment of Methodology

While providing coverage percentage data for each classification unit is a common way to present habitat assessment results [6,22,23,24,25], cluster analyses are usually applied to determine the zonation of statistically distinct faunal groups, e.g., coral genera [26], or fish communities [6] across specific reef sections. Rarely, clustering and ordination are applied to habitat zones to illuminate how statistically similar they are with respect to their faunal composition based on specific taxa, e.g., fish communities [6]. However, here, we applied cluster analysis to show how benthic habitat types (S, R, DC, R, HC, SC, MA, CA, TA, HA, SG, MF) determine the grouping of habitat zones (SP along the TL). Subsequent ordination was applied to visualize how isolated these habitat zone groups are from one another. By linking the resulting habitat zone groups with their locations along the TL, we found that the traditional reef zonation scheme differentiating reef flat, back reef, reef crest, and reef slope, may be an oversimplification of distinct habitat zones. Our methodology revealed that there may be distinct habitat zones with statistically different habitat type compositions occurring within each of these traditional zones.
Consequently, taxonomic groups that are sensitive to fine-scale environmental variation will be missed or neglected when this mosaic nature of habitat zones is not taken into account. Especially monitoring programs that are based on non-passive biodiversity data collection (e.g., trapping) must apply scale-relevant sampling protocols that consider environmental variation within habitat zones [27]. Nevertheless, there are several limitations to this methodology, first and foremost is the intense time consumption of manually mapping habitat boundaries. Satellite imagery and/or high-quality drone images may offer faster alternatives, although in-situ data is still needed to a certain extent to verify the interpretation of aerial images. Furthermore, the current method does not record coral health directly, hence coral color tracking and recognition of common diseases may be added to the scheme.

4.2. Benthic Habitat Zonation Patterns by Habitat Zone

Fringing reefs around volcanic islands are traditionally identified by their typical zonation pattern with a seaward gradient of mangrove forest, seagrass bed, and coral-dominated reef slope. The main substrate of mangrove and seagrass zones is sand, whereas the coral-dominated reef slope is built on dead coral or rock. Hard coral species distribution among reef flat, reef crest, and reef slope differs, as it is affected by specific hydrological, physical, and biological conditions (e.g., sedimentation, seawater quality, wave energy, competition, etc.) [28,29]. Therefore, the distribution of hard coral assemblages is limited by the wave energy occurring at the reef edge, and topography in general. Studies on the benthic habitat of the Red Sea have shown that Acropora assemblages are dominant on windward reefs, whereas Porites assemblages are dominant on leeward reefs, often forming a Porites ridge along the reef edge [26,30].
However, the hard coral species distribution of Weno Island’s fringing reef differed from this species-specific spatial pattern at fringing reefs in the Red Sea. The FSM is influenced by the trade winds and the northeast of Weno Island faces in a windward direction. Nevertheless, the reef edges of TL-1, 2, and 3 all showed individually different coral species compositions, depending on the exposure degree of the TL. Hard coral communities at TL-1 were dominated by Arcopora nobilis, whereas non-Acropora species were nearly absent (presence only of Pocillopora and Porites species of massive and submassive growth with very low abundance). On the other hand, TL-2 and TL-3 showed a considerably lower overall HC coverage percentage, while at both sites, the non-Acropora species dominated (especially Porites cylindrica). These differences in species composition may be explained by the particular topography at each site.
The first transect was laid within a sheltered area, whereas the other two transects were set in an exposed area, where wave action is rough. Acropora and Pocillopora are branching corals characterized by rapid growth and reproduction (mass spawning and recruitment events), whereas Porites is, primarily, a slow-growing massive coral [31]. However, Porites is less sensitive to extreme temperature variation and exposure to air than Acropora and Pocillopora [32]. It also tolerates high levels of fine particle sedimentation [33]. Hence, desiccation- and sedimentation-resistant Porites dominate the high-energy, shallow water, high sand content areas of TL-2 and TL-3, whereas fast-growing, more fragile Acropora dominate the low energy, sheltered areas of TL-1. However, despite the high energy environment along TL-3, the site showed the highest coverage of non-Acropora branching growth forms (i.e., branching Porites), as well as branching corals in general (i.e., Porites and Acropora).
This indicates that factors such as desiccation- and sedimentation-tolerances determine the spatial distribution of coral species within high-energy environments, whereas fragility (i.e., low skeletal strength) as a component of growth form plays a lesser role. This contrasts with results from a study at the Great Barrier Reef, where the plate and massive corals tended to dominate in intermediate to high wave exposure sites [34]. This study by Roelfsema et al. [34] used levels of wave exposure to predict the distribution of massive, plate and branching hard coral morphotypes through an ecological modeling approach. Given our results from TL-3, however, such a direct correlation between wave parameters and coral morphology must be considered with caution. Although total coral coverage at our high-wave-exposure site TL-3 is low, the few coral colonies recorded are primarily of the branching morphotype (although short-branched). Our result demonstrates that morphotype may not be a suitable hydrodynamic indicator for energy level.
However, although TL-1 showed more than fourth-fold the Acropora coverage compared to TL-2, Acropora species diversity was doubled at our second transect site, despite their generally low abundance (i.e., coverage percentage). This may be due to the pioneer way of the growth of Acropora, i.e., rapid recolonization after destructive natural disasters [35,36]. The region of TL-2 and TL-3 suffered catastrophic typhoon damage in the past (e.g., typhoons Pongsona and Chataan in 2002). The devastating effects are still apparent in three main ways: (1) the percentage of R coverage is considerably higher at the reef slopes of TL-2 and TL-3 than that at TL-1; (2) the percentage of total HC coverage in general at TL2 and TL-3 is comparably very low; (3) the HC assemblage that does occur features typical pioneer species and no clear dominance of a certain species. According to Freeman et al. [37], Weno Island classifies as a Northwest Pacific reef, statistically characterized by the highest annual storm frequency and mean temperature of all remote Pacific coral reefs, as well as a low seasonal cycle and limited nutrients. Another reason for the low abundance of hard corals in the exposed regions of Weno’s fringing reef may be the splash zone as a result of the high-energy environment that may inhibit the settlement of hard coral larvae.
Our benthic habitat mapping result showed that the coastal area in the northeast of Weno Island is dominated by dense seagrass beds on the sand bottom (Figure 2a, zone 1). However, at our first transect site, the nearshore environment showed no occurrence of a dense seagrass bed. Here, the seagrass cover appears further away from the shore, after areas of sand and rocks (Figure 2a, zones A, B). This may be explained by the construction of a boat dock, which involved dredging of the coastal area and the destruction of the mangrove forest. Seagrass and macroalgae species are affected by sedimentation (e.g., caused by dredging) [38]. As fine sediment suspended in the water column reduces light penetration, it can cause anoxia, and depress gas exchange in plants and algae [38]. Consequently, the photosynthetic rate of seagrasses and macroalgae decreases, enhancing the decline of these organisms [38].
Hence, the deviation from the general benthic habitat zonation pattern at TL-1 is caused by anthropogenic destruction of the natural habitat. Whereas the dredging may have initially destroyed the nearshore seagrass cover, the lack of a healthy mangrove forest may prevent the area from recovering. Mangroves act as “coastal kidneys”, absorbing unwanted nutrients and water-borne fine particles [39], which lowers sediment input, ultimately improving water visibility and light penetration, enforcing an increase in photosynthetic rates. Without such, the seagrass bed may have difficulties expanding back towards the shore again. Spatial competition is often caused by limited resources for light-dependent groups, such as photosynthetic corals and algae [23]. The density of zooxanthellate hard corals may decrease when (1) the density of azooxanthellate soft corals increases [40] or (2) benthic algae becomes dominant [41].
We found that Acropora assemblages in shallow depths hold a dominant position against soft coral with respect to spatial competition. At TL-1, where Acropora-dominated HC communities with respect to coverage percentage, no SC coverage was recorded. At the higher energy back reefs, branching Porites spp. and encrusting forms of the zooxanthellate soft coral genus Sinularia appear separately. It is known that massive hard corals and encrusting forms of soft corals are less susceptible to damage by wave action than the branching forms of tabulate corals [41]. Although, wave exposure may not be the primary controlling factor of growth form, as we also recorded branching forms of Porites in high-energy environments.

4.3. Benthic Habitat Zonation Patterns by Habitat Type Groups

While the fringing reef around Weno Island features the basic succession pattern of traditional habitat zones, statistical analyses revealed significant differences in sets of habitat type groups depending on location (i.e., TL-1, TL-2, TL-3). Each TL shows a unique set of habitat-type groupings. This can be explained by the varying degrees of location-specific environmental conditions, such as wave action strength or coastal environment type (e.g., mangroves, sand beach, rocky shore, urbanized shoreline, artificial structures such as piers, etc.), as well by biological factors, such as competition and predation. All of these factors influence benthic habitat zonation, either by limiting the spatial extent of habitat zones or by determining the specific set of habitat types within each zone.
Our inter-group distance comparison of the cluster groups of each TL showed that most groups are statistically intertwined, with high similarities to several other groups of different TLs. This can be explained by the presence of “transition zones”. When one distinct habitat type is exceeded by another, there is an area of intertwined habitat, a transition zone between two statistically separated habitat types. However, ordination group A was similar among all three TL. The B and C groups of TL-2 were statistically similar to the B group of TL-3. This means group A was environmentally comparable between all three transects, as well as TL-2-B, TL-2-C, and TL-3-B. The SIMPER results showed that this statistical similarity can be explained by the predominance of sand content at all three sites.
By combining coverage data of specific habitat types with cluster and ordination statistics and evaluating their statistical relationships with ANOSIM and SIMPER analyses, this study provides a statistical approach to quantifying fringing reef zonation patterns, while incorporating both seagrass beds and coral reef zones into the analyses. We believe this habitat zone-integrative methodology provides additional information that may benefit future coral reef ecology studies.

5. Conclusions

The two major research objectives of this benthic habitat study were (1) the development of a comparative methodology for the assessment of coral reef and seagrass bed as a joined habitat, and (2) the determination and discussion of the vertical habitat zonation from the coast to the reef edge of the fringing reef around Weno Island, Chuuk, FSM. Fringing reefs around volcanic islands are traditionally identified by their typical zonation pattern with a seaward gradient of mangrove forest, seagrass bed, and coral reef divided into reef flat, back reef, reef crest, and reef slope. Although the fringing reef of Weno Island also follows this basic reef zonation scheme, based on our clustering and ordination results, we conclude that this scheme may be an oversimplification of distinct habitat zones. Our analyses revealed distinct habitat zones with statistically different habitat type compositions occurring within each of these basic zones. These results highlight the suitability and superiority of applying for habitat type coverage percentage-based cluster and ordination analyses, followed by SIMPER and ANOSIM tests in such context. As habitat type coverage percentage data were used as a basis for analyses, the mosaic nature of habitat zones is integrated into the approach. Thus, the methodology developed here is a straightforward way to track environmental changes and pinpoint threats to coastal benthic habitats. It is also imperative to ensure representative biodiversity results featuring good quality, comparative data that can be used to determine how stressors may reconfigure coastal marine ecosystems and to ensure conservation effectiveness through functional zoning.
The spatial occupation of sessile organisms in tropical regions, such as hard coral, soft coral, seagrass, and macroalgae, is determined by a variety of factors, including irradiance, wave action, and nutrient levels [42]. Opposed to reports from the Red Sea, at Weno Island, the spatial distribution of hard coral species is less influenced by wind direction, and more related to topography-correlated wave energy. This concludes that hard coral species distribution is not primarily determined by wind direction, but rather by a combination of several hydrological and biological parameters. At Weno Island, hard coral species distribution was determined by wave action in the windward direction, by the coastal environment in the nearshore direction, and by a spatial competition for light. Our simple, repeatable methods provide a framework for benthic habitat-related monitoring research that allows the comparison of results across regions. Such comparisons will ultimately facilitate a better understanding of coastal ecosystems and seascapes.
One of the greatest challenges for assessing benthic habitat quality is the discrepancy in information volume between the physical and biological factors constituting a habitat [43]. By complementing in-situ habitat boundary GPS tracking, recording abiotic and biotic factors, as well as considering different morphologies of hard coral species, the method described in this study aimed at minimizing this discrepancy. Although we already applied an adapted version of the habitat classification scheme by the Australian Institute of Marine Science (AIMS), given the various impacts that different macrofaunal groups have on the reefs, future monitoring programs will benefit from further adjustments and advancements in technology and software development. Already, there are several automatic analyzing software programs available (e.g., Coral Point Count with Excel extensions (CPCe), or photoQuad) that are dedicated to ecological applications and use deep learning algorithms to obtain fast results. Hence, the outlining of each habitat category does not need to be completed manually anymore. Additionally, satellite imagery [44,45] and/or high-quality drone images may be used to complement in-situ data. Although, limited field data is still necessary to correct satellite and drone images. Furthermore, for specific coral health targeted monitoring, Coral Watch health charts (https://coralwatch.org, accessed on 29 September 2022) may be applied to record changes in coral color. It is a simple tool to monitor coral color as an indicator of coral health and fits in well with the simplicity necessary for an easily repeatable monitoring scheme.
With regard to simplifying the habitat classification scheme, we suggest splitting MF into sessile and vagile MF. Many vagile taxa may feed on corals, hence recording them as separate types improves early threat response. Likewise, sponges (i.e., Porifera) and tunicates (i.e., Tunicata) often cover and kill corals, hence, they should not be included in the sessile MF type but regarded as individual habitat types. This will improve monitoring regarding feeding pressure on coral reefs. On the other hand, fire corals (i.e., Millepora spp.) and the blue coral (i.e., Heliopora coerulea) should just be recorded as part of the hard coral (HC) habitat type, and zoanthids (i.e., Zoantharia) either as its own habitat type or as part of the soft coral (SC) type. This will eradicate unnecessary complexity in the classification scheme. We further suggest adding “energy”, classified in high-, intermediate-, and low-energy environments, as habitat types to the abiotic habitat group. As our results and other studies have shown, the spatial distribution of hard coral species along the reef is, in part, influenced by wave energy.

Supplementary Materials

The following supporting information can be downloaded at: https://www.mdpi.com/article/10.3390/jmse10111643/s1, Table S1: SIMPER results of the first transect (TL-1); Table S2: ANOSIM results of the first transect (TL-1); Table S3: SIMPER results of the second transect (TL-2); Table S4: ANOSIM results of the second transect (TL-2); Table S5: SIMPER results of the third transect (TL-3); Table S6: ANOSIM results of the third transect (TL-3).

Author Contributions

Conceptualization, T.K. and H.-S.P.; methodology, T.K., D.-W.L. and H.-J.K.; software, Y.-H.J., J.-H.O. and T.-H.K.; validation, Y.-U.C. and D.-H.K.; formal analysis, T.K. and D.-W.L.; investigation, T.K. and H.-J.K.; data curation, T.K., Y.-H.J. and Y.-U.C.; writing, T.K.; visualization, J.-H.O. and T.-H.K.; supervision, H.-S.P.; funding acquisition, H.-S.P. All authors have read and agreed to the published version of the manuscript.

Funding

This research was supported by the Korea Institute of Ocean Science and Technology (KIOST), grant numbers PEA0016, PEA0025.

Institutional Review Board Statement

Not applicable.

Informed Consent Statement

Not applicable.

Data Availability Statement

Not applicable.

Acknowledgments

We greatly appreciate the help of the local staff and researchers from the Korea-South Pacific Research Center (KSORC). We also appreciate the permission from the Chuuk department of Marine Resources and the chieftains of Sapuk village in Weno Island, who assisted in securing survey permits to conduct this project.

Conflicts of Interest

The authors declare no conflict of interest.

References

  1. Lohrer, A.M.; Fukui, Y.; Wada, K.; Whitlatch, R.B. Structural complexity and vertical zonation of intertidal crabs, with focus on habitat requirements of the invasive Asian shore crab, Hemigrapsus sanguineus (de Haan). J. Exp. Mar. Biol. Ecol. 2000, 244, 203–217. [Google Scholar] [CrossRef]
  2. Oakley-Cogan, A.; Tebbett, S.B.; Bellwood, D.R. Habitat zonation on coral reefs: Structural complexity, nutritional resources and herbivorous fish distributions. PLoS ONE 2020, 15, e0233498. [Google Scholar] [CrossRef] [PubMed]
  3. Song, K.; Mi, C.-R.; Zhao, Y.-Z.; Yang, N.; Sun, Y.-H.; Xu, J.-L. Zonation of nature reserve according to the habitat requirement of conservation target: A case study on the endangered Brown Eared-Pheasant at Baihuashan Nature Reserve. Glob. Ecol. Conserv. 2021, 32, e01941. [Google Scholar] [CrossRef]
  4. Ninio, R.; Meekan, M.G. Spatial patterns in benthic communities and the dynamics of a mosaic ecosystem on the Great Barrier Reef, Australia. Coral Reefs 2002, 21, 95–104. [Google Scholar] [CrossRef]
  5. Harborne, A.R.; Mumby, P.J.; Micheli, F.; Perry, C.T.; Dahlgren, C.P.; Holmes, K.E.; Brumbaugh, D.R. The functional value of Caribbean coral reef, seagrass and mangrove habitats to ecosystem processes. Adv. Mar. Biol. 2006, 50, 57–189. [Google Scholar] [CrossRef]
  6. De Mazières, J. Spatial Distribution of Reefr Fish Communities an Investigation of the Coral Coast, Fiji Islands. Master’s Thesis, The University of the South Pacific, Suva, Fiji, 2008. [Google Scholar]
  7. Jackson, E.; Rowden, A.A.; Attrill, M.J.; Bossey, S.J.; Jones, M.B. The importance of seagrass beds as a habitat for fishery species. Oceanogr. Mar. Biol. Annu. Rev. 2001, 39, 269–303. [Google Scholar]
  8. Gillanders, B.M. Seagrasses, fish, and fisheries. In Seagrasses: Biology, Ecology and Conservation; Larkum, A.W.D., Orth, R.J., Duarte, C.M., Eds.; Springer: Berlin/Heidelberg, Germany, 2006. [Google Scholar]
  9. Borum, J.; Sand-Jensen, K.; Binzer, T.; Pedersen, O. Oxygen movement in seagrasses. In Seagrasses: Biology, Ecology and Conservation; Larkum, A.W.D., Orth, R.J., Duarte, C.M., Eds.; Springer: Dordrecht, The Netherlands, 2006. [Google Scholar]
  10. Mateo, M.A.; Cebrián, J.; Dunton, K.; Mutchler, T. Carbon flux in seagrass ecosystems. In Seagrasses: Biology, Ecology and Conservation; Larkum, A.W.D., Orth, R.J., Duarte, C.M., Eds.; Springer: Berlin/Heidelberg, Germany, 2006. [Google Scholar]
  11. Marbà, N.; Holmer, M.; Gacia, E.; Barrón, C. Seagrass beds and coastal biogeochemistry. In Seagrasses: Biology, Ecology and Conservation; Larkum, A.W.D., Orth, R.J., Duarte, C.M., Eds.; Springer: Berlin/Heidelberg, Germany, 2006. [Google Scholar]
  12. Romero, J.; Lee, K.-S.; P´erez, M.; Mateo, M.A.; Alcoverro, T. Nutrient dynamics in seagrass ecosystems. In Seagrasses: Biology, Ecology and Conservation; Larkum, A.W.D., Orth, R.J., Duarte, C.M., Eds.; Springer: Berlin/Heidelberg, Germany, 2006. [Google Scholar]
  13. Sheppard, C.R.C.; Davy, S.K.; Pilling, G.M.; Graham, N.A.J. The Biology of Coral Reefs; Oxford University Press: Oxford, UK, 2017. [Google Scholar]
  14. Wilkinson, C. Status of Coral Reefs of the World; Australian Institute of Marine Science: Townsville, Australia, 2004.
  15. Pandolfi, J.M.; Bradbury, R.H.; Sala, E.; Hughes, T.P.; Bjorndal, K.A.; Cooke, R.G.; McArdle, D.; McClenachan, L.; Newman, M.J.; Paredes, G.; et al. Global trajectories of the long-term decline of coral reef ecosystems. Science 2003, 301, 955–958. [Google Scholar] [CrossRef] [PubMed] [Green Version]
  16. Hoegh-Guldberg, O.; Mumby, P.J.; Hooten, A.J.; Steneck, R.S.; Greenfield, P.; Gomez, E.; Harvell, C.D.; Sale, P.F.; Edwards, A.J.; Caldeira, K.; et al. Coral reefs under rapid climate change and ocean acidification. Science 2007, 318, 1737–1742. [Google Scholar] [CrossRef] [Green Version]
  17. George, A.; Luckymis, M.; Palik, S.; Joseph, E.; Mathias, D.; Malakai, S.; Nakayama, M.R.; Graham, C.; Rikim, K.; Marcus, A.; et al. The State of Coral Reef Ecosystems of the Federated States of Micronesia; Secretariat of the Pacific Regional Environment Programme (SPREP): Apia, Samoa, 2007. [Google Scholar]
  18. Hill, J.; Wilkinson, C. Methods for Ecological Monitoring of Coral Reefs; Australian Institute of Marine Science: Townsville, Australia, 2004.
  19. Jonker, M.; Johns, K.; Osborne, K. Surveys of Benthic Reef Communities Using Underwater Digital Photography and Counts of Juvenile Corals; Australian Institute of Marine Science: Townsville, Australia, 2008.
  20. Littler, M.M.; Littler, D.S.; Brooks, B.L. Harmful algae on tropical coral reefs: Bottom-up eutrophication and top-down herbivory. Harmful Algae 2006, 5, 565–585. [Google Scholar] [CrossRef]
  21. Clarke, K.R.; Warwick, R.M. Change in Marine Communities: An Approach to Statistical Analysis and Interpretation, 2nd ed.; PRIMER-E Ltd.: Plymouth, UK, 2001. [Google Scholar]
  22. Morrissey, J. Community structure and zonation of macroalgae and hermatypic corals on a fringing reef flat of Magnetic Island (Queensland, Australia). Aquat. Bot. 1980, 8, 91–139. [Google Scholar] [CrossRef]
  23. Reichelt, R.E.; Loya, Y.; Bradbury, R.H. Patterns in the use of space by benthic communities on two coral reefs of the Great Barrier Reef. Coral Reefs 1986, 5, 73–79. [Google Scholar] [CrossRef]
  24. Iryu, Y.; Nakamori, T.; Matsuda, S.; Abe, O. Distribution of marine organisms and its geological significance in the modern reef complex of the Ryukyu Islands. Sediment. Geol. 1995, 99, 243–258. [Google Scholar] [CrossRef]
  25. Nakamura, T.; Nakamori, T. Population dynamics of hermatypic coral communities on reef slope vs. reef flat at Shiraho, Ishigaki Island, southwest Japan. In Proceedings of the 10th International Coral Reef Symposium, Okinawa, Japan, 28 June–2 July 2004; pp. 460–477. [Google Scholar]
  26. Riegl, B.; Piller, W.E. Mapping of benthic habitats in northern Safaga Bay (Red Sea, Egypt): A tool for proactiUe management. Aquat. Conserv. Mar. Freshw. Ecosyst. 2000, 10, 127–140. [Google Scholar] [CrossRef]
  27. Mehrabi, Z.; Slade, E.M.; Solis, A.; Mann, D.J. The importance of microhabitat for biodiversity sampling. PLoS ONE 2014, 9, e114015. [Google Scholar] [CrossRef] [PubMed] [Green Version]
  28. Done, T.J. Coral zonation: Its nature and significance. In Perspectives on Coral Reefs; Barnes, D.J., Ed.; Australian Institute of Marine Science: Townsville, Australia, 1983; p. 277. [Google Scholar]
  29. Done, T.J. Coral community adaptability to environmental change at the scales of regions, reefs and reef zones. Am. Zool. 1999, 39, 66–79. [Google Scholar] [CrossRef] [Green Version]
  30. Riegl, B.; Piller, W.E. Distribution and Environmental Control of Coral Assemblages in Northern Safaga Bay (Red Sea, Egypt). Facies 1997, 36, 141–162. [Google Scholar] [CrossRef]
  31. Loya, Y.; Sakai, K.; Yamazato, K.; Nakano, Y.; Sambali, H.; van Woesik, R. Coral bleaching: The winners and the losers. Ecol. Lett. 2001, 4, 122–131. [Google Scholar] [CrossRef]
  32. Marshall, P.A.; Baird, A.H. Bleaching of corals on the Great Barrier Reef: Differential susceptibilities among taxa. Coral Reefs 2000, 19, 155–163. [Google Scholar] [CrossRef]
  33. Pichon, M. Porites. In Encyclopedia of Earth Sciences Series; Springer: Berlin/Heidelberg, Germany, 2011; pp. 653–655. [Google Scholar]
  34. Roelfsema, C.; Kovacs, E.; Ortiz, J.C.; Wolff, N.H.; Callaghan, D.; Wettle, M.; Ronan, M.; Hamylton, S.M.; Mumby, P.J.; Phinn, S. Coral reef habitat mapping: A combination of object-based image analysis and ecological modelling. Remote Sens. Environ. 2018, 208, 27–41. [Google Scholar] [CrossRef]
  35. Babcock, R.C.; Bull, G.D.; Harrison, P.L.; Heyward, A.J.; Oliver, J.K.; Wallace, C.C.; Willis, B.L. Synchronous spawnings of 105 scleractinian coral species on the Great Barrier Reef. Mar. Biol. 1986, 90, 379–394. [Google Scholar] [CrossRef]
  36. Connell, J.H.; Hughes, T.P.; Wallace, C.C.; Kerr, A.M. A long-term study of competition and diversity of corals. Ecol. Monogr. 2004, 74, 179–210. [Google Scholar] [CrossRef]
  37. Freeman, L.A.; Miller, A.J.; Norris, R.D.; Smith, J.E. Classification of remote Pacific coral reefs by physical oceanographic environment. J. Geophys. Res. Oceans 2012, 117, C02007. [Google Scholar] [CrossRef] [Green Version]
  38. Onuf, C.P. Seagrasses, dredging and light in Laguna Madre, Texas, U.S.A. Estuar. Coast. Shelf. Sci. 1994, 39, 75–91. [Google Scholar] [CrossRef]
  39. Duke, N.C. Mangrove islands. In Encyclopedia of Earth Sciences Series; Springer: Berlin/Heidelberg, Germany, 2011; pp. 653–655. [Google Scholar]
  40. Benayahu, Y.; Loya, Y. Competition for space among coral-reef sessile organisms at Eilat, Red Sea. Bull. Mar. Sci. 1981, 31, 514–522. [Google Scholar]
  41. Done, T.J. Phase shifts in coral reef communities and their ecological significance. Hydrobiologia 1992, 247, 121–132. [Google Scholar] [CrossRef]
  42. Chadwick, N.E.; Morrow, K.M. Competition among sessile organisms on coral reefs. In Coral Reefs: An Ecosystem in Transition; Springer: Berlin/Heidelberg, Germany, 2011; pp. 347–371. [Google Scholar]
  43. Diaz, R.J.; Solan, M.; Valente, R.M. A review of approaches for classifying benthic habitats and evaluating habitat quality. J. Environ. Manag. 2004, 73, 165–181. [Google Scholar] [CrossRef]
  44. Roelfsema, C.M.; Kovacs, E.M.; Ortiz, J.C.; Callaghan, D.P.; Hock, K.; Mongin, M.; Johansen, K.; Mumby, P.J.; Wettle, M.; Ronan, M.; et al. Habitat maps to enhance monitoring and management of the Great Barrier Reef. Coral Reefs 2020, 39, 1039–1054. [Google Scholar] [CrossRef]
  45. Roelfsema, C.M.; Lyons, M.B.; Castro-Sanguino, C.; Kovacs, E.M.; Callaghan, D.; Wettle, M.; Markey, K.; Borrego-Acevedo, R.; Tudman, P.; Roe, M.; et al. How Much Shallow Coral Habitat Is There on the Great Barrier Reef? Remote Sens. 2021, 13, 4343. [Google Scholar] [CrossRef]
Figure 1. Location map. (a) Chuuk Atoll of the Federated States of Micronesia. Red dotted square marks Weno Island. (b) Weno Island within the Chuuk Atoll. Red dotted square marks study site.
Jmse 10 01643 g001
Figure 2. Sampling area. (a) Boundary of habitat types as determined manually. (b) Location of the three transect lines for habitat investigation by photo-quadrats.
Jmse 10 01643 g002
Figure 3. Process of digital image analysis. (a) In situ image of photo-quadrat in coral reef habitat (b) Coral reef habitat type resulting from analysis of in situ image. DC: dead coral, HC1: hard coral, non-Acropora submassive, HC2: hard coral, non-Acropora massive, CA: coralline algae, HA: Halimeda spp., TA: turf algae, MA: macroalgae, S: sand. (c) In situ image of photo-quadrat in seagrass bed. (d) Seagrass bed habitat type resulting from analysis of in situ image. SG: seagrass; S: sand; MA: macroalgae.
Jmse 10 01643 g003
Figure 4. Relative coverage of hard coral morphotype along each transect line (TL). NA: Non-Acropora species; A: Acropora species.
Jmse 10 01643 g004
Table 1. Classification scheme of benthic habitat, and data collected in this study.
GroupTypeClassificationTaxonMorphology
AbioticSand---
Rubble---
Dead coral---
Rock---
CoralHard coral Acropora
(Cnidaria: Anthozoa: Hexacorallia: Scleractinia: Acroporidae)
Acropora millepora (Ehrenberg, 1834)
Acropora monticulosa (Brüggemann, 1879)
Acropora nobilis (Dana, 1846)
Acropora sp.
Bottlebrush
Branching
Digitate
Tabulate
Encrusting
Submassive
Non-AcroporaFungiidae spp.
Montipora spp.
Pavona spp.
Pocillopora spp.
Porites spp.
Porites cylindrica Dana, 1846
Branching
Encrusting
Foliaceous
Massive
Submassive
Mushroom
Solitary
Soft coral Cnidaria: Anthozoa: Octocorallia: AlcyonaceaAlcyonium sp.
Sinularia sp.
-
AlgaeMacroalgaeBrown macroalgae
(Phaeophyta)
Dictyota spp.
Padina spp.
Sargassum spp.
Turbinaria spp.
-
Red macroalgae (Rhodophyta)Actinotrichia spp.-
Green macroalgae (Chlorophyta)Bornetella spp.
Caulerpa spp.
Codium spp.
-
Coralline algaeRhodophyta: Corallinales--
Turf algaeMicroalgae,
Juvenile macroalgae,
Cyanobacteria
--
HalimedaChlorophyta: UlvophyceaeHalimeda spp.-
SeagrassAngiospermae:
Alismatales
Thalassia hemprichii Ascherson, 1871
Cymodocea rotundata Ascherson & Schweinfurt, 1870
Syringodium isoetifolium Dandy, 1939
Enhalus acoroides Royle, 1839
-
OtherMacrofaunaPorifera--
Tunicata-
Echinodermata-
Arthropoda-
Mollusca-
Cnidaria: Anthozoa: Hexacorallia: Zoantharia-
Cnidaria: Hydrozoa: MilleporidaeMillepora spp.
Cnidaria: Anthozoa: Octocorallia: HelioporaceaHeliopora coerulea (Pallas, 1766)
IndeterminateIndeterminate---
Table 2. Relative coverage (%) by benthic habitat types along the three transect lines.
TypeClassificationTaxonTotal (%)TL1 (%)TL2 (%)TL3 (%)
Sand (S)--42.432.245.541.8
Rubble (R)--8.96.810.47.3
Dead coral (DC)--1.52.61.70.5
Rock (RK)------
Hard coral (HC)Cnidaria: Anthozoa: Hexacorallia: ScleractiniaScleractinia total3.56.04.01.4
AcroporaAcropora spp. total1.55.11.20.1
Acropora millepora0.2-0.3-
Acropora monticulosa--0.1-
Acropora nobilis0.72.70.50.1
Acropora sp.0.62.40.4-
Non-AcroporaNon-Acropora spp. total2.00.92.71.3
Fungiidae spp.----
Montipora spp.0.1-0.1-
Pavona spp.0.2-0.4-
Pocillopora spp.0.20.30.2-
Porites cylindrica1.2-1.70.8
Porites spp.0.40.50.30.5
Soft coral (SC)Cnidaria: Anthozoa: Octocorallia: AlcyonaceaAlcyonacea total2.6-3.12.8
Alcyonium spp.--0.1-
Sinularia spp.2.5-3.02.8
Macroalgae (MA)Macroalgae total-2.73.62.91.7
Brown macroalgae (Phaeophyta)Phaeophyta total2.53.42.71.7
Dictyota spp.0.80.80.90.4
Padina spp.1.30.51.80.8
Sargassum spp.0.31.9--
Turbinaria spp.0.20.2-0.5
Green macroalgae (Chlorophyta)Chlorophyta total0.10.10.1-
Bornetella spp.-0.1--
Caulerpa spp.0.1-0.1-
Codium spp.----
Red macroalgae (Rhodophyta)Rhodophyta total---0.1
Actinotrichia spp.---0.1
Coralline algae (CA)Rhodophyta: CorallinalesCorallinales total1.40.91.90.7
Turf algae (TA)Microalgae, juvenile macroalgae, CyanobacteriaTurf algae total6.03.18.13.4
Halimeda (HA)Chlorophyta: UlvophyceaeHalimeda spp. total4.97.55.22.9
Seagrass (SG)Angiospermae: AlismatalesAlismatales total26.137.217.137.4
Thalassia hemprichiiNANANANA
Cymodocea rotundataNANANANA
Syringodium isoetifoliumNANANANA
Enhalus acoroidesNANANANA
Macrofauna (MF)Macrofauna total-0.10.10.1-
Cnidaria: Hydrozoa: Milleporidae Millepora spp.----
Cnidaria: Anthozoa: Octocorallia: HelioporaceaHeliopora coerulea----
Porifera-0.10.10.1-
Tunicata-----
Cnidaria: Anthozoa: Hexacorallia: Zoantharia -----
Echinodermata-----
Mollusca-----
Arthropoda-----
Indeterminate (IN)------
Publisher’s Note: MDPI stays neutral with regard to jurisdictional claims in published maps and institutional affiliations.

