Article

A Composite Permeable Sloping Seawall for Effective Energy Dissipation: A Quasi-Soft Alternative Solution for Shore Protection

by
Vaishnavi Dabir
1,
Kanchan Khare
1,* and
Mutukuru Gangireddy Munireddy
2
1
Department of Civil Engineering, Symbiosis Institute of Technology, Symbiosis International (Deemed University), Pune 412115, Maharashtra, India
2
Department of Civil Engineering, Andhra University, Visakhapatnam 530003, Andhra Pradesh, India
*
Author to whom correspondence should be addressed.
J. Mar. Sci. Eng. 2022, 10(10), 1423; https://doi.org/10.3390/jmse10101423
Submission received: 1 September 2022 / Revised: 21 September 2022 / Accepted: 22 September 2022 / Published: 3 October 2022
(This article belongs to the Special Issue Non-conventional Coastal Protection Solutions)

Abstract

:
The recent trend in coastal research centers around environmental sustainability, especially in coastal conservation. A seawall typically has three layers, namely core, filter, and hard rubble/concrete armor. In the current study, a two-layered seawall is proposed, comprising a coir geotextile roll from the coastal regions, along with sand encapsulated in a geotextile over an impermeable core. This can be considered as a quasi-soft solution against the traditional, three-layered, hard alternative. The objective of this study is to investigate the combined effect of slope and porosity, of this composite structure, on the wave reflection. The findings show that the composite structure provides less reflection coefficient values compared to traditional rubble mound seawalls. Four orientations and positions of coir rolls with geosynthetic sandbag were tested. The armor layer with coir rolls overlain by geosynthetic sandbags over an impermeable core could be a better alternative, as it increases the hydrodynamic performance by 59% as compared to sandbags, used alone, over an impermeable core on a slope of 1:2.

1. Introduction

Seawalls are shore parallel structures constructed as a last line of defense to protect the coast. Around the world, various types of seawalls are constructed in a traditional manner using rubble, concrete, masonry, wood, etc. The rubble mound seawalls are the most traditional type of seawalls used conveniently at places where rubble is easily available. Traditional seawalls have a disadvantage associated with them—the non-availability of massive rocks [1]. The lack of availability of material alternatives and the limited natural resources in certain regions has increased the incorporation of geosynthetics in coastal protection [2]. Geosynthetics are lightweight materials engineered for their deemed performance. It could be serving the purpose of giving reinforcement strength to a structure, or it could be to provide an optimum filtration performance. A sand encapsulated with geosynthetic is one of the materials gaining popularity owing to ease of deployment and reduced construction time [3]. Currently, the variety of geosynthetics used are geosynthetic sand containers (GSC), geosynthetic wrap- around revetments (GWR), and geo-tubes.
Remarkable work for gaining insight into the generalized behavior of geosynthetic structure in case-specific coastal conditions was done by [4,5,6,7,8]. All of these studies allude to the significance of the model-prototype study for the assessing the behavior of the geosynthetic structure in the coastal environment. Ref. [9] discussed a case study from the east coast of Korea, where geo-tubes were installed offshore of the Young-Jin beach. Seaweed was observed to be accumulated on the surface of the submerged tube post-one year of installation. They concluded that any adverse effect on the environment is unlikely with the geotextile polymer material used in the manufacturing of the geo-tube.
To analyze and optimize the design performance of a seawall, one of the most important parameters which can affect the efficiency is the slope. Ref. [10] performed numerical analysis of wave reflection characteristics for permeable seawall structures and compared it with analytical practice methods. Less reflection is observed for walls on sloping beds as compared to flat beds for lower friction factor values. The obtained reflection coefficient values were compared for the bed slope, and it was observed that vertical walls reflect less energy on milder slopes for longer waves. However, the variation in the slope of bed does not affect the reflection coefficient (Kr) for short waves. Ref. [11] investigated the effect of change in slopes and surface conditions on the change in reflection coefficient. The study focused on non-porous seawalls with plane and dentated and serrated surfaces, using random as well as regular waves. It was inferred that when compared to the conventionally used surf similarity parameter ‘ξ’, the relative water depth (i.e., D/L, ratio of water depth to incident wavelength) and the characteristic dimension of the seawall (i.e., L/W) were more influencing parameters for the analysis of wave reflection. Refs. [12,13] developed a relationship, using non-linear regression, for the estimation of the hydrodynamic performance parameters of the waves in front of seawalls. The studies focus on the variation of wave reflection coefficients, due to the relative run-up and relative run-down, for porous structures. Ref. [14] conducted an experimental investigation, using regular and random waves, on porous caisson-type vertical seawall. The reflection coefficient of the porous and semi-porous seawalls was compared with that of the plain fully reflecting seawall.
The majority of studies, to date, have focused on impermeable structures with various openings, such as slots and serrations, and studies on permeable structures like geosynthetic sandbags or rubble mound seawall are available in abundance. However, the effect of permeability of sand, which is a particulate material, has not been emphasized.
In the present study, geosynthetic encapsulated sandbags and nonwoven, needle-punched, coir geotextiles are used for the armor of the seawall. This combination has not been explored previously. The coir geotextile is an abundantly available coastal resource. Coir geotextile reinforced with sand has been shown to enhance the peak shear strength, angle of internal friction, and ductility of sand [15]. Incorporating it with engineered geosynthetic encapsulating sand as a composite seawall amour material is done in the present work (Figure 1). The geotextiles were folded and stitched manually and filled with sand, up to 80% by volume. The coir geotextile was rolled in such a way that the thickness of the geosynthetic encapsulated sand layer matched with that of the coir roll. The coir used in the experiment is a non-woven, needle-punched, 10 mm thick geotextile.

2. Governing Parameters

The governing parameters in variation of wave reflection due to the structure variation would be the reflection coefficient (Kr), seawall slope (Cot θ), porosity of the armor (n), water depth (D), incident wave height (Hi), wave period (T), and incident wavelength (Li) (Table 1). This can be denoted as
Kr = f (Cot θ, n, D, Hi, T, Li)
As the wavelength and wave period are interrelated, only the wave period T is considered. The depth of the water is assumed to be constant. Hence, the modified expression for the reflection coefficient is expressed as
Kr = f (Cot θ, n, Hi, T)
For the experiment, the angle of wave attack (β) is 90 degrees, and seabed slope (α) is 0 degrees.
The objective of this study was lab scale investigation of (1) the role of porosity of frontal armor of the seawall with respect to slope for energy dissipation. (2) Efficiency of the alternative material as compared to the traditional seawalls.

3. Materials and Methods
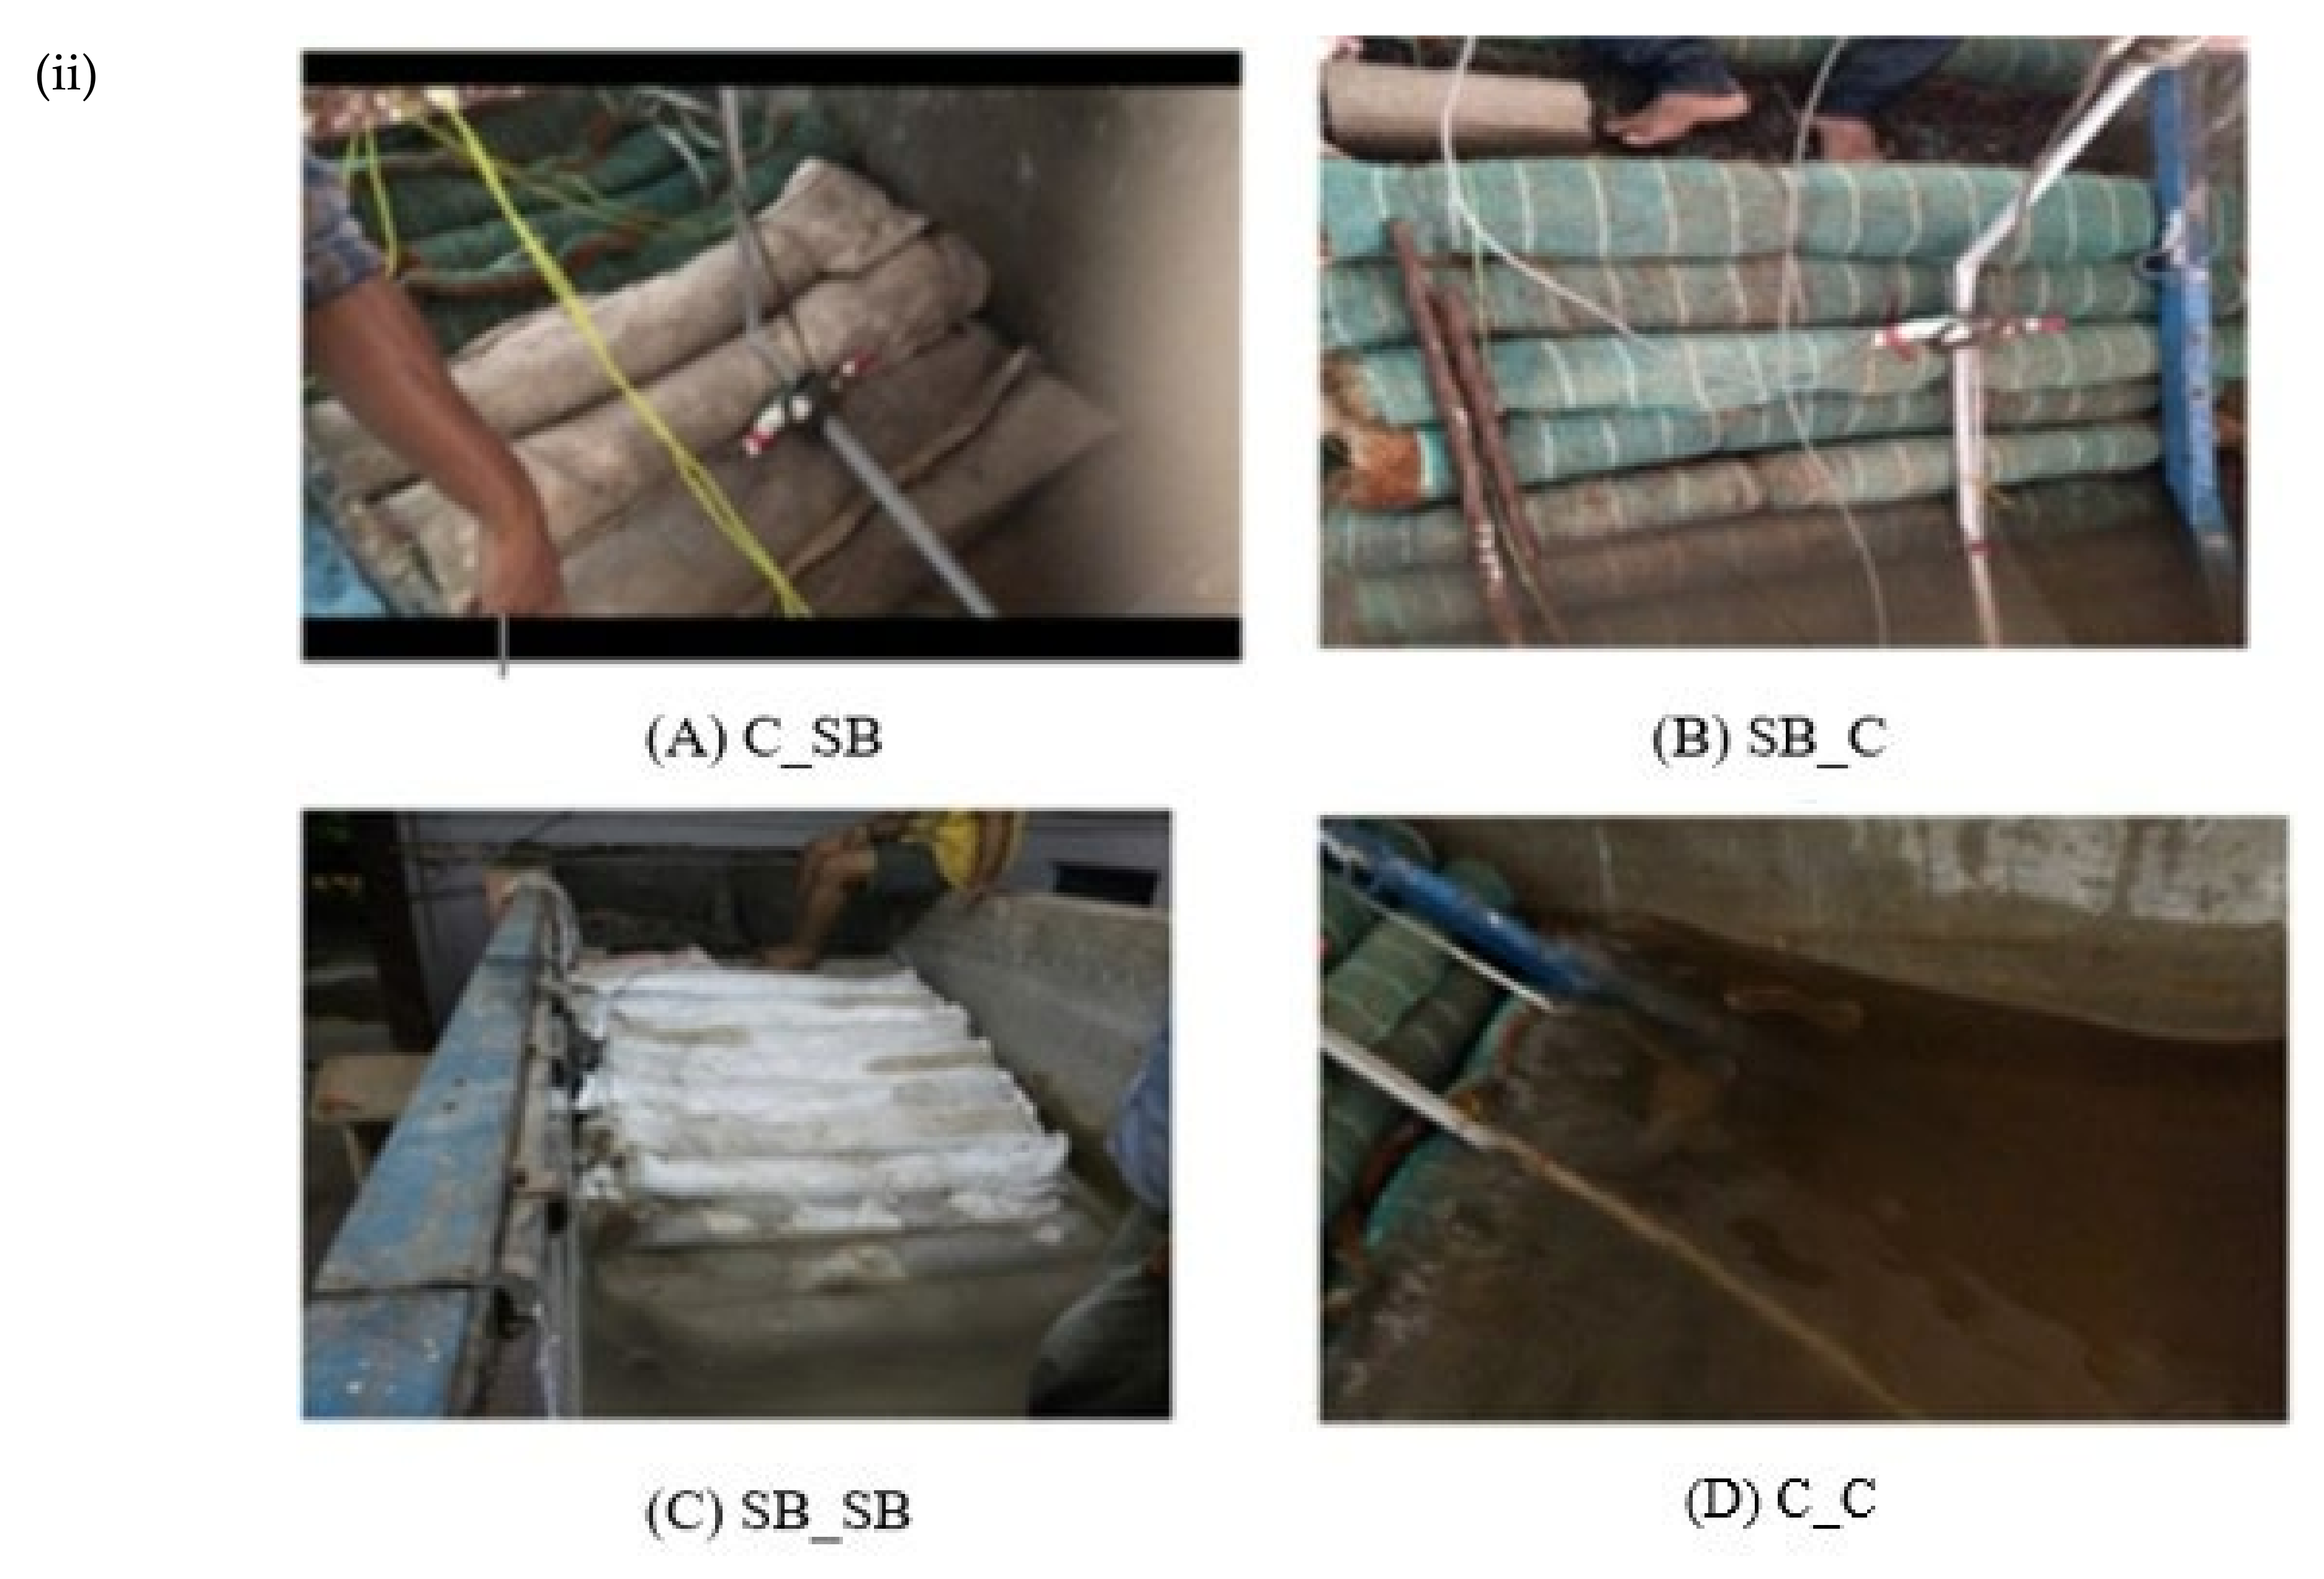
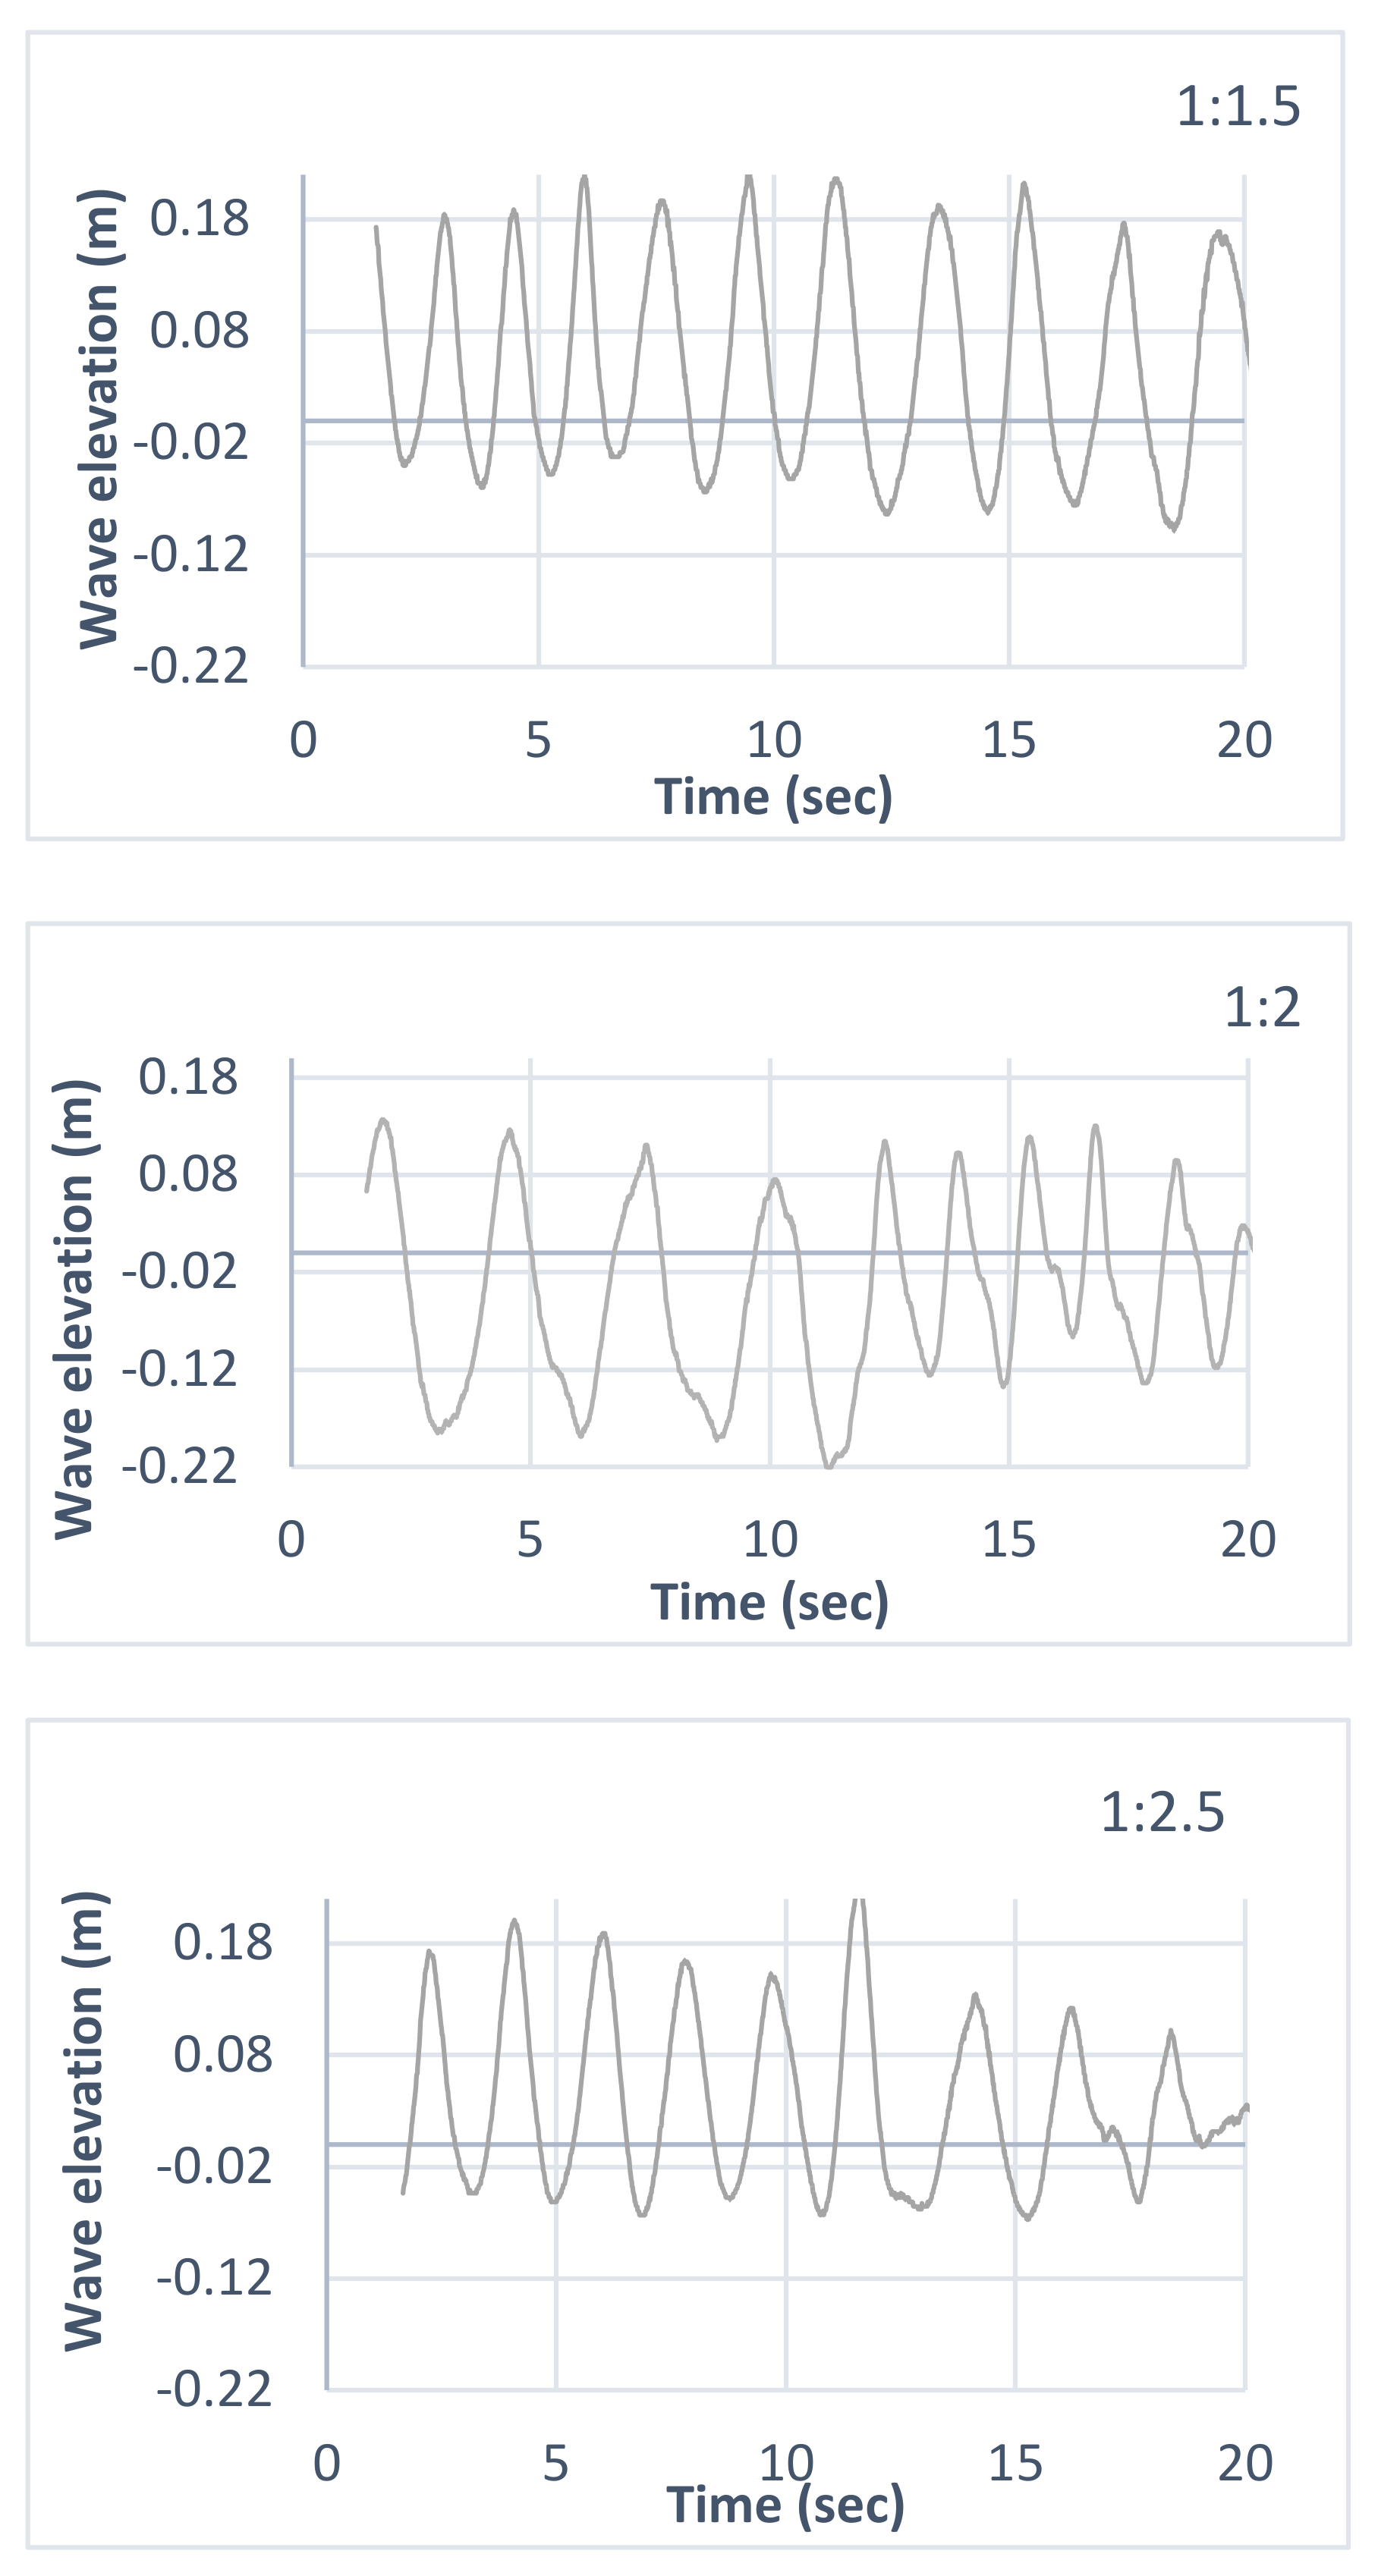
Great progress has been made in the simulation of soil particle size and gradation [16], and relevant experimental studies are also needed. The experimentally evaluated properties of the geosynthetic, sand, and coconut coir used in this experiment are shown in Table 2, Table 3 and Table 4. Grain size distribution of sand is as shown in Figure 2.
A two-layered seawall was constructed in a laboratory setting. One layer was comprised of a geosynthetic sandbags (GSB), and the other layer was comprised of coir geotextile roll (CGR). Four different arrangements were constructed, as shown in Figure 3i.

Experimentation

The experiments were conducted at the wave flume in the Department of Civil Engineering, Andhra University, Visakhapatnam, India. The experimental set up is as shown in Figure 4.
The wave flume had the following dimensions: 45 m length, 1.2 m width, and 1.2 m depth. It has a piston-type wavemaker installed (Figure 5). It has a capacity to generate regular waves with the desired frequency and amplitude. Wave absorbers are installed at the beach side of the wavemaker to avoid multiple reflections from the beachside, which could lead to erroneous measurements of incident wave height.
The incident and run-up waves were recorded using conductance type wave gauges. The wave probes were connected to a dedicated data acquisition system (DAQ). The data acquisition was done with a sampling frequency of 0.025 s and the length of the record was for 100 s. The run-up, run-down, and wave elevation were acquired simultaneously through a LABVIEW and DAQ interfaced with a personal computer. The arrival time of wave at the model depends on the wave frequency and water depth. The time history was viewed on the monitor to verify the trend in its variation, based on which the starting and ending points of the time series for analysis were determined. A sufficient time gap was allowed between successive runs to restore calm water conditions in the wave flume. The wave height and wave periods were obtained by analyzing the measured time histories of wave surface elevation using threshold-crossing analysis [17]. The threshold-crossing option is a generalization of the classical zero-crossing analysis. For a predefined reference level, the input time series channel was divided into events, each of which was defined by the time series value crossing the reference level in an upward direction. For each event, the peak–peak value, the minimum–maximum values, and the duration were determined and stored in a time series file. The time series of the different parameters stated earlier were viewed to pick up the part of time series with regular trends by omitting the transient part. The regular time series were then subjected to threshold-crossing analysis to get the mean amplitude of the time history. The mean of amplitude of measured hydrodynamic forces were obtained using the above procedure for each test run. In order to obtain the incident and reflected wave heights from the structure, several methods have been proposed to obtain the reflection coefficient of regular waves over breakwaters. A method proposed by [18] involves traversing one wave probe in the direction of the wave propagation to measure the maximum Hmax and minimum Hmin wave heights of the composite wave field. The values of Hmax and Hmin correspond to wave heights at a quasi-antinode and node, respectively, of the corresponding composite wave system. The incident wave height H was calculated as the average of Hmax and Hmin, and reflection wave height Hr was calculated as half the difference between Hmax and Hmin. Then, the reflection coefficient (Kr) was estimated as the ratio of reflected wave height Hr to incident wave height H.
The seawall was prepared using a wooden plank as an impermeable core with slopes (1:1.5, 1:2, 1:2.5). The armor layer was constructed with a geosynthetic encapsulated sandbag (GSB) and a coir geotextile roll (CGR). The armor layer was constructed by placing layers of GSB and CGR as per the experimentation program. The selected configurations, as shown in Figure 3i,ii, are annotated as: CGR over CGR as “C_C”, CGR over GSB as “C_SB”, GSB over CGR as “SB_C”, and GSB over GSB as “SB_SB”. Before the experiment, the permeability of the composite armor system was determined using the method prescribed by [19]. A constant water depth of 0.4 m was maintained throughout the test. As per the experimental program in Table 5, regular waves of three different amplitudes and four different wave periods were generated, resulting in 12 unique wave heights for each arrangement and slope. A total of 144 experiments were performed with these conditions, as shown in Figure 6.
Run-up and run-down values were extracted from recordings for further analysis. The hydrodynamic performance of the seawalls was tested in response to wave parameters and non-dimensional parameters of seawall using the Buckingham Pi theorem. The hydraulic parameters are scaled down as per the Froude similitude criterion. The structure criterion, like the fiber size and the openings, are used the way it is without any possible scaling. The wave parameters used are referred from INCOIS wave data from Ratnagiri buoy for periods of 1 s to 3 s. The ranges of the non-dimensional parameters are as shown in Table 6, where θ is the slope of the seawall on the seaward side. Therefore, Equation (2) can be further represented in a non-dimensional form as
K r = f { ( D / L i ) ,   ( H i / L i ) , C o t   θ , ξ ,   n }
The porosity of armor materials is the ratio of volume of voids to the total volume. For sand, the method incorporated was determined by procedure described in IS 2720 (Part14) ASTM D 1298, 12B, 2017. For C_C geotextile roll, the porosity is determined by measuring volume of voids in terms of water volume in ml occupied for a sample roll submerged in water. The ratio of this volume was taken to that of total volume space occupied by coir roll after converting ml to m3. For composites C_SB and SB_C, the average mean of porosity value of C_C and SB_SB was taken considering the equal combination used.

4. Results and Discussion

For acquiring parameters in the form mentioned in Equation (3), the incident wave height and reflection coefficient are obtained by using the wave gauge for a three-point system of wave reflection measurements. To determine how the change of porosity of the frontal armor of the seawall, along with the slope of the seawall, affect energy dissipation together, the depth of water is kept constant and wave conditions were varied, as shown in Table 5. Analysis of the recorded time histories of water surface elevations was performed using the zero-upcrossing analysis. The wave envelope for the arrangement of SB_C for a period of 1.5 s, and three different slopes, is shown in Figure 7. For each experiment, the peak minimum and maximum values of water surface elevation were determined. Similarly, the value of Kr was obtained for all the other arrangements.
Figure 8 shows the box and whisker plot used for data visualization of the entire dataset. The lowest range of Kr can be seen as obtained in the case of C_C.
A detailed analysis of all the other variations is presented in the subsequent sections of this paper.

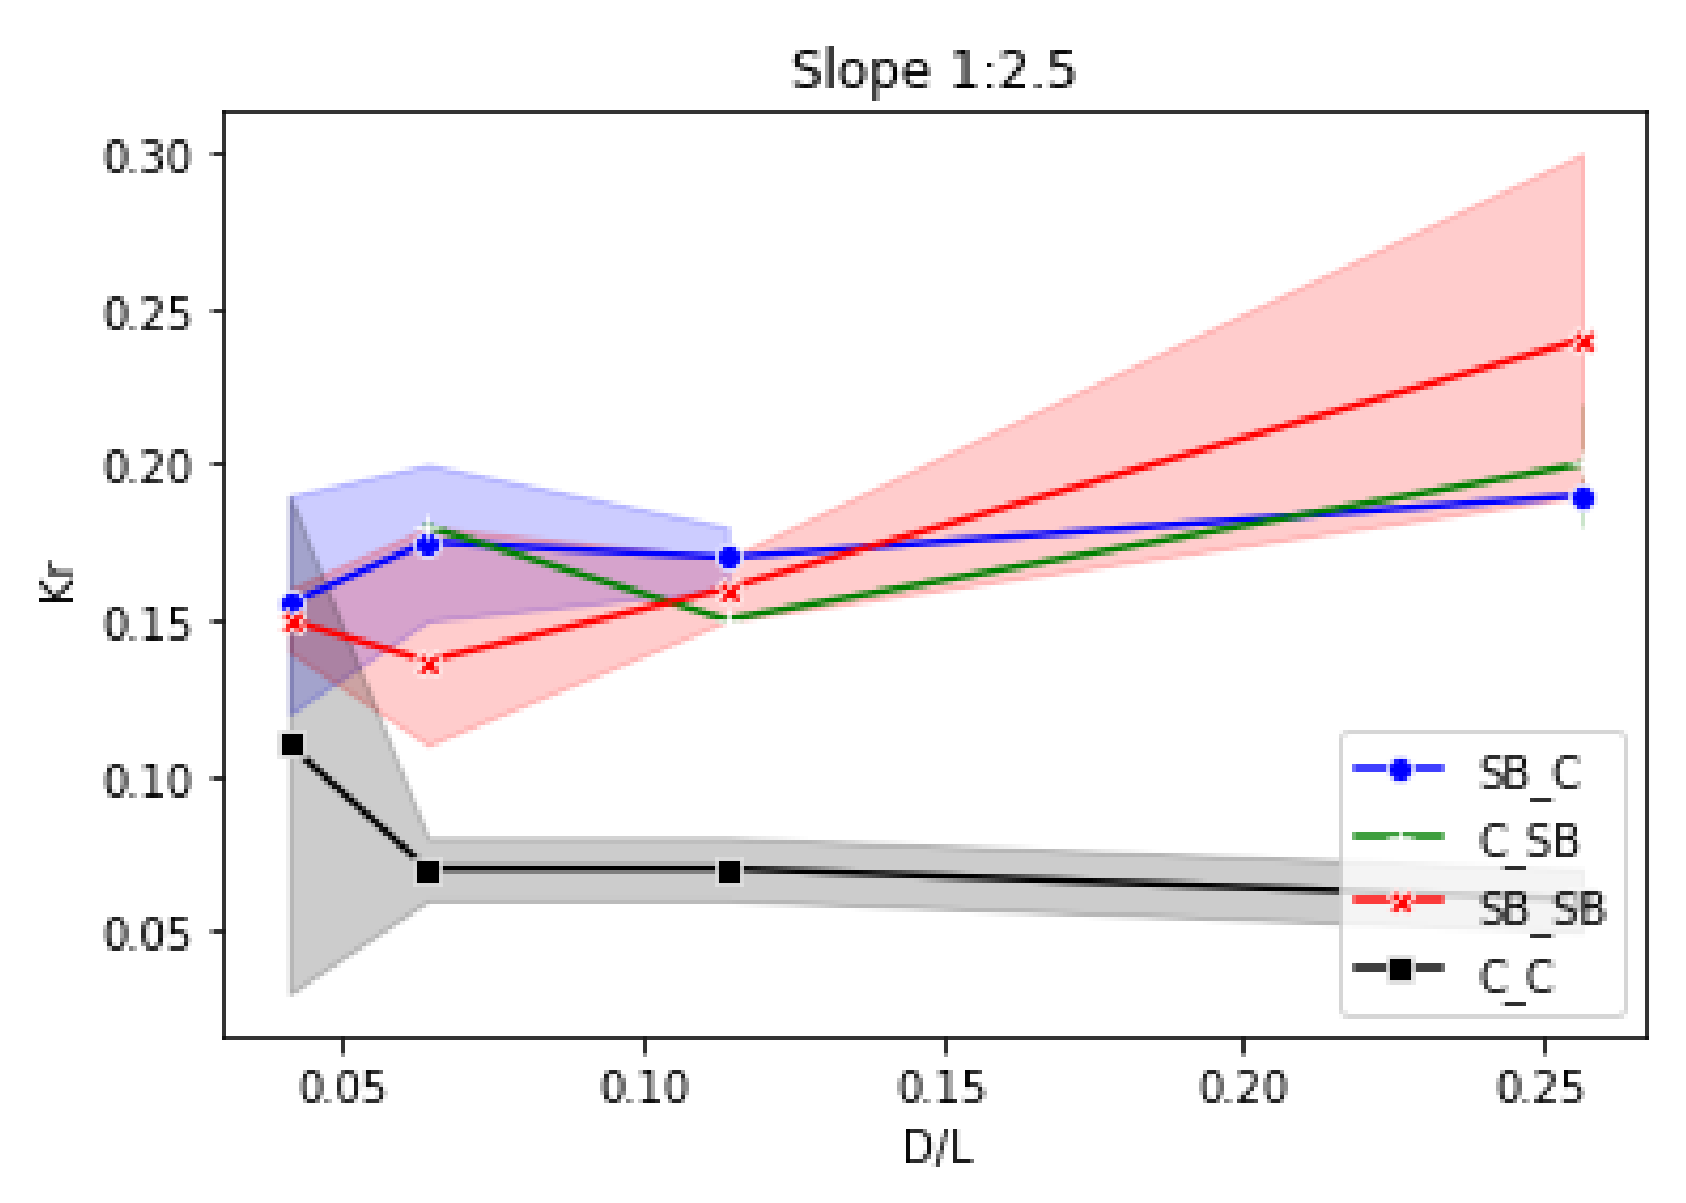
4.1. Effect of Relative Water Depth on the Reflection Coefficient

The reflection coefficient was plotted as a function of relative water depth (D/L) to symbolize the wave period. This representation is also seen in [11]. For the slope of 1:1.5 and all the four variations in structure, the trend of reflection coefficient was observed to be increasing with the relative water depth, except for C_C (Figure 9, Figure 10 and Figure 11).
This is because for this steeper slope, the double coir layer was unstable and oscillated on the slope with every wave impact. The readings were recorded by securing the coir rolls on the sides of the tank for noting the observations. Further observations on the slope of 1:2 can be ascertained by the trend of Kr (Figure 10), which tries to match with the trend patterns of the other variations. Here, the coir oscillations were relatively in control, owing to the relatively milder slope of 1:2.
For the slope of 1:2.5, the trend pattern matched with that of the other structural variations. The inference from the average values of Kr from all three slopes (Figure 12) is that the lowest reflection coefficient is obtained from the C_C structure. Coir and geosynthetic sandbag, i.e., SB_C and C_SB, had similar trends and ranges of values on all three slopes. The geosynthetic sandbag (SB_SB) provided a relatively higher refection coefficient compared to the other alternatives. The reflection coefficient values decreased with decreasing slope. This observation matched that of [13]. With the shorter waves, i.e., with higher D/L, the steepness of the wave increased, resulting in higher wave force and hence higher reflection.

4.2. Effect of the Surf Similarity Parameter on the Reflection Coefficient

The effect of the surf similarity parameter ξ, the wave periods in terms of D/Li and the wave heights in terms of Hi/Li on Kr, and that of the run-up and run-down values in terms of Rup/Hi and Rdn/Hi, is vital for estimating the hydrodynamic performance and for ascertaining the behavior of the structure under regular and extreme wave conditions.
The Iribarren number (ξ) comprises slope in the form of tan θ in its numerator and the square root of wave steepness in its denominator (Equation (4)).
ξ = tan θ h l
Surprisingly, however, when it was plotted for the entire raw dataset (Figure 13), it failed to provide any relation with the reflection coefficient. A similar observation was made by [20] in a study performed on geosynthetic sandbag to the core of rubble mound seawall. The readings were then segregated according to the slope and the variations separately with averaged Kr values for the same frequencies and increasing wave height. The data observed for all three slopes followed a two-degree polynomial trend with the Iribarren number (Figure 14).
Further, the values of Kr were compared to those obtained from the reflection model proposed by [21], which represents reflection coefficient as a function of Koh (relative water depth) where Ko is 2π/Lo (wave number in deep water) and h is water depth in front of the structure. Interestingly, the values showed a positive trend, as expected from the model. As seen in Figure 15, the Kr values exhibit an increasing trend with an increase in actual values. An exception to this observation is showcased by C_C. This could be due to multiple factors. The prime observation during the test was due to low density of the rolls, it oscillated with each impounding wave and backpressure from the impervious core. Overall, a turbulence was created in coir interstices, which affects the reflection coefficient values. Hence, the model can be proposed after more extensive study on porous structures.

4.3. Wave Energy Dissipation

The wave energy dissipation by all four variations can be represented by the non-dimensional parameter, namely relative energy dissipation (RL), which is evaluated by accounting for the energy equilibrium of an incident wave attack on the structure. The wave energy dissipation can be expressed by
E i = E r + E l
where El is the dissipated wave energy, and Ei and Er are the energy of the incident and the reflected wave, respectively. The relative energy dissipation equation can be determined as given by [22]. Rearranging Equation (5):
E l E i   = 1 E r E i
The ratio of dissipated energy to the energy of the incident wave is the relative wave reflection, and the ratio of energy of the reflected wave to incident wave is the wave reflection. Therefore,
R L = 1 ( K r 2 )
For the same wave steepness, the reflection values increased with a decrease in slope. With an increase in wave steepness, lower energy dissipation is achieved. This can be confirmed by lower energy reduction with increasing wave steepness. The effect of wave steepness on the reflection coefficient is quite evident for all three slopes. Figure 16 shows the variation of RL, with wave steepness corresponding to a relative water depth of 0.25.
With an increase in the wave steepness, the RL has a slight decrease for all four variations observed on all three slopes. Overall, a high RL value was observed because of the material properties used in the test set. The average RL value observed was 0.96. The highest energy dissipation was obtained by C_C or both layers being coir, being 0.98, and the least value was obtained for SB_SB, which was 0.955. The composite of sandbag and coir provided an optimum RL of 0.964, irrespective of the placement or positioning of the layers. It is evident that the highest wave energy dissipation was due to coir having a high voids ratio and interconnected fibers which break down the wave energy over its thickness. The combination of sandbag and coir provided a very high value of RL. This indicated that the porosity of the composite can be considered as a unique value, and placement of the composite might not affect the overall average energy dissipation. This is in line with the observations made by [23].

4.4. Comparison with Results Obtained by Formulae from Literature

The results of the current study are compared with reflection coefficient values of rubble mound seawalls with a steep slope. As rubble mounds are permeable structures, it was logical to compare the Kr values of permeable sloping structures with the current set of results. The formulae incorporated for the study are mentioned in Appendix A. It is observed that the value of the reflection for slope 1:2, as compared to different formulae from the literature coefficient, is not heavily affected by the incident wave height; the range of the coefficient is, however, inversely proportional to the wave period. This is again attributed to wave energy. Figure 17 shows the reflection coefficient with respect to relative wave height Hi/D.
The Kr value from the present study is significantly less as compared with the rubble mound seawalls in the slope of 1:1.5. With two layers of sandbag installed, its performance is better than the reflection coefficient obtained from other rubble mound structures. It is evident that higher energy dissipation is achieved by the composite structure as compared to traditional rubble mound structures. The least reflection coefficient value was of both layers of coir, as expected initially. The lowest value of reflection is obtained by the reflection model proposed by [24]. The highest is as proposed by [25].

4.5. Hydrodynamic Performance Evaluation

To evaluate the optimal seawall configuration, overall hydrodynamic performance evaluation can be performed as given mathematically by [11], as given in Equation (8).
Performance   parameter = Σ V *   w t
where V is the value of hydrodynamic performance parameters, i.e., Kr, Rup/Hi, Rdn/Hi, and wt is a factor.
K r = V *   w t
The weights for hydrodynamic performance parameters can be calculated based on required design criteria by dividing the parameters possible by the total length of the parameters.
Therefore, for the current study, hydrodynamic performance parameter =
    K r w K r + R u p H i w R u p + R d n H i w R d n
The weights of the wave hydrodynamic performance parameters were calculated as shown in Table 7. The cumulative hydrodynamic performance was evaluated as shown in Table 8.
The hydrodynamic performance parameter for the structure with coir over sandbag (SB_C) shows an increase with the increase in wavelength for all three slopes. The observation for the structure consisting of two layers of sandbags is similar (SB_SB). However, in the other two cases, for both layers of coir (C_C) and coir under sandbag (C_SB), the positive trend was observed only on the steeper slope of 1:1.5, and the trend did not match with that at the gentler slopes of 1:2 and 1:2.5. This could be because, at a gentler slope and with a permeable core, the wave dissipates more, due to the open void spaces, and reflects less.
The data are represented in the form of a bar chart with a range of incident wave height values for the same wavelength. The wave height in the range 0.03 m to 0.09 m, 0.07 m to 0.15 m, and 0.08 to 0.22 m are marked in the graph in blue, orange, and green, respectively, in Figure 18. Where the inner and outer material was the same, i.e., for C_C and SB_SB, the cumulative values of hydrodynamic performance parameters increased with an increase in the slope. The hydrodynamic performance parameter for the geo-composite structure SB_C also showed an increasing trend of cumulative values for an increase in the slope of the structure; for C_SB there is an uncertain trend observed. This could be attributed to the porosity of the inner material being more than that of the surface material. In the case of the composite structure, the placement of materials seems to affect the hydrodynamic performance parameter. The values of the parameter varied from 1.74 to 2.39, 0.17 to 4.61, 0.16 to 3.97, and 1.03 to 5.20 for SB_C, C_SB, C_C, and SB_SB, respectively, at the slope of 1:2.5. At the slope of 1:2, the range of values in the same order of orientation was noted to be in the range of 2.32 to 8.31, 3.75 to 9.75, 1.16 to 3.03, and 0.97 to 3.79 at the slope of 1:2; and 3.27 to 6.80, 3.35 to 9.09, 0.06 to 5.33, and 0.28 (2.22) to 5.41, respectively, for slope 1:1.5.
Table 9 shows the variables responsible for the change in reflection coefficient values for all the alternatives.
This indicates that SB_C and C_SB increase the hydrodynamic performance of the seawall by 19% and 18%, respectively, for the slope of 1:2.5 as compared to SB_SB. Similarly, for the slope of 1:2, the increase in hydrodynamic performance is 59% and 65%. There is a 25% and 46% increase on the slope of 1:1.5. It was interesting to note that the orientation C_C showed a decrease in hydrodynamic performance at all three slopes by 25%, 8%, and 16% on the slope of 1:2.5, 1:2, and 1:1.5, respectively, as compared to SB_SB. This indicates that a slope of 1:2 is the ideal slope for porous structures as far as the hydrodynamic performance parameter is concerned. All the equations to date primarily consider the Iribarren number as the influencing parameter. To gauge the most significant parameter for the energy dissipation of the composite seawall, a P-Test was performed, using backward elimination, on the entire set of data. Multiple governing parameters were selected using the backward elimination method.
Neither the Iribarren number nor the wave steepness influenced the reflection coefficient as much as the dominant Ho/gt2 wave parameter from the wave characteristics category. There were more parameters from the structures which influenced the reflection, and therefore the dissipation performance of the seawall. The porosity of the geocomposite had a major influence on the seawall reflection characteristics, followed by the slope outliers satisfied with available replacement values. With a significant F value at 2.13 × 10⁻⁸, it can be concluded that there is some correlation between the Kr values and the significant parameters. However, the sum of squared errors value was 0.24 and the mean squared error residual value was 0.4789. This hinted at a nonlinear relationship between the parameters and the reflection coefficient.
The relative wave run-up and run-down values were plotted with respect to the surf similarity parameter for all three slopes and all four variations of seawall armor (Figure 19 and Figure 20). The impact of ξ on the run-up and run-down values was determined by plotting a logarithmic trendline on the readings. The run-up and run-down values seemed to be unaffected with the decreasing slope. The run-down seemed notably less effective with the decrease in slope. This can be attributed to the permeable surface of the seawall armor, wherein the wave energy was dissipated through the sand interstices and coir meshes, respectively.
The overall trend shows an increase of relative run-up values with an increase in permeability values, the order of permeability being (SB_SB < C_SB < SB_C < C_C). The physical explanation for the increasing trend of these values can be found in [31], which states that for a very steep structure having large ξ values, with an impermeable core, the run-up and run-down of surging and non-breaking waves would be high due to the entrapped water in the permeable layer, resulting into reduction of the roughness of the surface, which is encountered by waves. Therefore, the wave behaves as if running on a very steep smooth slope.
In contrast to this, if the core is permeable, the water can penetrate the core, resulting in a wash up and reducing the actual run-up values. For a very gentle slope of 1:2.5, and for C_C, due to a very permeable structure and a large number of voids, the relative wave run-up value was extremely low. As the wave moved from plunging to surging, no significant change was observed. SB_SB, being relatively denser than other arrangements, showed high value of run-up and run-down. Interestingly, C_SB also showed higher value of run-up and down after SB_SB. This could be due to the backpressure created due to underlying coir roll. The increase in trend of run-up and run-down value is in line with the findings by [10,12,20], although the exact comparison was not possible because of differences in experimental setup and types of seawalls.

5. Conclusions

In the present work, the effect of permeability of the composite armor and how the slope affects the performance of a seawall structure were studied at a laboratory level. The slopes of seawall chosen were between 1:1.5 to 1:2.5, with the objective of observing the response for relatively steeper slopes. A two-layered seawall made up of coir geotextile roll, along with sand encapsulated in geosynthetic material as armor, over an impermeable core, was studied for its performance.
Based on the experimental results from the study, it can be concluded that, for the composite structure tested, the permeability is the most significant parameter for effective wave energy dissipation. The reflection coefficient is observed to be very low because of associated porosity of the composite and density characteristics of the material. Energy is dissipated by the wave gushing down under the structure due to voids, and absorption into the armor interstices.
Results indicate that the use of coir in combination with the geosynthetic sandbag is hydraulically most efficient. A very small reflection coefficient is obtained for coir testing alone (Kr < 0.2). However, due to the very low density, the structural stability was observed to be compromised. As the unaided coir roll oscillated with each pounding wave, a further provision of bracing the coir rolls to the underlying layers is suggested. An alternative wherein the coir log can be overlain by a geosynthetic sandbag is hydraulically efficient (Kr < 0.4) and a structurally sound solution. The positioning of coir over or under the sandbag had little very little effect on the reflection coefficient values of the composite together. However, placing coir over the sandbags was done without any bracing and hence was structurally unstable. Using coir under or over the sandbag as a composite improved the hydrodynamic performance by 65% and 59%, respectively, on the slope of 1:2, as compared to a sandbag used alone. In conclusion, coir overlain by sandbag on a slope of 1:2 was demonstrated to be hydrodynamically the most efficient of the four tested seawall armors. As the armor layers are expected to be overlain over a classic impermeable core, the solution is deemed to be a quasi-soft solution.
The current lab scale study suggests an avenue of research into novice material combinations, which can be a smarter alternative to the existing hard structures. These could be used independently or as a composite to form an auxiliary quasi-soft solution, forming slender and smart structures for coastal protection. Once the solutions are successful on a lab scale, a pilot field investigation can be taken up for proposing such sustainable alternatives with confidence.

Author Contributions

Conceptualization, investigation and writing V.D.; Resources and validation, M.G.M.; Supervision, writing review and editing, K.K. All authors have read and agreed to the published version of the manuscript.

Funding

This research received no external funding.

Institutional Review Board Statement

Not applicable.

Informed Consent Statement

Not applicable.

Data Availability Statement

Not applicable.

Conflicts of Interest

The authors declare no conflict of interest.

Appendix A

Table A1. Rubble mound seawall formulae adopted for comparison.
Author Formula   comprising   ξ   and comments
[11] K r = 0.90 [ 0.52 / ξ   p]
[13] K r = 0.431 d L 0.253 H i L i 0.56 ξ 1.042   c o t θ 0.78 ( s w ) 0.292
[24] K r = 1 2 exp ( 0.125   ξ ) 2
Not applicable on rubble mounds
[25] K r = tanh ( 0.12   ξ 0.87 )
[26] K r = 0.6   ξ 2 6.6 + ξ 2
[27] K r = 0.6   ξ 2 12 + ξ 2
[28] K r = 0.125   ξ 0.173
[29] K r = 0.07   ( P 0.08 + ξ )
Also used value of ξ = t a n 0.62 α ( H L ) 0.46
[30] K r = 1 1 + 7.1 ξ 0.8   Uses   ξ = h g T 2 t a n α

References

  1. Kudale, M.D.; Mahalingaiah, V.; Tayade, B.R. Use of sand-filled geotextile tubes for sustainable coastal protection- case studies in Indian scenario. Indian J. Mar. Sci. 2014, 2014, 5–7. [Google Scholar]
  2. Lee, S.C.; Hashim, R.; Motamedi, S.; Song, K.-I. Utilization of Geotextile Tube for Sandy and Muddy Coastal Management: A Review. Sci. World J. 2014, 2014, 1–9. [Google Scholar] [CrossRef] [PubMed] [Green Version]
  3. Khare, K.C.; Dabir, V.V. Geosynthetics in coastal protection: An Indian Overview. In Proceedings of the International Conference on Hydraulics, Water Resources and Coastal Engineering (Hydro2016), CWPRS, Pune, India, 8–10 December 2016; pp. 683–689. [Google Scholar]
  4. Faure, Y.-H.; Ho, C.C.; Chen, R.-H.; Le Lay, M.; Blaza, J. A wave flume experiment for studying erosion mechanism of revetments using geotextiles. Geotext. Geomembr. 2010, 28, 360–373. [Google Scholar] [CrossRef]
  5. Hornsey, W.; Carley, J.; Coghlan, I.; Cox, R. Geotextile sand container shoreline protection systems: Design and application. Geotext. Geomembr. 2011, 29, 425–439. [Google Scholar] [CrossRef]
  6. Kriel, H.J. Hydraulic Stability of Multi-Layered Sand-Filled Geotextile Tube Breakwaters under Wave Attack. Ph.D. Thesis, Stellenbosch University, Stellenbosch, South Africa, 2012. [Google Scholar]
  7. Palmeira, E.M.; Tatto, J. Behaviour of geotextile filters in armoured slopes subjected to the action of waves. Geotext. Geomembr. 2015, 43, 46–55. [Google Scholar] [CrossRef]
  8. Recio-Molina, J.; Yasuhara, K. Stability of modified geotextile wrap-around revetments (GWR) for coastal protection. Geosynth. Int. 2005, 12, 260–268. [Google Scholar] [CrossRef]
  9. Shin, E.; Oh, Y. Coastal erosion prevention by geotextile tube technology. Geotext. Geomembr. 2007, 25, 264–277. [Google Scholar] [CrossRef]
  10. Mallayachari, V.; Sundar, V. Reflection characteristics of permeable seawalls. Coast. Eng. 1994, 23, 135–150. [Google Scholar] [CrossRef]
  11. Neelamani, S.; Sandhya, N. Wave reflection characteristics of plane, dentated and serrated seawalls. Ocean Eng. 2003, 30, 1507–1533. [Google Scholar] [CrossRef]
  12. Negm, A.; Nassar, K. Determination of Wave Reflection Formulae for Vertical and Sloped Seawalls Via Experimental Modelling. Procedia Eng. 2016, 154, 919–927. [Google Scholar] [CrossRef] [Green Version]
  13. Nassar, K.; Mahmod, W.E.; Tawfik, A.; Rageh, O.; Negm, A.; Fath, H. Developing empirical formulas for assessing the hydrodynamic behaviour of serrated and slotted seawalls. Ocean Eng. 2018, 159, 388–409. [Google Scholar] [CrossRef]
  14. Esmaeili, M.; Rahbani, M.; Khaniki, A.K. Experimental investigating on the reflected waves from the caisson-type vertical porous seawalls. Acta Oceanol. Sin. 2019, 38, 117–123. [Google Scholar] [CrossRef]
  15. Lal, D.; Sankar, N.; Chandrakaran, S. Interface shear behaviour of coir geotextiles and sand using large-scale direct shear tests. Aust. Geomech. J. 2017, 52, 75–84. [Google Scholar]
  16. Sun, J.; Huang, Y. Modeling the Simultaneous Effects of Particle Size and Porosity in Simulating Geo-Materials. Materials 2022, 15, 1576. [Google Scholar] [CrossRef]
  17. Chakrabarthi, S. Hydrodynamics of Offshore Structures, 2nd ed.; Henry Ling Ltd.: Dorechester/London, UK, 1985. [Google Scholar]
  18. Dean, R.G.; Dalrymple, R.A. Water Wave Mechanics for Engineers and Scientists; World Scientific: Singapore, 1984. [Google Scholar]
  19. Antonio, J.; Molina, R. Hydraulic Stability of Geotextile Sand Containers for Coastal Structures—Effect of Deformations and Stability Formulae. Coast. Eng. 2008, 1, 3805–3817. [Google Scholar]
  20. Oumeraci, H.; Kortenhaus, A. Core made of geotextile sand containers for rubble mound breakwaters and seawalls: Effect on armour stability and hydraulic performance. Ocean Eng. 2011, 38, 159–170. [Google Scholar] [CrossRef]
  21. Reedijk, B.; Muttray, M.; Van Den Berge, A.; De Rover, R. Effect Of Core Permeability on Armour Layer Stability. Coast. Eng. 2008, 1, 3358–3367. [Google Scholar]
  22. Munireddy, M.G.; Neelamani, S. Wave Transmission and Reflection Characteristics of a Partially Immersed Rigid Vertical Barrier. Ocean. Eng. 1992, 19, 313–325. [Google Scholar]
  23. Dabir, V.; Deki, S.; Agarwal, K.; Ranjan, A.; Khare, K. Permeability of A Composite Seawall: Effect of the Orientation of Gaps in the Structure. IOP Conf. Ser. Earth Environ. Sci. 2020, 527, 012004. [Google Scholar] [CrossRef]
  24. Gimenez-Curto, L. Behaviour of Rubble Mound Breakwaters under Wave Action. Ph.D. Thesis, University of Santander, Cantabria, Spain, 1979. [Google Scholar]
  25. Zanuttigh, T.L.; Andersen, B. Wave reflection in 3D conditions. Coast. Eng. 2010, 57, 531–538. [Google Scholar] [CrossRef]
  26. Seelig, W.N.; Ahrens, J.P. Estimation of Wave Reflection and Energy Dissipation Coefficients for Beaches, Revetments, and Breakwaters; US Army Corps of Engineers: Washington, DC, USA, 1981; Volume 81, pp. 1–41.
  27. Burger, W.; Oumeraci, H.; Partenscky, H.W. Geohydraulic Investigations of Rubble Mound Breakwaters. In Proceedings of the 21st International Conference on Coastal Engineering, Sol-Malaga, Spain, 20–25 June 1988; p. 166. [Google Scholar]
  28. Postma, G. Wave Reflection from Rock Slopes under Random Wave Attack. Master’s Thesis, Delft University of Technology, Delft, The Netherlands, 1989. [Google Scholar]
  29. Van der Meer, J.W.; Stam, C.M. Wave Runup on Smooth and Rock Slopes of Coastal Structures. J. Waterw. Port Coast. Ocean Eng. 1992, 118, 534–550. [Google Scholar] [CrossRef]
  30. Hughes, S.A.; Fowler, J.E. Estimating Wave-Induced Kinematics at Sloping Structures. J. Waterw. Port Coast. Ocean Eng. 1995, 121, 209–215. [Google Scholar] [CrossRef]
  31. Van der Meer, J.W.; Allsop, N.W.H.; Bruce, T.; De Rouck, J.; Kortenhaus, A.; Pullen, T.; Schüttrumpf, H.; Troch, P.; Zanuttigh, B. Manual on wave overtopping of sea defences and related structures. An overtopping manual largely based on European research, but for worldwide application. EurOtop. 2018. Available online: https://biblio.ugent.be/publication/8506110 (accessed on 3 September 2022).
Figure 1. Composite seawall armor in the present study.
Jmse 10 01423 g001
Figure 2. Grain size distribution of sand used in encapsulation.
Jmse 10 01423 g002
Figure 3. Experimental arrangements.
Jmse 10 01423 g003aJmse 10 01423 g003b
Figure 4. Schematic sketch of test setup in the wave flume.
Jmse 10 01423 g004
Figure 5. Wave flume and wave generator system.
Jmse 10 01423 g005
Figure 6. Process flow diagram.
Jmse 10 01423 g006
Figure 7. Wave envelopes for SB_C.
Jmse 10 01423 g007
Figure 8. The range of reflection coefficients corresponding to the variations utilized.
Jmse 10 01423 g008
Figure 9. Kr vs D/L for slope 1:1.5.
Jmse 10 01423 g009
Figure 10. Kr vs. D/L for slope 1:2.
Jmse 10 01423 g010
Figure 11. Kr vs. D/L for slope 1:2.5.
Jmse 10 01423 g011
Figure 12. Average Kr trend for all three slopes together.
Jmse 10 01423 g012
Figure 13. Iribarren number compared to Kr.
Jmse 10 01423 g013
Figure 14. Effect of Iribarren number on reflection coefficient.
Jmse 10 01423 g014
Figure 15. Wave reflection as compared to Koh.
Jmse 10 01423 g015
Figure 16. RL as compared to wave steepness.
Jmse 10 01423 g016
Figure 17. Kr for T in range 1 to 2.5 s. Source: [11,13,24,25,26,27,28,29,30].
Jmse 10 01423 g017
Figure 18. Hydrodynamic performance parameter.
Jmse 10 01423 g018
Figure 19. Relative wave Rup/Hi for the three slopes.
Jmse 10 01423 g019
Figure 20. Relative wave Rdn/Hi for the three slopes.
Jmse 10 01423 g020
Table 1. The governing parameters and their range/values used for the experiments.
SymbolValue/RangesUnit
D30cm
Li156 to 975cm
Hi3–20cm
T1–2.5s
Cot θ1.5, 2, 2.5-
Table 2. Specifications of the non-woven needle-punched geotextile.
PropertyUnits
CBR Puncture Strength3110 N
Trapezoidal Tear Strength450 N
Grab Tensile Strength1110 N
Grab Elongation>50%
AOSless than 75 micron
Water flow50 L/sqm/s
UV Resistance70% at 500 hrs of exposure
Table 3. Specifications of the sand used in the study.
PropertyValueUnits
Relative Density69.8%
Specific gravity2.68-
Permeability0.0134m/s
Cu5.12-
Cc1.09-
Ø30degrees
Table 4. Specifications of coir geotextile used in the experiments.
PropertyValueUnits
Thickness10mm
GSM600-
Permeability11,860lit/m3/min
Table 5. Experimentation program.
ArrangementcotθWave ConditionsTotal Runs
C_SB1.5, 2, 2.5Three actuator amplitudes, 5 cm, 10 cm, and 15 cm, and four wave periods, 1 s, 1.5 s, 2 s, and 2.5 s, for each amplitude36
SB_C1.5, 2, 2.536
SB_SB1.5, 2, 2.536
C_C1.5, 2, 2.536
Table 6. Non-dimensional parameters for the test.
ParameterRepresentationRange of Value
Relative water depth(D/Li)0.06–0.2
Relative wave steepness(Hi/Li)0.001–0.075
Slope of seawallCot θ1.5, 2, 2.5
Surf similarity parameter ξ = tan θ / ( H i L i ) 1.8–17
Plunging waves
Surging waves
Porosity of the structuresn0.4 for Geosynthetic sandbag
0.615 for the geocomposite
0.8 for coir rolls
Table 7. Weights for normalized hydrodynamic performance parameters.
Seawalls Design Criteria Weights   of   the   Most   Dominant   Hydrodynamic   Wave   Parameters   w K r , w R u p   and   w R d n
KrRup/HiRdn/Hi
1. Detraction of dynamic and hydrostatic wave
pressure on seawall face.
110
2. Deterrence to the wave overtopping.010
3.Liquefaction mitigation and prevention of soil erosion in front of wall toe.101
4. Wave energy dissipation.100
5. Optimization of wave downfall pressure in front of the wall.101
6. Lowering of the potential crest level.010
7. Climate change and sea level rise (SLR) adaptation111
8. Reduction of thickness of armor layer110
9. Toe layer optimization101
Overall weights7/95/94/9
0.770.550.44
Table 8. Sample hydrodynamic performance parameters for three slopes and similar wave conditions for SB_C.
Hydrodynamic Performance ParametersWeight (wt)Value of Reflection (V)Amplitude (A) 10Period (T) 2.5
Cot θ = 1.5Cot θ = 2Cot θ = 2.5
(wt)VV* wtVV* wtVV* wt
Kr0.770.230.170.050.030.190.146
Rup/Hi0.552.71.486.533.590.630.34
Rdn/Hi0.442.951.290.450.1982.000.88
Cumulative count2.94 3.818 1.366
Table 9. Significance of independent variables on the dependent variables.
ANOVA
dfSSMSFSignificance F
Regression32.1035430.70118115.525144122.99 × 10−8
Residual924.1551080.045164
Total956.258651
CoefficientsStandard Errort Statp-valueLower 95%Upper 95%Lower 95.0%Upper 95.0%
Intercept−0.220530.1360671.620720.108500−0.490770.049714−0.49070.04971
Ho/gt227.764326.3435894.376753.177 × 10−515.165440.3632315.165440.3632
Cot Theta−0.154110.0536932.870140.005090−0.26074−0.047467−0.26074−0.04746
Porosity−0.70480.1847473.814930.000246−1.07172−0.337873−1.07172−0.33787
Publisher’s Note: MDPI stays neutral with regard to jurisdictional claims in published maps and institutional affiliations.

